final report of progress - university of arkansas · final report of progress ... 5.8, 5.8, 4.6,...
TRANSCRIPT
1
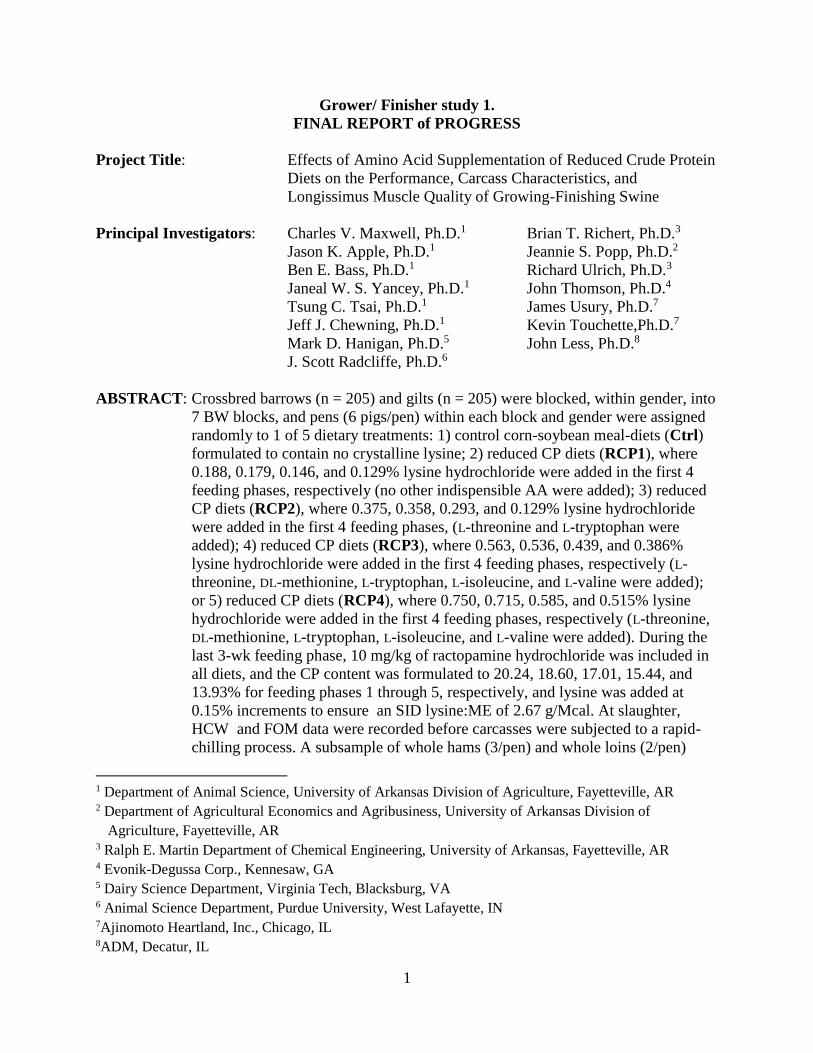
Grower/ Finisher study 1.
FINAL REPORT of PROGRESS
Project Title: Effects of Amino Acid Supplementation of Reduced Crude Protein
Diets on the Performance, Carcass Characteristics, and
Longissimus Muscle Quality of Growing-Finishing Swine
Principal Investigators: Charles V. Maxwell, Ph.D.1 Brian T. Richert, Ph.D.3
Jason K. Apple, Ph.D.1 Jeannie S. Popp, Ph.D.2
Ben E. Bass, Ph.D.1 Richard Ulrich, Ph.D.3
Janeal W. S. Yancey, Ph.D.1 John Thomson, Ph.D.4
Tsung C. Tsai, Ph.D.1 James Usury, Ph.D.7
Jeff J. Chewning, Ph.D.1 Kevin Touchette,Ph.D.7
Mark D. Hanigan, Ph.D.5 John Less, Ph.D.8
J. Scott Radcliffe, Ph.D.6
ABSTRACT: Crossbred barrows (n = 205) and gilts (n = 205) were blocked, within gender, into
7 BW blocks, and pens (6 pigs/pen) within each block and gender were assigned
randomly to 1 of 5 dietary treatments: 1) control corn-soybean meal-diets (Ctrl)
formulated to contain no crystalline lysine; 2) reduced CP diets (RCP1), where
0.188, 0.179, 0.146, and 0.129% lysine hydrochloride were added in the first 4
feeding phases, respectively (no other indispensible AA were added); 3) reduced
CP diets (RCP2), where 0.375, 0.358, 0.293, and 0.129% lysine hydrochloride
were added in the first 4 feeding phases, (L-threonine and L-tryptophan were
added); 4) reduced CP diets (RCP3), where 0.563, 0.536, 0.439, and 0.386%
lysine hydrochloride were added in the first 4 feeding phases, respectively (L-
threonine, DL-methionine, L-tryptophan, L-isoleucine, and L-valine were added);
or 5) reduced CP diets (RCP4), where 0.750, 0.715, 0.585, and 0.515% lysine
hydrochloride were added in the first 4 feeding phases, respectively (L-threonine,
DL-methionine, L-tryptophan, L-isoleucine, and L-valine were added). During the
last 3-wk feeding phase, 10 mg/kg of ractopamine hydrochloride was included in
all diets, and the CP content was formulated to 20.24, 18.60, 17.01, 15.44, and
13.93% for feeding phases 1 through 5, respectively, and lysine was added at
0.15% increments to ensure an SID lysine:ME of 2.67 g/Mcal. At slaughter,
HCW and FOM data were recorded before carcasses were subjected to a rapid-
chilling process. A subsample of whole hams (3/pen) and whole loins (2/pen)
1 Department of Animal Science, University of Arkansas Division of Agriculture, Fayetteville, AR 2 Department of Agricultural Economics and Agribusiness, University of Arkansas Division of
Agriculture, Fayetteville, AR 3 Ralph E. Martin Department of Chemical Engineering, University of Arkansas, Fayetteville, AR 4 Evonik-Degussa Corp., Kennesaw, GA 5 Dairy Science Department, Virginia Tech, Blacksburg, VA 6 Animal Science Department, Purdue University, West Lafayette, IN 7Ajinomoto Heartland, Inc., Chicago, IL 8ADM, Decatur, IL

2
were transported under refrigeration to the University of Arkansas. Hams were
knife-dissected into lean, fat, bone, and skin, whereas LM chops were used to
measure fresh pork quality characteristics. Across the entire feeding trial, ADG
increased only 2.1% between Ctrl and RCP3, but dropped 6.1% between RCP3
and RCP4 (quadratic, P < 0.001), whereas ADFI tended to decreased linearly (P =
0.085) as CP was reduced in swine diets. Gain efficiency (G:F) increased 4.6% in
gilts between Ctrl and RCP2 before decreasing to values similar to Ctrl; yet, G:F
remained relatively unchanged in barrows across the 5 dietary treatments
(quadratic gender × reduced CP diet, P = 0.041). Fat depth increased linearly (P =
0.001), and carcass fat-free lean yields decreased linearly (P = 0.018), as CP was
reduced in swine diets. Furthermore, the percent of ham muscle decreased (linear,
P = 0.002), and the percent of ham fat increased (linear, P = 0.012), with
decreasing dietary CP. Incorporating crystalline AA in diets of growing-finishing
swine can reduce dietary CP by 19.7 to 28.6% across the 5 feeding phases, and,
more importantly, live pig performance was actually improved with lower
inclusion levels of synthetic AA in reduced CP diets, but ADG, ADFI, and G:F
declined when fed the reduced CP diet with the highest synthetic AA inclusion
levels. Lastly, reducing dietary CP and replacing with crystalline AA had did not
negatively affect fresh pork quality.
Key Words: Carcass composition, Crude protein level, Growth performance, Pork quality,
Ractopamine hydrochloride, Swine
Introduction
Nitrogen (N2) compounds from swine feces and urine are oxidized and reduced by soil
and air, whereas some N2 is released into the atmosphere as nitrous oxide (N2O). The greenhouse
effect of N2O is approximately 288-fold that of carbon dioxide (CO2); thus, N2O has the third
largest impact on total global warming after CO2 and methane. Research has demonstrated that
reducing CP and maximizing crystalline AA in swine diets can dramatically reduce N2 excretion
when fed to either nursery or growing-finishing pigs (Kerr and Easter, 1995; Kendall, 2000;
Figueroa et al., 2002; Hinson et al., 2009). Conversely, growth performance and carcass
characteristics are quite variable when pigs were fed reduced CP diets (Dourmad et al., 1993;
Kerr et al., 1995; Figueroa et al., 2002). In addition, a large segment of the swine industry feeds
ractopamine hydrochloride (Paylean; Elanco Animal Health, a Division of Eli Lilly, Greenfield,
IN) to finishing swine, but FDA regulations required Paylean to be fed in diets formulated to
16% CP (Feed Additive Compendium, 2011), even though research has shown that Paylean
could be fed in low-CP diets supplemented with the appropriate AA without compromising
growth performance or carcass composition (DeCamp et al., 2001; Gaines et al., 2004).
Moreover, Gaines et al. (2004, 2007) observed that feeding finishing pigs a low-CP/AA-
amended diet actually improved the reduction in carcass yield associated with increasing dietary
soybean meal to meet the FDA minimum CP requirement. These studies have yet to determine
the maximum level of CP reduction, in conjunction with the optimum AA inclusion rate(s), that
can be fed with Paylean on growth performance and carcass characteristics.

3
Interestingly, reducing the CP content of grower and finisher pig diets has been
repeatedly shown to increase intramuscular fat content in the LM from 14 to 65% (Kerr et al.,
1995; Nold et al., 1999; Teye et al., 2006). On the other hand, dietary Paylean has been reported
to reduce the intramuscular fat content and marbling scores, but these reductions associated with
Paylean are more likely a response to dietary lysine levels in excess of 0.80% (Apple et al.,
2007). Therefore, the primary objective of this study was to test the effects of minimizing dietary
CP and maximizing the use of crystalline AA on live performance, carcass composition, and
pork quality of growing-finishing pigs fed Paylean the last 3 wk before slaughter.
Materials and Methods
Pig care and handling, as well as all experimental procedures, were approved by the
University of Arkansas Interdepartmental Animal Care and Use Committee (protocol no. 11023)
before initiating the experiment.
Pig Allotment and Diets
Crossbred barrows (n = 205) and gilts (n = 205), from the mating of C-29 females to line-
380 boars (PIC, Inc., Hendersonville, TN), were blocked, within gender, into 7 BW blocks, and
allotted randomly within blocks to replicated pens (6 pigs/pen). Then, within gender and blocks,
pens of pigs were assigned randomly to 1 of 5 dietary treatments (Tables 1 and 2): 1) control
corn-soybean meal-diets (Ctrl) formulated to contain no crystalline lysine and meet 95% of the
standardized ileal digestible (SID) AA requirements for growing-finishing swine (PIC Nutrient
Specification Manual, 2011); 2) reduced CP diets (RCP1), where soybean meal was reduced by
5.8, 5.8, 4.6, and 3.8 percentage units, and 0.188, 0.179, 0.146, and 0.129% lysine hydrochloride
were added, in the Grower-1, Grower-2, Finisher-1, and Finisher-2 feeding phases, respectively
(no other indispensible AA were added); 3) reduced CP diets (RCP2), where soybean meal was
reduced by 11.7, 11.5, 9.1, and 7.5 percentage units, and 0.375, 0.358, 0.293, and 0.129% lysine
hydrochloride were added, in the Grower-1, Grower-2, Finisher-1, and Finisher-2 feeding
phases, respectively (L-threonine and L-tryptophan were added); 4) reduced CP diets (RCP3),
where soybean meal was reduced by 17.5, 17.3, 13.6, and 11.3 percentage units, and 0.563,
0.536, 0.439, and 0.386% lysine hydrochloride were added, in the Grower-1, Grower-2, Finisher-
1, and Finisher-2 feeding phases, respectively (L-threonine, DL-methionine, L-tryptophan, L-
isoleucine, and L-valine were added); or 5) reduced CP diets (RCP4), where soybean meal was
reduced by 23.3, 23.0, 18.1, and 15.0 percentage units, and 0.750, 0.715, 0.585, and 0.515%
lysine hydrochloride were added, in the Grower-1, Grower-2, Finisher-1, and Finisher-2 feeding
phases, respectively (L-threonine, DL-methionine, L-tryptophan, L-isoleucine, and L-valine were
added). During the last 3-wk feeding phase (Finisher-3), 10 mg/kg of ractopamine hydrochloride
(Paylean; Elanco Animal Health, a division of Eli Lilly, Greenfield, IN) was included in all diets,
and the CP content was formulated to 20.24, 18.60, 17.01, 15.44, and 13.93% for Ctrl, RCP1,
RCP2, RCP3, and RCP4, respectively. In addition, the Ctrl, RCP1, RCP2, RCP3, and RCP4 diets
were formulated with 0.0, 0.15, 0.30, 0.45, and 0.60% lysine hydrochloride, respectively, to
insure an SID lysine:ME of 2.67 g/Mcal (Apple et al., 2004).

4
Pigs were housed in curtain-sided buildings with slatted floors, and each 1.49 × 3.96-m
pen was equipped with a single-opening feeder and nipple waterer, which afforded each pig ad
libitum access to both feed and water. Pigs were fed a 5-phase dietary program with transition
from Grower-1 to Grower-2, Grower-2 to Finisher-1, Finisher-1 to Finisher-2, and Finisher-2 to
Finisher-3 diets at mean block weights of 41, 59, 82, and 104 kg, respectively. All diets were
formulated to 95% of the average SID lysine requirement for barrows and gilts to ensure that
lysine was not above these requirements. Moreover, diets were formulated to exceed the SID AA
ratio recommendations for other indispensable AA by 2.0 percentage units for growing-finishing
barrows and gilts (PIC, 2011) for all phases of production. Dried distillers’ grains with solubles
(DDGS) was included in the first 4 feeding phases at 20.0% (as-fed basis), but DDGS were
eliminated for the Finisher-3 diets. It should be noted that gilts and barrows were fed the same
diets within each feeding phase but gilts were fed on a separate feed budget to adjust for
expected gender differences in BW gain. Moreover, within each feeding phase, diets were
formulated to maintain a constant lysine-to-ME ratio across the dietary treatments.
During the first 4 feeding phases, individual pig BW was measured weekly, and pen feed
disappearance was recorded at the end of each feeding period to calculate ADG, ADFI, and G:F.
In addition, 10th rib fat depth and LM area were measured at the beginning of the study, as well
as at the end of the first 4 feeding phases, by a trained certified ultrasound technician. Due to the
number of pigs on this trial, 3 gilts and 3 barrows were selected randomly from each BW block
to allow for estimation of carcass gain.
Pig Slaughter and Pork Carcass Data Collection
When the average block weight of 127.0 kg was achieved, all pigs were transported
approximately 10 h to a commercial pork slaughter/fabrication facility (Cargill Meat Solutions,
Ottumwa, IA), where pigs were slaughtered according to humane, industry-accepted procedures
after a 6-h lairage. Then, 10th-rib fat and LM depths were measured on-line with a Fat-O-Meater
(FOM) probe and hot carcass weight was recorded before carcasses were exposed to a 24-h rapid
chilling system. After approximately 6 h of chilling, a subsample of randomly selected, left-side
hams (3/pen) and loins (2/pen) were individually identified, and identified whole, bone-in hams
(IMPS #401) and whole, bone-in loins (IMPS #410) were collected during carcass fabrication,
boxed, and transported under refrigeration to the University of Arkansas Red Meat Research
Abattoir for additional data collection.
Ham fabrication. Upon arrival, each ham was weighed, skinned, and subsequently knife-
dissected into the “flat” (biceps femoris), “pillow” (semimembranosus), “knuckle” (quadriceps
complex), semitendinosus, lean muscle trim, fat trim, and bone. Weights of each component
were recorded, and individual muscle weights, along with the weights of all lean, fat, bone, and
skin were divided by the whole ham weight to calculate yields.
Loin fabrication. After 7 d of vacuum-aging at 2°C, loins were removed from their
packaging material, and pH and temperature of the LM was recorded before the blade,
tenderloin, and sirloin sections of each loin were removed. Then, center-cut loins were processed
into: 1) a 2.5-cm-thick chop for visual and instrumental color, firmness, and marbling data
5
collection; 2) two 3.8-cm-thick chops used for drip loss determination; 3) a 2.5-cm-thick chop
for proximate analyses; and 4) two 2.5-cm-thick chops that was vacuum-packaged and
immediately frozen for Warner-Bratzler shear force (WBSF) determinations at a later date.
Pork quality data collection. After a 45-min bloom period at 2°C, trained, experimented
university personnel visually evaluated each LM chop for color based on the American (1 = pale,
pinkish gray to 6 = dark, purplish red; NPPC, 1999) and Japanese color standards for pork
(Nakai et al., 1975), as well as firmness (1 = soft to 3 = very firm; NPPC, 2000) and marbling (1
= 1% i.m. fat to 10 = 10% i.m. fat; NPPC, 1999). Then, instrumental color (L*, a*, and b*)
values were determined from 3 readings on each LM chop with a Hunter MiniScan XE (Hunter
Associate Laboratory, Reston, VA) using illuminant A and a 25-mm viewing diameter. The
spectrocolorimeter was calibrated against a standard white tile (M04207; Hunter Associate
Laboratory) before data collection.
Drip loss was determined according to the suspension method of Honikel et al. (1986),
with modifications described by Apple et al. (2000). Briefly, 3.0-cm-diameter cores were
manually removed from the center of each 3.8-cm-thick LM chop, weighed, and suspended on a
barbless fishhook mounted to the lid of a 46 × 66 × 38 plastic container, and stored for 48 h at
4°C. After storage, each core was removed from its hook, blotted dry on paper towels, and
reweighed. The weight loss was divided by the original core weight to calculated drip loss
percentage.
Duplicate 5-g samples of the LM were removed from each chop designated for proximate
analyses, weighed, placed in 30-mL beakers, and reweighed before being dried for 72 h in a
Labcono freeze-dryer (Labcono Corp., Kansas City, MO) according to the procedure outlined by
Apple et al. (2001). The difference between the initial and dried beaker weights was divided by
the initial LM sample weight to calculate dry matter (DM). Then, dried LM samples were
packaged and submitted to the Poultry Science Department’s Analytical Laboratory (University
of Arkansas Division of Agriculture) for quantification of total protein, fat, and ash according to
AOAC-approved procedures.
Warner-Bratzler Shear Force (WBSF) Determination.
Longissimus muscle chops were thawed for 16 h at 2°C, deboned and trimmed free of
any external fat, weighed, and cooked to an internal endpoint temperature of 71°C on electric,
counter-top griddles (model 07047; National Presto Industries, Inc., Eau Claire, WI). Chops were
turned every 3 min until reaching the endpoint temperature, and internal temperature was
monitored with a hand-held, FoodCheck digital thermometer (Comark Instruments, Inc.,
Beaverton, OR). Immediately after cooking, LM chops were blotted dry on paper towels, and
reweighed, and the difference between the raw and cooked weights was used to calculate
cooking loss percentages. Then, chops were allowed to cool approximately 2 h to room
temperature before six 1.3-cm-diameter cores were mechanically removed parallel to the muscle
fiber orientation. Each core was subsequently sheared once through the center with a WBSF
device attached to an Instron Universal Testing Machine (model 4466; Instron Corp., Canton,
6
MA), equipped with a 55-kg tension/compression laod cell and performed at a crosshead speed
of 250 mm/min. The average of 6 cores/LM chop was averaged for statistical purposes.
Statistical Analyses
Performance, carcass and ham composition, and fresh LM quality data were analyzed as
a randomized complete block design, with blocks based on initial BW, pen as the experimental
unit, and treatments in a 2 × 5 factorial arrangement. The analysis of variance was generated with
the mixed models procedure of SAS (SAS Inst., Inc., Cary, NC), with gender, reduced CP
dietary treatment, and the gender × reduced CP diet as the lone fixed effects included in the
model. When a significant (P ≤ 0.05) F-test was observed, least squares means were separated
using the PDIFF option of SAS. Because of the unequal distribution among the dietary CP
treatments, PROC IML of SAS was used to generate the appropriate coefficients for linear,
quadratic, cubic, and quartic polynomial contrasts. In addition, linear, quadratic, cubic, and
quartic polynomial contrasts were generated to discern the interactive effects of gender and
reduced CP diet on performance, carcass/ham composition, and fresh pork quality characteristic.
Results
Growth Performance
Live weights of pigs decreased linearly with decreasing dietary CP during the Grower-1
(P = 0.009), Grower-2 (P = 0.005), and Finisher-1 (P = 0.002) phases (Figure 1A). Additionally,
BW increased quadratically during the Finisher-2 (P = 0.032) and Finisher-3 (P < 0.001) phases,
with BW dropping off in pigs fed RCP4. Moreover, when Paylean was included in the diet, pig
weights increased with as dietary CP was reduced from Ctrl to RCP3, but BW decreased
approximately 4.4, 4.8, and 6.2 kg between RCP2 and RCP4 during the first, second, and third
week of the Finisher-3 phase, respectively (quadratic, P ≤ 0.01; Figure 1B).
During the Grower-1 and Grower-2 phases, barrows had greater (P ≤ 0.020) ADG and
ADFI than gilts, and barrows were fatter (P < 0.030) at the 10th rib than gilts, resulting in lower
(P ≤ 0.042) calculated lean muscle weights than gilts (Table 6). Both ADG and G:F decreased
linearly (P ≤ 0.055) during the Grower-1 and Grower-2 phases, whereas 10th rib fat depth
increased linearly (P < 0.001) in the Grower-1 phase, as CP decreased in the diet. Even though
LM area was greater (P < 0.05) greater in pigs fed RCP1 and RCP3 than those fed Ctrl, RCP2,
and RCP4 during the Grower-1 phases, LM area increased (quadratic, P = 0.034) with
decreasing dietary CP content. Moreover, calculated lean muscle weight decreased linearly (P ≤
0.007) in growing pigs as CP content was reduced.
Barrows had greater ADG and ADFI in the Finisher-1 (P < 0.001) and Finisher-2 (P ≤
0.003) phases (Table 6). In addition, barrows had greater 10th rib fat depths (P < 0.001) and LM
areas (P = 0.042) than gilts during the Finisher-1 phases, whereas barrows had larger (P = 0.046)
LM areas than gilts during the Finisher-2 phase; however, calculated lean muscle weight was
similar between genders during the Finisher-1 (P = 0.225) and Finisher-2 (P = 0.103) phases.
Both ADG (P = 0.056) and ADFI (P = 0.034) increased linearly as CP was reduced in the
Finisher-1 diets, but neither ADG (P ≥ 0.178) nor ADFI (P ≥ 0.135) were affected by dietary CP

7
reductions during the Finisher-2 phase. During the Finisher-1 (P = 0.095) and Finisher-2 (P =
0.062) phases, fat depth tended to increase as dietary CP was decreased, resulting in decreases in
estimated lean muscle weights during the Finisher-1 (linear, P < 0.001) and Finisher-2
(quadratic, P = 0.089) feeding phases.
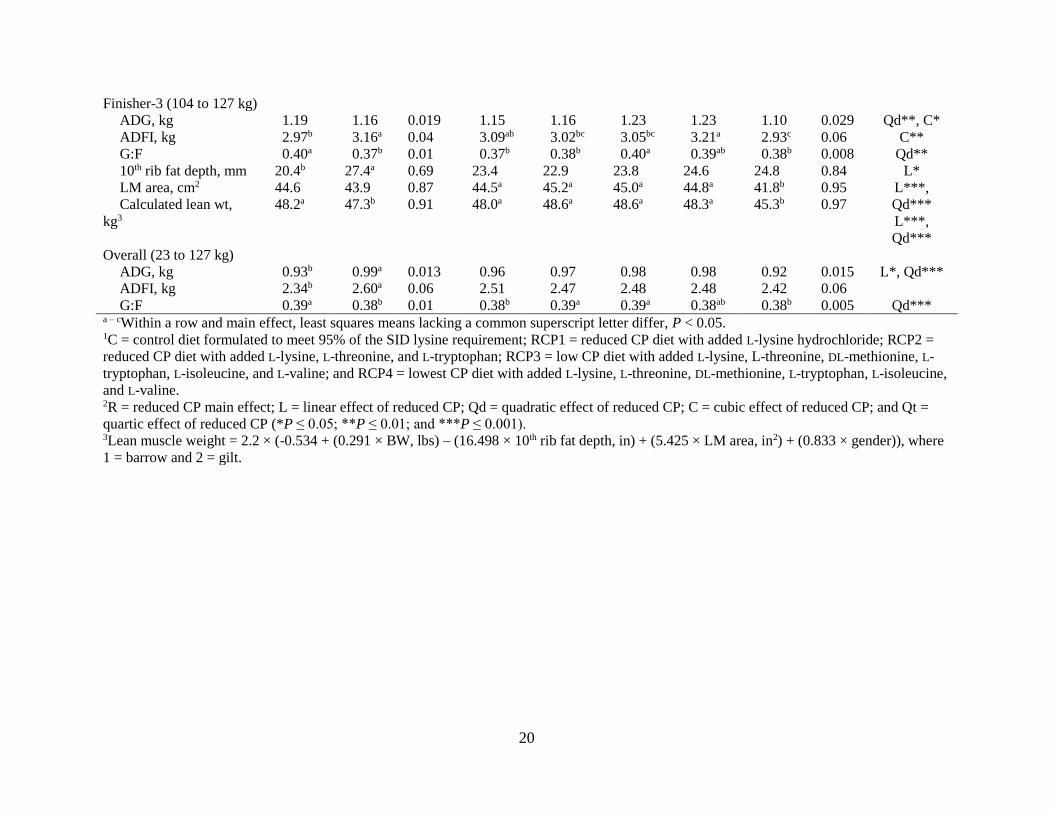
When Paylean was included in the Finisher-3 diets, barrows had greater (P < 0.001)
ADFI and 10th rib fat depth, as well as lower (P = 0.023) estimated lean muscle weights, than
gilts (Table 6). Pigs fed RCP3 had greater (P < 0.05) ADFI than those fed RCP1, RCP2, and
RCP4, and Ctrl-fed pigs had greater (P < 0.05) ADFI than those fed RCP4. Barrows fed the Ctrl
diet may have had greater ADG than Ctrl-fed gilts, but RCP1-, RCP2-, and RCP3-fed gilts had
greater ADG than their castrated male counterparts (quadratic gender × reduced CP diet, P =
0.007; Figure 2A). Furthermore, G:F increased between Ctrl and RCP2 in gilts and decreased
between RCP2 and RCP4, but G:F was relatively unchanged across dietary treatments in barrows
during the Finisher-3 phase (quadratic gender × reduced CP diet, P = 0.014; Figure 2B). Even
though ultrasound-measured fat depth increased linearly (P = 0.022) with decreasing dietary CP,
both LM area and calculated muscle weight increased (quadratic, P < 0.001) with decreasing
dietary CP, with the greatest LMA and muscle weights in RCP1- and RCP2-fed pigs.
Across the entire feeding trial, barrows had greater (P < 0.001) ADG and ADFI than
gilts, but gilts had greater (P < 0.001) G:F than barrows (Table 6). Daily BW gain increased only
2.1% between Ctrl and RCP3, but dropped 6.1% between RCP3 and RCP4 (quadratic, P <
0.001). On the other hand, ADFI tended to decreased linearly (P = 0.085) as CP was reduced in
swine diets. Gain efficiency increased 4.6% in gilts between Ctrl and RCP2 before decreasing
when G:F values were similar between Ctrl and RCP4; however, G:F remained relatively
unchanged in barrows across the 5 dietary treatments (quadratic gender × reduced CP diet, P =
0.041; Figure 3).
Carcass and Ham Compositions
Barrows produced greater (P = 0.008) dressing percentages, resulting in heavier (P =
0.001) carcasses, than gilts (Table 8). Carcasses from barrows also had more (P = 0.008) fat
opposite the 10th rib than gilts, and, even though LM depth was not (P = 0.688) affected by
gender, estimated fat-free lean yield was almost 2 percentage units greater (P < 0.001) in gilt and
barrow carcasses. In addition, hams from gilts had a greater (P < 0.001) proportion of muscle,
and a lower (P < 0.001) percentage of fat, than hams from barrows.
Reducing dietary CP and optimizing the use of crystalline AA had no (P ≥ 0.208) effects
on HCW, dressing percentage, or LM depth; however, fat depth increased linearly (P = 0.001),
and carcass fat-free lean yields decreased linearly (P = 0.018), as CP was reduced in swine diets
(Table 8). Fresh ham weights did not (P = 0.157) differ among dietary treatments, but the percent
of muscle in the fresh ham decreased (linear, P = 0.002), and the percent of fat in the fresh ham
increased (linear, P = 0.012), with decreasing dietary CP. In addition, the yield of the pillow
(biceps femoris) decreased in carcasses from gilts, but increased in carcasses from barrows, as
dietary CP was reduced (linear gender × reduced CP diet, P = 0.016; Figure 4).
Longissimus Muscle Quality Characteristics
8
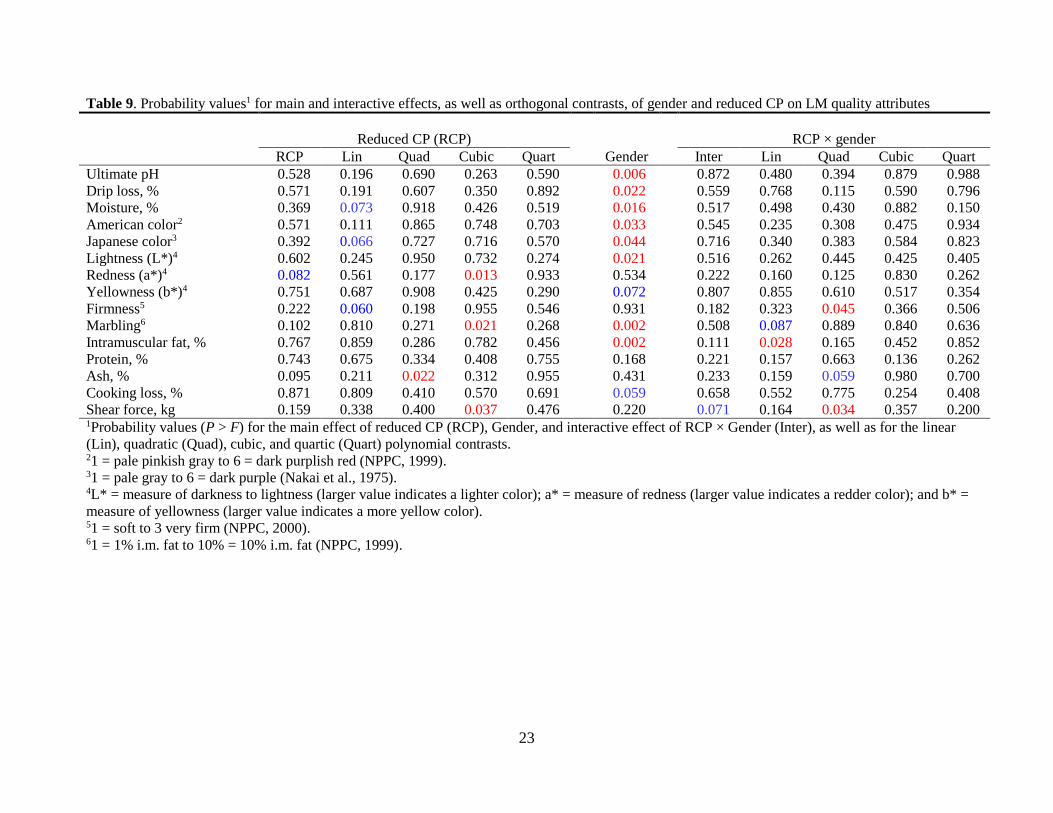
Ultimate muscle pH was greater (P = 0.006) in the LM from barrows than gilts, but drip
loss (P = 0.022) and LM moisture (P = 0.016) were greater, and cooking loss percentage tended
to be less (P = 0.059), in the LM of gilts than barrows (Table 9). The LM from barrows received
greater American (P = 0.033) and Japanese (P = 0.044) color scores than the LM from gilts, and
the LM from barrows was darker (lower L* values, P = 0.021) than that from gilts, but neither
redness (a*) nor yellowness (b*) values differed (P ≥ 0.072) between genders. Interesting, the
observed increases in carcass fatness in barrows may be the reasons that marbling scores were
greater (P = 0.002) in the LM from barrows when compared to the LM of gilts.
The ultimate pH, water-holding capacity, and American color scores of the LM were not
(P ≥ 0.111) altered by dietary CP content (Table 9). Even though neither L* (P ≥ 0.245) nor b*
(P ≥ 0.290) values were altered by the dietary CP treatments, Japanese color scores (linear, P =
0.066) and redness (a*) values (cubic, P = 0.013) increases as CP was reduced in swine diets.
Firmness scores increased with decreasing dietary CP in the LM of gilts, but the LM of barrows
fed RCP2 received greater firmness scores than that of pigs fed Ctrl or RCP4 (quadratic gender ×
reduced CP diet, P = 0.045; Figure 5). Additionally, marbling scores were greatest in pigs fed
RCP1 and RCP4 and least in pigs fed RCP2 and RCP3 (cubic, P = 0.021).
The intramuscular fat (IMF) content of the LM from barrows increased as CP was
reduced in the diet, but IMF content decreased with decreasing dietary CP (linear gender ×
reduced CP diet, P = 0.028; Figure 6B). Additionally, WBSF values of cooked LM chops from
gilts decreased quadratically, whereas WBSF values for LM chops from barrows increased
quadratically, as CP was reduced in the diets of growing-finishing pigs (quadratic gender ×
reduced CP diet, P = 0.034; Figure 7).
Conclusions
Incorporating crystalline AA in grower and finisher swine diets can reduce dietary CP by
24.8, 28.6, 25.6, 19.7, and 25.0% in the Grower-1, Grower-2, Finisher-1, Finisher-2, and
Finisher-3 feeding phases, respectively. More importantly, across the entire feeding trial, ADG,
ADFI, and G:F improved with lower inclusion levels of synthetic AA in reduced CP diets, but
live pig performance and carcass composition declined when fed the reduced CP diet with the
highest synthetic AA inclusion levels. Results of the present study indicate that adding
crystalline lysine hydrochloride up to 0.56, 0.54, 0.44, 0.36, and 0.45% in the Grower-1, Grower-
2, Finisher-1, Finisher-2, and Finisher-3 (with 10 mg/kg Paylean) has no detrimental effects on
growth rate and feed consumption. In addition, fresh pork quality, in particular IMF, was
improved by reducing dietary CP; however, improvements in pork quality associated with
feeding reduced CP diets appear to be gender specific.
Literature Cited
Apple, J. K., J. R. Davis, L. K. Rakes, C. V. Maxwell, M. R. Stivarius, and F. W. Pohlman. 2001. Effects
of dietary magnesium and duration of refrigerated storage on the quality of vacuum-packaged,
boneless pork loins. Meat Sci. 57:43-53.

9
Apple, J. K., C. V. Maxwell, D. C. Brown, K. G. Friesen, R. E. Musser, Z. B. Johnson, and T.A.
Armstrong. 2004. Effects of dietary lysine and energy density on performance and carcass
characteristics of finishing pigs fed Ractopamine. J. Anim. Sci. 82:3277-3287.
Apple, J. K., C. V. Maxwell, B. deRodas, H. B. Watson, and Z. B. Johnson. 2000. Effect of magnesium
mica on performance and carcass quality of growing-finishing swine. J. Anim. Sci. 78:2135-2143.
Apple, J. K., P. J. Rincker, F. K. McKeith, S. N. Carr, T. A. Armstrong, and P. D. Matzat. 2007. Meta-
analysis of ractopamine responses in finishing swine. Prof. Anim. Sci. 23:179-196.
DeCamp, S. A., S.L. Hankins, A. Carroll D.J. Ivers, B.T. Richert, A.L. Sutton, and D.B. Anderson. 2001.
Effect of Ractopamine and dietary crude protein on nitrogen and phosphorus excretion from
finishing pigs. J. Anim. Sci. 79 (Suppl. 1):61 (Abstr.).
Dourmad, J. Y., Y. Henry, D. Bourdon, N. Quiniou, and D. Guillou. 1993. Effect of growth potential and
dietary protein input on growth performance, carcass characteristics and nitrogen output in
growing-finishing pigs. Pages 206–211 in Proc. 1st Int. Symp. Nitrogen Flow in Pig Production and
Environmental Consequences. EAAP Publ. No. 69. P. M. W. A. Verstegen, L. A. den Hartog, G. J.
M. van Kempen, and J. H. M. Metz, ed. Pudoc, Wageningen, the Netherlands
Figueroa, J. L., A. J. Lewis, P. S. Miller, R. L. Fischer, R. S. Gómez, and R. M. Diedrichsen. 2002.
Nitrogen metabolism and growth performance of gilts fed standard corn-soybean meal diets or low-
crude protein, amino acid-supplemented diets. J. Anim. Sci. 80:2911–2919.
Hinson, R. B., A. P. Schinckel, J. S. Radcliffe, G. L. Allee, A. L. Sutton and B. T. Richert. 2009. Effect of
feeding reduced crude protein and phosphorus diets on weaning-finishing pig growth performance,
carcass characteristics, and bone characteristics. J. Anim. Sci. 87:1502-1517.
Honikel, D. O., C. J. Kim, R. Roncales, and R. Hamm. 1986. Sarcomeme shortening of prerigor muscles
and its influence on drip loss. Meat Sci. 16:267-282.
Feed Additive Compendium. 2010. Supplement # 4. Miller Publishing Company, 12400 Whitewater
Drive, Suite 160. Minnetonka, Minn. 55343.
Gaines, A. M., R. D. Boyd, M. E. Johnston, G. L. Allee, and J. L. Usry. 2007. Lysine source affects
ractopamine diets. Feedstuffs, vol. 79, No. 16 (March 26, 2007).
Gaines, A.M., B.W. Ratiff, P. Srichana, G.L. Allee and J.L. Usry. 2004. Evaluation of high synthetic
lysine diets for pigs fed ractopamine HCl (Paylean). J. Anim. Sci. 82 (Suppl.2):38 (Abstr.).
Kendall, D. C. 2000. Dietary manipulation of swine diets to reduce aerial ammonia, hydrogen sulfide,
odor, and nutrient excretion; and evaluating the effects of pig genotype, sex, antibiotic use, and
health management practices on lean growth rate, carcass characteristics, pork quality, and immune
system variables. MS Thesis. Purdue Univ., West Lafayette, IN.
Kerr, B. J., and R. A. Easter. 1995. Effect of feeding reduced protein, amino acid-supplemented diets on
nitrogen and energy balance in grower pigs. J. Anim. Sci. 73:3000–3008.
Kerr, B. J., F. K. McKeith, and R. A. Easter. 1995. Effect on performance and carcass characteristics of
nursery to finisher pigs fed reduced crude protein, amino acid-supplemented diets. J. Anim. Sci.
73:433–440.
Nakai, H., F. Saito, T. Ikeda, S. Ando, and A. Komatsu. 1975. Standard models of pork colour. Bull. Natl.
Inst. Anim. Ind. (Chiba) 29:69-75.
Neill, C. R., S.S. Dritz, M.D. Tokach, J.L. Nelssen, R.D. Goodband, J.M DeRouchey and J.L Usry. 2006.
Lysine requirement of pigs fed ractopamine HCl in a commercial facility. J. Anim. Sci. 84 (Suppl.
2):197 (Abstr.)

10
Nold, R. A, J. R. Romans, W. J. Costello, and G. W. Libal. 1999. Characterization of muscles from boars,
barrows, and gilts slaughtered at 100 or 110 kilograms: differences in fat, moisture, color, water-
holding capacity, and collagen. J. Anim. Sci. 77:1746-1754.
NPPC. 1991. Procedures to Evaluate Market Hogs. 3rd ed. Natl. Pork Prod. Council, Des Moines, IA.
NPPC. 1999. Official Color and Marbling Standards. Natl. Pork Prod. Council, Des Moines, IA.
NPPC. 2000. Composition and Quality Assessment Procedures. Natl. Pork. Prod. Council, Des Moines,
IA.
NRC. 1998. National Requirements of Swine. 10th ed. Natl. Acad.Press, Washington, DC.
PIC. 2011. Nutrient Specification Manuel. PIC, Inc., Hendersonville, TN.
Teye, G. A., P. R. Sheard, F. M. Whittington, G. R. Nute, A. Stewart, and J. D. Wood. 2006. Influence of
dietary oils and protein level on pork quality. 1. Effects on muscle fatty acid composition, carcass,
meat and eating quality. Meat Sci. 73:157-165.

11
Table 1. Composition (as-fed basis) of grower diets1
Grower-1 phase (23 to 41 kg) Grower-2 phase (41 to 59 kg)
C RCP1 RCP2 RCP3 RCP4 C RCP1 RCP2 RCP3 RCP4
CP, %: 23.70 21.61 19.58 17.61 15.72 21.53 19.46 17.44 15.49 13.61
Ingredient, %
Corn 47.39 53.06 58.64 63.95 68.62 53.10 58.69 64.21 69.09 73.82
Soybean meal 30.08 24.23 18.38 12.53 6.73 24.55 18.78 13.00 7.25 1.50
DDGS1 20.00 20.00 20.00 20.00 20.00 20.00 20.00 20.00 20.00 20.00 Limestone 0.95 0.98 1.01 1.03 1.06 0.99 1.01 1.04 1.06 1.09
Restaurant grease 0.55 0.49 0.43 0.40 0.50 0.50 0.46 0.40 0.50 0.58
Salt 0.50 0.50 0.50 0.50 0.50 0.50 0.50 0.50 0.50 0.50 Dicalcium phosphate 0.16 0.20 0.23 0.27 0.31 0.09 0.12 0.16 0.20 0.24
Vitamin premix2 0.13 0.13 0.13 0.13 0.13 0.13 0.13 0.13 0.13 0.13
Trace mineral premix3 0.10 0.10 0.10 0.10 0.10 0.10 0.10 0.10 0.10 0.10
Copper sulfate 0.10 0.10 0.10 0.10 0.10 --- --- --- --- ---
Ethoxiquin 0.03 0.03 0.03 0.03 0.03 0.03 0.03 0.03 0.03 0.03
Ronozyme 0.02 0.02 0.02 0.02 0.02 0.02 0.02 0.02 0.02 0.02
Potassium sulfate 0.00 0.00 0.00 0.10 0.50 0.00 0.00 0.00 0.30 0.65
l-lysine 0.00 0.19 0.38 0.56 0.75 0.00 0.18 0.36 0.54 0.72
L-threonine 0.00 0.00 0.05 0.13 0.22 0.00 0.00 0.04 0.12 0.20
DL-methionine 0.00 0.00 0.00 0.05 0.11 0.00 0.00 0.00 0.00 0.07
L-isoleucine 0.00 0.00 0.00 0.04 0.14 0.00 0.00 0.00 0.07 0.16
L-valine 0.00 0.00 0.00 0.01 0.11 0.00 0.00 0.00 0.03 0.12
L-tryptophan 0.00 0.00 0.03 0.06 0.09 0.00 0.00 0.03 0.06 0.09
Calculated composition,
%
Total lysine 1.19 1.17 1.16 1.14 1.13 1.03 1.02 1.00 0.99 0.98
SID lysine 1.01 1.01 1.01 1.01 1.01 0.86 0.86 0.86 0.86 0.86 Total P 0.51 0.49 0.47 0.45 0.43 0.47 0.45 0.44 0.42 0.40
Available P 0.31 0.31 0.31 0.31 0.31 0.29 0.29 0.29 0.29 0.29
Total Ca 0.55 0.55 0.55 0.55 0.55 0.53 0.53 0.53 0.53 0.53
ME, Mcal/kg 3.37 3.37 3.37 3.37 3.37 3.38 3.38 3.38 3.38 3.38 1C = control diet formulated to meet 95% of the SID lysine requirement; RCP1 = reduced CP diet with added L-lysine hydrochloride; RCP2 =
reduced CP diet with added L-lysine, L-threonine, and L-tryptophan; RCP3 = low CP diet with added L-lysine, L-threonine, DL-methionine, L-
12
tryptophan, L-isoleucine, and L-valine; and RCP4 = lowest CP diet with added L-lysine, L-threonine, DL-methionine, L-tryptophan, L-isoleucine,
and L-valine.
2Dried distillers’ grains with solubles 3Supplied 5,512 IU vitamin A, 689 IU vitamin D3 (D-activated animal sterol), 22.05 IU vitamin E, 2.2 mg vitamin K (menadione sodium
bisulfite), 13.78 mg pantothenic acid (D-calcium pantothenate), 4.8 mg niacin, 4.13 mg riboglavin, and 19.3 µg vitamin B12 per kg of feed. 4Supplied 0.20 mg SE from sodium selenite, 26.4 mg Mn from manganous oxide, 110 mg Zn from zinc oxide, 110 mg Fe from ferrous sulfate,
11 mg Cu from copper sulfate, and 0.20 mg I from calcium iodate per kg of feed.

13
Table 2. Composition (as-fed basis) of finisher diets1
Finisher-1 (59 to 82 kg) Finisher-2 (82 to 104 kg) Finisher-3 (104-127 kg)
C RCP1 RCP2 RCP3 RCP4 C RCP1 RCP2 RCP3 RCP4 C RCP1 RCP2 RCP3 RCP4
CP, %: 18.97 17.34 15.74 14.16 12.68 17.66 16.30 14.96 13.64 12.37 20.24 18.60 17.01 15.44 13.93
Ingredient, %
Corn 59.35 63.76 68.03 71.78 75.55 62.97 66.63 69.97 73.08 76.24 69.14 73.76 78.24 82.25 86.23
Soybean meal 18.40 13.83 9.28 4.75 0.25 15.00 11.20 7.45 3.73 0.00 28.65 23.85 19.10 14.35 9.60
DDGS2 20.00 20.00 20.00 20.00 20.00 20.00 20.00 20.00 20.00 20.00 --- --- --- --- --- Limestone 1.16 1.18 1.20 1.22 1.24 0.94 0.95 0.97 0.99 1.00 0.60 0.62 0.65 0.67 0.69
Restaurant grease 0.31 0.28 0.26 0.42 0.47 0.33 0.30 0.38 0.50 0.58 0.45 0.40 0.36 0.46 0.49
Salt 0.50 0.50 0.50 0.50 0.50 0.50 0.50 0.50 0.50 0.50 0.50 0.50 0.50 0.50 0.50 Dicalcium phosphate 0.01 0.04 0.07 0.10 0.13 0.00 0.03 0.05 0.08 0.10 0.36 0.40 0.43 0.46 0.49
Vitamin premix3 0.13 0.13 0.13 0.13 0.13 0.13 0.13 0.13 0.13 0.13 0.13 0.13 0.13 0.13 0.13
Trace mineral premix4 0.10 0.10 0.10 0.10 0.10 0.10 0.10 0.10 0.10 0.10 0.10 0.10 0.10 0.10 0.10
Ethoxiquin 0.03 0.03 0.03 0.03 0.03 0.03 0.03 0.03 0.03 0.03 0.03 0.03 0.03 0.03 0.03
Ronozyme 0.02 0.02 0.02 0.02 0.02 0.02 0.02 0.02 0.02 0.02 0.02 0.02 0.02 0.02 0.02
Potassium sulfate 0.00 0.00 0.05 0.35 0.60 0.00 0.00 0.15 0.40 0.60 0.00 0.00 0.00 0.25 0.50
L-lysine 0.00 0.15 0.29 0.44 0.59 0.00 0.12 0.24 0.36 0.48 0.00 0.15 0.30 0.45 0.60
L-threonine 0.00 0.00 0.03 0.10 0.16 0.00 0.00 0.01 0.06 0.11 0.00 0.03 0.10 0.16 0.23
DL-methionine 0.00 0.00 0.00 0.00 0.01 --- --- --- --- --- 0.00 0.00 0.02 0.06 0.10
L-isoleucine 0.00 0.00 0.00 0.03 0.10 0.00 0.00 0.00 0.00 0.06 0.00 0.00 0.00 0.03 0.11
L-valine 0.00 0.00 0.00 0.00 0.05 --- --- --- --- --- 0.00 0.00 0.00 0.02 0.10
L-tryptophan 0.00 0.00 0.02 0.05 0.07 0.00 0.00 0.02 0.04 0.06 0.00 0.00 0.02 0.05 0..07
Paylean5 --- --- --- --- --- --- --- --- --- --- 0.03 0.03 0.03 0.03 0.03
Calculated composition, %
Total lysine 0.90 0.89 0.88 0.87 0.86 0.81 0.80 0.79 0.78 0.77 1.02 1.01 1.00 0.99 0.98
SID lysine 0.74 0.74 0.74 0.74 0.74 0.65 0.65 0.65 0.65 0.65 0.90 0.90 0.90 0.90 0.90 Total P 0.43 0.42 0.41 0.39 0.38 0.42 0.41 0.39 0.38 0.37 0.46 0.44 0.43 0.41 0.40
Available P 0.26 0.26 0.26 0.26 0.26 0.26 0.26 0.26 0.26 0.26 0.25 0.25 0.25 0.25 0.25
Total Ca 0.56 0.56 0.56 0.56 0.56 0.46 0.46 0.46 0.46 0.46 0.45 0.45 0.45 0.45 0.45
ME, Mcal/kg 3.37 3.37 3.37 3.37 3.37 3.38 3.38 3.38 3.38 3.38 3.38 3.38 3.38 3.38 3.38 1C = control diet formulated to meet 95% of the SID lysine requirement; RCP1 = reduced CP diet with added L-lysine hydrochloride; RCP2 = reduced CP diet with added L-
lysine, L-threonine, and L-tryptophan; RCP3 = low CP diet with added L-lysine, L-threonine, DL-methionine, L-tryptophan, L-isoleucine, and L-valine; and RCP4 = lowest CP
diet with added L-lysine, L-threonine, DL-methionine, L-tryptophan, L-isoleucine, and L-valine. 2Dried distillers’ grains with solubles 3Supplied 5,512 IU vitamin A, 689 IU vitamin D3 (D-activated animal sterol), 22.05 IU vitamin E, 2.2 mg vitamin K (menadione sodium bisulfite), 13.78 mg pantothenic
acid (D-calcium pantothenate), 4.8 mg niacin, 4.13 mg riboglavin, and 19.3 µg vitamin B12 per kg of feed. 4Supplied 0.20 mg SE from sodium selenite, 26.4 mg Mn from manganous oxide, 110 mg Zn from zinc oxide, 110 mg Fe from ferrous sulfate, 11 mg Cu from copper
sulfate, and 0.20 mg I from calcium iodate per kg of feed.

14
5Paylean (ractopamine hydrochloride; Elanco Animal Health, a Division of Eli Lilly, Co., Greenfield, IN).

15
Table 3. Amino acid composition (as-fed basis) of grower diets1
Grower-1 phase (23 to 41 kg) Grower-2 phase (41 to 59 kg)
C RCP1 RCP2 RCP3 RCP4 C RCP1 RCP2 RCP3 RCP4
CP, %: 23.70 21.61 19.58 17.61 15.72 21.53 19.46 17.44 15.49 13.61
Calculated, %
Lysine 1.19 1.17 1.16 1.14 1.13 1.03 1.02 1.00 0.99 0.98
Methionine 0.39 0.36 0.33 0.35 0.38 0.37 0.34 0.31 0.29 0.32
Methionine + cysteine 0.81 0.75 0.69 0.67 0.66 0.75 0.69 0.63 0.58 0.58
Threonine 0.91 0.81 0.77 0.76 0.75 0.83 0.73 0.68 0.66 0.65
Tryptophan 0.27 0.23 0.22 0.22 0.22 0.23 0.20 0.19 0.19 0.18
Isoleucine 0.98 0.87 0.76 0.69 0.68 0.81 0.71 0.62 0.59 0.58
Valine 1.14 1.03 0.92 0.81 0.80 0.97 0.87 0.77 0.69 0.68
Leucine 2.20 2.05 1.89 1.73 1.56 2.02 1.87 1.71 1.56 1.40
Histidine 0.64 0.58 0.51 0.45 0.39 0.58 0.52 0.46 0.40 0.34
Arginine 1.45 1.27 1.09 0.90 0.72 1.32 1.15 0.97 0.79 0.61
Phenylalanine 1.17 1.05 0.94 0.82 0.70 1.06 0.95 0.83 0.72 0.60
Analyzed, %
CP 23.44 21.40 19.42 17.63 15.16 20.97 19.27 16.99 14.98 13.66
Lysine 1.15 1.14 1.16 1.16 1.12 1.00 0.99 0.98 0.96 0.93
Methionine 0.38 0.35 0.33 0.34 0.34 0.36 0.34 0.31 0.28 0.31
Methionine + cysteine 0.76 0.69 0.66 0.63 0.61 0.70 0.67 0.61 0.55 0.56
Threonine 0.88 0.77 0.76 0.74 0.78 0.78 0.71 0.64 0.62 0.67
Tryptophan 0.27 0.24 0.23 0.22 0.22 0.23 0.20 0.19 0.20 0.18
Isoleucine 0.96 0.86 0.79 0.70 0.62 0.85 0.76 0.64 0.60 0.55
Valine 1.10 1.00 0.92 0.81 0.75 0.99 0.90 0.79 0.70 0.66
Leucine 2.12 1.94 1.88 1.71 1.48 1.93 1.83 1.62 1.48 1.36
Histidine 0.60 0.56 0.51 0.45 0.38 0.54 0.49 0.44 0.38 0.33
Arginine 1.45 1.26 1.15 0.98 0.75 1.28 1.12 0.97 0.80 0.63
Phenylalanine 1.15 1.02 0.96 0.84 0.68 1.02 0.93 0.80 0.69 0.60 1C = control diet formulated to meet 95% of the SID lysine requirement; RCP1 = reduced CP diet with added L-lysine hydrochloride; RCP2 =
reduced CP diet with added L-lysine, L-threonine, and L-tryptophan; RCP3 = low CP diet with added L-lysine, L-threonine, DL-methionine, L-
tryptophan, L-isoleucine, and L-valine; and RCP4 = lowest CP diet with added L-lysine, L-threonine, DL-methionine, L-tryptophan, L-isoleucine,
and L-valine.

16
Table 4. Amino acid composition (as-fed basis) of finisher diets1
Finisher-1 (59 to 82 kg) Finisher-2 (82 to 104 kg) Finisher-3 (104-127 kg)
C RCP1 RCP2 RCP3 RCP4 C RCP1 RCP2 RCP3 RCP4 C RCP1 RCP2 RCP3 RCP4
CP, %: 18.97 17.34 15.74 14.16 12.68 17.66 16.30 14.96 13.64 12.37 20.24 18.60 17.01 15.44 13.93
Calculated, %
Lysine 0.90 0.89 0.88 0.87 0.86 0.81 0.80 0.79 0.78 0.77 1.02 1.01 1.00 0.99 0.98
Methionine 0.34 0.31 0.29 0.27 0.26 0.32 0.30 0.28 0.26 0.24 0.35 0.33 0.32 0.34 0.36
Methionine + cysteine 0.69 0.64 0.59 0.54 0.50 0.65 0.61 0.57 0.53 0.49 0.68 0.64 0.61 0.60 0.60
Threonine 0.71 0.64 0.60 0.59 0.58 0.66 0.60 0.54 0.54 0.53 0.78 0.74 0.73 0.72 0.71
Tryptophan 0.20 0.17 0.17 0.16 0.16 0.18 0.15 0.15 0.15 0.14 0.23 0.20 0.19 0.19 0.19
Isoleucine 0.75 0.66 0.57 0.51 0.50 0.68 0.61 0.54 0.47 0.45 0.81 0.73 0.64 0.59 0.58
Valine 0.90 0.81 0.73 0.64 0.60 0.84 0.76 0.69 0.62 0.55 0.92 0.84 0.76 0.69 0.68
Leucine 1.83 1.71 1.58 1.45 1.33 1.74 1.64 1.54 1.43 1.32 1.83 1.71 1.59 1.47 1.34
Histidine 0.52 0.47 0.42 0.37 0.32 0.48 0.44 0.40 0.36 0.32 0.52 0.47 0.42 0.38 0.33
Arginine 1.12 0.98 0.83 0.69 0.55 1.01 0.90 0.78 0.66 0.54 1.30 1.15 1.00 0.85 0.70
Phenylalanine 0.92 0.83 0.73 0.64 0.55 0.85 0.77 0.70 0.62 0.54 0.99 0.90 0.81 0.72 0.62
Analyzed, %
CP 19.05 17.64 15.53 14.17 12.82 17.54 16.54 15.21 14.08 12.50 18.82 17.72 16.03 14.12 12.62
Lysine 0.85 0.84 0.79 0.84 0.88 0.76 0.77 0.76 0.78 0.72 1.00 0.99 0.99 0.97 0.96
Methionine 0.33 0.32 0.29 0.27 0.26 0.32 0.31 0.29 0.27 0.25 0.30 0.29 0.28 0.29 0.31
Methionine + cysteine 0.66 0.62 0.57 0.53 0.50 0.63 0.61 0.58 0.53 0.50 0.61 0.58 0.55 0.53 0.53
Threonine 0.70 0.64 0.57 0.58 0.57 0.65 0.60 0.55 0.55 0.53 0.71 0.71 0.70 0.64 0.61
Tryptophan 0.21 0.18 0.17 0.16 0.15 0.18 0.16 0.16 0.15 0.14 0.23 0.21 0.20 0.19 0.18
Isoleucine 0.74 0.66 0.57 0.51 0.49 0.67 0.61 0.56 0.50 0.45 0.78 0.72 0.63 0.55 0.53
Valine 0.88 0.81 0.70 0.63 0.60 0.81 0.75 0.71 0.64 0.55 0.89 0.82 0.73 0.63 0.62
Leucine 1.78 1.66 1.54 1.40 1.30 1.73 1.66 1.59 1.48 1.37 1.66 1.57 1.43 1.27 1.15
Histidine 0.49 0.45 0.39 0.35 0.32 0.46 0.43 0.40 0.37 0.32 0.50 0.46 0.41 0.35 0.31
Arginine 1.11 1.00 0.83 0.71 0.58 1.02 0.93 0.82 0.70 0.59 1.26 1.14 1.00 0.83 0.69
Phenylalanine 0.91 0.83 0.73 0.64 0.56 0.85 0.79 0.73 0.65 0.57 0.95 0.87 0.78 0.65 0.56 1C = control diet formulated to meet 95% of the SID lysine requirement; RCP1 = reduced CP diet with added L-lysine hydrochloride; RCP2 = reduced CP
diet with added L-lysine, L-threonine, and L-tryptophan; RCP3 = low CP diet with added L-lysine, L-threonine, DL-methionine, L-tryptophan, L-isoleucine,
and L-valine; and RCP4 = lowest CP diet with added L-lysine, L-threonine, DL-methionine, L-tryptophan, L-isoleucine, and L-valine.

17
Table 5. Probability values1 for main and interactive effects, as well as orthogonal contrasts, of gender and reduced CP on live pig performance
Reduced CP (RCP) RCP × gender
RCP Lin Quad Cubic Quart Gender Inter Lin Quad Cubic Quart
Grower-1 (23 to 41 kg)
ADG, kg
ADFI, kg
G:F
10th rib fat depth, mm
LM area, cm2
Calculated lean wt, kg2
0.056
0.170
< 0.001
0.006
0.022
0.015
0.010
0.242
< 0.001
< 0.001
0.520
0.007
0.106
0.099
0.961
0.415
0.034
0.051
0.910
0.214
0.288
0.744
0.527
0.754
0.963
0.348
0.537
0.304
0.011
0.219
0.004
0.019
0.127
0.029
0.057
0.002
0.947
0.167
0.396
0.534
0.114
0.687
0.476
0.527
0.783
0.388
0.249
0.383
0.743
0.434
0.777
0.434
0.026
0.252
0.765
0.071
0.154
0.225
0.284
0.699
0.927
0.134
0.174
0.590
0.778
0.986
Grower-2 (41 to 59 kg)
ADG, kg
ADFI, kg
G:F
10th rib fat depth, mm
LM area, cm2
Calculated lean wt, kg2
0.050
0.273
0.014
0.187
0.010
0.002
0.055
0.265
0.027
0.095
0.042
0.002
0.740
0.285
0.105
0.627
0.020
0.042
0.024
0.690
0.019
0.407
0.695
0.269
0.359
0.106
0.680
0.114
0.035
0.091
< 0.001
< 0.001
0.239
0.002
0.118
0.042
0.340
0.760
0.653
0.715
0.500
0.855
0.400
0.665
0.462
0.871
0.904
0.918
0.263
0.495
0.614
0.198
0.867
0.433
0.123
0.281
0.209
0.810
0.265
0.702
0.687
0.884
0.832
0.557
0.154
0.462
Finisher-1 (59 to 82 kg)
ADG, kg
ADFI, kg
G:F
10th rib fat depth, mm
LM area, cm2
Calculated lean wt, kg2
0.192
0.264
0.200
0.406
0.011
< 0.001
0.056
0.034
0.986
0.131
0.027
< 0.001
0.230
0.924
0.434
0.310
0.004
0.006
0.309
0.433
0.023
0.515
0.988
0.392
0.964
0.889
0.727
0.620
0.444
0.667
< 0.001
< 0.001
0.238
< 0.001
0.046
0.225
0.546
0.281
0.822
0.882
0.711
0.432
0.118
0.090
0.842
0.895
0.264
0.168
0.613
0.141
0.549
0.378
0.364
0.187
0.683
0.993
0.302
0.702
0.940
0.748
0.696
0.967
0.863
0.645
0.886
0.851
Finisher-2 (82 to 104 kg)
ADG, kg
ADFI, kg
G:F
10th rib fat depth, mm
LM area, cm2
Calculated lean wt, kg2
0.473
0.577
0.166
0.393
0.462
0.213
0.178
0.502
0.019
0.062
0.874
0.135
0.336
0.672
0.416
0.534
0.215
0.089
0.982
0.941
0.902
0.902
0.168
0.428
0.381
0.135
0.674
0.720
0.743
0.774
0.003
< 0.001
< 0.001
< 0.001
0.238
0.103
0.877
0.973
0.753
0.941
0.470
0.808
0.349
0.770
0.194
0.459
0.221
0.271
0.742
0.800
0.964
0.908
0.201
0.678
0.973
0.937
0.716
0.760
0.555
0.798
0.658
0.564
0.937
0.744
0.829
0.732
Finisher-3 (104 to 127 kg)
ADG, kg
ADFI, kg
G:F
0.011
0.018
0.018
0.734
0.474
0.587
0.003
0.197
0.002
0.037
0.004
0.964
0.812
0.198
0.133
0.376
< 0.001
< 0.001
0.073
0.565
0.032
0.597
0.505
0.148
0.007
0.154
0.014
0.801
0.497
0.624
0.342
0.903
0.137

18
10th rib fat depth, mm
LM area, cm2
Calculated lean wt, kg2
0.162
< 0.001
< 0.001
0.022
< 0.001
< 0.001
0.640
< 0.001
< 0.001
0.321
0.206
0.136
0.868
0.331
0.444
< 0.001
0.145
0.023
0.585
0.356
0.212
0.342
0.314
0.209
0.682
0.090
0.055
0.248
0.876
0.491
0.526
0.502
0.756
Overall (23 to 127 kg)
ADG, kg
ADFI, kg
G:F
0.001
0.295
0.006
0.050
0.085
0.478
< 0.001
0.629
< 0.001
0.078
0.193
0.402
0.684
0.909
0.444
< 0.001
< 0.001
< 0.001
0.318
0.776
0.135
0.107
0.294
0.314
0.178
0.551
0.041
0.730
0.606
0.532
0.685
0.876
0.221 1Probability values (P > F) for the main effect of reduced CP (RCP), Gender, and interactive effect of RCP × Gender (Inter), as well as for the linear
(Lin), quadratic (Quad), cubic, and quartic (Quart) polynomial contrasts. 2Lean muscle weight = 2.2 × (-0.534 + (0.291 × BW, lbs) – (16.498 × 10th rib fat depth, in) + (5.425 × LM area, in2) + (0.833 × gender)), where 1 =
barrow and 2 = gilt.

19
Table 6. Main effects of gender and reduced CP diet on live pig performance
Gender Reduced CP1
Gilt Barrow SEM C RCP1 RCP2 RCP3 RCP4 SEM Effect2
Grower-1 (23 to 41 kg)
ADG, kg
ADFI, kg
G:F
10th rib fat depth, mm
LM area, cm2
Calculated lean wt,
kg3
0.74b
1.46b
0.51
6.9b
19.1
16.6a
0.78a
1.51a
0.52
7.2a
18.5
16.1b
0.026
0.07
0.00
0.27
0.92
0.84
0.77
1.46
0.53ab
6.5b
18.4bc
16.4a
0.78
1.46
0.53a
6.9ab
19.6a
16.8a
0.77
1.53
0.51bc
7.0a
18.5bc
16.4a
0.75
1.52
0.50c
7.4a
19.2a
16.4a
0.72
1.48
0.49c
7.4a
18.2c
15.8b
0.029
0.07
0.011
0.31
0.96
0.85
L**
L***
L***
Qd*
L**, Qd*
Grower-2 (41 to 59 kg)
ADG, kg
ADFI, kg
G:F
10th rib fat depth, mm
LM area, cm2
Calculated lean wt,
kg3
0.85b
1.99b
0.43
8.5b
26.2
24.1b
0.94a
2.22a
0.42
9.5a
26.7
24.6a
0.029
0.09
0.01
0.25
1.06
1.05
0.93
2.16
0.43a
8.5
26.3bc
24.6a
0.88
2.07
0.42a
8.8
27.5a
24.8a
0.91
2.12
0.43a
9.5
26.3bc
24.3a
0.90
2.07
0.43a
8.8
26.8ab
24.6a
0.86
2.10
0.41b
9.4
25.3c
23.4b
0.031
0.09
0.007
0.36
1.11
1.07
L*, C*
L*, C*
L*, Qd*
L**, Qd*
Finisher-1 (59 to 82 kg)
ADG, kg
ADFI, kg
G:F
10th rib fat depth, mm
LM area, cm2
Calculated lean wt,
kg3
0.97b
2.40b
0.40
12.1b
31.8b
31.3
1.07a
2.74a
0.39
15.1a
39.3a
31.6
0.014
0.07
0.01
0.32
1.04
1.09
1.02
2.65
0.39
13.3
32.1a
31.8a
1.05
2.58
0.41
13.3
33.0a
32.0a
1.03
2.57
0.40
13.5
32.7a
31.9a
1.00
2.56
0.39
13.4
32.4a
31.6a
0.99
2.48
0.40
14.4
30.8b
30.1b
0.021
0.08
0.007
0.49
1.09
1.11
L*
C*
L*, Qd**
L***, Qd**
Finisher-2 (82 to 104 kg)
ADG, kg
ADFI, kg
G:F
10th rib fat depth, mm
LM area, cm2
Calculated lean wt,
kg3
0.92b
2.86b
0.32a
18.4b
40.1
40.1
0.97a
3.21a
0.30b
24.5a
32.3
39.4
0.012
0.06
0.01
0.76
1.17
1.04
0.92
3.04
0.30
20.8
39.5
39.9
0.95
3.10
0.31
20.9
39.4
40.0
0.94
2.99
0.32
21.0
40.0
40.1
0.96
3.07
0.32
21.9
40.6
40.0
0.95
2.99
0.32
22.5
38.8
38.7
0.019
0.08
0.008
0.95
1.30
1.10
L*
20
Finisher-3 (104 to 127 kg)
ADG, kg
ADFI, kg
G:F
10th rib fat depth, mm
LM area, cm2
Calculated lean wt,
kg3
1.19
2.97b
0.40a
20.4b
44.6
48.2a
1.16
3.16a
0.37b
27.4a
43.9
47.3b
0.019
0.04
0.01
0.69
0.87
0.91
1.15
3.09ab
0.37b
23.4
44.5a
48.0a
1.16
3.02bc
0.38b
22.9
45.2a
48.6a
1.23
3.05bc
0.40a
23.8
45.0a
48.6a
1.23
3.21a
0.39ab
24.6
44.8a
48.3a
1.10
2.93c
0.38b
24.8
41.8b
45.3b
0.029
0.06
0.008
0.84
0.95
0.97
Qd**, C*
C**
Qd**
L*
L***,
Qd***
L***,
Qd***
Overall (23 to 127 kg)
ADG, kg
ADFI, kg
G:F
0.93b
2.34b
0.39a
0.99a
2.60a
0.38b
0.013
0.06
0.01
0.96
2.51
0.38b
0.97
2.47
0.39a
0.98
2.48
0.39a
0.98
2.48
0.38ab
0.92
2.42
0.38b
0.015
0.06
0.005
L*, Qd***
Qd*** a – cWithin a row and main effect, least squares means lacking a common superscript letter differ, P < 0.05. 1C = control diet formulated to meet 95% of the SID lysine requirement; RCP1 = reduced CP diet with added L-lysine hydrochloride; RCP2 =
reduced CP diet with added L-lysine, L-threonine, and L-tryptophan; RCP3 = low CP diet with added L-lysine, L-threonine, DL-methionine, L-
tryptophan, L-isoleucine, and L-valine; and RCP4 = lowest CP diet with added L-lysine, L-threonine, DL-methionine, L-tryptophan, L-isoleucine,
and L-valine. 2R = reduced CP main effect; L = linear effect of reduced CP; Qd = quadratic effect of reduced CP; C = cubic effect of reduced CP; and Qt =
quartic effect of reduced CP (*P ≤ 0.05; **P ≤ 0.01; and ***P ≤ 0.001). 3Lean muscle weight = 2.2 × (-0.534 + (0.291 × BW, lbs) – (16.498 × 10th rib fat depth, in) + (5.425 × LM area, in2) + (0.833 × gender)), where
1 = barrow and 2 = gilt.

21
Table 7. Probability values1 for main and interactive effects, as well as orthogonal contrasts, of gender and reduced CP on carcass characteristics and
pork quality attributes
Reduced CP (RCP) RCP × gender
RCP Lin Quad Cubic Quart Gender Inter Lin Quad Cubic Quart
HCW, kg 0.691 0.952 0.208 0.476 0.712 0.001 0.903 0.343 0.763 0.936 0.836
Dressing percent 0.659 0.280 0.305 0.713 0.748 0.008 0.464 0.117 0.782 0.722 0.343
10th rib fat depth, mm 0.021 0.001 0.876 0.410 0.937 < 0.001 0.495 0.103 0.891 0.692 0.479
LM depth, mm 0.759 0.381 0.604 0.614 0.432 0.688 0.676 0.530 0.795 0.568 0.222
Fat-free lean yield, % 0.195 0.018 0.972 0.822 0.610 < 0.001 0.424 0.099 0.619 0.490 0.544
Fresh ham wt, kg 0.405 0.556 0.157 0.391 0.331 0.415 0.997 0.991 0.706 0.972 0.979
Ham lean, % 0.030 0.002 0.687 0.500 0.555 < 0.001 0.843 0.824 0.802 0.447 0.403
Semimembranosus, % 0.907 0.558 0.677 0.522 0.802 0.033 0.780 0.671 0.818 0.737 0.239
Biceps femoris, % 0.916 0.942 0.781 0.952 0.361 0.161 0.149 0.016 0.336 0.804 0.975
Semitendinosus, % 0.743 0.530 0.473 0.353 0.713 0.016 0.805 0.290 0.675 0.617 0.914
Quadriceps complex, % 0.446 0.082 0.897 0.455 0.898 0.004 0.804 0.410 0.420 0.953 0.571
Ham fat, % 0.112 0.012 0.956 0.764 0.327 < 0.001 0.920 0.830 0.909 0.618 0.435
Ham bone, % 0.238 0.778 0.545 0.153 0.081 0.113 0.245 0.641 0.925 0.707 0.026
Ham skin, % 0.594 0.980 0.851 0.782 0.105 0.408 0.718 0.312 0.514 0.709 0.487 1Probability values (P > F) for the main effect of reduced CP (RCP), Gender, and interactive effect of RCP × Gender (Inter), as well as for the linear
(Lin), quadratic (Quad), cubic, and quartic (Quart) polynomial contrasts.

22
Table 8. Main effects of gender and reduced CP diet on carcass and fresh ham composition
Gender Reduced CP1
Gilt Barrow SEM C RCP1 RCP2 RCP3 RCP4 SEM Effect2
HCW, kg 92.2b 97.0a 0.99 93.8 94.7 95.3 96.2 93.2 1.56
Dressing percent 72.37b 73.09a 0.187 72.64 72.66 72.50 72.73 73.12 0.253
10th rib fat depth, mm 18.3b 23.1a 0.34 19.7 19.8 20.6 21.6 21.8 0.54 L***
LM depth, mm 63.6 64.1 0.22 64.3 64.5 63.4 64.6 62.3 1.43
Fat-free lean yield, % 53.92a 51.96b 0.217 53.43 53.33 52.81 52.70 52.41 0.343 L*
Fresh ham wt, kg 11.11 11.28 0.146 11.14 11.32 11.21 11.48 10.85 0.231
Ham lean, % 70.69a 68.27b 0.284 70.38 69.94 69.39 69.36 68.33 0.449 L**
Semimembranosus, % 16.53a 15.78b 0.244 16.30 16.38 16.00 15.93 16.16 0.385
Biceps femoris, % 17.92 17.48 0.217 17.81 17.52 17.88 17.53 17.77 0.343
Semitendinosus, % 5.25a 5.01b 0.068 5.10 5.25 5.14 5.09 5.07 0.107
Quadriceps complex,
%
11.95a 11.58b 0.088 11.88 11.91 11.79 11.62 11.64 0.140
Ham fat, % 10.03b 12.80a 0.329 10.56 11.13 11.03 12.18 12.17 0.520 L*
Ham bone, % 11.54 11.10 0.191 11.29 11.26 11.61 10.77 11.67 0.301
Ham skin, % 7.71 7.82 0.087 7.77 7.69 7.94 7.64 7.79 0.138 a – cWithin a row and main effect, least squares means lacking a common superscript letter differ, P < 0.05. 1C = control diet formulated to meet 95% of the SID lysine requirement; RCP1 = reduced CP diet with added L-lysine hydrochloride; RCP2 =
reduced CP diet with added L-lysine, L-threonine, and L-tryptophan; RCP3 = low CP diet with added L-lysine, L-threonine, DL-methionine, L-
tryptophan, L-isoleucine, and L-valine; and RCP4 = lowest CP diet with added L-lysine, L-threonine, DL-methionine, L-tryptophan, L-isoleucine,
and L-valine. 2R = reduced CP main effect; L = linear effect of reduced CP; Qd = quadratic effect of reduced CP; C = cubic effect of reduced CP; and Qt =
quartic effect of reduced CP (*P ≤ 0.05; **P ≤ 0.01; and ***P ≤ 0.001).”
23
Table 9. Probability values1 for main and interactive effects, as well as orthogonal contrasts, of gender and reduced CP on LM quality attributes
Reduced CP (RCP) RCP × gender
RCP Lin Quad Cubic Quart Gender Inter Lin Quad Cubic Quart
Ultimate pH 0.528 0.196 0.690 0.263 0.590 0.006 0.872 0.480 0.394 0.879 0.988
Drip loss, % 0.571 0.191 0.607 0.350 0.892 0.022 0.559 0.768 0.115 0.590 0.796
Moisture, % 0.369 0.073 0.918 0.426 0.519 0.016 0.517 0.498 0.430 0.882 0.150
American color2 0.571 0.111 0.865 0.748 0.703 0.033 0.545 0.235 0.308 0.475 0.934
Japanese color3 0.392 0.066 0.727 0.716 0.570 0.044 0.716 0.340 0.383 0.584 0.823
Lightness (L*)4 0.602 0.245 0.950 0.732 0.274 0.021 0.516 0.262 0.445 0.425 0.405
Redness (a*)4 0.082 0.561 0.177 0.013 0.933 0.534 0.222 0.160 0.125 0.830 0.262
Yellowness (b*)4 0.751 0.687 0.908 0.425 0.290 0.072 0.807 0.855 0.610 0.517 0.354
Firmness5 0.222 0.060 0.198 0.955 0.546 0.931 0.182 0.323 0.045 0.366 0.506
Marbling6 0.102 0.810 0.271 0.021 0.268 0.002 0.508 0.087 0.889 0.840 0.636
Intramuscular fat, % 0.767 0.859 0.286 0.782 0.456 0.002 0.111 0.028 0.165 0.452 0.852
Protein, % 0.743 0.675 0.334 0.408 0.755 0.168 0.221 0.157 0.663 0.136 0.262
Ash, % 0.095 0.211 0.022 0.312 0.955 0.431 0.233 0.159 0.059 0.980 0.700
Cooking loss, % 0.871 0.809 0.410 0.570 0.691 0.059 0.658 0.552 0.775 0.254 0.408
Shear force, kg 0.159 0.338 0.400 0.037 0.476 0.220 0.071 0.164 0.034 0.357 0.200 1Probability values (P > F) for the main effect of reduced CP (RCP), Gender, and interactive effect of RCP × Gender (Inter), as well as for the linear
(Lin), quadratic (Quad), cubic, and quartic (Quart) polynomial contrasts. 21 = pale pinkish gray to 6 = dark purplish red (NPPC, 1999). 31 = pale gray to 6 = dark purple (Nakai et al., 1975). 4L* = measure of darkness to lightness (larger value indicates a lighter color); a* = measure of redness (larger value indicates a redder color); and b* =
measure of yellowness (larger value indicates a more yellow color). 51 = soft to 3 very firm (NPPC, 2000). 61 = 1% i.m. fat to 10% = 10% i.m. fat (NPPC, 1999).

24
Table 10. Main effects of gender and reduced CP diet on LM quality attributes
Gender Reduced CP1
Gilt Barrow SEM C RCP1 RCP2 RCP3 RCP4 SEM Effect2
Ultimate LM pH 5.66b 5.78a 0.031 5.69 5.67 5.73 5.78 5.73 0.048
Drip loss, % 1.95a 0.62b 0.107 1.82 1.97 1.81 1.65 1.65 0.162
Moisture, % 71.36a 70.88b 0.137 70.82 71.05 71.23 71.08 71.43 0.216
American color3 3.4b 3.6a 0.11 3.4 3.4 3.5 3.6 3.6 0.08
Japanese color4 3.5b 3.7a 0.12 3.5 3.6 3.6 3.7 3.7 0.08
Lightness (L*)5 54.43a 52.82b 0.810 54.23 53.66 54.19 52.77 53.27 0.564
Redness (a*)5 7.47 7.60 0.219 7.47 7.23 7.68 8.02 7.28 0.138 C**
Yellowness (b*)5 14.84 14.40 0.264 14.77 14.40 14.84 14.59 14.51 0.167
Firmness6 2.3 2.3 0.07 2.2 2.3 2.4 2.4 2.3 0.05
Marbling7 2.1b 2.4a 0.09 2.3 2.5 2.1 2.1 2.4 0.09 C*
Intramuscular fat, % 5.68b 6.93a 0.278 6.03 6.68 6.32 6.48 6.01 0.432
Protein, % 81.67 81.08 0.437 81.85 81.14 81.03 81.51 81.36 0.569
Ash, % 3.90 4.01 0.105 4.25 4.02 3.75 3.67 4.09 0.166 Qd*
Cooking loss, % 14.63 15.33 0.275 15.32 14.70 14.92 14.93 15.04 0.420
Shear force, kg 3.47 3.32 0.118 3.17 3.52 3.52 3.23 3.51 0.156 C* a,bWithin a row and main effect, least squares means lacking a common superscript letter differ, P < 0.05. 1C = control diet formulated to meet 95% of the SID lysine requirement; RCP1 = reduced CP diet with added L-lysine hydrochloride; RCP2 =
reduced CP diet with added L-lysine, L-threonine, and L-tryptophan; RCP3 = low CP diet with added L-lysine, L-threonine, DL-methionine, L-
tryptophan, L-isoleucine, and L-valine; and RCP4 = lowest CP diet with added L-lysine, L-threonine, DL-methionine, L-tryptophan, L-isoleucine,
and L-valine. 2R = reduced CP main effect; L = linear effect of reduced CP; Qd = quadratic effect of reduced CP; C = cubic effect of reduced CP; and Qt =
quartic effect of reduced CP (*P ≤ 0.05; **P ≤ 0.01; and ***P ≤ 0.001). 31 = pale pinkish gray to 6 = dark purplish red (NPPC, 1999). 41 = pale gray to 6 = dark purple (Nakai et al., 1975). 5L* = measure of darkness to lightness (larger value indicates a lighter color); a* = measure of redness (larger value indicates a redder color);
and b* = measure of yellowness (larger value indicates a more yellow color). 61 = soft to 3 very firm (NPPC, 2000). 71 = 1% i.m. fat to 10% = 10% i.m. fat (NPPC, 1999).

25
Figure 1. Effect of reduced CP diets on BW of growing-finishing pigs: A) during each feeding
phase, and B) during the last 3 wk of the finisher-3 phase when Paylean was included in all diets.
Linear
P = 0.009
Quadratic
P = 0.032
Linear
P = 0.002
Linear
P = 0.005
Quadratic
P < 0.001
0
20
40
60
80
100
120
140
160
Grower-1 Grower-2 Finisher-1 Finisher-2 Finisher-3
BW
, k
g
Feeding phase
Ctrl RCP1 RCP2 RCP3 RCP4A

26
0
20
40
60
80
100
120
140
160
Grower-1 Grower-2 Finisher-1 Finisher-2 Finisher-3
BW
, k
g
Feeding phase
Ctrl RCP1 RCP2 RCP3 RCP4
100
110
120
130
140
150
160
1st wk 2nd wk 3rd wk
BW
, k
g
Finisher-3 phase
Ctrl RCP1 RCP2 RCP3 RCP4B
Quadratic
P < 0.001 Quadratic
P = 0.01 Quadratic
P = 0.01

27
Figure 2. Interactive effects of gender and reduced CP diet on: A) ADG (P = 0.073) and B) G:F
(P = 0.032) during the last (Finisher-3) feeding phase.
1.0
1.1
1.2
1.3
1.4
Gilt Barrow
AD
G,
kg
Ctrl RCP1 RCP2 RCP3 RCP4
0.20
0.25
0.30
0.35
0.40
0.45
0.50
Gilt Barrow
G:F
Ctrl RCP1 RCP2 RCP3 RCP4
Quadratic
P < 0.001 Quadratic gender × reduced CP diet
P = 0.007
A
Quadratic gender × reduced CP diet
P = 0.014
B

28
Figure 3. Interactive effect of gender and reduced CP diet on overall G:F (P = 0.135).
Figure 4. Interactive effect (P = 0.149) of gender and reduced CP diet on knife-dissection yield
of the pillow (biceps femoris) from fresh hams.
0.20
0.25
0.30
0.35
0.40
0.45
0.50
Gilt Barrow
G:F
Ctrl RCP1 RCP2 RCP3 RCP4
10
12
14
16
18
20
22
Gilt Barrow
Bic
eps
fem
ori
s y
ield
, %
Ctrl RCP1 RCP2 RCP3 RCP4
Quadratic gender × reduced CP diet
P = 0.041
Linear gender × reduced CP diet
P = 0.016

29
Figure 5. Interactive effect (P = 0.182) of gender and reduced CP diet on LM firmness scores (1
= soft to 3 = very firm; NPPC, 2000).
1.0
1.5
2.0
2.5
3.0
Gilt Barrow
LM
fir
mn
ess
Ctrl RCP1 RCP2 RCP3 RCP4
Quadratic gender × reduced CP diet
P = 0.045

30
Figure 6. Interactive effect of gender and reduced CP diet on: A) marbling scores (P = 0.508),
and B) intramuscular fat content (P = 0.111) of the LM.
A
B
Linear gender × reduced CP diet
P = 0.028
1.0
1.5
2.0
2.5
3.0
3.5
Gilt Barrow
Marb
lin
g s
core
Ctrl RCP1 RCP2 RCP3 RCP4
3.0
4.0
5.0
6.0
7.0
8.0
9.0
Gilt Barrow
Intr
am
usc
ula
r fa
t, %
Ctrl RCP1 RCP2 RCP3 RCP4
Linear gender × reduced CP diet
P = 0.087

31
Figure 7. Interactive effect (P = 0.071) of gender and reduced CP diet on Warner-Bratzler shear
force (WBSF) of the cooked LM.
1.0
2.0
3.0
4.0
5.0
Gilt Barrow
WB
SF
, k
g
Ctrl RCP1 RCP2 RCP3 RCP4
Quadratic gender × reduced CP diet
P = 0.034