financial stability report -...
TRANSCRIPT

Financial Stability ReportIssue No. 5
Reserve Bank of India June 2012

© Reserve Bank of IndiaAll rights reserved. Reproduction is permitted provided an acknowledgment of the source is made.
This publication can also be accessed through Internet at http://www.rbi.org.in
Feedback on this Report may be given at [email protected]
Published by Financial Stability Unit, Reserve Bank of India, Mumbai 400 001 and designed and printed at Alco Corporation, A2/73, Shah and Nahar Industrial Estate, Lower Parel (W), Mumbai - 400 013

Foreword
This Financial Stability Report (FSR), the 5th in the series, is being released against a backdrop of worrisome global and domestic macroeconomic developments. Sovereign default concerns and the need for substantial bank recapitalisation in the Eurozone have escalated fears of contagion and recession. Even as governments
respond by reducing public expenditure, widespread dissent against austerity and other harsh measures in times of rising unemployment have led to the fall of several incumbents. Globally, decision making in democracies has become hostage to political polarisation. Confi dence in the fi nancial system is low and investors seem to have turned risk averse.
On the domestic front, slowing growth, elevated infl ation and large fi scal and current account defi cits are serious concerns. The already high fi scal defi cit leaves little room for the Government to stimulate the economy. The current account defi cit is being increasingly fi nanced by debt fl ows, threatening long-term sustainability.
On the positive side, the recent decline in petroleum prices, if sustained, can provide some relief. The projected normal monsoon and the inherent resilience of the Indian economy could provide the needed momentum to growth, provided appropriate policy actions are initiated to contain the defi cits and improve the investment climate. Further, despite some negative indicators, particularly on asset quality, the Indian fi nancial sector has remained sound and resilient. Banks continue to be well capitalised with leverage at healthy levels.
Through these half-yearly FSRs, the Reserve Bank hopes to share the results of its macro prudential surveillance with the market, to encourage debate, to create awareness of the vulnerabilities in the system and even to initiate prompt corrective action. As in the case of the previous FSRs, this issue of the Report refl ects the collective assessment of the Sub Committee of the Financial Stability and Development Council (FSDC) on potential risks to fi nancial stability.
The dictum for central bankers used to be akin to how mothers, across cultures and across time, have admonished their children: ‘If you can’t say anything nice, don’t say it at all’. That dictum is no longer valid. Today central banks and regulators have to bear the responsibility of striking the right balance between presenting a candid and accurate picture and not causing unnecessary alarm. Robert Shiller, in an interview published in Central Banking Journal regarding his latest book on ‘Central Banks and their Role in a Good Society’, says “… This gets back to a basic issue about central bank policy that they have a sense that they are criticised whenever they rock the boat; whenever they say something that alarms markets. There might be a bias in central bank thinking towards short run stability when they should be making provocative statements from time to time…”
The endeavour of our FSRs has been to explain the known knowns and indicate the known unknowns. Making people aware of the problem goes a long way in mitigating it. Timing of an alert or a warning is, of course, crucial. As the French novelist, Marguerite Yourcenar, commented “being right too early is being wrong”.
Dr. D. SubbaraoJune 28, 2012


Financial Stability Report June 2012
ContentsPage No.
Foreword
List of Select Abbreviations i-ii
Overview 1
Chapter I : Macroeconomic Risks 6
Chapter II : Financial Markets 15
Chapter III : Financial Institutions: Soundness and Resilience 21
Chapter IV : Financial Sector Regulation and Infrastructure 39
Chapter V : Systemic Risk Assessment 51
Systemic Risk Survey 51
Systemic Liquidity Indicator 53
Network Analysis of the Financial System 54
Banking Stability Measures and Expected Shortfall 58
Macro Stress Testing 60
Annex: Methodologies 64
LIST OF BOXES
2.1 The Greek Dilemma 16
3.1 Power and Airlines : Sectors under Stress 27
3.2 Stress Testing of Derivatives Portfolio of Select Banks 30
3.3 Gold Loan Companies and Associated Risks 31
4.1 Introduction of Dynamic Loan Loss Provisioning Framework for Banks in India 41
4.2 Increased volatility in the foreign exchange market and CCIL’s US$/INR settlement 44
5.1 Network Statistics of the Banking System 56
5.2 Macro Stress Test - Quantile Regression Approach 61
LIST OF CHARTS
1 Financial Stability Map 1
1.1 Macroeconomic Risk Map 6
1.2 Slower Global Recovery in 2012 7
1.3 Gross Financing Needs - AEs 7
1.4 Growth in World Trade Volume 8
1.5 Baltic Dry Index at Low Level 8

1.6 GDP Growth in BRICS Economies 8
1.7 Trends in Quarterly GDP growth (Y-o-Y) 8
1.8 Growth in Drivers of Domestic Demand 9
1.9 Rapid increase in Wholesale Prices of Select Commodities 10
1.10 Relationship between the Twin Defi cits 12
1.11 Trends in Gold Imports 12
1.12 Revenue Expenditure as proportion to Total Expenditure of Centre 13
1.13 Capital Expenditure as proportion to Total Expenditure of Centre 13
1.14 Revenue Defi cit as a proportion of Gross Fiscal Defi cit of Centre 13
1.15 Growth in Retail Credit, NPA and PFCE 14
1.16 Falling Profi t Margins and Rising Interest Costs 14
2.1 Money Market Spreads in 2012 in US Dollars and Euros 15
2.2 Sovereign CDS Spreads in Europe in 2012 16
2.3 Volatilities of Various Asset Classes 16
2.4 Interest Rate Differential between Indian Rates and those of US and Euro 17
2.5 Financial Markets Stability Map 17
2.6 Financial Markets Stability Indicator 17
2.7 Indian Government Bond Yields in 2012 18
2.8 Currencies of EDEs with Current Account Defi cits 19
2.9 Weekly Returns of Nifty and Defty in 2012 19
3.1 Banking Stability Map 21
3.2 Banking Stability Indicator 21
3.3 Claims by Indian Banks on Select Countries – Position as on Dec 2011 22
3.4 Claims on Indian Banks by Select Countries as Ratio of Indian Banking Sector Assets 22
3.5 Growth Rate of Bank Credit to Select Sectors 23
3.6 Credit Growth in Various Sectors - Bank Group Wise 23
3.7 CD/ID ratio and Incremental CD/ID ratio of SCBs 23
3.8 Growth Rate of Select Components of Balance Sheet 24
3.9 Maturity Profi le of Deposits and Advances 24
3.10 CRAR of Bank Groups 24
3.11 Ratio of Net NPAs to Capital of Banks in Select Countries 25
Page No.
Contents

3.12 Trend in Growth Rate of Gross NPAs vis-à-vis Loans & Advances 25
3.13 Slippages as Ratio of Recoveries 25
3.14 Growth of Restructured Accounts vis-à-vis NPAs and Loans 25
3.15 NPA Ratios of SCBs 26
3.16 Growth Rate of NPAs of Select Sectors 26
3.17 Exposure of SCBs to Power Sector 27
3.18 NPA and Restructured Accounts in Power Sector 27
3.19 Bank Credit to Airlines Sector 27
3.20 Top 10 Banks in terms of Credit to Airlines Sector 27
3.21 CRAR in the Eventuality of Write off of Existing Stock of NPAs (net) 28
3.22 Growth Rate of Earnings 28
3.23 Profi tability Ratios 28
3.24 OBS Assets (Notional Principal) as a Ratio of Balance Sheet Assets 28
3.25 Positive and Negative MTM as a Ratio of Capital Funds for Sample of Banks 29
3.26 Net MTM as a Ratio of Capital Funds for Sample of Banks 29
3.27 Credit Growth – NBFCs vis-à-vis Banks 29
3.28 Negative MTM Post-Stress (Scenario) as Ratio of Capital Funds 30
3.29 Negative MTM Post-Stress (Sensitivity) as Ratio of Capital Funds 30
3.30 Change in Net MTM–Scenario Analysis 30
3.31 Change in Net MTM–Sensitivity Analysis 30
3.32 Financial Soundness Indicators of NBFC-ND-SIs 31
3.33 Financial Soundness Indicators of Scheduled UCBs 32
3.34 Growth of Select Balance Sheet Components of RRBs – March 2012 32
3.35 Gross NPA Ratio of RRBs 32
3.36 Credit Risk : Gross Credit- Distribution of Stressed CRAR of Banks 35
3.37 Interest Rate Risk - Banking Book - Distribution of Stressed CRAR of Banks 37
3.38 Bottom-Up Stress Testing: Distribution of Stressed CRAR of Select Banks 37
3.39 Impact of Shocks on Capital Position: SUCBs – Mar 2012 38
3.40 Impact of Liquidity Risk Shocks: SUCBs – Mar 2012 38
4.1 RWA Density across Regions 42
4.2 Contribution to RWAs of SCBs 42
Page No.
Financial Stability Report June 2012

4.3 RWA Density across Bank Groups – Mar 2012 42
4.4 RWA Density of SCBs 42
4.5 Increase in initial margin on two days in the review period during which the exchange rate was most volatile
44
4.6 Settlement Lags in RTGS 45
4.7 Daily average customer transactions settled within one minute 45
4.8 Daily average interbank transactions settled within one minute 45
4.9 Average settlement values of associate members as a per cent of total settlement values 46
4.10 CCIL’s exposures to Designated Settlement Banks 46
4.11 Outstanding notional IRS volumes at the end of the month 47
4.12 Share of insured deposits of different categories of banks 49
4.13 Cross-Country Comparison of Coverage Levels at end-2010 49
4.14 Cross-Country Comparison of Reserve Ratios at end-2010 50
5.1 Specifi c risks identifi ed in the Risk Survey, October 2011 51
5.2 Specifi c risks identifi ed in the Risk Survey, April 2012 51
5.3 Risks most diffi cult for the country to manage 52
5.4 Risks most diffi cult for fi nancial institutions to manage 52
5.5 Survey responses on the probability of ‘high’ impact event in the global fi nancial systemin the short term
52
5.6 Survey responses on the probability of ‘high’ impact event in the global fi nancial systemin the medium term
52
5.7 Survey responses on the probability of ‘high’ impact event in the domestic fi nancial systemin the short term
53
5.8 Survey responses on the probability of ‘high’ impact event in the domestic fi nancial systemin the medium term
53
5.9 The Systemic Liquidity Index 54
5.10 Trends in the interbank market 55
5.11 Percentage change of activities over a one year period in the interbank market 55
5.12 Short Term Funds as a Ratio of Total Borrowing of SCBs (March 31, 2012) 55
5.13 Short Term Funds as a Ratio of Total Outside Liabilities (March 31, 2012) 55
5.14 Network of the Banking System – March 31, 2011 56
5.15 Network of the Banking System – March 31, 2012 56
5.16 Contagion due to the failure of a top net borrower 57
Page No.
Contents

5.17 Potential loss to the banking system due to failure of top banks 57
5.18 Potential loss distribution in the banking system due to failure of banks 57
5.19 Insurance companies’ investments in different bank groups 57
5.20 MFs’ investments in different bank groups 58
5.21 Movement of JPoD and BSI 59
5.22 Movement of Toxicity Index of Banks 59
5.23 Movement of Vulnerability Index of Banks 59
5.24 Systemic Inter-linkages among the Banks: Cascade Effect 60
5.25 Domino Impact of Banks on the Entire System: Cascade Effect 60
5.26 Expected Shortfall to Total Assets: System Level 60
LIST OF TABLES
1.1 External Sector Vulnerability Indicators 11
3.1 Consolidated Foreign Claims of European Banks 22
3.2 Asset Quality of Select Sectors - Mar 2012 26
3.3 Credit Risk: Gross Credit - Impact on Capital and NPAs 35
3.4 Credit Risk: Sectoral – Impact on Capital and NPAs 35
3.5 Credit Risk: Concentration- Impact on Capital and NPAs 36
3.6 Interest Rate Risk: Banking Book-Impact on Banks 36
3.7 Liquidity Risk: Impact on Banks 37
4.1 Details of Imposition of Volatility Margin during 2011-12 44
5.1 Impact of a Global Systemic Event on the Domestic Financial System 53
5.2 Confi dence in the Global and Domestic Financial Systems 53
5.3 Contribution of Insurance companies and MFs to Banks Borrowings 58
5.4 Percentage distribution of insurance companies and MFs in investment/lending in the banking system
58
5.5 Macroeconomic Scenario Assumptions 62
5.6 Projected Gross NPA ratio using Different Models 62
5.7 Projected CRAR using Different Models 62
5.8 Bank-group-wise Projected NPAs 63
5.9 Bank-group-wise Projected CRAR 63
5.10 Projected Sectoral Gross NPA ratio 63
Page No.
Financial Stability Report June 2012


Financial Stability Report June 2012
List of Select Abbreviations
AEs Advanced Economies
AI Alternative Investment
AMCs Asset Management Companies
BCBS-IADI Basel Committee on Banking Supervision – International Association of Deposit Insurers
BIS Bank for International Settlements
BRICS Brazil, Russia, India, China and South Africa
BSE Bombay Stock Exchange
BSI Banking Stability Index
BSMD Banking System’s Portfolio Multivariate Density
BSMs Banking Stability Measures
CAB Current Account Balance
CAD Current Account Defi cit
CBLO Collateralised Borrowing and Lending Obligation
CCIL Clearing Corporation of India Limited
CCP Central Counterparty
CD Certifi cate of Deposit / Credit to Deposit
CDS Credit Default Swap
CET 1 Common Equity Tier 1
CIS Collective Investment Scheme
CP Commercial Paper
CPI Consumer Price Index
CPSS Committee on Payment and Settlement Systems
CRAR Capital to Risk-weighted Assets Ratio
CRR Cash Reserve Ratio
CSO Central Statistical Organisation
DB Defi ned Benefi t
DC Defi ned Contribution
DCCB District Central Co-operative Bank
DICGC Deposit Insurance and Credit Guarantee Corporation
DMA Direct Market Access
DP Dynamic Provisions
DSB Designated Settlement Banks
ECB European Central Bank / External Commercial Borrowing
EDEs Emerging and Developing Economies
EEFC Exchange Earners' Foreign Currency
EPFO Employees’ Provident Fund Organisation
EPS Employees’ Pension Scheme
ES Expected Shortfall
EU European Union
FCNRB Foreign Currency Non Resident Bank
FDI Foreign Direct Investment
FII Foreign Institutional Investor
FMI Financial Market Infrastructure
FSB Financial Stability Board
FSDC Financial Stability and Development Council
FSR Financial Stability Report
GDP Gross Domestic Product
GFD Gross Fiscal Defi cit
GFSR Global Financial Stability Report
HFT High Frequency Trading
IAIS International Association of Insurance Supervisors
IASB International Accounting Standards Board
ID Investment to Deposit
IFRS International Financial Reporting Standard
IIP Index of Industrial Production
IMF International Monetary Fund
IOSCO International Organisation of Securities Commissions
IRDA Insurance Regulatory and Development Authority
i

List of Select Abbreviations
IRS Interest Rate Swap
JPoD Joint Probability of Distress
KYC Know Your Customer
LAF Liquidity Adjustment Facility
LaR Liquidity at Risk
LGD Loss Given Default
LIBOR London Inter-bank Offered Rate
LTRO Longer-Term Refi nancing Operation
LTV Loan To Value
MF Mutual Fund
MOVE Merrill Lynch Option Volatility Estimate
MSCI Morgan Stanley Capital International
MSF Marginal Standing Facility
MTM Mark-to-Market
NBFC-ND-SI Non-Banking Financial Company-Non Deposit taking-Systemically Important
NBFCs Non-Banking Financial Companies
NCDs Non-convertible Debentures
NDTL Net Demand and Time Liabilities
NEFT National Electronic Fund Transfer
NIIP Net International Investment Position
NIM Net Interest Margin
NPA Non-Performing Asset
NPS National Pension System
NRE Non Resident External
NRI Non Resident Indian
NRO Non Resident Ordinary
NSE National Stock Exchange
OBS Off-Balance Sheet
OIS Overnight Indexed Swap
OMO Open Market Operation
OTC Over The Counter
PFCE Private Final Consumption Expenditure
PFRDA Pension Fund Regulatory and Development Authority
PoD Probability of Distress
PSBs Public Sector Banks
PSS Payment and Settlement Systems
RBI Reserve Bank of India
RD Revenue Defi cit
REER Real Effective Exchange Rate
RoA Return on Assets
RoE Return on Equity
RRB Regional Rural Bank
RTGS Real Time Gross Settlement
RWA Risk-Weighted Asset
S&P Standard and Poor’s
SCBs Scheduled Commercial Banks
SEBI Securities and Exchange Board of India
SEBs State Electricity Boards
SIFI Systemically Important Financial Institution
SLI Systemic Liquidity Index
SLR Statutory Liquidity Ratio
SP Specifi c Provision
StCB State Co-operative Bank
SUCB Scheduled Urban Co-operative Bank
TI Toxicity Index
UCB Urban Co-operative Bank
VaR Value at Risk
VAR Vector Autoregression
VI Vulnerability Index
VIX US Chicago Board of Options Exchange’s Volatility Index
WEO World Economic Outlook
WPI Wholesale Price Index
Y-o-Y Year-on-Year
ii

Financial Stability Report June 2012
1
Overview
The financial system of the country remains robust, though risks to stability have increased since the publication of the last Financial Stability Report (FSR) in December 2011. The combined effect of the dismal global macroeconomic situation and the muted economic performance on the domestic front has caused marginal increase in risks to stability. The financial sector stakeholders, however, continued to repose confidence in the stability of the domestic financial system, as revealed by the findings of Reserve Bank’s second Systemic Risk Survey, though there has been some reduction in the level of confidence. Threats to stability are posed by the global sovereign debt problem and risk aversion, domestic fiscal position, widening current account deficit and structural aspects of food inflation. Falling international crude oil prices and a normal monsoon could, however, be positives for the domestic economy, going forward. The foreign exchange and equity markets witnessed high levels of volatility while investor confidence and sentiments ran low. Indian banks’ soundness indicators remained robust, although the pressures on asset quality persisted. Given a decelerating deposit growth, banks’ reliance on borrowed funds, especially short term funds increased. The country’s financial market infrastructure functioned without disruption. But, potential vulnerabilities such as settlement lags in the Real Time Gross Settlement (RTGS) System and large uncollateralised intra-day exposures assumed by the Clearing Corporation of India Limited (CCIL) on its designated settlement banks need to be addressed. The results of a series of stress tests to study the impact of adverse macro-financial shocks showed that the banking system remained resilient even under extreme stress scenarios.
The financial system remains robust though risks to financial stability have worsened
1. Risks to financial stability have worsened since December 2011, primarily due to global risks and domestic macroeconomic conditions. Risks to domestic growth are accentuated by fiscal and external sector imbalances. Financial markets, particularly the foreign exchange market, continue to correct downwards and experience heightened volatility. The recent decline in international crude oil prices, if sustained, could provide relief. A normal monsoon could also alleviate pressures on the growth front and provide impetus towards reviving the domestic economy, given its inherent strength. Banks are well capitalised, though trends in asset quality and their ability to withstand sustained liquidity pressures pose some concerns. The overall stability of the system remained robust as indicated by the trends in the Financial Stability Map (Chart 1)1.
1 The composite financial stability map, which attempts to capture the movements in the risks on the three major dimensions of the Indian financial system – macroeconomy, financial markets and banking sector. Detailed methodology is in the Annex.2 Position of the Financial Markets Stability Indicator is as in May 2012
Chart 1: Financial Stability Map
Note: Risks increase with the distance from the centre2
Source: RBI staff calculations

Overview
2
Survey respondents express concerns about global risks and twin deficits; remain confident about stability
2. The respondents of Reserve Bank’s second Systemic Risk Survey, conducted in April 2012, expressed their concern about the evolving global risks as well as a host of domestic factors including the current account defi cit, fi scal defi cit, asset quality of banks and potential funding risks. However, the participants remained relatively sanguine about the stability of the domestic financial system, despite some fall in the level of confi dence since the previous Survey, conducted in October 2011.
Global environment
Global macroeconomic risks have deteriorated
3. Deepening crisis in the Euro area and continued global slowdown contributed significantly to the deterioration in global risks. The downside risks to the global macroeconomic environment are expected to intensify further in the coming months, owing to the political uncertainty in the Euro area, the persistence of global imbalances, fi scal stress and sluggish growth prospects. Debt and gross fi nancing needs continue to be high in several Advanced Economies (AEs), even as sovereign yields are rising for some Euro area countries.
The contagion from Euro area spreads to other advanced and emerging economies
4. There are signs of spillover of the developments in the Eurozone to other AEs and emerging and developing economies (EDEs) through the trade, fi nance and confidence channels. Weakening demand for exports, decreasing trade fi nance owing to deleveraging by banks in Europe and possible impact on the capital fl ows to emerging economies are threatening a sustained global recovery. The persistently high unemployment rates in several AEs and moderating internal demand in some of the emerging economies are adding to the problem.
Global fi nancial markets under stress
5. The global fi nancial markets remained under stress and experienced high volatility during the period under review. There was a brief period of improvement
in sentiments following the two rounds of Long Term Refi nancing Operations by the European Central Bank. Reduced institutional appetite for the sovereign bonds of the troubled Eurozone economies has translated into funding pressures for European banks. With worsening access to unsecured funds, these banks remain vulnerable to funding market freezes and dependent on central bank support.
Extended run of accommodative monetary policies in AEs could create vulnerabilities
6. The existing regime of very low policy rates in US and other AEs is generally expected to continue for some more time. This has further reduced the cost of debt capital relative to equity. Going forward, this could result in greater use of leverage and lead to a ‘search-for-yield’ behaviour among investors.
Macroeconomic environment
The domestic economy has decelerated sharply
7. Domestic GDP growth declined sharply to 6.5 per cent during 2011-12 from 8.4 per cent in the previous year, weighed by global uncertainties as well as domestic cyclical and structural factors. The trend refl ected the experience of similar EDEs, especially the BRICS countries. The deceleration in GDP growth was refl ected across all the three segments of the economy – agriculture, services and industries. The downside risks to growth may persist given the headwinds from the global economy and moderation in private and government consumption and investment demand.
Inflationary pressures have moderated but risks remain
8. Core infl ation has moderated during the period under review. Nevertheless, the persistence of overall infl ation, in the face of signifi cant growth slowdown, points to serious supply bottlenecks and sticky infl ation expectations. While falling global commodity prices could aid in checking infl ationary trends in the coming months, the potential impact of the lagged pass-through of rupee depreciation, suppressed infl ation in energy and fertilisers and possible fi scal slippage continue to pose a threat.

Financial Stability Report June 2012
3
External sector risks aggravated; recent trends in oil prices provide comfort
9. The external sector vulnerability indicators point to increased risks. The current account deficit has deteriorated with decelerating growth in exports even as imports remained high on the back of sustained demand for gold and crude oil. The net international investment position of the country worsened with rising short term debt relative to total external debt. Falling international oil prices, if sustained, will help moderate external sector risks. But, domestic factors viz., a fast depreciating exchange rate, reduced capital infl ows and the risk of downgrade of the sovereign rating of the country, continue to pose challenges for the fi nancing of the defi cit.
Trends in the composition of fiscal deficit pose concerns
10. Fiscal risks remain elevated, given that both fi scal and primary defi cits have increased during 2011-12. Recent trends in terms of an elevated ratio of revenue defi cit to gross fi scal defi cit and the increasing proportion of revenue expenditure relative to capital outlays are also disquieting. Gross fi nancing needs of the Government remain high with consequent impact on private investment and growth.
Plans for fi scal consolidation afoot; risks of slippages remain
11. The Union Budget for 2012-13 set out a roadmap for fi scal consolidation during the 12th Five Year Plan period. The proposed fi scal consolidation for 2012-13 is primarily based on the revenue-raising efforts of the Government. The achievement of proposed reduction in the ratio of gross fi scal defi cit to GDP would also depend on the commitment of the Government to contain its expenditure on subsidies within the stipulated cap of 2 per cent of GDP in 2012-13.
Financial Markets
India’s foreign exchange market corrected and remained volatile
12. The turmoil in the Euro area, a widening current account defi cit and perceptions of slowdown in policy-making in India affected the domestic foreign exchange market during the review period, resulting in a rapid
depreciation of the Indian rupee. These trends were, however, broadly in line with the wider trend evidenced in case of currencies of EDEs, especially those with high current account defi cits. A combination of administrative measures and foreign exchange market intervention were taken to address the stress.
Potential rating change could impact overseas borrowing
13. The process of deleveraging underway amongst European banks has had some impact on the cost of borrowing of Indian fi rms and banks. A change in the current external rating of the country could have ‘cliff effects’, impacting both, the availability and the cost of foreign currency borrowing for Indian banks and fi rms.
The domestic equity markets reflecting weak sentiments
14. The domestic equity markets appreciated in the fi rst two months of the calendar year. Thereafter, the markets retraced to their December 2011 levels as Foreign Institutional Investment (FIIs) fl ows reversed in the wake of worsening global outlook, weak domestic sentiments and the sharp depreciation of the Indian rupee.
Implications of increasing use of Algorithmic and High Frequency Trading need to be watched
15. Some recent episodes in Indian markets have highlighted the need for a carefully calibrated approach towards technological advancements like direct market access supporting algorithmic and high frequency trading. Globally, too, the balance between the benefi ts of such advancements vis-à-vis the risks posed by them is a subject of debate.
Financial Institutions
Banks’ reliance on borrowed funds growing
16. Credit growth in the banking sector decelerated to around 16.3 per cent in 2011-12, as compared with about 22.6 per cent as at end March 2011, refl ecting the overall slowdown in the economy. Deposit growth also decelerated and, at less than 14 per cent as at end March 2012, was the lowest growth rate recorded in the past 10 years. The disproportionate slowdown in deposit growth vis-à-vis credit growth led to increased reliance of banks on borrowed funds, which may translate into

Overview
4
liquidity risks.
Asset quality concerns persisted; comfortable capital position act as cushion
17. An increase in slippage ratios, rise in the quantum of restructured assets and a high rate of growth in Non Performing Assets (NPAs) relative to credit growth implied that the concerns on asset quality of banks remain elevated. The Gross NPA ratio for scheduled commercial banks (SCBs) increased to 2.9 per cent as at end March 2012 (2.4 per cent at end March 2011). The position is not alarming at the current juncture and some comfort is also provided by the strong capital adequacy position of banks.
Growing interconnectedness warrants closer monitoring of the ‘most connected’ banks
18. Distress dependencies between banks have been on the rise, as evidenced by the trends in the Banking Stability Measures. The analysis of the network of the Indian banking system reveals that the maximum potential loss to the banking system due to the failure of the ‘most connected’ bank has risen during 2011. These trends would need to be carefully monitored, through rigorous microprudential supervision of the ‘more connected’ banks.
Regulatory measures aim to mitigate risks from the rapid growth of gold NBFCs
19. The rapid growth of NBFCs engaged in lending against gold in recent years could pose risks due to the business model of such companies, concentration of business amongst a few companies and their growing interconnectedness with the banking system. These risks are sought to be addressed through various regulatory prescriptions.
Interconnectivities in the Indian fi nancial system could pose risks
20. Insurance companies and mutual funds are the major lenders in the Indian fi nancial system with banks, especially public sector banks, being the major borrowers. The insurance companies and mutual funds are, therefore, vulnerable to the risk of contagion from the banking system. Banks, on the other hand, are considerably reliant on borrowings from these entities. As borrowings from mutual funds are largely short term,
they could engender greater liquidity risks for the banking system.
A macro mapping of the non-banking fi nancial segment may be warranted
21. Strengthening the regulatory framework for banks globally adds to risks of migration of fi nancial sector activity to the relatively less regulated ‘shadow banking’ sector. In the Indian context, the non banking financial sector in the country functions within a regulatory framework appropriate to the activities undertaken by these entities. Nevertheless, a review of the extant regulatory arrangements and a complete macro mapping of all kinds of credit intermediation activities, with regulatory focus on more systemically important activities and entities, may be warranted in the light of the international reforms.
Financial institutions remain largely resilient to credit, market and liquidity risks
22. Credit risks continued to remain the primary source of vulnerability for banks, while risks from adverse movements in interest rate appeared manageable, as evidenced by the results of a series of sensitivity stress tests. The banking system, as a whole, is, however, well positioned to absorb even severe credit risks stresses. Statutory Liquidity Ratio (SLR) investments lend resilience to banks in managing their liquidity risks. A sample of banks reported a positive net marked to market (MTM) position on the derivatives portfolio, indicating that they are in a position to absorb adverse market movements in case of simulated historical stress scenarios and random sensitivity shocks.
23. NBFCs are also well positioned to withstand credit risk shocks given their comfortable capital adequacy positions. Stress tests conducted for Urban Cooperative Banks point to some vulnerability to both credit and liquidity risks.
Regulatory Infrastructure
Unintended consequences of key reform measures will need to be managed
24. Gaps and challenges in implementation of the post crisis reforms are emerging, especially with respect to the resolution framework for systemically important fi nancial institutions and reforms in the OTC derivative markets. There could be unintended consequences of

Financial Stability Report June 2012
5
these reforms, particularly for EDEs. Differences in the calibration of reform measures in different jurisdictions may leave scope for regulatory arbitrage.
Domestic Basel III guidelines aim at a smooth transition
25. In line with the present regulatory requirements, the fi nal guidelines for Basel III also require banks in India to maintain a capital ratio at 9 per cent of risk weighted assets (RWAs), which is higher than the 8 per cent prescribed by the Basel Committee. The timelines suggested by the Basel Committee have been retained to enable a smooth transition. Going forward, challenges will be faced as the additional capital needs could impact the cost of capital and return on equity of banks, especially in the short run. The fi scal impact of the increased capital requirements of public sector banks has also to be reckoned with.
26. A more stringent leverage ratio has been prescribed for the period of the parallel run considering that the leverage ratio of banks in India is currently well above the minimum ratio of 3 per cent prescribed by the Basel Committee.
Variations in RWAs will need to be monitored as banks migrate to advanced approaches under Basel II
27. Signifi cant differences in the RWA density (RWAs to Total Assets) have been observed across jurisdictions and also across banks in the same jurisdiction. These are generally driven by differences in the risk profi le of banks, their business mix and also the stage of regulatory evolution in the jurisdiction. There may, however, be
practice-based inconsistencies in the calibration of risk parameters. Migration to advanced approaches under Basel II may create further scope for the emergence of interpretational differences. Variations in RWA density across bank segments have been evidenced in the Indian context as well, and the underlying trends will need to be studied.
Financial Market Infrastructure
Real time gross settlement reduces risks … but settlement lags need monitoring
28. Delays in settlement of transactions in the RTGS system, notwithstanding proactive intraday liquidity management by banks, the provision of intraday liquidity by the central bank and the availability of prudential reserve balances, could pose risks. The underlying trends of variations in settlement lags across different banks will also need to be monitored.
Newly issued standards and the risks posed by settlement banks warrant a review of CCIL’s risk management framework
29. The newly issued international ‘Principles for Financial Market Infrastructure’ proposing stringent risk management requirements necessitate a relook at the risk management practices of domestic central counterparties such as CCIL. Risks are also posed by the designated settlement banks of CCIL which act as ‘quasi’ payment systems and require CCIL to assume signifi cant uncollateralised intraday exposures to these entities. The trends in this regard need to be assessed vis-à-vis CCIL’s fi nancial resources and its liquidity and credit risk management framework.

Chapter I Macroeconomic Risks
6
Chapter I
Macroeconomic Risks
Global and domestic outlook has worsened since the time of publication of the previous FSR. The Euro area sovereign debt problem is continuing to weigh on global recovery. Although slowing global growth has dampened commodity prices, heightened risk aversion and the resultant slowing of capital fl ows are likely to adversely impact emerging and developing economies (EDEs). On the domestic front, while growth has clearly decelerated, infl ation risks remain. Notwithstanding the moderation in core infl ation, the persistence of overall infl ation, in the face of signifi cant growth slowdown, points to serious supply bottlenecks and sticky infl ation expectations. The increase in current account defi cit (CAD), despite the slowdown in growth, is symptomatic of demand-supply imbalances and a pointer to the need to resolve the supply bottlenecks. A widening CAD in the face of worsening global economic and fi nancial conditions and muted capital fl ows has exerted downward pressure on the rupee. Prospects for increasing capital infl ows depend on both global conditions, particularly a credible resolution of the Euro area situation, and an improvement in the domestic investment climate. Thus, key risks to domestic macroeconomic environment seem to arise from global sovereign debt problem and risk aversion, domestic fi scal position, widening CAD and structural aspects of food infl ation.
Macroeconomic risks to fi nancial stability higher since previous assessment
1.1 The uncertain global situation, rising risk aversion and slowing capital infl ows, largely resulting from the Euro area sovereign debt problem are impacting the EDEs. They pose challenges to India’s growth and balance of payments outlook. Domestically, the widening CAD, lower levels of capital fl ows and increasing share of short-term debt in total debt heighten external sector risks. Fiscal slippages and slackening in growth in the recent quarters have enhanced the vulnerability to shocks. Risks from the corporate sector balance sheets have remained elevated due to relatively unfavourable domestic and external macroeconomic environment, e.g. subdued domestic consumption and investment demand, rising costs of inputs, deceleration in exports and risks from unhedged foreign currency. Risks in the household sector, however, have moderated(Chart 1.1).
The Global Economy
Sluggishness in global recovery becomes more widespread…
1.2 The global economy remained on a slow recovery path during the period under review. Growth in the advanced economies (AEs) remained sluggish in
Chart 1.1 : Macroeconomic Risk Map
Note: Risks increase with distance from the centreSource: RBI staff calculations

Financial Stability Report June 2012
7
last quarter of 2011 and fi rst quarter of 2012. IMF as well as the European Commission have indicated that the Euro area will undergo a mild recession in 2012. EDEs are also expected to slow down (Chart 1.2).
… with downside risks persisting
1.3 The slowdown in the Euro Area is spreading through trade, fi nance and confi dence channels to other AEs and to EDEs. In the short run, fi scal consolidation measures, especially in the Eurozone, could impact demand and growth adversely. The recent string of rating downgrades of Euro area sovereigns and banks could raise borrowing costs. Growth, both in the Eurozone and in other parts of the world, is also likely to be affected by deleveraging by EU-based banks1. EDEs, in particular, remain vulnerable to the spillovers of the accommodative monetary policies in AEs, especially in the Eurozone (Chapter II).
Global fi scal risks have intensifi ed
1.4 Recent developments in the Eurozone, have led to an intensifi cation of fi scal risks globally. Debt and gross fi nancing needs continue to be high in several AEs, even as sovereign yields are rising (Chart 1.3). There are concerns that the recession in the Eurozone may be used by countries to scale back or defer fi scal consolidation measures, especially in the current political climate. Relevant in this context is the observation by IMF in its Fiscal Monitor, April 2012, “. … Should growth slow further, countries with fi scal space should allow the automatic stabilizers to operate freely and allow the defi cit to rise to avoid excess fi scal contraction, which could worsen economic conditions. But short-term caution should not be an excuse to slow or delay efforts to put public fi nances on a sounder footing over the medium term…”
Elevated unemployment in the U.S. and rising unemployment in the Eurozone could add to risks
1.5 Unemployment in AEs remains high and could act as a drag on recovery and fi scal consolidation. The unemployment rate in the US increased to 8.2 per cent in May 2012 from 8.1 per cent in April, the fi rst increase in 11 months. Unemployment in the Euro area rose to
Chart 1.2: Slower Global Recovery in 2012(Growth in GDP)
P: ProjectedSource: IMF WEO, April 2012
1 As per the Global Financial Stability Report (GFSR), April 2012, deleveraging by European banks could result in reduction of combined balance sheet of large banks by as much as $2.6 trillion (€2.0 trillion) through end-2013 i.e. by almost 7 per cent of total assets. The GFSR observes that one-fourth of this deleveraging may be effected through a reduction in lending.
Chart: 1.3: Gross Financing Needs - AEs
Note: Projected fi guresSource: IMF Fiscal Monitor, April 2012

Chapter I Macroeconomic Risks
8
11 per cent in April 2012 - the highest rate on record. The unemployment rate is particularly acute in Spain (at nearly 24.3 per cent) and in the periphery Eurozone.
Trends in global growth are mirrored in global trade volumes….
1.6 The slowdown in global growth is refl ected in sluggish trends in the volume of international trade (Charts 1.4 and 1.5). These trends are unlikely to reverse in short run given the uncertainties about the outlook for global growth.
The Domestic Economy
Domestic growth decelerated on the back of global and domestic factors
1.7 Domestic GDP growth declined sharply to 6.5 per cent during 2011-12 from 8.4 per cent in the previous year, weighed by global uncertainties as well as domestic cyclical and structural factors. The trend refl ected the experience of several EDEs, especially the BRICS countries (Chart 1.6).
1.8 Importantly, the quarterly growth rates have been showing a declining trend for the preceding four quarters with the fourth quarter GDP growth rate slowing to 5.3 per cent – the lowest quarterly growth rate in last 7 years (Charts 1.7).
1.9 The slowdown in real GDP was refl ected in all the major sectors. Growth rate in agriculture at 2.8 per cent is due to the base effect (agriculture rate growth
Chart 1.4: Growth in World Trade Volume(goods and services)
P: ProjectedSource: IMF WEO, April 2012
Chart 1.5: Baltic Dry Index at Low Level
Source: Bloomberg
Chart 1.6: GDP Growth in BRICS Economies
* Estimated data for South AfricaSource: IMF WEO, April 2012
Chart 1.7 Trends in Quarterly GDP Growth (Y-o-Y)
Source: CSO

Financial Stability Report June 2012
9
during 2010-11 stood at 7.0 per cent as against a trend growth of around 3.0 per cent). Slowdown in industrial activity is on account of weak demand for consumer durables, interest rate sensitivity, deceleration in external demand and subdued investment demand as well as a decline in business confi dence amidst the prevailing interest rate environment. Manufacturing slowed down from 7.6 per cent in 2010-11 to 2.5 per cent in 2011-12. During the same period, growth rate in the services sector moderated from 9.2 per cent to 8.5 per cent and the moderation was observed in several segments of the sector.
Subdued corporate investments and declining net exports dragged down aggregate demand…
1.10 All the major drivers of domestic demand, recorded sharp deceleration during FY12 (Chart 1.8). The sharp moderation in real GDP at market prices from 9.6 per cent in 2010-11 to 6.9 per cent in 2011-12 was refl ected in all components of aggregate demand – consumption (private and government), investment and net exports. Weakness in investment, in particular, has implications for the near and medium-term growth outlook.
..while declining savings and investment rates added to concerns
1.11 Both investment and saving rates declined in 2010-11. Gross domestic savings rate declined from 33.8 per cent in 2009-10 to 32.3 per cent in 2010-11 while gross capital formation rate declined from 36.6 per cent to 35.1 per cent. Corporate pipeline investment has shrunk and new investment remains subdued, affected by the domestic and global growth outlook, higher interest rates and rising input prices. Given these trends, the outlook for domestic growth is unlikely to improve in the short term.
1.12 Headwinds from the global economy will continue to impact domestic growth in the coming quarters. Going forward into 2012-13, downside risks to growth are likely to persist, especially if the monsoons are signifi cantly below long period average. The index of industrial production increased by just 0.1 per cent in April 2012. Though the manufacturing Purchasing Managers’ Index (PMI) for May 2012 suggested that industrial activity remains in expansionary mode,
Chart 1.8: Growth in Drivers of Domestic Demand
Source: CSO

Chapter I Macroeconomic Risks
10
the pace of expansion seems to have slowed down signifi cantly. Demand conditions may also improve, though constraints might be faced due to low pipeline investments.
Infl ationary pressures moderate but risks remain
1.13 Headline Wholesale Price Index (WPI) infl ation has declined largely on account of transitory factors including a favourable base effect and seasonal decline in vegetable prices. The headline WPI infl ation, which was above 9 per cent during April-November 2011, moderated to 6.9 per cent by end-March 2012, consistent with the Reserve Bank’s indicative projection of 7 per cent. The moderation was initially driven by softening of food prices and then by a decline in non-food manufactured products (core) infl ation, which fell below 5 per cent for the fi rst time in two years. However, headline infl ation thereafter, inched up to 7.6 per cent in May 2012 driven mainly by food and fuel prices (Chart 1.9). Notably, the consumer price index (CPI) infl ation (as measured by the new series, base year: 2010) increased sharply from 7.7 per cent in January, 2012 to 10.4 per cent in April, 2012.
1.14 Notwithstanding the recent moderation in global crude oil prices and domestic price pressures in manufactured products, upside risks to infl ation remain. The likely trends in global crude oil prices, going ahead, remain uncertain. Moreover, the impact of the lagged pass-through of rupee depreciation, suppressed infl ation in energy and fertilisers and possible fi scal slippage continue to pose a signifi cant threat. While moderation in global commodity prices could aid in checking infl ationary trends in the coming months, this could at least partially be offset by the depreciation of the rupee. Infl ation risks are likely to remain high, given the persistence of overall infl ation, even in the face of signifi cant growth slowdown which points to serious supply bottlenecks and sticky infl ation expectations.
External sector risks intensifi ed as the external sector vulnerability indicators deteriorated
1.15 The external sector position weakened in the period under review, driven by a worsening CAD, rising external debt and weakening Net International Investment Position (NIIP).
Chart 1.9: Rapid Increase in Wholesale Prices of Select Commodities
Note: Base 2004-05=100Source: Government of India

Financial Stability Report June 2012
11
1.16 All the key external sector vulnerability indicators - the reserve cover of imports, the ratio of short-term debt to total external debt, the ratio of foreign exchange reserves to total debt, the debt service ratio and NIIP-GDP ratio - deteriorated (Table 1.1).
Prevailing global uncertainties accentuate risks tothe CAD...
1.17 The trade defi cit increased primarily because of the slowdown in global demand and the inelastic nature of oil imports. Pressures on the defi cit were further aggravated by the fact that the non-oil imports remained high.
1.18 Given the uncertain global environment, the CAD is likely to remain elevated in the near term. Though export demand had benefi tted in recent periods due to diversifi cation of export markets to EDEs, export growth is likely to remain sluggish in the coming quarters as slowdown in AEs is increasingly affecting growth in EDEs. The widening CAD, notwithstanding slowdown in growth and depreciation of the currency, refl ects the demand-supply imbalances and is a pointer to the urgent need to resolve the supply bottlenecks. Softening of global oil prices and the recent moderation in imports of gold may alleviate the pressures on the external defi cit. The CAD is also susceptible to deceleration in receipts due to moderation of software exports, business services and investment income.
… leading to increased risks in fi nancing the external defi cit
1.19 Risks to fi nancing the CAD have intensifi ed in recent months. Global developments such as deleveraging by European banks have affected capital fl ows, especially to emerging markets like India (Chapter II). The moderation in capital infl ows has necessitated fi nancing of the CAD by drawing down foreign exchange reserves in recent quarters. This has weakened the external sector resilience of the economy as discussed earlier.
1.20 Future capital infl ows will depend on conditions in the global economy as well as the evolving domestic macroeconomic environment, including the pace of domestic policy reforms. Domestic factors including slowdown, potential downgrade by rating agencies and a depreciating exchange rate may affect capital
Table 1.1: External Sector Vulnerability Indicators
End-June 2011
End-Sept 2011
End-Dec 2011
Reserve cover of imports (in months) 9.2 8.5 7.7
Short-term debt to total external debt (%) 21.6 22.1 23.3
Foreign exchange reserves to total external debt (%)
99.6 96.2 88.6
Debt service ratio (%) 4.8 5.2 7.9
Net International Investment Position to GDP (annualised) ratio (%)
-12.4 -11.4 -12.0
Source: RBI
infl ows. All of these are likely to pose challenges for the fi nancing of the CAD.
Recent measures to encourage capital infl ows may alleviate these risks
1.21 A host of administrative measures have been taken of late to improve infl ows of external commercial borrowings (ECBs) and NRI deposits. The increase in the all-in-cost ceiling, and other relaxations in ECB guidelines could facilitate overseas borrowings by corporates. Also, greater fl exibility has been given to banks in mobilising non-resident deposits by deregulating interest rates on NRE and NRO accounts in November 2011 and raising the ceiling on interest rates on FCNRB in May 2012. Exporters have been asked to convert half the foreign currency balances in the EEFC accounts to the domestic currency. FII investment in non-convertible debentures / bonds issued by Indian companies in the infrastructure sector was enhanced to USD 25 billion and limit for investment in Government securities was raised to USD 20 billion. Such measures are expected to provide a reprieve to the pressures on the external sector.
Fiscal consolidation could aid the moderation of external risks...
1.22 If budget defi cit is expanding and private sector savings and investment balance remains unchanged, high fi scal defi cit can be fi nanced only by expanding CAD. In the Indian context, the most visible link between the fi scal defi cit and CAD is provided by oil prices. As prices for a number of petroleum products remain administered in the domestic market and are not signifi cantly aligned to movement in international prices, a rise in international prices does not lead to demand adjustment in the domestic economy but rather results in a high import bill and higher CAD. On

Chapter I Macroeconomic Risks
12
the other hand, underpricing of petroleum products with no moderation in domestic demand leads to rise in petroleum subsidies and hence expansion of fi scal defi cit (Chart 1.10).
…As will waning gold imports
1.23 As discussed, imports have remained high given elevated global oil prices and sustained domestic demand for gold. India has traditionally been one of the largest consumers of gold in the world. This could potentially pose risks as domestic production of gold is negligible and the demand has to be met almost entirely through imports. In 2011- 2012, India imported US$ 45 billion worth of gold, an increase of 3 per cent year-on-year (despite a fall of 17 per cent in physical imports from 1034 tonnes to 854 tonnes). Gold imports constitute as much as 10 per cent of total imports. The import of gold is canalised and banks, MMTC Ltd., State Trading Corporations, etc. are authorised to import gold. Adverse movements in gold prices can also result in losses on loans portfolios of commercial banks and NBFCs (Chapter III). Recent administrative measures have, inter alia, led to some reduction in gold imports (Chart 1.11).
1.24 Demand for gold is high in India on account of socio-cultural factors and its use in the informal economy. According to a World Gold Council study, as much as 23 per cent of all gold imported is for investment purpose in India. Even its use in jewellery at 75 per cent has an investment element for households. Banks’ import of gold coins for retail sale to households has been a matter of concern. It has risen from just one per cent of total imports by banks in 2009-10 to 3.8 per cent in 2011-12. Diversion of household savings into gold has implications for the availability of funds of the fi nancial sector and thereby for growth. The high returns on gold in the recent past could underpin demand, thus putting pressure on the CAD on an ongoing basis.
Fiscal risks on the rise….
1.25 Fiscal risks have risen in the period under review with both fi scal and primary defi cits rising during 2011-12. The increased market borrowings by the government could crowd out private investment with implications for growth, besides posing
Chart 1.10: Relationship between the Twin Defi cits
Source: RBI
Chart 1.11: Trends in Gold Imports
Source: DGCIS, Bloomberg

Financial Stability Report June 2012
13
challenges for monetary management. The proposed fi scal consolidation in 2012-13 is primarily based on the revenue-raising efforts of the central government. The achievement of budgeted reduction in GFD-GDP ratio would also depend on the commitment of the government to contain its expenditure on subsidies within the stipulated cap of 2 per cent of GDP in2012-13.
…Trends in the components of the fi scal defi cit present some concerns
1.26 Trends in the various components of fi scal defi cit of Centre throw up some disquieting features in terms of the elevated share of revenue expenditure in total expenditure and declining share of capital expenditure in total expenditure of Centre (Charts 1.12 and 1.13). There are concerns that the persistently high subsidy burden is crowding out public investment, especially at the current juncture when private investment is slowing down. There is another concern that the gross fi scal defi cit of Centre continues to be predominantly structural rather than cyclical.
1.27 The ratio of revenue defi cit (RD) to gross fi scal defi cit (GFD), which indicates the proportion of borrowings being used to fi nance current consumption, has increased signifi cantly since 2008-09, thereby reducing the availability of resources for capital investment. In recognition of this concern, the RD to GFD ratio of Centre is budgeted lower at 68.7 per cent for 2012-13, as against the ratio of 75.7 per cent for 2011-12 (RE) (Chart 1.14).
Risks may be addressed by recent attempts at fi scal consolidation…...but will hinge on robust tax buoyancy and on capping of subsidies
1.28 The Union Budget 2012-13 sets out a roadmap for fi scal consolidation by budgeting a signifi cant reduction in the ratio of gross fi scal defi cit to GDP, beginning from 2012-13, thereby setting the stage for attaining a ‘faster, sustainable and more inclusive growth’ during the 12th Five Year Plan period.
1.29 The fi scal correction for the ensuing year is primarily revenue-driven through widening of base of the services tax, stipulating a negative list of exempted categories in respect of services tax, rationalization of
Chart 1.12: Revenue Expenditure as Proportion toTotal Expenditure of Centre
Source: Government of India
Chart 1.13: Capital Expenditure as Proportion toTotal Expenditure of Centre
Source: Government of India
Chart 1.14: Revenue Defi cit as a Proportion ofGross Fiscal Defi cit of Centre
Source: Government of India

Chapter I Macroeconomic Risks
14
custom duty rates and partial rollback of crisis-related reductions in various indirect tax rates. The revenue outcome in 2012-13 would, however, hinge on the realisation of the budgeted gross tax buoyancy which, at 1.39 for 2012-13, is signifi cantly higher than the long-term average tax buoyancy of 1.11 for the period 2003-04 to 2011-12 as well as the average of 1.14 for the recent period 2010-11 to 2011-12.
1.30 On the expenditure side, there are latent pressures on Central government fi nances for 2012-13. On the petroleum subsidy front, upside risks stem from volatile international crude oil prices and fl uctuations in the exchange rate. Also, the budgeted growth of 3 per cent in food subsidies in 2012-13 appears to be modest when viewed in the context of the implementation of the Food Security Bill. Against this backdrop, the capping of subsidies by Central government at 2 per cent of GDP is a welcome step but avoidance of fi scal slippages would necessitate steps to allow fuller pass through of international crude oil and fertiliser prices.
Household Risks have moderated
1.31 Risks posed by the household sector have declined, as evidenced by the trends in the Macroeconomic Risk Map. Delinquencies in retail sector have moderated while growth in retail credit has decelerated. As debt-fi nanced consumption continues to be low in India, it does not seem to be a source of signifi cant risk from the perspective of the system as a whole. (Chart 1.15).
Elevated corporate sector risks with rising costs and declining profi ts
1.32 Risks to health of the corporate sector in the economy remain elevated. Recent corporate results point to falling profi tability due to rise in input costs, including interest costs, and moderation of external and domestic demand (Chart 1.16). Firm oil prices, stickiness in manufactured input prices, higher import costs associated with the depreciation of the exchange rate and continuance of moderation in external and domestic demand emerge as important source of risks to the balance sheet of corporate and need to be monitored. Reserve Bank’s Industrial Outlook Survey also indicated that the present industrial slowdown is expected to continue for some time.
Chart 1.15: Growth in Retail Credit, NPA and PFCE
PFCE: Private fi nal consumption expenditureRet Cr: Retail creditSource: CSO, RBI
Chart 1.16: Falling Profi t Margins and Rising Interest Costs
Source: RBI

Financial Stability Report June 2012
15
Chapter II
Financial Markets
I. Global Markets
Lingering European debt crisis cast a shadow on fi nancial markets
2.1 The European sovereign debt crisis had caused funding strains for sovereigns and, in their wake, for European banks since the onset of the fi nancial crisis. This intensifi ed towards the end of 2011. There was persistent uncertainty over the exact terms of fi scal relief for Greece. The rating downgrades of European banks and sovereigns have added to the strains experienced by fi nancial markets.
ECB’s policy support rescued sentiment temporarily
2.2 Stronger than expected US economic data and the European Central Bank (ECB)’s fi rst three-year Longer-Term Refi nancing Operation1 (LTRO) in December 2011 were mainly responsible for changing market sentiment in early part of 2012 as investor risk appetite recovered. The ECB followed up the first round of LTRO in December 2011 with another one in February 2012,
Globally, uncertainty and risk aversion reigned in the fi nancial markets as sovereign default risk, fragility in the banking sector and funding strains for sovereigns and banks continued to haunt the Euro area. Policymakers, posed with fresh challenges, had to innovate constantly to address the panic and keep the markets stable. Unconventional policy measures have been initiated by governments and central banks during the last two years, to deal with the situation. While the measures have brought temporary respite to the fi nancial markets and the economies, the structural nature of the problems persist and the Eurozone crisis, remains a major threat to global fi nancial stability. The improvement in sentiment in the early part of 2012 has given way to gloom as popular dissent against tough austerity measures has made it diffi cult for democratically elected governments to act. The concerns of a Greek exit from the European monetary union increased uncertainty during the period under review. The falling momentum in domestic growth in India as well as the rising current account defi cit and the growing fi scal gap are eroding investor confi dence. While the domestic money and bond markets remain relatively unaffected by external turbulence, the foreign exchange and equity markets have witnessed high levels of volatility. A combination of foreign exchange market intervention and administrative measures have been taken to address the stress in foreign exchange markets. Sentiment in Indian equity markets is likely to remain tied to developments in global and domestic macroeconomic situation.
1 The ECB usually conducts overnight, weekly and monthly repos. During the fi nancial crisis, it started conducting longer term repos for 1-year maturities. This program was expanded further for unlimited sums for three years with considerable relaxation in quality and nature of collateral accepted.
taking the total policy support from this measure to over 1 trillion. The LTROs provided fi nance for stressed
sovereigns and banks. Bank and sovereign CDS spreads tightened signifi cantly. Strains in US dollar funding markets appeared to ease (Chart 2.1).
Chart 2.1: Money Market Spreads in 2012 in US Dollars and Euros
Source: Bloomberg

Chapter II Financial Markets
16
Sovereign debt sustainability concerns resurfaced...
2.3 Policy measures proved unsuccessful in providing sustained relief. The broad fi nancial market rally that followed the unconventional monetary policy measures taken in late 2011 and early 2012 has subsided. Global markets were concerned about elevated risks from Greece during the period under review (Box Item 2.1). While the size of fi rewalls for fi scal risks in Europe have been raised, doubts over their capacity to support larger countries such as Spain or Italy in case of a contagion, have weakened market confi dence.
...with widening of spreads on sovereign bonds
2.4 Sovereign CDS spreads have widened signifi cantly, especially in Spain and Italy (Chart 2.2). Several institutions lowered risk limits for sovereign bonds of the troubled economies in Eurozone due to adverse developments and the higher notional losses on such bond holdings (as a result of higher volatility). This reduced the institutional appetite for bonds and affected their liquidity. The implied volatilities of the bond, stock, and foreign exchange markets point to an uncertain environment (Chart 2.3).
Structural issues remain to be addressed
2.5 Some European banks continue to be heavily reliant on wholesale funding. However, the maturities of bank borrowings have been shortened owing to market conditions. Further, their access to unsecured funds has also worsened. This fragility makes banks vulnerable to funding market freezes and has signifi cantly increased their dependence on central bank support.
Chart 2.2: Sovereign CDS Spreads in Europe in 2012
Source: Bloomberg
Chart 2.3: Volatilities of Various Asset Classes2
Source: Bloomberg
Greece received a second bailout package from the IMF-EU-ECB troika in February 2012 after its fi scal situation failed to improve to the extent expected. The second restructuring involved an effective loss of as much as 75 percent for private bond holders in order to reduce Greece’s debt burden. Outcomes of recent elections in Europe point to anti-incumbency on account of austerity measures. The contrasting experiences of Ireland and Iceland are a pointer for the Greek situation. Ireland, which is in the Euro currency union, is still on negative growth
trajectory, despite adhering to austerity measures imposed by lenders. Iceland, in contrast, has rebounded with good growth rates in 2011 through depreciation of its currency and by passing on losses to its lenders. Iceland grew at 4.5 per cent in Q1 2012 compared to 0 per cent for the European Union. In fact, the central bank of Iceland has been hiking interest rates since Q3 2011. The outcome of the second election in Greece in June 2012 appears to favour the continuation of Greece in the monetary union.
Box 2.1 : The Greek Dilemma
2 Volatilities are represented for currencies by 1-month implied vols of EUR/US$, for equities by US’ VIX index and for bonds by the Merrill Lynch’s MOVE index for US treasuries.

Financial Stability Report June 2012
17
Rating agency, Moody’s Investor Service cut ratings of 15 major banks by one to three notches, in another round of rating downgrades in mid-June 2012.
Accommodative monetary policy in advanced countries has externalities
2.6 In the United States, macroeconomic indicators point to a slow recovery, though the sustainability of the recovery remains uncertain. Central banks in advanced economies (AEs) are continuing their accommodative monetary policies. Policy rates have been at or near historic lows in many AEs, with a commitment to continue these levels for some more time. This, in turn, induces greater leverage and a progressive easing of lending standards. From a corporate issuer’s point of view, the cost of raising fund by issuance of bonds has become more attractive, relative to equity. A surge in corporate borrowings could increase systemic leverage in the process. There are signs that continuously low interest rates may start to feed into a search-for-yield behaviour in global fi nancial markets (Chart 2.4).
II. Domestic Markets
Foreign exchange market exhibited considerable stress
2.7 Developments in Euro area and deterioration in global macroeconomy were among the factors that contributed to stress in the domestic foreign exchange market during the period under review. The other three components of the Financial Markets Stability Map (Chart 2.5), viz. banking sector funding, debt and equity markets, remained largely unchanged in comparison. The rise in the Financial Markets Stability Indicator (Chart 2.6) is largely driven by the fall in the rupee to historical lows and rise in its volatility.
Sovereign bond yields refl ected fi scal slippages
2.8 Bond yields moved higher towards the end of March and early April 2012 (Chart 2.7) on account of persistently tight liquidity conditions and an unanticipated rise in budgeted government borrowings for 2012-13. Subsequently they have stayed in a range
Chart 2.4: Interest Rate Differential Between Indian Rates and those of US and Euro3
Source: Bloomberg
Chart 2.5: Financial Markets Stability Map
Note : Movement away from centre implies higher risk
Chart 2.6: Financial Markets Stability Indicator
Note : Higher value denotes higher risk. Shaded portion indicated in red is projection
3 10-year rates on Indian government bonds are used as investment and US dollar and Euro Libor rates are used as borrowing rates.

Chapter II Financial Markets
18
between 8.5 per cent and 8.8 per cent for 10-year maturities. The fi nancial markets remained unconvinced about the ability of the government to bring down the high level of fi scal defi cit. The gross and net market borrowing of the Central Government through dated securities have been budgeted at ` 5696 billion and` 4790 billion, respectively during 2012-13. This is higher by 11.7 per cent and 9.8 per cent, respectively over the last year. The Central Government proposes to fi nance only 2 per cent of the budget through treasury bills, signifi cantly lower than 22 per cent in 2011-12. A cut in the Reserve Banks’ policy rate by 50 basis points, inter alia, brought 10-year government bond yields closer to 8 per cent.
Indian sovereign bond market remained largely insulated from overseas pressures
2.9 During the period under review, the rating agencies, S&P and Fitch, changed the outlook on Indian sovereign debt and 11 banks /institutions, from stable to negative. Though the government bond yields rose marginally on the news of change in the rating outlook, they quickly retraced. Since the Central Government does not borrow in the offshore markets and reliance on outside investors by way of Foreign Institutional Investment (FII) is limited, the impact was muted.
Liquidity conditions improved after tightness in March
2.10 Liquidity conditions in Indian money market remained tight, during the period under review, outside of the Reserve Bank’s indicative comfort level of (+)/(-) one per cent of net demand and time liabilities (NDTL) of banks. Average net injection of liquidity under the daily liquidity adjustment facility (LAF) increased from around `0.5 trillion during April-September 2011 to around ̀ 1.6 trillion during March 2012. The increase in currency in circulation, quarterly tax outgo from all fi rms and the foreign exchange market intervention operations sucked liquidity out of the banking system. The Reserve Bank injected liquidity by conducting open market operations (OMOs) and reducing the cash reserve ratio (CRR) by 125 basis points. The Systemic Liquidity Indicator (Chapter V) exhibits the stress felt in funding liquidity for banks and others.
Chart 2.7: Indian Government Bond Yields in 2012
Source: Bloomberg
Rating change could impact the cost and availability of foreign currency borrowing
2.11 The process of deleveraging underway among European banks has raised the cost of borrowing for Indian fi rms and banks. Smaller borrowers have found their traditional funding lines withdrawn. A large part of foreign currency borrowings of Indian fi rms and banks is in the form of loans (External Commercial Borrowings) rather than bonds. The current external rating of India stands at BBB- (with a negative watch by S&P and Fitch and Baa3 by Moody’s). A rating change could have some ‘cliff effects’. This could affect both availability and cost of foreign currency credit lines for Indian corporates further. The impact is also being felt by Indian banks as they are the primary source of foreign currency denominated funding for Indian firms like buyer’s credit. Indian fi nancial institutions and non-banking fi nancial companies (NBFCs) in the public sector have been large benefi ciaries of FII investments in debt in the past. These institutions, could also face the impact of a reduction in FII infl ows.
Forex market remained volatile
2.12 Concerns over high twin defi cits of the country, re-emergence of global macroeconomic tensions and the European sovereign debt crisis have been the key factors behind the weakening rupee. The Reserve Bank has been using a mix of foreign exchange market interventions and administrative measures to address the volatility arising from tensions in the market place. The depreciation of the rupee followed the general trend of

Financial Stability Report June 2012
19
currencies of EDEs, especially those with high current account defi cits (Chart 2.8).
Reserves fell moderately
2.13 Adequacy of reserves has emerged as an important parameter in gauging the ability of a country to absorb external shocks. At the end of September 2011, the import cover declined to 8.5 months from 9.6 months at end-March 2011.The ratio of short-term debt to the foreign exchange reserves was 21.3 per cent at end-March 2011 and it increased to 23 per cent at end-September 2011. The ratio of volatile capital flows (defi ned to include cumulative portfolio infl ows and short-term debt) to the reserves increased from 67.3 per cent as at end-March 2011 to 68.3 per cent as at end-September 2011.
2.14 With the changing profi le of capital fl ows, the traditional approach of assessing reserve adequacy in terms of import cover has been broadened to include a number of parameters which take into account the size, composition and risk profi les of various types of capital fl ows as well as the types of external shocks to which the economy is vulnerable. In the recent period, assessment of reserve adequacy is being done using some new measures, including ‘Liquidity at Risk’ (LaR). The LaR approach requires that a country’s foreign exchange liquidity position could be calculated under a range of possible outcomes for relevant financial variables, such as, exchange rates, commodity prices, credit spreads etc.
Recent Rupee weakness found echo in stock market sentiment
2.15 The Morgan Stanley Capital International (MSCI) Emerging Markets index reported a fi rst quarter gain of 13.2 per cent in Q1 2012. Stock markets in India mirrored the movement in other emerging markets in Asia and elsewhere. The initial optimism fuelled by increased liquidity provided by ECB and the resolution of uncertainties relating to the second debt package for Greece quickly waned. Retrenchment by FIIs in India (as also abroad) led to a correction in Indian stock indices back to their December 2011 lows. The US dollar rate of return to foreign investors worsened with the depreciation of the Indian rupee and this, in turn, reduced the attractiveness of Indian equity (Chart 2.9).
Chart 2.8: Currencies of EDEs with Current Account Defi cits
Source: Bloomberg
Chart 2.9: Weekly Returns of Nifty and Defty4 in 2012
Source: Bloomberg
4 Defty is the S&P CNX Defty index and is a Dollar denominated value of NSE’s Nifty Index.

Chapter II Financial Markets
20
Some episodes have highlighted the possible risks from Algo and High Frequency Trades
2.16 In recent period, there have been many instances of extreme volatility and disruptions witnessed in Indian stock markets, resulting from various causes which can be directly or indirectly attributed to the increasing use of Algorithmic5 (Algo) and High Frequency Trading (HFT)6. The Financial Stability Report of June 2011 had mentioned about the possible risk implications of a rapid move towards technological advancements like introduction of Direct Market Access (DMA)7, facilitating Algo trading and HFT for Indian stock markets. In India only about17 per cent and 11 per cent of cash market turnover in NSE and BSE respectively are on account of Algo and HFT in recent months. This proportion is much lower than that in developed markets like US and Europe.
5 Algo trading refers to the use of electronic platforms for entering trading orders with a computer program (algorithm) determining the decisions on aspects such as the timing, price, or quantity of the order, or in many cases initiating the order without human intervention.6 The HFT is a special class of Algo trading, in which computers make elaborate decisions to initiate orders based on electronically accessed information, at a very fast speed (in microseconds), before human traders are capable of processing the information they observe.7 Direct Market Access (DMA) is a facility that allows ‘clients’ to directly access the broker’s trading infrastructure (linked to the exchange trading system) without any manual intervention by the broker, resulting in advantages such as direct control over and faster execution of client orders, orders, reduced risk of errors associated with manual order entries, greater transparency, increased liquidity, lower impact costs for large orders, better audit trails and better use of hedging and arbitrage opportunities through the use of decision support tools/algorithms for trading.
2.17 Indian stock exchanges already have features like circuit breakers on stocks (having derivative trading) and indices, dummy price band for no band securities, quantity alert check, consolidated audit trail and trade cancellation policy and other risk reduction procedures to detect manipulation and deal with the possible risks. There is a need to balance the need for technological advancements with a pragmatic approach to the intended benefi ts of the innovations. This assumes even more signifi cance for India as efforts are being made to increase the retail participation in the Indian securities markets to change the largely institutional character of the market. The regulators and policy makers need to continue to assess the system-wide impact of such trading, from the perspective of current priority for a broad-based development of fi nancial markets.

Financial Stability Report June 2012
21
Chapter III
Financial Institutions: Soundness and Resilience
Soundness of Financial Institutions
Banking Stability Map and Indicator1
Risks to the banking sector remain elevated
3.1 Vulnerabilities in the banking sector exhibited a mixed trend at the end of March 2012 as revealed by the Banking Stability Map. The soundness and profi tability indicators showed some improvement over the position as at end September 2011. Soundness indicators, however, showed a deterioration vis-à-vis their position
The stability of the banking sector deteriorated marginally in the period since September 2011. The soundness indicators of banks, however, remained robust. Asset quality pressures persisted while credit growth decelerated, largely refl ecting the slowdown in the economy. As the divergence between credit and deposit growth widened, banks’ reliance on borrowed funds increased, heightening associated liquidity risks. Going into 2012-13, the operating conditions for the Indian banks are expected to remain challenging given the weakening global economic outlook, adverse domestic macroeconomic conditions and policy uncertainties. Banks in India are likely to be affected due to deleveraging in advanced countries though the direct impact is expected to be limited. Credit growth of the non banking fi nancial companies has decelerated. Regulatory restraints have been put in place to rein in the risks posed by exposure of banks to gold loan companies. The stress tests carried out on banks, incorporating a range of shocks, revealed deterioration in their capital position as compared with the baseline scenario, but the banking system remained resilient even under extreme stress scenarios. A series of scenarios and sensitivity stress tests applied on select banks’ derivatives portfolio revealed that they are well positioned to manage the resultant market risks.
1 For methodology and details, please refer to the Annex.
Chart 3.1 : Banking Stability Map
Note: Away from the centre signifi es increase in riskSource : RBI staff calculations
Chart 3.2 : Banking Stability Indicator
Note: (i) Increase in indicator value shows lower stability (ii) Jun 2012 and Sep 2012 are forecasted values indicated by the
shaded regionSource : RBI staff calculations
in March 2011. Strains in asset quality intensifi ed. The liquidity defi cit added to the stress in the banking sector (Chart 3.1).
3.2 The Banking Stability Indicator, as at end March 2012, pointed to deterioration in the stability of the banking sector, compared with its position in September 2011. A forecast of the indicator for the next two quarters surmised that the risks to the banking sector are likely to remain elevated in the near term (Chart 3.2).

Chapter III Financial Institutions: Soundness and Resilience
22
Deleveraging trends in global banking expected to continue...
3.3 The confl uence of funding strains and sovereign risks led to fears of a precipitous deleveraging process that could hurt fi nancial markets and the wider economy via asset sales and contractions in credit (Chapters I and II). Many European banks have announced medium-term business plans for reducing assets. The impact is likely to differ signifi cantly across regions, with larger effects expected in emerging Europe than in Asia or Latin America (Table 3.1). In the Indian context, the claims of European banks, amounting to US$ 146 billion, formed 53 per cent of total consolidated foreign claims. Of this, 56 per cent pertained to claims of banks in United Kingdom.
… with limited impact possible for domestic credit availability
3.4 The direct impact of the Eurozone crisis on Indian banks is expected to be limited. The Indian banking sector is dominated by domestic banks with foreign banks accounting for only 8 per cent of total banking sector assets and 5 per cent of banking sector credit. There could, however, be indirect impact on Indian banks due to their exposures to other countries, especially in the Eurozone (Charts 3.3 and 3.4).
3.5 The direct impact of deleveraging is not expected to be signifi cant on domestic credit availability although specialised types of fi nancing like structured long term finance, project finance and trade finance could be impacted.
Table 3.1 : Consolidated Foreign Claims of European Banks(in US$ billion)
Jun-2011 Dec-2011
Developing Europe 1304 1137
Developing Asia and Pacifi c 935 841
of which, India 159 146
Developing Latin America and Caribbean 855 770
Source : Locational Banking Statistics - Dec 2011, BIS
Chart 3.3 : Claims by Indian Banks on Select Countries – Positionas on Dec 2011
Source : Data collected from a sample of 50 banks that form 90 per cent of banking sector assets
Chart 3.4 : Claims on Indian Banks by Select Countries as Ratio of Indian Banking Sector Assets
Source : Locational Banking Statistics - Dec 2011, BIS

Financial Stability Report June 2012
23
Scheduled Commercial Banks (SCBs)
Credit and deposit growth weakens, reverberating slowdown concerns in the economy
3.6 Balance sheet of SCBs expanded by 14.5 per cent during 2011-12, lower than the growth of 18.8 per cent for 2010-11. The deceleration was refl ected in the growth rates of both credit and deposits. Credit growth in the banking sector, at 16.3 per cent in 2011-12, was lower than the 22.6 per cent recorded in 2010-11. Deposit growth stood at 13.7 per cent and 17.7 per cent for the two years respectively. The growth rate of deposits in 2011-12 was the lowest recorded in the past 10 years.
3.7 These trends broadly refl ected the slowdown in the economy, as the nominal GDP growth decelerated from 18.8 per cent in 2010-11 to 15.4 per cent in2011-12. Benchmarking of the interest rates on small savings schemes to market determined rates of interest as well as availability of liquid funds with higher yield and associated tax benefi ts may have also contributed to the deceleration in growth rate of deposits of banks.
Slowdown in credit driven by slowdown in some specifi c sectors…
3.8 The deceleration in credit growth was particularly marked in case of the priority sector, real estate and infrastructure segments, which together account for nearly 60 per cent of banking sector credit (Chart 3.5).
… and amongst public sector banks
3.9 The deceleration was most pronounced in the credit growth of Public Sector Banks (PSBs) while the old private sector banks recorded a sharper credit growth of 24 per cent. Expansion of credit to retail and real estate sectors accounted for the bulk of the growth in credit among the old private sector banks – a trend which would need to be carefully monitored, if sustained (Chart 3.6).
CD ratio increased consequent on divergence between credit and deposit growth rates …
3.10 The credit to deposit (CD) ratio increased to 76 per cent as at end March 2012 (as against 73.5 per cent as at end September 2011 and 74.3 per cent as at end March 2011) driven by the divergence between deposit and credit growth rates in 2011-12. The incremental CD ratio also remained high at 88 per cent. The incremental Investment to Deposit (ID) ratio rose sharply on the back of a 17 per cent growth in investments (Chart 3.7).
Chart 3.5 : Growth Rate of Bank Credit to Select Sectors
Source : RBI Supervisory Returns
Chart 3.6 : Credit Growth in Various Sectors - Bank Group Wise
Source : RBI Supervisory Returns
Chart 3.7 : CD/ID ratio and Incremental CD/ID ratio of SCBs
Source : RBI Supervisory Returns

Chapter III Financial Institutions: Soundness and Resilience
24
… and banks’ reliance on borrowed funds increased
3.11 Banks, during 2011-12, increasingly relied on borrowings to fund their credit and investment growth. This was evidenced by the increasing gap between the combined growth of advances and investments and that of deposits and capital (Chart 3.8). This was accompanied by the growing short term maturity mismatches in the balance sheet of banks (Chart 3.9). The rollover and liquidity risks associated with these trends will need to be assessed and managed.
Capital ratios recover as credit growth slows
3.12 The capital ratios of the SCBs improved marginally since September 2011, primarily due to slowdown in growth of credit. There was, however, a marginal deterioration in comparison with the position as on March 2011. Capital to Risk weighted Assets Ratio (CRAR) fell from 14.2 per cent as at end March 2011 to 13.5 per cent as at end September 2011, but recovered to 14.1 per cent as at end March 2012. Core CRAR fell from 10 per cent as at end March 2011 to 9.6 per cent as at end September 2011, but rose to 10.3 per cent as at end March 2012 (Chart 3.10).
Asset quality concerns persist as NPA ratios remain high
3.13 Asset quality concerns persist as the growth in non performing assets (NPAs) accelerated and continued to outpace credit growth. The respondents of the second Systemic Risk Survey conducted by the Reserve Bank (Chapter V) also identifi ed asset quality as one of the critical risks faced by the Indian banking sector.
3.14 The Gross NPA ratio increased to 2.9 per cent as at end March 2012, as against 2.4 per cent as at end March 2011 and 2.8 per cent as at end September 2011. Net NPA ratio stood at 1.3 per cent as at end March 2012, as against 0.9 per cent as at end March 2011 and 1.2 per cent as at end September 2011. The ratio of NPAs (net of provisions) to capital also falls short when benchmarked against the peer economies (Chart 3.11).
Chart 3.8 : Growth Rate of Select Components of Balance Sheet
Note: Adv+Inv-Growth: Growth rate of advances and investments Depo+Cap n Resrv-Growth: Growth rate of deposits and capital and reserves
Borrg Growth: Growth rate of BorrowingsSource: RBI Supervisory Returns
Chart 3.9 : Maturity Profi le of Deposits and Advances
Source: RBI Supervisory Returns
2 Divergence denotes the gap between growth rate of advances and investments and deposit and capital. A positive gap implies that the growth rate of deposits and capital was not suffi cient to meet the growth of advances and investments leading to increased reliance on borrowed funds.
Chart 3.10 : CRAR of Bank Groups
Source : RBI Supervisory Returns

Financial Stability Report June 2012
25
Growth in NPAs outpaced credit growth by a wide margin
3.15 NPAs grew at 43.9 per cent as at end March 2012, far outpacing credit growth of 16.3 per cent. The divergence in growth rate of credit and NPAs has widened in the recent period, which could put further pressure on asset quality in the near term (Chart 3.12).
Accretions to NPAs accelerated
3.16 The slippage ratio3 increased to 2.1 per cent as at end March 2012 from 1.6 per cent at March 2011 and 1.9 per cent at September 2011.The ratio of slippages plus restructured standard advances to recoveries (excluding up-gradations) also exhibited an increasing trend underscoring the concerns with respect to asset quality, and the need for proactive management of NPAs by banks (Chart 3.13).
Restructuring of advances is on the increase…
3.17 Due to a spillover of the global financial crisis to the Indian economy, certain relaxations4
were permitted on restructuring on a temporary basis in the later part of 2008-09, which helped in tiding over the diffi culties faced by the real sector. However, it led to a signifi cant increase in the level of restructured standard assets during 2008-09 and 2009-10, after which there was a deceleration in the amount of restructured assets. In 2011-12, the quantum of restructured accounts has again increased sharply, outpacing both credit growth and growth rate of gross NPAs (Chart 3.14).
Chart 3.12 : Trend in Growth Rate of Gross NPAs vis-à-visLoans & Advances
Source: RBI Supervisory Returns
Chart 3.13 : Slippages as Ratio of Recoveries
Note : * Recoveries include write offSource: RBI Supervisory Returns
3 The slippage ratio is defi ned as the ratio of slippages i.e. fresh accretion to NPAs during the year to standard advances at the beginning of the year.4 RBI Circular titled “Prudential Guidelines on Restructuring of Advances by banks” (No. RBI/2008-09/143 DBOD.No.BP.BC.No.37 /21.04.132/2008-09 dated August 27, 2008)
Chart 3.11: Ratio of Net NPAs to Capital of Banks in Select Countries
Source: Financial Soundness Indicators - Dec 2011, IMF
Chart 3.14 : Growth of Restructured Accounts vis-à-vis NPAs and Loans
Source: RBI Supervisory Returns

Chapter III Financial Institutions: Soundness and Resilience
26
…and could weigh on NPA ratios, going forward
3.18 An empirical analysis of the asset quality of banks’ advances portfolio was conducted by adding back the advances written off by banks during the last fi ve years and (separately) assuming that 15 per cent of restructured accounts slip into impaired category. The resultant ratios exhibited an increasing trend that calls for a closer look at the underlying management of NPAs by banks (Chart 3.15).
Asset quality in some key sectors remained under strain
3.19 The increase in gross NPAs for the year ending March 2012 was largely contributed by some key sectors viz., priority sector, retail and real estate. The growth rate of NPAs in the infrastructure segment, however, decelerated as at end March 2012, partially on account of base effects and sharp moderation in credit to infrastructure projects (Table 3.2 and Chart 3.16). Certain sectors like power and airlines saw signifi cant increase in impairments (Box 3.1).
Table 3.2 : Asset Quality of Select Sectors - Mar 2012
Chart 3.15 : NPA Ratios of SCBs
Source: Supervisory Returns and RBI staff calculations
Chart 3.16 : Growth rate of NPAs of Select Sectors
Source: RBI Supervisory Returns
Source: RBI Supervisory Returns

Financial Stability Report June 2012
27
Chart 3.17 : Exposure of SCBs to Power Sector
Note: Exposure comprises of fund and non fund based credit as well as investmentsSource: RBI staff calculations
The risks faced by banks on their exposure to the power sector due to rising losses and debt levels in state electricity boards (SEBs) and the shortage of fuel availability for power generation were discussed in the FSR for December 2011. Potential pressures on asset quality have intensifi ed with restructuring in bank credit to power sector registering a sharp increase, especially in the last quarter of 2011-12, even as impairments as a ratio of outstanding credit has moderated. Meanwhile, the losses of SEBs have also been mounting6, adding to the concerns about asset quality in the sector (Charts 3.17 and 3.18).
Chart 3.19 : Bank Credit to Airlines Sector
Source: RBI staff calculations
Chart 3.20 : Top 10 Banks in terms of Credit to Airlines Sector
Source: RBI staff calculations
5 Statistics based on data collected from 67 banks that represent 91 per cent of total assets of SCBs, unless specifi ed otherwise.6 An estimate by CRISIL puts net losses of power distribution companies to around ` 400 billion in 2010-11.
Box 3.1 : Power and Airlines : Sectors under Stress5
increases in impairment and restructuring in the sector saw the share of this sector in aggregate banking system NPA and restructured assets rise disproportionate to its share in banking sector credit (Chart 3.19). There was signifi cant concentration discernible in distribution of credit to the airline sector as ten banks accounted for almost 86 per cent of total bank credit to this sector. As at end-March 2012, nearly three quarters of the advances of banks, which have an exposure of above `10 billion to the airline industry, were either impaired or restructured. PSBs accounted for the major share of these exposures (Chart 3.20).
Going forward, the sectors are likely to continue facing funding constraints and could also be affected by prevalent policy uncertainties. These could pose challenges to the asset quality of credit to these sectors.
Asset quality of banks’ credit to the airlines industry came under some stress in recent periods, driven largely by the performance of some specifi c airline companies. Sharp
Chart 3.18 : NPA and Restructured Accounts in Power Sector
Source: RBI staff calculations

Chapter III Financial Institutions: Soundness and Resilience
28
Further strains on asset quality could emerge; though the strong capital position provides cushion
3.20 The muted economic backdrop and global headwinds could lead to further deterioration in asset quality. The position is not alarming at the current juncture and some comfort is provided by the strong capital adequacy of banks which ensure that the banking system remains resilient even in the unlikely contingenc y of having to absorb the entire existing stock of NPAs (Chart 3.21). A series of credit risk stress tests also testify to the resilience of banks (paragraphs 3.43 to 3.45).
Profi tability indicators display mixed trends
3.21 SCBs continued to register healthy profi ts, though the growth rate of earnings has decelerated (Chart 3.22). Return on assets (RoA), return on equity (RoE) and net interest margin (NIM) have declined marginally as at end March 2012, relative to end March 2011 (Chart 3.23). Going forward, the growth of earnings could be affected due to lower credit off-take and asset quality concerns.
Interest rate swaps dominate off balance sheet assets of banks
3.22 The aggregate notional amount of off balance sheet (OBS) assets of the SCBs far exceeded the size of their on-balance sheet assets (Chart 3.24). The distribution of total OBS assets (in terms of notional amount) showed concentration of about 64 per cent in foreign banks followed by 17 per cent in case of PSBs. In the case of derivatives, foreign banks constituted 70 per
Chart 3.21 : CRAR in the Eventuality of Write off ofExisting Stock of NPAs (net)
Source: RBI Supervisory Returns
Chart 3.22 : Growth Rate of Earnings
Note : EBPT – Earnings Before Provisions and Taxes PAT – Profi t After TaxesSource : RBI Supervisory Returns
Chart 3.23 : Profi tability Ratios
Source: RBI Supervisory Returns
Chart 3.24 : OBS Assets (Notional Principal) as a Ratio ofBalance Sheet Assets
Source: RBI Supervisory Returns

Financial Stability Report June 2012
29
cent of total notional amount, followed by new private sector banks at 16 per cent. Among the OBS constituents, the most prominent segment was Interest Rate Swaps (IRS).
Banks geared to absorb market risks from their derivatives portfolio; will need to manage the resultant credit risks
3.23 An analysis of derivatives portfolio of a sample of banks7 revealed that most banks reported a positive net mark-to-market (MTM) position. The dominance of foreign banks in the derivatives segment was evident as the proportion of gross positive as well as negative MTM to capital stood, on an average, at around 250 per cent for foreign banks compared with 16 per cent in case of the other banks in the sample. Net MTM as a ratio of capital varied between a positive of 30 per cent to a negative of 10 per cent (Charts 3.25 and 3.26).
3.24 A series of stress tests was carried out on the derivatives portfolio by the select banks based on a common set of historical scenarios and random sensitivity shocks (Box 3.2). The post-stress net MTM position was positive for most banks suggesting that the banks are well geared to absorb adverse market movements. However, banks remained exposed to the risks of counterparty failure, especially in case of disputes with clients over payment, as had been evidenced in the past.
Non Banking Financial Companies (NBFCs)
Credit growth decelerated amidst declining asset quality and profi tability
3.25 NBFCs experienced deceleration in growth rate of credit though the credit growth continued to outpace that of the banking sector. Bank credit to NBFCs accelerated as did the reliance of NBFCs on bank credit as a source of funding. This could pose risks for NBFCs if banks are not in a position or unwilling to extend credit to the sector (Chart 3.27).
3.26 The fi nancial soundness indicators of systemically important non-deposit taking NBFCs (NBFC-ND-SIs) revealed a deteriorating trend with respect to soundness, asset quality and profi tability (in terms of RoA). The CRAR remained above the regulatory requirement of 15 per cent, though it declined over the review period,
Chart 3.25 : Positive and Negative MTM as a Ratio of Capital Funds for Sample of Banks
Source : Banks in the Sample
Chart 3.26 : Net MTM as a Ratio of Capital Funds forSample of Banks
Source : Banks in the Sample
7 Sample consists of 26 banks accounting for 88 per cent of total notional amount of derivatives exposure and 64 per cent of total assets of SCBs as on March 31, 2012.
Chart 3.27 : Credit Growth – NBFCs vis-à-vis Banks
Source : RBI Supervisory Returns

Chapter III Financial Institutions: Soundness and Resilience
30
Chart 3.30 : Change in Net MTM–Scenario Analysis
Note: Based on Worst Case Analysis (the maximum impact on the net MTM positions amongst the scenario/sensitivity stress tests respectively).Source: Banks in the Sample
Box 3.2 : Stress Testing of Derivatives Portfolio of Select Banks
A stress testing exercise on derivatives portfolio of a cross section of banks was undertaken. The stress tests consisted of six historical scenarios and four interest rate and exchange rate sensitivity shocks8.The impact of the tests exhibited considerable variance across banks and across bank groups. In
terms of increase in negative MTM, foreign banks were impacted signifi cantly while the impact on the rest of the bank groups was muted. Further, the shocks used for sensitivity analysis caused the maximum stress, in case of most banks, relative to the historical scenarios (Charts 3.28 and 3.29).
Chart 3.28 : Negative MTM Post-Stress (Scenario) as Ratio of Capital Funds
Note: Each line represents an individual bank in the sample setSource: Banks in the Sample
Chart 3.29 : Negative MTM Post-Stress (Sensitivity) as Ratio of Capital Funds
The impact on the net MTM positions of banks in the sample, post application of the stress conditions, was observed to be relatively muted in most cases. The shocks used for sensitivity analysis caused the maximum stress for most banks relative to the historical scenarios with the average change in
Net MTM being around 344 per cent for the sensitivity analysis compared with 66 per cent for scenario analysis. However, there were a few outlier banks where the impact was signifi cant and these banks would need to carefully manage the underlying risks (Charts 3.30 and 3.31).
8 For methodology and details, please refer to the Annex.
Chart 3.31 : Change in Net MTM–Sensitivity Analysis

Financial Stability Report June 2012
31
(Chart 3.32). The downward movement in CRAR could partially be explained by the increasing asset base of the NBFCs. Further, the RoA remained healthy at around2 per cent.
Rapid rise of gold loan companies could be a cause of concern
3.27 The exponential growth in balance sheets of NBFCs engaged in lending against gold in recent years
9 NBFCs which are predominantly engaged in extending loans against gold jewellery are also known as ‘gold loan companies’.
Chart 3.32 : Financial Soundness Indicators of NBFC-ND-SIs
Source : RBI Supervisory Returns
coupled with the rapid rise in gold prices along with expansion in the number of their branches could be a cause of concern (Box 3.3). The gold loan companies9 exhibited high dependency on the banking system for their resources which could pose risks to the banks, in case the business model of these companies falters. This growing interconnectedness of gold loan companies with banks was sought to be addressed through recent regulatory measures viz., the de-recognition of priority
Lending against the collateral of gold is not a recent phenomenon, though there has been a spurt in this activity in recent years with NBFCs emerging as prominent players in the market for ‘gold loans’. The share of NBFCs in total gold loans extended by all fi nancial institutions, showed a marked increase between March 2010 and 2011. Individuals are the largest borrowers against gold from NBFCs and account for 95 per cent of the total gold loans.
The data related to these NBFCs shows that the total asset size increased sharply from ` 54.8 billion as at end March 2009 to ` 445.1 billion as at end March 31, 2012. The growth has largely been accompanied by an escalation in borrowings. There is signifi cant concentration among the companies, as the growth in advances is mainly contributed by two companies. The borrowings of these two companies increased by nearly 200 per cent between March 2010 and 2011.
Nevertheless, there are several concerns pertaining to this segment of the NBFC sector. The main concerns being:
(i) Concentration Risk With more than 90 per cent of the loan assets being
collateralised by only one product viz. gold jewellery, the business model of gold loan companies has inherent
concentration risks. The risks, however, would materialise only in case of a steep adverse movement in gold prices.
(ii) Operational Risk The gold loan companies thrive on the promises of
disbursement of quick /easy loan. Considering the extremely speedy disbursal being promised by these companies, quality of due diligence including adherence to Know Your Customer (KYC) norms, establishing ownership and quality of the gold, etc. could be compromised.
(iii) Concerns on Private Placement of NCDs on a Retail Basis The gold loan companies have resorted to frequent
issuances of short term retail non convertible debentures (NCDs), especially through private placement for meeting their credit needs. Concerns arise as some of these NCDs carry the features of ‘public deposits’, but these entities are not regulated in a manner akin to deposit taking NBFCs.
(iv) Reliance on borrowings, especially bank funds The business model of the gold loan companies is driven
by borrowings, of which, bank fi nance forms the major component and is increasing at a fast rate. Any adverse development in recovery by these NBFCs or an adverse movement in gold prices may have a spill-over impact on the asset quality of the banks.
Box 3.3 : Gold Loan Companies and Associated Risks
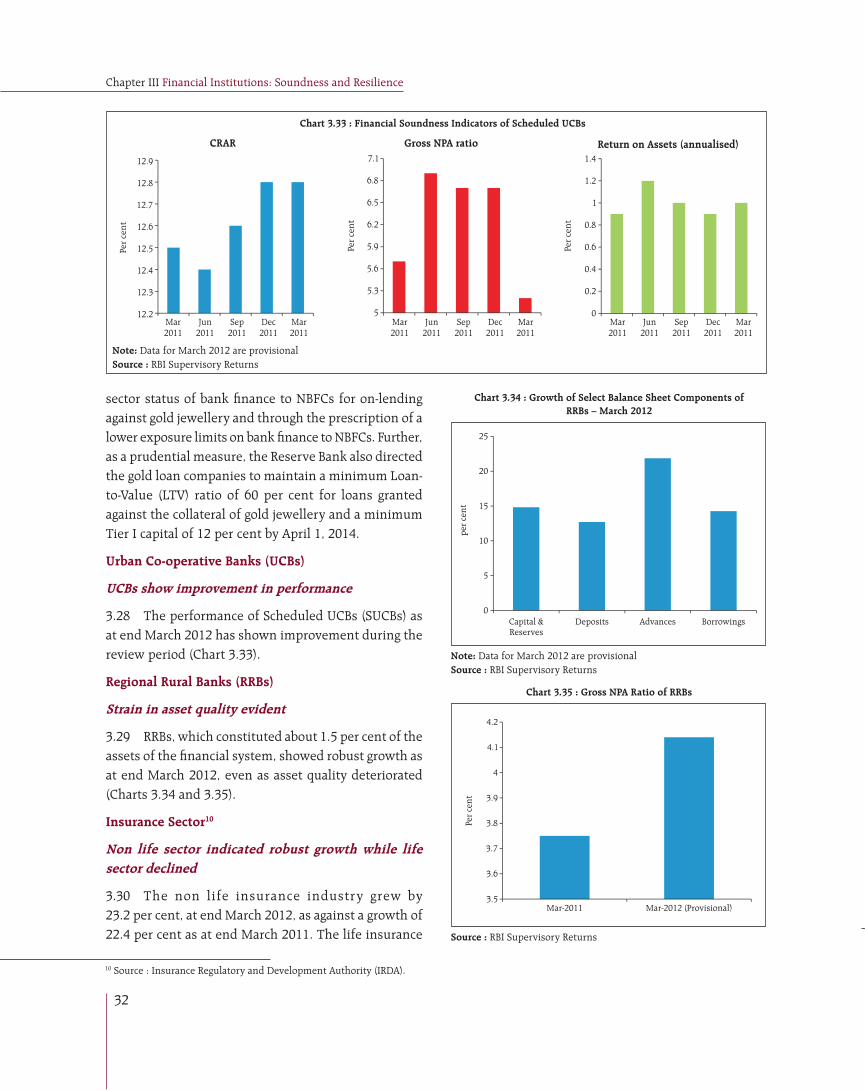
Chapter III Financial Institutions: Soundness and Resilience
32
sector status of bank fi nance to NBFCs for on-lending against gold jewellery and through the prescription of a lower exposure limits on bank fi nance to NBFCs. Further, as a prudential measure, the Reserve Bank also directed the gold loan companies to maintain a minimum Loan-to-Value (LTV) ratio of 60 per cent for loans granted against the collateral of gold jewellery and a minimum Tier I capital of 12 per cent by April 1, 2014.
Urban Co-operative Banks (UCBs)
UCBs show improvement in performance
3.28 The performance of Scheduled UCBs (SUCBs) as at end March 2012 has shown improvement during the review period (Chart 3.33).
Regional Rural Banks (RRBs)
Strain in asset quality evident
3.29 RRBs, which constituted about 1.5 per cent of the assets of the fi nancial system, showed robust growth as at end March 2012, even as asset quality deteriorated (Charts 3.34 and 3.35).
Insurance Sector10
Non life sector indicated robust growth while life sector declined
3.30 The non life insurance industry grew by 23.2 per cent, at end March 2012, as against a growth of 22.4 per cent as at end March 2011. The life insurance
Chart 3.34 : Growth of Select Balance Sheet Components ofRRBs – March 2012
Note: Data for March 2012 are provisionalSource : RBI Supervisory Returns
Chart 3.35 : Gross NPA Ratio of RRBs
Source : RBI Supervisory Returns
10 Source : Insurance Regulatory and Development Authority (IRDA).
Chart 3.33 : Financial Soundness Indicators of Scheduled UCBs
Note: Data for March 2012 are provisionalSource : RBI Supervisory Returns

Financial Stability Report June 2012
33
industry showed a decline of 9.2 per cent in the fi rst year premium collected in 2011-12, against a growth of 15.1 per cent in 2010-11.
Challenges lie ahead in wake of Solvency II regime
3.31 The Indian insurance sector is governed by a factor based solvency regime which is comparable toSolvency I11. This framework is rule based and refl ects various risks at the industry level while implicit margins embedded in various elements for valuing assets, liabilities and solvency margins make the solvency framework prudent and robust.
3.32 Solvency II is a risk-based regulatory regime that will apply to almost all insurance establishments in the European Union (EU). The regime introduces economic risk-based solvency requirements and aims to bring in a change in perception that capital is not the only mitigant against failures. Instead of statutory provisioning, Solvency II provides for provisioning based on the (market consistent) ‘Best Estimate’. Given that the joint venture partners of a number of insurance companies operating in India are EU based entities, the Indian operations have also been assessed for the purpose of Solvency II. While the level of preparedness of these entities would be much higher, greater challenges exist with respect to the public sector insurers both in the life and non-life segments.
3.33 The current capital regime in India is not in complete consonance with Solvency II and embarking on the framework would necessitate addressing a range of challenges in terms of assessment of risks, development of internal models, adequacy of data, capacity building both within IRDA and in the insurance industry. As a fi rst step in this direction, IRDA has set up a Committee to examine the solvency regime in select jurisdictions and to make its recommendations on the Solvency II regime in India.
Pension Funds12
3.34 India’s pension ecosystem is enormous and is growing rapidly. At one end of the spectrum are Defi ned Benefi t (DB) pension schemes of which the two main schemes are the pre-reform civil services pension
11 Solvency I is the name given to changes to the EU’s insurer solvency regime made in 2002. The changes aimed to establish a common prudential framework for insurance undertakings in EU based on the concept of minimum harmonisation and mutual recognition.12 Source: Pension Fund Regulatory and Development Authority (PFRDA).
scheme of the Centre/states (which has been replaced by the National Pension System for the new recruits) and the ‘organised sector’ social security scheme operationalised by the Employees’ Provident Fund Organisation (EPFO). Besides, in the defi ned benefi t category, there are a number of schemes which are run by the central and state governments, of which the largest is the Indira Gandhi National Old Age Pension Scheme. The state governments run a number of occupational pension schemes, a large number of which, relate to the trades in the unorganised sector and mainly target the population below the poverty line.
3.35 At the other end of the spectrum are the Defi ned Contribution (DC) Schemes of which the National Pension System (NPS) introduced from January 2004 is the most important addition to the Indian pension sector. The NPS was initially introduced as a replacement pension scheme for the civil services. The scheme was fi rst adopted by the central government and then by the state governments, except for West Bengal, Kerala and Tripura. In 2009, the NPS was extended to the private sector and, in 2010, the Government of India introduced a co-contribution scheme (called ‘Swavalamban’) on the NPS platform for the unorganised sector. The DC space is also populated by a number of schemes that are run by insurance companies for private individuals and corporates.
3.36 In the case of the DB schemes, the biggest challenge is the quantifi cation of the liabilities. Since the pre-2004 pension scheme is indexed to infl ation and wage increases recommended by the Pay Commission, it becomes diffi cult to project the pay-outs far into the future. The problem is compounded by the fact that it is a ‘Pay As You Go’ system which implies that this is an unfunded liability. Any large increase in the pension liability will have a direct impact on the fi scal defi cit. The 2012-13 budget estimated a total outfl ow of ̀ 631 billion on pensions and retirement benefits of central government employees alone, which is an increase of 12 per cent over the revised estimate of `561 billion in 2011-12. In the 1970s and 1980s, recruitment by the Government expanded rapidly, though it was contained
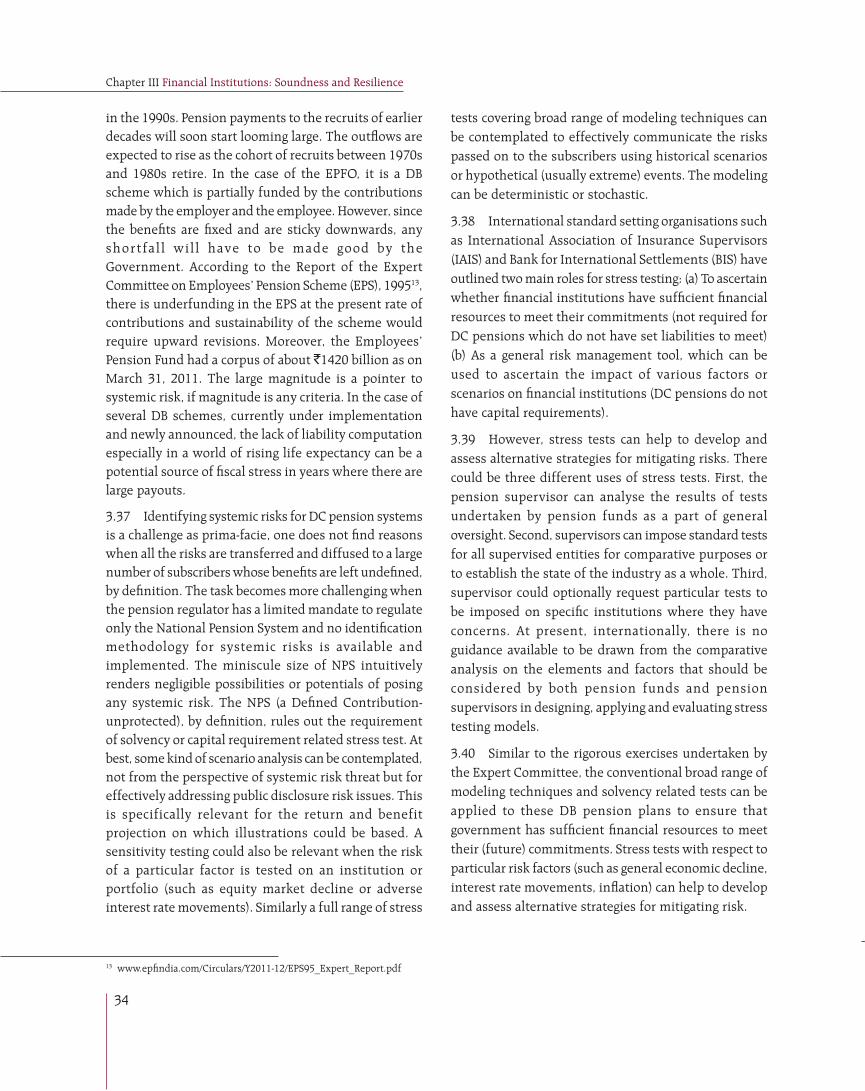
Chapter III Financial Institutions: Soundness and Resilience
34
in the 1990s. Pension payments to the recruits of earlier decades will soon start looming large. The outfl ows are expected to rise as the cohort of recruits between 1970s and 1980s retire. In the case of the EPFO, it is a DB scheme which is partially funded by the contributions made by the employer and the employee. However, since the benefi ts are fi xed and are sticky downwards, any shortfal l wil l have to be made good by the Government. According to the Report of the Expert Committee on Employees’ Pension Scheme (EPS), 199513, there is underfunding in the EPS at the present rate of contributions and sustainability of the scheme would require upward revisions. Moreover, the Employees’ Pension Fund had a corpus of about `1420 billion as on March 31, 2011. The large magnitude is a pointer to systemic risk, if magnitude is any criteria. In the case of several DB schemes, currently under implementation and newly announced, the lack of liability computation especially in a world of rising life expectancy can be a potential source of fi scal stress in years where there are large payouts.
3.37 Identifying systemic risks for DC pension systems is a challenge as prima-facie, one does not fi nd reasons when all the risks are transferred and diffused to a large number of subscribers whose benefi ts are left undefi ned, by defi nition. The task becomes more challenging when the pension regulator has a limited mandate to regulate only the National Pension System and no identifi cation methodology for systemic risks is available and implemented. The miniscule size of NPS intuitively renders negligible possibilities or potentials of posing any systemic risk. The NPS (a Defi ned Contribution-unprotected), by defi nition, rules out the requirement of solvency or capital requirement related stress test. At best, some kind of scenario analysis can be contemplated, not from the perspective of systemic risk threat but for effectively addressing public disclosure risk issues. This is specifically relevant for the return and benefit projection on which illustrations could be based. A sensitivity testing could also be relevant when the risk of a particular factor is tested on an institution or portfolio (such as equity market decline or adverse interest rate movements). Similarly a full range of stress
13 www.epfi ndia.com/Circulars/Y2011-12/EPS95_Expert_Report.pdf
tests covering broad range of modeling techniques can be contemplated to effectively communicate the risks passed on to the subscribers using historical scenarios or hypothetical (usually extreme) events. The modeling can be deterministic or stochastic.
3.38 International standard setting organisations such as International Association of Insurance Supervisors (IAIS) and Bank for International Settlements (BIS) have outlined two main roles for stress testing: (a) To ascertain whether fi nancial institutions have suffi cient fi nancial resources to meet their commitments (not required for DC pensions which do not have set liabilities to meet) (b) As a general risk management tool, which can be used to ascertain the impact of various factors or scenarios on fi nancial institutions (DC pensions do not have capital requirements).
3.39 However, stress tests can help to develop and assess alternative strategies for mitigating risks. There could be three different uses of stress tests. First, the pension supervisor can analyse the results of tests undertaken by pension funds as a part of general oversight. Second, supervisors can impose standard tests for all supervised entities for comparative purposes or to establish the state of the industry as a whole. Third, supervisor could optionally request particular tests to be imposed on specifi c institutions where they have concerns. At present, internationally, there is no guidance available to be drawn from the comparative analysis on the elements and factors that should be considered by both pension funds and pension supervisors in designing, applying and evaluating stress testing models.
3.40 Similar to the rigorous exercises undertaken by the Expert Committee, the conventional broad range of modeling techniques and solvency related tests can be applied to these DB pension plans to ensure that government has suffi cient fi nancial resources to meet their (future) commitments. Stress tests with respect to particular risk factors (such as general economic decline, interest rate movements, infl ation) can help to develop and assess alternative strategies for mitigating risk.

Financial Stability Report June 2012
35
Chart 3.36 : Credit Risk : Gross Credit- Distribution ofStressed CRAR of Banks
Source : Supervisory Data and RBI staff calculations
Table 3.3 : Credit Risk: Gross Credit - Impact on Capital and NPAs
(Except number of banks, fi gures are in per cent)
System Level Impacted Banks (CRAR < 9%)
Impacted Banks(Core CRAR < 6%)
CRAR Core CRAR
NPA Ratio
Number of Banks
Share in Total
Assets
Number of Banks
Share in Total Assets
Baseline:
All Banks 14.1 10.3 2.9 – – – –
Select 60 Banks
13.9 10.1 2.8 – – – –
Shock 1: 11.9 7.9 5.8 5 6.7 11 30.0Shock 2: 11.1 7.2 7.2 12 30.2 18 41.9Shock 3: 12.7 8.8 4.2 3 1.5 4 6.5
Shock 1: NPAs increase by 100 per centShock 2: NPAs increase by 150 per centShock 3: NPAs increase due to 40 per cent of restructured standard advances
turning NPAs
Source: Supervisory Data and RBI staff calculations
14 For methodology and details, please refer to the Annex.15 The results of the macro stress tests are discussed in Chapter V of this Report.
Resilience of Financial Institutions
3.41 The resilience of the fi nancial institutions was assessed through a series of stress tests which imparted extreme but plausible shocks14 based on supervisory data pertaining to end-March 2012. The resilience of SCBs to various stress scenarios was tested using both the top down and the bottom up approaches as also through a series of macro stress tests15. A number of single factor sensitivity stress tests were also carried out on scheduled UCBs and NBFC-ND-SIs (Non deposit taking systemically important NBFCs) to assess their vulnerabilities and resilience under various scenarios.
Scheduled Commercial Banks (SCBs)
3.42 A series of top down stress tests incorporating credit, foreign exchange, equity, interest rate and liquidity risks were carried out for the banking system (60 SCBs comprising 99 per cent of total banking sector assets). The same set of shocks were used by 25 select SCBs (comprising about 75 per cent of total assets) to conduct bottom up stress tests. The bottom up stress tests broadly refl ected the results of the top down stress tests and reconfi rmed the resilience of the banking system to a wide range of shocks.
Credit risk remains the main source of vulnerability for SCBs
3.43 The impact of shocks under different credit risk scenarios for banks as on March 2012 shows that the system level CRAR remained above the required minimum of 9 per cent and the system is reasonably poised to withstand the shocks; although some banks, including a few large banks, could be under stress as their CRAR would fall below 9 per cent (Table 3.3 and Chart 3.36).
Banks remain resilient to sectoral credit risk shocks
3.44 The analysis of a credit risk shock emanating from important sectors viz. agriculture, power, real estate, telecom and priority sector revealed that the maximum impact was seen in the case of shocks to the priority sector followed by shocks to the real estate and agriculture sectors. The banks were, however, able to absorb the shocks (Table 3.4).
Table 3.4 : Credit Risk: Sectoral – Impact on Capital and NPAs
(Per cent)
System Level
CRAR Core CRAR NPA Ratio
Baseline:
All Banks 14.1 10.3 2.9
Select 60 Banks 13.9 10.1 2.8
Shock: 5 percentage points increase in NPAs in each sector
Power 13.7 9.8 3.2Telecommunication 13.8 10.0 3.0Agriculture 13.4 9.6 3.5Real Estate 13.3 9.4 3.7All 4 Sectors : Agriculture + Power + Real Estate + Telecom
12.6 8.8 4.7
Priority Sector 12.8 8.9 4.4
Source: Supervisory Data and RBI staff calculations

Chapter III Financial Institutions: Soundness and Resilience
36
Table 3.6 : Interest Rate Risk: Banking Book-Impact on Banks (Except number of banks, fi gures are in per cent)
System Level Impacted Banks (CRAR < 9%)
Impacted Banks (Core CRAR < 6%)
CRAR Core CRAR
Number of Banks
Share in Total
Assets
Number of Banks
Share in Total
Assets
Baseline:
All Banks 14.1 10.3 – – – –
Select 50 Banks 13.9 10.1 – – – –
Net Impact on Banking Book (Earnings + Portfolio)
Shock 1 10.9 7.1 16 25.9 18 41.3Shock 2 13.9 10.1 0 0.0 0 0.0Shock 3 13.4 9.6 0 0.0 0 0.0Shock 4 12.0 8.3 3 3.4 7 10.5
Income Impact on Banking Book (Earnings)
Shock 1 13.8 10.0 1 1.8 1 1.8Shock 2 13.9 10.1 0 0.0 0 0.0Shock 3 13.8 10.1 0 0.0 0 0.0Shock 4 13.8 10.0 1 1.8 1 1.8
Valuation Impact on Banking Book (Duration Gap Analysis)
Shock 1 11.0 7.2 14 23.1 17 40.2Shock 2 13.9 10.1 0 0.0 0 0.0Shock 3 13.4 9.7 0 0.0 0 0.0Shock 4 12.1 8.4 2 1.5 7 10.2
Shock 1: Parallel upward shift in INR yield curve by 250 bpsShock 2: Parallel downward shift by 250 bpsShock 3: Steepening of the INR yield curve, with interest rates increasing by 100
bps linearly spread between 1-month maturity and more than 10 year maturity
Shock 4: Inversion of the INR yield curve with one-year rates shifting upwards linearly by 250 bps and 10-year rates dropping by 100 bps
Source: Supervisory Data and RBI staff calculations
16 The stress tests have been carried out on the assumption that (i) the SLR securities would be available for use during a period of system-wide run on deposits and (ii) only excess SLR securities are liquid. Five different defi nitions of liquid assets have been used involving different combinations of cash, CRR, Inter-bank-deposits and Investments.
Table 3.5 : Credit Risk: Concentration- Impact on Capital and NPAs
(Except number of banks, fi gures are in per cent)
System Level Impacted Banks (CRAR < 9%)
Impacted Banks (Core CRAR < 6%)
CRAR Core CRAR
NPA Ratio
Number of Banks
Share in Total
Assets
Number of Banks
Share in Total Assets
Baseline:
All Banks 14.1 10.3 2.9 - - - -
Select 60 Banks
13.9 10.1 2.8 - - - -
Shock 1 12.7 8.8 5.6 1 0.19 1 3.0Shock 2 12.2 8.3 7.8 1 0.19 2 5.1Shock 3 11.6 7.7 10.6 1 0.19 9 30.4Shock 4 12.3 8.4 7.5 1 0.19 2 5.1
Shock 1: Top individual borrower defaultsShock 2: Top two individual borrowers defaultShock 3: Top three individual borrowers defaultShock 4: Top group borrower defaults
Source: Supervisory Data and RBI staff calculations
Credit concentration risk was not signifi cant
3.45 A study of the concentration of credit portfolio of banks revealed that, at the system level, the concentration appeared moderate, though the degree of concentration was higher in some individual banks (Table 3.5). The average exposure of the banks to the largest group borrower stood at 4.7 per cent of total advances. The maximum exposure was, however, much higher at 26.1 per cent.
Banks able to withstand interest rate shocks
3.46 The resilience of SCBs to shocks involving both parallel and non-parallel shifts in the yield curve was assessed. The tests were carried out separately for the banking and trading books. The results carried out on the trading book suggest that the impact of interest rate risk would be limited and no bank is impacted adversely. The results of the banking book also suggest that the banking system could withstand the assumed stressed scenarios, though the CRAR of some individual banks slip below the regulatory minimum. The impact is maximum in case of a parallel upward shift of the INR yield curve by 250 basis points (bps) (Table 3.6 and Chart 3.37).
Impact of adverse exchange rate and equity price movements would be limited
3.47 The impact, of appreciation/depreciation of currencies by 10/20 per cent, on banks’ individual net open bilateral currency positions was assessed. The stress tests results indicate that the impact will not be signifi cant. The impact of a fall in the equity prices by 40 per cent on banks’ capital revealed that the shock has a marginal impact as the equity market exposure of banks was not very signifi cant. The system level CRAR fell to 13.4 per cent, under stress, from the baseline of 14.1 per cent. For all banks, the post-stress CRAR remained above 9 per cent.
SLR investments key in mitigating liquidity risks
3.48 Stress scenarios assessing the resilience of banks to liquidity risk16 evidenced deterioration in the liquidity position of some banks. The availability of Statutory
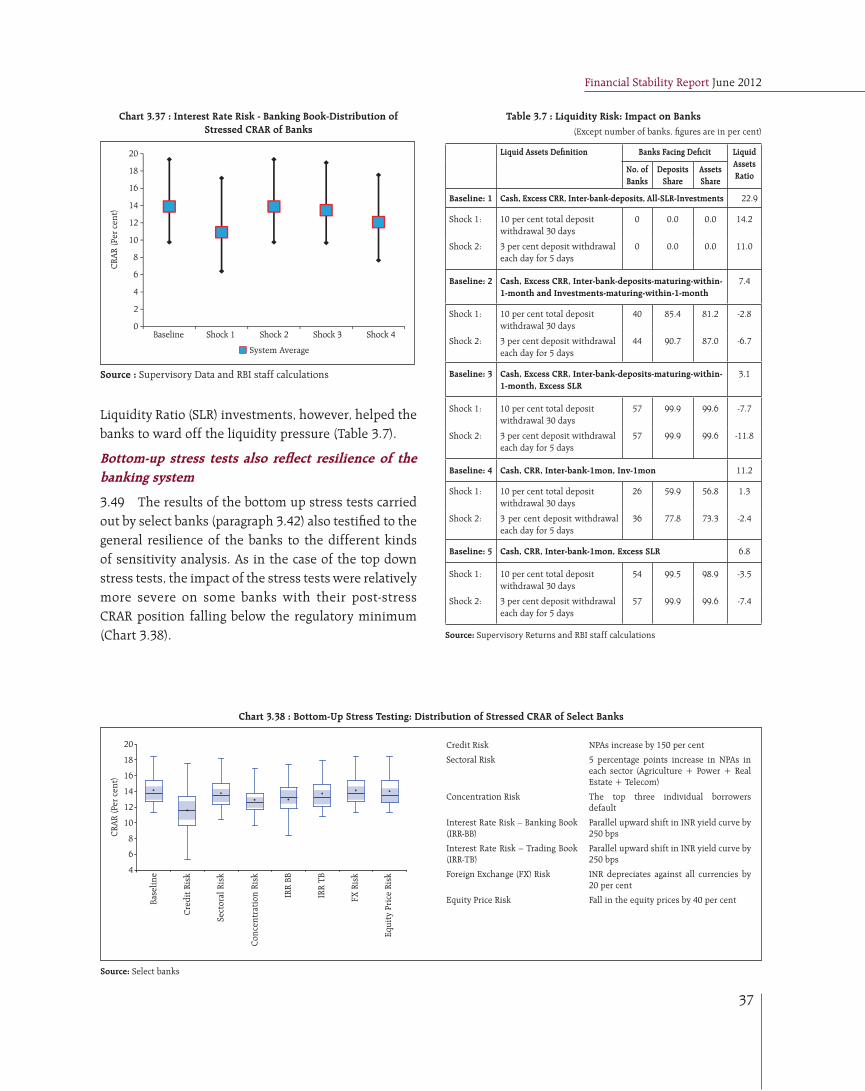
Financial Stability Report June 2012
37
Liquidity Ratio (SLR) investments, however, helped the banks to ward off the liquidity pressure (Table 3.7).
Bottom-up stress tests also refl ect resilience of the banking system
3.49 The results of the bottom up stress tests carried out by select banks (paragraph 3.42) also testifi ed to the general resilience of the banks to the different kinds of sensitivity analysis. As in the case of the top down stress tests, the impact of the stress tests were relatively more severe on some banks with their post-stress CRAR position falling below the regulatory minimum (Chart 3.38).
Chart 3.37 : Interest Rate Risk - Banking Book-Distribution of Stressed CRAR of Banks
Source : Supervisory Data and RBI staff calculations
Table 3.7 : Liquidity Risk: Impact on Banks(Except number of banks, fi gures are in per cent)
Liquid Assets Defi nition Banks Facing Defi cit Liquid Assets Ratio
No. of Banks
Deposits Share
Assets Share
Baseline: 1 Cash, Excess CRR, Inter-bank-deposits, All-SLR-Investments 22.9
Shock 1: 10 per cent total deposit withdrawal 30 days
0 0.0 0.0 14.2
Shock 2: 3 per cent deposit withdrawal each day for 5 days
0 0.0 0.0 11.0
Baseline: 2 Cash, Excess CRR, Inter-bank-deposits-maturing-within-1-month and Investments-maturing-within-1-month
7.4
Shock 1: 10 per cent total deposit withdrawal 30 days
40 85.4 81.2 -2.8
Shock 2: 3 per cent deposit withdrawal each day for 5 days
44 90.7 87.0 -6.7
Baseline: 3 Cash, Excess CRR, Inter-bank-deposits-maturing-within-1-month, Excess SLR
3.1
Shock 1: 10 per cent total deposit withdrawal 30 days
57 99.9 99.6 -7.7
Shock 2: 3 per cent deposit withdrawal each day for 5 days
57 99.9 99.6 -11.8
Baseline: 4 Cash, CRR, Inter-bank-1mon, Inv-1mon 11.2
Shock 1: 10 per cent total deposit withdrawal 30 days
26 59.9 56.8 1.3
Shock 2: 3 per cent deposit withdrawal each day for 5 days
36 77.8 73.3 -2.4
Baseline: 5 Cash, CRR, Inter-bank-1mon, Excess SLR 6.8
Shock 1: 10 per cent total deposit withdrawal 30 days
54 99.5 98.9 -3.5
Shock 2: 3 per cent deposit withdrawal each day for 5 days
57 99.9 99.6 -7.4
Source: Supervisory Returns and RBI staff calculations
Chart 3.38 : Bottom-Up Stress Testing: Distribution of Stressed CRAR of Select Banks
Credit Risk NPAs increase by 150 per cent
Sectoral Risk 5 percentage points increase in NPAs in each sector (Agriculture + Power + Real Estate + Telecom)
Concentration Risk The top three individual borrowers default
Interest Rate Risk – Banking Book (IRR-BB)
Parallel upward shift in INR yield curve by 250 bps
Interest Rate Risk – Trading Book (IRR-TB)
Parallel upward shift in INR yield curve by 250 bps
Foreign Exchange (FX) Risk INR depreciates against all currencies by 20 per cent
Equity Price Risk Fall in the equity prices by 40 per cent
Source: Select banks

Chapter III Financial Institutions: Soundness and Resilience
38
Urban Co-operative Banks
UCBs vulnerable to credit risk shocks…
3.50 Stress tests on credit risk were carried out for Scheduled UCBs (SUCBs) using their balance sheet data as at end-March 2012. The impact of credit risk shocks on the CRAR of the banks was assessed under two different scenarios assuming an increase in the gross NPA ratio by 50 per cent and 100 per cent respectively. The results show that SUCBs could withstand shocks assumed under the fi rst scenario easily, though it would come under some stress under the second scenario (Chart 3.39).
…as also to liquidity risks
3.51 Stress tests on liquidity risk were carried out under two different scenarios assuming an increase in cash outfl ows in the 1 to 28 days time bucket by 50 per cent and 100 per cent respectively. It was assumed that there were no changes in cash infl ows under both the scenarios. The banks were considered to be impacted if, as a result of the stress, the mismatch or negative gap (i.e. the cash infl ow less cash outfl ow) in the 1 to 28 days time bucket exceeded 20 per cent of outfl ows. The stress test results indicate that the SUCBs would be signifi cantly impacted even under the less severe stress scenario (Chart 3.40).
Non-Banking Financial Companies
NBFCs able to withstand credit risk shocks
3.52 A stress test on credit risk for NBFC-ND-SI sector for the period ended December 2011 was carried out under two scenarios assuming an increase in gross NPA by 200 per cent and 500 per cent respectively.
3.53 It was observed that, in the fi rst scenario, CRAR reduced marginally from 27.5 to 26.8 per cent, while in the second scenario CRAR reduced to 24.3 per cent.
Chart 3.39 : Impact of Shocks on Capital Position: SUCBs – Mar 2012
Note : Data for March 2012 are provisionalSource: Supervisory Data and RBI staff calculations
Chart 3.40 : Impact of Liquidity Risk Shocks: SUCBs – Mar 2012
Note : Data for March 2012 are provisionalSource: Supervisory Data and RBI staff calculations
The sector, thus, remained resilient even to the more severe stress scenario owing largely to its comfortable CRAR position. However, the CRAR of some individual NBFCs (accounting for around 5 per cent of total assets of NBFC-ND-SIs), fell to below the regulatory requirement of 15 per cent.

Financial Stability Report June 2012
39
Chapter IV
Financial Sector Regulation and Infrastructure
The fi nancial sector reform measures initiated in the aftermath of the global fi nancial crisis are being implemented by many countries, with the pace and extent of reforms varying across countries and markets. The standard setting bodies have come out with fi nal recommendations for policy reforms, and these need to be implemented after extensive study and debate to ensure that adverse impact of unintended consequences do not outweigh the intended benefi ts. In the Indian context, fi nal guidelines with respect to Basel III have been issued and a discussion paper on dynamic provisioning has been released. The unfi nished agenda includes convergence with International Financial Reporting Standards (IFRS), strengthening the oversight mechanism of the non-banking fi nancial sector, reforms in the Over the Counter (OTC) derivatives market and improving the resolution framework for fi nancial institutions. The payment and settlement system in the country continues to be robust, with increasing use of electronic modes of settlement. Certain concerns, viz., settlement lags in the RTGS System and large uncollateralised intra-day exposures to settlement banks being assumed by the Clearing Corporation of India Limited (CCIL) need to be addressed. Safety net arrangements have functioned smoothly, but issues relating to the adequacy and resilience of the deposit insurance fund remain.
Global regulatory reforms gathering pace, but implementation challenges will need to be addressed
4.1 International initiatives, started after the global fi nancial crisis, have gathered momentum and the policy framework for the reforms has crystalised. However, several implementation challenges are emerging.
4.2 Several countries have announced their respective national policy frameworks for migration to Basel III leading to concerns about cross border consistency. Gaps in implementation are also emerging, for instance, with respect to putting in place resolution frameworks for systemically important fi nancial institutions (SIFIs) and reforms in the OTC derivatives markets. Unintended consequences of the reform measures might pose challenges, especially to emerging markets such as India, which will need to be carefully monitored. One set of concerns relate to the potential deleveraging induced by the new capital and liquidity standards, affecting trade credit, infrastructure and project finance, etc. to emerging markets. There may not be a market in emerging economies for certain capital instruments, e.g. contingent capital instruments, which are being
proposed under Basel III. There are also concerns about the availability of a suffi cient quantum of ‘liquid’ assets prescribed under the Basel III liquidity norms and the impact of such requirements on domestic fi nancial markets.
Guidelines refl ecting the new international standards have been issued
4.3 The Reserve Bank, on May 2, 2012, issued fi nal guidelines on Basel III. The implementation of Basel III capital requirements will begin on January 1, 2013. The norms will be fully implemented by March 31, 20181. Under the new standards, banks will have to
maintain total capital of at least 9 per cent, tier 1 capital of 7 per cent and common equity tier 1 (CET1) of 5.5 per cent of risk weighted assets (RWAs) respectively;
create a capital conservation buffer in the form of common equity at 2.5 per cent of RWAs. The implementation of the capital conservation buffer will start from March 31, 2015.
1 Implementation has been advanced by nine months to make full implementation co-terminus with the fi nancial closure of banks on March 31 of every year.

Chapter IV Financial Sector Regulation and Infrastructure
40
4.4 As a prudential measure, the existing capital adequacy requirement in India is one per cent higher than the minimum prescribed by the Basel Committee, and the higher requirement will continue under Basel III. A more stringent leverage ratio has also been prescribed based on the fact that most Indian banks have a relatively comfortable leverage position, much more than the minimum of 3 per cent proposed by the Basel Committee. During the period of parallel run, banks should strive to maintain their existing level of leverage ratio but, in no case the leverage ratio should fall below 4.5 per cent. A bank whose leverage ratio is below 4.5 per cent may endeavour to bring it above 4.5 per cent as early as possible. Final leverage ratio requirements will be prescribed by the Reserve Bank after the parallel run, taking into account the prescriptions given by the Basel Committee.
4.5 The implementation of Basel III proposals are expected to be far reaching. For emerging economies like India, the implementation comes at a time when credit demand is expected to pick up, given the compulsions of growth; the investment needs of infrastructure; and the demand ushered in by increasing fi nancial inclusion. Simultaneously meeting the requirements of additional capital buffers and the growing credit needs of the economy may pose challenges. As the additional capital requirements, both equity and non-equity, are likely to increase over the period of full implementation of Basel III, this could put pressure on capital markets, increase the cost of capital and reduce return on equity, in the short-term for the banking system. The fi scal impact of the increased capital requirements of public sector banks has also to be reckoned with. However, in the medium to long term, the measures are expected to yield net benefi t to the banking system and to the economy at large. Also, the comfortable capital adequacy position of banks in India (CRAR at over 14 per cent and core CRAR at over 10 per cent as on March 31, 2012) under Basel II implies that banks will migrate to the Basel III requirements from a position of relative strength. The e xtended t rans i t ional a r rangement for fu l l implementation of Basel III provides suffi cient time to banks to carefully assess and raise the capital required.
4.6 The case for prescribing forward looking provisions for credit risk for Indian banks was highlighted in the previous FSR. The Reserve Bank has since issued draft guidelines on dynamic provisioning2. The dynamic provision created during a year has been quantifi ed as the difference between long run average expected loss (EL) of the portfolio for one year and the incremental specifi c provisions made during the year (Box 4.1).
Progress in convergence with IFRS has been tardy
4.7 Challenges to the IFRS convergence of the banking sector arise from a lack of clarity about the convergence schedule domestically, as also from the uncertainity in the finalisation of IFRS 9 relating to Financial Instruments. The uncertainties with respect to IFRS 9 arise, on account of delays in fi nalising the proposals relating to impairment and hedge accounting by the International Accounting Standards Board (IASB) coupled with recent proposals by IASB to reopen previously fi nalised requirements relating to classifi cation and measurement of fi nancial assets. There are also some major technical issues arising for Indian banks in the course of convergence. Differences between the IFRS and current regulatory guidelines on classifi cation and measurement of fi nancial assets, focus in the standard on the business model followed by banks and the challenges for management in this area, lack of adequate number of skilled staff and modifi cations to IT systems and processes are some of the other challenges that may need to be tackled in due course. As discussed in previous FSRs, a Working Group constituted by the Reserve Bank is examining the implementation issues.
The existing resolution regime in the country may need a revamp
4.8 The extant rules for resolution do not meet all the requirements of the Key Attributes of Effective Resolution Regimes for Financial Institutions adopted by the Financial Stability Board (FSB)3. In India, there is no explicit governance arrangement for resolution in the form of legal and institutional structures. At present, resolution of a bank is attempted under the Banking
2 RBI Discussion paper on “Introduction of Dynamic Provisioning Framework for Bank in India”, March 30, 2012 (http://rbi.org.in/scripts/BS_PressReleaseDisplay.aspx?prid=26219)3 http://www.fi nancialstabilityboard.org/publications/r_111104cc.pdf

Financial Stability Report June 2012
41
Regulation (BR) Act, 1949, through compulsory or voluntary mergers. One of the fundamental objectives of any resolution attempt is to protect the interests of the depositors. However, in the case of compulsory amalgamation under section 45 of the BR Act, 1949, shareholders are not completely precluded from getting compensation.
4.9 In order to examine the gaps in the extant resolution regime for fi nancial institutions in India vis-à-vis the ‘key attributes’ and to suggest the nature and extent of the legislative and regulatory changes needed
to address such gaps, a Working Group has been constituted in the Reserve Bank. The Sub Committee of the Financial Stability and Development Council (FSDC) is also deliberating on the issue.
Differences in RWA density could be accentuated as banks migrate to the Basel II advanced approaches
4.10 From a stability perspective, migration of banks, particularly large banks with international presence, to the advanced approaches under Basel II is desirable. When the banks migrate to these approaches, trends in RWAs will need to be monitored.
Indian banks make four types of loan loss provisions at present, viz., (a) general provisions for standard assets; (b) specifi c provisions for non performing assets (NPAs); (c) fl oating provisions; and (d) provisions against the diminution in the fair value of a restructured asset. The present provisioning policy was found to have the following drawbacks, (i) the rate of standard asset provisions has not been determined based on any scientifi c analysis or the credit loss history of banks; (ii) banks make fl oating provisions at their discretion without any pre-determined rules and not all banks make fl oating provisions; (iii) though the Reserve Bank has been following a policy of countercyclical variation of standard asset provisioning rates, the methodology has been largely based on current available data and judgement, rather than on an analysis of credit cycles and loss history, and hence the provisioning framework does not have countercyclical or cycle smoothening elements.
Advances in credit risk modeling over the last decade or so have introduced the concept of expected losses (EL) and unexpected losses (UL) to measure potential losses in a credit portfolio. It is generally accepted that banks should cover the unexpected losses by capital and expected losses by provisions. The EL is generally derived as the mean of the credit loss distribution. EL-based provisioning has forward-looking elements as it is capable of incorporating a through-the-cycle view of the probability of default. The Basel Committee also supports an EL approach that captures actual losses more transparently and is also less procyclical than the current ‘incurred loss’ approach.
The objective of the dynamic provisioning framework is to smoothen the impact of incurred losses on profi ts through the cycle, and not to provide general provisioning cushion for expected losses. The proposed dynamic provisioning framework in India consists of two components, viz.,
a. Ex-post specifi c provisions (SP) made during a year (which will be debited to the profi t and loss account), required as per RBI guidelines; and
b. Dynamic provisions (DP) equal to Ct – SP i.e., the difference between the long run average expected loss of the portfolio for one year and the incremental specifi c provisions made during the year ( represents EL and Ct
represents stock of loans).
It is assumed that when the approach is implemented for the fi rst time, the bank will have adequate SP to cover its NPAs. Positive value of Ct - SP will increase the credit balance in DP Account. A negative value will represent a drawdown from the DP Account. This will generally ensure that every year the charge to profi t and loss on account of specifi c provisions and DP is maintained at a level ofCt.
With respect to the implementation of a dynamic provisioning framework, not all banks can be expected to be on the same plane. Banks with available capability can introduce a DP framework based on the theoretical model, while the other banks can follow the standardised method, which is outlined in the draft guidelines. Internal estimates based on the data obtained from a sample of banks reveal that in terms of impact on the profi t and loss of banks, the approach would mean taking a total provisioning charge to profi t and loss account equivalent to 1.37 per cent of the gross advances annually. Supervisory data show that during the period from 2003 to 2010, average annual charge to profi t and loss on account of standard asset provisions and specifi c provisions gross of write-offs amounted to 1.04 per cent of gross advances, in the range of 0.58 per cent to 1.87 per cent of the gross advances. The additional charge is mainly attributed to calibration of based on downturn Loss Given Default (LGD).
Box 4.1: Introduction of Dynamic Loan Loss Provisioning Framework for Banks in India

Chapter IV Financial Sector Regulation and Infrastructure
42
4.11 Capital ratios are key indicators of a bank’s solvency and resilience. RWAs are key to the computation of capital ratios of banks with the proportion of RWAs to Total Assets (RWA density) serving as an indicator of a bank’s riskiness. However, signifi cant differences in the RWA density are observed across jurisdictions (Chart 4.1). Such differences are also observed across banks in the same jurisdiction. For the most part, the differences in RWA density are risk-based i.e. they reflect the differences in the riskiness of the underlying portfolio and of the bank’s business mix. Variations also arise due to differences in the stage of regulatory evolution – Basel I, Basel II, rollout of the advances approaches, etc. and use of national discretion in this regard. Concerns, however, emerge in respect of the variations which arise due to differences in interpretation of the standards and lead to practice-based inconsistencies in the calibration of risk parameters.
4.12 In the Indian context, credit risk is by far the largest component of RWAs representing, on an average, 71 per cent of total RWAs for the banking sector (Chart 4.2). There are, however, signifi cant differences in the RWA density across banks, though for the scheduled commercial banks (SCBs) as a whole, RWA density has been increasing over time (Charts 4.3 and 4.4).
…leading to potential diminishing trust in capital ratios
4.13 The gradual shift from Basel I to Basel II and to the Internal Rating Based approaches has enabled banks
Chart 4.1: RWA Density across Regions (Per cent)
Source: IMF Working Paper - Revisiting Risk-Weighted Assets “Why Do RWAs Differ Across Countries and What Can Be Done About It ?”, March 2012
Chart 4.2: Contribution to RWAs of SCBs
Source : RBI Supervisory Returns
Chart 4.3: RWA Density across bank groups – Mar 2012
Source : RBI Supervisory Returns
Chart 4.4: RWA Density of SCBs (Per cent)
Source : RBI Supervisory Returns

Financial Stability Report June 2012
43
to benefi t to some extent from lower RWAs. Perceived differences in RWAs within and across countries have, however, raised questions about the reliability of RWAs and capital ratios.
4.14 The Basel Committee, as part of its comprehensive monitoring of the implementation of Basel III, has proposed, inter alia, to identify areas of material inconsistencies in the calculation of RWAs. The fi ndings of the exercise could result in policy recommendations to address the identifi ed inconsistencies.
Closer monitoring of banks’ interaction with Non Banking Financial Companies (NBFCs) and Mutual Funds is warranted...
4.15 International efforts at strengthening the oversight and regulation of shadow banking activities continue. The challenge in regulating this segment is to ensure that all signifi cant players are brought under regulation, while ensuring that there are no incentives to migrate to the less stringently regulated segments. The policy reforms are presently focusing on fi ve key areas, viz., (a) mitigation of the spill-over effect between the regular banking system and the shadow banking system; (b) reducing the susceptibility of money market funds to ‘runs’; (c) assessing and mitigating systemic risks posed by other shadow banking entities; (d) assessing and aligning the incentives associated with securitisation; and (e) dampening risks and pro-cyclical incentives associated with secured fi nancing contracts such as repos, and securities lending that may exacerbate funding strains in times of ‘runs’4.
... given the interconnectedness between different segments of the fi nancial system
4.16 The non banking fi nancial sector in the country comprising, inter alia, NBFCs, mutual funds and insurance companies, functions within a regulatory framework appropriate to the activities undertaken by these entities. Nonetheless, a complete macro mapping of all kinds of credit intermediation activities would be warranted in the light of international reforms in this area. Further, there are concerns posed by the degree of interconnectedness of these entities with the banking
system which could pose credit and liquidity risks (Chapter V).
4.17 Some concerns are also posed by the degree of reliance of the mutual funds sector, especially the Money Market Mutual Funds, on institutional investors. In times of stress, withdrawal of funds by such investors could pose severe liquidity strains, as was observed in 2008-2009.
Regulatory gaps being identifi ed and plugged…
4.18 Gaps in the regulation of the non banking fi nancial sector are being continuously identifi ed and plugged and the oversight mechanism strengthened. The need for a regulatory framework for Alternative Investment (AI) Funds, which had been flagged in previous FSRs, was discussed by FSDC Sub Committee, and the Securities and Exchange Board of India (SEBI) has since put in place a framework for the same. In cognition of the risks posed to the banking system on account of their exposure to NBFCs extending gold loans, exposure limits of banks to NBFCs have been tightened while loan to value (LTV) ratios have been prescribed on gold loans extended by NBFCs. Similar LTV ratios have not been prescribed for the banking system and this may necessitate a relook, going forward.
Global initiatives for systemically important insurance companies may not affect Indian companies…
4.19 The International Association of Insurance Supervisors (IAIS), in conjunction with FSB, is in the process of developing a methodology to assess the systemic importance of insurers. The methodology will take congisance of the nature of insurance activities and the risks posed to the stability of the fi nancial system. It is likely to include a range of parameters including nature of operations of the entity, i ts s ize, interconnectedness and substitutability, and its global activity. The IAIS is in the process of collating and analysing data in this regard. The Life Insurance Corporation of India participated in the fi rst phase of this exercise. However, only some of the indicators being considered by the IAIS may be relevant in the Indian context given the nature of insurance operations in India and the extant regulatory framework. Further, the level
4 http://www.fi nancialstabilityboard.org/press/pr_111027.pdf

Chapter IV Financial Sector Regulation and Infrastructure
44
of global operations of Indian companies is limited and their exposure to complex fi nancial products almost non-existent.
Potential mis-selling under the Bancassurance model will need to be addressed
4.20 Bancassurance refers to the insurance distribution model where insurance products are sold through the bank branch network. The model has acquired popularity in the Indian context as many large banking groups in the country are also promoters of insurance companies. Further, the geographical reach of banks has made them ideal vehicles for the distribution of insurance products. Instances of mis-selling of insurance products through this delivery channel have been evidenced, though there are extant regulatory requirements mandating that bank staff handling the sale of insurance products be adequately trained. There is also some anecdotal evidence of insurance products being sold as a ‘package’ along with banking products such as deposits and loans, raising issues of conflict of interest. The proposed
regulations on Investment Advisors by SEBI and on Bancassurance by the Insurance Regulatory and Development Authority (IRDA) are likely to address the issue. Concerted efforts to educate customers in this regard will also be necessary.
Financial Market Infrastructure (FMI)
The country’s FMI functioned smoothly despite heightened market volatility
4.21 The payment and settlement systems in the country remained robust and continued to function without any major disruption. The FMI displayed a significant degree of resilience, with central counterparties in different segments managing the impact of heightened volatility in various markets, including the foreign exchange markets (Box 4.2).
Liberalisation of access criteria provided a fi llip to electronic payment systems
4.22 The shift towards electronic modes of settlement continued, with the value of transactions settled through
The year 2011-12, and especially the period under review, witnessed heightened volatility (Chapter 2). The increased volatility and the sharp depreciation in the value of the Indian rupee resulted in signifi cant changes in the marked to market (MTM) margin liability of the members of CCIL’s forex segment, with the impact depending on the net currency positions of the participants.
Managing the risks necessitated increase in initial margins and, in also in some instances of increase in variation margins. On a few occasions, heightened intraday volatility resulted in the margin cover being reduced by more than 50
per cent warranting the collection of intraday MTM margins (Table 4.1 and Chart 4.5).
Table 4.1: Details of Imposition of Volatility Margin during 2011-12
Date Forex Forward Segment (%)
Forex Settlement segment (%)
22-Sep-11 to 26-Sep-11 37.5 0.25
28-Oct-11 to 31-Oct-11 5.0 -
09-Nov-11 to 11-Nov-11 2.5 -
01-Dec-11 to 02-Dec-11 5.0 -
16-Dec-11 to 19-Dec-11 27.5 0.25
27-Jan-12 to 30-Jan-12 2.5 -
Box 4.2: Increased volatility in the foreign exchange market and CCIL’s US$/INR settlement

Financial Stability Report June 2012
45
the Real Time Gross Settlement (RTGS) system accounting for over 74 per cent of total settlement values as at end March 2012. Volume wise, the share of retail electronic transactions grew from 37 per cent in March 2011 to about 45 per cent in March 2012.
4.23 The migration of payment transactions to RTGS and National Electronic Fund Transfer (NEFT) settlement modes is likely to gain impetus from the liberalisation of access criteria to electronic payment systems5. So far, the centralised electronic payment systems provided for only direct membership. The sub-membership route has been enabled for all licensed banks to participate in NEFT and RTGS systems. Such sub-membership would be an alternate mechanism to licensed banks which have the technological capabilities but are not participating in centralised payment systems on account of access criteria or cost considerations.
Risks minimised in RTGS… but effi cacy of intraday liquidity management varies across participants
4.24 RTGS systems permit transactions to be settled deal by deal and in real time, thus attempting to eliminate systemic and settlement risks. Specifi cally, RTGS can substantially contribute to the reduction in the duration of credit and liquidity exposures in payment and settlement systems. In the Indian context, an empirical analysis of the settlement lags in the RTGS6 reveals that 70 per cent of average daily transactions (constituting 65 per cent of the average daily settlement amount) are settled instantaneously (Chart 4.6). This is facilitated by proactive intraday liquidity management by banks7, provision of intraday liquidity by the central bank and the ‘double duty’ performed by prudential reserve balances maintained by banks. Nevertheless, nearly 25 per cent of transactions (by amount) are settled with a lag of more than one minute while 15 per cent are settled with a lag of more than 10 minutes. There are also large variations observed with respect to settlement lags amongst different participants of the RTGS system. The underlying trends, especially with regard to the outliers will need to be carefully monitored (Charts 4.7 and 4.8).
5 http://rbi.org.in/scripts/Notifi cationUser.aspx?Id=7113&Mode=06 The empirical analysis used individual transaction data from the RTGS for 15 working days in the month of March 2012.7 Several large participants of RTGS have procured intraday liquidity management systems which enables them to manage payment queues internally.
Chart 4.6: Settlement lags in RTGS
Source: RBI
Chart 4.7 Daily average customer transactions settled within one minute
Source: RBI
Chart 4.8 Daily average interbank transactions settled within one minute
Source: RBI

Chapter IV Financial Sector Regulation and Infrastructure
46
Designated settlement banks (DSBs) of CCIL act as quasi payment systems….
4.25 Quasi-payment systems are generally defi ned as “Commercial institutions responsible for clearing and settling payments on behalf of customers which represent, by value, a substantial percentage of payments …. being settled across the books of the institution rather than through an organised payment system”.8 Risks posed by such institutions are similar to those posed by systemically important payment systems.
4.26 The risks arising from the concentration of associate members in the Collateralised Borrowing and Lending Obligation (CBLO) and securities segments of CCIL in two DSBs were highlighted in the FSR of December 2011. The risks are exacerbated by the fact that the DSBs themselves are large participants (with proprietary positions) in most market segments. An analysis of the settlement volumes indicates that associate members account for a signifi cant proportion of the settlement volumes (Chart 4.9). The DSBs, thus, act as quasi payment settlement systems and the risks they pose to the overall system will need to be monitored.
….necessitating CCIL to assume large intraday exposures to the DSBs
4.27 The large settlement values of the associate members result in CCIL assuming signifi cant intraday exposures to the DSBs (on account of the pay-in made by the associate members to the DSB) (Chart 4.10). CCIL has sanctioned limits for each of the DSBs, which are uncollateralised. There are also instances of exposure to the DSBs being in excess of the limits. Failure of one or more DSBs could pose systemic concerns and the trends in this regard need to be assessed vis-à-vis CCIL’s financial resources, its liquidity and credit risk management framework and extant regulatory prescriptions on the capital adequacy norms for banks’ exposures to central counterparties (CCPs)9. The Basel Committee is also working on the issues related to the appropriate capitalisation of banks’ exposure to CCPs. At present, exposures to CCPs under Basel II attract zero exposure value.
8 “Central bank oversight of payment and settlement systems”, BIS, May 20059 The exposures to CCPs on account of derivatives trading and securities fi nancing transactions ( e.g. CBLOs, Repos) outstanding against them, are currently assigned zero exposure value for counterparty credit risk, as it is presumed that the CCPs’ exposures to their counterparties are fully collateralised on a daily basis, thereby providing protection for the CCP’s credit risk exposures. Deposits / collateral kept by banks with CCIL, however, attract 20 per cent risk weight. (http://rbi.org.in/scripts/BS_CircularIndexDisplay.aspx?Id=5001).
Chart 4.9: Average settlement values of associate members asper cent of total settlement values
Source: CCIL
Chart 4.10 CCIL’s exposures to Designated Settlement Banks
Source: CCIL

Financial Stability Report June 2012
47
4.28 Available evidence suggests that the DSBs, in turn, extend intraday liquidity to the associate members including equity market players. If the associated risks are not rigorously managed by the DSBs, they could further exacerbate the risks faced by the CCP. Going forward, however, the Basel III liquidity risk framework, which incorporates effective management of intraday liquidity, may alleviate these risks.
OTC Derivative markets
Delays in implementing OTC derivative market reforms observed internationally
4.29 Several issues and challenges facing the OTC markets in India, viz., skewed participation structure, need for greater standardisation, introduction of central clearing, etc., were highlighted in previous FSRs. Even as these issues remain relevant, challenges are posed by the international reforms agenda for OTC derivatives viz., “all standardised OTC derivative contracts be traded on exchanges or electronic trading platforms, where appropriate, and cleared through central counterparties by end-2012”. The FSB has observed delays in both rule making and implementation of the reform process across G20 jurisdictions. Certain exceptions for some derivative products, e.g. foreign exchange forwards, are, however, under consideration.
4.30 In the case of India, the market for OTC derivatives has developed in a calibrated manner along with, in most cases, a concomitant regulatory framework. CCP arrangements already exist in the country for foreign exchange forward contracts involving the domestic currency. Similar arrangements are being contemplated for other products. However, markets such as that for Credit Defaults Swaps are in a nascent stage and extant volumes do not warrant centralised settlements. The existing reporting arrangements for OTC derivatives encompass foreign exchange, interest rate, government securities, corporate bonds and money market instruments and are being strengthened, as was discussed in previous FSRs. Going forward, the key
10 “Thoughts on determining central clearing eligibility of OTC derivatives”, Bank of England, Financial Stability Paper No. 14, CheSidanius and Anne Wetherilt, March 201211 Financial Stability Report, (December 2010, Paragraphs 3.48) includes an analysis of concentration risks posed by OTC derivatives market in India (http://www.rbi.org.in/scripts/BS_PressReleaseDisplay.aspx?prid=23666)12 The sudden dip in volume observed in March 2012 is largely due to reduction in notional positions as a result of trade compression introduced by CCIL recently, as was discussed in previous FSRs.
priority for Indian markets would be greater standardisation of OTC products, introduction of central clearing arrangements for a greater number of such products and reporting of all OTC trades to the trade repository.
Volumes in the Interest Rate Swap (IRS) market in India could warrant centralised settlement….
4.31 Low volumes in some derivative markets make it challenging to introduce guaranteed clearing for such products. A recent Bank of England report10, which attempts to construct a defi nition for “central clearing eligibility” of a product, observed that liquidity is a key determinant in a central counterparty’s decision to clear a product and that the systemic risk reduction benefi ts of central clearing can be achieved only when contracts meet this eligibility criteria.
4.32 In the Indian context, IRS, launched in 1999, is the only OTC derivative product where the market volumes have grown substantially. The growth has been particularly marked in the case of the overnight index swap based on the overnight money market index (Chart 4.11). The participation structure in the market, however, remains skewed with foreign banks dominating the IRS market11.
Chart 4.11 Outstanding notional IRS volumes at the end of the month12
Source: CCIL

Chapter IV Financial Sector Regulation and Infrastructure
48
…but will necessitate robust risk management by the CCP and potentially onerous margin requirements
4.33 Central clearing of IRS trades will shift the primary responsibility of managing counterparty risks to the CCP. It is, thus, critical that the CCP has adequate fi nancial resources and exercises effective risk control. The CCP will need to, inter alia, design margin and other risk management requirements which account for the complexity of the underlying instruments and maintain suffi cient liquid resources to ensure settlement under a wide range of potential stress scenarios. Further, the overall cost to participants of central clearing of derivative transactions will need to be assessed as margin requirements could be very high for some banks during volatile times. As all positions will need to be collateralised, shifting IRS transactions to a CCP could entail large collateral requirements.
4.34 The concentration risks arising from the gamut of activities carried out by CCIL have been fl agged in previous FSRs. Additionally, entrusting the responsibility of centralised clearing of IRS trades or any other OTC derivative trades to CCIL could add to these risks and will have to be contingent on a thorough assessment of its ability and fi nancial resources, including liquidity resources, to handle extreme market situations.
Bilateral margins for OTC derivatives may have systemic implications
4.35 Migration of all OTC derivative contracts to central clearing will be challenging and may also not be desirable as OTC products can perform a valuable function of offering customised contracts to suit individual hedging requirements. These contracts, however, will continue to engender counterparty and systemic risks. Bilateral margins on non-centrally cleared products are, thus, being contemplated internationally to reduce the systemic risks arising from such products and for creating incentives for centralised clearing. Such margins may need to be considered in the Indian context also, after weighing the advantages against the systemic implications of the increased collateral requirements. The potential benefi ts of margin requirements could be partially offset by the impact arising from the need to
13 Principles for fi nancial market infrastructures, April 2012 (http://www.bis.org/publ/cpss101.htm)
provide high-quality, liquid collateral, especially at a time when the Basel III liquidity requirements will create additional demand for similar securities. IMF’s recent Global Financial Stability Report (April 2012) has also highlighted that “heightened uncertainty, regulatory reforms and the extraordinary post-crisis responses of central banks in the advanced economies have been driving up demand for safe assets… even as the supply of such assets has contracted,… with negative implications for global fi nancial stability”.
New and demanding international standards issued for FMIs……
4.36 New international standards for payment, clearing and settlement systems were issued in April 2012 by the Committee on Payment and Settlement Systems (CPSS) and the Technical Committee of the International Organization of Securities Commissions (IOSCO)13. The new standards (called “principles”) will be applicable to all systemically important payment systems, central securities depositories, securities settlement systems, central counterparties and trade repositories (collectively “fi nancial market infrastructures” or “FMIs”). The set of 24 principles is designed to ensure that the essential infrastructure supporting global fi nancial markets is robust and better placed to withstand fi nancial shocks. They encompass issues related to the legal basis and the governance framework of the FMI, its credit, liquidity and operational risk management framework, settlement systems, default management, access criteria and the effi ciency and transparency of FMI’s.
…necessitating assessment of compliance of domestic FMIs with the Principles
4.37 Compared with the current standards, the new principles pose more stringent requirements in important areas like financial resources and risk management procedures of an FMI, default handing and the mitigation of business and operational risk. In the Indian context, previous formal assessments observed the country’s FMIs to be broadly compliant with the then prevalent international standards e.g. the Core Principles for Systemically Important Payment Systems, Recommendations for Securities Settlement Systems

Financial Stability Report June 2012
49
and Risk Management Principles for Central Counterparties. Going forward, the degree to which domestic FMIs observe the new principles will need to be evaluated.
Legal amendments will be necessary to ensure orderly handling of a FMI default
4.38 Given the criticality of the functioning of FMIs, the risks which FMIs can pose to fi nancial stability in the event of a default, warrants that an effective resolution mechanism be put in place to ensure orderly winding up of such entities. The FSB’s Key Attributes of Effective Resolution Regimes for fi nancial institutions14 are also applicable for FMIs.
4.39 In the Indian context, currently, there is no provision in the RBI Act, 1934, or the Payment and Settlement System (PSS) Act, 2007, which enable the recapitalisation, orderly winding up or reorganisation of FMIs regulated by the Reserve Bank. In the absence of a specifi c legal mandate, the insolvency proceedings as laid down under the general law would be applicable. Compliance with the Key Attributes would necessitate that the Reserve Bank is conferred with adequate powers for effective resolution of the FMIs regulated by it, such as CCPs and payment systems through appropriate amendments to the PSS Act.
14 http://www.fi nancialstabilityboard.org/publications/ r_111104cc.pdf15 See Financial Stability Report, Issue No. 1, March 2010 for a complete description of the coverage of deposit insurance in India (http://www.rbi.org.in/scripts/BS_PressReleaseDisplay.aspx?prid=22230)
Chart 4.12: Share of insured deposits of different categories of banks
Source: DICGC
Chart 4.13: Cross-Country Comparison of Coverage Levels at end-2010 (absolute level and % of per capita GDP)
Source: FSB Thematic Review of Deposit Insurance Systems: Peer Review Report
Safety net arrangements
The Coverage and Reserve Ratio of the deposit insurance fund remains low…
4.40 In India, deposit insurance is mandatory for all banks. Deposit insurance is provided by the Deposit Insurance and Credit Guarantee Corporation (DICGC), a wholly owned subsidiary of the Reserve Bank of India (Chart 4.12).15 The coverage levels of the deposit insurance in India, both in terms of absolute amount and as a percentage of per capita GDP, remain low as compared to international standards (Chart 4.13). The Reserve Ratio (ratio of fund balance to insured deposits),

Chapter IV Financial Sector Regulation and Infrastructure
50
which stood at 1.4 per cent as at end March 2012, is also low as compared to peer emerging market economies, though a target reserve ratio has not been prescribed for India (Chart 4.14).
…. Necessitating exploring options to strengthen DICGC’s fund base
4.41 Bank failures in the Indian context have typically taken place in the case of banks in the co-operative sector. DICGC’s fund, as per current coverage levels, may not be adequate in the event of a large bank failing. Several options, for instance, income and service tax exemption for the Corporation, hiking the premium charged, provision for emergency liquidity support, etc. may need to be explored with a view to strengthening the fund.
FSB Peer review of deposit insurance systems throw up several lessons for DICGC
4.42 The FSB recently undertook a peer review of deposit insurance systems16 among its member institutions based on the Basel Committee on Banking Supervision – International Association of Deposit Insurers (BCBS-IADI) Core Principle for Effective Deposit Insurance Systems. Several recommendations of the peer review report are particularly relevant for India and will need to be carefully examined. These include:
i. review of coverage levels to ensure that it strikes an appropriate balance between depositor protection and market discipline;
ii. prompt depositor reimbursement in situations when payout is the only choice to deal with a
16 http://www.fi nancialstabilityboard.org/press/pr_120208.pdf
bank failure; this needs to be supported by comprehensive and prompt access to bank data, early information access via a single customer view, and robust information technology infrastructure;
iii. strengthening the degree of coordination between the deposit insurance agency and other safety net players to ensure effective resolution planning and prompt depositor payment; and
iv. unambiguous and immediate access to reliable funding sources (including any back-up funding options) to meet the fi nancing requirements.
Source: FSB Thematic Review of Deposit Insurance Systems: Peer Review Report
Chart 4.14: Cross-Country Comparison of Reserve Ratios at end-2010

Financial Stability Report June 2012
51
Chapter V
Systemic Risk Assessment
The Systemic Risk Survey, the second in the series conducted by the Reserve Bank, revealed that fi nancial sector stakeholders continued to repose confi dence in the stability of the domestic fi nancial system. The level of confi dence, however, seems to have diminished since the previous Survey. Market volatility emerges as the chief concern of respondents along with the risks associated with high levels of fi scal and current account defi cits. Policy risk (including perceived slowdown in policy making) also emerges more prominently in the current Survey. The Systemic Liquidity Indicator pointed to some stress in liquidity conditions during March and April as the banking system’s liquidity defi cit remained consistently in excess of the Reserve Bank’s stated comfort zone. Some concerns emerged from the rising trend of short term borrowings of banks especially as the systemic importance of some banks has increased over the last one year. Insurance companies and Mutual Funds (MFs) remain vulnerable to contagion risks from the banking system while banks continue to rely on these segments for their funding needs. The results of a series of stress tests carried out to study the impact of various adverse macro-fi nancial shocks on the health of banks showed that the banking system remained resilient even under extreme stress scenarios. An assessment of the stability of the banking system conducted through a series of Banking Stability Measures (BSMs) indicated that distress dependencies amongst banks had increased in recent periods but remained well below the levels observed during the global fi nancial crisis in 2008-09.
Systemic Risk Survey
5.1 The fi rst Systemic Risk Survey was conducted by the Reserve Bank in October 2011 to capture the views of market participants and other stakeholders on the aggregate risks facing the fi nancial system. The second Survey was conducted in April 2012.
Volatility in the fi nancial markets voted the primary concern
5.2 The second Survey reveals that stakeholders perceive volatility in the markets as the single most important risk facing the fi nancial system, followed by global and fi scal risks. Asset quality, which was perceived to be the most signifi cant risk in the previous Survey, emerged as the second most signifi cant risk in this Survey. Respondents felt that risks from the twin defi cits and from perceived slowdown in policy making have increased sharply since the last Survey (Chart 5.1 and Chart 5.2)1.
Risks emanating from infl ation most diffi cult for the country to manage
5.3 Survey respondents felt that managing infl ation continues to be the biggest challenge for the country
Chart 5.1: Specifi c risks identifi ed in the Risk Survey, October 2011
Chart 5.2: Specifi c risks identifi ed in the Risk Survey, April 2012
1 The bars in Charts 5.1 and 5.2 represent the weighted aggregate of number of respondents who have identifi ed the corresponding risk, the weights representing the probability assigned by the respondent to the occurrence of the risk.

Chapter V Systemic Risk Assessment
52
(Chart 5.3). For Survey respondents from financial
institutions, asset quality and funding risks remained
the most diffi cult to manage (Chart 5.4).
Perceived risks to domestic fi nancial stability increased
5.4 About 43 per cent of the respondents felt that
the probability of a systemic event impacting the global
fi nancial system in the short term is ‘high’, while 46
per cent thought that the probability was ‘high’ in the
Chart 5.3: Risks most diffi cult for the country to manage Chart 5.4: Risks most diffi cult for fi nancial institutions to manage
Survey Responses on the probability of a ‘high’ impact event in the global fi nancial system (per cent)
Chart 5.5: In the short term Chart 5.6: In the medium term
medium term. This represents a departure from the earlier Survey where over 60 per cent of the participants felt that the probability of a systemic event impacting the global fi nancial system in the short run was ‘high’. Respondents felt that the risks to the stability of the domestic fi nancial system in the medium term had increased (Charts 5.5 to Chart 5.8).
5.5 The Survey result also revealed that an increasing number of respondents felt that the impact of a global

Financial Stability Report June 2012
53
systemic event on the domestic fi nancial system will be ‘high’ (Table 5.1).
5.6 The Survey respondents continued to repose confi dence in the stability of the domestic fi nancial system with 25 per cent of the respondents being ‘very confi dent’ in the stability of the domestic fi nancial system while another 67 per cent of the respondents were ‘fairly confi dent’. The level of confi dence had, however, diminished relative to October 2011, when the fi rst Survey was conducted. More than half of the respondents were ‘not very confi dent’ in the stability of the global fi nancial system (Table 5.2).
Systemic Liquidity Indicator
Liquidity defi cit remained outside Reserve Bank’s stated comfort zone
5.7 During the period under review, the banking system’s liquidity deficit remained consistently in excess of the Reserve Bank’s stated comfort zone, driven mainly by transient factors like build-up of Government cash balances, rise in currency in circulation, advance tax outfl ows and other factors such as forex market operations by the Reserve Bank.
5.8 The Reserve Bank began injecting liquidity into the system through Open Market Operations (OMOs) from November 24, 2011 and injected around ` 1,247 billion of primary liquidity during 2011-12. The average
Table 5.1: Impact of a Global Systemic Event on the Domestic Financial System (Per cent)
Very High High Moderate Low No Impact
October 2011 8 35 47 10 0
April 2012 12 43 35 10 0
Table 5.2: Confi dence in the Global and Domestic Financial Systems (Per cent)
Global Financial System
Domestic Financial System
Oct-2011 Apr-2012 Oct-2011 Apr-2012
Complete confi dence 0 0 0 1
Very confi dent 1 4 39 24
Fairly confi dent 45 40 58 67
Not very confi dent 52 54 3 8
No confi dence 2 2 0 0
Survey Responses on the probability of a ‘high’ impact event in the domestic fi nancial system (per cent)
Chart 5.7: In the short term Chart 5.8: In the medium term
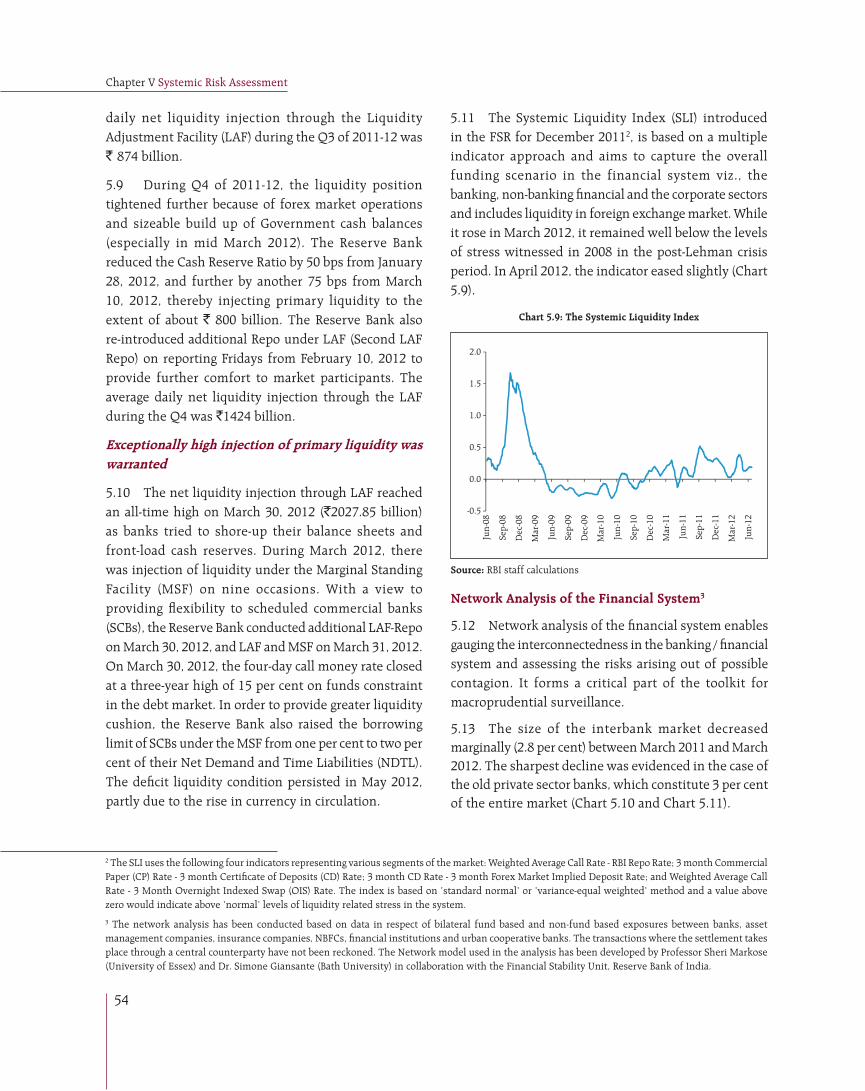
Chapter V Systemic Risk Assessment
54
daily net liquidity injection through the Liquidity Adjustment Facility (LAF) during the Q3 of 2011-12 was ` 874 billion.
5.9 During Q4 of 2011-12, the liquidity position tightened further because of forex market operations and sizeable build up of Government cash balances (especially in mid March 2012). The Reserve Bank reduced the Cash Reserve Ratio by 50 bps from January 28, 2012, and further by another 75 bps from March 10, 2012, thereby injecting primary liquidity to the extent of about ` 800 billion. The Reserve Bank also re-introduced additional Repo under LAF (Second LAF Repo) on reporting Fridays from February 10, 2012 to provide further comfort to market participants. The average daily net liquidity injection through the LAF during the Q4 was `1424 billion.
Exceptionally high injection of primary liquidity was warranted
5.10 The net liquidity injection through LAF reached an all-time high on March 30, 2012 (`2027.85 billion) as banks tried to shore-up their balance sheets and front-load cash reserves. During March 2012, there was injection of liquidity under the Marginal Standing Facility (MSF) on nine occasions. With a view to providing fl exibility to scheduled commercial banks (SCBs), the Reserve Bank conducted additional LAF-Repo on March 30, 2012, and LAF and MSF on March 31, 2012. On March 30, 2012, the four-day call money rate closed at a three-year high of 15 per cent on funds constraint in the debt market. In order to provide greater liquidity cushion, the Reserve Bank also raised the borrowing limit of SCBs under the MSF from one per cent to two per cent of their Net Demand and Time Liabilities (NDTL). The defi cit liquidity condition persisted in May 2012, partly due to the rise in currency in circulation.
2 The SLI uses the following four indicators representing various segments of the market: Weighted Average Call Rate - RBI Repo Rate; 3 month Commercial Paper (CP) Rate - 3 month Certifi cate of Deposits (CD) Rate; 3 month CD Rate - 3 month Forex Market Implied Deposit Rate; and Weighted Average Call Rate - 3 Month Overnight Indexed Swap (OIS) Rate. The index is based on ‘standard normal’ or ‘variance-equal weighted’ method and a value above zero would indicate above ‘normal’ levels of liquidity related stress in the system.
3 The network analysis has been conducted based on data in respect of bilateral fund based and non-fund based exposures between banks, asset management companies, insurance companies, NBFCs, fi nancial institutions and urban cooperative banks. The transactions where the settlement takes place through a central counterparty have not been reckoned. The Network model used in the analysis has been developed by Professor Sheri Markose (University of Essex) and Dr. Simone Giansante (Bath University) in collaboration with the Financial Stability Unit, Reserve Bank of India.
5.11 The Systemic Liquidity Index (SLI) introduced in the FSR for December 20112, is based on a multiple indicator approach and aims to capture the overall funding scenario in the financial system viz., the banking, non-banking fi nancial and the corporate sectors and includes liquidity in foreign exchange market. While it rose in March 2012, it remained well below the levels of stress witnessed in 2008 in the post-Lehman crisis period. In April 2012, the indicator eased slightly (Chart 5.9).
Chart 5.9: The Systemic Liquidity Index
Source: RBI staff calculations
Network Analysis of the Financial System3
5.12 Network analysis of the fi nancial system enables gauging the interconnectedness in the banking / fi nancial system and assessing the risks arising out of possible contagion. It forms a critical part of the toolkit for macroprudential surveillance.
5.13 The size of the interbank market decreased marginally (2.8 per cent) between March 2011 and March 2012. The sharpest decline was evidenced in the case of the old private sector banks, which constitute 3 per cent of the entire market (Chart 5.10 and Chart 5.11).

Financial Stability Report June 2012
55
Trends in the short term borrowing of banks could engender liquidity risks…
5.14 An analysis of trends in the short term inter bank borrowing of banks indicated that such borrowings, which consists mostly of certifi cate of deposits (CDs), form a sizeable portion of the funds raised in the interbank market. The ratio of the banking sector’s short term interbank borrowings to total borrowings stands at around 27 per cent. Further, short term borrowings have grown by nearly 40 per cent over a period of one year, even as the overall quantum of inter bank borrowing has fallen. As short term borrowings typically engender rollover risks, trends in this regard will need to be monitored (Chart 5.12).
5.15 Short term inter bank borrowings as a proportion of total outside liabilities of banks (at about 3 per cent) was not, however, very signifi cant. Nevertheless, there are some outlier banks which are heavily reliant on such borrowings and trends in this respect warrant greater attention (Chart 5.13).
The banking system continues to remain interconnected
5.16 The country’s banking system displays a signifi cant degree of interconnectedness. Together with this, a distinctly tiered structure of connectivity, where some banks are more connected than others, is also observed. An analysis of interconnectedness using the network model reveals that the level of connectivity in the system has increased slightly over the last year. (Box 5.1) Source: RBI staff calculations
Chart 5.13: Short Term Funds as a Ratio of Total Outside Liabilities (March 31, 2012)
Source: RBI staff calculations
Chart 5.12: Short Term Funds as a Ratio of Total Borrowing of SCBs (March 31, 2012)
Source: RBI staff calculations
Chart 5.10: Trends in the interbank market
Source: RBI staff calculations
Chart 5.11: Percentage change of activities over a one year period in the interbank market

Chapter V Systemic Risk Assessment
56
The network model uses various statistical measures to gauge the level of interconnectedness in the system. Some of the most important are as follows:
• Connectivity: This is a statistic that measures the extent of links between the nodes relative to all possible links in a complete graph.
• Cluster Coefficient: Clustering in networks measures how interconnected each node is. Specifically, there should be an increased probability that two of a node’s neighbours (banks’ counterparties in case of the financial network) are also neighbours themsleves. A high clustering coefficient for the network corresponds with high local interconnectedness prevailing in the system.
• Shortest Path Length: This gives the average number of directed links between a node and each of the other nodes in the network. Those nodes with the shortest path can be identified as hubs in the system.
• In-betweeness centrality: This statistic reports how the shortest path lengths pass through a particular node.
• Eigenvector measure of centrality: Eigenvector centrality is a measure of the importance of a node (bank) in a network. It describes how connected a node’s neighbours
are and attempts to capture more than just the number of out degrees or direct ‘neighbours’ a node has. The algorithm assigns relative centrality scores to all nodes in the network and a bank’s centrality score is proportional to the sum of the centrality scores of all nodes to which it is connected. In general, for an NxN matrix there will be N different eigenvalues, for which an eigenvector solution exists. Each bank has a unique eigenvalue, which indicates its importance in the system. This measure is used in the network analysis to establish the systemic importance of a bank and by far it is the most crucial indicator.
The trends in the aforesaid network statistics for the Indian banking sector indicate that the level of interconnectedness has remained broadly stable over the last five quarters though some statistics point to a marginal increase in connectivity.
Mar 2011
Jun 2011
Sep 2011
Dec 2011
Mar 2012
Connectivity 28.1 % 27.8 % 28.7 % 26.4 % 29.1 %Cluster Coefficient 41.4 % 41.1 % 42.7 % 42.0 % 41.4 %Average Shortest Path Length 1.73 % 1.77 % 1.73 % 1.86 % 1.74 %Average In-betweeness centrality
53.38 % 59.96 % 59.06 % 68.66 % 53.44 %
Eigenvalue 65 % 61 % 57 % 64 % 59 %Eigenvector centrality of dominant node
0.15 0.15 0.15 0.15 0.16
Source: RBI staff calculations.
Box 5.1: Network Statistics of the Banking System
Source: RBI staff calculations
Chart 5.14: Network of the Banking System – March 31, 2011
Source: RBI staff calculations
Chart 5.15: Network of the Banking System – March 31, 2012
The systemic importance of some banks may have risen…
5.17 The majority of the banks appearing in the inner core of the network of the Indian banking system
remained the same over the last one year.4 However, the number of net borrowers in the inner core has increased during this period, pointing to increased systemic importance of these banks. (Charts 5.14 and Chart 5.15)
4 A tiered structure is one where different institutions have different degrees or levels of connectivity with others in the network. In the present analysis, the most connected banks (based on their eigenvector centrality) are in the inner most core (at the centre of the network diagrams in Charts 5.14 and 5.15). Banks are then placed in the mid core, outer core and the periphery (the respective concentric circles around the centre in the diagrams), based on their level of relative connectivity. The range of connectivity of the banks is defined as a ratio of each bank’s in degree and out degree divided by that of the most connected bank. Banks that are ranked in the top 10 percentile of this ratio constitute the inner core. This is followed by a mid core of banks ranked between 90 and 70 percentile and a 3rd tier of banks ranked between 40 and 70 percentile. Banks with connectivity ratio of less than 40 per cent are categorised as the periphery. The colour coding of the links in the tiered network diagram represents the borrowing from different tiers in the network (for example, the green links represent borrowings from the banks in the inner core).
5 For a complete description of the methodology on the contagion analysis, please refer to FSR for December 2011 (rbidocs.rbi.org.in/rdocs/PublicationReport/Pdfs/5SYRA221211.pdf)

Financial Stability Report June 2012
57
... as is also indicated by the results of contagion analysis
5.18 A contagion analysis using the network model reveals that the maximum possible loss to the banking system due to the failure of the ‘most connected’ bank has risen from 12 per cent of the capital of the banking system to over 16 per cent over the four quarters of 2011 (Chart 5.16). The average loss caused by the failure of the three ‘most connected’ banks has also increased (Chart 5.17). The contagion risks, however, appear to be confi ned to a few banks (Chart 5.18). Financial stability considerations, therefore, warrant that the risks posed by the increased interconnectedness of the few banks in the inner core need to be carefully monitored, through, inter alia, rigorous microprudential supervision of these entities.
The major lenders in the fi nancial system remain vulnerable to contagion risks
5.19 The network analysis of the broader fi nancial system, presented in the previous FSR, had thrown up the interconnectedness among the banking, insurance and the mutual funds segments of the fi nancial system. The analysis revealed that the largest net lenders in the system were the insurance companies and the Asset Management Companies (AMCs), while the banks were the largest borrowers. This renders the lenders vulnerable to the risk of contagion from the banking system. The random failure of a bank which has large borrowings from the insurance and mutual funds segments of the fi nancial system may have signifi cant implications for the entire system (Charts 5.19 and 5.20).
Source: RBI staff calculations
Chart 5.16: Contagion due to the failure of a top net borrower5
Source: RBI staff calculations
Chart 5.17: Potential loss to the banking system due to failure of top banks
Source: RBI staff calculations
Chart 5.18: Potential loss distribution in the banking system due to failure of banks
Source: RBI staff calculations
Chart 5.19: Insurance companies’ investments in different bank groups
5 For a complete description of the methodology on the contagion analysis, please refer to FSR for December 2011 (rbidocs.rbi.org.in/rdocs/PublicationReport/Pdfs/5SYRA221211.pdf)

Chapter V Systemic Risk Assessment
58
Banks reliant on the insurance sector and mutual funds, specially for short term funds…
5.20 SCBs were considerably dependent on borrowings from insurance companies and mutual funds. As at end-March 2012, nearly 27 per cent of the entire intra-fi nancial system borrowings by banks was from insurance companies while another 37 per cent was from mutual funds. The reliance is particularly high in case of private sector banks (Table 5.3). Such borrowings from mutual funds and insurance companies constitute 6.8 per cent of the banking systems’ outside liabilities.
5.21 The bulk of the borrowing by SCBs from the mutual funds (81 per cent) consists of short term funds, which could engender rollover and liquidity risks. These borrowings almost entirely comprise CD issuances. In contrast, borrowings from insurance companies primarily have a longer maturity, with over 88 per cent of the borrowings carrying a remaining maturity of at least one year (Table 5.4).
Banking Stability Measures and Estimation of Expected Shortfall
5.22 The stability of banking system was studied through various Banking Stability Measures, which gauge the impact of distress in one bank on the rest through direct and indirect links. For assessing these dependencies, the financial system is modeled as a portfolio of a specific group of banks (Segoviano and Goodhart, 2009). The model uses the Banking System’s Portfolio Multivariate Density (BSMD)6, which characterises both the individual and joint asset value movements of the portfolio of banks. The BSMD is recovered from the Probabilities of Distress (PoDs) of banks under analysis, which is observed empirically based on 99 per cent Value at Risk (VaR)7 of daily return on banks’ equity prices.
Table 5.3 Contribution of Insurance companies and MFs to Banks Borrowings
Borrowings/Funds received from the Insurance Sector
Borrowings/Funds received from MFs
` billion
As percentage of total
borrowing
` billion
As percentage of total
borrowing
Banking Sector 1828 26.5 2591 37.1
Public Sector Banks 1153 27.2 1761 41.5
Old Private Sector Banks 60 25.2 185 77.7
New Private Sector Banks 583 40.7 631 44.2
Foreign Banks 32 2.9 14 1.3
Source: RBI staff calculations
Source: RBI staff calculations
Chart 5.20: MFs’ investments in different bank groups
6 A complete description of the methodology was presented in the third issue of the Financial Stability Report, June 2011 (http://www.rbi.org.in/scripts/BS_PressReleaseDisplay.aspx?prid=24557)
7 The methodology for calculation of PoDs has been revised in this FSR as compared to the method used in FSR December 2011. The calculated PoDs are used as an input for derivation of JPoDs and the Banking Stability Measures as well as the Expected Shortfall. Earlier, threshold for calculation of PoDs were derived based on daily equity price returns since January 2007. Since during the fi nancial crisis of 2008-09, the Indian banking equity prices recorded higher decline in return as compared to the current time as well as before the crisis, the threshold return limit (VaR) was set at a much lower level. Hence, the empirically observed PoDs were unable to capture the relative variation of equity return during the current period. Therefore, to overcome this limitation, the revised calculations of PoDs are based on the threshold derived after excluding the period of the fi nancial crisis (i.e. on the daily equity price return since January 2010). All the measures show a slight upward movement (as compared to results published earlier). Further, to capture stress event in a broader way, the revised PoDs are based on 99 per cent VaR instead of 99.5 per cent VaR.
Table 5.4: Percentage distribution of Insurance companies and MFs in investment /lending in the banking system
(Per cent)
Insurance Companies Mutual Funds
Short term
Long term
Total Short term
Long term
Total
Banking sector 11.6 88.4 100 81.0 19.0 100
Public Sector Banks 8.2 54.9 63.1 58.2 9.8 67.9
Old Private Sector Banks 1.2 2.0 3.3 5.8 1.3 7.1
New Private Sector Banks 1.5 30.4 31.9 16.8 7.6 24.4
Foreign Banks 0.6 1.1 1.8 0.2 0.3 0.6
Source: RBI staff calculations

Financial Stability Report June 2012
59
Common distress in the system: JPoD and BSI
5.23 The probability of distress of the entire banking system, as measured by Joint Probability of Distress (JPoD), has been showing an upward trend over the last two years, though the probability continued to be low when compared to the level seen during the 2008-09.The Banking Stability Index (BSI), which measures the expected number of banks which could become distressed given that at least one bank becomes distressed, declined from the highs registered during 2008-09 till end-2010. Thereafter, it has been showing an increasing trend (Chart 5.21).
5.24 Trends in both JPoD and BSI indicate that inter-dependencies among banks have risen in recent times though they remain much below the level seen during the global fi nancial crisis.
Distress between specific banks: Toxicity & Vulnerability Index
5.25 The distress between specifi c banks has been measured based on Toxicity Index and Vulnerability Index8. As in the case of common distress indices, both the Toxicity and Vulnerability indices have shown a declining trend since the global fi nancial crisis but the indices have been rising in recent periods, especially since 2011. (Charts 5.22 and 5.23).
Cascade effects due to distress in a specifi c bank
5.26 Cascade effects are a measure of the probability of one or more banks becoming distressed, given that a specifi c bank becomes distressed. The measure refl ects the systemic importance of a bank. Though these conditional probabilities do not imply causation; these can provide important insights into systemic inter-linkages among the banks. The cascade probabilities show that the Indian banking system is highly interlinked and had a very high distress dependency during the fi nancial crisis. This effect decreased in 2010,
8 The Toxicity Index (TI) is the average probability that a bank under distress may cause distress to another bank in the system while the Vulnerability Index (VI) quantifi es the vulnerability of a bank given distress in the other banks in the system.
Source: Bloomberg data and RBI staff calculations
Chart 5.21: Movement of JPoD and BSI
Source: Bloomberg data and RBI staff calculations
Chart 5.22: Movement of Toxicity Index of Banks
Source: Bloomberg data and RBI staff calculations
Chart 5.23: Movement of Vulnerability Index of Banks

Chapter V Systemic Risk Assessment
60
but has shown an increasing trend in recent periods (Chart 5.24).
Domino Impact on the System: Cascade Effect
5.27 The systemic importance and ‘domino’ effect of a specifi c bank can be quantifi ed as the likelihood of distress in the system dependent on distress in the bank (Chart 5.25). The domino impact for failure of the entire banking system has increased marginally in recent times.
Expected Shortfall
5.28 The banking system’s Expected Shortfall (ES)9, which had a declining trend during 2008 to 2010, has been increasing since 2011. The ES was estimated to be around 8.5 per cent of total assets of the banking system in December 2008. Since then, the ES had declined significantly. However, beginning 2011, it has been showing an increasing trend, though the ES remains much below the levels observed during the global fi nancial crisis. During March 2012, the ES stood at 3.4 per cent of total assets. Projected values of the ES for the coming quarters indicate that the shortfall may increase marginally (Chart 5.26).
Macro stress testing10
5.29 A series of macro stress tests was carried out to study the impact of various adverse macro shocks on banks’ credit quality. Four different econometric tools were used for the purpose. Apart from tests conducted at the system level, the exercise was also performed at bank-group and sectoral levels. In previous FSRs, the stress tests were conducted using various classical multivariate regressions. To ensure that the stress testing exercise takes cognisance of the tail events, quantile regression has also been adopted (Box 5.2). An assessment of systemic risk under different macroeconomic shocks from complementary angles was, thus, possible.
9 Expected shortfall is a popular measure of systemic risk. It provides an informative summary of the severity of extreme events that occur with a small probability but can have system-wide consequences. Expected shortfall is measured as the estimated weighted average loss of assets in the tail risk region with the respective probability of losses being considered as the weights. Under a continuous loss distribution (Z), expected shortfall at the 100(1-)% confi dence level ( ES (Z) ) is defi ned as, ES (Z) = E[Z ZVaR (Z)]. Hence, Expected shortfall is the conditional expectation of loss given that the loss is beyond the VaR level.
10 The methodology is in the Annex.
Source: Bloomberg data and RBI staff calculations
Chart 5.24: Systemic Inter-linkages among the Banks: Cascade Effect
Source: Bloomberg data and RBI staff calculations
Chart 5.25: Domino Impact of Banks on the Entire System: Cascade Effect
Note: Jun 2012 and Sep 2012 are projected valuesSource: Supervisory & Bloomberg data and RBI staff calculations
Chart 5.26: Expected Shortfall to Total Assets: System Level

Financial Stability Report June 2012
61
The macro stress test is a tool to assess the vulnerability
of the banking system to extreme but plausible adverse
macroeconomic shocks. The stochastic relationship between
banking stability, typically taken as a credit risk indicator
defi ned by non-performing advances ratio or slippage ratio, and
macro variables is established through statistical/econometric
models.
The results presented in previous FSRs were based on stress
tests conducted using the techniques of multivariate logit
regression, multivariate regression and multivariate panel
regression. However, these classical regression analyses have
their own limitations. First, they estimate the conditional mean
of the dependent variable for the given set of independent
variables (regressors) and, hence, this regression curve gives
an incomplete picture. Second, these techniques assume that
the impact of the independent variable on the dependent
variable is symmetric and identical for different levels of
the dependent variable, an assumption which may not hold
under all circumstances. In particular, during a tail event, the
relationship among the variables may change. To ensure that
the stress testing exercise takes cognisance of the tail events,
it is important that the exercise looks beyond the conditional
mean and focuses on the tail. To this end, the technique of
quantile regression tools, which enables explicit modeling of
the tail of conditional distribution of the target variable, has
been adopted.
Quantile regression is one of the tools, which provides facility
of modeling not only mean/median, but also explicitly models
the tail of the conditional distribution by using other quantiles
of the target variable.
The -th quantile (in the interval (0,1)) of any random variable
Y can be defi ned as
Traditionally, quantiles are calculated by arranging the values of
the variable in ascending order and then take the observation
at which threshold is reached. Koenkar and Bassett(1978)
introduced a completely new method to calculate quantile
which is based on an objective function which is given as below,
where, the concept of ‘sorting’ was replaced by the concept of
‘optimising’:
The above mentioned optimising technique can be extended
for regression settings, which is as below:
Here, the -th conditional quantile of the error conditional
on xt is zero (i.e. ) = 0). Hence, the -th conditional
quantile of yt with respect to xt can be written as,
Assembling above mentioned equation and objective function,
the parameter vector can be computed by
The above parameter can be computed by representing it in a
linear equation. If we rewrite yt as a function of only positive
elements then,
with , k=1,2,…K and , t=1,2,…T,
then the solution will be reduced to the following problem:
Subject to: ,
Whereas, the variance covariance matrix can be estimated by
the three methods, namely, direct method, rank score method
and resampling method.
The quantile regression also captures the changing relative
importance of macro variables along the conditional credit risk
distribution at various quantiles.
References
IMF(2009), ‘Global Financial Stability Report’, April 2009.
Koenker, R. and Bassett, G. (1978), ‘Regression Quantiles’
Econometrica 46 (1).
Niel Schulze (2004), ‘Applied Quantile Regression:
Microeconomatric, Financial and Environmental Analyses’,
Inaugural-Dissertation, Tubingen.
Schechtman Ricardo, Gaglianone W. P. (2011), ‘Macro Stress
Testing of Credit Risk Focused on the Tails’, Working Paper Series 241, Banco Central Do Brasil.
Box 5.2: Macro Stress Test - Quantile Regression Approach

Chapter V Systemic Risk Assessment
62
Table 5.7: Projected CRAR using Different Models (Per cent)
Scenario Jun-12 Mar-13 Jun-12 Mar-13
Multivariate Logit Multivariate
Baseline 13.50 12.58 13.50 12.59
Medium Risk 13.50 12.53 13.50 12.55
Severe Risk 13.50 12.46 13.50 12.50
VAR Quantile
Baseline 13.50 12.60 13.48 12.58
Medium Risk 13.50 12.56 13.47 12.52
Severe Risk 13.50 12.52 13.47 12.46
Source: Supervisory data and RBI staff calculations
5.30 The macro stress tests encompass a series of risk scenarios incorporating a baseline and two adverse macroeconomic scenarios representing medium and severe risk, where the shocks in the macroeconomic parameters are assumed to occur simultaneously (Table 5.5). The impact of the stress scenarios was assessed on the unconsolidated balance sheet of the domestic operations of SCBs. Essentially, the macro stress tests focus on different credit risk scenarios.
Credit quality may deteriorate under severe macro stress, but impact on CRAR is contained
5.31 The non performing asset (NPA) levels projected through different models suggest that, under the baseline scenario, NPAs are expected to be in the range of 3.3 to 3.5 per cent by March 2013. Under the stress scenarios, they could increase to 3.7 to 4.1 per cent (the medium risk scenario) and 4.1 to 4.6 per cent (the severe risk scenario). Under the severe risk scenario, the system level CRAR12 of commercial banks could decline to 12.5 per cent by March 2013, which still remains well above the regulatory requirements (Tables 5.6 and 5.7).
Table 5.5: Macroeconomic Scenario Assumptions11
(Per cent)
ScenarioJun-12 Mar-13 Jun-12 Mar-13
GDP growth WPI Infl ation
Baseline 7.7 7.6 7.0 6.5
Medium Risk 6.7 5.6 8.4 9.3
Severe Risk 5.2 3.5 10.6 12.2
Short-term interest Rates Export/ GDP ratio
Baseline 8.2 7.9 16.3 16.4
Medium Risk 9.1 9.8 15.2 14.2
Severe Risk 10.5 11.6 13.5 12.0
Gross Fiscal Defi cit
Baseline 5.1 5.1
Medium Risk 5.8 6.5
Severe Risk 6.9 7.9
11 The adverse scenarios were derived based on up to 1 standard deviation of 10 years historical data for medium risk and 1.25 to 2 standard deviation of 10 years historical data for severe risk. These stress scenarios are stringent and conservative assessments under hypothetical-severely adverse economic conditions and should not be interpreted as forecasts or expected outcomes. The projections are based on data pertaining to the fourth quarter of2011-12. The macroeconomic shocks have been assumed to occur in the fi rst quarter of 2012-13.
12 CRAR is based on BASEL II requirements.
Table 5.6: Projected Gross NPA ratio using Different Models
(Per cent of total advances)
Scenario Jun-12 Mar-13 Jun-12 Mar-13
Multivariate Logit Multivariate
Baseline 3.1 3.5 3.0 3.4
Medium Risk 3.1 3.9 3.0 3.8
Severe Risk 3.1 4.5 3.0 4.3
VAR Quantile
Baseline 3.0 3.3 3.2 3.5
Medium Risk 3.0 3.7 3.3 4.1
Severe Risk 3.0 4.1 3.3 4.6
Source: Supervisory data and RBI staff calculations

Financial Stability Report June 2012
63
Impact of the risk scenarios varies across bank groups, but all groups are resilient
5.32 The impact of the risk scenarios varied across bank groups. The CRAR of public sector banks, under the severe stress scenario could fall to 11.5 per cent while the CRAR of the other bank groups is expected to be higher given the higher level of CRAR under the baseline scenario (Tables 5.8 and 5.9).
The impact of risk scenarios vary across different sectors
5.33 The impact of the different risk scenarios on the level of NPAs in different sectors varied with the maximum impact evidenced in the Food Processing, Engineering and Iron and Steel sectors. The effect on NPAs in agriculture in this macro stress test analysis appears to be marginal (Table 5.10).
Table 5.8: Bank-group-wise Projected NPAs(Multivariate Panel Regression)
(Per cent of total advances)
Jun-12 Mar-13 Jun-12 Mar-13
Public Sector Banks Old Private Sector Banks
Baseline 3.4 3.5 2.2 2.7
Medium 3.4 3.8 2.2 3.1
Severe 3.4 4.2 2.2 3.5
New Private Sector Banks Foreign Banks
Baseline 2.4 2.7 2.3 3.1
Medium 2.4 3.1 2.3 3.5
Severe 2.4 3.5 2.3 3.9
Source: Supervisory data and RBI Staff calculations
Table 5.10: Projected Sectoral Gross NPA ratio
(Per cent of total advances)
Sectors March 2013
BaselineMedium
RiskSevere Risk
Agriculture 4.2 4.4 4.5
Food Processing 7.6 8.7 9.9
Construction 2.9 3.1 3.3
Cement 2.9 3.1 3.5
Infrastructure 0.9 1.1 1.3
Iron and Steel 4.2 4.9 5.6
Engineering 4.9 5.6 6.2
Automobiles 2.4 2.6 2.8
Others 3.4 3.7 4.0
Source: Supervisory data and RBI staff calculations
Table 5.9: Bank-group-wise Projected CRAR(Multivariate Panel Regression)
(Per cent)
Jun-12 Mar-13 Jun-12 Mar-13
Public Sector Banks Old Private Sector Banks
Baseline 12.31 11.58 13.99 12.87
Medium 12.31 11.54 13.99 12.81
Severe 12.31 11.49 13.99 12.75
New Private Sector Banks Foreign Banks
Baseline 16.63 15.12 15.95 14.81
Medium 16.63 15.08 15.95 14.78
Severe 16.63 15.02 15.95 14.74
Source: Supervisory data and RBI staff calculations

Annex
64
Annex
Methodologies
Financial Stability Map
The Financial Stability Map depicts the overall stability condition in the Indian fi nancial system. The Financial Stability Map is based on the three major indicators namely, Macroeconomic Stability Indicator (MSI), Financial Market Stability Indicator (FMSI) and Banking Stability Indicator (BSI). The methodologies for calculation of above indicators are described below.
Macroeconomic Stability Map and Indicator
The Macroeconomic Stability Map and Indicator is based on seven sub-indices, each pertaining to specifi c area of macroeconomic risk. Each sub-index on macroeconomic risk includes select parameters representing risks in that area. These sub-indices have been validated by assessing their appropriate impact on macroeconomic or fi nancial variable such as GDP, infl ation, interest rates or the quality of assets of the banks. The seven sub-indices of the overall macroeconomic stability index and their components are described below:
Global Risk Index
The Global Risk index is based on real output and the prices in the advanced economies. In respect of real output, a composite index based on the weighted average of the growth rate of GDP of U.S., Euro Area and Japan has been constructed. Using a similar procedure, index for infl ation in these advanced economies was also constructed. GDP index is ranked in ascending order while that of infl ation is ranked in descending order. Global Risk Index is a composite index of these indices having equal weights for each index.
External Vulnerability
The index of external vulnerability is based on current account defi cit/GDP, current payments/current receipts, average monthly imports/reserve, share of short term debt in total debt, debt stock - GDP ratio and debt service ratio.
Fiscal Vulnerability
Initially, an index of fi scal stress is constructed based on the gross primary defi cit (GPD), gross fi scal defi cit (GFD) and the total liabilities of the centre and state governments. This is based broadly on the methodology suggested in two IMF Working Papers by Baldacci, McHugh and Petrova (2011) and Baldacci, Petrova, Belhocine, Dobrescu and Mazraani (2011). The weights in respect of GFD and GPD so obtained were applied to recent data on GPD and GFD provided by the Offi ce of the Comptroller General of Accounts to assess the change in fi scal risks.
Growth
For obtaining the outlook on domestic growth, the relationship of growth with a number of variables were attempted, viz. exports/GDP, growth of core industry, GFCF/GDP, real bank credit, PMI and yield curve (difference between the ten-year and one-year yield). Amongst these variables, the yield curve and PMI Manufacturing were found to be the most appropriate indicators of growth.
Infl ation
The outlook for infl ation is based on the changes in international oil prices, exchange rate, and world infl ation.
Corporate Sector
The health of the corporate sector is captured through profi t margin. The risks emanating from the sector is inversely related to it. In order to capture the relationship of the corporate sector with the fi nancial sector, the share of interest in sales is also captured in the index for the corporate sector.

Financial Stability Report June 2012
65
Household Sector
In the absence of frequent data on indebtedness of household, the outstanding credit from the bank to the household sector, viz. retail credit, is taken as a proxy for household indebtedness. Further, in view of the delay in availability of data on personal disposable income, private fi nal consumption expenditure (PFCE) is used as its proxy. Based on these two variables, and the retail NPA, the index for household sector attempts to capture the risks originating from the household sector.
Financial Markets Stability Map and Indicator
With the objective to measure stability of the fi nancial market, Financial Market Stability Map and Indicator has been prepared based on the indicators of four sectors/markets namely banking sector, foreign exchange market, equity market and debt market. The indicators selected from various sectors/markets are following; i) Banking Sector: Banking Beta of CNXBANK Index and NIFTY Index, CD Rate and CD rate minus Implied Forward rate, ii) Foreign Exchange Market: CMAX of daily INR-US Dollar exchange rate, which is defi ned as Xt/Max(Xi, i=1,2,..upto one year). Where, Xt is the INR-US Dollar exchange rate at time t, and 25 Delta Risk Reversals of foreign exchange rate, iii) Equity Market: Inverse of NIFTY CMAX and India VIX, and iv) Debt Market: Corporate bond which is average return of corporate bonds rated A, AA, and AAA, 10-years Government bond yield and CP Rate.
Because of different levels of the selected indicators, they cannot be added straightaway. Therefore, to bring all the indicators at same level, variance-equal transformation has been used.
At fi rst level, four indicators for the four selected sectors/market were prepared based on simple average of elementary indicators and thereafter FMSI was derived based on simple average of the four indicators derived at fi rst level. FMSI was estimated based on daily data.
Further, projection of FMSI was done based on monthly FMSI which is monthly average of daily FMSI, credit growth, WPI-Manufactured Products infl ation and REER using following regression equation:
Where,
Banking Stability Map and Indicator
The Banking Stability Map and Indicator present an overall assessment of changes in underlying conditions and risk factors that have a bearing on stability of the banking sector during a period. Following ratios are used for construction of each composite index:
Table : Indicators used for construction of Banking Stability Map and Banking Stability Indicator
Dimension RatiosSoundness CRAR Tier-I Capital to
Tier-II CapitalLeverage ratio as Total-Assets to Capital and Reserves
Asset-Quality Net NPAs to Total-Advances
Gross NPAs to Total-Advances
Sub-Standard-advances to gross NPAs
Restructured-Standard-Advances to Standard-Advances
Profi tability Return on Assets Net Interest Margin Growth in Profi t
Liquidity Liquid-Assets to Total-Assets
Customer-Deposits to Total-Assets
Non-Bank-Advances to Customer-Deposits
Deposits maturing within-1-year to Total Deposits
Effi ciency Cost to Income Business (Credit + Deposits) to staff expenses
Staff Expenses to Total Expenses

Annex
66
The fi ve composite indices represent the fi ve dimensions viz., Soundness, Asset-quality, Profi tability, Liquidity and Effi ciency. Each index, representing a dimension of bank functioning, takes values between zero (minimum) and 1 (maximum). Each index is a relative measure during the sample period used for its construction, where a high value means the risk in that dimension is high. Therefore, an increase in the value of the index in any particular dimension indicates an increase in risk in that dimension for that period as compared to other periods. For each ratio used for a dimension, a weighted average for the banking sector is derived, where the weights are the ratio of individual bank asset to total banking system assets. Each index is normalized for the sample period as ‘Ratio-on-a-given-date minus Minimum-value-in-sample-period divided by maximum-value-in-sample-period minus Minimum-value-in-sample-period’. A composite measure of each dimension is calculated as a weighted average of normalised ratios used for that dimension, where the weights are based on the marks assigned for assessment for CAMELS rating. Based on the individual composite indices for each dimension, the Banking Stability Indicator is constructed as a simple average of these fi ve composite sub-indices.
For the current map and indicator, the sample period for assessment was taken from March 2006 to March 2012. Projection of BSI was done using Auto Regressive Moving Average (ARMA) method.
Stress Testing of Derivatives Portfolio of Select Banks
The stress testing exercise focused on the derivatives portfolio of a representative sample set of banks. The top 26 banks in terms of notional value of derivatives portfolio as at end December 2011 were selected for the analysis. The methodology adopted involved designing a set of stress conditions. Each bank in the sample was asked to assess the impact of these stress conditions on their respective derivatives portfolios as on March 31, 2012.
In case of domestic banks, the derivatives portfolio of both domestic and overseas operations were reckoned. In case of foreign banks, only the domestic (i.e. Indian) position was considered for the exercise. Derivatives trade where hedge effectiveness was established was exempted from the tests, while all other trades were included.
The stress scenarios incorporated six historical scenarios and four sensitivity tests. For constructing the historical scenario, six parameters (market variables) were chosen and the 1 day rate of change over a horizon of 2007-2011 was calculated for each variable. The date corresponding to the maximum change (in each variable) was selected as the stress period. For each of the six stress periods, the 1 day rate of change for rest of the market variables needed for valuation of derivative portfolio of banks was calculated to arrive at six different scenarios
Table : Parameters and Dates used to construct scenario Analysis
Parameter Highest 1 day change in the period 2007-2011
USD/INR Rate of change of -3.1 per cent
MIFOR 6 MONTHS Absolute change of -240 bps
OIS INR 2YEARS Absolute change of -60.5 bps
USD LIBOR 3 MONTHS Absolute change of -38.6 bps
EURIBOR 6 MONTHS Absolute change of 17.5 bps
USD LIBOR SWAP CURVE 5 YEARS Absolute change of -8.5 bps
The sensitivity tests were constructed using the spot USD/INR rate and domestic interest rates as parameters

Financial Stability Report June 2012
67
Table: Shocks for Sensitivity Analysis
Domestic Interest Rates
Shock 1
Overnight +250 bps
Upto 1yr +150 bps
Above 1yr +100 bps
Domestic Interest Rates
Shock 2
Overnight -250 bps
Upto 1yr -150 bps
Above 1yr -100 bps
Exchange rates
Shock 3 USD/INR +20 per cent
Exchange Rates
Shock 4 USD/INR -20 per cent
Single Factor Sensitivity Analysis – Stress Testing
As a part of quarterly surveillance, stress tests are conducted covering credit risk, interest rate risk, equity price risk, foreign exchange risk, liquidity risk etc. Resilience of the commercial banks in response to these shocks is studied. The analysis covers all scheduled commercial banks. Single factor sensitivity analysis on credit risk of scheduled urban co-operative banks and non-banking fi nancial companies are also conducted.
Credit Risk
To ascertain the resilience of banks, the credit portfolio was shocked by increasing NPA levels, for the entire portfolio as well as for select sectors, along with a simultaneous increase in provisioning requirements. For testing the credit concentration risk, default of the top individual borrowers and the largest group borrower is assumed. The estimated provisioning requirements so derived were adjusted from existing provisions and the residual provisioning requirements, if any, were deduced from banks’ capital.
The analysis was carried out both at the aggregate level as well as at the individual bank level, based on supervisory data as on March 31, 2012. The scenario assumed enhanced provisioning requirements of 1 per cent, 30 per cent and 100 per cent for standard, sub-standard and doubtful/loss advances, respectively. The assumed increase in NPAs was distributed across sub-standard, doubtful and loss categories in the same proportion as prevailing in the existing stock of NPAs. The additional provisioning requirement was applied to the altered composition of the credit portfolio.
Equity price risk, foreign exchange risk and interest rate risk
The fall in value of the portfolio or income losses due to change in equity prices, appreciation/ depreciation of INR, shifting of INR yield curve are accounted for the total loss of the banks because of the assumed shock. The estimated total losses so derived were reduced from the banks’ capital.
For interest rate risk in the banking Book, two kinds of approaches were considered: (1) Income Approach, which impacts the earnings of banks because of shift in INR yield curve and (2) Duration Gap Analysis, which computes the valuation impact (portfolio losses). The income losses, on interest bearing exposure gap, are calculated for one year for each time bucket separately, to refl ect the impact on the current year profi t & loss and income statement.

Annex
68
The portfolio losses, on interest bearing exposure gap, are calculated for each time bucket, using duration gap analysis. The total (net) impact on the banking book was calculated by adding income losses/gains and portfolio losses/gains[1], and the resultant losses/gains were used to derive the impacted CRAR. The valuation impact for the tests was calculated under the assumption that the HTM portfolio would be marked to market. For interest rate shocks in trading book, the valuation losses are calculated for each time bucket on the interest bearing assets using duration approach.
Liquidity Risk
The aim of liquidity stress tests is to assess the ability of a bank to withstand unexpected liquidity drain without taking recourse to any outside liquidity support. The analysis is done as at end-March 2012. The scenario depicts different proportions (depending on the type of deposits) of unexpected deposit withdrawals on account of sudden loss of depositors’ confi dence and assesses the adequacy of liquid assets available to fund them.
The defi nition of liquid assets are taken as:
1 Cash + Excess CRR + Inter Bank Deposits + SLR Investments
2 Cash + Excess CRR + Inter Bank Deposits maturing-within-1-month + Investments maturing-within-1-month
3 Cash + Excess CRR + Inter Bank Deposits maturing-within-1-month + Excess SLR Investments
4 Cash + CRR + Inter Bank Deposits maturing-within-1-month + Investments maturing-within-1-month
5 Cash + CRR + Inter Bank Deposits maturing-within-1-month + Excess SLR Investments
It is assumed that banks would meet stressed withdrawal of deposits through sale of liquid assets.
The sale of investments is done with a hair cut of 10 per cent of their market value.
The stress test is done on a static mode.
Bottom-up Stress Testing
Bottom-up sensitivity analysis was performed by 25 scheduled commercial banks (comprising about 75 percent of the total assets). A set of common scenarios and shock sizes were provided to select banks. The tests were conducted using March 2012 data. Banks used their own methodologies for calculation of losses in each case.
Urban Co-operative Banks – Credit Risk
Stress tests on credit risk were conducted on Scheduled Urban Co-operative Banks (SUCBs) using their asset portfolio as at end-March 2012. The tests were based on single factor sensitivity analysis. The impact on CRAR was studied under two different scenarios. The assumed scenarios were as under:
Scenario I:
Shock applied: 50 per cent increase in gross NPAs.
Provisioning requirement is increased by 50 per cent.
Capital (Tier I & II) is reduced by additional provisions.
[1] Total (Net) losses/gain = Income (losses/ gain) + Portfolio (losses/ gain)

Financial Stability Report June 2012
69
Scenario II:
Shock applied: 100 per cent increase in gross NPAs.
Provisioning requirement is increased by 100 per cent.
Capital (Tier I & II) is reduced by additional provisions.
Liquidity stress test based on cash fl ow basis in 1-28 days time bucket was also conducted, where mismatch [negative gap (cash infl ow less than cash outfl ow)] exceeding 20 per cent of outfl ow in 1 to 28 days time bucket was considered stressful.
Scenario I: Cash out fl ows in 1-28 days time bucket goes up by 50 per cent (no change in cash infl ows)
Scenario II: Cash out fl ows in 1-28 days time bucket goes up by 100 per cent (no change in cash infl ows)
Non-Banking Financial Companies (ND-SI) – Credit Risk
Stress tests on credit risk were conducted on Non-Banking Financial Companies (Non-Deposit taking and Systemically Important) using their asset portfolio as at end-December 2011. The tests were based on single factor sensitivity analysis. The impact on CRAR was studied under two different scenarios. The scenario assumed increase in the existing stock of NPAs by 200 and 500 per cent. The assumed increase in NPAs was distributed across sub-standard, doubtful and loss categories in the same proportion as prevailing in the existing stock of NPAs. The additional provisioning requirement was adjusted from the current capital position. The stress were conducted at individual NBFCs as well as at an aggregate level.
Systemic Liquidity Index (SLI)
The SLI uses the following four indicators representing various segments of the market:
1. Weighted Average Call Rate – RBI Repo Rate
2. 3 month Commercial Paper (CP) Rate – 3 month Certifi cate of Deposits (CD) Rate
3. 3 month CD Rate – 3 month Implied Deposit Rate
4. Weighted Average Call Rate - 3 Month Overnight Index Swap (OIS) Rate
In order to create the SLI, variance-equal or standard normal transformation was used.
Macro Stress Testing
To ascertain the resilience of banks, the credit risk was modeled as functions of macroeconomic variables. Credit risk stress tests have been computed using several econometric models that relate banking system aggregates to the macroeconomic variables, such as (i) multivariate logit regression on aggregate systems’ NPA data; (ii) multivariate regression in terms of the slippage ratio (infl ow of new NPAs); (iii) aggregate VAR using slippage ratio; (iv) quantile regression of slippage ratio, (v) multivariate panel regression on bank-group wise slippage ratio data; and (vi) multivariate regressions for aggregate sectoral NPAs. The banking system aggregate includes current and lagged values of aggregate NPAs (NPA ratio) and infl ow of new NPAs (slippage ratio), while macroeconomic variables include GDP growth, short term interest rate (call rate), WPI infl ation, exports-to-GDP ratio , gross fi scal defi cit-to-GDP ratio and REER.
While the multivariate regressions allows evaluating the impact of selected macroeconomic variables on the banking system’s NPA and capital, the VAR model refl ects the impact of the overall economic stress situation on the banks’ capital and NPA ratio, which also take into account feed-back effect. In these methods, conditional

Annex
70
mean of NPA/slippage ratio is estimated and assumed that the impact of macro variables on credit quality will remain same irrespective of the level of the credit quality, which may not always be true. In order to relax this assumption, quantile regression has been adapted to project credit quality, in which, in place of conditional mean the conditional quantile has been estimated.
The Modeling Framework
The following multivariate models were run to estimate the impact of macroeconomic shocks on the aggregate NPA (npa) / slippage ratio (SR): 1
Aggregate banking system multivariate logit2 regression:
Where,
Aggregate banking system multivariate regression:
The analysis was carried out on slippage ratio at the aggregate level for the commercial banking system as a whole.
Where,
Vector AutoRegression (VAR):
In order to judge the resilience of banking on various macroeconomic shocks, Vector Autoregressive (VAR)3 approach has been adopted. The advantage of VAR model is that, it allows to fully capture the interaction among macroeconomic variables and banks’ stability variable. It also captures the entailed feedback effect.
In notational form, mean-adjusted VAR of order p (VAR(p)) can be written as
Where, is a (K×1) vector of variables at time t, the (i=1,2,…p) are fi xed (K×K) coeffi cient matrices and is a K-dimensional white noise or innovation process.
In order to estimate, VAR system, slippage ratio, call rate, infl ation, growth and REER were selected, however, because of limited data points, GFD-to-GDP could not be taken. The appropriate order of VAR has been selected based on minimum information criteria as well as other diagnostics and suitable order was found to be two. Accordingly, VAR of order 2 (VAR(2)) was estimated and stability of the model was checked based on roots of AR characteristic polynomial. Since, all roots are found to be inside the unit circle, this selected model was found to be fulfi lling the stability condition. The impact of various macroeconomic shocks was determined using impulse response function of the selected VAR.
1 Slippage ratio, exports/GDP, and the call rate are seasonally adjusted.2 For detailed model specifi cations, please refer to FSR – December 2010. The logit transformation of NPA ratio is defi ne as:
3 For detailed VAR model specifi cations, please refer to FSR – June 2011.

Financial Stability Report June 2012
71
Quantile Regression:
In order to estimate slippage ratio at desired level of conditional quantile, following quantile regression at 0.60 quantile (which is the present quantile of the slippage ratio) was used:
Where,
Bank-group wise panel fi xed-effect regression:
Bank-group wise panel regression was modeled where slippage ratio was considered as functions of macroeconomic variables. The bank-group effect were identifi ed along with the overall model specifi cations.
where, is the bank-group specifi c parameter and .
Sectoral multivariate regression:
The impact of macroeconomic shocks on various sectors was assessed by employing multivariate regression models using aggregate NPA ratio for each sector separately. The dependent variables consisted of lagged NPAs, sectoral GDP growth, infl ation, and short-term interest rate.
Derivation of the NPAs and CRAR from the slippage ratios, which were projected from the above mentioned credit risk econometric models, were based on the following assumptions: credit growth of 17 per cent; recovery rate of 5 per cent; write-offs at 3.5 per cent; risk weighted assets growth of 18 per cent; and profi t growth of 10 per cent. The regulatory capital growth is assumed to remain at the minimum by assuming minimum mandated transfer of 25 per cent of the profi t to the reserves account. The distribution of new NPAs in various sub-categories was done as prevailing in the existing stock of NPAs. Provisioning requirements for various categories of advances are 0.4 per cent for standard advances, 10 per cent for sub-standard advances, 75 per cent for doubtful advances, and 100 per cent for loss advances. The projected values of the ratio of the non-performing advances were translated into capital ratios using the “balance sheet approach”, by which capital in the balance sheet is affected via the provisions and net profi ts. It is assumed that the existing loan loss provisioning coverage ratios remain constant for the future impact.