financial statements - aa annual report...
TRANSCRIPT

Our B
usinessG
overnanceFinancial Statem
entsO
ur Performance
AA plc Annual Report and Accounts 2017 79
Financial statementsfor the year ended 31 January 2017
80 AA plc Annual Report and Accounts 2017
1. Our opinion on the financial statements is unmodified:
In our opinion:
the financial statements give a true and fair view of the state of the Group’s and of the parent Company’s affairs as at 31 January 2017 and of the Group’s profit for the year then ended;
the Group financial statements have been properly prepared in accordance with International Financial Reporting Standards (“IFRSs”) as adopted by the European Union;
the parent Company financial statements have been properly prepared in accordance with United Kingdom Generally Accepted Accounting Practice, including Financial Reporting Standard 101 ‘Reduced Disclosure Framework’; and
the financial statements have been prepared in accordance with the requirements of the Companies Act 2006 and, as regards the Group financial statements, Article 4 of the IAS Regulation.
2. Overview
MaterialityOverall Group materiality of £7.6m which represents approximately 2% of earnings before interest, tax, depreciation and amortisation (EBITDA) adjusted for exceptional items.
Audit scopeWe performed an audit of the complete financial information of the Roadside Assistance and Insurance Services divisions and audit procedures on specific balances for the remaining divisions.
The divisions and entities where we performed full and specific scope audit procedures accounted for 97% of the Group’s revenue, 99% of the Group’s Trading EBITDA adjusted for exceptional items and 97% of the Group’s total assets.
Risk of material misstatement
Revenue recognition
Valuation of the net pension scheme liability
Goodwill impairment
Recognition and valuation of provisions: Duplicate breakdown cover
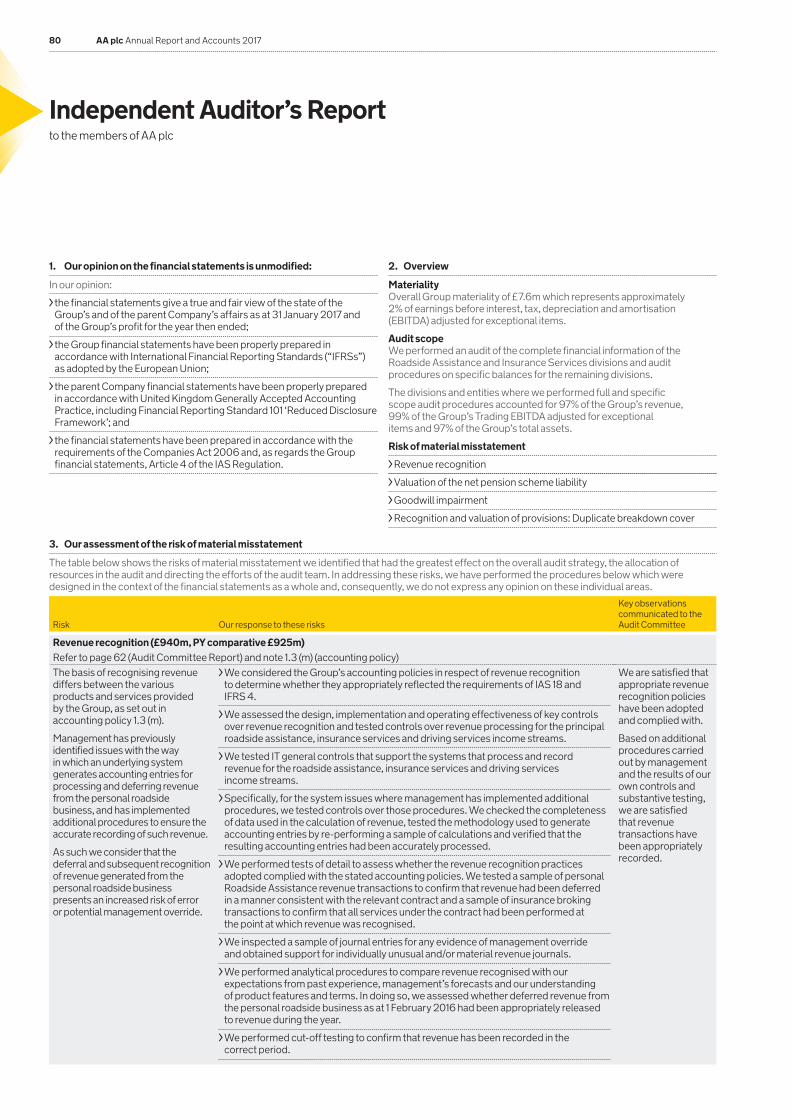
3. Our assessment of the risk of material misstatement
The table below shows the risks of material misstatement we identified that had the greatest effect on the overall audit strategy, the allocation of resources in the audit and directing the efforts of the audit team. In addressing these risks, we have performed the procedures below which were designed in the context of the financial statements as a whole and, consequently, we do not express any opinion on these individual areas.
Risk Our response to these risks
Key observations communicated to the Audit Committee
Revenue recognition (£940m, PY comparative £925m)Refer to page 62 (Audit Committee Report) and note 1.3 (m) (accounting policy)The basis of recognising revenue differs between the various products and services provided by the Group, as set out in accounting policy 1.3 (m).
Management has previously identified issues with the way in which an underlying system generates accounting entries for processing and deferring revenue from the personal roadside business, and has implemented additional procedures to ensure the accurate recording of such revenue.
As such we consider that the deferral and subsequent recognition of revenue generated from the personal roadside business presents an increased risk of error or potential management override.
We considered the Group’s accounting policies in respect of revenue recognition to determine whether they appropriately reflected the requirements of IAS 18 and IFRS 4.
We assessed the design, implementation and operating effectiveness of key controls over revenue recognition and tested controls over revenue processing for the principal roadside assistance, insurance services and driving services income streams.
We tested IT general controls that support the systems that process and record revenue for the roadside assistance, insurance services and driving services income streams.
Specifically, for the system issues where management has implemented additional procedures, we tested controls over those procedures. We checked the completeness of data used in the calculation of revenue, tested the methodology used to generate accounting entries by re-performing a sample of calculations and verified that the resulting accounting entries had been accurately processed.
We performed tests of detail to assess whether the revenue recognition practices adopted complied with the stated accounting policies. We tested a sample of personal Roadside Assistance revenue transactions to confirm that revenue had been deferred in a manner consistent with the relevant contract and a sample of insurance broking transactions to confirm that all services under the contract had been performed at the point at which revenue was recognised.
We inspected a sample of journal entries for any evidence of management override and obtained support for individually unusual and/or material revenue journals.
We performed analytical procedures to compare revenue recognised with our expectations from past experience, management’s forecasts and our understanding of product features and terms. In doing so, we assessed whether deferred revenue from the personal roadside business as at 1 February 2016 had been appropriately released to revenue during the year.
We performed cut-off testing to confirm that revenue has been recorded in the correct period.
We are satisfied that appropriate revenue recognition policies have been adopted and complied with.
Based on additional procedures carried out by management and the results of our own controls and substantive testing, we are satisfied that revenue transactions have been appropriately recorded.
Independent Auditor’s Report to the members of AA plc

Our B
usinessG
overnanceFinancial Statem
entsO
ur Performance
AA plc Annual Report and Accounts 2017 81
Risk Our response to these risks
Key observations communicated to the Audit Committee
Valuation of the net pension scheme liability under IAS 19 (R ) (£395m, PY comparative £296m)Refer to page 62 (Audit Committee Report), note 1.3 (l) (accounting policy) and note 25 (disclosures)The Group operates three defined benefit pension schemes, the most significant of which is the AA UK defined benefit pension scheme (AAUK). We consider the valuation of the AAUK net pension liability to be a significant risk as:
The actuarial assumptions used to value the pension scheme liabilities are judgemental and sensitive.
The schemes hold some complex and illiquid assets for which there are no quoted prices. Prices are obtained directly from the relevant investment managers who apply judgement in valuing those assets.
Due to the significance of the value of the AAUK pension obligation, a small change in actuarial assumptions may result in a material difference to the amounts reported.
We understood and walked through management’s controls in respect of the selection of key assumptions related to the valuation of actuarial liabilities and the valuation of scheme assets.
Using external data we verified the appropriateness of the key actuarial assumptions used by management in determining the pension obligation under IAS 19(R ), as detailed in note 25 of the consolidated financial statements.
We determined whether the assumptions used met the requirements of IFRS and were in line with market practice, as well as the specific circumstances of the schemes and their participants. This included a comparison of life expectancy with relevant mortality tables, benchmarking inflation and discount rates against external market data, considering changes in historical assumptions and evaluating the independence, qualifications and results of work performed by management’s experts involved in the valuation process. We used our pension valuation experts to assist us with these procedures.
We obtained net asset value (NAV) statements in respect of the schemes’ investments directly from the fund administrator and reconciled them to both the scheme’s custody records and the Group financial statements.
Where applicable we reviewed administrator controls reports for controls over valuation of complex assets.
We obtained and reviewed a sample of audited fund financial statements to assess whether the NAV was appropriate.
We tested the assets held in equity markets and confirmed the valuation of those equities.
We tested the data used to perform scheme valuations to gain comfort that the data is complete and accurate and agrees to underlying payroll records.
We reviewed the disclosures relating to the defined benefit schemes.
Based on our procedures we are satisfied that the values of assets held within the scheme are appropriately supported.
We concluded that assumptions used to determine the defined benefit obligation fall within an acceptable range.
Goodwill impairment (carrying value £1,173m, PY comparative £1,199m)Refer to page 62 (Audit Committee Report), note 1.3 (i) (accounting policy) and notes 11 and 26 (disclosures)The goodwill balance as at 31 January 2017 is significant based on its size relative to the total assets of the Group.
The AA plc goodwill arising on consolidation represents the excess of the cost of acquisition over the Group’s interest in the fair value of the identified assets and liabilities at the date of acquisition in 2004.
Management analyses discounted cash flows at the cash generating unit (CGU) level to calculate the value in use for each CGU as required by IAS 36. This calculation represents a significant estimate including judgements related to future Trading EBITDA growth and discount rate assumptions.
In the current financial year, the Group completed the sale of AA Ireland. This resulted in £26m of goodwill being disposed of in the year.
We examined management’s impairment model, which included an assessment of discounted cash flows, to understand the significant assumptions used in the impairment test for each CGU.
We engaged our valuation experts to assess the reasonableness of the discount rate by considering the Group specific circumstances as well as comparable companies from similar sectors.
We performed sensitivity analysis to assess the impact of certain key variables on levels of headroom, including discount rate and Trading EBITDA growth assumptions.
We confirmed the appropriate accounting treatment in respect of the goodwill relating to the disposed of the AA Ireland business.
We confirmed compliance with the Group’s accounting policy.
Based on our procedures, which included additional sensitivity analysis, we are satisfied that no impairment of the recorded goodwill has been identified.

82 AA plc Annual Report and Accounts 2017
Independent Auditor’s Report continued
Risk Our response to these risks
Key observations communicated to the Audit Committee
Recognition and valuation of provisions: Duplicate breakdown cover (£10m, PY comparative £nil)Refer to page 62 (Audit Committee Report), note 1.3 (u) (accounting policy) and notes 4 and 21 (disclosures)In the current year, AA management has become aware of some duplication of Roadside Assistance cover taken by customers who meet certain criteria while being personal Members and holding Added Value Accounts (AVAs) with AA’s banking partners. Through its review of data, management has identified a group of customers for whom the benefit of holding both forms of cover is not clear. Steps are being taken to remediate.
A provision of £10m has been reported by management at 31 January 2017, reflecting its assessment of the cost of remediation which includes refunds of policy premiums. £7m of the provision is presented as an exceptional revenue provision with £3m being the finance charge that represents interest accrual on the refunded policy premiums.
The duplicate breakdown cover provision requires the use of estimates in determining the likelihood of a refund occurring and is dependent on individual customer circumstances. Variability in assumptions can result in measurement uncertainty and a range of potential outcomes.
As a result, the duplicate breakdown cover provision has been added as an area of audit emphasis for the current year.
We inspected legal and regulatory correspondence up to the date of issuance of these financial statements.
We obtained management’s assessment of the provision and based on the actual customer outcomes to date and sensitivity analysis, assessed the reasonableness of the key assumptions that inform the estimate. We recalculated a range of outcomes reflecting variables in those assumptions.
We tested the completeness of underlying data and verified a sample to individual case records in order to assess accuracy.
We confirmed the provision meets the recognition criteria set out in IAS 37 ‘Provisions, Contingent Liabilities and Contingent Assets’.
We are satisfied that the duplicate breakdown cover provision meets the recognition criteria set out in IAS 37 and disclosures in the 31 January 2017 financial statements are in accordance with the applicable accounting framework.
Taking into consideration the variability of assumptions, we consider the provision amount recognised as at 31 January 2017 to be within an acceptable range.

Our B
usinessG
overnanceFinancial Statem
ents
AA plc Annual Report and Accounts 2017 83
Our Perform
ance
4. Involvement with component team
In establishing our overall approach to the Group audit, we determined the type of work that needed to be undertaken at each of the components by us, as the primary audit engagement team, or by the component auditors operating under our instruction.
The Insurance component team is responsible for the audit of the Insurance Services and Insurance Underwriting segments. The Group audit team is responsible for the audit of the Group function and all other components.
The Group audit team provided detailed audit instructions to the component team which included guidance on areas of focus, including the relevant risks of material misstatement detailed above, and set out the information required to be reported to the Group team.
The Group team reviewed key work papers and participated in the planning and execution of the component team’s audit of the identified risks. The Group team attended the closing meetings with the management of the Insurance Companies and attended key Audit Committee meetings.
The work performed on the components, together with the additional procedures performed at Group level, gave us appropriate evidence for our opinion on the consolidated financial statements as a whole.
5. Our application of materiality
We apply the concept of materiality both in planning and performing our audit, and in evaluating the effect of identified misstatements on our audit and of uncorrected misstatements, if any, on the financial statements and in forming our opinion in the Audit Report.
MaterialityMateriality is the magnitude of an omission or misstatement that, individually or in the aggregate, could reasonably be expected to influence the economic decisions of the users of the financial statements. Materiality provides a basis for determining the nature and extent of our audit procedures.
When establishing our overall audit strategy, we determined a magnitude of uncorrected misstatements that we judged would be material for the financial statements as a whole. We determined materiality for the Group to be £7.6m (prior year £8.0m), which is approximately 2% of Trading EBITDA adjusted for exceptional items. We base our materiality on a Trading EBITDA performance measure as Trading EBITDA is the key metric used by management in measuring and reporting on the performance of the business. In presenting its measure of Trading EBITDA, management adjusts Trading EBITDA for non-recurring items and also certain recurring items that are not allocated in assessing segment performance. In calculating materiality, we have adjusted Trading EBITDA only for exceptional items which we considered to be non-recurring. This provided a basis for determining the nature, timing and extent of risk assessment procedures, identifying and assessing the risk of material misstatement and determining the nature, timing and extent of further audit procedures.
During the course of our audit, we reassessed initial materiality. Our final calculated materiality did not result in any substantive change in our audit procedures.
Performance materialityPerformance materiality is the application of materiality at the individual account or balance level. It is set at an amount to reduce to an appropriately low level the probability that the aggregate of uncorrected and undetected misstatements exceeds materiality.
On the basis of our risk assessments, together with our assessment of the Group’s overall control environment, our judgement is that overall performance materiality (ie our tolerance for misstatement in an individual account or balance) for the Group should be 50% of materiality, namely £3.8m (prior year £4.0m). Our objective in adopting this approach is to ensure that total uncorrected and undetected audit differences do not exceed our materiality of £7.6m for the financial statements as whole.
Audit work at individual components is undertaken based on a percentage of our total performance materiality. The performance materiality set for each component is based on the relative size of the component and our view of the risk of misstatement at that component. The range of the performance materiality allocated to components was £0.8m to £2.7m (prior year £0.8m to £2.9m).
Reporting thresholdWe agreed with the Audit Committee that we would report to the Committee all audit differences in excess of £0.4m, which is set at approximately 5% of planning materiality, as well as differences below that threshold that, in our view, warranted reporting on qualitative grounds. We evaluate any uncorrected misstatements against both the quantitative measures of materiality discussed above and in the light of other relevant qualitative considerations.
6. An overview of the scope of our audit
Following our assessment of the risk of material misstatement to the Group financial statements, our audit scope focused on the two largest components, Roadside Assistance and Insurance Services, which were subject to a full scope audit for the year ended 31 January 2017. For the remaining components (Driving Services and Insurance Underwriting) and the statutory entities containing the Group’s borrowings and related hedging instruments, pension scheme balances and Head Office costs, specific audit procedures were performed that were impacted by our assessed risks of material misstatement. The components for which we performed full scope audits accounted for 93% of the Group’s revenue, 92% of the Group’s Trading EBITDA and 61% of the Group’s total assets.
The specific scope component contributed 4% of the Group’s revenue, 7% of the Group’s Trading EBITDA and 36% of the Group’s total assets. The audit scope of these components may not have included testing of all significant accounts of the component but will have contributed to the coverage of significant accounts tested for the Group.
The remaining components together represent 1% of the Group’s Trading EBITDA. For these components, we performed other procedures, including analytical review, testing of consolidation journals and intercompany eliminations to respond to any potential risks of material misstatement to the Group financial statements.

84 AA plc Annual Report and Accounts 2017
Independent Auditor’s Report continued
Items not allocated to a segment and therefore not included in the Trading EBITDA coverage, include the difference between the cash contributions to the pension schemes for ongoing service and the calculated annual service cost and share-based payments. Pensions and Incentive Schemes have been subject to specific substantive audit procedures as set out in this report.
The charts below illustrate the coverage obtained from the work performed by our audit teams.
7. What we have audited
We have audited the financial statements of AA plc for the year ended 31 January 2017 which comprise:
Group
the consolidated income statement
the consolidated statement of comprehensive income
the consolidated statement of financial position
the consolidated statement of changes in equity
the consolidated statement of cash flows
the related notes 1 to 36 to the consolidated financial statements
Company
the company statement of financial position
the company statement of changes in equity
the related notes 1 to 11 to the company financial statements
The financial reporting framework that has been applied in the preparation of the Group financial statements is applicable law and International Financial Reporting Standards (IFRSs) as adopted by the European Union.
The financial reporting framework that has been applied in the preparation of the parent Company financial statements is applicable law and United Kingdom Accounting Standards (United Kingdom Generally Accepted Accounting Practice), including Financial Reporting Standard 101 ‘Reduced Disclosure Framework’.
This report is made solely to the Company’s members, as a body, in accordance with Chapter 3 of Part 16 of the Companies Act 2006. Our audit work has been undertaken so that we might state to the Company’s members those matters we are required to state to them in an auditor’s report and for no other purpose. To the fullest extent permitted by law, we do not accept or assume responsibility to anyone other than the Company and the Company’s members as a body, for our audit work, for this report, or for the opinions we have formed.
8. Respective responsibilities of Directors and auditor
As explained more fully in the Directors’ Responsibilities Statement set out on page 78, the Directors are responsible for the preparation of the financial statements and for being satisfied that they give a true and fair view. Our responsibility is to audit and express an opinion on the financial statements in accordance with applicable law and International Standards on Auditing (UK and Ireland). Those standards require us to comply with the Auditing Practices Board’s Ethical Standards for Auditors.
9. Scope of the audit of the financial statements
An audit involves obtaining evidence about the amounts and disclosures in the financial statements sufficient to give reasonable assurance that the financial statements are free from material misstatement, whether caused by fraud or error. This includes an assessment of: whether the accounting policies are appropriate to the Group’s and the parent Company’s circumstances and have been consistently applied and adequately disclosed; the reasonableness of significant accounting estimates made by the Directors; and the overall presentation of the financial statements. In addition, we read all the financial and non-financial information in the Annual Report and Accounts to identify material inconsistencies with the audited financial statements and to identify any information that is apparently materially incorrect based on, or materially inconsistent with, the knowledge acquired by us in the course of performing the audit. If we become aware of any apparent material misstatements or inconsistencies we consider the implications for our report.
10. Opinion on other matters prescribed by the Companies Act 2006
In our opinion:
the part of the Directors’ Remuneration Report to be audited has been properly prepared in accordance with the Companies Act 2006; and
based on the work undertaken in the course of the audit:
the information given in the Strategic Report and the Directors’ Report for the financial year for which the financial statements are prepared is consistent with the financial statements; and
the Strategic Report and the Directors’ Report have been prepared in accordance with applicable legal requirements.
In light of the knowledge and understanding of the Company and its environment obtained in the course of the audit, we have identified no material misstatements in the Strategic Report or Directors’ Report.
TRADING EBITDA (%)
Full scope components 92%Specific scope components 7%Other procedures 1%
REVENUE (%)
Full scope components 93%Specific scope components 4%Other procedures 3%
TOTAL ASSETS (%)
Full scope components 61%Specific scope components 36%Other procedures 3%
Our B
usinessG
overnanceFinancial Statem
ents
AA plc Annual Report and Accounts 2017 85
Our Perform
ance
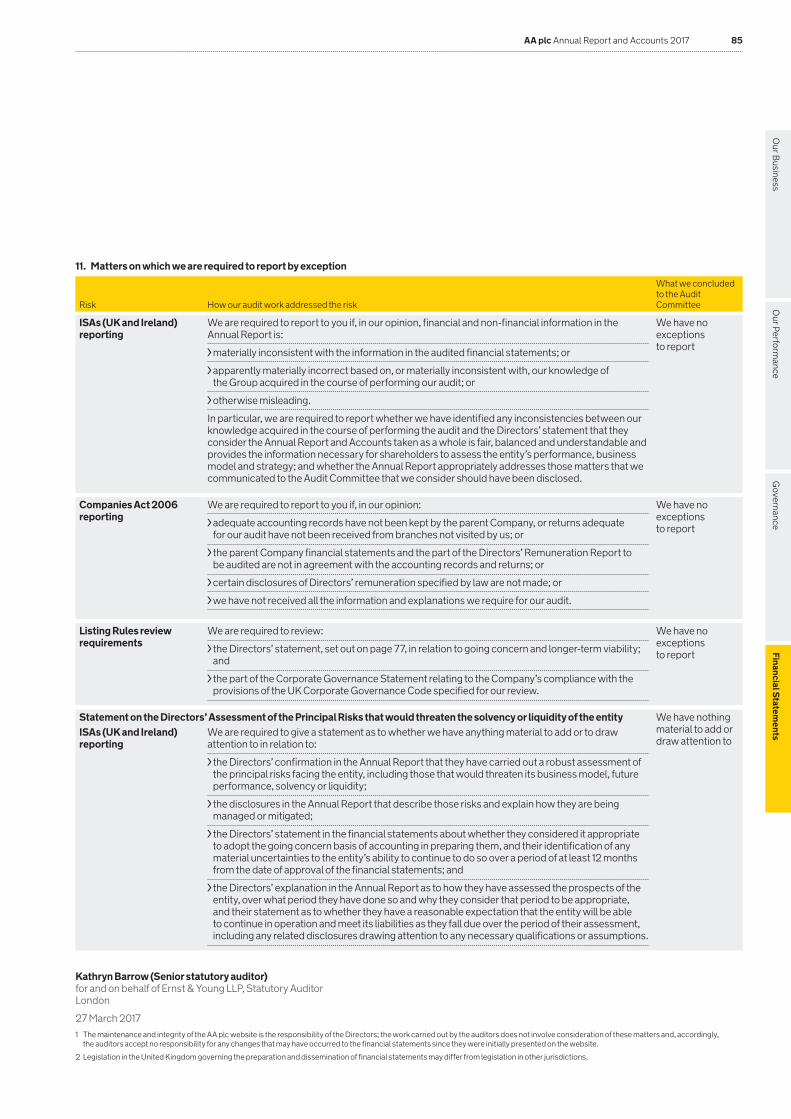
11. Matters on which we are required to report by exception
Risk How our audit work addressed the risk
What we concluded to the Audit Committee
ISAs (UK and Ireland) reporting
We are required to report to you if, in our opinion, financial and non-financial information in the Annual Report is:
materially inconsistent with the information in the audited financial statements; or
apparently materially incorrect based on, or materially inconsistent with, our knowledge of the Group acquired in the course of performing our audit; or
otherwise misleading.
In particular, we are required to report whether we have identified any inconsistencies between our knowledge acquired in the course of performing the audit and the Directors’ statement that they consider the Annual Report and Accounts taken as a whole is fair, balanced and understandable and provides the information necessary for shareholders to assess the entity’s performance, business model and strategy; and whether the Annual Report appropriately addresses those matters that we communicated to the Audit Committee that we consider should have been disclosed.
We have no exceptions to report
Companies Act 2006 reporting
We are required to report to you if, in our opinion:
adequate accounting records have not been kept by the parent Company, or returns adequate for our audit have not been received from branches not visited by us; or
the parent Company financial statements and the part of the Directors’ Remuneration Report to be audited are not in agreement with the accounting records and returns; or
certain disclosures of Directors’ remuneration specified by law are not made; or
we have not received all the information and explanations we require for our audit.
We have no exceptions to report
Listing Rules review requirements
We are required to review:
the Directors’ statement, set out on page 77, in relation to going concern and longer-term viability; and
the part of the Corporate Governance Statement relating to the Company’s compliance with the provisions of the UK Corporate Governance Code specified for our review.
We have no exceptions to report
Statement on the Directors’ Assessment of the Principal Risks that would threaten the solvency or liquidity of the entity We have nothing material to add or draw attention to
ISAs (UK and Ireland) reporting
We are required to give a statement as to whether we have anything material to add or to draw attention to in relation to:
the Directors’ confirmation in the Annual Report that they have carried out a robust assessment of the principal risks facing the entity, including those that would threaten its business model, future performance, solvency or liquidity;
the disclosures in the Annual Report that describe those risks and explain how they are being managed or mitigated;
the Directors’ statement in the financial statements about whether they considered it appropriate to adopt the going concern basis of accounting in preparing them, and their identification of any material uncertainties to the entity’s ability to continue to do so over a period of at least 12 months from the date of approval of the financial statements; and
the Directors’ explanation in the Annual Report as to how they have assessed the prospects of the entity, over what period they have done so and why they consider that period to be appropriate, and their statement as to whether they have a reasonable expectation that the entity will be able to continue in operation and meet its liabilities as they fall due over the period of their assessment, including any related disclosures drawing attention to any necessary qualifications or assumptions.
Kathryn Barrow (Senior statutory auditor)for and on behalf of Ernst & Young LLP, Statutory Auditor London
27 March 20171 The maintenance and integrity of the AA plc website is the responsibility of the Directors; the work carried out by the auditors does not involve consideration of these matters and, accordingly,
the auditors accept no responsibility for any changes that may have occurred to the financial statements since they were initially presented on the website.
2 Legislation in the United Kingdom governing the preparation and dissemination of financial statements may differ from legislation in other jurisdictions.

86 AA plc Annual Report and Accounts 2017
Consolidated income statement for the year ended 31 January
Note2017
£m2016
£m
Continuing operationsTrading Revenue 2 940 925Revenue from business disposed of 2 – 10Exceptional revenue provision 2 (7) –Group Revenue 2 933 935Cost of sales (341) (337)Gross profit 592 598Administrative & marketing expenses (309) (302)Share of profits of joint ventures and associates, net of tax 1 1Operating profit 284 297Trading EBITDA 2 403 402Items not allocated to a segment 5 (20) (18)Amortisation and depreciation 11,13 (67) (51)Impairment of investment in joint venture 14 (1) –Exceptional operating items 4 (31) (36)
Operating profit 4 284 297Finance costs 6 (185) (289)Finance income 7 1 1Profit before tax 100 9Tax expense 9 (26) (10)Profit/(loss) for the year from continuing operations 74 (1)Discontinued operationsProfit for the year from discontinued operations 3 80 7Profit for the year 154 6
Earnings per share from profit/(loss) for the year Note2017
pence2016
pence
Basic from total operations 10 25.3 1.0Basic from continuing operations 10 12.2 (0.2)Basic from discontinued operations 10 13.1 1.2Diluted from total operations 10 25.3 1.0Diluted from continuing operations 10 12.2 (0.2)Diluted from discontinued operations 10 13.1 1.2
The accompanying notes are an integral part of this consolidated income statement.

Our B
usinessG
overnanceFinancial Statem
ents
AA plc Annual Report and Accounts 2017 87
Our Perform
ance
Note2017
£m2016
£m
Profit for the year 154 6Other comprehensive income on items that may be reclassified to profit and loss in subsequent yearsExchange differences on translation of foreign operations 2 1Effective portion of changes in fair value of cash flow hedges 13 10Tax effect 9 (1) (2)
14 9Other comprehensive income on items that will not be reclassified to profit and loss in subsequent yearsRemeasurement on (losses)/gains on defined benefit schemes 25 (99) 149Tax effect 9 17 (26)
(82) 123Total other comprehensive income (68) 132Total comprehensive income for the year 86 138
The accompanying notes are an integral part of this consolidated statement of comprehensive income.
Consolidated statement of comprehensive income for the year ended 31 January

88 AA plc Annual Report and Accounts 2017
Note2017
£m2016
£m
Non-current assetsGoodwill and other intangible assets 11 1,283 1,298Property, plant and equipment 13 131 122Investments in joint ventures and associates 14 10 10Deferred tax assets 9 62 52
1,486 1,482Current assetsInventories 15 6 5Trade and other receivables 16 195 172Cash and cash equivalents 17 211 166
412 343Total assets 1,898 1,825
Current liabilitiesTrade and other payables 18 (520) (518)Current tax payable (11) (7)Provisions 21 (19) (8)
(550) (533)Non-current liabilitiesBorrowings and loans 19 (2,819) (2,920)Finance lease obligations 29 (20) (21)Defined benefit pension scheme liabilities 25 (395) (296)Provisions 21 (11) (7)Insurance technical provisions 22 (16) (4)
(3,261) (3,248)Total liabilities (3,811) (3,781)Net liabilities (1,913) (1,956)Equity Share capital 23 1 1Share premium 24 403 399Own shares 24 (26) (22)Currency translation reserve 24 1 (1)Cash flow hedge reserve 24 2 (10)Retained earnings 24 (2,294) (2,323)Total equity attributable to equity holders of the parent (1,913) (1,956)
Signed for and on behalf of the Board on 27 March 2017 by:
Bob Mackenzie Martin ClarkeExecutive Chairman Chief Financial Officer
The accompanying notes are an integral part of this consolidated statement of financial position.
Consolidated statement of financial position as at 31 January
Our B
usinessG
overnanceFinancial Statem
ents
AA plc Annual Report and Accounts 2017 89
Our Perform
ance
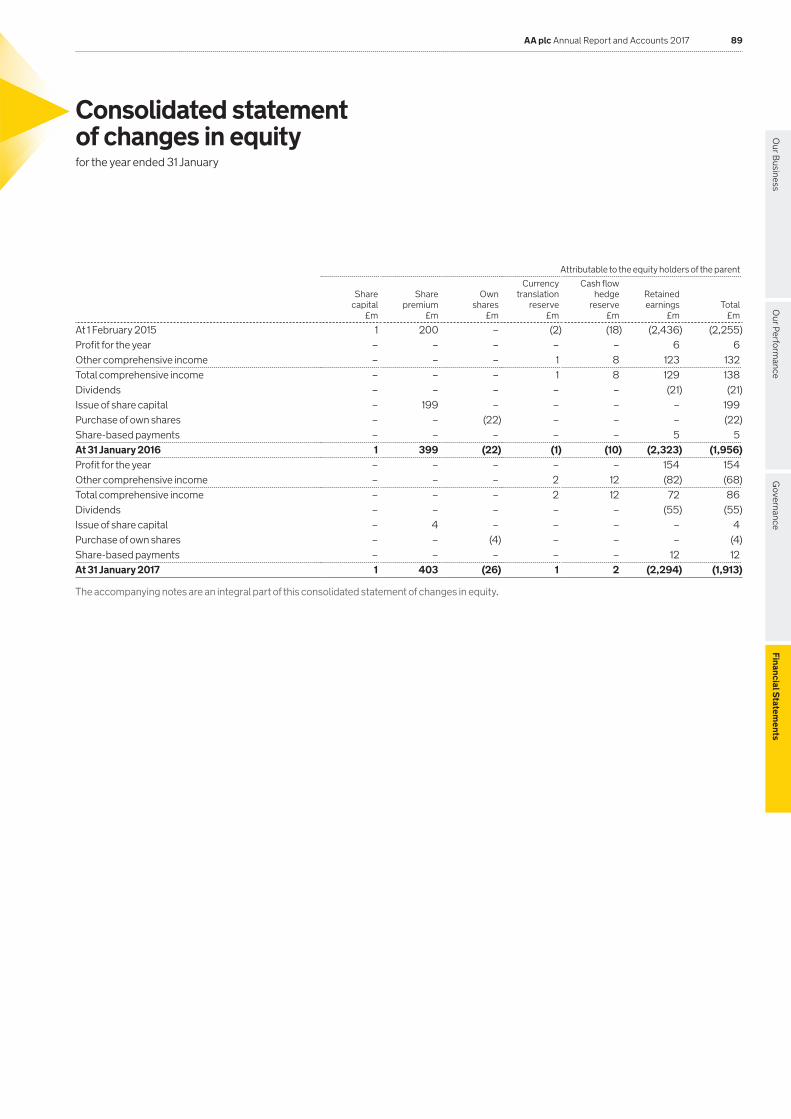
Attributable to the equity holders of the parent
Share capital
£m
Share premium
£m
Own shares
£m
Currency translation
reserve £m
Cash flow hedge
reserve £m
Retained earnings
£mTotal
£m
At 1 February 2015 1 200 – (2) (18) (2,436) (2,255)Profit for the year – – – – – 6 6Other comprehensive income – – – 1 8 123 132Total comprehensive income – – – 1 8 129 138Dividends – – – – – (21) (21)Issue of share capital – 199 – – – – 199Purchase of own shares – – (22) – – – (22)Share-based payments – – – – – 5 5At 31 January 2016 1 399 (22) (1) (10) (2,323) (1,956)Profit for the year – – – – – 154 154Other comprehensive income – – – 2 12 (82) (68)Total comprehensive income – – – 2 12 72 86Dividends – – – – – (55) (55)Issue of share capital – 4 – – – – 4Purchase of own shares – – (4) – – – (4)Share-based payments – – – – – 12 12At 31 January 2017 1 403 (26) 1 2 (2,294) (1,913)
The accompanying notes are an integral part of this consolidated statement of changes in equity.
Consolidated statement of changes in equityfor the year ended 31 January

90 AA plc Annual Report and Accounts 2017
Note2017
£m2016
£m
Profit before tax from continuing and discontinued operations 184 17Amortisation and depreciation 11,13 68 54Net finance costs 6,7 184 288Other adjustments to profit before tax (62) 12Working capital:(Increase)/decrease in trade and other receivables (45) 13Increase in trade and other payables 23 6Increase/(decrease) in provisions 24 (6)Difference between pension charge and cash contributions (10) (1)Total working capital adjustments (8) 12Net cash flows from operating activities before tax 366 383Tax paid (21) (2)Net cash flows from operating activities 345 381Investing activitiesCapital expenditure (71) (75)Proceeds from sale of fixed assets 18 11Acquisitions and disposals, net of cash acquired or disposed of 3 99 (8)Interest received 1 1Net cash flows from investing activities 47 (71)Financing activitiesProceeds from borrowings 700 735Issue costs on borrowings (6) (16)Debt repayment premium and penalties (30) (62)Repayment of borrowings (766) (1,039)Share capital issued – 199Refinancing transactions (102) (183)Purchase of own shares – (22)Interest paid on borrowings (143) (178)Payment of finance lease capital (43) (34)Payment of finance lease interest (7) (8)Dividends paid (55) (21)Net cash flows from financing activities (350) (446)Net increase/(decrease) in cash and cash equivalents 42 (136)Net foreign exchange differences 3 –Cash and cash equivalents at 1 February 166 302Cash and cash equivalents at 31 January 17 211 166
The cash flows from operating activities are stated net of cash outflows relating to exceptional items of £15m (2016: £37m). This relates to the cost of business transformation of £11m (2016: £21m), non-recurring costs of IT system implementation and cost restructuring activities of £7m (2016: £7m), share issue costs of £nil (2016: £1m), refinancing of the Group’s borrowings £nil (2016: £4m), and a net cash inflow from onerous property lease provisions in respect of vacant properties of £3m (2016: £4m outflow).
Other adjustments to profit before tax of £62m (2016: inflow of £12m) include profit on sale of Ireland £77m (2016: £nil), share of profit from joint ventures and associates of £1m (2016: profit of £1m), share based payments of £12m (2016: £5m), loss on sale of fixed assets of £3m (2016: £3m), impairment of investment in joint ventures of £1m (2016: £nil) and loss on disposal of Autowindshields of £nil (2016: £5m).
Operating cash flows from discontinued operations were £10m (2016: £14m) (see note 3).
The accompanying notes are an integral part of this consolidated statement of cash flows.
Consolidated statement of cash flowsfor the year ended 31 January

Our B
usinessG
overnanceFinancial Statem
ents
AA plc Annual Report and Accounts 2017 91
Our Perform
ance
Notes to the consolidated financial statements
1 Basis of preparation and accounting policies
1.1 General informationThe consolidated financial statements for the year ended 31 January 2017 comprise the financial statements of AA plc (‘the Company’) and its subsidiaries (together referred to as ‘the Group’). AA plc is a public limited company incorporated and domiciled in England and Wales.
These statements and the prior year comparatives have been presented to the nearest £million.
1.2 Basis of preparationThe Group has prepared these statements under International Financial Reporting Standards (IFRS) as adopted by the European Union, International Financial Reporting Interpretation Council (IFRIC) interpretations and those parts of the Companies Act 2006 applicable to companies reporting under IFRS.
These consolidated financial statements have been prepared under the historic cost convention as modified by the measurement of derivatives and liabilities for contingent consideration in business combinations at fair value.
a) Going concernThe Group is highly cash generative with a large proportion of its revenues coming from recurring transactions. The significant customer loyalty demonstrated by high renewal rates and lengthy customer tenure underpins this and in addition to the cash balances at the reporting date the Group has agreed undrawn credit facilities. The majority of the Group’s borrowings are long term in nature with no borrowings due within 12 months from the date of signing of these financial statements. For the Group’s longer term viability, it remains a key assumption of the Directors that the Group continues to have ready access to both public debt and equity markets to enable these borrowings to be easily refinanced in due course. The Directors have reviewed projected cash flows for a period of one year from the date of signing these financial statements and have concluded that the Group has sufficient funds to continue trading for this period and the foreseeable future. Therefore, the financial statements have been prepared using the going concern basis.
b) Basis of consolidationThe consolidated financial statements incorporate the financial statements of the Company and entities controlled by the Company (its subsidiaries). Control is achieved where the Company has rights to variable returns from its involvement with the entity and has the ability to influence those returns through its power over the entity.
The results of subsidiaries acquired or disposed of during the year are included in the consolidated income statement from the effective date of acquisition or up to the effective date of disposal, as appropriate. Where necessary, adjustments are made to the financial statements of subsidiaries to bring the accounting policies into line with those used by the Group. All intra-group transactions, balances, income and expenses are eliminated on consolidation.
1.3 Accounting policiesThe principal accounting policies are set out below.
a) Interests in joint ventures and associatesAn associate is an entity over which the Group is in a position to exercise significant influence, but not control or joint control, through participating in the financial and operating policy decisions of the entity. Joint ventures are joint arrangements whereby the parties that have joint control of the arrangement have rights to the net assets of the arrangement.
The results, assets and liabilities of joint ventures and associates are incorporated in these financial statements using the equity method of accounting. Investments in joint ventures and associates are carried in the Group balance sheet at cost, including direct acquisition costs, as adjusted by post-acquisition changes in the Group’s share of the net assets less any impairment losses.
b) Foreign currenciesThese financial statements are presented in pound sterling, which is the currency of the primary economic environment in which the Group operates.
Transactions in currencies other than the functional currency of each consolidated undertaking are recorded at rates of exchange prevailing on the dates of the transactions. Monetary assets and liabilities denominated in foreign currencies are translated into the respective functional currency at rates of exchange ruling at the balance sheet date. Gains and losses arising on the translation of assets and liabilities are taken to the income statement.
The results of overseas operations are translated into sterling at average rates of exchange for the period. Exchange differences arising on the retranslation of the opening net assets of overseas operations are transferred to the Group’s cumulative translation reserve in equity.
c) Business combinations and goodwillAll business combinations are accounted for by applying the acquisition method.
Costs related to the acquisition, other than those associated with the issue of debt or equity securities, are expensed as incurred.
Goodwill arising on consolidation represents the excess of the cost of acquisition over the Group’s interest in the fair value of the identified assets and liabilities of a subsidiary at the date of acquisition. Goodwill is recognised as an asset at cost less accumulated impairment losses.
Any contingent consideration payable is recognised at fair value at the acquisition date, and subsequent changes to the fair value of the contingent consideration are recognised in profit or loss. Any consideration paid to a former owner who continues to work for the business as part of the acquisition that is contingent on future service is excluded from goodwill and treated as acquisition earn-out costs within items not allocated to a segment in administrative and marketing expenses.
d) Intangible assetsIntangible assets other than goodwill which are acquired separately are stated at cost. The cost of intangible assets acquired in a business combination is their fair value as at the date of acquisition.
Following initial recognition, intangible assets are carried at cost less any accumulated amortisation and impairment losses. Intangible assets with finite lives are amortised over the useful economic life.
e) Software and development costsSoftware development expenditures on an individual project are recognised as an intangible asset when the Group can demonstrate:
The technical feasibility of completing the intangible asset so that it will be available for use or sale
Its intention to complete and its ability to use or sell the asset
How the asset will generate future economic benefits
The availability of resources to complete the asset
The ability to measure reliably the expenditure during development
Following initial recognition of the development expenditure as an asset, the cost model is applied. The asset is carried at cost less any accumulated amortisation and impairment losses. Amortisation of the asset begins when development is complete and the asset is available for use. It is amortised over its useful life of three to five years.

92 AA plc Annual Report and Accounts 2017
1 Basis of preparation and accounting policies (continued)
1.3 Accounting policies (continued)f) Property, plant and equipmentLand and buildings held for use in the production of goods and services or for administrative purposes are stated in the balance sheet at cost or fair value for assets acquired in a business combination less any subsequent accumulated depreciation and impairment losses. No capitalised interest is included in the cost of items of property, plant and equipment.
Property, plant and equipment is stated at cost less accumulated depreciation and impairment losses. Such costs include costs directly attributable to making the asset capable of operating as intended. The cost of property, plant and equipment less their expected residual value is depreciated by equal instalments over their useful economic lives. These lives are as follows:
Buildings 50 years Related fittings 3–20 years Leasehold properties over the period of the lease IT systems (hardware) 3–5 years Plant, vehicles and other equipment 3–10 years
Assets held under finance leases are depreciated on a straight line basis over the lease term.
g) InventoriesInventories are stated at the lower of cost and net realisable value. Costs include all costs incurred in bringing each product to its present location and condition. Net realisable value is based on estimated selling price less any further costs expected to be incurred to completion and disposal.
h) Financial instrumentsFinancial assets and financial liabilities are recognised on the Group’s balance sheet when the Group becomes a party to the contractual provisions of the instrument. They are classified according to the substance of the contractual arrangements entered into. At each reporting date the Group assesses whether there is any objective evidence that a financial asset or a group of financial assets is impaired.
Trade receivables and trade payablesTrade receivables and trade payables are not interest bearing and are recognised initially at fair value. A provision for impairment of trade receivables is established when there is objective evidence that the Group will not be able to collect all amounts due according to the original terms of the receivables.
Cash and cash equivalentsCash and cash equivalents comprise cash balances and call deposits with an original maturity less than three months.
Debt instrumentsDebt is initially recognised in the balance sheet at fair value less transaction costs incurred directly in connection with the issue of the instrument. Debt issue fees in respect of the instrument, including premiums and discounts on issue, are capitalised at inception and charged to the income statement over the term of the instrument using the effective interest method. Issue costs relating to the extinguishment of debt are charged to the profit and loss account immediately.
Equity instruments (share capital issued by the Group)An equity instrument is any contract that evidences a residual interest in the assets of the Group after deducting all its liabilities. Equity instruments are recognised at the fair value of proceeds received less direct issue costs.
Derivative financial instrumentsThe Group’s capital structure exposes it to the financial risk of changes in interest rates and fuel prices. The Group uses interest rate and fuel swap contracts to hedge these exposures.
Derivative financial instruments are recorded in the balance sheet at fair value. The fair value of derivative financial instruments is determined by reference to market values for similar financial instruments. The gain or loss on remeasurement to fair value is recognised immediately in profit or loss unless they qualify for hedge accounting as described below.
Cash flow hedgesChanges in the fair value of derivative financial instruments that are designated as highly effective hedges of future cash flows are recognised in other comprehensive income. Any ineffective portion of the hedge is recognised immediately in the income statement. Amounts recognised in other comprehensive income are reclassified from equity to profit and loss (within finance costs) in the period when the hedged item affects profit or loss. When a hedging instrument expires or is sold, or when a hedge no longer meets the criteria for hedge accounting, any cumulative gain or loss recognised in the other comprehensive income at that time remains in equity and is reclassified when the hedged transaction is ultimately recognised in the income statement.
In order to qualify for hedge accounting, the Group is required to document from inception the relationship between the item being hedged and the hedging instrument and demonstrate that the hedge will be highly effective on an ongoing basis. This effectiveness testing is performed at each period end to ensure that the hedge remains highly effective.
i) Impairment of assetsThe carrying amounts of the Group’s non-financial assets, other than inventories and deferred tax assets, are reviewed at each reporting date to determine whether there is any indication of impairment. If any such indication exists, then the asset’s recoverable amount is estimated. In addition, goodwill and intangible assets not yet available for use are tested for impairment annually.
For the purpose of impairment testing, assets that cannot be tested individually are grouped together into the smallest group of assets that generates cash inflows from continuing use that are largely independent of the cash inflows of other assets or groups of assets (the cash generating units or “CGUs”). The goodwill acquired in a business combination is allocated to CGUs so that the level at which impairment is tested reflects the lowest level at which goodwill is monitored for internal reporting purposes.
The recoverable amount of an asset or cash generating unit is the greater of its value in use and its fair value less costs to sell. In assessing value in use, the estimated future cash flows are discounted to their present value using a pre-tax discount rate that reflects current market assessments of the time value of money and the risks specific to the asset.
An impairment loss is recognised if the carrying amount of an asset or its CGU exceeds its estimated recoverable amount. Impairment losses are recognised in profit or loss. Impairment losses recognised in respect of CGUs are allocated first to reduce the carrying amount of any allocated goodwill and then to reduce the carrying amounts of the other assets on a pro rata basis.
An impairment loss in respect of goodwill is not reversed. In respect of other assets, an impairment loss is reversed if there has been a change in the estimates used to determine the recoverable amount. An impairment loss is reversed only to the extent that the asset’s carrying amount does not exceed the carrying amount that would have been determined, net of depreciation or amortisation, if no impairment loss had been recognised.
Notes to the consolidated financial statements continued

Our B
usinessG
overnanceFinancial Statem
ents
AA plc Annual Report and Accounts 2017 93
Our Perform
ance
1 Basis of preparation and accounting policies (continued)
1.3 Accounting policies (continued)j) LeasesFinance leases transfer substantially all of the risks and rewards of ownership to the lessee. All other leases are classified as operating leases.
Assets held under finance leases are recognised as assets of the Group at their fair value or, if lower, at the present value of the minimum lease payments, each determined at the inception of the lease. The corresponding liability to the lessor is shown as a financial liability. Lease payments are apportioned between finance charges and the lease obligation so as to achieve a constant rate of interest on the remaining balance of the liability. Finance charges are charged directly to the income statement.
Rentals payable and receivable under operating leases are charged, or credited, to the income statement on a straight-line basis over the term of the relevant lease. Any incentives to enter into an operating lease are recognised evenly over the lease term.
k) ProvisionsA provision is required when the Group has a present legal or constructive obligation as a result of a past event and it is probable that settlement will be required of an amount that can be reliably estimated. Provisions are discounted where the impact is material.
Provisions for restructuring costs are recognised when the Group has a detailed formal plan for the restructuring that has been communicated to affected parties.
For property leases, where a decision has been made prior to the year end to permanently vacate the property, provision is made for future rent and similar costs net of any rental income expected to be received up to the estimated date of final disposal.
l) Retirement benefit obligationThe Group’s position in respect of defined benefit pension plans is calculated by estimating the amount of future benefit that employees have earned in return for their service in the current and prior periods; that benefit is discounted to determine its present value, and the fair value of any plan assets (at bid price) is deducted. The Group determines the net interest on the net defined benefit liability for the period by applying the discount rate used to measure the defined benefit obligation at the beginning of the annual period to the net defined benefit liability.
The discount rate is the yield at the reporting date on bonds that have a credit rating of at least AA, with maturity dates approximating the terms of the Group’s obligations, and that are denominated in the currency in which the benefits are expected to be paid.
Remeasurements arising from defined benefit plans comprise actuarial gains and losses and the return on plan assets (excluding interest). The Group recognises them immediately in other comprehensive income and all other expenses related to defined benefit plans in administrative and marketing expenses in profit or loss.
When the benefits of a plan are changed, or when a plan is curtailed, the portion of the changed benefit related to past service by employees, or the gain or loss on curtailment, is recognised immediately in profit or loss when the plan amendment or curtailment occurs.
The calculation of the defined benefit obligations is performed by a qualified actuary using the projected unit credit method. When the calculation results in a benefit to the Group, the recognised asset is limited to the present value of benefits available in the form of any future refunds from the plan or reductions in future contributions and takes into account the adverse effect of any minimum funding requirements.
For defined contribution schemes, the amounts recognised in profit or loss are the contributions payable in the year.
m) Revenue recognitionRevenue is measured at the fair value of the consideration receivable less any discounts and excluding value added tax and other sales related taxes.
Roadside membership subscriptions and premiums receivable on underwritten insurance products are apportioned on a time basis over the period where the Group is liable for risk cover. The unrecognised element of subscriptions and premiums receivable, relating to future periods, is held within liabilities as deferred income and provision for unearned premiums.
Commission income from insurers external to the Group is recognised at the commencement of the period of risk.
Where customers choose to pay by instalments, the Group charges interest based on the principal outstanding and disclosed interest rate and recognises this income over the course of the loan.
For all other revenue, income is recognised at point of delivery of goods or on provision of service. This includes work which has not yet been fully invoiced, provided that it is considered to be fully recoverable.
n) Insurance contractsAn insurance contract is a contract under which insurance risk is transferred to the issuer of the contract by another party. In the roadside assistance segment, the Group accepts insurance risk from its customers under roadside recovery service contracts by agreeing to provide services whose frequency and cost is uncertain. Claims and expenses arising from these contracts are recognised in profit or loss as incurred. The Group also has insurance risk within the insurance underwriting segment on insurance products underwritten by the Group.
At the balance sheet date, a liability adequacy test is performed to ensure the adequacy of the insurance contract liabilities. In performing these tests, current estimates of future cash outflows arising under insurance contracts are considered and compared with the carrying amount of deferred income, provision for unearned premiums and other insurance contract liabilities. Any deficiency is immediately recognised in profit or loss and an onerous contract provision is established.
The estimation of the ultimate liability from claims made under insurance contracts for breakdown recovery is not considered to be one of the Group’s most critical accounting estimates. This is because there is a very short period of time between the receipt of a claim, eg. a breakdown, and the settling of that claim. Consequently, there are no significant provisions for unsettled claims costs in respect of the roadside assistance services.
The provision for outstanding claims relating to products with insurance risk within the insurance underwriting segment is set on an individual claim basis and is based on the ultimate cost of all claims notified but not settled, less amounts already paid by the reporting date, together with a provision for related claims handling costs. The provision also includes the estimated cost of claims incurred but not reported at the statement of financial position date (“IBNR”), which is set using statistical methods. Both outstanding claims and IBNR are not discounted for the time value of money. The amount of any anticipated reinsurance, salvage or subrogation recoveries is separately identified and reported within trade and other receivables and insurance contract liabilities respectively. Differences between the provisions at the reporting date and settlements and provisions in the following year are recognised in the income statement as they arise.
ReinsuranceThe Group undertakes a programme of reinsurance in respect of the policies which it underwrites. Outward reinsurance premiums are accounted for in the same accounting period as the related inward insurance premiums and are included as a deduction from earned premium, and therefore as a reduction in revenue. The amount of any anticipated reinsurance recoveries is treated as a reduction in claims costs.

94 AA plc Annual Report and Accounts 2017
Notes to the consolidated financial statements continued
1 Basis of preparation and accounting policies (continued)
1.3 Accounting policies (continued)o) Exceptional items and adjusted earnings per shareExceptional operating items are events or transactions that fall within the operating activities of the Group and which by virtue of their size or incidence have been disclosed in order to improve a reader’s understanding of the financial statements.
In addition, occasionally there are events or transactions that fall below operating profit that are one-off in nature and items within operating profit that relate to transactions that do not form part of the ongoing segment performance and which by virtue of their size or incidence have been separately disclosed in the financial statements.
Adjusted earnings per share adjusts profit after tax for items that are either discontinued operations, one-off in nature or relate to transactions that do not form part of the ongoing performance of the Group.
p) Finance income and costsFinance costs comprise interest payable, finance charges on finance leases recognised in profit or loss using the effective interest method, amortisation of debt issue fees, unwinding of the discount on provisions (including the net defined benefit obligations) and net foreign exchange losses that are recognised in the income statement (see foreign currency accounting policy).
Finance income comprises interest receivable on funds invested and net foreign exchange gains.
Foreign currency gains and losses are reported on a net basis.
q) TaxationTax on the profit or loss for the year comprises current and deferred tax.
Current tax is the expected tax payable or receivable on the taxable income or loss for the year, using tax rates enacted or substantively enacted at the balance sheet date, and any adjustment to tax payable in respect of previous years.
Deferred tax is provided on temporary differences between the carrying amounts of assets and liabilities for financial reporting purposes and the amounts used for taxation purposes. The following temporary differences are not provided for: the initial recognition of goodwill; the initial recognition of assets or liabilities that affect neither accounting nor taxable profit other than in a business combination; and differences relating to investments in subsidiaries to the extent that they will probably not reverse in the foreseeable future. The amount of deferred tax provided is based on the expected manner of realisation or settlement of the carrying amount of assets and liabilities, using tax rates enacted or substantively enacted at the balance sheet date.
A deferred tax asset is recognised only to the extent that it is probable that future taxable profits will be available against which the temporary difference can be utilised. The carrying amount of deferred tax assets is reviewed at each balance sheet date and reduced to the extent that it is no longer probable that sufficient taxable profits will be available to allow all or part of the asset to be recovered.
r) Segmental analysisThe Group reports its operations using the segments that are reported for management purposes. Segments are based on business operations because this is where Group risk and return is focused.
s) Share-based paymentsThe Group operates a number of equity settled, share-based payment compensation plans for employees. The fair value of the equity settled awards is measured at the grant date based on expectations of performance conditions being met. The fair value of the awards is recognised as an expense with a corresponding credit to reserves.
t) Discontinued operations and disposalsA discontinued operation is a component of the Group’s business, the operations and cash flows of which can be clearly distinguished from the rest of the Group and which:
Represents a separate major line of business or geographical area of operations;
Is part of a single coordinated plan to dispose of a separate major line of business or geographical area of operations; or
Is a subsidiary acquired exclusively with a view to re-sale
Classification as a discontinued operation occurs on disposal or when the operation meets the criteria to be classified as held for sale, if earlier.
When an operation is classified as a discontinued operation, the consolidated income statement is represented as if the operation had been discontinued from the start of the comparative year.
u) Critical accounting estimates and judgementsEstimates are evaluated continually and are based on historical experience and other factors, including expectations of future events that are believed to be reasonable under the circumstances. The Group makes estimates and assumptions about the future. The resulting accounting estimates will, by definition, seldom equal the related actual results.
Management has exercised judgement in applying the Group’s accounting policies and in making critical estimates. The underlying assumptions on which these judgements are based, are reviewed on an ongoing basis and include the selection of assumptions in relation to the retirement benefit obligation and assumptions for future growth of cash flows to support the value-in-use calculations for the goodwill impairment review.
The principal estimates and assumptions that have a risk of causing an adjustment to the carrying amounts of assets and liabilities within the next financial period are discussed below.
Retirement benefit obligationThe Group’s retirement benefit obligation, which is actuarially assessed each period, is based on key assumptions including return on plan assets, discount rates, inflation, future salary and pension costs. These assumptions may be different to the actual outcome.
Derivative financial instrumentsThe fair value of derivative financial instruments is determined by reference to market values for similar financial instruments. The Group is therefore required to identify changes in market conditions around expectations for interest rates. These assumptions may be different to the actual outcome.
Goodwill The Group tests goodwill for impairment annually. The recoverable amounts of cash generating units have been determined based on value-in-use calculations which require the use of estimates. Management have prepared discounted cash flows based on the latest strategic plan.
Share-based paymentsThe Group has issued a number of share-based payment awards to employees during the year which are measured at fair value. This involves estimates about the expected volatility of the share price and the number of leavers over the vesting period.
Provision for duplicate breakdown coverThe Group has made a provision in revenue and finance costs for potential refunds due to customers who may have duplicate cover as a business-to-business customer and as a personal Member. This provision has required the use of estimates in determining the likelihood of a refund occurring and is dependent on individual customer circumstances. These estimates may be different to the actual outcome and include the split of the exceptional charge between revenue and finance costs.

Our B
usinessG
overnanceFinancial Statem
ents
AA plc Annual Report and Accounts 2017 95
Our Perform
ance
2 Segmental information2017
£m2016
£m
RevenueRoadside Assistance 742 724Insurance Services 131 131Driving Services 67 68Insurance Underwriting – 2Trading Revenue 940 925Revenue from business disposed of – 10Exceptional revenue provision (see note 21) (7) –Group Revenue 933 935
Trading EBITDARoadside Assistance 365 361Insurance Services 76 78Driving Services 20 19Insurance Underwriting (1) –Head Office costs (57) (56)Trading EBITDA 403 402
Items not allocated to a segment (20) (18)Amortisation and depreciation (67) (51)Impairment of investment in joint venture (1) –Exceptional operating items (31) (36)Operating profit 284 297Net finance costs (184) (288)Profit before tax from continuing operations 100 9
All segments operate principally in the UK. Turnover by destination is not materially different from turnover by origin.
During August 2015, AA plc Group agreed to dispose of its windscreen replacement subsidiary Autowindshields (UK) Limited. Contracts were exchanged in August 2015 and the sale was completed by the end of the previous financial year. The results of this business have been presented above as business disposed of.
The segmental results for the prior period have been restated to exclude Ireland which is now a discontinued operation (see note 3).
For management purposes, the Group is organised into business units based on their products and services. The Group has five reportable operating segments as follows:
Roadside Assistance: This segment is the largest part of the AA business. The AA provides a nationwide service, sending patrols out to Members stranded at the side of the road, repairing their vehicles where possible and getting them back on their way quickly and safely.
Insurance Services: This segment includes the insurance brokerage activities of the AA, primarily in arranging motor and home insurance for customers, its home emergency activities and its intermediary financial services business.
Driving Services: This segment contains the AA Driving School and the British School of Motoring, which are the two largest driving schools in the UK, as well as AA DriveTech, which provides driver training and educative programmes.
Insurance Underwriting: This segment consists of the insurance underwriting and reinsurance activities of the AA. Any adjustments arising on consolidation of the Group’s insurance underwriting activities, such as the deferring of revenue relating to the broker, are included in this segment.
Head Office costs: This segment includes IT, finance, property and other back office support functions.
Segment performance is primarily evaluated using the Group’s key performance measures of Trading Revenue and Trading EBITDA.
Trading Revenue is revenue on a continuing basis adjusted for exceptional items and business disposed of. Trading EBITDA is profit after tax on a continuing basis as reported, adjusted for depreciation, amortisation, exceptional operating items, items not allocated to a segment, net finance costs, tax expense and business disposed of. This better reflects the Group’s underlying performance.
Items not allocated to a segment relate to transactions that do not form part of the ongoing segment performance and include transactions which are one-off in nature (see note 5).
Depreciation, amortisation, exceptional items, net finance costs and tax expense are not allocated to individual segments as they are managed on a group basis.
Segmental information is not presented for items in the statement of financial position as management does not view this information on a segmental basis.

96 AA plc Annual Report and Accounts 2017
Notes to the consolidated financial statements continued
3 Discontinued operations
On 11 August 2016, the Group completed the sale of its Irish business. The entities sold were AA Ireland Limited and its subsidiary undertakings. The Ireland business segment has therefore been reported as a discontinued operation as it represented a separate geographical area and the whole of the Irish operation was disposed of in the year.
As part of the transaction, the AA Ireland pension scheme, which is closed to future accrual, was transferred to AA Corporation Limited, a UK subsidiary of AA plc and will continue to be the responsibility of the Group.
a) Results of discontinued operations2017
£m2016
£m
Revenue 23 38Expenses (15) (25)Trading EBITDA 8 13Depreciation and amortisation (1) (3)Exceptional items – (2)Operating profit 7 8Profit on disposal of discontinued operations 77 –Profit before tax 84 8Tax (4) (1)Profit for the year from discontinued operations 80 7
Tax includes a charge of £1m (2016: £1m) in relation to the trading results of the discontinued operation and a charge of £3m (2016: £nil) in relation to tax due on the licensing of the brand to the Irish business segment. The tax due on the use of the brand has arisen over a number of years but has become material in the current financial year and related wholly to the discontinued operations. As this liability rests with the UK Group, any changes from the amounts provided will be reflected in the UK entity accounts going forward.
No additional tax arises on the profit on disposal of the Irish business segment mainly due to the application of the substantial shareholding exemption.
The profit from the sale of the Ireland business segment consisted of the following:£m
Proceeds 133Fees (3)Net assets (53)Profit on disposal of discontinued operations 77
Proceeds, net of fees, were £130m and allowed £106m of the Senior Term Facility to be repaid on 31 August 2016. Under the terms of our borrowings, we have held back £24m from the net proceeds in ring-fenced available cash to be used for potential future acquisitions. Any amounts not committed to an acquisition within 12 months from the AA Ireland completion date must be used to repay either Class A notes or the Senior Term Facility.
b) Net cash flows of discontinued operations2017
£m2016
£m
Operating cash flow 10 14Investing cash flow (3) (4)Total cash flows 7 10
During the year, the following cash flows arose as a result of Group acquisitions and disposals:£m
Cash proceeds from sale of Irish business segment 133Fees (3)Net cash proceeds from sale of Irish business segment 130Cash held in Irish business at point of disposal (31)Acquisitions and disposals, net of cash acquired or disposed of 99

Our B
usinessG
overnanceFinancial Statem
ents
AA plc Annual Report and Accounts 2017 97
Our Perform
ance
3 Discontinued operations (continued)
c) Net assets of discontinued operations at point of disposal
£mGoodwill 26Other intangible assets 9Property, plant and equipment 3Trade and other receivables 25Cash and cash equivalents 31Trade and other payables (39)Provisions - restructuring (1)Cumulative foreign exchange adjustment in reserves (1)Total 53
4 Operating profit
Operating profit from continuing operations is stated after charging:2017
£m2016
£m
Amortisation of owned intangible assets 33 21Depreciation of owned tangible fixed assets 12 10Depreciation of leased tangible fixed assets 22 20Operating lease rentals payable – land and buildings 4 5Exceptional operating items 31 36
Exceptional revenue included £7m for duplicate breakdown cover (2016: £nil). In addition, £3m was charged to exceptional finance charges, bringing the total exceptional amount for duplicate breakdown cover to £10m. See note 21 for further information.
Exceptional operating costs include £14m relating to business transformation costs (2016: £22m), £3m loss on disposal of fixed assets (2016: £3m), £3m for IT systems transformation (2016: £2m), £1m costs from onerous properties (2016: £2m income), £nil for the loss on disposal of Autowindshields (UK) Limited (2016: £5m), £nil relating to finance transactions (2016: £4m), and £3m mainly relating to non-recurring costs for cost restructuring activities (2016: £2m).
Costs from the current year refinancing in December 2016 were directly attributable to the issue and repayment of loan notes and have therefore been included either in finance costs or in borrowings as debt issue fees (see notes 6 and 20).
5 Items not allocated to a segment 2017
£m2016
£m
Share-based payments (see note 34) 12 5Difference between cash contributions to the pension scheme for ongoing service and the calculated annual service costs 8 13Total items not allocated to a segment 20 18

98 AA plc Annual Report and Accounts 2017
Notes to the consolidated financial statements continued
6 Finance costs 2017
£m2016
£m
Interest on external borrowings (147) (159)Finance charges payable under finance leases (8) (7)Total ongoing cash finance costs (155) (166)Ongoing amortisation of debt issue fees (5) (4)Net finance expense on defined benefit pension schemes (10) (12)Total ongoing non-cash finance costs (15) (16)Double-running interest on external borrowings – (19)Debt repayment premium and penalties (2) (62)Transfer from cash flow hedge reserve for extinguishment of cash flow hedge (6) (8)Debt issue fees immediately written off following repayment of borrowings (see note 20) (4) (18)Duplicate breakdown cover – interest on refunds (see note 21) (3) –Exceptional finance costs (15) (107)Total finance costs (185) (289)
Within interest on external borrowings is £10m (2016: £13m) of interest charged on the Senior Term Facility and £8m (2016: £8m) charged in relation to the interest rate swaps used to hedge the variable element of the Senior Term Facility (see note 20).
Double-running interest costs related to the double-running of the Class B/B2 notes from the time of issue of the Class B2 notes in April 2015 until the repayment of the Class B notes in July 2015.
During the previous year, the Group repaid the original Class B notes of £655m and PIK notes of £175m (see note 20). As a result, the Group incurred early repayment penalties of £58m for the Class B notes and £4m for the PIK notes.
During the year, the Group repaid £106m of the Senior Term Facility (2016: £209m), following which the Group transferred the fair value of the cash flow hedges related to the repayment of £6m (2016: £8m) from other comprehensive income to the income statement.
As part of the refinancing during the current year, the Group incurred a £2m premium cost in relation to the repayment of £165m of the Class B2 notes (see note 20). This premium was written off in the income statement.
7 Finance income2017
£m2016
£m
Interest receivable 1 1Total finance income 1 1
8 Staff costs2017
£m2016
£m
Wages and salaries 251 270Social security costs 25 24Retirement benefit costs 29 34
305 328
The average monthly number of persons employed under contracts of service during the year was:2017 2016
Operational 6,266 6,620Management and administration 1,188 1,242
7,454 7,862
Our B
usinessG
overnanceFinancial Statem
ents
AA plc Annual Report and Accounts 2017 99
Our Perform
ance
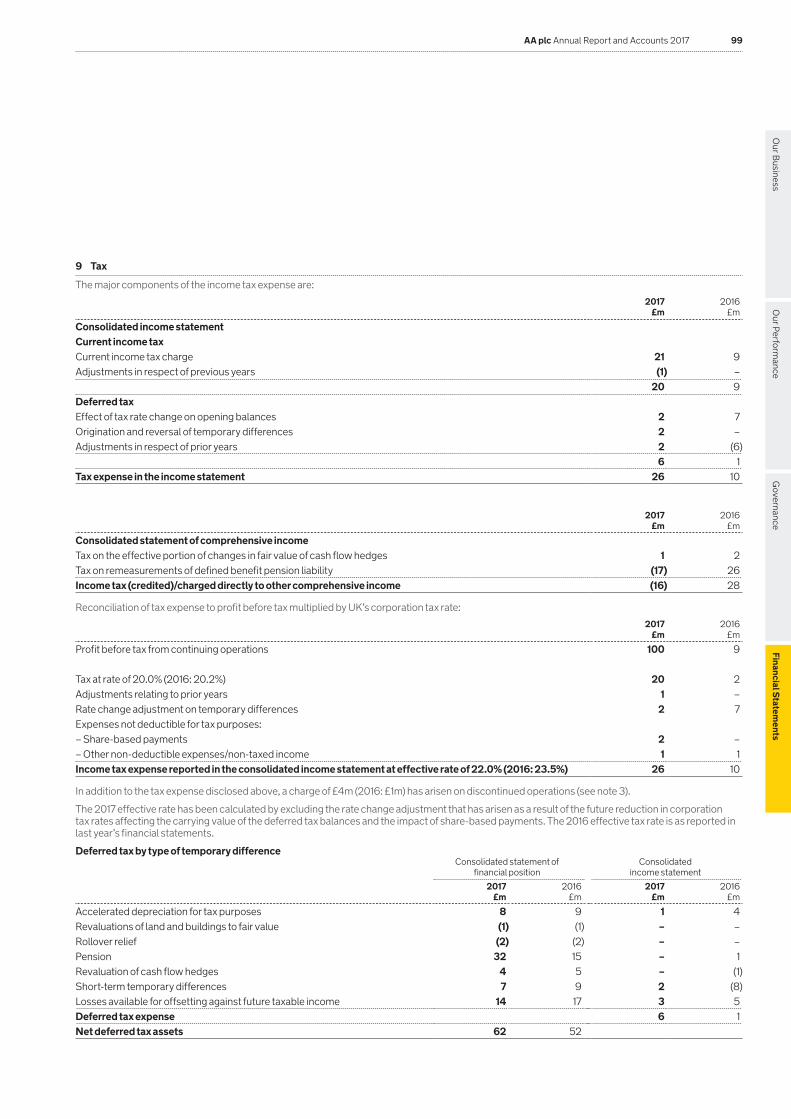
9 Tax
The major components of the income tax expense are:
2017 £m
2016 £m
Consolidated income statement Current income taxCurrent income tax charge 21 9Adjustments in respect of previous years (1) –
20 9Deferred taxEffect of tax rate change on opening balances 2 7Origination and reversal of temporary differences 2 –Adjustments in respect of prior years 2 (6)
6 1Tax expense in the income statement 26 10
2017 £m
2016 £m
Consolidated statement of comprehensive incomeTax on the effective portion of changes in fair value of cash flow hedges 1 2Tax on remeasurements of defined benefit pension liability (17) 26Income tax (credited)/charged directly to other comprehensive income (16) 28
Reconciliation of tax expense to profit before tax multiplied by UK’s corporation tax rate:2017
£m2016
£m
Profit before tax from continuing operations 100 9
Tax at rate of 20.0% (2016: 20.2%) 20 2Adjustments relating to prior years 1 –Rate change adjustment on temporary differences 2 7Expenses not deductible for tax purposes:– Share-based payments 2 –– Other non-deductible expenses/non-taxed income 1 1Income tax expense reported in the consolidated income statement at effective rate of 22.0% (2016: 23.5%) 26 10
In addition to the tax expense disclosed above, a charge of £4m (2016: £1m) has arisen on discontinued operations (see note 3).
The 2017 effective rate has been calculated by excluding the rate change adjustment that has arisen as a result of the future reduction in corporation tax rates affecting the carrying value of the deferred tax balances and the impact of share-based payments. The 2016 effective tax rate is as reported in last year’s financial statements.
Deferred tax by type of temporary differenceConsolidated statement of
financial positionConsolidated
income statement2017
£m2016
£m2017
£m2016
£m
Accelerated depreciation for tax purposes 8 9 1 4Revaluations of land and buildings to fair value (1) (1) – –Rollover relief (2) (2) – –Pension 32 15 – 1Revaluation of cash flow hedges 4 5 – (1)Short-term temporary differences 7 9 2 (8)Losses available for offsetting against future taxable income 14 17 3 5Deferred tax expense 6 1Net deferred tax assets 62 52

100 AA plc Annual Report and Accounts 2017
Notes to the consolidated financial statements continued
9 Tax (continued)
Reconciliation of net deferred tax assets2017
£m2016
£m
At 1 February 52 81Tax expense recognised in the income statement (6) (1)Tax income/(expense) recognised in OCI 16 (28)At 31 January 62 52
The Group offsets tax assets and liabilities if and only if it has a legally enforceable right to set off current tax assets and current tax liabilities and the deferred tax assets and deferred tax liabilities relate to income taxes levied by the same tax authority.
The UK corporation tax rate will reduce from 20% to 19% on 1 April 2017 and then to 17% (2016: 18%) on 1 April 2020. These rates have been substantively enacted at the balance sheet date and have therefore been included in the deferred tax calculations.
Deferred tax has been recognised at an overall rate of 17.2% for the UK at 31 January 2017 (2016: 18.4%) and 12.5% for Ireland as at 31 January 2016. The UK rate has been adjusted to reflect the expected reversal profile of the Group’s temporary differences.
The Group has tax losses which arose in the UK of £76m (2016: £92m) that are available indefinitely for offsetting against future taxable profits of the companies in which the losses arose. A deferred tax asset has been recognised in respect of these losses.
10 Earnings per share
Basic earnings per share amounts are calculated by dividing net profit for the year attributable to ordinary shareholders by the weighted average number of ordinary shares outstanding during the year.
2017 2016
Basic earnings per share:Profit after tax from total operations (£m) 154 6Weighted average number of shares outstanding (millions) 609 596Basic earnings per share from total operations (pence) 25.3 1.0
2017 2016
Basic earnings per share:Profit/(loss) after tax from continuing operations (£m) 74 (1)Weighted average number of shares outstanding (millions) 609 596Basic earnings per share from continuing operations (pence) 12.2 (0.2)
2017 2016
Basic earnings per share:Profit after tax from discontinued operations (£m) 80 7Weighted average number of shares outstanding (millions) 609 596Basic earnings per share from discontinued operations (pence) 13.1 1.2
For diluted earnings per share, the weighted average number of ordinary shares is adjusted to assume conversion of all potential dilutive ordinary shares.
Under the Group’s all employee share incentive plan, shares are purchased monthly at market value and are therefore not dilutive. In addition, matching shares are issued monthly at market value and are therefore not dilutive.
The Group has another class of potential dilutive ordinary shares relating to the MVP shares (see note 34). However, as at 31 January 2017, based on average market value of ordinary shares for the year, these were not dilutive.
There are no further classes of share that are dilutive as at 31 January 2017. 2017 2016
Weighted average number of ordinary shares in issue (millions) 609 596Potentially dilutive shares (millions) – –Weighted average number of diluted ordinary shares (millions) 609 596Diluted earnings per share from total operations (pence) 25.3 1.0Diluted earnings per share from continuing operations (pence) 12.2 (0.2)Diluted earnings per share from discontinued operations (pence) 13.1 1.2
Adjusted earnings per share adjusts profit after tax for items that are either discontinued operations, one-off in nature or relate to transactions that do not form part of the ongoing performance of the Group.

Our B
usinessG
overnanceFinancial Statem
ents
AA plc Annual Report and Accounts 2017 101
Our Perform
ance
10 Earnings per share (continued)2017 2016
Profit after tax from continuing operations as reported (£m) 74 (1)Adjusted for:Exceptional items (£m) 31 36Impairment of investment in joint venture (£m) 1 –Items not allocated to a segment (£m) 20 18Exceptional finance costs (see note 6) (£m) 15 107Tax expense (£m) 26 10Adjusted profit before tax (£m) 167 170Tax at the effective rate of 22.0% (2016: 23.5%) (£m) (37) (40)Adjusted profit after tax (£m) 130 130Weighted average number of shares outstanding (millions) 609 596Adjusted basic earnings per share (pence) 21.3 21.8Weighted average number of diluted ordinary shares (millions) 609 596Adjusted diluted earnings per share (pence) 21.3 21.8
11 Goodwill and other intangible assetsGoodwill
£mSoftware
£mTotal
£m
Cost At 1 February 2015 1,199 129 1,328 Additions – 64 64Disposals – (2) (2)At 31 January 2016 1,199 191 1,390Additions – 56 56Disposals – (30) (30)Disposed with sale of subsidiary (26) (14) (40)At 31 January 2017 1,173 203 1,376
Amortisation and impairmentAt 1 February 2015 – 71 71Amortisation – 21 21Amortisation within discontinued operations – 2 2Disposals – (2) (2)At 31 January 2016 – 92 92Amortisation – 33 33Amortisation within discontinued operations – 1 1Disposals – (29) (29)Disposed with sale of subsidiary – (5) (5)Exchange differences – 1 1At 31 January 2017 – 93 93
Net book value At 31 January 2017 1,173 110 1,283At 31 January 2016 1,199 99 1,298
Within software, £53m (2016: £53m) relates to assets under construction which are not amortised.
Software additions comprise £12m (2016: £13m) in relation to internally developed assets and £44m (2016: £51m) in relation to separately acquired assets.
The Group has reviewed and shortened the useful economic lives of some software assets, which are expected to be replaced by new software in the year ending 31 January 2018. As a result, amortisation for those assets has been recalculated resulting in an additional amortisation charge to the income statement of £3m.

102 AA plc Annual Report and Accounts 2017
Notes to the consolidated financial statements continued
12 Business combinations
Acquisitions during the year ended 31 January 2017 There were no acquisitions during the year ended 31 January 2017.
Acquisitions during the year ended 31 January 2016 On 18 August 2015, the Group acquired the entire share capital of XL Insurance (Gibraltar) Limited, an insurance underwriter, for a total consideration of £7m. It was then renamed AA Underwriting Insurance Company Limited.
13 Property, plant and equipmentFreehold
Land & Buildings £m
Long Leasehold Land & Buildings
£mVehicles
£m
Plant & equipment
£mTotal
£m
Cost At 1 February 2015 24 10 92 107 233 Additions – – 47 21 68Disposals – – (50) (3) (53)At 31 January 2016 24 10 89 125 248Additions – – 50 14 64Disposals – – (36) (42) (78)Disposed with sale of subsidiary – (3) (6) (8) (17)Exchange differences – – 1 1 2At 31 January 2017 24 7 98 90 219
Depreciation and impairmentAt 1 February 2015 6 4 37 86 133 Charge for the year 1 – 20 9 30Charge for the year within discontinued operations – – 1 – 1Disposals – – (36) (2) (38)At 31 January 2016 7 4 22 93 126Charge for the year – 1 23 10 34Disposals – – (16) (44) (60)Disposed with sale of subsidiary – (2) (4) (8) (14)Exchange differences – – 1 1 2At 31 January 2017 7 3 26 52 88
Net book value At 31 January 2017 17 4 72 38 131At 31 January 2016 17 6 67 32 122
The net book amount of vehicles includes £72m (2016: £65m) held under finance lease agreements. The accumulated depreciation on these assets is £26m (2016: £19m).
The net book amount of other assets includes £nil (2016: £nil) in respect of plant & machinery held under finance lease agreements. The accumulated depreciation on these assets is £8m (2016: £8m).
Within plant and equipment £4m (2016: £10m) relates to assets under construction which are not depreciated.

Our B
usinessG
overnanceFinancial Statem
ents
AA plc Annual Report and Accounts 2017 103
Our Perform
ance
14 Investments in joint ventures and associates2017 2016
Joint ventures
£mAssociates
£mTotal
£m
Joint ventures
£mAssociates
£mTotal
£m
At 1 February 6 4 10 1 3 4Additions 1 1 2 5 – 5Disposals – (1) (1) – – –Share of profits – 1 1 – 1 1Dividend received – (1) (1) – – –Impairment (1) – (1) – – –At 31 January 6 4 10 6 4 10
The joint ventures of the Group which are indirectly held are detailed below.Company Country of registration Nature of business
AA Law Limited (49% interest held)1 England Insurance services TVS Auto Assist (India) Limited (49% interest held)2 India Roadside servicesMotoriety UK Limited (50% interest held)3 England Roadside servicesIntelematics Europe Limited (32% interest held)4 England Roadside services
1 The Group exercises joint control over AA Law Limited through its equal representation on the Board.
2 The Group exercises joint control over TVS Auto Assist (India) Limited through its joint influence over key decision making.
3 The Group exercises joint control over Motoriety UK Limited through its joint influence over key decision making.
4 The Group exercises joint control over Intelematics Europe Limited through its joint influence over key decision making.
The associates of the Group which are indirectly held are listed below.Company Country of registration Nature of business
ARC Europe SA (20% interest held) Belgium Roadside services
During the year, the Group sold its interest in the shares of ACTA Assistance SA to ARC Europe SA. The other parties owning shares in ACTA Assistance SA and ARC Europe SA also sold their interest in ACTA Assistance for shares in ARC Europe so that the overall interest held in ARC Europe remained the same for each party.
The Group also received a dividend from ACTA Assistance during the year of £1m.
The investment in Motoriety was impaired from £1m to £nil as the Group does not deem the investment to be recoverable due to the loss making position of that company. On 23 February 2017, the board of directors of Motoriety UK Limited resolved to commence a pre-pack administration for its assets to be disposed of by an administrator.
15 Inventories2017
£m2016
£m
Finished goods 6 56 5
16 Trade and other receivables2017
£m2016
£m
CurrentTrade receivables 141 146Prepayments and accrued income 22 21Reinsurers’ share of insurance liability (see note 22) 28 1Other receivables 4 4
195 172
Included in trade receivables are amounts of £70m (2016: £89m) relating to amounts due from insurance broking customers.
Reinsurers’ share of insurance liability comprises £15m unearned reinsurance premiums and £13m reinsurance claims outstanding.

104 AA plc Annual Report and Accounts 2017
Notes to the consolidated financial statements continued
17 Cash and cash equivalents2017
£m2016
£m
Ring-fenced cash at bank and in hand – available 128 74Ring-fenced cash at bank and in hand – restricted 8 20Non ring-fenced cash at bank and in hand – available 60 58Non ring-fenced cash at bank and in hand – restricted 15 14
211 166
Ring-fenced cash and cash equivalents relate to cash held by AA Intermediate Co Limited and its subsidiaries. Dividends can only be paid to AA plc when certain debt to EBITDA and cash flow criteria are met.
Cash at bank and in hand includes £23m (2016: £34m) held by and on behalf of the Group’s insurance businesses which are subject to contractual or regulatory restrictions. The reduction in ring-fenced restricted cash since 31 January 2016 relates to the sale of the Irish business.
18 Trade and other payables 2017
£m2016
£m
Trade payables 97 110Other taxes and social security costs 27 23Accruals 57 67Deferred income 241 248Provision for unearned premiums in insurance underwriting (see note 22) 18 –Other payables 33 30Obligations under finance lease agreements (see note 29) 47 40
520 518
Included in trade payables are amounts of £82m (2016: £86m) relating to amounts due to underwriters in respect of insurance broking activities.
19 Borrowings and loans2017
£m2016
£m
Borrowings (see note 20) 2,799 2,893Interest rate swap used for hedging (see note 27) 20 27
2,819 2,920
The interest rate swap liability is shown on a net basis as the liability is settled with each counterparty on a net basis. On a gross basis, the asset is £19m (2016: £24m) and the liability is £39m (2016: £51m).
20 Borrowings
Expected maturity date Interest ratePrincipal
£mIssue costs
£m
Amortised issue costs
£m
Total at 31 January
2017 £m
Total at 31 January
2016 £m
Senior Term Facility 31 January 2019 5.00% 348 (3) 2 347 452Class A1 notes 31 July 2018 4.72% 175 (3) 3 175 474Class A2 notes 31 July 2025 6.27% 500 (1) – 499 499Class A3 notes 31 July 2020 4.25% 500 (3) 2 499 498Class A4 notes 31 July 2019 3.78% 55 (2) 2 55 249Class A5 notes 31 January 2022 2.88% 700 (37) 1 664 –Class B2 notes 31 July 2022 5.50% 570 (16) 6 560 721
4.63% 2,848 (65) 16 2,799 2,893
At 31 January 2017, the Senior Term Facility carried interest at a rate of LIBOR plus a margin of 2%. The variable element has been fully hedged using matching interest rate swap arrangements which fix LIBOR at 3.00% until 31 July 2018 and then at 4.93% until 31 January 2019. All other borrowings have fixed interest rates. The weighted average interest rate for all borrowings of 4.63% has been calculated using the effective interest rate and carrying values on 31 January 2017.
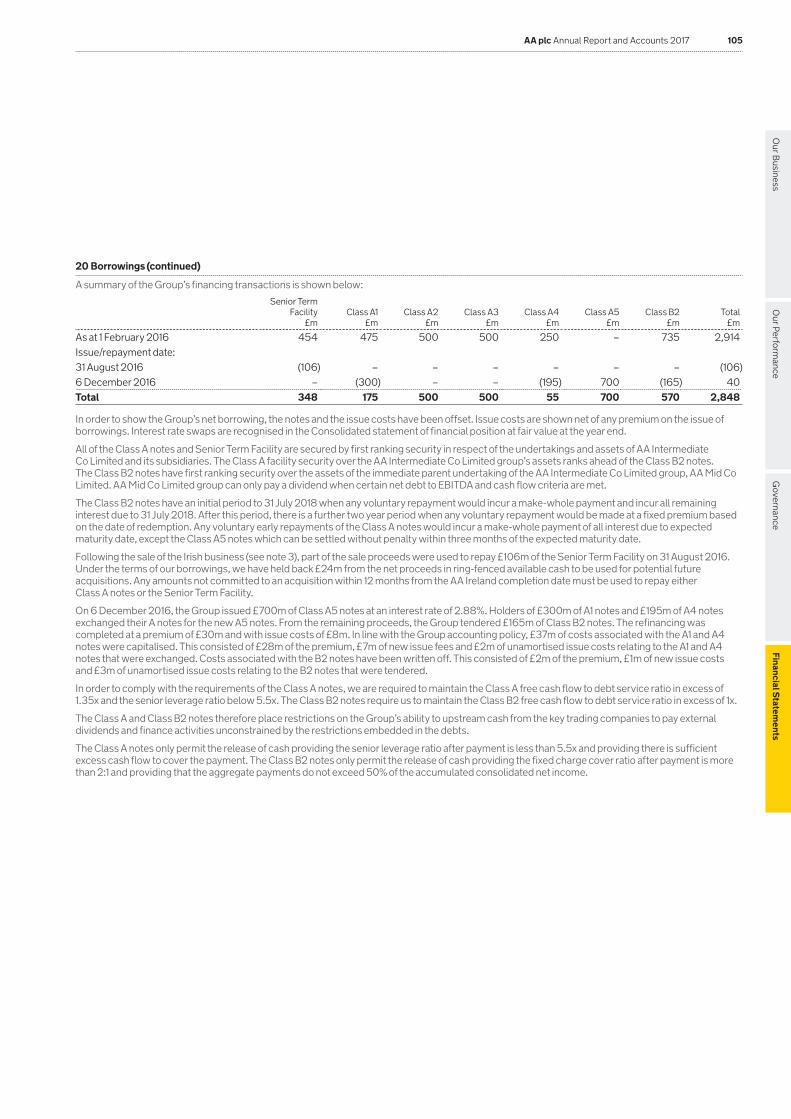
Our B
usinessG
overnanceFinancial Statem
ents
AA plc Annual Report and Accounts 2017 105
Our Perform
ance
20 Borrowings (continued)
A summary of the Group’s financing transactions is shown below:Senior Term
Facility £m
Class A1 £m
Class A2 £m
Class A3 £m
Class A4 £m
Class A5 £m
Class B2 £m
Total £m
As at 1 February 2016 454 475 500 500 250 – 735 2,914Issue/repayment date:31 August 2016 (106) – – – – – – (106)6 December 2016 – (300) – – (195) 700 (165) 40Total 348 175 500 500 55 700 570 2,848
In order to show the Group’s net borrowing, the notes and the issue costs have been offset. Issue costs are shown net of any premium on the issue of borrowings. Interest rate swaps are recognised in the Consolidated statement of financial position at fair value at the year end.
All of the Class A notes and Senior Term Facility are secured by first ranking security in respect of the undertakings and assets of AA Intermediate Co Limited and its subsidiaries. The Class A facility security over the AA Intermediate Co Limited group’s assets ranks ahead of the Class B2 notes. The Class B2 notes have first ranking security over the assets of the immediate parent undertaking of the AA Intermediate Co Limited group, AA Mid Co Limited. AA Mid Co Limited group can only pay a dividend when certain net debt to EBITDA and cash flow criteria are met.
The Class B2 notes have an initial period to 31 July 2018 when any voluntary repayment would incur a make-whole payment and incur all remaining interest due to 31 July 2018. After this period, there is a further two year period when any voluntary repayment would be made at a fixed premium based on the date of redemption. Any voluntary early repayments of the Class A notes would incur a make-whole payment of all interest due to expected maturity date, except the Class A5 notes which can be settled without penalty within three months of the expected maturity date.
Following the sale of the Irish business (see note 3), part of the sale proceeds were used to repay £106m of the Senior Term Facility on 31 August 2016. Under the terms of our borrowings, we have held back £24m from the net proceeds in ring-fenced available cash to be used for potential future acquisitions. Any amounts not committed to an acquisition within 12 months from the AA Ireland completion date must be used to repay either Class A notes or the Senior Term Facility.
On 6 December 2016, the Group issued £700m of Class A5 notes at an interest rate of 2.88%. Holders of £300m of A1 notes and £195m of A4 notes exchanged their A notes for the new A5 notes. From the remaining proceeds, the Group tendered £165m of Class B2 notes. The refinancing was completed at a premium of £30m and with issue costs of £8m. In line with the Group accounting policy, £37m of costs associated with the A1 and A4 notes were capitalised. This consisted of £28m of the premium, £7m of new issue fees and £2m of unamortised issue costs relating to the A1 and A4 notes that were exchanged. Costs associated with the B2 notes have been written off. This consisted of £2m of the premium, £1m of new issue costs and £3m of unamortised issue costs relating to the B2 notes that were tendered.
In order to comply with the requirements of the Class A notes, we are required to maintain the Class A free cash flow to debt service ratio in excess of 1.35x and the senior leverage ratio below 5.5x. The Class B2 notes require us to maintain the Class B2 free cash flow to debt service ratio in excess of 1x.
The Class A and Class B2 notes therefore place restrictions on the Group’s ability to upstream cash from the key trading companies to pay external dividends and finance activities unconstrained by the restrictions embedded in the debts.
The Class A notes only permit the release of cash providing the senior leverage ratio after payment is less than 5.5x and providing there is sufficient excess cash flow to cover the payment. The Class B2 notes only permit the release of cash providing the fixed charge cover ratio after payment is more than 2:1 and providing that the aggregate payments do not exceed 50% of the accumulated consolidated net income.
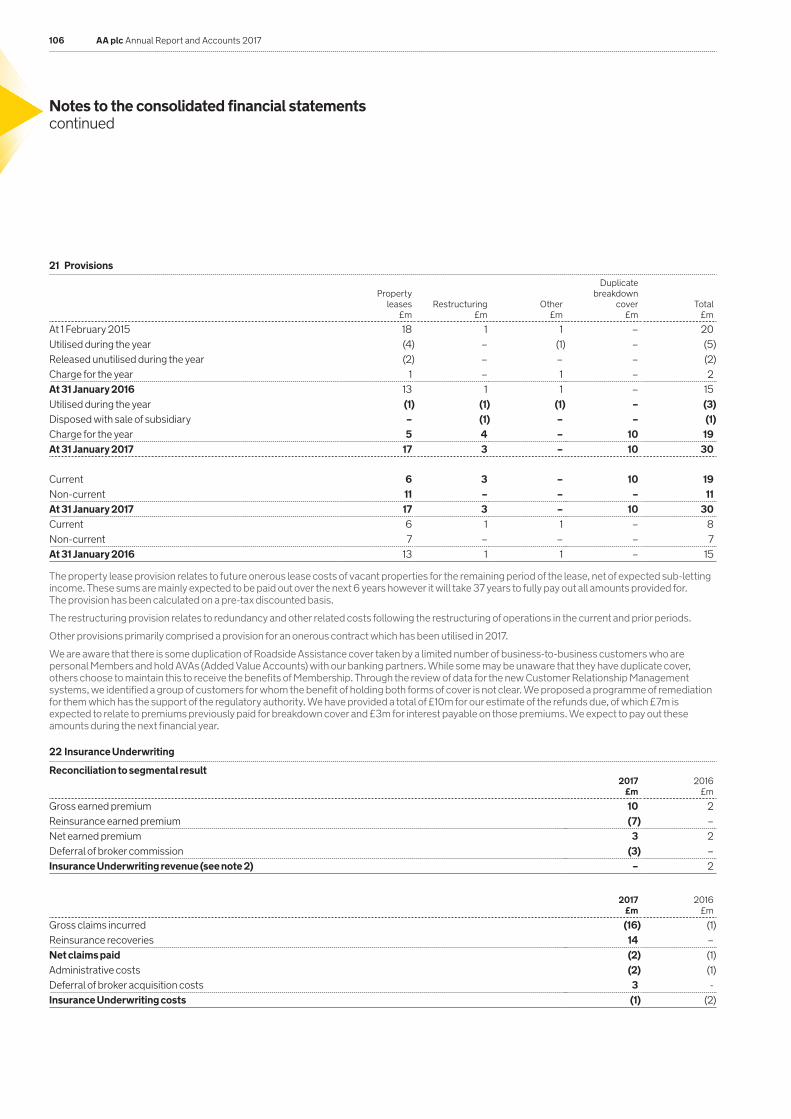
106 AA plc Annual Report and Accounts 2017
Notes to the consolidated financial statements continued
21 Provisions
Property leases
£mRestructuring
£mOther
£m
Duplicate breakdown
cover £m
Total £m
At 1 February 2015 18 1 1 – 20Utilised during the year (4) – (1) – (5)Released unutilised during the year (2) – – – (2)Charge for the year 1 – 1 – 2At 31 January 2016 13 1 1 – 15Utilised during the year (1) (1) (1) – (3)Disposed with sale of subsidiary – (1) – – (1)Charge for the year 5 4 – 10 19At 31 January 2017 17 3 – 10 30
Current 6 3 – 10 19Non-current 11 – – – 11At 31 January 2017 17 3 – 10 30Current 6 1 1 – 8Non-current 7 – – – 7At 31 January 2016 13 1 1 – 15
The property lease provision relates to future onerous lease costs of vacant properties for the remaining period of the lease, net of expected sub-letting income. These sums are mainly expected to be paid out over the next 6 years however it will take 37 years to fully pay out all amounts provided for. The provision has been calculated on a pre-tax discounted basis.
The restructuring provision relates to redundancy and other related costs following the restructuring of operations in the current and prior periods.
Other provisions primarily comprised a provision for an onerous contract which has been utilised in 2017.
We are aware that there is some duplication of Roadside Assistance cover taken by a limited number of business-to-business customers who are personal Members and hold AVAs (Added Value Accounts) with our banking partners. While some may be unaware that they have duplicate cover, others choose to maintain this to receive the benefits of Membership. Through the review of data for the new Customer Relationship Management systems, we identified a group of customers for whom the benefit of holding both forms of cover is not clear. We proposed a programme of remediation for them which has the support of the regulatory authority. We have provided a total of £10m for our estimate of the refunds due, of which £7m is expected to relate to premiums previously paid for breakdown cover and £3m for interest payable on those premiums. We expect to pay out these amounts during the next financial year.
22 Insurance Underwriting
Reconciliation to segmental result2017
£m2016
£m
Gross earned premium 10 2Reinsurance earned premium (7) –Net earned premium 3 2Deferral of broker commission (3) –Insurance Underwriting revenue (see note 2) – 2
2017 £m
2016 £m
Gross claims incurred (16) (1)Reinsurance recoveries 14 –Net claims paid (2) (1)Administrative costs (2) (1)Deferral of broker acquisition costs 3 -Insurance Underwriting costs (1) (2)

Our B
usinessG
overnanceFinancial Statem
ents
AA plc Annual Report and Accounts 2017 107
Our Perform
ance
22 Insurance Underwriting (continued)
Reconciliation of movements in the provision for unearned premiums2017
£m2016
£m
Gross unearned premiums at 1 February – –Less: unearned reinsurance premiums – –Net unearned premiums at 1 February – –
Gross premiums written 28 2Less: outward reinsurance premium (22) –Net premiums written 6 2
Gross premiums earned (10) (2)Less: reinsurance premium earned 7 –Net premiums earned (3) (2)
Gross unearned premiums at 31 January (see note 18) 18 –Less: unearned reinsurance premiums (see note 16) (15) –Net unearned premiums at 31 January 3 –
Reconciliation of movements in claims outstanding2017
£m2016
£m
Gross claims outstanding at 1 February 4 4Less: reinsurance claims outstanding (1) (1)Net claims outstanding at 1 February 3 3
Gross claims incurred 16 1Less: reinsurance recoveries (14) –Net claims incurred 2 1
Gross claims paid (4) (1)Less: received from reinsurance 2 –Net claims paid (2) (1)
Gross claims outstanding at 31 January (see below) 16 4Less: reinsurance claims outstanding (see note 16) (13) (1)Net claims outstanding at 31 January 3 3
On 7 December 2016, the Lord Chancellor announced a review into the discount rate for personal injury damages awards (the ‘Ogden rate’), which is used by UK courts in the calculation of personal injury lump sum settlements. On 27 February 2017, it was announced that there will be a reduction in the Ogden rate from 2.5% to minus 0.75% with effect from 20 March 2017. The Group has therefore adopted a discount rate of minus 0.75% in estimating claims liabilities in existence at 31 January 2017, which has increased both gross insurance technical provisions and the reinsurance claims outstanding by c. £3m. There is negligible impact on the Group’s operating profit.
Insurance technical provisions 2017
£m2016
£m
Outstanding claims provisions 10 2Other technical provisions – provisions for incurred but not reported claims 6 2
16 4
Provision is made for the estimated cost of claims incurred but not settled at the balance sheet date, including the cost of claims incurred but not yet reported. The estimated cost of claims includes expenses to be incurred in settling claims.

108 AA plc Annual Report and Accounts 2017
Notes to the consolidated financial statements continued
23 Share capital2017
£m2016
£m
Allotted, called up and fully paid609,461,827 (2016: 608,181,845) ordinary shares of £0.001 each 1 1
1 1
The voting rights of the holders of all ordinary shares are the same and all ordinary shares rank pari passu on a winding up. AA plc has no authorised ordinary share capital.
All movement in the number of shares relates to the issue of matching shares in relation to the staff share incentive plans (see note 34).
The MVP shares in issue were as follows: 2017
£0002016
£000
Allotted, called up and fully paid20,000,000 (2016: 20,000,000) MVP A shares of £0.001 each 20 2020,000,000 (2016: 20,000,000) MVP B shares of £0.001 each 20 2020,000,000 (2016: 20,000,000) MVP C shares of £0.001 each 20 20
60 60
The MVP shares have no voting rights. There are 8 million authorised shares in each of the following MVP share classes: A1, B1 and C1. There are 12 million authorised shares in each of the following MVP share classes: A2, B2 and C2. In total, there are 60 million authorised MVP shares. See also note 34.
24 Reserves
Share premium
£m
Own shares
£m
Currency translation
reserve £m
Cash flow hedge
reserve £m
Retained earnings
£m Total
£m
At 1 February 2015 200 – (2) (18) (2,436) (2,256)Retained profit for the year – – – – 6 6Dividends paid – – – – (21) (21)Purchase of own shares by the employee benefit trust – (22) – – – (22)Issue of shares 206 – – – – 206Share issue costs (7) – – – – (7)Share-based payments – – – – 5 5Other comprehensive income:Exchange differences on translation of foreign operations – – 1 – – 1Remeasurement gains on defined benefit schemes (note 25) – – – – 149 149Tax effect of remeasurement gain on defined benefit schemes (note 9) – – – – (26) (26)Effective portion of changes in fair value of cash flow hedges – – – 10 – 10Tax effect of effective portion of changes in fair value of cash flow hedges (note 9) – – – (2) – (2)At 31 January 2016 399 (22) (1) (10) (2,323) (1,957)Retained profit for the year – – – – 154 154Dividends paid – – – – (55) (55)Purchase of own shares by the employee benefit trust – (4) – – – (4)Issue of shares 4 – – – – 4
Share-based payments – – – – 12 12Other comprehensive income:Exchange differences on translation of foreign operations – – 2 – – 2Remeasurement losses on defined benefit schemes (note 25) – – – – (99) (99)Tax effect of remeasurement losses on defined benefit schemes (note 9) – – – – 17 17Effective portion of changes in fair value of cash flow hedges – – – 13 – 13Tax effect of effective portion of changes in fair value of cash flow hedges (note 9) – – – (1) – (1)At 31 January 2017 403 (26) 1 2 (2,294) (1,914)

Our B
usinessG
overnanceFinancial Statem
ents
AA plc Annual Report and Accounts 2017 109
Our Perform
ance
24 Reserves (continued)
Currency translation reserveThe translation reserve comprises foreign exchange differences arising from the translation of the financial statements of foreign operations, as well as from the translation of liabilities that hedge the Group’s net investment in a foreign subsidiary.
Cash flow hedge reserveThe cash flow hedge reserve comprises the effective portion of the cumulative net change in the fair value of cash flow hedging instruments related to hedged transactions that have not yet occurred.
DividendsIn the year ended 31 January 2017, total dividends of 9.1p (2016: 3.5p) per qualifying ordinary share were paid. Dividends are paid from the unconsolidated distributable reserves of AA plc. As at 31 January 2017, the Company had distributable reserves of £512m (2016: £495m). In March 2017, the Directors proposed a final dividend of 5.7p per ordinary share (2016: 5.5p), representing total dividend payments of £57m in respect of the 2017 financial year (2016: £55m). Subject to approval by shareholders at the AGM on 8 June 2017, the dividend will be paid on 13 June 2017 and will be accounted for as an appropriation of retained earnings in the 2018 financial year.
25 Pensions
The Group operates two funded defined benefit pension schemes: the AA UK Pension Scheme (AAUK) and the AA Ireland Pension Scheme (AAI). The assets of the schemes are held separately from those of the Group in independently administered funds. The AAUK scheme has final salary sections and a Career Average Revalued Earnings (CARE) section which accrues benefits on an average salary basis. All AAUK sections are largely closed to new entrants but open to future accrual for existing members. The AAI scheme is closed to new entrants and future accrual of benefits. The Group also operates an unfunded post-retirement Private Medical Plan (AAPMP), which is a defined benefit scheme that is not open to new entrants. During the year, following the sale of the Irish business by the Group (see note 3), AA Corporation Limited, a UK subsidiary of the Group became the sponsor of the AAI scheme.
The AAUK pension scheme is governed by a corporate trustee whose board is currently composed of member-nominated and company-nominated directors. The AAI pension scheme is governed by a corporate trustee whose board is currently composed of company-nominated directors of which some are also members of the scheme. For both pension schemes the company-nominated directors include an independent director whom the trustee board directors have nominated as Chairman. The trustee of each scheme is responsible for paying members’ benefits and for investing scheme assets, which are legally separate from the Group.
The valuations have been based on a full assessment of the liabilities of the schemes which have been updated where appropriate to 31 January 2017 by independent qualified actuaries.
The amounts recognised in the balance sheet are as follows:As at 31 January 2017
AAUK £m
AAI £m
AAPMP £m
Total £m
Present value of the defined benefit obligation in respect of pension plans (2,515) (53) (59) (2,627)Fair value of plan assets 2,190 42 – 2,232Deficit (325) (11) (59) (395)
As at 31 January 2016AAUK
£mAAI £m
AAPMP £m
Total £m
Present value of the defined benefit obligation in respect of pension plans (2,053) (46) (47) (2,146)Fair value of plan assets 1,815 35 – 1,850Deficit (238) (11) (47) (296)
The increase in the deficit is due to changes in the financial assumptions, primarily a decrease in the discount rate and increase in assumed price inflation partially offset by the updating of mortality rates.
In November 2013, the Group completed the AAUK pension scheme triennial valuation agreeing a deficit of £202m with the pension trustees and implementing an asset backed funding scheme. The asset backed funding scheme provides a long-term deficit reduction plan where the Group makes an annual deficit reduction contribution, increasing with inflation (capped at 5% each year), over a period of 25 years up to 2038 secured on the Group’s brands. In the year ended 31 January 2017 this contribution was £13m. The Group also made an additional one off deficit reduction payment of £6m to the AAUK scheme bringing total deficit reduction contributions for the AAUK scheme to £19m. The Group is currently committed to pay c.£13m in annual deficit reduction contributions for the AAUK scheme.
Using an inflation assumption of 3.2% and a discount rate assumption of 2.7%, the present value of the future deficit reduction contributions has been calculated and based on these assumptions, the Group does not expect the present value of deficit reduction contributions to exceed the IAS 19 deficit. The Group has also considered circumstances in which a surplus could be created and note that, in this event, the Group would have an unconditional right to a refund of the surplus assuming the gradual settlement of AAUK liabilities over time until all members have left the plan.
The triennial valuation of the AAUK pension scheme as at 31 March 2016 is currently underway. It is likely, following completion of the valuation, that both the ongoing and deficit reduction employer contributions the Group is required to pay will increase above current levels. In light of this anticipated increase in cost, we have undertaken a review of the options for mitigating current and future liabilities. We are proposing to retain a defined benefit arrangement allowing all members of the AAUK scheme to accrue future service benefits in a single modified CARE defined benefit section of the scheme. This will involve moving employees from the final salary sections of the AAUK scheme into the modified CARE section. On the 20 March 2017, we commenced a consultation process with employees affected by the proposed changes. These changes, if implemented, will be taken into account in agreeing the future contributions and deficit reduction plan with the pension trustees which should be finalised by 30 June 2017.

110 AA plc Annual Report and Accounts 2017
Notes to the consolidated financial statements continued
25 Pensions (continued)
The last triennial valuation for the AAI scheme was in December 2013. The Group made deficit reduction contributions of c. £1m in the year ended 31 January 2017 and will continue to make annual deficit reduction contributions, increasing with inflation, until December 2023 or until an alternative agreement is agreed with the trustees.
The triennial valuation of the AAI scheme is due as at 31 December 2016, and is expected to be finalised during the 2018 financial year.
In total, the Group is currently committed to pay c. £19m in ongoing employer contributions and c. £14m in deficit reduction employer contributions to its defined benefit plans (AAUK and AAI) in the year ending 31 January 2018.
Assets £m
Liabilities £m
Income statement
£m
Statement of comprehensive
income £m
Balance at 1 February 2016 1,850 (2,146) – –Current service cost – (29) (29) –Interest on defined benefit scheme assets/(liabilities) 68 (78) (10) –Amounts recognised in the income statement 68 (107) (39) –Effect of changes in financial assumptions – (613) – (613)Effect of changes in demographic expectations – 110 – 110Effect of experience adjustment – 81 – 81Return on plan assets excluding interest income 323 – – 323Amounts recognised in the statement of comprehensive income 323 (422) – (99)Foreign exchange gain/(loss) 5 (6) – (1)Contribution from scheme participants 1 (1) – –Benefits paid from scheme assets (55) 55 – –Ongoing employer contributions 20 – – –Deficit reduction employer contributions 20 – – –Movements through cash (14) 54 – –Balance at 31 January 2017 2,232 (2,627) – –
Assets £m
Liabilities £m
Income statement
£m
Statement of comprehensive
income £m
Balance at 1 February 2015 1,844 (2,278) – –Current service cost – (34) (34) –Past service cost – (2) (2) –Interest on defined benefit scheme assets/(liabilities) 56 (68) (12) –Amounts recognised in the income statement 56 (104) (48) –Effect of changes in financial assumptions – 185 – 185Effect of experience adjustment – 1 – 1Return on plan assets excluding interest income (37) – – (37)Amounts recognised in the statement of comprehensive income (37) 186 – 149Foreign exchange loss – (1) – (1)Contribution from scheme participants 1 (1) – –Benefits paid from scheme assets (52) 52 – –Ongoing employer contributions 24 – – –Deficit reduction employer contributions 14 – – –Movements through cash (13) 51 – –Balance at 31 January 2016 1,850 (2,146) – –
A redundancy exercise was carried out during the year ended 31 January 2016 which affected 28 members of the AAUK Scheme. Under the terms of the AAUK Scheme the members were entitled to enhanced pension benefits upon redundancy and the impact of this was a past service cost of £2m in relation to the AAUK scheme.
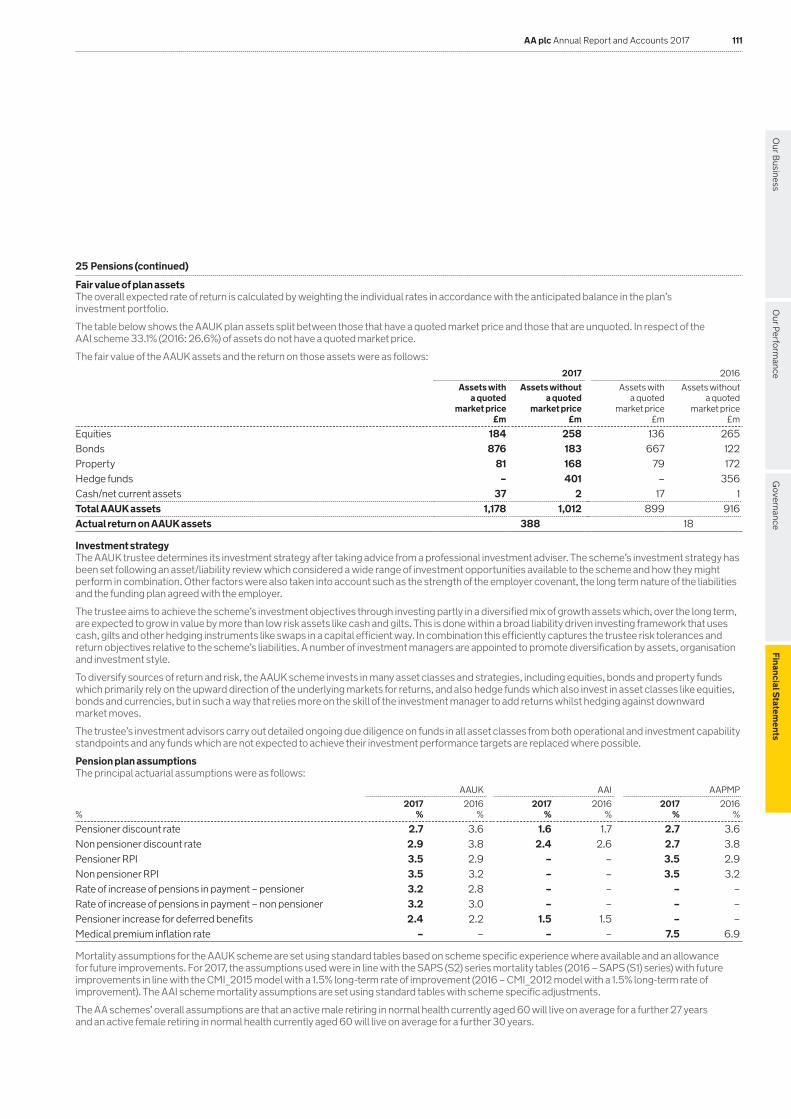
Our B
usinessG
overnanceFinancial Statem
ents
AA plc Annual Report and Accounts 2017 111
Our Perform
ance
25 Pensions (continued)
Fair value of plan assetsThe overall expected rate of return is calculated by weighting the individual rates in accordance with the anticipated balance in the plan’s investment portfolio.
The table below shows the AAUK plan assets split between those that have a quoted market price and those that are unquoted. In respect of the AAI scheme 33.1% (2016: 26.6%) of assets do not have a quoted market price.
The fair value of the AAUK assets and the return on those assets were as follows:2017 2016
Assets with a quoted
market price £m
Assets without a quoted
market price £m
Assets with a quoted
market price £m
Assets without a quoted
market price £m
Equities 184 258 136 265Bonds 876 183 667 122Property 81 168 79 172Hedge funds – 401 – 356Cash/net current assets 37 2 17 1Total AAUK assets 1,178 1,012 899 916Actual return on AAUK assets 388 18
Investment strategyThe AAUK trustee determines its investment strategy after taking advice from a professional investment adviser. The scheme’s investment strategy has been set following an asset/liability review which considered a wide range of investment opportunities available to the scheme and how they might perform in combination. Other factors were also taken into account such as the strength of the employer covenant, the long term nature of the liabilities and the funding plan agreed with the employer.
The trustee aims to achieve the scheme’s investment objectives through investing partly in a diversified mix of growth assets which, over the long term, are expected to grow in value by more than low risk assets like cash and gilts. This is done within a broad liability driven investing framework that uses cash, gilts and other hedging instruments like swaps in a capital efficient way. In combination this efficiently captures the trustee risk tolerances and return objectives relative to the scheme’s liabilities. A number of investment managers are appointed to promote diversification by assets, organisation and investment style.
To diversify sources of return and risk, the AAUK scheme invests in many asset classes and strategies, including equities, bonds and property funds which primarily rely on the upward direction of the underlying markets for returns, and also hedge funds which also invest in asset classes like equities, bonds and currencies, but in such a way that relies more on the skill of the investment manager to add returns whilst hedging against downward market moves.
The trustee’s investment advisors carry out detailed ongoing due diligence on funds in all asset classes from both operational and investment capability standpoints and any funds which are not expected to achieve their investment performance targets are replaced where possible.
Pension plan assumptionsThe principal actuarial assumptions were as follows:
%
AAUK AAI AAPMP2017
%2016
%2017
%2016
%2017
%2016
%
Pensioner discount rate 2.7 3.6 1.6 1.7 2.7 3.6Non pensioner discount rate 2.9 3.8 2.4 2.6 2.7 3.8Pensioner RPI 3.5 2.9 – – 3.5 2.9Non pensioner RPI 3.5 3.2 – – 3.5 3.2Rate of increase of pensions in payment – pensioner 3.2 2.8 – – – –Rate of increase of pensions in payment – non pensioner 3.2 3.0 – – – –Pensioner increase for deferred benefits 2.4 2.2 1.5 1.5 – –Medical premium inflation rate – – – – 7.5 6.9
Mortality assumptions for the AAUK scheme are set using standard tables based on scheme specific experience where available and an allowance for future improvements. For 2017, the assumptions used were in line with the SAPS (S2) series mortality tables (2016 – SAPS (S1) series) with future improvements in line with the CMI_2015 model with a 1.5% long-term rate of improvement (2016 – CMI_2012 model with a 1.5% long-term rate of improvement). The AAI scheme mortality assumptions are set using standard tables with scheme specific adjustments.
The AA schemes’ overall assumptions are that an active male retiring in normal health currently aged 60 will live on average for a further 27 years and an active female retiring in normal health currently aged 60 will live on average for a further 30 years.

112 AA plc Annual Report and Accounts 2017
Notes to the consolidated financial statements continued
25 Pensions (continued)
Sensitivity analysisReasonably possible changes at the reporting date to one of the relevant actuarial assumptions, holding other assumptions constant, would have affected the defined benefit liability by the amounts shown below:
For the year ending 31 January 2017AAUK
£mAAI £m
AAPMP £m
Increase of 0.25% in discount rate 127 3 2Increase of 0.25% in Inflation rate (102) (1) –Increase of 1% in medical claims inflation – – (9)Increase of one year of life expectancy (90) (2) –
An equivalent decrease in the assumptions at 31 January 2017 would have had the equal but opposite effect on the amounts shown above, on the basis that all other variables remain constant.
The weighted average duration of plan liabilities at 31 January 2017 is around 21 years.
Pension scheme risksThe AAUK and AAI schemes have exposure to a number of risks because of the investments they make in following their investment strategy. Investment objectives and risk limits are implemented through the investment management agreements in place with the schemes’ investment managers and monitored by the trustees by regular reviews of the investment portfolios. In addition, under guidance from their investment advisors the trustees monitor estimates of key risks on an ongoing basis such as those shown below. A number of measures are taken to mitigate these risks where possible.
Interest rate risk and Inflation risk - this is the risk that the present value of future cash flows of a financial asset or liability will fluctuate because of changes in market interest rates and/or expected inflation. The scheme is subject to interest rate and inflation risk because some of the scheme’s investments are in gilts, index linked gilts and other hedging assets. These investments are held in order to mitigate the impact of interest rate and inflation changes on the Scheme’s liabilities.
Credit risk - this is the risk that one party to a financial instrument will cause a financial loss for the other party by failing to discharge an obligation. This risk mainly relates to the Scheme’s bonds and is mitigated by carrying out due diligence and investing only in bond funds which are well diversified in terms of credit instrument, region, credit rating and issuer of the underlying bond assets. To reduce risk further, the underlying bond assets within a fund are ringfenced, and the scheme diversifies across a number of bond funds.
Currency risk - the scheme is subject to currency risk because some of the scheme’s investments are in overseas markets. The trustee hedges some of this currency risk by investing in investment funds which hold currency derivatives to protect against adverse fluctuations in the relative value of its portfolio positions as a result of changes in currency exchange rates.
Market price risk - this is the risk that the fair value or future cash flows of a financial asset such as equities will fluctuate because of changes in market prices (other than those arising from interest rate, inflation or currency risk), whether those changes are caused by factors specific to the individual financial instrument or its issuer, or factors affecting all similar financial instruments traded in the market. The scheme manages this exposure to overall price movements by constructing a diverse portfolio of investments across various markets and investment managers.
Financial derivatives risk – The scheme does not directly hold any financial derivatives but instead invests in investment funds which hold the derivatives required to hedge the scheme’s interest rate, inflation and currency risks. The scheme also permits some of the investment managers to use derivative instruments if these are being used to contribute to a reduction of risks or facilitate efficient portfolio management of their funds. The main risks associated with financial derivatives include: losses may exceed the initial margin; counterparty risk where the other party defaults on the contract; and liquidity risk where it may be difficult to close out a contract prior to expiry. These risks are managed by monitoring of investment managers to ensure they have reasonable levels of market exposure relative to initial margin and positions are fully collateralised on a daily basis with secure cash or gilts collateral.
The AAUK scheme had hedged around 50% of interest rate risk and around 75% of inflation risk (of the liabilities) as at 31 January 2017 and hedging had been fairly constant at those levels for some years as part of a policy to reduce financial risks to the Scheme. The current longer term objective is to aim to hedge around 75% of both the interest rate risk and inflation risk of the liabilities; this will help to further reduce funding level volatility. More interest rate hedging will be added in due course as, and when, prevailing pricing is regarded as reasonable value in the circumstances, or if any other reasons drive a policy change on risk appetite.

Our B
usinessG
overnanceFinancial Statem
ents
AA plc Annual Report and Accounts 2017 113
Our Perform
ance
26 Impairment of intangible assets
Goodwill acquired through business combinations has been allocated to cash generating units (“CGUs”) on initial recognition and for subsequent impairment testing.
The carrying value of goodwill by CGU is as follows:2017
£m2016
£m
Roadside Assistance 874 874Insurance Services 240 240Driving Schools 26 26DriveTech 33 33Ireland – 26
1,173 1,199
The Group has performed impairment testing at 31 January 2017 and 31 January 2016. The impairment test compares the recoverable amount of the CGU to its carrying value. The Ireland segment was disposed of on 11 August 2016 (see note 3).
The recoverable amount of each CGU has been determined based on a value in use calculation using cash flow projections from the Group’s three year plan up to 31 January 2020 and a reasonable expectation of growth in the subsequent two years. For the purposes of the impairment test, terminal values have been calculated using the Gordon growth model and a nil growth assumption after year 5 which is lower than the expected long term average growth rate of the UK economy. Cash flows have been discounted at a pre-tax rate reflecting the time value of money and the risk specific to these cash flows. This has been determined as a pre-tax rate of 9.0% (2016: 9.9%).
The value in use calculation used is most sensitive to the assumptions used for growth and for the discount rate. Accordingly, stress testing has been performed on these key assumptions as part of the impairment test to further inform the consideration of whether any impairment is evident. Further to this, management believes that no reasonably foreseeable change in any of the key assumptions would cause the recoverable amount of the CGU to be lower than its carrying amount, and consequently no impairment has been recognised.
27 Financial assets and financial liabilities
The carrying amounts of all financial assets and financial liabilities by class are as follows:
Financial assets 2017
£m2016
£m
Loans and receivablesCash and cash equivalents 211 166Trade receivables 141 146Other receivables and accrued income 16 17Total financial assets 368 329
Financial liabilities 2017
£m2016
£m
Measured at fair value through other comprehensive incomeInterest rate and fuel swaps used for hedging 20 27
Loans and borrowingsTrade payables 97 110Other payables 56 66Obligations under finance lease agreements 67 61Borrowings 2,799 2,893Total financial liabilities 3,039 3,157

114 AA plc Annual Report and Accounts 2017
Notes to the consolidated financial statements continued
27 Financial assets and financial liabilities (continued)
Fair valuesFinancial instruments held at fair value are valued using quoted market prices or other valuation techniques.
Valuation techniques include net present value and discounted cash flow models, and comparison to similar instruments for which market observable prices exist. Assumptions and market observable inputs used in valuation techniques include interest rates.
The objective of using valuation techniques is to arrive at a fair value that reflects the price of the financial instrument at each year end at which the asset or liability would have been exchanged by market participants acting at arm’s length.
Observable inputs are those that have been seen either from counterparties or from market pricing sources and are publicly available. The use of these depends on the liquidity of the relevant market. When measuring the fair value of an asset or a liability, the Group uses observable inputs as much as possible. Fair values are categorised into different levels in a fair value hierarchy based on the inputs used in the valuation as follows:
Level 1 – Quoted market prices in an actively traded market for identical assets or liabilities. These are the most reliable.
Level 2 – Inputs other than quoted prices included in Level 1 that are observable for the assets or liabilities. These include valuation models used to calculate the present value of expected future cash flows and may be employed either when no active market exists or when there are quoted prices available for similar instruments in active markets. The models incorporate various inputs, including interest rate curves and forward rate curves of the underlying instrument.
Level 3 – Inputs for assets or liabilities that are not based on observable market data.
If the inputs used to measure the fair values of an asset or a liability might be categorised in different levels of the fair value hierarchy, then the fair value measurement is categorised in its entirety in the same level as the lowest input that is significant to the entire measurements.
The fair values are periodically reviewed by the Group Treasury function. The following tables provide the quantitative fair value hierarchy of the Group’s interest rate swaps and loan notes.
The carrying values of all other financial assets and liabilities (including the Senior Term Facility) are approximate to their fair values:
At 31 January 2017:
Carrying value
£m
Fair value measurement using
Quoted prices in active markets
(Level 1) £m
Significant observable
inputs (Level 2)
£m
Significant unobservable
inputs (Level 3)
£mFinancial liabilities measured at fair valueInterest rate and fuel swaps (note 19) 20 – 20 –Liabilities for which fair values are disclosedLoan notes (note 20) 2,452 2,656 – –
At 31 January 2016:
Carrying value
£m
Fair value measurement using
Quoted prices in active markets
(Level 1) £m
Significant observable
inputs (Level 2)
£m
Significant unobservable
inputs (Level 3)
£m
Financial liabilities measured at fair valueInterest rate and fuel swaps (note 19) 27 – 27 –Liabilities for which fair values are disclosedLoan notes (note 20) 2,441 2,528 – –
There have been no transfers between the levels and no non-recurring fair value measurements of assets and liabilities during the two years to 31 January 2017.

Our B
usinessG
overnanceFinancial Statem
ents
AA plc Annual Report and Accounts 2017 115
Our Perform
ance
28 Financial risk management objectives and policies
The Group’s principal financial liabilities comprise borrowings as well as trade and other payables. The main purpose of these financial liabilities is to finance the Group’s operations. The Group’s principal financial assets include deposits with financial institutions, money market funds and trade receivables.
The Group is exposed to market risk, credit risk and liquidity risk. The Group’s senior management oversees the management of these risks, supported by the Group Treasury function. The Group Treasury function ensures that the Group’s financial risks are governed by appropriate policies and procedures and that financial risks are identified, measured and managed in accordance with the Group’s policies and risk objectives. All derivative activities are for risk management purposes and are carried out by the Group Treasury function. It is the Group’s policy not to trade in derivatives for speculative purposes.
The Board of Directors reviews and agrees policies for managing each of these risks, which are summarised below.
Market riskMarket risk is the risk that the fair value of future cash flows of a financial instrument will fluctuate because of changes in prices set by the market. The key market risk that the Group is exposed to is interest rate risk. The Group has policies and limits approved by the Board for managing the interest rate risk exposure. The Group’s policy is to fully hedge all of its exposure to variable interest rates. The Group has therefore taken out interest rate swaps to the value of its variable rate instruments.
The interest rate profile of the Group’s interest-bearing financial instruments is as follows:2017
£m2016
£m
Fixed rate instrumentsFinancial liabilities (2,518) (2,502)Effect of interest rate swaps (348) (454)Net exposure to fixed rate instruments (2,866) (2,956)Variable rate instrumentsFinancial liabilities (347) (452)Effect of interest rate swaps 348 454Net exposure to variable rate instruments 1 2
Sensitivity of fixed-rate instruments The Group does not account for any fixed-rate financial assets and financial liabilities at fair value through profit or loss and does not use derivative instruments in fair value hedges. Consequently, having regard to fixed rate instruments, a change in market interest rates at the reporting date would not affect profit or loss.
Sensitivity of variable rate instrumentsAn increase of 50 basis points in interest rates at 31 January 2017 would have increased equity by £2m (2016: £4m) and would have had no impact on profit or cash. A decrease to interest rates of the same magnitude will have an equal and opposite effect on equity and profit. This calculation assumes that the change occurred at the year end and had been applied to risk exposures existing at that date.
This analysis assumes that all other variables remain constant and considers the effect of financial instruments with variable interest rates and the fixed rate element of interest rate swaps. The analysis is performed on the same basis for all comparative periods.
Credit riskCredit risk is the risk that a counterparty will not meet its obligations under a financial instrument or customer contract, leading to a financial loss. The Group is exposed to credit risk in relation to its financial assets, outstanding derivatives and trade and other receivables. The Group assesses its counterparty exposure in relation to the investment of surplus cash and undrawn credit facilities. The Group primarily uses published credit ratings to assess counterparty strength and therefore to define the credit limit for each counterparty, in accordance with approved treasury policies.
The credit risk for the Group is limited as payment from customers is generally required before services are provided.
Credit risk in relation to deposits and derivative counterparties is managed by the Group’s treasury function in accordance with the Group’s policy. Investments of surplus funds are made only with approved counterparties and within credit limits assigned to each counterparty. The limits are set to mitigate financial loss through any potential counterparty failure.
The Group’s maximum exposure to credit risk for the components of the statement of financial position at each reporting date is the carrying amount except for derivative financial instruments. The Group’s maximum exposure for financial derivative instruments is noted under liquidity risk.

116 AA plc Annual Report and Accounts 2017
Notes to the consolidated financial statements continued
28 Financial risk management objectives and policies (continued)
The ageing analysis of trade receivables is as follows:Past due but not impaired
Total £m
Neither past due nor
impaired £m
< 30 days £m
30-60 days £m
60+ days £m
2017 141 135 4 – 22016 146 136 2 2 6
The movements in the provision for the collective impairment of receivables are as follows:2017
£m2016
£m
At 1 February 2 2Charge for the year 2 1Utilised (1) –Unused amounts reversed (1) (1)At 31 January 2 2
Liquidity riskLiquidity risk is the risk that the Group either does not have available sufficient financial resources to enable it to meet its obligations as they fall due, or can secure them only at excessive cost. The Group’s approach to managing liquidity risk is to evaluate current and expected liquidity requirements to ensure that it maintains sufficient reserves of cash and headroom on its working capital facilities.
The table below analyses the maturity of the Group’s financial liabilities on a contractual undiscounted cash flow basis and includes any associated debt service costs. The analysis of non-derivative financial liabilities is based on the remaining period at the reporting date to the contractual maturity date.
At 31 January 2017:On demand
£mLess than 1 year
£m1-2 years
£m2-5 years
£mOver 5 years
£mTotal
£mLoans and borrowings – 126 641 1,536 1,195 3,498Obligation under finance leases – 51 13 8 – 72Other payables and accruals – 56 – – – 56Trade payables – 97 – – – 97
– 330 654 1,544 1,195 3,723
Interest rate swaps used for hedgingAssets (inflow) – (14) (8) – – (22)Liabilities – 23 18 – – 41
– 9 10 – – 19– 339 664 1,544 1,195 3,742
At 31 January 2016:On demand
£mLess than 1 year
£m1-2 years
£m2-5 years
£mOver 5 years
£mTotal
£m
Loans and borrowings – 138 140 1,990 1,436 3,704Obligation under finance leases – 43 14 8 – 65Other payables and accruals – 66 – – – 66Trade payables – 110 – – – 110
– 357 154 1,998 1,436 3,945
Interest rate swaps used for hedgingAssets (inflow) – (9) (3) – – (12)Liabilities – 16 8 5 – 29
– 7 5 5 – 17– 364 159 2,003 1,436 3,962

Our B
usinessG
overnanceFinancial Statem
ents
AA plc Annual Report and Accounts 2017 117
Our Perform
ance
28 Financial risk management objectives and policies (continued)
Capital managementAs noted in the financial review on pages 26 to 29, the Group considers its capital to be a combination of net debt and equity.
2017 £m
2016 £m
Total net debt 2,704 2,809Equity (valued at close on 31 January 2017) 1,486 1,790Total capital 4,190 4,599
The Group’s objectives when managing capital are:
to safeguard the entity’s ability to continue as a going concern, so that it can continue to provide returns for shareholders and benefits for other stakeholders;
to further strengthen the AA as the pre-eminent Membership services organisation in the UK;
to revolutionise the customer experience through investing in and embracing new technologies;
to reduce Group borrowings and associated interest costs; and
to provide an adequate return to shareholders.
The relative priorities of these objectives are discussed on page 28 of the financial review.
The Group monitors capital using net debt to Trading EBITDA ratios. The key ratios are Senior Secured Debt to Trading EBITDA, and Net Debt to Trading EBITDA as calculated below:
2017 £m
2016 £m
Senior Term Facility 348 454Class A notes 1,930 1,725Less: AA Intermediate Co Limited group cash and cash equivalents (136) (94)Net Senior Secured Debt1 2,142 2,085Class B2 notes 570 735Finance lease obligations 67 61Net WBS Debt2 2,779 2,881Less: AA plc Group cash and cash equivalents3 (75) (72)Total Net Debt 2,704 2,809
AA plc Trading EBITDA 403 402AA Intermediate Trading EBITDA4 414 417
Net debt ratio5 6.7x 7.0xClass B2 leverage ratio6 6.7x 6.9xSenior leverage ratio7 5.2x 5.0x
1 Principal amounts of the Senior Term Facility and Class A notes less AA Intermediate Co Limited group cash and cash equivalents.
2 WBS debt represents the borrowings and cash balances within the WBS structure headed by AA Intermediate Co Limited. This includes the principal amounts of the Senior Term Facility, Class A notes, Class B2 notes and finance leases less AA Intermediate Co Limited group cash and cash equivalents.
3 Total cash and cash equivalents for the Group excluding the value reported as the AA Intermediate Co Limited group cash and cash equivalents.
4 AA Intermediate Co Limited group Trading EBITDA including discontinued operations and business held for sale as required by the debt documents .
5 Ratio of Total Net Debt to AA plc Trading EBITDA for the last 12 months.
6 Ratio of Net WBS Debt to AA Intermediate Trading EBITDA for the last 12 months.
7 Ratio of Net Senior Secured Debt to AA Intermediate Trading EBITDA for the last 12 months.
The Senior Term Facility, Class A notes and Class B2 notes have interest cover covenants attached to them. The Group was in compliance with all covenants throughout the period and as at 31 January 2017.
The Group includes regulated companies which are required to hold sufficient capital to meet acceptable solvency levels based on the relevant regulators’ requirements (see note 17). There are no other externally imposed capital requirements.
Further details on our policies and processes for managing capital, as well as the thresholds set for the covenants above are set out in the financial review on pages 26 to 29.
Further details of our objectives to reduce Group borrowings are set out in the strategic report on page 14.
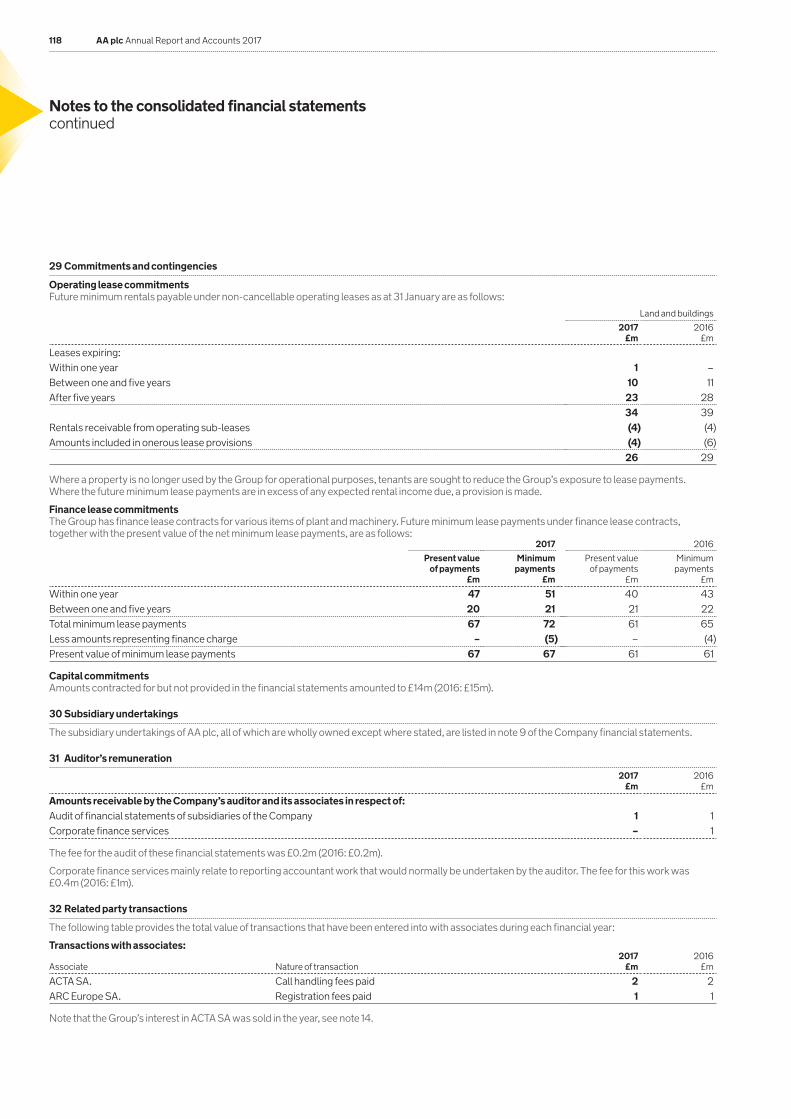
118 AA plc Annual Report and Accounts 2017
Notes to the consolidated financial statements continued
29 Commitments and contingencies
Operating lease commitments Future minimum rentals payable under non-cancellable operating leases as at 31 January are as follows:
Land and buildings2017
£m2016
£m
Leases expiring:Within one year 1 –Between one and five years 10 11After five years 23 28
34 39Rentals receivable from operating sub-leases (4) (4)Amounts included in onerous lease provisions (4) (6)
26 29
Where a property is no longer used by the Group for operational purposes, tenants are sought to reduce the Group’s exposure to lease payments. Where the future minimum lease payments are in excess of any expected rental income due, a provision is made.
Finance lease commitmentsThe Group has finance lease contracts for various items of plant and machinery. Future minimum lease payments under finance lease contracts, together with the present value of the net minimum lease payments, are as follows:
2017 2016Present value
of payments £m
Minimum payments
£m
Present value of payments
£m
Minimum payments
£m
Within one year 47 51 40 43Between one and five years 20 21 21 22Total minimum lease payments 67 72 61 65Less amounts representing finance charge – (5) – (4)Present value of minimum lease payments 67 67 61 61
Capital commitmentsAmounts contracted for but not provided in the financial statements amounted to £14m (2016: £15m).
30 Subsidiary undertakings
The subsidiary undertakings of AA plc, all of which are wholly owned except where stated, are listed in note 9 of the Company financial statements.
31 Auditor’s remuneration2017
£m2016
£m
Amounts receivable by the Company’s auditor and its associates in respect of:Audit of financial statements of subsidiaries of the Company 1 1Corporate finance services – 1
The fee for the audit of these financial statements was £0.2m (2016: £0.2m).
Corporate finance services mainly relate to reporting accountant work that would normally be undertaken by the auditor. The fee for this work was £0.4m (2016: £1m).
32 Related party transactions
The following table provides the total value of transactions that have been entered into with associates during each financial year:
Transactions with associates:
Associate Nature of transaction2017
£m2016
£m
ACTA SA. Call handling fees paid 2 2ARC Europe SA. Registration fees paid 1 1
Note that the Group’s interest in ACTA SA was sold in the year, see note 14.

Our B
usinessG
overnanceFinancial Statem
ents
AA plc Annual Report and Accounts 2017 119
Our Perform
ance
33 Compensation of key management personnel of the Group
Key management personnel are defined as those persons having authority and responsibility for planning, directing and controlling the activities of the Group.
Key management personnel consists of the Executive Chairman, the Chief Financial Officer, Non-Executive Directors and the Executive Management Committee.
The amounts recognised as an expense during the financial year in respect of key management personnel are as follows:2017
£m2016
£m
Short-term employee benefits 6 6Share-based payments – MVP and LTBP shares (see note 34) 8 2Total compensation of key management personnel 14 8
34 Share-based payments2017
£m2016
£m
Share-based payments – MVP shares 8 2Share-based payments – LTBP 2 2Share-based payments – staff share incentive plan 2 1
12 5
Management value participation shares (MVP shares)On 23 June 2014, the Company issued 24 million convertible, redeemable MVP shares to certain key members of senior management at £0.001 per share. These shares were divided into three classes and are convertible into ordinary shares following satisfaction of a Total Shareholder Return (TSR) performance condition of 12% (or above) per annum compound growth against the admission price of £2.50 which is tested on the third, fourth and fifth anniversaries of admission to the London Stock Exchange.
A further 36 million MVP shares were issued at £0.001 per share on 22 December 2015.
At 31 January 2016, 14.2% of the issued MVP shares were held in the Employee Benefit Trust (EBT). On 22 April 2016, awards were granted by the EBT to further key members of senior management over ordinary shares which convert from the remaining 14.2% (amounting to 8,520,000) MVP shares.
The MVP share-based payments are equity settled. The following table illustrates the number and fair value of the MVP shares awarded:
Vesting date2017
No. of shares2016
No. of shares
2017 Fair value per share
£
2016 Fair value per share
£
June 2014 awards:A1 shares 23 June 2017 8,000,000 8,000,000 0.25 0.25B1 shares 23 June 2018 8,000,000 8,000,000 0.26 0.26C1 shares 23 June 2019 8,000,000 8,000,000 0.26 0.26December 2015 awards:A2 shares 23 June 2017 9,160,000 9,160,000 0.38 0.38B2 shares 23 June 2018 9,160,000 9,160,000 0.40 0.40C2 shares 23 June 2019 9,160,000 9,160,000 0.40 0.40April 2016 awardsA2 shares 23 June 2017 2,840,000 – 0.35 –B2 shares 23 June 2018 2,840,000 – 0.35 –C2 shares 23 June 2019 2,840,000 – 0.35 –Total 60,000,000 51,480,000
Unvested A1 and A2 shares can also be converted on the fourth or fifth anniversary of admission and unvested B1 and B2 shares can also be converted on the fifth anniversary of admission.
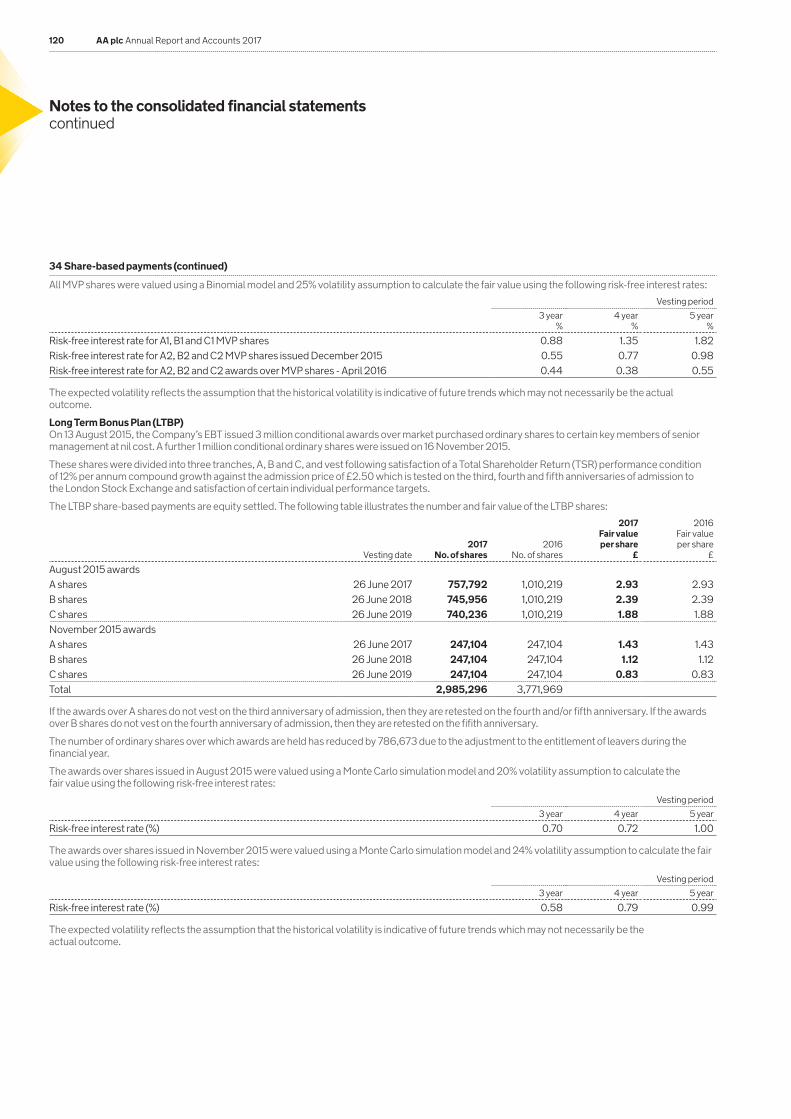
120 AA plc Annual Report and Accounts 2017
Notes to the consolidated financial statements continued
34 Share-based payments (continued)
All MVP shares were valued using a Binomial model and 25% volatility assumption to calculate the fair value using the following risk-free interest rates:Vesting period
3 year %
4 year %
5 year %
Risk-free interest rate for A1, B1 and C1 MVP shares 0.88 1.35 1.82Risk-free interest rate for A2, B2 and C2 MVP shares issued December 2015 0.55 0.77 0.98Risk-free interest rate for A2, B2 and C2 awards over MVP shares - April 2016 0.44 0.38 0.55
The expected volatility reflects the assumption that the historical volatility is indicative of future trends which may not necessarily be the actual outcome.
Long Term Bonus Plan (LTBP)On 13 August 2015, the Company’s EBT issued 3 million conditional awards over market purchased ordinary shares to certain key members of senior management at nil cost. A further 1 million conditional ordinary shares were issued on 16 November 2015.
These shares were divided into three tranches, A, B and C, and vest following satisfaction of a Total Shareholder Return (TSR) performance condition of 12% per annum compound growth against the admission price of £2.50 which is tested on the third, fourth and fifth anniversaries of admission to the London Stock Exchange and satisfaction of certain individual performance targets.
The LTBP share-based payments are equity settled. The following table illustrates the number and fair value of the LTBP shares:
Vesting date2017
No. of shares2016
No. of shares
2017 Fair value per share
£
2016 Fair value per share
£
August 2015 awardsA shares 26 June 2017 757,792 1,010,219 2.93 2.93B shares 26 June 2018 745,956 1,010,219 2.39 2.39C shares 26 June 2019 740,236 1,010,219 1.88 1.88November 2015 awardsA shares 26 June 2017 247,104 247,104 1.43 1.43B shares 26 June 2018 247,104 247,104 1.12 1.12C shares 26 June 2019 247,104 247,104 0.83 0.83Total 2,985,296 3,771,969
If the awards over A shares do not vest on the third anniversary of admission, then they are retested on the fourth and/or fifth anniversary. If the awards over B shares do not vest on the fourth anniversary of admission, then they are retested on the fifith anniversary.
The number of ordinary shares over which awards are held has reduced by 786,673 due to the adjustment to the entitlement of leavers during the financial year.
The awards over shares issued in August 2015 were valued using a Monte Carlo simulation model and 20% volatility assumption to calculate the fair value using the following risk-free interest rates:
Vesting period3 year 4 year 5 year
Risk-free interest rate (%) 0.70 0.72 1.00
The awards over shares issued in November 2015 were valued using a Monte Carlo simulation model and 24% volatility assumption to calculate the fair value using the following risk-free interest rates:
Vesting period3 year 4 year 5 year
Risk-free interest rate (%) 0.58 0.79 0.99
The expected volatility reflects the assumption that the historical volatility is indicative of future trends which may not necessarily be the actual outcome.

Our B
usinessG
overnanceFinancial Statem
ents
AA plc Annual Report and Accounts 2017 121
Our Perform
ance
34 Share-based payments (continued)
Staff share incentive plansThe Group has a number of all employee Share Incentive Plans (SIP).
Under the SIP, employees are able to buy Partnership shares by making weekly or monthly payments into the SIP.
In addition, for every Partnership share an employee purchases the Company will match this on a 1:1 basis (Matching Shares).
The SIP share-based payments are equity settled. The following table illustrates the fair value and vesting period of the SIPs:
Share type Award date Vesting date No. of shares
2017Volatility
%
Risk-free interest rate
%
Fair value per share
£
Charge for year ended 31 January
2017 £m
Charge for year ended 31 January
2016 £m
2015 SIP
Partnership shares 29 August 2014 29 August 2015 2,132,766 21 0.55 0.23 – –Matching shares 29 August 2014 29 August 2018 2,132,766 21 0.55 2.58 1 12016 SIPMatching shares 11 January 2016 11 January 2019 1,366,211 26 0.76 2.93 1 –
5,631,743 2 1
The SIPs are valued using a Black Scholes model.
The expected volatility reflects the assumption that the historical volatility is indicative of future trends which may not necessarily be the actual outcome.
The 2016 SIP scheme began in January 2016 with the issue of 111,577 shares in that month. Shares were then issued each month until December 2016.
The 2017 SIP scheme began in February 2017, after the current year end.
35 Accounting standards, amendments and interpretations
New accounting standards, amendments and interpretations adopted in the yearIn the year ended 31 January 2017, the Group did not adopt any new standards or amendments issued by the IASB or interpretations issued by the IFRS Interpretations Committee (IFRS IC) that have had a material impact on the consolidated financial statements. Other new standards, amendments and interpretations adopted, that have not had a material impact on the amounts reported in these financial statements but may impact the accounting for future transactions and arrangements, were:
Effective date
IAS 1: Disclosure Initiative 1 January 2016Annual Improvements to IFRS 2012-2014 1 January 2016IFRS 11: Accounting for Acquisitions of Interests in Joint Operations 1 January 2016
New accounting standards, amendments and interpretations not yet adopted A number of new standards, amendments and interpretations, which have not been applied in preparing these financial statements, have been issued and are effective for annual reports beginning after 1 February 2016:
Effective date
IAS 12: Recognition of Deferred Tax Assets for Unrealised Losses 1 January 2017IAS 7: Disclosure Initiative 1 January 2017IFRS 15: Revenue from Contracts with Customers 1 January 2018IFRS 9: Financial Instruments 1 January 2018IFRS 2: Classification and Measurement of Share Based Payment Transactions – Amendments to IFRS 2 1 January 2018IFRS 16: Leases 1 January 2019
The Group has carried out an impact assessment to determine the impact of adopting IFRS 15. Based on this assessment, management has concluded that there will be no material impact on revenue from adopting this standard.
The Group is currently assessing whether the other standards above will have a material impact on the financial statements for the year ended 31 January 2018.
36 Events after the reporting period
On 20 March 2017, the Group commenced a consultation process with members of the UK defined benefit pension scheme affected by proposed changes to the scheme. See further details in note 25. These changes, if implemented, will be taken into account in the 2018 financial year.
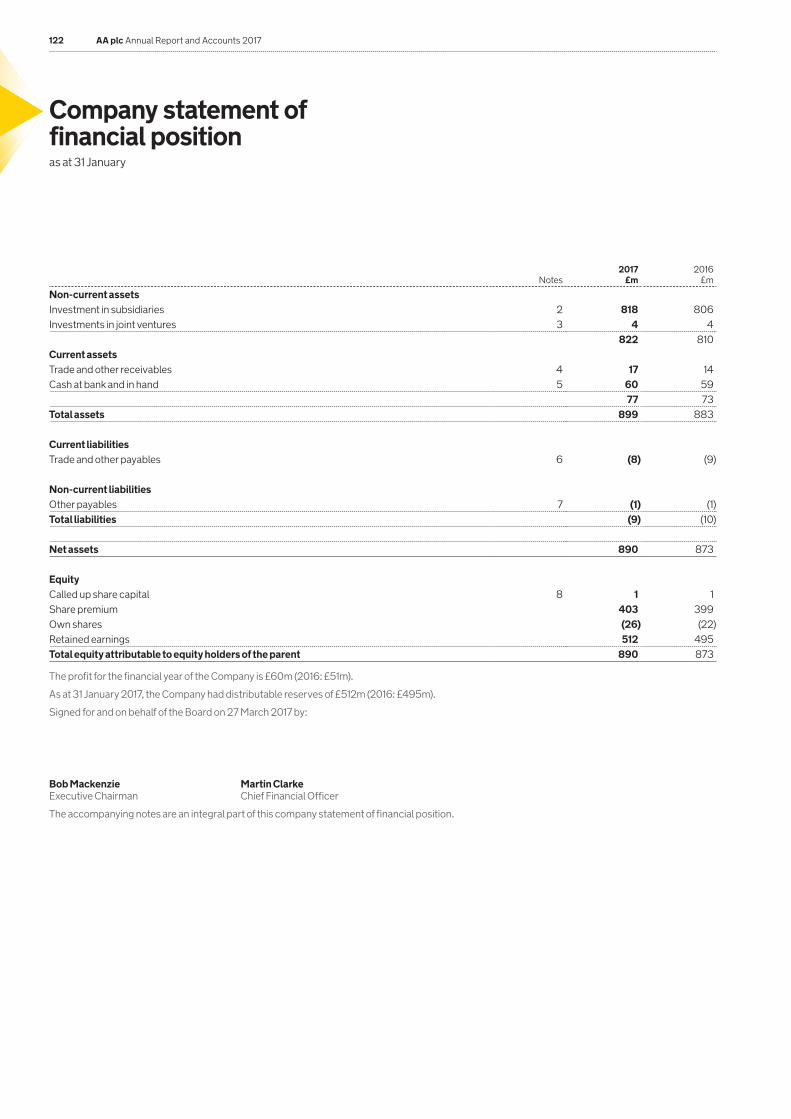
122 AA plc Annual Report and Accounts 2017
Company statement of financial position as at 31 January
Notes2017
£m2016
£m
Non-current assetsInvestment in subsidiaries 2 818 806Investments in joint ventures 3 4 4
822 810Current assetsTrade and other receivables 4 17 14Cash at bank and in hand 5 60 59
77 73Total assets 899 883
Current liabilities Trade and other payables 6 (8) (9)
Non-current liabilitiesOther payables 7 (1) (1)Total liabilities (9) (10)
Net assets 890 873
EquityCalled up share capital 8 1 1Share premium 403 399Own shares (26) (22)Retained earnings 512 495Total equity attributable to equity holders of the parent 890 873
The profit for the financial year of the Company is £60m (2016: £51m).
As at 31 January 2017, the Company had distributable reserves of £512m (2016: £495m).
Signed for and on behalf of the Board on 27 March 2017 by:
Bob Mackenzie Martin ClarkeExecutive Chairman Chief Financial Officer
The accompanying notes are an integral part of this company statement of financial position.

Our B
usinessG
overnanceFinancial Statem
ents
AA plc Annual Report and Accounts 2017 123
Our Perform
ance
Company statement of changes in equity as at 31 January
Share capital
£m
Share premium
£m
Own shares
£m
Retained earnings
£mTotal
£m
At 1 February 2015 1 200 – 458 659Profit for the year – – – 51 51Dividends – – – (21) (21)Issue of share capital – 199 – – 199Purchase of own shares – – (22) – (22)Share-based payments – – – 7 7At 31 January 2016 1 399 (22) 495 873Profit for the year – – – 60 60Dividends – – – (55) (55)Issue of share capital – 4 – – 4Purchase of own shares – – (4) – (4)Share-based payments – – – 12 12At 31 January 2017 1 403 (26) 512 890
The accompanying notes are an integral part of this company statement of changes in equity.

124 AA plc Annual Report and Accounts 2017
1 Authorisation of financial statements and Company accounting policies
1.1 Authorisation of financial statements The parent company financial statements of AA plc (the “Company”) for the year ended 31 January 2017 were authorised for issue by the Board of Directors on 27 March 2017 and the balance sheet was signed on the Board’s behalf by Bob Mackenzie and Martin Clarke. AA plc is a public limited company incorporated and domiciled in England and Wales. The Company’s ordinary shares are traded on the London Stock Exchange.
These financial statements were prepared in accordance with Financial Reporting Standard 101 Reduced Disclosure Framework (FRS101). The financial statements are prepared under the historical cost convention and on a going concern basis.
No profit and loss account is presented by the Company as permitted by Section 408 of the Companies Act 2006.
The accounting policies which follow set out those policies which apply in preparing the financial statements for the year ended 31 January 2017. The financial statements are prepared in sterling and are rounded to the nearest million pounds (£m).
1.2 Basis of preparationThe Company has taken advantage of the following disclosure exemptions under FRS 101:
IAS 1 paragraph 10(d) (statement of cash flows),
IAS 1 paragraph 16 (statement of compliance with all IFRS),
IAS 1 paragraph 38A (requirement for minimum of two primary statements, including cash flow statements),
IAS 1 paragraph 111 (cash flow statement information),
IAS 1 paragraphs 134-136 (capital management disclosures),
IFRS 1 paragraphs 6 and 21,
Paragraphs 45(b) and 46 to 52 of IFRS 2, ‘Share-based payment’,
IAS 7: ‘Statement of cash flows’,
IAS 8 paragraphs 30 and 31,
The requirements in IAS 24, ‘Related party disclosures’ to disclose related party transactions entered into between two or more members of a group.
1.3 Accounting policiesa) Foreign currencies Transactions in foreign currencies are recorded at the rate ruling at the date of the transaction or at the contracted rate if the transaction is covered by a forward foreign currency contract. Monetary assets and liabilities denominated in foreign currencies are retranslated at the rate of exchange ruling at the balance sheet date or if appropriate at the forward contract rate. All differences are taken to the profit and loss account.
b) Investments in subsidiaries and joint venturesFixed asset investments are included in the balance sheet at cost, less any provisions for permanent impairment.
Investments in subsidiaries and joint ventures are stated at the lower of cost and net realisable value.
The carrying amounts of the Company’s assets are reviewed for impairment when events or changes in circumstances indicate that the carrying amount of the fixed asset may not be recoverable. If any such indication exists, the asset’s recoverable amount is estimated. An impairment loss is recognised whenever the carrying amount of an asset or its income-generating unit exceeds its recoverable amount. Impairment losses are recognised in the profit and loss account unless it arises on a previously revalued fixed asset.
The recoverable amount of fixed assets is the greater of their net realisable value and value in use. In assessing value in use, the expected future cash flows are discounted to their present value using a pre-tax discount rate that reflects current market assessments of the rate of return expected on an investment of equal risk. For an asset that does not generate largely independent income streams, the recoverable amount is determined for the income-generating unit to which the asset belongs.
Joint ventures are joint arrangements whereby the parties that have joint control of the arrangement have rights to the net assets of the arrangement.
c) Critical accounting estimates and judgements Estimates are evaluated continually and are based on historical experience and other factors, including expectations of future events that are believed to be reasonable under the circumstances. The Group makes estimates and assumptions about the future. The resulting accounting estimates will, by definition, seldom equal the related actual results. The principal estimates and assumptions that have a risk of causing an adjustment to the carrying amounts of assets and liabilities within the next financial period are discussed below.
Management has exercised judgement in applying the Group’s accounting policies and in making critical estimates. The underlying assumptions on which these judgements are based, are reviewed on an ongoing basis and include the assumptions for future growth of cash flows to support the value-in-use calculations for the investment impairment review.
InvestmentsThe Group tests the investment balances for impairment annually. The recoverable amounts of the investments have been determined based on value-in-use calculations which require the use of estimates. Management has prepared discounted cash flows based on the latest strategic plan.
Notes to the Company financial statements

Our B
usinessG
overnanceFinancial Statem
ents
AA plc Annual Report and Accounts 2017 125
Our Perform
ance
2 Investments in subsidiaries 2017
£m2016
£m
At 1 February 806 799Charge for the share incentive schemes 12 7At 31 January 818 806
In the year ended 31 January 2017, there was an increase in investment in subsidiaries of £12m (2016: £7m) relating to the fair value of share-based payments granted. Details are provided in note 34 of the Group financial statements.
No indicators of impairment in the value of subsidiaries have been identified.
3 Investments in joint ventures 2017
£m2016
£m
At 1 February 4 –Additions – 4At 31 January 4 4
On 29 June 2015, the Company invested £4m in a 49% share of a joint venture with TVS Automobile Solutions, one of the largest players in the Indian automotive market.
4 Trade and other receivables2017
£m2016
£m
Trade receivables from subsidiary undertakings 17 13Group relief receivable – 1
17 14
Amounts owed by subsidiary undertakings are unsecured, have no repayment terms and bear no interest.
5 Cash2017
£m2016
£m
Cash 60 5960 59
6 Trade and other payables2017
£m2016
£m
Amounts owed to subsidiary undertakings 8 8Accruals – 1
8 9
Amounts owed to subsidiary undertakings are unsecured, have no repayment terms and bear no interest.
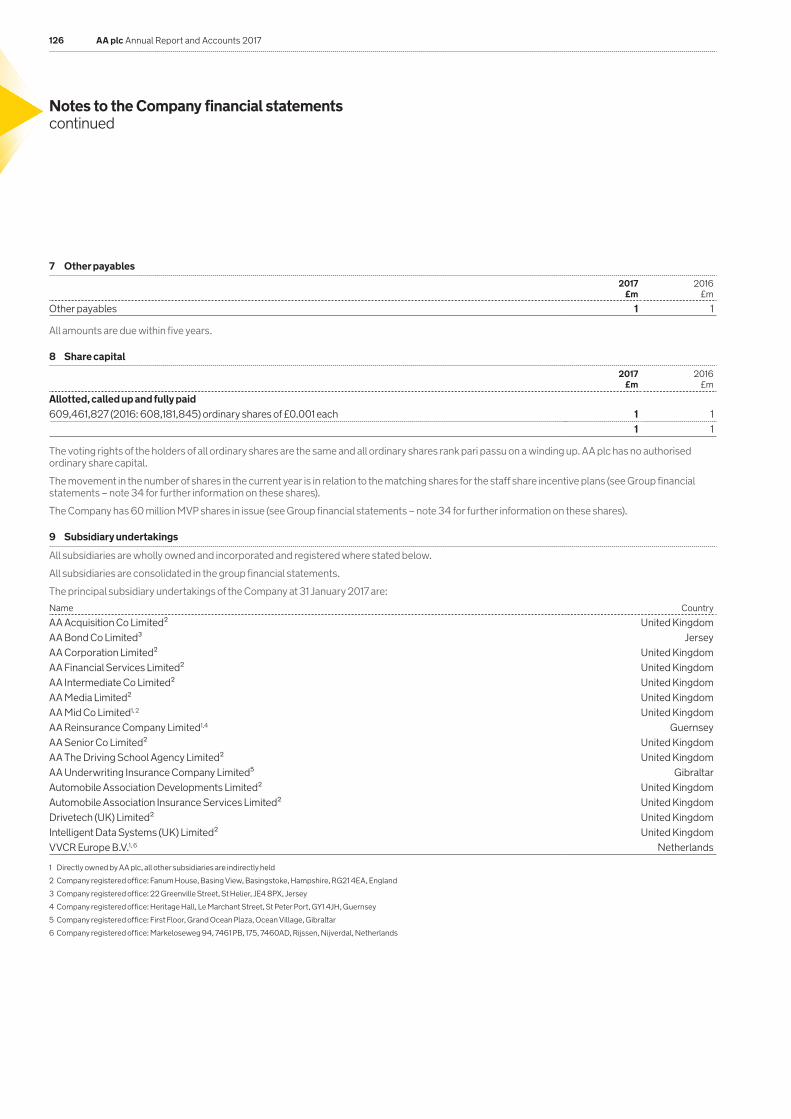
126 AA plc Annual Report and Accounts 2017
Notes to the Company financial statements continued
7 Other payables2017
£m2016
£m
Other payables 1 1
All amounts are due within five years.
8 Share capital2017
£m2016
£m
Allotted, called up and fully paid609,461,827 (2016: 608,181,845) ordinary shares of £0.001 each 1 1
1 1
The voting rights of the holders of all ordinary shares are the same and all ordinary shares rank pari passu on a winding up. AA plc has no authorised ordinary share capital.
The movement in the number of shares in the current year is in relation to the matching shares for the staff share incentive plans (see Group financial statements – note 34 for further information on these shares).
The Company has 60 million MVP shares in issue (see Group financial statements – note 34 for further information on these shares).
9 Subsidiary undertakings
All subsidiaries are wholly owned and incorporated and registered where stated below.
All subsidiaries are consolidated in the group financial statements.
The principal subsidiary undertakings of the Company at 31 January 2017 are:Name Country
AA Acquisition Co Limited² United KingdomAA Bond Co Limited³ JerseyAA Corporation Limited² United KingdomAA Financial Services Limited² United KingdomAA Intermediate Co Limited² United KingdomAA Media Limited² United KingdomAA Mid Co Limited1, 2 United KingdomAA Reinsurance Company Limited1,4 GuernseyAA Senior Co Limited² United KingdomAA The Driving School Agency Limited² United KingdomAA Underwriting Insurance Company Limited⁵ GibraltarAutomobile Association Developments Limited² United KingdomAutomobile Association Insurance Services Limited² United KingdomDrivetech (UK) Limited² United KingdomIntelligent Data Systems (UK) Limited² United KingdomVVCR Europe B.V.1, 6 Netherlands
1 Directly owned by AA plc, all other subsidiaries are indirectly held
2 Company registered office: Fanum House, Basing View, Basingstoke, Hampshire, RG21 4EA, England
3 Company registered office: 22 Greenville Street, St Helier, JE4 8PX, Jersey
4 Company registered office: Heritage Hall, Le Marchant Street, St Peter Port, GY1 4JH, Guernsey
5 Company registered office: First Floor, Grand Ocean Plaza, Ocean Village, Gibraltar
6 Company registered office: Markeloseweg 94, 7461 PB, 175, 7460AD, Rijssen, Nijverdal, Netherlands

Our B
usinessG
overnanceFinancial Statem
ents
AA plc Annual Report and Accounts 2017 127
Our Perform
ance
9 Subsidiary undertakings (continued)
The other subsidiary undertakings of the Company at 31 January 2017 are: Name Country
A.A. Pensions Trustees Limited² United KingdomAA Assistance Limited² United KingdomAA Brand Management Limited² United KingdomAA Insurance Holdings Limited1,2 United KingdomAA Ireland Pension Trustees Limited³ IrelandAA Pension Funding GP Limited⁴ United KingdomAA Pension Funding LP⁴ United KingdomAA PIK Co Limited1,5 JerseyAA Road Services Limited² United KingdomAA Technical Solutions Limited² United KingdomAA Underwriting Limited² United KingdomAutomobile Association Holdings Limited² United KingdomAutomobile Association Insurance Services Holdings Limited² United KingdomAutomobile Association Protection and Investment Planning Limited² United KingdomAutomobile Association Services Limited² United KingdomAutomobile Association Travel Services Limited² United KingdomAutomobile Association Underwriting Services Limited² United KingdomBreakdown Assistance Services Limited⁶ United KingdomBreakdown Hero Limited⁶ United KingdomDrakefield Group Limited² United KingdomDrakefield Holdings Limited² United KingdomDrakefield Insurance Services Limited² United KingdomDrakefield Services Limited² United KingdomLongacre Claims Limited² United KingdomNationwide 4 X 4 Ltd² United KingdomPeak Performance Management Limited² United KingdomPersonal Insurance Mortgages and Savings Limited² United KingdomThe Automobile Association Limited⁵ JerseyVVCR Europe Beroepsopleidingen B.V.⁷ NetherlandsVVCR Europe Holding B.V.⁷ Netherlands
1 Directly owned by AA plc, all other subsidiaries are indirectly held
2 Company registered office: Fanum House, Basing View, Basingstoke, Hampshire, RG21 4EA, England
3 Company registered office: 61a South William Street, Dublin 2, Ireland
4 Company registered office: 50 Lothian Road, Festival Square, Edinburgh, EH3 9WJ, Scotland
5 Company registered office: 22 Greenville Street, St Helier, JE4 8PX, Jersey
6 Company registered office: 90 Long Acre, London, WC2E 9RA, England
7 Company registered office: Markeloseweg 94, 7461 PB, 175, 7460AD, Rijssen, Nijverdal, Netherlands
10 Auditor’s remuneration
The fee for the audit of these financial statements was £0.2m (2016: £0.2m).
11 Staff costs
The Company had no employees or employee staff costs in the current or prior year. However, the Company has incurred costs in respect of the Non-Executive Directors of £1m (2016: £1m).

128 AA plc Annual Report and Accounts 2017
AA plc
Company number: 5149111
Registered office
Fanum House Basing View Basingstoke Hampshire RG21 4EA
Telephone: 0370 544 8866
Share price information
The Company’s ordinary shares are listed on the London Stock Exchange. Share price information can be found on the website www.theaaplc.com
ISIN Number: GB00BMSKPJ95
SEDOL Number: BMSKRPJ9
Advisors
Corporate BrokersCenkos Securities, 6.7.8 Tokenhouse Yard, London EC2R 7AS Liberum Capital, Ropemaker Place, Level 12, 25 Ropemaker Street, London, EC2Y 9LY Morgan Stanley & Co, 20 Bank Street, Canary Wharf, London E14 4AD
SolicitorsFreshfields Bruckhaus Deringer LLP, 65 Fleet Street, London EC4Y 1HS Proskauer Rose (UK) LLP, 110 Bishopsgate, London EC2N 4AY
AuditorsErnst & Young LLP, 1 More London Place, London SE1 2AF
RegistrarCapita Asset Services, 40 Dukes Place, London EC3A 7NH Telephone: 0871 664 0300 (calls cost 10p per minute plus network extras) Lines are open Monday – Friday, 9.00am – 5.30pm (from outside the UK: +44 (0) 208 639 3399).
Please note that from 19 June 2017 Equiniti Limited will replace Capita Asset Services as Registrar to AA plc. Your existing share certificate(s) will remain valid and do not need to be replaced.
The contact details for Equiniti are as follows:
By post: Equiniti Limited, Aspect House, Spencer Road, Lancing, West Sussex BN99 6DA.
By telephone: 0333 207 6538 (from outside the UK: +44 121 415 0999). Lines are open 8.30am to 5.30pm, Monday to Friday.
Online: www.shareview.co.uk.
Financial public relationsHeadland Consultancy, Eldon House, 2-3 Eldon Street, London EC2M 7LS
Financial CalendarThe Company’s Annual General Meeting will be held on 8 June 2017 at Freshfields Bruckhaus Deringer LLP, 65 Fleet Street, London EC4Y 1HS.
Warning to ShareholdersShare fraud includes scams where investors are called and offered shares that often turn out to be worthless or non-existent, or an inflated price for shares that they own. These calls often require you to make a quick decision and come from fraudsters operating in ‘boiler rooms’ that are often based abroad. High pressure sales tactics can also come by email, post, word of mouth or at a seminar. Scams are also advertised in newspapers, magazines or online and appear as if they are genuine investment opportunities.
In addition, be aware of money recovery scams which can be initiated by someone claiming to be from the police or a government agency. Organisations’ names vary but can include the National Fraud Intelligence Bureau and the US Securities & Exchange Commission. You should check the latest information on the Financial Conduct Authority (FCA) website at www.fca.org.uk/consumers/scams/what-to-do-if-you-are-scammed for more details of scams pretending to be the police or a government agency.
The FCA found that even experienced investors have been caught out by share fraud and on average, around £200 million is lost in the UK each year.
If you are offered unsolicited investment advice, discounted shares, a premium price for shares you own, or free company or research reports, you should take these steps before handing over any money:
1. Get the name of the person and organisation contacting you
2. Check the Financial Services Register (FSR) at www.fca.org.uk/firms/systems-reporting/register to ensure they are authorised
3. Use the details on the FSR to contact the firm
4. If you are based in the UK, call the FCA Consumer Helpline on 0800 111 6768 if there is no telephone number on the FSR or you are told it is out of date
5. Search the FCA’s list of known unauthorised firms and individuals to avoid doing business with
6. Remember that law enforcement and other agencies will not contact members of the public asking for their bank details or money
7. Remember: if it sounds too good to be true, it probably is
If you use an unauthorised firm to buy or sell shares or other investments, you will not have access to the Financial Ombudsman Service or Financial Services Compensation Scheme (FSCS) if things go wrong. If you are approached about a share scam you should tell the FCA using the share fraud reporting form at www.fca.org.uk/consumers/scams, where you can find out about the latest investment scams. If you are based in the UK, you can also call the FCA Consumer Helpline on 0800 111 6768. If you have already paid money to share fraudsters you should contact Action Fraud online at www.actionfraud.police.uk or, if you are based in the UK, by telephone on 0300 123 2040.
Shareholder queries and information
Financial information about the company including the annual report, regulatory announcements and corporate governance information is available on our website: www.theaaplc.com
Alternatively please contact us at [email protected]
Shareholder information