financial statements - riverside
TRANSCRIPT

Financial Statements Year ended 31 March 2018 The Riverside Group Limited

Contents
01. At a glance 1
02. Five year summary of financial highlights 3
03. The Board, Executives and Advisors 7
04. Group Chair’s introduction 11
05. Group Chief Executive’s statement 15
06. Strategic report 19
07. Report of the Board 39
08. Independent auditor’s report 51
09. Group and Association statements 55
Group: Consolidated statement of comprehensive income 56
Group: Consolidated statement of financial position 57
Group: Consolidated statement of changes in reserves 58
Group: Consolidated statement of cash flows 59
Association statement of comprehensive income 60
Association statement of financial position 61
Association statement of changes in reserves 62
10. Notes to the financial statements 65

These statements demonstrate we are in a strong position to deliver our vision of transforming lives and revitalising neighbourhoods.
In 2017/18 we achieved the following:At a glance
845New homes and extra care units built
£124mCapital expenditure
45.6%% of service transactions accessed by customers online
32.6%Gearing
£10.1mTransformation investment
1
Last year: 841 Last year: £110m
Last year: £3.5m
We are building
We are connecting Effective business
We are renewing
Effective business
Last year: 34.5%Last year: 38.1%
Last year: £4,880
Raising performance
£4,337Cost Per Unit

2

3
02. Five year summary of financial highlights

4
New homes built
Riverside is committed to increasing its investment in new homes and 2018 once again saw an increase in the number of homes built.
Operating surplus as a percentage of turnover
Operating surplus has increased in 2018 as the Group continues to respond to the challenges presented by the government spending review.
For the year ended 31 March 2014 2015 2016 2017 2018Group
Statement of comprehensive incomeTurnover £’000 303,933 325,977 365,598 370,051 346,160Operating surplus £’000 68,377 80,549 72,812 80,051 80,007Operating surplus as a percentage of turnover % 22.5% 24.7% 19.9% 21.6% 23.1%Surplus on ordinary activities before tax £’000 49,126 48,052 50,087 69,850 60,071Surplus as a percentage of turnover % 16.2% 14.7% 13.7% 18.9% 17.4%
Statement of financial position Tangible assets £’000 1,835,516 1,750,256 1,778,548 1,793,785 1,835,975Loans repayable after more than one year £’000 681,846 749,810 774,867 740,629 749,595Reserves £’000 311,132 334,835 389,843 450,931 518,121
Accommodation figuresTotal housing stock owned and managed Units 52,980 53,164 52,945 52,610 52,942New homes built Units 713 689 750 841 845
Five year summary of financial highlights
2015 24.7%
2016 19.9%
2017 21.6%
2018 23.1%2014
22.5%
2018 845
2015 689
2016 750
2017 8412014
713

5
Gearing
The Association’s gearing fell due to a reduction in borrowing and an increase in the value of property. note: gearing calculation based on funder covenant definition
Interest cover
Interest cover has been maintained, despite an increase in interest.
For the year ended 31 March 2014 2015 2016 2017 2018Group
Key ratiosVoids and bad debts – Group % 2.5 2.4 2.0 2.0 2.7(as % of net rental income)
Rent and service charge arrears – Group % 4.1 2.9 2.9 3.1 4.1(as a % of net rent and service charge receivable)
Interest cover – Association 2.7 2.6 2.4 2.8 2.8(operating surplus plus property depreciation, amortisation and grant divided by net interest payable)
Gearing – Association % 36.5 38.2 36.0 34.5 32.6(loans as % of properties)
All figures have been extracted from current and prior years’ audited financial statements.
2015 2.6
2016 2.4
2017 2.8
2018 2.8 2014
2.7
2015 38.2%
2016 36.0%
2017 34.5%
2018 32.6%
2014 36.5%

6

7
03. The Board, Executives and Advisors

8
The Board, Executives and Advisors
Jonathan Dale
Sally Trueman
Susan Jee Group Treasurer
The Board is responsible for Riverside’s overall policy and strategy and is committed to integrity and accountability in the stewardship of the Group’s affairs.
Group Board
*Co-opted Board Member
Max Steinberg CBE Group Chair
Carol Matthews*
Peter White
Pauline Davis Group Vice Chair
Ingrid Fife
Detailed information can be found about each Group Board member on our website www.riverside.org.uk/about-us/our-team
Tim Croston

9
Registered auditors
KPMG LLP 1 St Peter’s Square Manchester M2 3AE
Principal bankers
National Westminster Bank Plc 28 Castle Street Liverpool L2 0UP
Secretary and Registered Office
Andy Gladwin (resigned 9 May 2018)
Tom Ferguson (appointed 10 May 2018)
2 Estuary Boulevard Estuary Commerce Park Liverpool L24 8RF
Registered Numbers
Co-operative and Community Benefit Society Registered Number: 30938R
Homes England Registered Number: L4552
Executive Directors
Details of Board Member resignations and appointments for the period 1 April 2017 to 21 August 2018 are listed on page 40.
(Left to right) Carol Matthews Group Chief Executive
John Glenton Executive Director, Care and Support
Léann Hearne Executive Director, Shared Services
Ian Gregg Executive Director, Asset Services
Cris McGuinness Chief Financial Officer
Victor Andrews Tenant observer
(not pictured) John Wood (retired 30 April 2018) Executive Director, Neighbourhood Services

10

11
04. Group Chair’s introduction

12
During 2018, we will celebrate our 90th birthday. We hope that our founders would be proud of how we’ve taken the modest resources they secured in 1928 and built a national organisation capable of helping more than 50,000 households at any one time.
Welcome to The Riverside Group’s Financial Statements for the year ended March 2018. Thank you for taking the time to read them.
As usual the statements set out our statutory accounts, as well as providing a more reflective overview of strategic, operational and financial performance. However this year our format is slightly different, in that we are addressing the new requirements set out in The Regulator of Social Housing’s revised Value for Money Standard and associated Code of Practice. No longer are we publishing a separate self-assessment document, but rather we are setting out our achievements against the seven mandatory metrics defined by the Regulator, as well as a range of other strategic measures drawn from our Corporate Plan, to provide a rounder picture of our performance. We have always tried to set out a balanced account of the value for money that Riverside offers, which is aligned with our corporate priorities. However, we hope the new approach provides a more succinct and comparable summary.
During 2018, we will celebrate our 90th birthday, and these statements demonstrate that Riverside has grown to become a financially robust and sustainable organisation which is well positioned to continue to meet the housing needs of some of the most vulnerable households in the country. Looking back, our fundamental mission and social purpose have changed very little – it is the scale at which we operate and the means we use that are different. We hope that our founders would be proud of how we’ve taken the modest resources they secured in 1928, and built
a national organisation capable of helping more than 50,000 households at any one time. I sense that our outlook is very much in tune with the deep reflections that the wider sector has been engaged in, following the terrible Grenfell Tower tragedy just over a year ago. A number of high profile reviews and commissions have been established, and Riverside has played an active role in shaping their thinking, to ensure that social purpose remains at the very heart of social housing going forward.
Of course we are only able to achieve what we do by building an organisation which is adaptable, robust and resilient; one that is operated in the long-term interests of our beneficiaries, given the ongoing risks we face. This means that financial strength is a crucial means to an end, and these statements demonstrate how we have created a business worth over £2 billion, with underlying operating surpluses that enable us to reinvest in more homes and better services. Our financial reserves are over £500m and this strength continues to be recognised externally, with credit rating agency Moody’s continuing to rank Riverside amongst a handful of the country’s most attractive associations to funders, with an A1 rating.
This financial strength needs to be used purposefully, and a year ago we adopted a new three year plan for Riverside, setting out ambitions to step up housing supply, improve our service offer to customers and close the gap between our best and worst performing neighbourhoods. A year on and we are making good progress and we use these pages to account for the outcomes we are achieving.
Group Chair’s introduction

Riverside has grown to become a financially robust and sustainable organisation which is well positioned to continue to meet the housing needs of some of the most vulnerable households in the country.
13
We are looking forward to welcoming Impact Housing Association into the Riverside Group as a subsidiary. It is testament to the quality of relationships built and joint endeavors that this partnership has progressed through a focused period of due diligence to enable both Boards to approve the joining together of two organisations which will unlock significant investment for tenants homes in Cumbria.
None of our achievements could be secured without the highest standards of Governance at Riverside – something that continues to be recognised by the Regulator. We have been able to establish and maintain a passionate and skilful group of non-executives who are committed to the values of Riverside, and who support a highly skilled executive team. Collectively, they combine a long-term strategic outlook with real attention to detail, as they seek assurance about investment opportunities and performance. These statements are a tribute to their tireless dedication and wisdom.
Max Steinberg CBE Group Chair

14

15
05. Group Chief Executive’s statement

16
Balancing a clear social purpose with commercial behaviours is not new to Riverside. We’re broadly on course to deliver our objectives, though there will inevitably be challenges ahead.
The publication of our 2018 Financial Statements comes at a moment of significant opportunity for Riverside and the wider social housing sector. Over the years we have tended to focus on the gathering clouds of increasing risk, whether associated with Brexit, the squeeze on customer incomes through ongoing welfare reform, and reducing Government investment in homes and services. Whilst these are still very real, the stock of social housing, and housing associations in particular, is rising. Government has set itself an ambitious target of building 300,000 new homes each year, practically doubling current levels of output, and sees housing associations as having a significant role to play, both through providing traditional products such as social rented housing and affordable homes for sale for those locked out of the housing market.
The gauntlet has been laid down, presenting a unique chance for the sector to show what it can deliver. This growth agenda needs to be balanced with other objectives, as the call for housing associations to reaffirm their social purpose and offer greater transparency and accountability gets louder. Balancing a clear social purpose with commercial behaviours is not new to Riverside, and we have attempted to reconcile these through the Corporate Plan we agreed a year ago and on which we report progress in these statements.
We’re broadly on course to deliver our objectives, though there will inevitably be challenges ahead. During last year we completed over 845 new homes, the highest number in the recent history of Riverside, fitting for such a significant birthday year. Our affordable rental programme has been particularly strong, but it is clear that our commercial housebuilding is not delivering at the level we originally planned, with sales around 15% below target. We know that if we are to achieve our own target of doubling the number of homes built over the plan period, we will need to find new delivery vehicles such as Joint Ventures and partnerships, maximising opportunities to enter deals with Homes England.
At the same time, we are relentlessly implementing our ambitious approach to service transformation, resulting in an improvement in customer satisfaction by more than a third over the year (as measured by our net promoter score), delivered at a reduced cost. Our new front line service model has been rolled out across our neighbourhoods, with 40% more housing officers on the ground, backed by an efficient shared service centre and a new on-line customer self-service portal for repairs ordering which is being trialled in over 3,500 households. We are also proud to continue to grow our care and support services. Tackling the rising tide of homelessness is central to our strategy, and
Group Chief Executive’s statement

Following a competitive process, we were selected
as preferred partner by Impact Housing Association, and I am delighted that they
have now chosen to join the Group as a subsidiary.
17
we now provide services to over 10,000 homeless customers each year. We do not see the continuation and growth of these services as optional – they are central to our mission.
In the longer-term, we recognise that there is a role for growth through merger, acquisitions and other forms of constitutional partnership, and we are continuing to develop our approach but only where this will help us meet our strategic objectives. Following a competitive process, we were selected as preferred partner by Impact Housing Association, and I am delighted that they have now chosen to join the Group as a subsidiary. This will immediately unlock significant investment to improve tenants’ homes in Cumbria, and provide a longer-term opportunity to develop a more efficient and effective service offer across the whole of the county, as we explore the integration of Impact’s operations with our own in the Carlisle region.
Investment at the scale that we have embarked upon demands a clear financial strategy backed by challenging targets. Whilst these statements demonstrate that our overall position is strong – with excellent liquidity and relatively low borrowing per unit – we remain on a journey to improve our operating margin and reduce our unit costs, where we perform below average for our peers. At Group level, both of
these measures have improved over the past year, but there is some way to go.
We are now on our own journey of organisational transformation which will be pivotal to our success. It is only by changing ourselves that we will be able to achieve our fundamental mission of ‘transforming lives, revitalising neighbourhoods’.
Carol Matthews Group Chief Executive

18

19
06. Strategic report

20
Overview of the businessThe Riverside Group Limited (TRGL) is registered with the Regulator of Social Housing, for now the regulatory division of The Homes and Communities Agency, as a Private Registered Provider (PRP) of social housing as defined by the Housing and Regeneration Act 2008 and it is a charitable Registered Society under the Co-operative and Community Benefit Societies Act 2014. It is the parent of Irvine Housing Association Limited, which is registered with the Scottish Housing Regulator (SHR). The Group also engages in commercial activities through its subsidiaries Prospect (GB) Limited (residential development), Evolve Facility Services Limited (property maintenance) and The Compendium Group Limited, a joint venture with Lovell Partnerships Limited (large scale urban regeneration and development). Riverside Estuary Limited operates our Hull Extra Care PFI. Riverside
Finance plc was set up to enable funding to be secured from the capital markets for the Group.
The Group’s structure is summarised in the table below and governance related matters are discussed in the Board report.
More detail of the Group’s structure and its activities is set out in Note 12 of the financial statements.
The strategic report will provide information across three themes:
— Our strategy— Our business environment— Our business performance.
Each of these will be expanded upon in the paragraphs which follow.
Transforming the business is key to unlocking efficiencies which will allow us to prosper for years to come, building affordable homes and improving our customers’ experience, with a more streamlined, cost effective and targeted approach.
Strategic report
1Note: Registered Social Landlord
Irvine Housing Association Limited
Prospect (GB) Limited
Evolve Facility Services Limited
The Compendium Group Limited
Riverside Estuary Limited
Riverside Finance plc
The Riverside Group Limited: 52,942 units owned and managed
Scottish RSL1 Property development and investment
Property maintenance
Major regeneration projects
Construction and management of extra care units
Bond finance
21
Our strategyObjectives
Our vision is “transforming lives,
revitalising neighbourhoods”.
We seek to transform the lives of individuals by providing quality services and better opportunities, whilst revitalising the places they live through investing in our homes and leading regeneration.
Riverside’s plans for achievement of its objectives are managed on a three year cycle. We have just completed the first year of our Corporate Plan 2017-20, and are making good progress in delivering our key strategic objectives.
ContextIn developing this plan, we have we have reviewed a range of evidence. We have considered the implications of significant economic, political and demographic change in the context of European and global political instability. We have also reflected on our own performance and the changing characteristics of our customers, stock and neighbourhoods.
Our objectives The Riverside Corporate Plan 2017-20 is called ‘We are Riverside’ and sets out how we will deliver our vision. We have broken the strategy down into three objectives.
— Stepping up supply – for future customers and the taxpayer
Helping end the housing crisis; doubling our housebuilding programme in three years.
— Customers first – for existing customers Making customers and communities our priority
by working in new ways; completing our modernisation programme, rolling out online repairs services.
— Neighbourhoods matter – for communities and local partners
Closing the gap between our best and worst performing places.
Our objectives are outward facing. But to achieve them we need to continue to focus internally and transform the business to drive better value for money and performance, through motivated and engaged colleagues. We set out a coherent change agenda for
the coming three years through identifying activities and targets under three ‘routes to success’:
— adding value— engaging our people— raising performance.
The main vehicle for this change is our transformation programme which will develop a new Target Operating Model (TOM) for the whole Group. The programme provides a clear, resourced roadmap, following a £25m commitment made by the Board. Creating and implementing a new Group-wide model will enhance the value for money we offer to our stakeholders, and ensure that Riverside is a flexible and adaptable organisation able to meet immediate and future challenges.
We will deliver the plan by translating high level objectives into resource backed business stream and regional plans, with robust methods to ensure our Boards and Executive Team gain assurance about delivery.
Over the three years of the plan we have set ourselves the following targets:
We are building… Stepping up supplyBy March 2020 we will have:
— Built 1,500 homes in each year, two-thirds of which will be for affordable rent.
— Delivered a 400 home programme in Scotland.
We are connecting… Customers firstBy March 2020 we will have:
— 50% of repairs and other key service transactions undertaken online.
— 15% of older customers helped by the Retirement Living at Home initiative to continue living independently in their existing homes.
— £1m additional investment in our support services leveraged through new funding streams including social impact investment.
We are renewing… Neighbourhoods matter— Over 200 new homes for rent and our first homes
for sale started as part of the London Assets programme.
— Two large scale renewal plans approved, backed by multi-million pound investment.
— 1-2% of our rented homes disposed each year in accordance with strategic plans.
— National footprint reduced from 163 to 150 local authority areas.

22
Economy and the housing market
Explanation – As the Group increases the number of new housing starts, it becomes more sensitive to macroeconomic conditions, including uncertainty relating to Brexit and market cooling in London.
Mitigation – The business golden rules have been re-affirmed by Group Board. These are the critical, high priority performance measures which must be maintained and include liquidity, covenant headroom and operating margin.
The Group actively mitigates interest rate risk through hedging.
All development schemes are reviewed by the new Investment Appraisal Committee at a range of gateways including concept, acquisition and completion. This enables a thorough review of each scheme in the context of market changes.
One of the golden rules sets out the maximum investment in commercial activities. The financial results of the commercial entities have full visibility at Group Board.
Our business environment The following paragraphs will explain the internal and external environment in which Riverside operates.
Welfare and housing policy
Explanation – There are a range of policy developments which could impact on the Group. These include the Housing White and Green Papers, the Green Paper for Care & Support, proposals for the future funding of supported housing, voluntary right to buy and roll out of universal credit.
Mitigation – Riverside has a track record as an influencer and opinion former in the sector.
Group Board hold regular strategy events to review the external environment and to develop the Group’s response.
The potential impact of Government policy is reflected in the Group’s Business Plan through sensitivity analysis and stress testing.
Risk managementRiverside directs its affairs in a prudent manner and safeguards its assets through the effective management of risk with regular reviews of the risk landscape and Board approval of all business developments involving significant risk. The strategic risk register is routinely considered by Boards and Committees.

23
Funding
Explanation – As at March 2018 the Group has borrowings of £779m. The Group needs to maintain the confidence of the financial markets so that it can raise the additional funding necessary to fulfil its ambitions to increase housing supply. The 2017-20 Corporate Plan includes a commitment to provide 1,500 new homes a year by 2020.
Mitigation – The Group’s credit rating was revalidated as A1 by Moody’s at the end of 2017.
The business plan underwent exhaustive stress testing and Group Board concluded that the business could withstand a range of adverse scenarios.
The surplus from open market sales is a key dependency given that it contributes cash to underpin the affordable homes programme.
Riverside is financially strong and the ability to provide security against future borrowing is the key limiting factor to its development ambitions.
Safety first
Explanation – The Group works with some of the most vulnerable members of the community and attaches the highest priority to its compliance responsibilities.
Mitigation – An asset compliance framework has been rolled out. This includes robust data quality controls, ongoing risk assessment, escalation routines and clear accountabilities. A comprehensive compliance dashboard is scrutinised by the governance community.
A consistent Group wide communal area inspection regime was implemented in the year.
Over the past two years the Group has invested in its information security capabilities including senior appointments and new technologies. In May 2018 the Group was awarded a certificate of assurance that it met the requirements of the UK.Gov Cyber Security Essentials scheme.
Transformation
Explanation – Driven by the four years of rent reduction, economic challenges and welfare reform, the Group is over mid-way through an organisational redesign (the Target Operating Model) which is the largest change programme ever attempted at Riverside.
Mitigation – There has been significant investment in business change capability. Risk management is an important element of the business change methodology. The IT transformation programme is on track.
The IT team is demonstrating its ability to deliver complex projects and the first phase of a major upgrade of the core housing management system successfully went live in February 2018.
A new model for the delivery of frontline housing services was implemented in November 2017. Staff have been equipped with the tools and technologies to facilitate agile working. They are supported by a centralised back office team.
Regular updates on progress including savings made are presented to Group Board. The implementation process has had no adverse impacts on customer service KPIs.

24
Being a responsible business
Riverside is one of the country’s largest providers of affordable housing, care and regeneration services. A group of complementary businesses driven by a clear social purpose, our charitable housing association is at our core.
Being a responsible business links closely with our overall vision to transform lives and revitalise neighbourhoods. Our values are also at the heart of what we do, and reflect our strong sense of social responsibility and accountability to our customers. We are people-focused, courageous, trusted and ambitious. We pride ourselves in doing business in an ethical way, whilst respecting the environment.
We have an impressive track record of investing in added-value activities for individuals and wider communities, whilst delivering measurable positive outcomes. Our commitment to being an ethical and social business informs all our activities, we also contribute through specific initiatives, such as those described hereafter.
— Community
Our Retirement Living at Home model offers services for a significant number of older customers who live in a general needs home. Over the next three years (2017-20) we have tasked ourselves to help 15% of our older customers to continue living independently in their existing homes. Our provision of extra services to help sustain tenancies, including money advice, has seen customers £15m better off over the last three years (2014-17). Riverside staff raised £100k for our corporate charity, Cancer Research UK.
— Environment
Over the past three years (2014-17) we have spent £3m improving public services on our estates. In London we are working with customers to shape multi-million pound improvements on six of our estates. The ambitious, self funded regeneration scheme aims to replace existing homes with new ones that are safer, warmer, more energy efficient, great open spaces are created and community safety improved.
— Marketplace
We are making an additional investment (£1m over 2017-20) in our support services, leveraged through new funding streams, including social impact investment. We maintain an ongoing commitment to responsible procurement, with every Pre-Qualification Questionnaire (PQQ) or tender including our standard requirements on social value and responsible business.
— Workplace
In May 2017 Riverside signed up to MIND’s Employer Pledge, detailing how we would demonstrate our commitment to changing the way we all think and act about mental health in the workplace. This includes; a mental health scenario as part of Equality Analyses for developing/renewing policies, and a mental health and wellbeing prompt added to all staff one-to-ones meetings, yearly appraisals and back to work interviews.
25
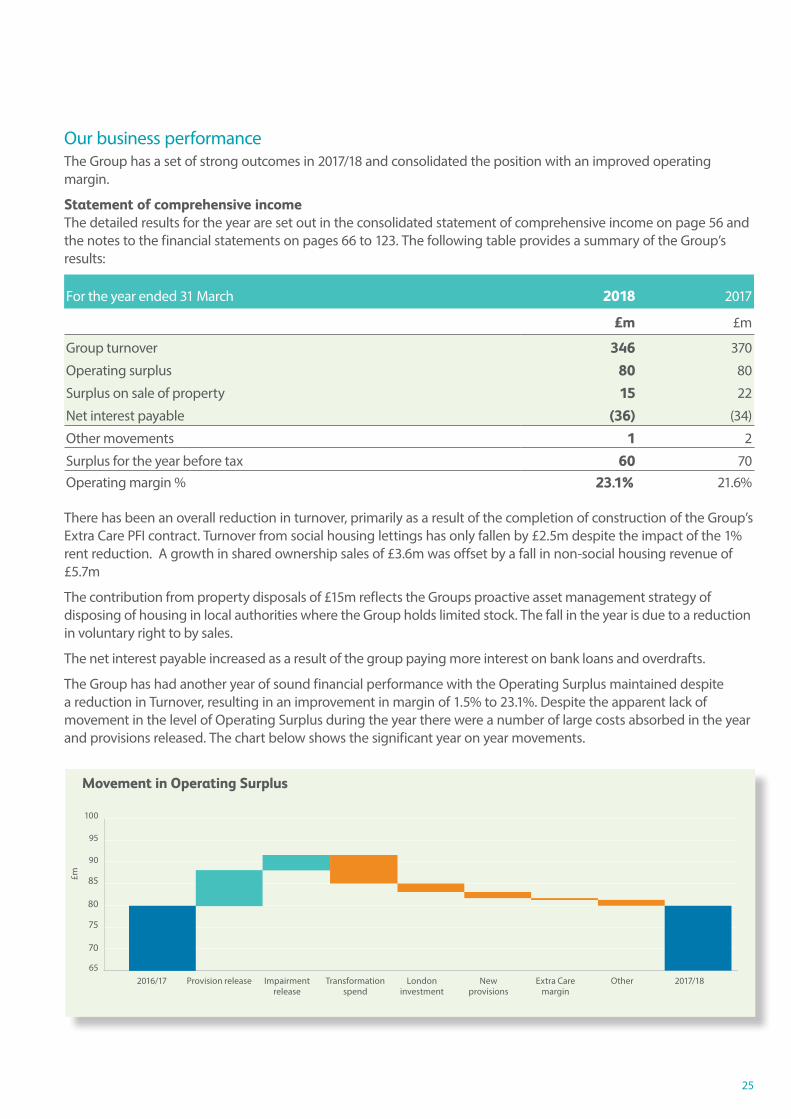
Our business performanceThe Group has a set of strong outcomes in 2017/18 and consolidated the position with an improved operating margin.
Statement of comprehensive incomeThe detailed results for the year are set out in the consolidated statement of comprehensive income on page 56 and the notes to the financial statements on pages 66 to 123. The following table provides a summary of the Group’s results:
For the year ended 31 March 2018 2017
£m £m
Group turnover 346 370
Operating surplus 80 80
Surplus on sale of property 15 22
Net interest payable (36) (34)
Other movements 1 2
Surplus for the year before tax 60 70Operating margin % 23.1% 21.6%
There has been an overall reduction in turnover, primarily as a result of the completion of construction of the Group’s Extra Care PFI contract. Turnover from social housing lettings has only fallen by £2.5m despite the impact of the 1% rent reduction. A growth in shared ownership sales of £3.6m was offset by a fall in non-social housing revenue of £5.7m
The contribution from property disposals of £15m reflects the Groups proactive asset management strategy of disposing of housing in local authorities where the Group holds limited stock. The fall in the year is due to a reduction in voluntary right to by sales.
The net interest payable increased as a result of the group paying more interest on bank loans and overdrafts.
The Group has had another year of sound financial performance with the Operating Surplus maintained despite a reduction in Turnover, resulting in an improvement in margin of 1.5% to 23.1%. Despite the apparent lack of movement in the level of Operating Surplus during the year there were a number of large costs absorbed in the year and provisions released. The chart below shows the significant year on year movements.
Movement in Operating Surplus
£m
65
70
75
80
85
90
95
100
London investment
2016/17 Provision release Impairment release
Transformation spend
New provisions
2017/18Extra Care margin
Other

26
During the year Operation Surplus benefited from a net £8.9m release of provisions and a net £3.5m release against impairment despite the inclusion of the impairment of a land bank site and properties in London earmarked for demolition and replacement with new build social housing.
The year also saw an £6.6m increase in investment in transformation and a £2.0m increase in the development of Lon-don Assets attributable to an increase in professional fees and the impairment provision. Spend in both these areas has the objective of either delivering future savings or future growth. Cost includes £1.2m of new contractual provi-sions. The other significant elements of the movement were the transition of Extra Care units located in Hull from the construction phase to being fully operational which adversely impacted the surplus by £0.4m and a £0.8m fall across the wider operation.
Statement of cash flows
The consolidated statement of cash flows is provided on page 59 and supporting details can be found in the notes to the financial statements on pages 66 to 123. The following table provides a summary of the key elements.
For the year ended 31 March 2018 2017
£m £mOperating activities 125 123
Returns on investment and servicing of finance (41) (35)
Capital expenditure (124) (110)
Proceeds from property sales 37 50
Change in short term deposits 13 5Cash inflow/(outflow) 10 33
Financing (15) 2
Increase in cash (5) 35
Net cash received from operating activities was £2m higher than the prior year. The cash generated from operations, sales, grants and investments has been used for the supply of new housing, the improvement of existing properties and the purchase of stock from other associations. Capital expenditure was £124m in the year compared to £110m in the previous year.
Proactive asset management remains a key aim with surplus properties being sold allowing the proceeds from sales of £37m to be reinvested in the Groups remaining homes as well as funding further supply of new homes. Cash received from social housing grant and investments amounted to £42m.

27
Statement of financial positionThe consolidated statement of financial position is provided on page 57 and supporting details can be found in the notes to the financial statements on pages 66 to 123. The following table provides a summary of the key elements.
For the year ended 31 March 2018 2017
£m £mFixed assets and investments 1,860 1,832Debtors receivable after more than one year 11 12Net current assets 154 130Total assets less current liabilities 2,025 1,974Creditors falling due after more than one year 1,507 1,523Reserves 518 451
2,025 1,974Debt per unit (£’000) 13.9 15.1
The surplus generated has resulted in a strengthening of the balance sheet funded by an increase in reserves in addition to a reduction in debt resulting in reduced gearing.
The construction of social housing and shared ownership properties, the purchase of 491 units from Hyde Housing and the continued investment in existing properties and technology increased the value of fixed assets by £42m. This increase was achieved against the backdrop of the ongoing disposals programme referred to earlier.
Fixed asset investments have decreased by £14m as a direct result of the disposal of the Commercial Properties portfolio within Prospect.
There have been a number of significant movements within current assets. Investments have reduced by £14.3m due to a reduction in the affordable housing fund. Trade and other debtors have reduced as a result of more effective credit control. There has been an increase in properties for sale of £5.7m. Cash has reduced by £5m from £69m to £64m due to an increase in capital investment.
Short term creditors have reduced due to release of long standing provisions and a fall in loans.
The operating surplus generated has meant that investment spend has been funded without the need for increased borrowing.
Cash Flow
£m
0
50
100
150
200
250
300
Finance cost
Opening cash
Cash from operations
Cash from sales
Grants and investment
Funding Closing cash
Capital expenditure

Investment in assets
Housing stock Other net assets Reserves Grant Loans less cash
Funding of assets
28
We have reinvested the surplus generated into our housing assets and enhancing the organisation’s financial strength. The “We are building” stream within the Corporate Plan will ensure the continued investment in the organisation’s housing assets.
Our borrowing structure and interest costs As at 31st March 2018, the Group has committed funding of £1,052m of which £779m is drawn. Available facilities are comprised of £173m of facilities fully secured and ready to draw and a further £100m of facilities which are agreed but awaiting security; this additional £100m of funding is expected to be available to draw by 31 March 2019. In addition to loan facilities, as at 31 March 2018 the Group also had available as funding £100m of retained bonds (which are fully secured and available for issue) and £64m of cash and cash equivalents.
During the course of the year, the retained £10m of low cost government guaranteed funds from AHF plc were drawn. A total of £150m of new revolving credit facilities were agreed in the year, which also brought a new counterparty (HSBC) into the lending portfolio. £50m of these new facilities were secured and available to draw by the year end. In addition, a further £40m of revolving credit facilities were being arranged with a second new counterparty, Svenska Handelsbanken AB. This facility is expected to be executed, secured and available to draw over the course of the year ending 31 March 2019.
The Group’s treasury policy aims to minimise refinancing risk and the Group has to repay £95m of loans over the next five years which represents 12% of drawn debt.
Net Interest costs are £35m (2017: £34m). The weighted average cost of drawn debt, inclusive of margins and hedging activities was 4.3% (2017: 4.6%).
The Group manages its exposure to fluctuations in interest rate risk by ensuring the proportion of its debt on fixed interest rates provides a high level of certainty over its net interest costs. Fixed rates are provided via a combination of fixed rate debt, embedded and standalone interest rate swaps. At 31 March 2018, 93% of Group’s drawn debt (inclusive of hedging activities) was fixed (2017: 96%). This would have fallen to 76% if all loan facilities were fully drawn (2017: 79%).
The Group applies FRS 102 accounting. Under FRS 102 the fair value of derivatives are shown on the balance sheet with the corresponding fair value movement disclosed in the cash flow hedge reserve or via the statement of comprehensive income dependent on whether the requirements of hedge accounting have been achieved.
At 31 March 2018 the Group had a standalone interest rate swap exposure of £18m (2017: £25m) based on fixed rate interest rates with a notional value of £226m. The weighted duration of the

29
swaps is 4.6 years (2017: 4.8 years). For the year ended 31 March 2018 the application of hedge accounting has resulted in limiting the impact of the movement in fair value of derivatives to £0.7m credit to the statement of comprehensive income (2017: £1.2m credit)
Loan covenants, actual and forecast, are monitored monthly and reported to the board on a quarterly basis. The key covenants are interest cover, gearing ratios and asset cover. All covenants have been met throughout the year and at the year end.
As at 31 March 2018, the Group has a Moody’s credit rating of A1 and the outlook for the Group is deemed stable, in accordance with Moody’s current view of the social housing sector in general.
Our developmentStepping Up Supply is a key theme within the Riverside Corporate Plan for 2017-20. This will be achieved through building different tenures to help balance the risks and ensure the development programme is financially sustainable. In the first year, half of the homes we have built have been at affordable rents, with the remainder being sold outright or on a shared ownership basis.
At the end of the first year financial performance and progress against affordable unit targets has been good. Over 1,000 of the 2,111 new homes target set out in the Corporate Plan have been identified or secured.
Of these, 29% will be new shared ownership homes. During 2017/18 we completed 429 new affordable rented and shared ownership homes and started on site on a further 379 homes.
We continued to focus our investment on core areas, where we have a strong presence, working closely with local authorities to deliver significant programmes in Cumbria, Tyneside, Merseyside, Derby, Leicestershire and Hull.
We have completed all phases of our Hull Extra Care PFI project in March 2018, which has seen an additional 316 homes provided. Prospect and Compendium (our joint venture company) have completed and sold 159 and six properties respectively.
Riverside has identified six sites in London which currently house over 500 tenants that may benefit from regeneration, with feasibility studies indicating up to 600 additional homes could be provided. Consultations with residents and local planning authorities has commenced on three of these estates, and a procurement process completed to identify developer partners.
And in Scotland, work started in May 2018 on a site in Irvine. This will see 87 new affordable homes delivered with over £5m of grant secured from Scottish Government. This is an indication of our desire to grow in Scotland.
Over the last year, half of the homes we have built have been at affordable rents, with the remainder being sold outright or on a shared ownership basis.

30
Business Effectiveness: value for money Our approachIn this section we set out evidence of Riverside’s compliance with the regulator’s new value for money standard and accompanying code of practice. We will not be publishing a separate narrative self-assessment.
Over the years we have adopted a method of improving value for money that is fully integrated into the running of our business. We do not see VFM as something that is ‘separate’, but rather we have adopted approaches to corporate planning and performance management which clearly set out what we want to achieve for our customers, prospective customers and communities. We then identify and manage the people, financial resources and processes needed to achieve our goals.
Seven (plus five) MetricsTo demonstrate the progress we are making in achieving our objectives in a cost effective manner, we are reporting performance against the seven metrics defined by The Regulator of Social Housing, to enable comparison against the rest of the sector. We also compare our performance against our targets for the year (where they have been defined), and, to give a sense of our direction of travel, our results for 2016/17. Where performance falls short, we set out high level proposals for improvement and a target for 2018/19.
The seven mandatory metrics on their own do not cover the breadth of our objectives. We have therefore supplemented them with five other measures, drawn from our Integrated Strategic Performance Report. This is the bi-monthly scorecard we use to review progress against the objectives set out in our three year corporate plan, which has now come to the end of its first year. https://www.riverside.org.uk/about-us/our-vision/
We have selected five measures which focus on the outcomes we deliver for customers and communities, related to our main objectives. These complement the regulator’s more financial and development orientated metrics.
They are as follows:
Stepping up Supply— Customer satisfaction with new homes: for rented
homes built as part of our affordable programme (effectiveness).
— Net Present Value per unit of our affordable housing programme: a measure of financial viability of the largest component of our development programme (economy).
Customers First— Net promoter score: an overall measure of
satisfaction with service across our main business stream (effectiveness).
— Percentage of key transactions completed on-line: a potential future driver of customer satisfaction and cost reduction (efficiency, economy).
Neighbourhoods Matter— Satisfaction with area as a place to live: a
measure of the impact of our investment in neighbourhoods (effectiveness).
How are we doing?So what do these combined metrics tell us about the value for money that Riverside offers as we reach the end of the first year of our new Corporate Plan?
We believe they tell the story of an organisation which:
— is financially strong, but still serious about improvement: achieving sustainable year on year cost reductions through an ambitious programme of transformation; securing a steady rise in customer satisfaction.
— is re-investing our substantial financial capacity: building more homes than ever for rent, shared ownership and sale.
— understands the places in which we work, and seeks to manage our assets actively.
— remains totally committed to our charitable purpose of supporting some of those in the greatest need: understanding the financial consequences of doing so, and ensuring we maximise returns elsewhere in the business.

31
The Mandatory Metrics
We have benchmarked our performance against the provisional sector score card results for associations owning more than 10,000 homes. The benchmark applied is the median for this group.
Metric 1: Reinvestment % EFFICIENCY
RESULT TARGET PREVIOUS YEAR
BENCHMARK
3.6% 4.0% 4.3% 6.3%
Riverside is generating substantial surpluses which strengthen our balance sheet and enable us to re-invest in new and improved homes. In 2017/18 Riverside re-invested almost 3.6% of the total value of our housing assets in this way. Re-investment in our existing homes increased and was above target last year. We spent over £40m (gross) in planned maintenance and improvements. Additionally £29m was spent on stock acquisition and a significant amount was invested in stock rationalisation with the aim of increasing efficiency.
Performance Improvement: We are committed to a significant step-up in our development programme under our 2017-20 corporate plan, although this will not be evident in our spend until 2018/19. This is reflected in next year’s targets.
Target for 2018/19: 5.6%
Metric 2: New supply delivered % ECONOMY
RESULT TARGET PREVIOUS YEAR
BENCHMARK
a. Social Housing Units
0.9% 1.1% 0.8% 1.15%
b. Non-social Housing Units
0.3% 0.4% 0.5% 0.06%
We have made a positive start to delivering our Affordable Housing programme under the current Corporate Plan 2017-20, and in the first year we completed 429 social housing units. This figure comprises a mixture of social, affordable rent and shared ownership units across a range of property types. Outside of VFM reporting requirements, we completed an additional 251 extra care units (Hull PFI scheme), which puts us between median and upper quartile of developing housing associations.
We have taken advantage of a favourable development climate in which high quality Section 106 opportunities have continued to present and the availability of grant has been better than anticipated. Shared Ownership sales exceeded budget (£2.3m).
The number of ‘Non-Social’ unit completions fell short of target, although is in the upper quartile when benchmarked with other providers with more than 10,000 homes, primarily as a result of slower than anticipated sales by Prospect, our commercial inhouse building subsidiary. This reflected both delays in the development and land purchase processes, and slower than anticipated sales on three sites.
Performance Improvement: — Revised targets for commercial housebuilding
subsidiary. — Consider new joint venture vehicles for mixed
tenure development, including non-social housing.
Target for 2018/19: social housing units 0.9% non-social housing units 0.4%
Metric 3: Gearing % EFFICIENCY
RESULT TARGET PREVIOUS YEAR
BENCHMARK
38.9% 46.0% 40.3% 46.1%
Riverside’s gearing has fallen by nearly 1.5% over the past year putting us well below the median position for our comparator group. Increasing reserves and some slippage in our development programme has reduced our immediate borrowing needs. This a temporary position, and we can expect gearing to begin to climb again in 2018/19 as our development programme builds.
The strength of our balance sheet puts Riverside in a very strong position to fund the significant long-term growth ambitions set out in the 2017-20 Corporate Plan, as we play our part in helping tackle the housing crisis. We remain a very attractive prospect to lenders and investors, having maintained a Moody’s A1 credit-rating, one of only two providers in the sector to do so. Around a third of our rented homes are uncharged.
Performance Improvement: None required. Target for 2018/19: 39.4%

32
Metric 4: Interest Cover (EBITDA MRI) EFFICIENCY
RESULT TARGET PREVIOUS YEAR
BENCHMARK
189% 121% 205% 198%
Our interest cover is relatively healthy, and provides significant headroom against our highest loan covenant requirement. However despite a small increase in our overall operating surplus in 2017/18, interest cover has fallen from the previous year. This is partly because of higher levels of investment in our stock over the year, a £3m increase in capitalised major repairs as well as increases in interest payable arising from one-off costs associated with restructuring and simplifying our loan portfolio. The actual level of interest paid reduced.
Our interest cover is in the lower middle quartile for our comparator group and is a product of a number of structural factors which supress our operating surplus, a key component of the calculation. Our headline unit costs are high compared to sector averages. This is predominantly because of higher costs and the lower operating margins associated with our care and support business, where our operating margin is half that that of our general needs business stream. Our level of interest cover is also the product of a relatively low rent base, given our concentration of stock in lower value areas, especially in the north west of England. The average net rent for our general needs stock is 11% lower than the sector average.
Performance Improvement: — Further reduce management and overhead costs
through transformation programme (see below).— Further repairs savings through new in-house
service in South and Central Region.— Delivery of asset management programme which
will see a gradual shift in asset values through our development and acquisitions programme, and the disposal of lower value assets.
Target for 2018/19: 140%
Metric 5: Headline Social Housing CPU ECONOMY
RESULT TARGET PREVIOUS YEAR
BENCHMARK
£4,337 £4,414 £4,880 £3,198
Riverside’s headline social housing cost per unit has fallen by more than 11% from 2016/17, continuing the trend from the previous year reported in our final VFM self-assessment. This has been driven in part by cost savings generated by our ongoing transformation programme, despite one-off restructuring costs still being a major factor in offsetting net savings. The other significant driver of change has been a reduction in ‘other social housing costs’, which were artificially inflated in the two previous financial years as a result of the accounting treatment of Hull PFI.
Whilst our cost performance relative to a sector median of £3,198 appears weak, this is largely driven by high service costs associated with our supported housing and housing for older people. When these costs are removed, Riverside’s adjusted CPU for management, repair, maintenance and other falls to £2,939, closer to the adjusted median for our comparator group of £2,842.
Performance improvement: — Performance improvement measures the same as
those set out for interest cover.
Target for 2018/19: £4,026

33
Metric 6: Operating Margin % EFFICIENCY
RESULT TARGET PREVIOUS YEAR
BENCHMARK
Overall 23.1% 19.3% 21.6% 29.3%Social Housing 30.7% 25.3% 29.3% 32.9%
Riverside’s overall group-level margin has improved by 1.5% over the year, nearly 4% above target. With our margin now increasing towards 25%, we are well on the way to achieving a target margin of 30% by 2021 just above the current median for our comparator group of 29.3%. Whilst the operating surplus has remained at £80m, the improvement in margin is largely accounted for by a reduction in turnover of over 6%, arising from a number of factors including ongoing rent reductions, the removal of the one-off impact of our Hull PFI schemes over the previous two years, and the sale of our commercial property portfolio.
The level of our Group margin is largely driven by our social housing business, with our commercial development subsidiary only generating an operating margin of 4% (against a target of 13%). This follows a challenging year where sales have been substantially behind target and the impact of a £2m balance sheet write off has been absorbed. Furthermore, within our social housing business, neighbourhood services (general needs rent and shared ownership) has an operating margin which is nearly double the level generated by our care and support business stream. Care and support has a very different business model being resource intensive and where contracted income and service charge income account for 60% of turnover.
Our social housing margin is stronger at 30.7% closer to the median for our comparator group of 32.9%, a slight improvement on the previous year and over 5% above target.
Performance improvement: — Improved commercial sales performance and profit
margins, incorporated in Prospect’s business plan going forward (under new leadership).
— Other cost reduction measures as per commentary on interest cover.
We plan to retain and grow our care and support arm as a lower margin business, as this is central to our mission as a charitable housing association. However we will continue to drive improvements to its margin.
Overall target 2018/19: 25% Social Housing target for 2018/19: 33.1%
Metric 7: Return on Capital Employed ECONOMY
RESULT TARGET PREVIOUS YEAR
BENCHMARK
4.75% 3.63% 5.22% 4.10%
Our Return on Capital Employed is nearly 5%, 1% above our target for the year and well above the median for our comparator group, but 0.5% below the level achieved in 2016/17.
This decline is mainly driven by two unusual factors: a £30m acquisition of 500 homes from Hyde which was completed just before financial year end, boosting our asset base but without significant returns being generated; and a reduction in gains on the disposal of fixed assets from the previous year which had been boosted by our participation in the Voluntary Right to Buy Programme.
Performance Improvement: None required.Target for 2018/19: 4.4%

34
Our Additional Value for Money Metrics
Stepping up Supply
Customer satisfaction with new home (affordable rent and shared ownership)
RESULT TARGET PREVIOUS YEAR
91.3% 92.0% N/A
A high level of customer satisfaction with newly built rented and shared ownership homes was achieved in 2017/18, with overall performance falling just short of target at 91.3%. This was predominantly the result of extremely positive feedback regarding the design and safety features of our properties across the Group, with 100% satisfaction recorded among general needs customers.
Whilst this reflects a positive outcome in the context of an expanding development programme and increased sales activity, a more favourable overall outturn was not achieved due to a reduction in the number of ‘very satisfied’ and ‘satisfied’ Shared Ownership customers.
Despite this, it is clear that we provide a high quality new build offer to all customers.
Performance Improvement: — Robust defects process to address snagging and
other repairs.— Improved information provided as part of
handover process (e.g. heating).
Target for 2018/19: 92%
NVP/Unit – Affordable Programme
RESULT TARGET PREVIOUS YEAR
-£1,123 -£4,410 -£4,410
Financially, our affordable programme has performed very well, nearly breaking even in unit NPV terms and exceeding the target we have set for the current affordable housing programme. This represents a significant improvement on the financial performance of our last programme.
This is a result of our ability to secure grant on better terms than originally expected, and the ongoing availability to purchase completed properties on favourable terms through s106 agreements. We continue to be able to contain costs by procuring the construction of new homes at competitive prices through the Riverside Framework, a partnership between eight associations.
Performance Improvement: none required
Target for 2018/19: -£4,410
Customers First
Net Promoter Score
RESULT TARGET PREVIOUS YEAR
21.4 17.0 15.9
Riverside’s Net Promoter Score (NPS), a measure of overall satisfaction with our service improved significantly during 2017/18, with a 44% increase achieved from the previous year, exceeding the annual target. Positive progress was made particularly among general needs and care & support customers for which NPS scores of 30.2 and 26.1 were recorded respectively. The primary drivers of performance against this measure, as cited by ‘promoters’, were heavily linked to our repairs service, affordability of housing services and our commitment to listen to and act upon customer views.

35
This strong overall performance was offset by lower NPS scores reported by our shared ownership and leasehold customers, with leaseholders in particular the most prevalent ‘detractor’ group. We were less likely to be recommended due to issues around customer service, communication and repairs, demonstrating the importance of providing consistent services across all business areas.
Given the scale of transformation currently underway across the organisation, including the implementation of a completely reformed frontline service, current NPS performance represents a solid foundation from which to build.
Performance Improvement: — High quality, consistent repairs service across the
Group following a rapid improvement exercise.— Review Home Ownership processes and service
delivery model as part of transformation programme.
Target for 2018/19: 20
Percentage of key service transactions completed online
RESULT TARGET PREVIOUS YEAR
45.6% 50% 38.1%
Riverside is committed to expanding our digital offer to customers, enabling people to access a range of services online, making it quicker and easier to respond to their needs. We saw a 20% increase in the number of ‘key’ service transactions undertaken online during 2017/18 and made significant progress towards achieving our target of 50%. A major project is underway to embed an online repairs booking service that has recently gone live to 3,500 customers.
Performance Improvement: — Roll out on-line repairs service across customer
base.— Use on-line platform to extend to other services.— Complete Wi-Fi installation at Care and Support
Schemes.
Target for 2018/19: 50%
Neighbourhoods Matter
Customer satisfaction with area as place to live
RESULT TARGET PREVIOUS YEAR
86% 87% 86%
Performance remained largely static throughout 2017/18 compared to the previous year, with no movement in the overall level of satisfaction, finishing just below target at 86%. This does however, represent positive progress over five years, in which time performance has improved from the sector’s bottom quartile.
Riverside works in some of the country’s most deprived areas and although this measure is affected by a range of factors, many outside of our direct influence, we continue to work with partners to improve our neighbourhoods. A co-ordinated approach to the production of detailed evidence based ‘Neighbourhood Plans’ has been implemented and will continue to inform practical and targeted interventions to bring about positive change in areas of need.
Several large scale regeneration programmes will begin to gather pace over the final two years of the Corporate Plan, underlining our commitment to ‘closing the gap’ between our best and worst performing places.
Performance Improvement: — Production of Neighbourhood Plans for areas in
need of improvement.— Targeted investment in priority neighbourhoods.
Target for 2018/19: 87%

36
Looking forward: Our transformation programmeThe principal driver of improved value for money at Riverside will continue to be our comprehensive transformation programme.
The focus of this is the implementation of a new operating model based on a fundamental re-design of the Group, to support us in achieving our vision and long term goals.
Since early 2016, significant improvement has already been delivered, including the implementation of a new frontline service (supported by national shared services) generating a total recurring salary cost saving of £6.2m per annum. Further phases of the programme (spanning the next two financial years) are expected to deliver a further £18m in recurring savings.
These savings will be achieved through a combination of further salary cost reductions and premises costs, as we reduce our overall footprint, refurbish strategic sites and close a number of smaller offices. Over the longer term, recurring savings will offset costs associated with programme delivery, redundancy payments, premises refurbishment and continued strategic IT investment. Delivery costs totalled £15m for the first phase with a further £44m built in to the business plan for the remaining phases over the next two financial years.
This approach will see us become a leaner, more efficient organisation that has the capacity to deliver the key priorities of building more homes and providing better value services in sustainable neighbourhoods. This will help deliver recurring savings of £24m per annum from 2020/21, driving improvements across all the key value for money metrics. We will continue to evidence progress in our Financial Statements.
Our futureRiverside is embarking on an ambitious plan for growth over the next five years and our strong balance sheet and improving margin offer a good basis for this investment. We continue to be mindful of the increased risk that this growth plan will present and will keep this under careful review.
In order to deliver our vision of “transforming lives and revitalising neighbourhoods” we will be doubling our output of new homes and at the same time our transformation process will ensure that we continue to reduce our costs in proportion to our income.
We plan to raise new finance during the coming year to pay for this and also to invest further in our commercial facing activities to provide the subsidy that will be needed as grant funding disappears.
On the basis that the Board has a reasonable expectation that, based on forecasts and current expectations of future sector conditions, the Group and Association have adequate resources to continue in operational existence for the foreseeable future. As a result Riverside continues to adopt a going concern basis in preparing these financial statements.
Statement of complianceThe form and content of the strategic report review has been prepared in line with the Statement of Recommended Practice for registered Social Housing Providers 2014. The statement has also been prepared in accordance with The Accounting Direction for Private Registered Providers of Social Housing from April 2015.
Cris McGuinness Chief Financial Officer

37

38

39
07. Report of the Board

40
Principal activityThe principal activity of the Riverside Group is the provision of affordable homes for rent and shared ownership, together with housing support and associated services for vulnerable and elderly residents.
TRGL comprises several companies with a common, shared purpose. TRGL is the ultimate parent within this Group. Details of members of the Riverside Group are given on page 93 of these financial statements.
TRGL, through its Board of members is responsible for establishing the Group’s overall policies and strategies, for monitoring compliance with Group values and overseeing performance against Group targets, within a clearly defined framework of delegation and system of control.
The Group’s objectives are carried out for the public benefit as set out in the financial statements. The Board considers legal advice and regulatory guidance when determining the activities that the Group undertakes to deliver these objectives.
Events after the end of the reporting periodOn 17 August 2018 the £100m retained element of the Riverside Group £250m 30 year bond was sold and on 20 August 2018 Impact Housing Association joined the Riverside Group.
The Board of The Riverside Group LimitedThe Board members of TRGL holding office during the period 1 April 2017 to 21 August 2018 are detailed below:
— Tim Croston (appointed 7 September 2017)
— Jonathan Dale— Pauline Davis — Ingrid Fife (appointed 29 October 2017)
— Philip Han (resigned 7 September 2017)
— Susan Jee— Carol Matthews— Max Steinberg CBE
— Sally Trueman— Peter White (appointed 18 January 2018)
The Board is comprised of non-executives, a tenant member, and the Group Chief Executive, who is a co-optee. A tenant is also invited to to attend Board meetings as an observer. This role was filled by Janice Murray until December 2017 when she was succeeded by Victor Andrews, who will undertake this role for a twelve month term. Also in attendance at Board meetings are the Executive Directors and the Company Secretary.
Membership of the Board comprises 55% women, (2017: 50%), which compares to a 51% female population in the areas where Riverside works. (Board membership of both those declaring themselves to be disabled or BME is in line with the percentage of the relevant population).
The Board is pleased to present its report and the audited consolidated financial statements for the year ended 31 March 2018.
Report of the Board

The Group Audit Committee addresses internal and external audit issues and advises the Board on risk management policies and processes.
41
During the year payments made to Board members totalled £530k (2016: £513k), which represented 0.15% (2016: 0.14%) of annual turnover. Payment of the Group Chair and Group Board members is calculated by taking into account the size of the Group and industry norms.
The Board carries out an annual appraisal of its performance and a biennial appraisal of individual Board members. Every three years an external provider is engaged to assess Board performance and the effectiveness of the Board Chair.
Each board member (excluding the co-optee) is appointed for a fixed term of office, of up to three years. Reappointment is possible for up to a maximum of two additional terms.
Review of business and future developmentsThe review of business and future developments is discussed in the Group Chair’s introduction, the Group Chief Executive’s statement and the strategic report on pages 15 to 36.
Executive DirectorsWhilst the Board is responsible for the Group’s overall policy and strategy, management is delegated to the Group Chief Executive. The Executive Directors are the senior management team and act as executives within the authority delegated by the Board. They meet formally under the leadership of the Group Chief Executive in order to consider all major management issues. This meeting is a key decision making forum for
the management of the Group, reviewing all proposed policy changes and performance.
The Executive Directors hold no beneficial interest in the share capital of any member of the Group. However, a £1 share in two subsidiary companies is held in trust for TRGL by an Executive Director.
Corporate governanceThe Board is committed to integrity and accountability in the stewardship of the Group’s affairs. The Group complies with the NHF Code of Governance, except that, to promote a culture of openness, the Group Audit Committee meets with staff present.
The Group has carried out its annual assessment of governance, including roles, responsibilities and accountabilities of the Board, Chair and Chief Executive and is satisfied that its arrangements are clear and effective.
The external auditors have undertaken non-audit work for the Group during the year ended 31 March 2018. Details of this work is set out in note 9 to the financial statements. The Group Audit Committee has a protocol with the external auditors, which sets out policies for determining what non-audit work can be undertaken by the external auditors and procedures for the annual review of external auditor performance.

42
Key
Board and Committees
Leadership Group
Wider workforce
Wider population
Sexual Identity
Disability
Gender
Ethnicity
%
%%
%
0
00
0
10
1010
10
20
2020
20
30
30
30
30
40
40
40
40
50
50
50
50
80
60
60
60
60
90
70
70
80
80
90
90
100
10070
70
100
Board & Committees
NO
YES
Leadership Group
Male Heterosexual
NO
Wider workforce
Female Gay / Lesbian/ Bisexual
NO
YES
Wider population
NO
YES
White British Other Ethnic GroupBlack / African / Caribbean/ Black British
Asian / Asian British Combined
Mixed / Multiple Ethnic Groups

43
Equality and Diversity: Board, committee and workforce compositionRiverside has adopted an equality, diversity and inclusion (EDI) policy which aims to:
— Prevent discrimination, eliminate prejudice, promote inclusion and celebrate diversity within the organisation.
— Be fair in its dealings with all people – board members, staff, customers, volunteers and partners – with whom Riverside has relationships taking into account the diverse nature of their culture and backgrounds.
— Ensure that EDI is embedded in everything it does.
To achieve these policy aims, it is important that Riverside understands the composition of its Board and Committees, Leadership Team and wider workforce by the key protected characteristics, and compares this with the profile of the population living in the communities it serves. Over time, the Board wants to continue to use progressive policies and practices, to develop a more diverse workforce, led by a diverse Leadership Team and governance community.
Each year, the Board agrees an Equality and Diversity Action Plan to provide a framework to drive improvement, and as part of the plan for 2018/19 it has committed to working towards the ten challenges set out in the Chartered Institute of Housing’s ‘Leading Diversity by 2020’ campaign.
One of these challenges is to publish data demonstrating the composition of Boards and Committees, the Leadership Team and the wider workforce, comparing this with the characteristics of the population living in the places where Riverside operates. The charts show this comparison by ethnicity, disability, gender and sexual orientation.
This data demonstrates that whilst the wider staff base is diverse, the composition of the Leadership Team and Board and Committees is less so, particularly in relation to ethnicity and disability.
Signing up to the CIH campaign will help frame an improvement plan for tackling areas of weakness. The Board has recently approved its own Board Diversity Protocol, which will introduce practical measures to encourage a wider pool of applicants for Board and Committee positions and ensure that appropriate support and training is available for members, including participation in mentoring programmes.
Corporate role of the BoardThe Board comprises eight non-executive Board members plus the Group Chief Executive who is a co-optee.
The Board determines what matters should be delegated to the Executive Team or a Committee of the Board and what matters it will reserve for its own consideration and decision. Board members act in the interest of the Riverside Group and not on behalf of any other interest group.
The principal obligations of the Board to the Group are to:
— be committed to the values and objectives of the Group
— develop strategy and implement the Group’s core policies
— uphold the NHF code of governance — represent the Group and enhance its
profile externally.
The Board is drawn from a wide background and its members are selected to ensure that they bring relevant experience, skills and understanding to the discussions and decision making process of the Board. The Group aims to have Boards and Committees which are representative of the wider population in the areas where it works and it is committed to fairness and equality of opportunity.
Each subsidiary has a Board of Directors chosen for their specific area of expertise including appropriately experienced non-executives. The Board has a schedule of six meetings each year for regular business and meets annually to discuss strategy. It also convenes if decisions are required for urgent matters between meetings. TRGL rules allow attendance by telephone and video conference which facilitates effective governance. The Chair also has authority to take decisions on behalf of the Board where a meeting cannot be organised and a timely decision is required.
The Board has established several committees to oversee specific areas of the Group’s work. The Board sets the responsibilities and scope of authority of each Committee. Board delegation may allow decision making for certain matters, or require that the Committee consider issues and provide advice and assurance to support Board decision-making.

44
The Committees of the Board are the Governance and Remuneration Committee, the Group Audit Committee, the Group Treasury Committee, the Neighbourhood Services Committee, the Care and Support Committee, London Development Committee, Joint Advisory Committee and the Scotland Committee, all of which, are primarily composed of non-executive members. There are over 30 tenants actively involved in the formal governance structure through their roles as Board, Committee and Riverside Customer Voice members. Further information on the Committees is given below and the membership is shown in table 1 with attendance at Board and Committee meetings being shown in table 2.
Group Governance and Remuneration CommitteeThe Committee monitors Group Governance to ensure that it remains effective and efficient. This includes overseeing succession planning and recruitment activity for key individuals in the Group and advising TRGL Board on their appointment including TRGL Board members, the Chief Executive Officer and Chairs of Committees. It agrees the appointment of all other non-executives and the appointment of Executive Directors. It ensures that Board and Committees are regularly appraised to ensure that they remain effective. Independent consultants are engaged to review the Group Chief Executive’s renumeration annually and their contract every three years. The salary level of other Executive Directors is reviewed, again by an independent party, triennally. The Executive Directors are not present at any meeting when their remuneration packages are discussed. The Committee also agrees the brief within which the Group Chief Executive can negotiate staff salaries with the union, Unite. The Committee is comprised entirely of non-executives and takes specialist human resources advice from external consultants as appropriate. It meets at least four times per year.
Group Audit Committee The Committee addresses internal and external audit issues and advises the Board on risk management policies and processes. It also considers the financial statements and the appointment of the external auditor and recommends their approval by the Board. The Committee is comprised entirely of non-executives, with a representative from each of the Neighbourhood Services and Care & Support Committees. At least one member must have recent and relevant financial experience and an appropriate professional qualification. It meets at least four times per year.
Group Treasury CommitteeThe Committee considers technical and complex treasury matters and provides advice and makes recommendations to TRGL Board. It is composed entirely of non-executives who are appointed on the basis of their skills and knowledge of treasury issues. It meets when required but at least once per year.
Neighbourhood Services Committee The Committee was established in December 2016 and is responsible for monitoring services provided by the social housing business and Riverside Home Ownership. It has responsibility for considering the customers’ experience of services and ensuring that services are well managed, deliver value for money, and appropriately manage risk. The Committee is composed of non-executives, including a TRGL Board member, tenant representatives and the Executive Director, Asset Services. It meets at least six times per year.
Care and Support CommitteeThe Committee is responsible for monitoring services provided by the Care and Support business. As with the Neighbourhood Services Committee, it focuses on the customer experience in the context of value for money and risk management. The Committee is composed of non-executives, tenant representatives and the Executive Director, Care and Support. It meets at least four times per year.
Scotland Committee The Committee oversees and monitors the implementation of the Group business strategy for Scotland. It comprises three nominees from the Board of Irvine Housing Association Limited and three nominees from TRGL. The Committee meets as required.
Joint Advisory CommitteeThe Committee was formed in early 2018 to advise the Boards of TRGL and Impact Housing Association (IHA) on matters relating to the partnership between the two organisations. It is not intended as a permanent feature of the Group’s governance structure and will be disestablished once its specific purpose has been served. On this basis details of meetings have not been included here.
London Development CommitteeThe London Development Committee was formed in October 2017 to oversee the shaping, design, costing and delivery of estate renewal in London on Group Board’s behalf, giving advice and making appropriate recommendations in line with financial parameters and corporate ambitions.

45
Table 1: Board and Committee Members of TRGL as at 25 July 2018
Riverside Group Audit Committee
Tim Croston (Chair) Adrian CrookesMaria HallowsSara NaylorNeill Skinner
Riverside Group Treasury Committee
Susan Jee (Chair) Devan BalaNigel Perryman
Peter White (Chair) Rowan CarstairsJackie GrannellDavid GreenIan GreggMary McAndrewDuncan McEachranMaria MilfordSara NaylorSue PowellPatrick RiceDarren Warneford
Scotland Committee
Duncan McEachran (Chair)Margaret Burgess Gerard Darroch Pauline DavisDavid GreenSue Powell
Pauline Davis (Chair) Susan JeeMax Steinberg
Riverside Group Governance and Remuneration Committee
Care and Support Committee
Ingrid Fife (Chair)Ian BennettJudith CrowtherAndy DeutschJohn GlentonHetal ParmarNeill SkinnerArchdeacon Cherry VannPeter White
Board of The Riverside Group Ltd
Max Steinberg (Chair) Pauline Davis (Vice-Chair) Ingrid FifeSusan Jee (Treasurer)Tim CrostonJonathan C DaleSally E TruemanPeter White
Co-opteesCarol Matthews
London Development Committee
Pauline Davis (Chair) Victor AndrewsJenny CoombsCris McGuinnessDale MeredithPaul Newbold
Joint Advisory Committee
Mark CostelloGeraldine KayJocelyn Manners-ArmstrongCarol MatthewsSue PowellLee SugdenPeter White
Neighbourhood Services Committee

46
Table 2: Member attendance at Board and/or Committee meetings.
Board/committee members
Group Board
Governance & Remuneration
Neighbourhood Services
Group Treasury
Group Audit
Scotland Care and Support
London Development
Meetings attended/Eligible to attend
Max Steinberg 7/7 6/6 – – – – – –
Pauline Davis 7/7 6/6 – – – 1/1 3/3 4/4
Susan Jee 6/7 6/6 – 6/6 4/4 0/1 – –
Jonathan Dale 7/7 – – – – – – –
Philip Han 2/2 – – 5/6 1/1 – – –
Sally Trueman 6/7 – – – – – – –
Carol Matthews 7/7 – – – – – – –
Peter White 5/7 – 5/6 – – – 3/4 –
Tim Croston 5/5 – – – – – – –
Ingrid Fife 4/4 – – – – – 2/2 –
Sue Powell – – 4/6 – – – – –
Darren Warneford – – 6/6 – – – – –
John Wood – – 6/6 – – – – 4/4
Adrian Crookes – – – – 3/4 – – –
Tim Croston – – – – 4/4 – – –
Neill Skinner – – – – 4/4 – 3/4 –
Robert Towers – – – 3/5 – – – –
Duncan McEachran – – 4/6 – – 1/1 – –
Margaret Burgess – – – – – 1/1 – –
Gerrard Darroch – – – – – 1/1 – –
David Green – – 6/6 – – 1/1 – –
Rowan Carstairs – – 5/6 – – – – –
Jackie Grannell – – 6/6 – – – – –
Mary McAndrew – – 5/6 – – – – –
Maria Milford – – 6/6 – – – – –
Sara Naylor – – 6/6 – 1/1 – – –
Patrick Rice – – 5/6 – – – – –
Anne Parker – – – – – – 2/2 –
Richard Austin – – – – – – 2/3 –
Ian Bennett – – – – – – 2/4 –
Andy Deutsch – – – – – – 3/4 –
John Glenton – – – – – – 4/4 –
Archdeacon Cherry Vann – – – – – – 3/4 –
Jenny Coombs – – – – – – – 4/4
Dale Meredith – – – – – – – 4/4
Paul Newbold – – – – – – – 3/4
Victor Andrews – – – – – – – 1/1
Devan Bala – – – 3/3 – – – –
Nigel Perryman – – – 3/3 – – – –
Judith Crowther – – – – – – 1/2 –
Hetal Parmar – – – – – – 2/2 –
The above table captures all those who have served as Board or Committee Members in the financial year 2017/18 including those who stepped down or were appointed in the financial year 2017/18.

47
Internal controls assuranceThe Board is the ultimate governing body and is responsible for the Group’s system of internal control.
The Board, advised by the Group Audit Committee, has reviewed the effectiveness of the system of internal control for the year ended 31 March 2018 and to the date of approval of these financial statements. For the year ended 31 March 2018, the Board makes the following statements:
— The system of internal control is designed to provide the Board with reasonable but not absolute assurance that risks are identified on a timely basis and dealt with appropriately; that assets are safeguarded; that proper accounting records are maintained; and that the financial information used within the business or for publication is reliable. Control is exercised through an organisational structure with clearly defined levels of authority, responsibility and accountability.
— The Group maintains a culture of risk awareness, based on a sound control environment with high regard for integrity and ethical values. Regular reviews of the risk universe and risk mitigation actions are carried out. Any business development involving significant risk is subject to Board approval.
— The framework of internal control is subject to a regular programme of review. In particular, the Group maintains a fully resourced Internal Audit team led by an appropriately qualified Director reporting directly to the Group Audit Committee. Service delivery risk is monitored through the service improvement framework, quality self-assessment and tenant scrutiny processes. All this ensures that the control environment framework remains robust during a period of continued external change.
— The Group is committed to sound financial management in all aspects of its business. It has a robust business planning process and all parts of the Group have detailed annual budgets and longer term business plans. The Group has a comprehensive system of management reporting. This includes a monthly reporting package of financial results and key performance indicators. Overall scrutiny is provided by the Board.
— The Group maintains a suite of policies covering the main elements of its business. The policies are subject to a rolling programme of review to confirm their continued appropriateness with all Group policies approved by the Board.
— The anti-fraud policy sets out the commitment to preventing fraud. Confidential reporting arrangements are in place to allow staff to voice their concerns and know that they will be properly investigated. The anti-bribery and corruption policy sets out guidelines for all staff to ensure the highest standards of conduct in business dealings and this has been adopted throughout the Group, in addition to the NHF’s publication “Code of conduct with good practice for members” (2012).
— The Group has made good progress in implementing the various new regulatory requirements including annual certification of compliance with laws and regulatory standards together with the compilation of our assets and liabilities into a single register. These all strengthen the control environment.
— The Group is mid way through its new Target Operating Model. The design principles include a number of elements which will improve the control environment including consistency, standardisation and clarity about performance management.
— In reviewing the effectiveness of the Group’s system of internal control, the Board has considered a range of sources of assurance including:— management reports;— key performance indicators;— audit reports;— quality management systems and;— external regulator reports.
— During the year there were no weaknesses in internal controls which resulted in material losses, contingencies or uncertainties that require disclosure in these financial statements.

48
Statement of Board’s responsibilities in respect of the Board’s report and the financial statementsThe Board is responsible for preparing the Board’s Report and the financial statements in accordance with applicable law and regulations.
Co-operative and Community Benefit Society law requires the Board to prepare financial statements for each financial year. Under those regulations the Board have elected to prepare the financial statements in accordance with UK Accounting Standards, including FRS 102 The Financial Reporting Standard applicable in the UK and Republic of Ireland.
The financial statements are required by law to give a true and fair view of the state of affairs of the group and the association and of the income and expenditure of the group and the association for that period.
In preparing these financial statements, the Board is required to:
— select suitable accounting policies and then apply them consistently;
— make judgements and estimates that are reasonable and prudent;
— state whether applicable UK Accounting Standards and the Statement of Recommended Practice have been followed, subject to any material departures disclosed and explained in the financial statements; and
— assess the group and the association’s ability to continue as a going concern, disclosing, as applicable, matters related to going concern; and
— use the going concern basis of accounting unless it either intends to liquidate the group or the association or to cease operations, or has no realistic alternative but to do so.
The Board is responsible for keeping proper books of account that disclose with reasonable accuracy at any time the financial position of the association and enable them to ensure that its financial statements comply with the Co-operative and Community Benefit Societies Act 2014, the Housing and Regeneration Act 2008 and the Accounting Direction for Private Registered Providers of Social Housing 2015. It is responsible for such internal control as it determines is necessary to
enable the preparation of financial statements that are free from material misstatement, whether due to fraud or error, and has general responsibility for taking such steps as are reasonably open to it to safeguard the assets of the association and to prevent and detect fraud and other irregularities.
The Board is responsible for the maintenance and integrity of the corporate and financial information included on the association’s website. Legislation in the UK governing the preparation and dissemination of financial statements may differ from legislation in other jurisdictions.
Equality and diversity
The Group’s policies reflect its strong commitment to equality and the value it places on diversity in all aspects of its work.
Political donationsNo donations for political purposes were made during the year.
Policy on payment of creditorsIn the absence of any dispute, the Group’s policy is to pay non-development invoices within 30 days of the date of the invoice. Development creditors, paid under certificate, are settled within 21 days of the valuation date.
Changes in fixed assetsThe movements in fixed assets during the year are set out in note 11 to the financial statements.
Investment powerThe Group’s Rules permit investment of monies not immediately required to carry out its objectives as it determines and is permitted by law.
Annual General MeetingThe Annual General Meeting will be held on 13 September 2018.
AuditorsA resolution to re-appoint the auditors KPMG LLP will be put to the Annual General Meeting.
The Group’s policies reflect its commitment to equality and the value it places on diversity in all aspects of its work.
49
Statement of compliance The Board confirms that the strategic report and board report have been prepared in accordance with principles set out in paragraph 4.7 of the 2014 SORP for Registered Social Housing Providers.
The Board certifies that as a registered provider, TRGL complies with the Homes and Communities Agency’s Governance and Financial Viability Standard 2015.
Tom Ferguson Secretary

50

51
08. Independent auditor’s report

52
Opinion We have audited the financial statements of The Riverside Group Limited (“the association”) for the year ended 31 March 2018 which comprise the Group and Association statement of comprehensive income, Group and Association statement of financial position, Group and Association statement of changes in reserves and Group statement of cash flows, and related notes, including the accounting policies in note 1.
In our opinion the financial statements: — give a true and fair view, in accordance with UK
accounting standards, including FRS 102 The Financial Reporting Standard applicable in the UK and Republic of Ireland, of the state of affairs of the group and the association as at 31 March 2018 and of the income and expenditure of the group and the association for the year then ended;
— comply with the requirements of the Co-operative and Community Benefit Societies Act 2014; and
— have been properly prepared in accordance with the Housing and Regeneration Act 2008 and the Accounting Direction for Private Registered Providers of Social Housing 2015.
Basis for opinionWe conducted our audit in accordance with International Standards on Auditing (UK) (“ISAs (UK)”) and applicable law. Our responsibilities are described below. We have fulfilled our ethical responsibilities under, and are independent of the group and the association in accordance with, UK ethical requirements including the FRC Ethical Standard. We believe that the audit evidence we have obtained is a sufficient and appropriate basis for our opinion.
Going concernWe are required to report to you if we have concluded that the use of the going concern basis of accounting is inappropriate or there is an undisclosed material uncertainty that may cast significant doubt over the use of that basis for a period of at least twelve months from the date of approval of the financial statements. We have nothing to report in these respects.
Other informationThe association’s Board is responsible for the other information, which comprises the Strategic Report, the Report of the Board and the Statement on Internal Controls Assurance. Our opinion on the financial statements does not cover the other information and, accordingly, we do not express an audit opinion or any form of assurance conclusion thereon.
Our responsibility is to read the other information and, in doing so, consider whether, based on our financial statements audit work, the information therein is materially misstated or inconsistent with the financial statements or our audit knowledge. Based solely on that work, we have not identified material misstatements in the other information.
Matters on which we are required to report by exceptionUnder the Co-operative and Community Benefit Societies Act 2014 we are required to report to you if, in our opinion:
— the association has not kept proper books of account; or
— the association has not maintained a satisfactory system of control over transactions; or
— the financial statements are not in agreement with the association’s books of account; or
— we have not received all the information and explanations we need for our audit.
We have nothing to report in these respects.
Independent auditor’s reportto The Riverside Group Limited

The Group operates a Homebuy scheme by lending a percentage of the cost to home purchasers, secured on the property.
53
Board’s responsibilitiesAs more fully explained in their statement set out on page 48, the association’s Board is responsible for the preparation of financial statements which give a true and fair view; such internal control as it determines is necessary to enable the preparation of financial statements that are free from material misstatement, whether due to fraud or error; assessing the group and the association’s ability to continue as a going concern, disclosing, as applicable, matters related to going concern; and using the going concern basis of accounting unless it either intends to liquidate the group or the association or to cease operations, or has no realistic alternative but to do so.
Auditor’s responsibilitiesOur objectives are to obtain reasonable assurance about whether the financial statements as a whole are free from material misstatement, whether due to fraud or error, and to issue our opinion in an auditor’s report. Reasonable assurance is a high level of assurance, but does not guarantee that an audit conducted in accordance with ISAs (UK) will always detect a material misstatement when it exists. Misstatements can arise from fraud or error and are considered material if, individually or in aggregate, they could reasonably be expected to influence the economic decisions of users taken on the basis of the financial statements.
A fuller description of our responsibilities is provided on the FRC’s website at www.frc.org.uk/auditorsresponsibilities
The purpose of our audit work and to whom we owe our responsibilitiesThis report is made solely to the association in accordance with section 87 of the Co-operative and Community Benefit Societies Act 2014 and section 128 of the Housing and Regeneration Act 2008. Our audit work has been undertaken so that we might state to the association those matters we are required to state to it in an auditor’s report and for no other purpose. To the fullest extent permitted by law, we do not accept or assume responsibility to anyone other than the association as a body, for our audit work, for this report, or for the opinions we have formed.
Mick Davies for and on behalf of KPMG LLP, Statutory Auditor Chartered Accountants 1 St Peter’s SquareManchesterM2 3AE

54

55
09. Group and Association statements
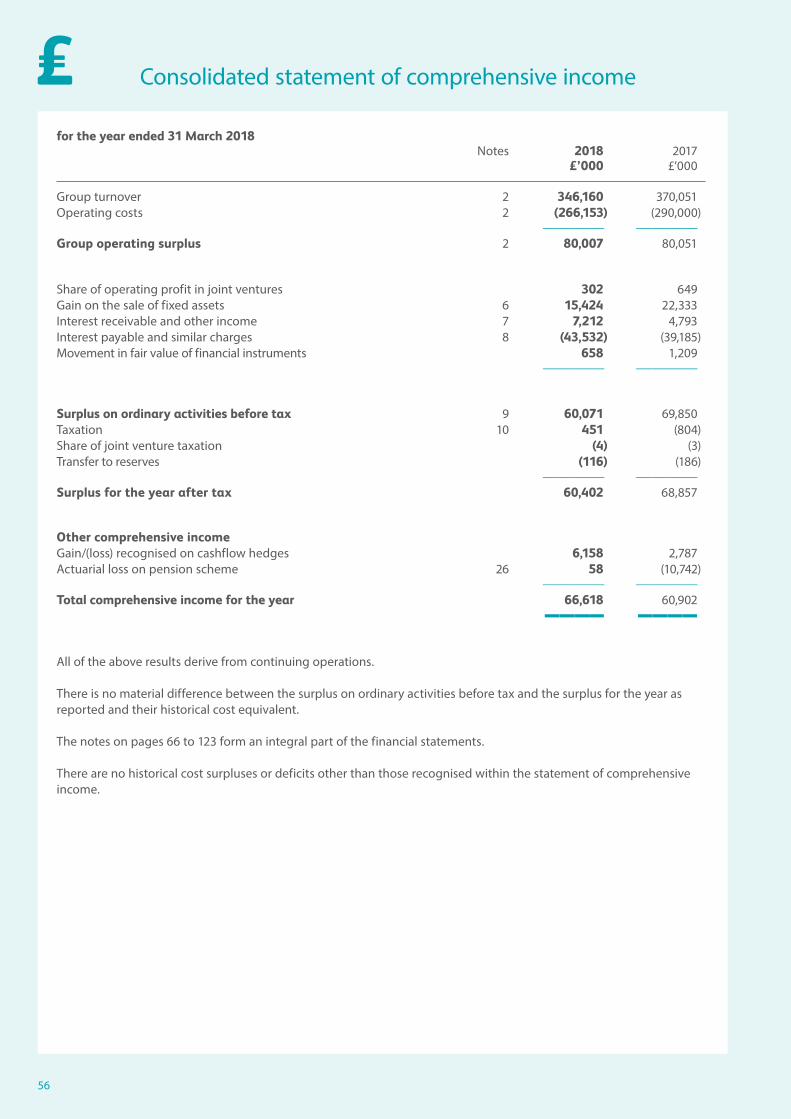
56
Consolidated statement of comprehensive income
for the year ended 31 March 2018 Notes 2018 2017 £’000 £’000 Group turnover 2 346,160 370,051Operating costs 2 (266,153) (290,000) ———— ————Group operating surplus 2 80,007 80,051
Share of operating profit in joint ventures 302 649Gain on the sale of fixed assets 6 15,424 22,333Interest receivable and other income 7 7,212 4,793Interest payable and similar charges 8 (43,532) (39,185)Movement in fair value of financial instruments 658 1,209 ———— ————
Surplus on ordinary activities before tax 9 60,071 69,850Taxation 10 451 (804)Share of joint venture taxation (4) (3)Transfer to reserves (116) (186) ———— ————Surplus for the year after tax 60,402 68,857
Other comprehensive incomeGain/(loss) recognised on cashflow hedges 6,158 2,787Actuarial loss on pension scheme 26 58 (10,742) ———— ————Total comprehensive income for the year 66,618 60,902 ———— ————All of the above results derive from continuing operations.
There is no material difference between the surplus on ordinary activities before tax and the surplus for the year as reported and their historical cost equivalent.
The notes on pages 66 to 123 form an integral part of the financial statements.
There are no historical cost surpluses or deficits other than those recognised within the statement of comprehensive income.

57
Consolidated statement of financial position
as at 31 March 2018 Notes 2018 2017 £’000 £’000
Fixed assetsTangible assets:Housing properties 11 1,810,866 1,776,397Other tangible fixed assets 11 25,109 17,388 ———— ———— 1,835,975 1,793,785InvestmentsInvestment in joint ventures 12 1,503 1,255Investment properties 12 1,236 15,013Other investments 12 16,374 16,319Homebuy equity loans 12 4,854 5,666 ———— ———— 1,859,942 1,832,038 ———— ————Debtors: amounts receivable after more than one year 13 11,106 11,648Current assetsInvestments 12 37,516 50,800Trade and other debtors 13 136,483 136,079Properties for sale 14 62,032 57,313Cash and cash equivalents 63,687 68,927 ———— ———— 299,718 313,119Creditors: amounts falling due within one year 15 (145,926) (182,886) ———— ————Net current assets 153,792 130,233 ———— ————Total assets less current liabilities 2,024,840 1,973,919 ———— ———— Creditors: amounts falling due after more than one year 16 1,470,797 1,483,333Deferred income 19 8,146 6,788Provisions for liabilitiesPension provision 28 15,376 16,408Other provisions 28 12,400 16,459 ———— ———— 1,506,719 1,522,988
Capital and reservesNon-equity share capital 20 — —Cashflow hedge reserve (13,927) (20,542)Designated reserves 3,138 3,022Income and expenditure reserve 528,910 468,451 ———— ———— 2,024,840 1,973,919 ———— ———— The financial statements on pages 55 to 123 were approved by the Board on 12 July 2018 and were signed on its behalf on 21 August 2018 by:
Max Steinberg CBE, Group Chair Susan Jee, Group Treasurer Tom Ferguson, Secretary
The notes on pages 66 to 123 form an integral part of the financial statements.
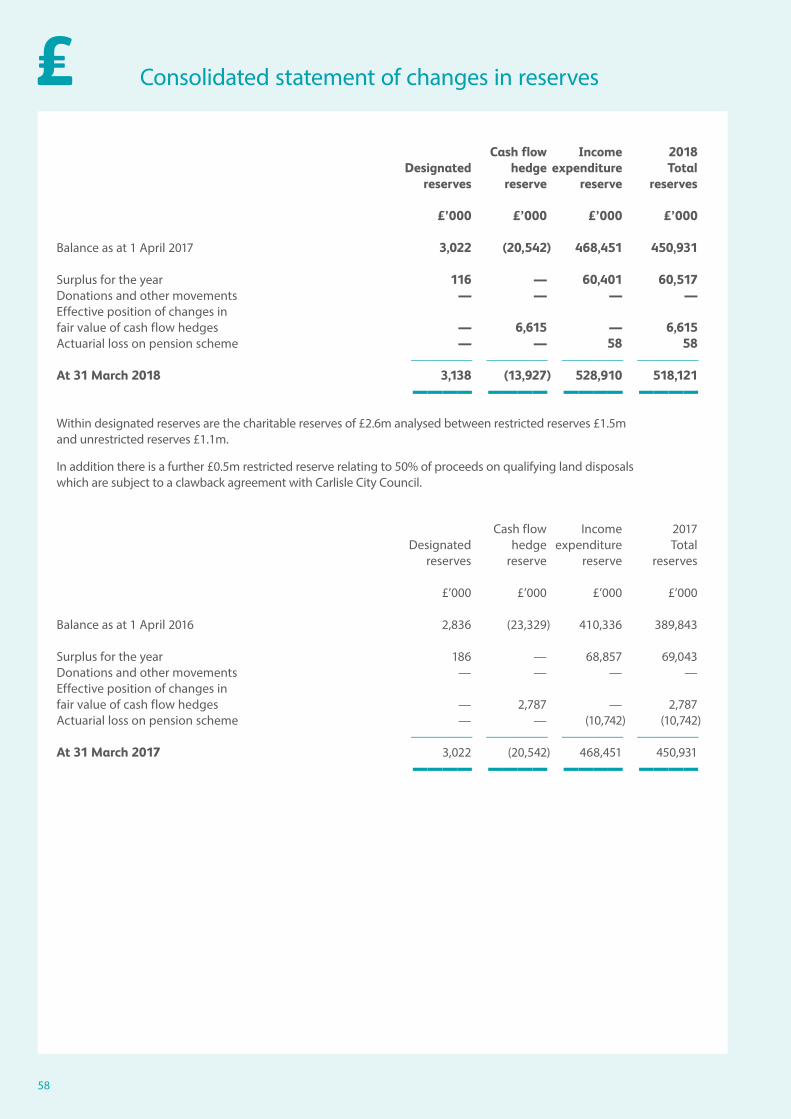
58
Consolidated statement of changes in reserves
Cash flow Income 2018 Designated hedge expenditure Total reserves reserve reserve reserves
£’000 £’000 £’000 £’000
Balance as at 1 April 2017 3,022 (20,542) 468,451 450,931
Surplus for the year 116 — 60,401 60,517Donations and other movements — — — —Effective position of changes in fair value of cash flow hedges — 6,615 — 6,615Actuarial loss on pension scheme — — 58 58 ———— ———— ———— ———— At 31 March 2018 3,138 (13,927) 528,910 518,121 ———— ———— ———— ———— Within designated reserves are the charitable reserves of £2.6m analysed between restricted reserves £1.5m and unrestricted reserves £1.1m.
In addition there is a further £0.5m restricted reserve relating to 50% of proceeds on qualifying land disposals which are subject to a clawback agreement with Carlisle City Council.
Cash flow Income 2017 Designated hedge expenditure Total reserves reserve reserve reserves
£’000 £’000 £’000 £’000
Balance as at 1 April 2016 2,836 (23,329) 410,336 389,843
Surplus for the year 186 — 68,857 69,043Donations and other movements — — — —Effective position of changes in fair value of cash flow hedges — 2,787 — 2,787Actuarial loss on pension scheme — — (10,742) (10,742) ———— ———— ———— ———— At 31 March 2017 3,022 (20,542) 468,451 450,931 ———— ———— ———— ————

59
Consolidated statement of cash flows
for the year ended 31 March 2018 2018 2017
£’000 £’000 £’000 £’000
Net cash inflow from operating activities (note 21) 124,777 123,038
Returns on investments and servicing of financeInterest received 1,846 2,307Interest paid (42,442) (37,695) ———— ————
Net cash outflow from returns on investments and servicing of finance (40,596) (35,388)
Taxation Tax paid (4) (3)
Capital expenditure and financial investmentCash paid for housing construction (126,122) (87,962)Cash paid for other fixed assets (9,556) (6,420)Cash flow for fixed asset investments 26,106 2,787Expenditure on capitalised improvements (30,953) (27,352)Social Housing Grant received 18,572 5,022Receipts from property sales 37,429 49,632Investment in joint ventures (2,695) 4,115 ———— ————
Net cash outflow from capital expenditure and financial investment (87,219) (60,178)
Management of liquid resourcesIncrease in short term deposits 13,284 5,522 ———— ————
Net cash inflow from management of liquid resources 13,284 5,522 ———— ————
Net cash outflow before financing 10,242 32,991
FinancingLoans raised 54,793 14,312Loan principal repayments (70,275) (12,779) ———— ————
Net cash inflow from financing (15,482) 1,533 ———— ————
(Decrease)/Increase in cash (note 22) (5,240) 34,524 ———— ————The notes on pages 66 to 123 form an integral part of the financial statements.

60
Association statement of comprehensive income
for the year ended 31 March 2018 Notes 2018 2017 £’000 £’000
Turnover 2 294,885 293,890Operating costs 2 (221,807) (224,736) ———— ————Operating surplus 2 73,078 69,154
Gain on the sale of fixed assets 6 15,245 22,324Interest receivable and other income 7 4,690 5,756Interest payable and similar charges 8 (39,415) (38,299)Movement in fair value of financial instruments 620 1,199Gift Aid 2,579 3,174 ———— ————
Surplus on ordinary activities before tax 9 56,797 63,308Taxation 10 — —Transfer to reserves (116) (186) ———— ————Surplus for the year after tax 56,681 63,122
Other comprehensive incomeGain/(loss) recognised on cash flow hedges 6,158 2,715Actuarial loss on pension scheme 26 58 (10,742) ———— ————Total comprehensive income for the year 62,897 55,095 ———— ————All of the above results derive from continuing operations.
There is no material difference between the surplus on ordinary activities before tax and the surplus for the year as reported and their historical cost equivalent.
The notes on pages 66 to 123 form an integral part of the financial statements.
There are no historical cost surpluses or deficits other than those recognised within the statement of comprehensive income.

61
Association statement of financial position
as at 31 March 2018 Notes 2018 2017 £’000 £’000
Fixed assetsTangible assetsHousing properties 11 1,729,313 1,694,760Other tangible fixed assets 11 24,801 16,932 ———— ———— 1,754,114 1,711,692 ———— ————InvestmentsInvestment properties 12 1,236 1,212Other investments 12 47,315 47,268Homebuy equity loans 12 329 329 ———— ———— 1,802,994 1,760,501 ———— ————
Debtors: amounts receivable after more than one year 13 49,887 51,619
Current assetsInvestments 12 33,342 45,243Trade and other debtors 13 55,950 60,343Properties for sale 14 20,245 19,823Cash and cash equivalents 56,161 63,514 ———— ———— 165,698 188,923
Creditors: amounts falling due within one year 15 (121,581) (150,738) ———— ————Net current assets 44,117 38,185 ———— ————Total assets less current liabilities 1,896,998 1,850,305 ———— ———— Creditors: amounts falling due after more than one year 16 1,351,076 1,364,107Deferred income 19 8,146 6,788Provisions for liabilities Pension provision 28 15,376 16,408Other provisions 28 12,400 16,459 ———— ———— 1,386,998 1,403,762Capital and reserves
Non-equity share capital 20 — —Cashflow hedge reserve (13,927) (20,529)Designated reserves 3,085 2,969Income and expenditure reserve 520,842 464,103 ———— ———— 1,896,998 1,850,305 ———— ———— The financial statements on pages 55 to 123 were approved by the Board on 12 July 2018 and were signed on its behalf on 21 August 2018 by:
Max Steinberg CBE, Group Chair Susan Jee, Group Treasurer Tom Ferguson, Secretary
The notes on pages 66 to 123 form an integral part of the financial statements.

62
Cash flow Income Designated hedge expenditure Total reserves reserve reserve reserves
£’000 £’000 £’000 £’000
Balance as at 1 April 2017 2,969 (20,529) 464,103 446,543
Surplus for the year 116 — 56,681 56,797Effective position of changes in fair value of cash flow hedges — 6,602 — 6,602Actuarial loss on pension scheme — — 58 58 ———— ———— ———— ————At 31 March 2018 3,085 (13,927) 520,842 510,000 ———— ———— ———— ———— Within designated reserves are the charitable reserves of £2.6m analysed between restricted reserves £1.5m and unrestricted reserves £1.1m.
In addition there is a further £0.5m restricted reserve relating to 50% of proceeds on qualifying land disposals which are subject to a clawback agreement with Carlisle City Council.
Cash flow Income Total Designated hedge expenditure reserves reserve reserve reserves
£’000 £’000 £’000 £’000
Balance as at 1 April 2016 2,783 (23,244) 411,723 391,262
Surplus for the year 186 — 63,122 63,308Effective position of changes in fair value of cash flow hedges — 2,715 — 2,715Actuarial loss on pension scheme — — (10,742) (10,742) ———— ———— ———— ————
At 31 March 2017 2,969 (20,529) 464,103 446,543 ———— ———— ———— ————
Association statement of changes in reserves

63

64

65
10. Notes to the financial statements
66
Principal accounting policies1The financial statements are Group statements which consolidate the financial statements of The Riverside Group Limited and its subsidiary undertakings.
Legal statusThe parent association, The Riverside Group Limited, is registered under the Co-operative and Community Benefit Societies Act 2014 and is registered with the Homes and Communities Agency as a Private Registered Provider of Social Housing.
Basis of accountingThe Group’s financial statements have been prepared in accordance with Financial Reporting Standard 102: the Financial Reporting Standard applicable in the UK and Republic of Ireland (FRS 102) and the Statement of Recommended Practice for registered housing providers: Housing SORP 2014. The Group is required under the Co-operative and Community Benefit Societies (Group Accounts) Regulations 1969 to prepare consolidated Group accounts.
The financial statements comply with the Co-operative and Community Benefit Societies Act 2014, the Co-operative and Community Benefit Societies (Group Accounts) Regulations 1969, the Housing and Regeneration Act 2008 and the Accounting Direction for Private Registered Providers of Social Housing 2015. The accounts are prepared on the historical cost basis of accounting as modified by the revaluation of housing properties, investments and derivative financial instruments and are presented in £ sterling.
Parent association disclosure exemptionsIn preparing the separate financial statements of the parent company, advantage has been taken of the following disclosure exemptions available in FRS 102:
— No cash flow statement has been presented for the parent association;
— Disclosures in respect of the parent company’s financial instruments have not been presented as equivalent disclosures and have been provided in respect of the Group as a whole; and
— No disclosure has been given for the aggregate remuneration of the key management personnel of the parent association as their remuneration is the same as the totals for the Group as a whole.

The Group has taken the modest resources secured in 1928, and built a national organisation capable of helping more than 50,000 households at any one time.
67
Basis of consolidationThe financial statements are Group statements and consolidate the financial statements of The Riverside Group Limited and its subsidiary undertakings.
The Riverside Group Limited’s interest in joint ventures is accounted for using the equity method.
Details of subsidiaries and joint ventures are shown in note 12 to the financial statements.
Going concernThe Group has in place long term borrowing facilities which provide resources to finance investment and development programmes along with the Group’s day to day operations. The Group has a long term business plan which shows that it is able to service debt facilities whilst continuing to comply with lenders covenants. On this basis the Board has a reasonable expectation that based on forecasts and current expectations of future sector conditions the Group and Association have adequate resources to continue in operational existence for the foreseeable future, being a period of at least twelve months after the date on which the report and financial statements are signed. As a consequence the Board continues to adopt the going concern basis in preparing these financial statements.
Judgements and key sources of estimation uncertaintyThe preparation of the financial statements requires management to make judgements, estimates and assumptions that affect the amounts reported for assets and liabilities as at the statement of financial position date and the amounts reported for revenues and expenses during the year. However, the nature of estimation means that actual outcomes could differ from those estimates.
The following judgements, estimates and assumptions have had the most significant effect in amounts recognised in the financial statements:
— The categorisation of housing properties. In determining the intended use, the Group has considered if the asset is held for social benefit or to earn commercial rentals. The Group has determined that market rented properties are investment properties;
— Tangible fixed assets. Other than investment properties, tangible assets are depreciated over their useful lives taking into account residual values where appropriate. The estimates of useful life for the different component types and assets are detailed on page 70;

68
— Impairment of non-financial assets. An annual impairment review of the Group’s land and properties is undertaken
During 2017/18 a proposal to transfer one of the sites in the Association’s Belle Vale land bank to The Compendium Group (the Association’s joint venture with Lovell Partnerships) indicated an impairment to £nil was required. As a consequence of this trigger event Jones Lang LaSalle were commissioned to value the land bank. As a result of this valuation an impairment of £2.9m is considered prudent taking the carrying value of the Belle Vale land bank to £nil.
As the Group’s London asset development programme progresses, existing Lambeth and Bromley properties have been impaired by £1.4m prior to the estate regeneration.
A review of the impairment provision for properties originally developed for shared ownership but currently let at market or intermediate rent indicated that £1.9m of the provision could be released as a result of an increase in estimated net realisable values.
— Pension and other post-employment benefits. The cost of defined benefit pension plans and other post-employment benefits are determined using actuarial valuations. The actuarial valuation involves making assumptions about discount rates, future salary increases, mortality rates and future pension increases. Due to the complexity of the valuation, the underlying assumptions and long term nature of these plans, such estimates are subject to considerable uncertainty and the Group relies on the expert input of actuaries. Further details of the assumptions made are provided in Note 26.
Supported housingIn addition to its own directly managed supported housing schemes, The Riverside Group owns a number of schemes that are run by outside agencies. Where The Riverside Group carries the financial risk all the scheme’s income and expenditure is included in the statement of comprehensive income. Where the agency carries the financial risk only the income and expenditure which relates solely to The Riverside Group is included. Other income and expenditure of schemes in this category is excluded from the statement of comprehensive income.
Supporting people contract incomeSupporting People (SP) contract income received from Administering Authorities is accounted for as income for support services in the turnover in note 3 to the financial statements. The related support costs are matched against this income.
Service chargesService charge income and costs are recognised on an accruals basis. The Group operates both fixed and variable service charges on a scheme by scheme basis in full consultation with residents. Where variable service charges are used the charges will include an allowance for the surplus or deficit from prior years, with the surplus being returned to residents by a reduced charge and a deficit being recovered by a higher charge. Until these are returned or recovered they are held as creditors or debtors in the statement of financial position.
Where periodic expenditure is required a provision may be built up over the years, in consultation with the residents; until these costs are incurred this liability is held in the statement of financial position within creditors.
TurnoverTurnover comprises rental and service charge income receivable (net of void losses), certain revenue grants from local authorities and the Homes and Communities Agency, together with other income and income from the sale of shared ownership and other properties developed for outright sale. Income from property sales is recognised as receivable on the delivery of services provided.
Joint ventures An entity is treated as a joint venture where the group holds an interest and shares control under a contractual arrangement with one or more parties external to the group.
In the group accounts, joint ventures are accounted for using the equity method. The consolidated statement of comprehensive income includes the group’s share of the operating results, pre-tax results and attributable taxation of such undertakings based on audited financial statements. In the consolidated statement of financial position, the group’s share of the identifiable net assets attributable to its joint ventures are shown separately.

We work with contractors and other organisations to help fund and carry out specialist adaptations, enabling many customers to stay in their homes.
69
Retirement benefitsDuring the year the Group contributed to local government pension schemes which were defined benefit schemes. The Group also contributes to the Social Housing Pension Scheme (SHPS). The assets of the scheme are held separately from those of the Group.
The assets of the pension schemes are measured using market values. The liabilities of the pension schemes are measured using a projected unit method discounted at the current rate of return on a high quality corporate bond of equivalent term and currency to the liabilities.
The disclosures in the accounts follow the requirements of Section 28 of FRS 102 in relation to multi-employer funded schemes in which the Group has a participating interest.
Contributions payable under an agreement with SHPS to fund past deficits are recognised as a liability in the Group’s financial statements calculated by the repayments known, discounted to the net present value at the year ended using a market rate discount factor of 2.06% at 31 March 2016, 1.33% at 31 March 2017 and 1.72% at 31 March 2018. The unwinding of the discount is recognised as a finance cost in the statements of comprehensive income in the period incurred.
Excluding SHPS, the surpluses of the pension schemes (to the extent that they are recoverable) or deficits are recognised in full. The movements in the schemes’ surpluses/deficits are included in the statement of comprehensive income and shown in the statement
of movement in reserves, under the heading actuarial gains and losses.
The Group also contributes to defined contribution plans. Under a defined contribution plan the Group pays fixed contributions into a separate entity and will have no legal or constructive obligation to pay further amounts. Obligations for contributions to defined contribution pension schemes are recognised as an expense in the statement of comprehensive income periods during which services are rendered by employees.
Holiday pay accrualA liability is recognised to the extent of any unused holiday pay entitlement which has accrued at the statement of financial position date and carried forward to future periods. This is measured at the undiscounted salary cost of the future holiday entitlement so accrued at the statement of financial position date.
Fixed assetsTangible fixed assets are stated at cost less accumulated depreciation.
Housing properties are principally properties available for rent. Cost includes the cost of acquiring the land and buildings, development costs and expenditure incurred in respect of improvements.
Properties acquired in stock transfers are recognised at fair value.
Leasing and hire purchase

70
Where assets are financed by hire purchase contracts and leasing agreements that give rights approximating to ownership (finance leases), they are treated as if they had been purchased outright. The amount capitalised is the present value of the minimum lease payments payable over the term of the lease. The corresponding leasing commitments are shown as obligations to the lessor in creditors. They are depreciated over the shorter of the lease term and their economic useful lives.
Lease payments are analysed between capital and interest components so that the interest element of the payment is charged to the statement of comprehensive income over the term of the lease and is calculated so that it represents a constant proportion of the balance of capital repayments outstanding. The capital part reduces the amounts payable to the lessor.
Other leases are treated as operating leases and payments are charged to the statement of comprehensive income on a straight line basis over the term of the lease.
Reverse premiums and similar incentives received on leases to enter into operating lease agreements are released to the statement of comprehensive income over the term of the lease.
Investment propertyInvestment property includes commercial and other properties not held for the social benefit of the Group. Investment property is measured at cost on initial recognition, which includes purchase cost and any directly attributable expenditure, and subsequently at fair value at the reporting date. Fair value is determined annually by external valuers and derived from the current market rents and investment property yields for comparable real estate, adjusted if necessary
for any difference in the nature, location or condition of the specific asset. No depreciation is provided. Changes in fair value are recognised in the statement of comprehensive income.
Depreciation and impairmentWhere a housing property comprises two or more major components with substantially different useful economic lives, each component is accounted for separately and depreciated on a straight line basis over its individual useful economic life. The estimated individual useful economic life of the components are as follows:
Component Useful Economic Life (years)
Structure – new build 100
Structure – rehabilitated up to 50
Kitchens 20
Bathrooms 30
Roofs 60
Boilers 15
Full heating system 30
Windows and doors 25
Depreciation on non-housing property stock is charged on a straight-line basis over the expected useful economic lives of the assets at the following rates:
Asset Useful Economic Life (years)
Freehold and long leasehold offices 15 to residual value
Office fixtures and fittings 10
Care and support scheme fixtures and fittings
3 – 25
IT equipment 3 – 5
Leasehold improvements over the term of the lease
Assets in the course of construction are held at cost and are not depreciated until reclassified as housing properties completed.

71
Improvement to propertyExpenditure incurred on general repairs to housing properties is charged to the statement of comprehensive income in the year in which it is incurred.
Expenditure on refurbishment or replacement of identified housing property components is capitalised.Non-component works to existing housing properties are capitalised where they relate to an improvement, which is defined as an increase in the net rental stream or the life of a property.
Impairment of non-financial assetsThe carrying amount of the Group’s non-financial assets are reviewed at each reporting date to determine whether there is any indication of impairment. If any indication exists, then the asset’s recoverable amount is estimated. For the purpose of impairment testing, assets that cannot be tested individually are grouped together into the smallest group of assets that generates cash inflows from continuing use that are largely independent of the cash inflows of other assets or groups of assets (the “cash generating unit” or “CGU”).
An impairment loss is recognised if the carrying amount of an asset or its CGU exceeds its estimated recoverable amount. Impairment losses are recognised in the statement of consolidated income.
Impairment losses recognised in prior periods are assessed at each reporting date for any indications that the loss has decreased or no longer exists. An impairment loss is reversed only to the extent that the asset’s carrying amount does not exceed the carrying amount that would have been determined net of depreciation or amortisation if no impairment loss had been recognised.
First tranche shared ownership salesShared ownership properties are split proportionally between current and fixed assets based on the first tranche proportion. First tranche proportions are accounted for as current assets and the related sales proceeds shown in turnover. The remaining element of the shared ownership property is accounted for as a fixed asset so that any subsequent sale is treated as a part disposal of a fixed asset.
GoodwillGoodwill arising on the acquisition of subsidiaries represents the excess of the fair value of the identifiable net assets acquired over the fair value of the consideration paid.
Goodwill is carried at cost less accumulated amortisation and impairment losses.
Amortisation is calculated on the straight line basis over estimated useful life, which is estimated at five years. The amortisation period and method is reviewed when events and circumstances indicate that the useful life may have changed since the last reporting date.
HomeBuyThe Group operates this scheme by lending a percentage of the cost to home purchasers, secured on the property. The loans are interest free and repayable only on the sale of the property. On a sale, the fixed percentage of the proceeds is repaid. The loans are financed by an equal amount of Social Housing Grant (SHG). On redemption:
— the SHG is recycled— the SHG is written off if a loss occurs or— the Group keeps any surplus.
Homebuy loans are treated as concessionary loans and are initially recognised as fixed asset investments in the statement of financial position at the amount paid to the purchaser and reviewed annually for impairment. The associated Homebuy grant from the HCA is recognised as deferred income within creditors until the loan is redeemed.
Properties for saleCompleted properties for outright sale and property under construction are valued at the lower of cost and net realisable value. Cost comprises materials, direct labour and direct development overheads.
Net realisable value is based on estimated sales price after allowing for all further costs of completion and disposal.
ArrearsDebtors include the total rent and service charge arrears which is comprised of both current and former tenant arrears. Former tenant arrears are fully provided for in the financial statements at the point the tenant leaves the property. Current tenant arrears are provided for at specific rates according to the age of the debt.
72
Social Housing and other government grantsWhere developments have been financed wholly or partly by social housing and other grants, the amount of the grant received has been included as deferred income and is recognised in Turnover over the estimated useful life of the associated asset, under the accruals model. Social Housing Grant (SHG) received for items of cost written off in the statement of comprehensive income is included as part of Turnover.
When SHG in respect of housing properties in the course of construction exceeds the total cost to date of those housing properties, the excess is shown as a current liability.
SHG must be recycled by the Group under certain conditions, if a property is sold, or if another relevant event takes place. In these cases, the SHG can be used for projects approved by the Homes and Communities Agency and Greater London Authority. However, SHG may have to be repaid if certain conditions are not met. If grant is not required to be recycled or repaid, any unamortised grant is recognised as Turnover. In certain circumstances, SHG may be repayable, and, in that event, is a subordinated unsecured repayable debt.
Non-monetary government grantOn disposal of assets for which non-monetary government grants are held as deferred income in the statement of financial position, the unamortised amount in creditors is derecognised and recognised as income in the statement of comprehensive income.
Recycling of Capital GrantWhere SHG is recycled, as described above, it is credited to a fund which appears as a creditor until used to fund the acquisition of new properties. Where recycled grant is known to be repayable it is shown as a creditor within one year.
Disposal Proceeds Fund (DPF)Receipts from the sale of SHG funded properties less the net book value of the property and the costs of disposal are credited to the DPF. This creditor is carried forward until it is used to fund the acquisition of new social housing.
Non government grantsGrants received from non-government sources are recognised under the performance model. If there are no specific performance requirements the grants are recognised when received or receivable. Where grant is received with specific performance requirements it is shown as deferred income until the conditions are met and then it is recognised as Turnover.
ProvisionsA provision is recognised in the statement of financial position when the Group has a present legal or constructive obligation as a result of a past event, that can be reliably measured and it is probable that an outflow of economic benefits will be required to settle the obligation. Provisions are recognised at the best estimate of the amount required to settle the obligation at the reporting date.
Capitalisation of costsCosts relating to development of properties and IT systems are capitalised only to the extent that they are directly attributable to the development process and in bringing the properties or system to their intended use. Capitalised costs are written off over the useful economic life of the asset.
Valuation of investmentsInvestments in subsidiaries are measured at cost less accumulated impairment. Where merger relief is applicable, the cost of the investment in a subsidiary undertaking is measured at the normal value of the shares issued together with the fair value of any additional consideration.
Investments in unlisted company shares, which have been classified as fixed asset investments as the Group intends to hold them on a continuing basis, are re-measured to fair value at each statement of financial position date. Gains and losses on re-measurement are recognised in the statement of consolidated income for the period.
Investments in listed company shares, which have been classified as current asset investments, are re-measured to fair value at each statement of financial position date. Gain and losses on re-measurement are recognised in the statement of consolidated income for the period.

We have a long history of working with people who are homeless, we are the third largest provider of services in the country.
73
Current asset investments Current asset investments include cash and cash equivalents invested for periods of more than 24 hours. They are recognised initially at cost and subsequently at fair value at the reporting date. Any change in valuation between reporting dates is recognised in the statement of comprehensive income.
Value Added TaxThe Riverside Group is partially exempt in relation to Value Added Tax (VAT), and accordingly is able to recover from HM Revenue & Customs part of the VAT incurred on expenditure. At the year end VAT recoverable or payable is included in the statement of financial position. Irrecoverable VAT is accounted for in the statement of comprehensive income.
TaxationThe charge for taxation is based on the surplus or deficit for the year. It takes into account deferred taxation arising from timing differences between the treatment of certain items for taxation and accounting purposes to the extent that a liability or asset is expected to be payable or receivable in the foreseeable future.
Loan issue costs and interest payableThe cost of raising loans is amortised over the period of the loan.
Loans are stated in the statement of financial position at the amount of the net proceeds after issue, plus increases to account for any subsequent amounts amortised. Where loans are redeemed during the year any redemption penalty and any connected loan finance issue costs are recognised in the statement of comprehensive income in the year in which the redemption took place.
Loan interest costs are calculated using the effective interest method of the difference between the loan amount at initial recognition and amount of maturity of the related loan.

74
Financial InstrumentsFinancial assets and financial liabilities are measured at transaction price initially, less transaction costs that are directly attributable to the acquisition or issue of the financial asset or financial liability.
At the end of each reporting period, financial instruments are measured without any deduction for transaction costs the entity may incur on sale or other disposal as follows:
— Debt instruments that meet the conditions in paragraph 11.8(b) of FRS 102 are measured at amortised cost using the effective interest method, except where the arrangement constitutes a financing transaction. In this case the debt instrument is measured at the present value of the future payments discounted at a market rate of interest for a similar debt.
— Commitments to receive or make a loan to another entity which meet the conditions in para 11.8(c) of FRS 102 are measured at cost less impairment.
Financial instruments held by the Group are classified as follows:
— Financial assets such as cash, current asset investments and receivables are classified as loans and receivables and held at amortised cost using the effective interest method unless a quoted price is available, in which case they are held at fair value.
— Financial liabilities such as bonds and loans are held at amortised cost using the effective interest method.
— Loans to or from subsidiaries including those that are due on demand are held at amortised cost using the effective interest method.
— Commitments to receive or make a loan to another entity which meet the conditions above are held at cost less impairment.
— An investment in another entity’s equity instruments other than non-convertible preference shares and non-puttable ordinary and preference shares are held at fair value.
— Derivatives such as interest rate swaps are classified as financial assets or financial liabilities at fair value.
Financial assets and financial liabilities at fair value are classified using the following fair value hierarchy:
— The best evidence of fair value is a quoted price in an active market.
— When quoted prices are unavailable, the price of a recent transaction for an identical asset, adjusted to reflect any circumstances specific to the sale, such as a distress sale, if appropriate.
— Where there is no active market or recent transactions then a valuation technique is used to estimate what the transaction price would have been on the measurement date in an arms length exchange motivated by normal business considerations.
Hedging Interest rate swaps relate to fixing variable rate interest and are therefore designated as cash flow hedges. A cash flow hedge is a hedge of the exposure to variability in cash flows that is attributable to a particular risk associated with a recognised asset or liability or a highly probable transaction, which could affect profit or loss. They are measured at fair value at each reporting date.
Gains and losses on cash flow hedges which are highly effective are recognised in other comprehensive income. Any ineffective portion of a gain or loss on cash flow hedges is recognised in profit or loss.
In order to apply hedge accounting, an economic relationship must exist between the hedged item and the hedging instrument. The Group must formally designate and document the hedging relationship at inception so that the risk being hedged, the hedged item and the hedging instrument are clearly identified, and the risk management objective for undertaking the hedge. It is also required to determine and document the causes of hedge ineffectiveness.
In a cash flow hedge, if the hedged future cash flows are no longer expected to occur, the amount that has been accumulated in the cash flow hedge reserve is reclassified from the cash flow hedge reserve to profit or loss immediately.

75
Service concession arrangements The Group’s Private Finance Initiatives (PFI) contracts with Sandwell Metropolitan Borough Council and Hull City Council meet the conditions of a service concession arrangement.
For service concession arrangements entered into after the date of transition to FRS 102 the service concession arrangements will be accounted for using the financial asset model whereby costs incurred in constructing the PFI assets are initially recognised as a financial asset at the fair value of the construction costs. Thereafter accounting is in accordance with FRS 102 section 11 “Basic Financial Instruments”.
Service concession arrangements entered into before the date of transition to FRS 102 continue to be accounted for using the same accounting policies being applied at the date of transition to FRS 102.
Impairment of financial assets Financial assets are assessed at each reporting date to determine whether there is any objective evidence that a financial asset or group of financial assets is impaired. If there is objective evidence of impairment, an impairment loss is recognised in the consolidated statement of comprehensive income immediately.
An impairment loss is measured as follows on the following instruments measured at cost or amortised cost:
— For an instrument measured at amortised cost, the impairment loss is the difference between the asset’s carrying amount and the present value of the estimated future cash flows discounted at the asset’s original effective interest rate.
— For an instrument measured at cost less impairment, the impairment loss is the difference between the asset’s carrying amount and the best estimate of the amount that the entity would receive for the asset if it were to be sold at the reporting date.
If, in a subsequent period, the amount of an impairment loss decreases and the decrease can be related objectively to an event occurring after the impairment was recognised, the previously recognised impairment loss is reversed either directly or by adjusting an allowance account. The reversal cannot result in a carrying amount (net of any allowance account) which exceeds what the carrying amount would have been had the impairment not previously been recognised. The amount of the reversal is recognised as profit or loss immediately.
Non-equity share capital27 shares have been issued to the members of The Riverside Group Limited. In the event of winding up the liability of individual members shall not exceed £1.
Cashflow hedge reserveThe hedge reserve comprises the effective portion of the cumulative net change on the fair value of cashflow hedging instruments related to hedged transactions that have not yet occurred.
Restricted reservesRestricted reserves represent reserves earmarked for a specific use.

76
Turnover, operating costs and operating surplus2 Group 2018
Operating Turnover Cost of sales Operating costs surplus/(deficit) £’000 £’000 £’000 £’000
Social housing activitiesLettings (note 3) 279,526 — (210,063) 69,463
Other social housing activitiesDevelopment for sale shared ownership 7,354 (7,062) — 292Management services 1,086 — (1,957) (871)Community regeneration — — (2,230) (2,230)Other 18,407 — (8,240) 10,167 ———— ———— ———— ———— 306,373 (7,062) (222,490) 76,821 ———— ———— ———— ————
Non-social housing activitiesLettings (note 3) 2,864 — (974) 1,890Developments for outright sale 36,663 (32,533) — 4,130Other 260 — (3,094) (2,834) ———— ———— ———— ———— 39,787 (32,533) (4,068) 3,186 ———— ———— ———— ————Total 346,160 (39,595) (226,558) 80,007 ———— ———— ———— ————
2017 Operating Turnover Cost of sales Operating costs surplus/(deficit) £’000 £’000 £’000 £’000
Social housing activitiesLettings (note 3) 282,049 — (212,535) 69,514
Other social housing activitiesDevelopment for sale shared ownership 3,842 (3,396) — 446Management services 1,424 — (1,795) (371)Community regeneration 20 — (4,184) (4,164)Other 37,163 — (33,817) 3,346 ———— ———— ———— ———— 324,498 (3,396) (252,331) 68,771 ———— ———— ———— ————
Non-social housing activitiesLettings (note 3) 5,204 — (1,127) 4,077Developments for outright sale 38,633 (31,988) — 6,645Other 1,716 — (1,158) 558 ———— ———— ———— ———— 45,553 (31,988) (2,285) 11,280 ———— ———— ———— ————Total 370,051 (35,384) (254,616) 80,051 ———— ———— ———— ————

77
Turnover, operating costs and operating surplus – continued2
Association 2018
Operating Turnover Cost of sales Operating costs surplus/(deficit) £’000 £’000 £’000 £’000
Social housing activitiesLettings (note 3) 269,409 — (206,342) 63,067
Other social housing activitiesDevelopment for sale shared ownership 7,354 (6,108) — 1,246Management services 1,086 — (1,916) (830)Community regeneration — — (2,187) (2,187)Other 14,293 — (4,108) 10,185 ———— ———— ———— ———— 292,142 (6,108) (214,553) 71,481 ———— ———— ———— ————
Non-social housing activitiesLettings (note 3) 2,734 — (943) 1,791Development for outright sale — — — —Other 9 — (203) (194) ———— ———— ———— ———— 2,743 — (1,146) 1,597 ———— ———— ———— ————Total 294,885 (6,108) (215,699) 73,078 ———— ———— ———— ————
2017 Operating Turnover Cost of sales Operating costs surplus/(deficit) £’000 £’000 £’000 £’000
Social housing activitiesLettings (note 3) 272,228 — (209,134) 63,094
Other social housing activitiesDevelopment for sale shared ownership 3,842 (3,396) — 446Management services 1,423 — (1,809) (386)Community regeneration — — (3,941) (3,941)Other 13,504 — (5,300) 8,204 ———— ———— ———— ———— 290,997 (3,396) (220,184) 67,417 ———— ———— ———— ————
Non-social housing activitiesLettings (note 3) 2,871 — (1,060) 1,811Development for outright sale — — — —Other 22 — (96) (74) ———— ———— ———— ———— 2,893 — (1,156) 1,737 ———— ———— ———— ————Total 293,890 (3,396) (221,340) 69,154 ———— ———— ———— ————

78
Group
General Supported Shared Key worker 2018 2017 housing housing ownership housing Total Total £’000 £’000 £’000 £’000 £’000 £’000
Income from lettingsRent receivable net of Service charge income 163,012 39,080 5,097 102 207,291 210,317Income for support services 724 24,474 — — 25,198 25,855Service charge receivable 5,754 29,777 11 182 35,724 33,527 ———— ———— ———— ———— ———— ————Net rental income 169,490 93,331 5,108 284 268,213 269,699 ———— ———— ———— ———— ———— ————Other revenue grants 718 7 — — 725 371Amortisation of government grants 6,567 3,668 353 — 10,588 10,757Government grants taken to income — — — — — 1,222 ———— ———— ———— ———— ———— ————Turnover from lettings 176,775 97,006 5,461 284 279,526 282,049 ———— ———— ———— ———— ———— ————
Expenditure on lettingsManagement (30,088) (11,343) (1,260) (36) (42,727) (47,243)Service charge costs and support services (13,570) (55,862) (104) (90) (69,626) (64,845)Routine maintenance (42,430) (8,781) (883) (15) (52,109) (50,678)Major repairs expenditure (5,272) (836) — — (6,108) (9,598)Bad debts (1,390) (922) 6 (2) (2,308) (1,953)Depreciation of housing properties (26,600) (7,077) (921) (16) (34,614) (33,577)Impairment of housing properties (2,571) — — — (2,571) (4,641) ———— ———— ———— ———— ———— ————Operating costs on lettings (121,921) (84,821) (3,162) (159) (210,063) (212,535) ———— ———— ———— ———— ———— ————Operating surplus on social housing lettings 54,854 12,185 2,299 125 69,463 69,514 ———— ———— ———— ———— ———— ————Void loss (1,352) (3,190) (8) (1) (4,551) (3,514) ———— ———— ———— ———— ———— ————
2018 2017 £’000 £’000
Particulars of turnover from non-social housing lettings
Market rent 2,864 5,204 ———— ———— 2,864 5,204 ———— ————
Income and expenditure from social housing lettings3

79
Income and expenditure from social housing lettings – continued3
Association
General Supported Shared Key worker 2018 2017 housing housing ownership housing Total Total £’000 £’000 £’000 £’000 £’000 £’000
Turnover from lettingsRent receivable net of Service charge income 153,740 33,991 5,097 102 197,930 201,245Income for support services 703 24,474 — — 25,177 25,854Service charges receivable 5,646 29,606 11 183 35,446 33,187 ———— ———— ———— ———— ———— ————Net rental income 160,089 93,071 5,108 285 258,553 260,286 ———— ———— ———— ———— ———— ————Other revenue grants 473 7 — — 480 371Amortisation of government grants 6,357 3,667 352 — 10,376 10,545Government grants taken to income — — — — — 1,026 ———— ———— ———— ———— ———— ————Turnover from lettings 166,919 96,745 5,460 285 269,409 272,228 ———— ———— ———— ———— ———— ————
Expenditure on lettingsManagement (29,358) (11,309) (1,260) (36) (41,963) (45,157)Service charge cost and support services (11,494) (55,702) (104) (90) (67,390) (64,305)Routine maintenance (43,468) (8,774) (883) (15) (53,140) (52,301)Major repairs expenditure (4,743) (832) — — (5,575) (9,234)Bad debts (1,324) (922) 6 (2) (2,242) (1,957)Depreciation of housing properties (25,447) (7,076) (921) (16) (33,460) (32,450)Impairment of housing properties (2,571) — — — (2,571) (3,730) ———— ———— ———— ———— ———— ————Operating costs on lettings (118,406) (84,615) (3,162) (159) (206,342) (209,134) ———— ———— ———— ———— ———— ————Operating surpluson social housing lettings 48,513 12,130 2,298 126 63,067 63,094 ———— ———— ———— ———— ———— ————Void loss (1,341) (3,190) (8) (1) (4,540) (3,504) ———— ———— ———— ———— ———— ————
2018 2017 £’000 £’000
Particulars of turnover from non-social housing lettings
Market rent 2,734 2,871 ———— ———— 2,734 2,871 ———— ————

80
Directors’ and senior staff emoluments4The Directors are defined for the purpose of this note as the members of the Board and Executive Directors of The Riverside Group Limited. Directors appointed after the end of the financial year are not included in the disclosure. This satisfies the definition included in the Accounting Direction for Private Registered Providers of Social Housing 2015.
The Executive Directors do not receive any chargeable benefits in kind other than company cars. The emoluments of the Directors are set out below. There are seven (2017: five) Executive Directors included within the total below who are not Board members.
Group 2018 2017 £’000 £’000
Emoluments (including pension contributions and benefits in kind) 1,356 1,281 ———— ————Highest paid Director – Interim Chief Finance Officer1 (2017: Group Chief Executive)Emoluments (excluding pension contributions) 243 211 ———— ————Expenses reimbursed to Directors not chargeable to income tax 9 8 ———— ————Three of the Directors received cash in lieu of pension payments of £65k. The Group Board approved a policy for such settlement at a rate which does not involve the Group incurring any greater cost than that of the individual’s pension membership.
Key to numbering 1 Interim appointment. Emoluments are inclusive of agency fees and VAT.
The emoluments (excluding pension contributions) paid to Executive and Non-Executive Directors were as follows:
2018 2017Executive Directors £’000 £’000
Rosemary Farrar1,2 243 9 Carol Matthews 195 184 Léann Hearne 154 151 John Wood 154 151 Ian Gregg 137 132 John Glenton 124 105 Joy Baggaley2 114 179 Cris McGuinness2 15 — Ronnie Clawson2 — 152 The emolument above exclude the following pension payments:Four of the Directors received pensions payments of £45k (2017: £52k) and three received cash in lieu of pension payments of £65k (2017: £63k). The Group Board approved a policy for payment in lieu of pension payments at a rate which does not involve the Group incurring any greater cost than that of the individual’s pension membership.
Key to numbering 1 Interim appointment. Emoluments are inclusive of agency fees and VAT.2 The emoluments relate to part of the year.

81
Directors’ and senior staff emoluments – continued4 2018 2017Non-Executive Directors £’000 £’000
Max Steinberg CBE 27 27 Susan Jee 19 19 Pauline Davis 19 11 Peter White 13 11 Jonathan Dale 10 10 Tim Croston1 10 — Philip Han1 8 12 Ingrid Fife1 6 — Philip Raw — 16 Paul Forster-Jones — 4 Mike Little — 2
Key to numbering 1 The emoluments relate to part of the year.
The number of staff whose remuneration is £60,000 or more (including pension contributions) is disclosed below: 2018 2017
£60,001 — £70,000 20 26 £70,001 — £80,000 17 11 £80,001 — £90,000 4 8 £90,001 — £100,000 6 7 £100,001 — £110,000 4 6 £110,001 — £120,000 5 4 £120,001 — £130,000 1 1 £140,001 — £150,000 1 — £150,001 — £160,000 2 2 £160,001 — £170,000 — 1 ———— ———— 60 66 ———— ————The salary bandings do not include Directors who are disclosed above.

82
Employee information5Staff numbersThe average number of persons (including the Executive Directors) employed during the year (based on 35-37.5 hours) was:
Group 2018 2017 Number Number
Full time equivalent 2,697 2,710 ———— ———— 2018 2017 £’000 £’000
Staff costs (for the above persons) Wages and salaries 76,728 74,771Social security costs 7,124 6,936Other pension costs 5,117 5,345 ———— ———— 88,969 87,052 ———— ————Staff costs and numbers referred to above all relate to staff employed by The Riverside Group, but exclude staff costs and numbers employed by the managing agents at supported housing schemes.
The total amount of severance and redundancy payments made during the year was £4.9m (2017: £3.5m).
Association 2018 2017 Number Number
Full time equivalent 2,148 2,204 ———— ———— 2018 2017 £’000 £’000
Staff costs (for the above persons) Wages and salaries 61,148 60,689Social security costs 5,634 5,593Other pension costs 4,651 4,882 ———— ———— 71,433 71,164 ———— ————The total amount of severance and redundancy payments made during the year was £4.8m (2017:£3.4m)

Gain on the sale of fixed assets6
Interest receivable and other income7
Group 2018 2017 £’000 £’000
Proceeds of sales 37,473 49,711Cost of sales (22,049) (27,378) ———— ————Surplus on sale of property 15,424 22,333 ———— ———
Association 2018 2017 £’000 £’000
Proceeds of sales 37,255 49,669Cost of sales (22,010) (27,345) ———— ————Surplus on sale of property 15,245 22,324 ———— ———— Surplus on sale of property includes shared ownership staircasing sales surplus of £703k (2017: £473k).
Group 2018 2017 £’000 £’000
Bank and other interest receivable 6,170 2,932Income from listed investments 1,042 1,861 ———— ———— 7,212 4,793 ———— ————
Association 2018 2017 £’000 £’000
Bank and other interest receivable 2,939 2,332Income from listed investments 325 1,861Intercompany interest from subsidiary 1,426 1,563 ———— ———— 4,690 5,756 ———— ————
83

84
Interest payable and similar charges8 Group
2018 2017 £’000 £’000
Bank loans and overdrafts 23,718 20,284Other loans 17,031 16,189Other interest payable 1,494 1,339Pension costs 558 564Finance costs 731 809 ———— ———— 43,532 39,185 ———— ————
Association 2018 2017 £’000 £’000
Bank loans and overdrafts 19,632 18,122Other loans 17,031 17,492Other interest payable 1,494 1,339Intercompany interest (31) 109Pension costs 558 564Finance costs 731 673 ———— ———— 39,415 38,299 ———— ————

85
Surplus on ordinary activities9 Group
2018 2017 £’000 £’000
Surplus on ordinary activities is stated after charging:Depreciation for the year
Housing properties 34,406 33,581Other tangible fixed assets 5,357 4,573Amortisation of government grant (10,621) (10,757)
Impairment charge/(credit) for the yearHousing properties 2,541 4,217Investment properties and properties awaiting sale — 424Released on disposal (300) (3,455)
Auditors’ remunerationFor audit services 163 160For non-audit services— tax advisory — 130— pension advisory 31 55— other 55 —
Operating lease rentalsLand and buildings 1,320 1,218Other 598 659 ———— ————
Association 2018 2017 £’000 £’000
Surplus on ordinary activities is stated after charging: Depreciation for the year
Housing properties 33,251 32,461Other tangible fixed assets 5,235 4,402Amortisation of government grant (10,389) (10,545)
Impairment charge/(credit) for the yearHousing properties 2,541 3,730Released on disposal (300) (3,455)
Auditors’ remunerationFor audit services 112 110For non-audit services— tax advisory — 130— pension advisory 28 55— other 76 —
Operating lease rentalsLand and buildings 1,172 1,106Other 552 627 ———— ————

86
Tax on surplus on ordinary activities10 Group
2018 2017 £’000 £’000
Analysis of charge in periodCurrent tax charge (3) —Deferred tax charge/(credit) (448) 804 ———— ————Total tax charge/(credit) (451) 804 ———— ————Factors affecting tax charge for periodThe tax assessed for the year is lower than the standard rate of corporation tax in the UK of 19%. The differences are explained below: 2018 2017 £’000 £’000
Profit on ordinary activities before tax 60,071 69,850 ———— ————Profit on ordinary activities multiplied by the standard rate of corporation tax in the UK of 19% (2017: 20%) 11,413 13,970Effects of:Expenses not deductible for tax purposes 4 4Profits exempt from tax due to charitable exemption (11,039) (12,865)Movement in deferred tax — (133)Consolidation adjustments — —Prior year deferred tax — (8)Affect on profit from Joint Ventures (47) (100)Disposal of investment properties (835) —Rate change 53 (64) ———— ————Total charge (451) 804 ———— ————Deferred taxationThe movement in the year is as follows: 2018 2017 £’000 £’000
At the beginning of the year (407) (1,210)Charge for the year (451) 813Prior year 3 (9) ———— ————At the end of the year (855) (407) ———— ————The elements of the deferred tax asset and amounts not provided are as follows: Provided £’000
Difference between accumulated depreciation and capital allowances 23Losses (53)Other timing differences (825) ———— (855) ————

87
Tax on surplus on ordinary activities – continued10 Association
2018 2017 £’000 £’000
Analysis of charge in periodCurrent tax charge — —Deferred tax charge — —Prior period tax — — ———— ———— — — ———— ————Factors affecting tax charge for periodThe tax assessed for the year is higher than the standard rate of corporation tax in the UK of 19%.The differences are explained below: 2018 2017 £’000 £’000
Profit on ordinary activities before tax 56,797 63,308 ———— ————Profit on ordinary activities multiplied by the standard rate of corporation tax in the UK of 19% (2017: 20%) 10,791 12,661Effects of:Profits exempt from tax as a result of charitable exemption (10,791) (12,661) ———— ————Current tax — — ———— ————

88
Tangible fixed assets11 Group Social Social Shared housing housing Completed ownership properties properties shared properties held for under ownership under Total letting construction properties construction properties £’000 £’000 £’000 £’000 £’000
CostAt 1 April 2017 2,003,391 39,218 87,487 12,679 2,142,775Schemes completed 29,480 (29,480) 13,537 (13,537) —Additions 28,590 14,020 — 17,348 59,958Improvements to existing properties 33,051 — 31 — 33,082Disposal of properties (25,195) — (2,231) — (27,426)Accelerated replacement of components (1,836) — — — (1,836)Reclassification 132 79 44 (254) 1 ———— ———— ———— ———— ————At 31 March 2018 2,067,613 23,837 98,868 16,236 2,206,554 ———— ———— ———— ———— ————Depreciation and impairmentAt 1 April 2017 362,609 — 3,769 — 366,378Charge for the year 33,594 — 812 — 34,406Eliminated in respect of disposals (7,135) — (202) — (7,337)Impairment charge 2,541 — — — 2,541Impairment released on disposals (300) — — — (300) ———— ———— ———— ———— ————At 31 March 2018 391,309 — 4,379 — 395,688 ———— ———— ———— ———— ————Net book value at 31 March 2018 1,676,304 23,837 94,489 16,236 1,810,866 ———— ———— ———— ———— ————Net book value at 31 March 2017 1,640,782 39,218 83,718 12,679 1,776,397 ———— ———— ———— ———— ————Improvements to existing properties consist of £33m (2017: £29.9m) capitalised costs in addition to £6.1m (2017: £9.5m) non-capitalised improvements, which have been charged to the income and expenditure account.
The net book value of tangible fixed assets includes £Nil (2017: £Nil) in respect of assets held under finance leases.

89
Tangible fixed assets – continued11 Group Fixtures Scheme Freehold vehicles Total fixtures and long and other and leasehold computer fixed fittings offices equipment assets £’000 £’000 £’000 £’000
CostAt 1 April 2017 14,859 11,505 13,491 39,855Additions 1,992 4 8,151 10,147Disposals (1,528) (294) (1,841) (3,663) ———— ———— ———— ————At 31 March 2018 15,323 11,215 19,801 46,339 ———— ———— ———— ————Depreciation and impairmentAt 1 April 2017 10,330 6,384 5,753 22,467Charge for the year 1,886 294 3,177 5,357Eliminated in respect of disposals (4,771) (70) (1,753) (6,594) ———— ———— ———— ————At 31 March 2018 7,445 6,608 7,177 21,230 ———— ———— ———— ————Net book value at 31 March 2018 7,878 4,607 12,624 25,109 ———— ———— ———— ————Net book value at 31 March 2017 4,529 5,121 7,738 17,388 ———— ———— ———— ————

90
Tangible fixed assets – continued11 Association Social Social Shared housing housing Completed ownership properties properties shared properties held for under ownership under Total letting construction properties construction properties £’000 £’000 £’000 £’000 £’000
CostAt 1 April 2017 1,911,355 36,621 87,487 12,679 2,048,142Schemes completed 29,480 (29,480) 13,537 (13,537) —Additions 28,590 13,787 — 17,348 59,725Improvements to existing properties 32,006 — 31 — 32,037Disposal of properties (24,902) — (2,231) — (27,133)Accelerated replacement of components (1,808) — — — (1,808)Reclassification 132 79 44 (254) 1 ———— ———— ———— ———— ————At 31 March 2018 1,974,853 21,007 98,868 16,236 2,110,964 ———— ———— ———— ———— ————Depreciation and impairmentAt 1 April 2017 350,634 — 2,748 — 353,382Charge for the year 32,439 — 812 — 33,251Eliminated in respect of disposals (7,021) — (202) — (7,223)Impairment charge 2,541 — — — 2,541Impairment released on disposals (300) — — — (300) ———— ———— ———— ———— ————At 31 March 2018 378,293 — 3,358 — 381,651 ———— ———— ———— ———— ————Net book value at 31 March 2018 1,596,560 21,007 95,510 16,236 1,729,313 ———— ———— ———— ———— ————Net book value at 31 March 2017 1,560,721 36,621 84,739 12,679 1,694,760 ———— ———— ———— ———— ————Improvements to existing properties consist of £32.0m (2017: £29.3m) capitalised costs in addition to £5.6m (2017: £9.2m) non-capitalised improvements, which have been charged to the income and expenditure account.
The net book value of tangible fixed assets includes £Nil (2017: £Nil) in respect of assets held under finance leases.

91
Tangible fixed assets – continued11 Association Fixtures Scheme Freehold vehicles Total fixtures and long and other and leasehold computer fixed fittings offices equipment assets £’000 £’000 £’000 £’000
CostAt 1 April 2017 14,859 10,806 12,950 38,615Additions 1,992 4 7,950 9,946Disposals (1,528) (70) (1,473) (3,071) ———— ———— ———— ————At 31 March 2018 15,323 10,740 19,427 45,490 ———— ———— ———— ————Depreciation and impairmentAt 1 April 2017 10,329 6,040 5,314 21,683Charge for the year 1,886 249 3,100 5,235Eliminated in respect of disposals (4,771) (70) (1,388) (6,229) ———— ———— ———— ————At 31 March 2018 7,444 6,219 7,026 20,689 ———— ———— ———— ————Net book value at 31 March 2018 7,879 4,521 12,401 24,801 ———— ———— ———— ————Net book value at 31 March 2017 4,530 4,766 7,636 16,932 ———— ———— ———— ————
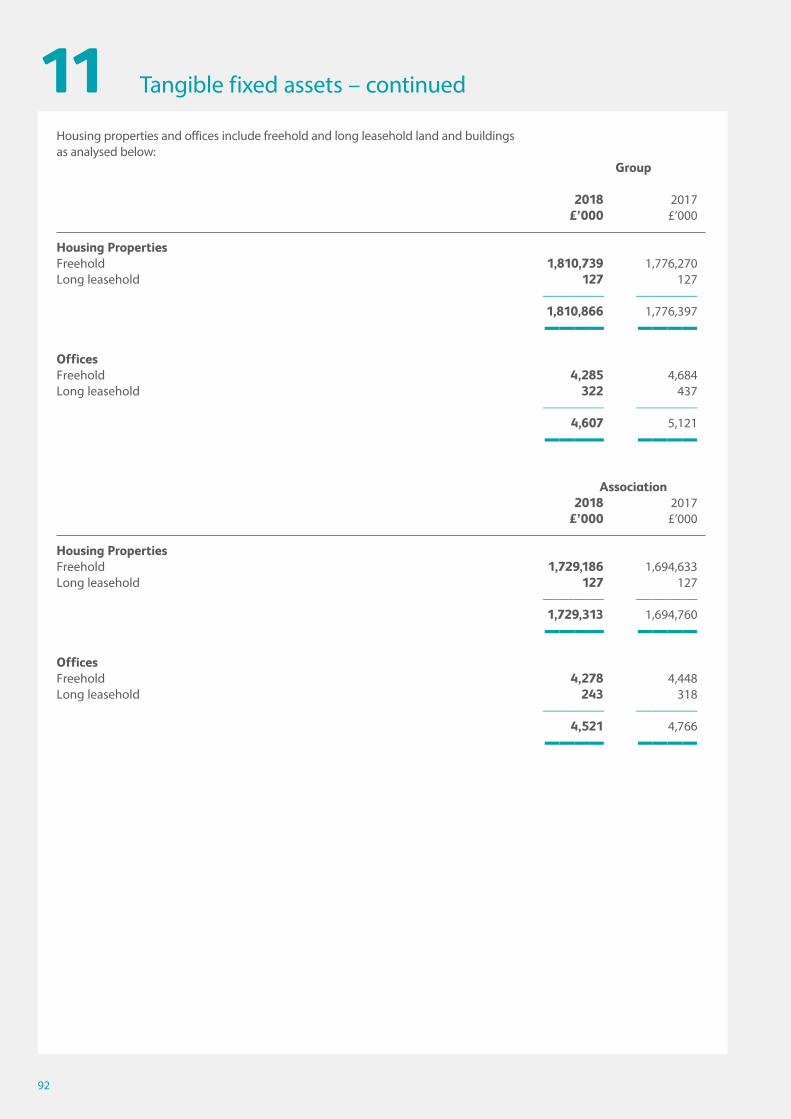
92
Tangible fixed assets – continued11Housing properties and offices include freehold and long leasehold land and buildings as analysed below:
Group
2018 2017 £’000 £’000
Housing PropertiesFreehold 1,810,739 1,776,270Long leasehold 127 127 ———— ———— 1,810,866 1,776,397 ———— ————OfficesFreehold 4,285 4,684Long leasehold 322 437 ———— ———— 4,607 5,121 ———— ————
Association 2018 2017 £’000 £’000
Housing PropertiesFreehold 1,729,186 1,694,633Long leasehold 127 127 ———— ———— 1,729,313 1,694,760 ———— ————OfficesFreehold 4,278 4,448Long leasehold 243 318 ———— ———— 4,521 4,766 ———— ————

93
Investments12A. Fixed assets
Name of undertaking Nature of undertaking Principal activity
Caribou Green Warmth LLP4 Joint Venture partnership incorporated under Energy improvement works the Limited Liability Partnership Act 2000
Circle Liverpool Limited2 Joint Venture company incorporated and Construction waste recycling limited by shares under the Companies Act 1985
The Compendium Group Limited3 Joint Venture company incorporated and limited Strategic urban regeneration by shares under the Companies Act 1985 and development
Donald Bates Charity5 Charitable Trust Management of sheltered housing
ECHG (Harrow) Homes plc5 Public Limited Company limited by shares Property investment under the Companies Act 1985
ECHG (Kensington & Chelsea) Public Limited Company Property investment Homes plc5
ECHG (No. 1) Limited5 A charitable Registered Society under the Property investment Co-operative and Community Benefit Societies Act 2014
Eleanor Godfrey Crittall Charity Charitable Trust Management of sheltered housing
Eventide Homes Trust Charitable Trust Management of supported housing
Evolve Facility Services Limited Private company limited by shares Property maintenance under the Companies Act 2006
Irvine Housing Association Limited Registered Society and Scottish Registered Registered provider of social housing Charity under the Co-operative and Community Benefits Societies 2014
Naylands (51-68) Limited1 Private company limited by shares Property management under the Companies Act 1985
Prospect (GB) Limited Company incorporated and limited by Property development shares under the Companies Act 1985 and investment
Riverside Consultancy Services Limited Company incorporated and limited by Design and build services shares under the Companies Act 1985
Riverside Finance plc Public Limited Company incorporated under Bond issuance the Companies Act 2006
Riverside Estuary Limited Private charitable company limited by Construction and management shares under the Companies Act 1985 of Extra Care units
Riverside Regeneration Limited5 Company incorporated and limited by Urban regeneration initiatives shares under the Companies Act 1985
Riverside Urban Services Limited5 Company incorporated and limited by Leasing of office premises guarantee under the Companies Act 1948 – 1981
The St. Michael’s Housing Trust Registered charity and registered provider Management of supported housing
Key to numbering
1 Entity is 77% owned by The Riverside Group Limited.2 Entity is 22.5% owned by The Riverside Group Limited.3 Entity is 50% owned by The Riverside Group Limited.4 Entity is 40% owned by The Riverside Group Limited.5 Entity is dormant.All other undertakings are 100% owned by The Riverside Group Limited.
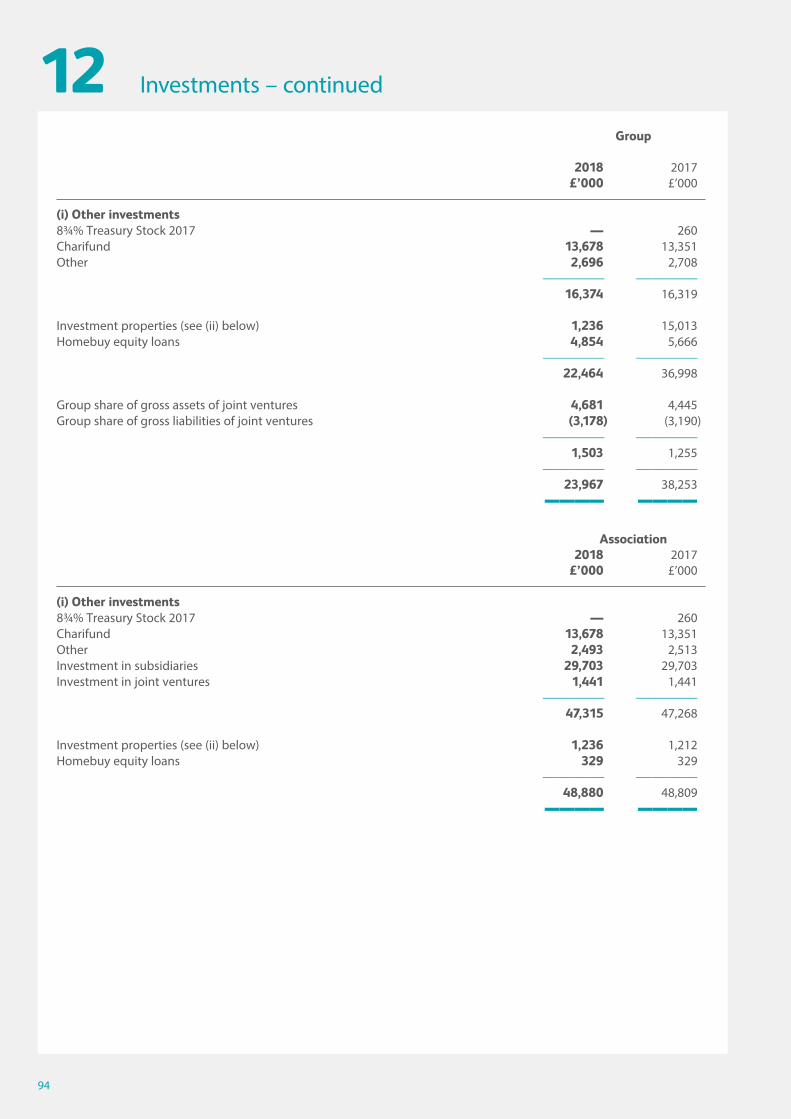
94
Investments – continued12 Group
2018 2017 £’000 £’000
(i) Other investments8¾% Treasury Stock 2017 — 260Charifund 13,678 13,351Other 2,696 2,708 ———— ———— 16,374 16,319
Investment properties (see (ii) below) 1,236 15,013Homebuy equity loans 4,854 5,666 ———— ———— 22,464 36,998
Group share of gross assets of joint ventures 4,681 4,445Group share of gross liabilities of joint ventures (3,178) (3,190) ———— ———— 1,503 1,255 ———— ———— 23,967 38,253 ———— ————
Association 2018 2017 £’000 £’000
(i) Other investments8¾% Treasury Stock 2017 — 260Charifund 13,678 13,351Other 2,493 2,513Investment in subsidiaries 29,703 29,703Investment in joint ventures 1,441 1,441 ———— ———— 47,315 47,268
Investment properties (see (ii) below) 1,236 1,212Homebuy equity loans 329 329 ———— ———— 48,880 48,809 ———— ————

95
Investments – continued12 Group
2018 2017 £’000 £’000
(ii) Investment propertiesValuation at 1 April 2017 15,013 14,258Revaluation 5,917 755Disposals (19,694) — ———— ————Valuation at 31 March 2018 1,236 15,013 ———— ————
Association 2018 2017 £’000 £’000
(ii) Investment propertiesValuation at 1 April 2017 1,212 1,123Revaluation 24 89 ———— ————Valuation at 31 March 2018 1,236 1,212 ———— ————B. Current assets
Group 2018 2017 £’000 £’000
Charged bank accounts 37,516 50,800 ———— ———— 37,516 50,800 ———— ————
Association 2018 2017 £’000 £’000
Charged bank accounts 33,342 45,243 ———— ———— 33,342 45,243 ———— ————

96
Group 2018 2017 £’000 £’000
Amounts falling due after more than one year: 11,106 11,648 ———— ————Amounts falling due within one year:Rent and service charge arrears 16,577 16,991Less: provision for bad and doubtful debts (6,720) (9,452) ———— ————Net rental debtors 9,857 7,539
Other debtors 117,928 121,058Prepayments and accrued income 4,220 5,796Deferred tax 451 407Amount due from joint venture 4,027 1,279 ———— ———— 136,483 136,079 ———— ————Included in debtors due after more than one year is £6.6m (2017: £6.7m) representing the obligation of the local authorities that transferred stock to the Group to have improvement work carried out to the properties. The Group is contracted by the local authorities to carry out these improvement works on their behalf. A further £0.4m (2017 : £4.9m) is held in respect of the on going Fire Risk Assessment programme.
Association 2018 2017 £’000 £’000
Amounts falling due after more than one year:Improvement programmes 11,106 11,648Intra group debtors 38,781 39,971 ———— ———— 49,887 51,619 ———— ————Amounts falling due within one year:Rent and service charge arrears 15,750 16,422Less: provision for bad and doubtful debts (6,378) (9,099) ———— ————Net rental debtors 9,372 7,323
Other debtors 42,619 46,579Prepayments and accrued income 3,959 6,441 ———— ———— 55,950 60,343 ———— ————
Debtors13

97
Properties for sale14 Group
2018 2017 £’000 £’000
Properties under construction – outright sales 35,722 32,560Properties under construction – shared ownership 8,725 8,117Completed properties – outright sales 4,259 4,930Completed properties – shared ownership 13,326 11,706 ———— ———— 62,032 57,313 ———— ————
Association 2018 2017 £’000 £’000
Properties under construction – shared ownership 6,919 8,117Completed properties – shared ownership 13,326 11,706 ———— ———— 20,245 19,823 ———— ————

98
Group 2018 2017 £’000 £’000
Bank and other loans (see note 17) 18,605 44,411Trade creditors 9,301 10,728Rent and service charges received in advance 5,272 4,422Social Housing Grant received in advance 7,565 5,404Other taxation and social security payable — 207Other creditors 28,830 29,294Recycled Capital Grant Fund (see note 16a) 3,786 3,178Disposal Proceeds Fund (see note 16a) 888 449Accruals and deferred income 56,435 72,129Corporation tax 1,094 115Accumulated amortisation of grant — 220Grant on Homebuy equity loans 1,784 1,784Amortisation of grant 10,379 10,545SHPS pension agreement plan 1,987 — ———— ———— 145,926 182,886 ———— ————
Association 2018 2017 £’000 £’000
Bank and other loans (see note 17) 16,300 33,357Trade creditors 6,880 6,527Rent and service charges received in advance 4,837 4,178Social Housing Grant received in advance 7,466 5,223Other creditors 28,554 31,460Recycled Capital Grant Fund (see note 16a) 3,786 3,178Disposals Proceeds Fund (see note 16a) 888 449Accruals and deferred income 36,453 50,350Intra group creditors 3,722 5,142Grant on Homebuy equity loans 329 329Amortisation of grant 10,379 10,545SHPS pension agreement plan 1,987 — ———— ———— 121,581 150,738 ———— ————Social Housing Grant received in advance will be utilised against the related capital expenditure during the next twelve months. Deferred government grant received from the Homes and Communities agency is initially stated at fair value as a long term liability and is amortised as income over the life of the structure of properties.
Creditors: amounts falling due within one year15
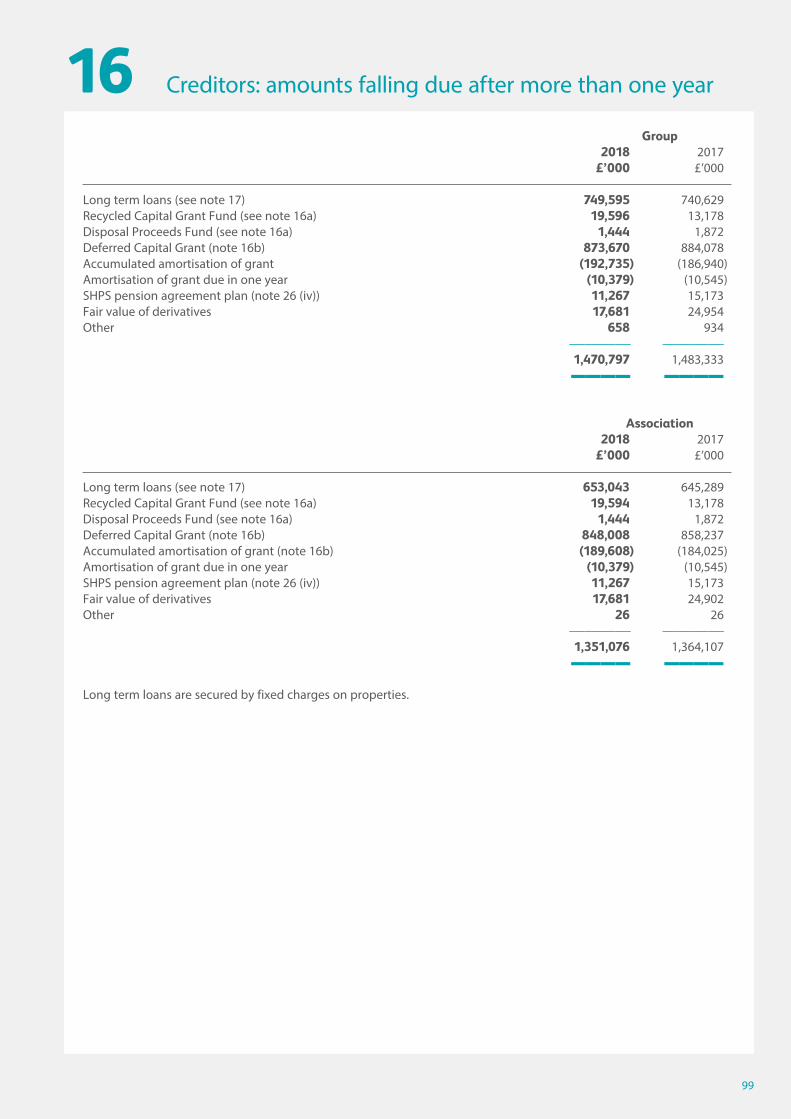
99
Creditors: amounts falling due after more than one year16 Group
2018 2017 £’000 £’000
Long term loans (see note 17) 749,595 740,629Recycled Capital Grant Fund (see note 16a) 19,596 13,178Disposal Proceeds Fund (see note 16a) 1,444 1,872Deferred Capital Grant (note 16b) 873,670 884,078Accumulated amortisation of grant (192,735) (186,940)Amortisation of grant due in one year (10,379) (10,545)SHPS pension agreement plan (note 26 (iv)) 11,267 15,173Fair value of derivatives 17,681 24,954Other 658 934 ———— ———— 1,470,797 1,483,333 ———— ————
Association 2018 2017 £’000 £’000
Long term loans (see note 17) 653,043 645,289Recycled Capital Grant Fund (see note 16a) 19,594 13,178Disposal Proceeds Fund (see note 16a) 1,444 1,872Deferred Capital Grant (note 16b) 848,008 858,237Accumulated amortisation of grant (note 16b) (189,608) (184,025)Amortisation of grant due in one year (10,379) (10,545)SHPS pension agreement plan (note 26 (iv)) 11,267 15,173Fair value of derivatives 17,681 24,902Other 26 26 ———— ———— 1,351,076 1,364,107 ———— ————Long term loans are secured by fixed charges on properties.

Creditors: analysis of disposal proceeds fund and recycled capital grant fund16a
Group and Association 2018 2017 £’000 £’000
Disposal Proceeds FundOpening balance 2,321 1,866Inputs to DPF:
Grants recycled — 930Interest accrued 11 13
Recycling of grant:Newbuild — (488)
———— ————Closing balance 2,332 2,321 ———— ———— 2018 2017 £’000 £’000
Recycled Capital Grant FundOpening balance 16,356 8,159Inputs to RCGF:
Grants recycled 8,306 9,103Interest accrued 100 54
Recycling of grant:Newbuild (1,380) (960)
———— ————Closing balance 23,382 16,356 ———— ————No amounts are due for repayment to the Homes and Communities Agency.
100

Group 2018 2017 £’000 £’000
Deferred capital grantAt start of the year 884,078 893,078Grant received in the year 3,773 6,299Disposals (14,181) (15,299) ———— ————As at 31 March 2018 873,670 884,078 ———— ————Amortisation at start of the year (186,940) (182,318)Released to income (10,621) (10,765)Released to disposals 4,826 6,143 ———— ————As at 31 March 2018 (192,735) (186,940) ———— ————Amounts due to be released within one year £10,379.Amounts due to be released after more than one year £670,556.
Association 2018 2017 £’000 £’000
Deferred capital grantAt start of the year 858,237 867,320Grant received in the year 3,775 6,215Disposals (14,004) (15,298) ———— ————As at 31 March 2018 848,008 858,237 ———— ————Amortisation at start of the year (184,025) (179,615)Released to income (10,389) (10,553)Released to disposals 4,806 6,143 ———— ————As at 31 March 2018 (189,608) (184,025) ———— ———— Amounts due to be released within one year £10,379.Amounts due to be released after more than one year £648,021.
Deferred Capital Grant16b
101

Group 2018 2017 £’000 £’000
Due within one yearBank loans 15,133 16,248Other loans 3,472 28,163 ———— ———— 18,605 44,411 ———— ————Due after more than one yearBank loans 433,830 461,906Local authority loans 67 67Other loans 176,660 139,570Less finance costs capitalised (6,519) (6,197) ———— ———— 604,038 595,346 ———— ————Bond 150,000 150,000Discount on issue (2,897) (3,115)Bond issue costs (1,545) (1,602) ———— ————Net bond balance 145,558 145,283 ———— ————The loans and bond are secured by way of a first fixed charge over assets of the Group.
Bank loans are repaid in instalments at a combination of fixed and variable rates of interest inclusive of lending margins of between 1.1% and 7.4%. The instalments fall to be repaid in the periods 2019 to 2046.
The local authority loan is interest free and is repayable in 2021.
Other loans are repayable in instalments at fixed rates of interest of between 3.8% and 11.7%. The instalments fall to be repaid in the periods 2019 to 2044.
The bond is repayable in one instalment in 2045. Fixed interest is payable at 3.9%.
2018 2017 £’000 £’000
Debt maturity profileIn one year or less 18,605 44,411Between one and two years 18,576 9,875Between two and five years 58,686 37,718In five years or more 683,294 703,950 ———— ———— 779,161 795,954Less:Loans due in one year or less (18,605) (44,411)Finance costs capitalised (8,064) (7,799)Discount on issue of bond (2,897) (3,115) ———— ———— 749,595 740,629 ———— ————
102
Debt analysis17
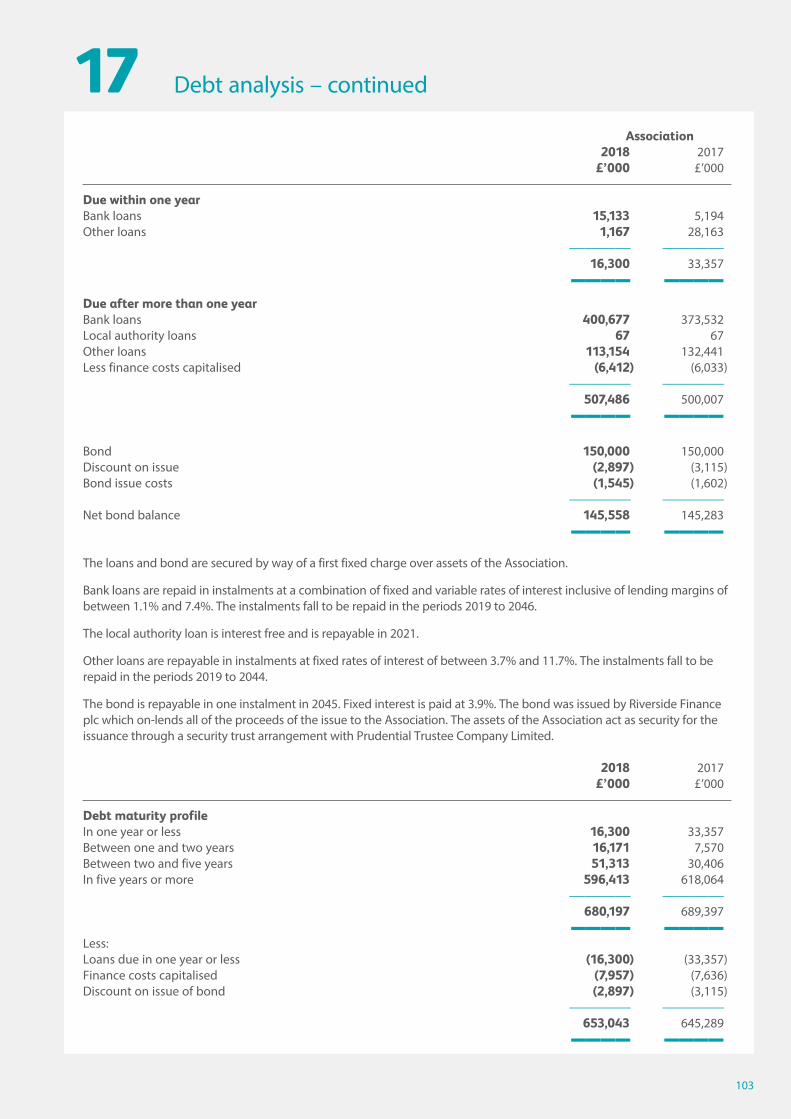
Debt analysis – continued17 Association
2018 2017 £’000 £’000
Due within one yearBank loans 15,133 5,194Other loans 1,167 28,163 ———— ———— 16,300 33,357 ———— ————Due after more than one year Bank loans 400,677 373,532Local authority loans 67 67Other loans 113,154 132,441Less finance costs capitalised (6,412) (6,033) ———— ———— 507,486 500,007 ———— ————Bond 150,000 150,000Discount on issue (2,897) (3,115)Bond issue costs (1,545) (1,602) ———— ————Net bond balance 145,558 145,283 ———— ————The loans and bond are secured by way of a first fixed charge over assets of the Association.
Bank loans are repaid in instalments at a combination of fixed and variable rates of interest inclusive of lending margins of between 1.1% and 7.4%. The instalments fall to be repaid in the periods 2019 to 2046.
The local authority loan is interest free and is repayable in 2021.
Other loans are repayable in instalments at fixed rates of interest of between 3.7% and 11.7%. The instalments fall to be repaid in the periods 2019 to 2044.
The bond is repayable in one instalment in 2045. Fixed interest is paid at 3.9%. The bond was issued by Riverside Finance plc which on-lends all of the proceeds of the issue to the Association. The assets of the Association act as security for the issuance through a security trust arrangement with Prudential Trustee Company Limited.
2018 2017 £’000 £’000
Debt maturity profileIn one year or less 16,300 33,357Between one and two years 16,171 7,570Between two and five years 51,313 30,406In five years or more 596,413 618,064 ———— ———— 680,197 689,397 ———— ————Less:Loans due in one year or less (16,300) (33,357)Finance costs capitalised (7,957) (7,636)Discount on issue of bond (2,897) (3,115) ———— ———— 653,043 645,289 ———— ————
103

Borrowing facilities17a
Borrowing facilitiesUndrawn committed borrowing facilities at 31 March 2018 were as follows:
Group 2018 2017 £’000 £’000
Expiring in one year or less 3,987 96,425Expiring between one and five years 210,699 92,256Expiring in more than five years 58,803 88,461 ———— ———— 273,489 277,142 ———— ————£100m (2017 : £2.4m) of the undrawn committed borrowing facilities requires fixed charged security to be placed with the lender before it can be utilised.
Association 2018 2017 £’000 £’000
Expiring in one year or less 3,987 93,961Expiring between one and two years 210,699 92,256Expiring in more than two years 58,803 88,461 ———— ———— 273,489 274,678 ———— ————£100m (2017 : £0m) of the undrawn committed borrowing facilities requires fixed charged security to be placed with the lender before it can be utilised.
104

Financial instruments and risk management18A. Carrying amount of financial instruments
The carrying value of the financial assets and liabilities include:
Group Group Association Association 2018 2017 2018 2017 £’000 £’000 £’000 £’000
Assets at fair value through profit or loss Fixed asset investments (Note 12) 16,374 16,319 16,169 16,124
Assets measured at amortised costFixed asset investments (Note 12) 4,854 5,666 329 329Current asset investments (Note 12) 37,516 50,800 33,342 45,243Debtors (Note 13) 131,812 129,876 51,991 53,902Cash and cash equivalents 63,687 68,927 56,161 63,514
Liabilities measured at amortised costLoans (Notes 15, 16 and 17) (768,200) (785,040) (669,343) (678,646)Trade creditors (Notes 15 and 16) (101,589) (117,829) (76,750) (97,683)DerivativesDesignated as hedges (Note 16) (17,681) (24,954) (17,681) (24,902) ———— ———— ———— ———— (633,227) (656,235) (605,782) (622,119) ———— ———— ———— ————B. Financial instruments measured at fair value
Where financial instruments are measured in the statement of financial position at fair value, disclosure of fair value measurements by level is required, in accordance with the following fair value measurement hierarchy;
Level 1 – Quoted prices in active markets for identical assets or liabilities.Level 2 – Inputs other than quoted prices included within level 1 that are observable for the asset or liability, either directly (from prices) or indirectly (that is derived from prices).Level 3 – Inputs from the asset or liability that are not based on observable market data (that is, unobservable inputs).
Investments measured at fair value through profit and loss comprise investments in bonds and funds investing in UK stocks. The fair value is determined by reference to their market price.
Derivative financial instruments are interest rate swaps designed to hedge the interest rate risk associated with the variability of cashflows on variable rate loans. All of the Group’s derivatives are carried at fair value. Fair value measurement is provided by the Group’s external advisors and is categorised as Level 2. The valuation techniques include discounted cash flow pricing models with observable inputs. The most significant inputs into those models are interest rate yield curves, developed from publicly quoted rates and market available information. All valuations have been compared to similar market transactions or alternative third-party pricing services to ensure current market conditions are properly represented.
For all other financial instruments fair value equates to book value.
105
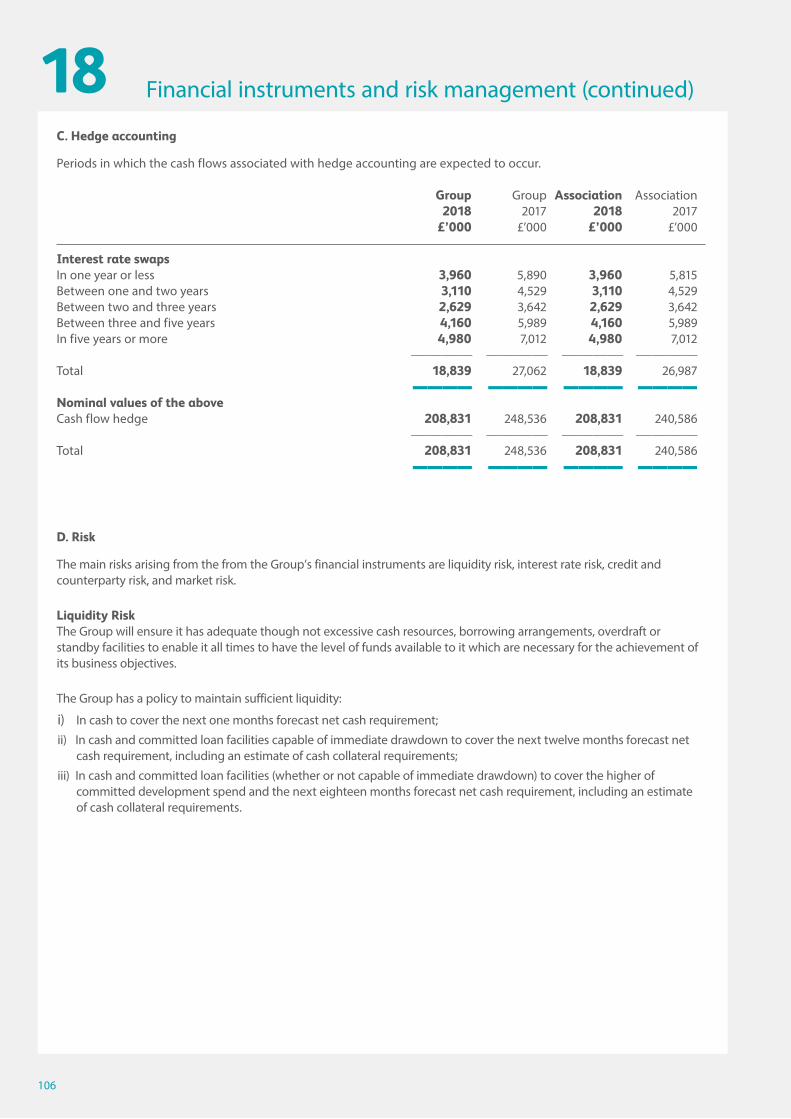
Financial instruments and risk management (continued)18C. Hedge accounting
Periods in which the cash flows associated with hedge accounting are expected to occur.
Group Group Association Association 2018 2017 2018 2017 £’000 £’000 £’000 £’000
Interest rate swaps In one year or less 3,960 5,890 3,960 5,815Between one and two years 3,110 4,529 3,110 4,529Between two and three years 2,629 3,642 2,629 3,642Between three and five years 4,160 5,989 4,160 5,989In five years or more 4,980 7,012 4,980 7,012 ———— ———— ———— ————Total 18,839 27,062 18,839 26,987 ———— ———— ———— ————Nominal values of the above Cash flow hedge 208,831 248,536 208,831 240,586 ———— ———— ———— ————Total 208,831 248,536 208,831 240,586 ———— ———— ———— ————D. Risk
The main risks arising from the from the Group’s financial instruments are liquidity risk, interest rate risk, credit and counterparty risk, and market risk.
Liquidity RiskThe Group will ensure it has adequate though not excessive cash resources, borrowing arrangements, overdraft or standby facilities to enable it all times to have the level of funds available to it which are necessary for the achievement of its business objectives.
The Group has a policy to maintain sufficient liquidity:
i) In cash to cover the next one months forecast net cash requirement;
ii) In cash and committed loan facilities capable of immediate drawdown to cover the next twelve months forecast net cash requirement, including an estimate of cash collateral requirements;
iii) In cash and committed loan facilities (whether or not capable of immediate drawdown) to cover the higher of committed development spend and the next eighteen months forecast net cash requirement, including an estimate of cash collateral requirements.
106

Financial instruments and risk management (continued)18Interest Rate RiskThe Group has a policy of managing its exposure to fluctuations in interest rates so as to minimise any detrimental impact on its budgeted expenditure and income levels. In respect of its borrowings the Group is risk adverse and will endeavour to ensure that its borrowings contain a mix of fixed and variable interest rate structures. The optimum mix will be determined in the Annual Treasury Strategy.
Variable rates include borrowing linked to LIBOR and borrowings linked to an index. Fixed rate interest includes borrowing in relation to which the interest rate has been fixed in excess of twelve months.
The Chief Financial Officer is responsible for monitoring the Group’s interest rate risk exposures and in managing this risk they will pay due regards to:
— minimising the risk of future covenant breach;
— current interest rate levels and the structure of the interest rate market;
— current interest rates and inflation compared with historic trends;
— anticipated future trend movements;
— the impact on revenue of estimated movements in interest rate and inflation trends;
— sensitivity of revenue to movement in interest rates and inflation trends; and
— policy and/or budgetary implications.
The Group has adopted the wider constitutional rule permitting the use of interest rate derivatives to manage its interest rate exposures. The Group will only use derivatives for managing interest rate and inflation risk and not for speculative purposes. All derivative transactions will be subject to standard ISDA documentation.
The Chief Financial Officer will monitor the mark to market of derivatives and ensure sufficient security is available to meet any requirements.
Credit and Counterparty riskCredit risk applies to all debtor balances, the majority relating to tenant and other arrears. There are dedicated teams assigned to manage the recovery of these arrears which are reported monthly as one of the Group’s key performance indicators.
The Group Treasury Policy specifies minimum credit ratings for counterparties. The Chief Financial Officer monitors the credit quality of all counterparties and if the credit rating of a counterparty is downgraded below the minimum requirement it is reported to the Group Board with appropriate recommendations, which might include proposals to cease investing surplus funds, to refinance loans or unwind a derivative position.
If possible the Group will spread transactions over a number of financial institutions at a level appropriate to their efficient management.
Market RiskThe Group seeks to ensure that its treasury management policies and objectives will not be compromised by adverse market fluctuations in the value of the principal sums it invests, and will seek to protect itself from the effects of such fluctuations.
107

Group and Association 2018 2017 £ £
At 1 April 2017 22 15Appointed in year 12 13Resigned in year (7) (6) ———— ———— At 31 March 2018 27 22 ———— ————
Share capital 20
Deferred income represents the amount received in excess of nominal value of the bond. This includes £8.2m for the AHF Bond and £0.8m for the £25m THFC loan. These amounts are being released over the life of the loan and the balances at 31 March 2018 are £7.5m and £0.6m respectively.
Deferred income19
108

Reconciliation of operating surplus to net cash inflow from operating activities21
Reconciliation of net cash flow to movement in net debt22
Group 2018 2017 £’000 £’000
Operating surplus 80,007 80,051Depreciation and impairment 30,853 30,237Increase in other debtors and prepayments 6,517 (27,996)Increase in other creditors and accruals (13,586) 19,456Decrease in rent arrears (2,317) (443)Fixed asset disposals 33,891 33,712Amortisation of Grant (10,588) (11,979) ———— ————Net cash inflow from operating activities 124,777 123,038 ———— ————
Group 2018 2017 £’000 £’000
Decrease in cash in the year (5,240) 34,524Increase in loans 15,482 (1,533)(Decrease)/increase in liquid resources (13,284) (5,522) ———— ————Change in net debt resulting from cash flows (3,042) 27,469
Release of finance costs 1,358 1,586 ———— ———— (1,684) 29,055Net debt at 1 April 2018 (665,313) (694,368) ———— ————Net debt at 31 March 2018 (see note 23) (666,997) (665,313) ———— ————
109

Analysis of net debt23
Capital commitments24
Group 1 April Cash Other 31 March 2017 flows changes 2018 £’000 £’000 £’000 £’000
Cash at bank and in hand 68,927 (5,240) — 63,687Loans due within one year (see note 15) (44,411) 26,208 (402) (18,605)Loans due after one year (see note 17) (740,629) (10,726) 1,760 (749,595)Current asset investments (see note 12B) 50,800 (13,284) — 37,516 ———— ———— ———— ————Total (665,313) (3,042) 1,358 (666,997) ———— ———— ———— ————
Group and Association 2018 2017 £’000 £’000
Capital expenditure that has been contracted for but whichhas not been provided for in the financial statements 50,250 41,813 ———— ————Capital expenditure that has been authorised by theBoard but which has not yet been contracted for 4,732 9,744 ———— ———— Income to be generated from the above expenditure contracted not provided for 14,222 24,290 ———— ————Income to be generated from the above expenditure authorised by the Board — 3,001 ———— ————The remaining commitments will be fully financed from internal cash resources and existing loan facilities as required.
110

Financial commitments25At 31 March 2018 commitments under non-cancellable operating leases were as follows:
Group 2018 2017
Land & Land & buildings Other buildings Other £’000 £,000 £’000 £,000
Expiring within one year 156 3 44 195Expiring between one and five years 590 595 205 229Expiring in five or more years 573 — 1,643 236 ———— ———— ———— ———— 1,319 598 1,892 660 ———— ———— ———— ————
Association 2018 2017
Land & Land & buildings Other buildings Other £’000 £,000 £’000 £,000 Expiring within one year 50 — 32 186Expiring between one and five years 550 552 110 211Expiring in five or more years 573 — 1,643 230 ———— ———— ———— ———— 1,173 552 1,785 627 ———— ———— ———— ————
111

Pension information26i) The Riverside Group Pension SchemeThe Riverside Group operates a pension scheme providing benefits based on final pensionable pay. The scheme was closed to future accrual on 31 March 2016. The actuarial method used for the calculation of the liabilities is the projected unit method. The latest valuation of the scheme was carried out with effect from 31 March 2017 and the liabilities for these accounting disclosures have been calculated by rolling forward the valuation liabilities from that valuation date to 31 March 2018. The assumptions used have been chosen as being consistent and appropriate both with FRS102 and with assumptions used in previous years. The actuarial assumptions, due to the timescale covered, may not necessarily be borne out in practice.
The major assumptions used in this valuation are:
2018 2017
Rate of discount on scheme liabilities 2.6% 2.5%Retail price inflation 3.3% 3.4%Consumer price inflation 2.3% 2.7%
Pension increases:- Pre 1 February 2002 3.2% 3.3%- Pre 5 April 2006 3.2% 3.3%- Post 5 April 2006 2.2% 2.3%
Life expectancy at age 65:- Male current pensioner 23.0 22.8- Female current pensioner 25.6 24.9- Male future pensioner 24.4 24.6- Female future pensioner 27.0 26.8
The scheme uses the Consumer Prices Index (CPI) to revalue pensions in deferment and increases given to GMP pensions in payment.
The Retail Price Index (RPI) is used to determine the pensions increase assumptions for those benefits in excess of GMP.
The Scheme Rules state that benefits earned before 1 February 2005 and 5 April 2006 are increased in line with RPI inflation up to a maximun of 2.5% each year. An allowance has been made for these caps in the pensions increase assumptions.
Pension increases above 5% are only provided at the Trustees’ discretion. The valuation assumes that a maximum pension increase of 5% p.a. applies to pre February 2002 benefits.
The fair value of the scheme’s assets at 31 March 2018, which are not intended to be realised in the short term and may be subject to significant change before they are realised, and the present value of the scheme’s liabilities, which are derived from cash flow projections over long periods and are thus inherently uncertain, were:
2018 2017 £’000 £’000
Fair value of assets 157,700 156,100Present value of liabilities (170,500) (169,800) ———— ————Deficit in the scheme (12,800) (13,700) ———— ————
112

Pension information – continued26The market value of the assets of the scheme and the expected long term rates of return at 31 March 2018 were:
2018 2017 £’000 £’000
Market value Equities 75,190 71,900Insured policy 15,000 15,500LDI Portfolio 20,070 16,700Cash 650 2,500Other 46,790 49,500 ———— ————Total 157,700 156,100 ———— ————The net interest expense for the year is included in comprehensive income. Remeasurements of the net defined benefit liability are included in other comprehensive income.
2018 2017 £’000 £’000
Analysis of interest Interest on assets 3,900 4,400Interest on pension liabilities (4,200) (4,600) ———— ————Net interest expense (300) (200) ———— ————Amount recognised in Other Comprehensive Income (OCI)Return on scheme assets excluding amount included in net interest 1,600 25,200Actuarial losses (2,000) (34,700)Adjustment for restrictions on the asset recognised — — ———— ————Remeasurement of the net liability (400) (9,500) ———— ————Total defined benefit cost (700) (9,700) ———— ————
113

Pension information – continued26 2018 2017 £’000 £’000
Movement in deficit during yearDeficit in scheme at beginning of the year (13,700) (4,800)Movement in year:Contributions from the employer 1,600 800Net interest expense (300) (200)Return on assets excluding amount included in net interest 1,600 25,200Actuarial losses (2,000) (34,700) ———— ————Deficit in scheme at end of the year (12,800) (13,700) ———— ————
2018 2017 £’000 £’000
The return on scheme assetsInterest income 3,900 4,400 Return on scheme assets excluding amount included in net interest 1,600 25,200 ———— ———— 5,500 29,600 ———— ————
2018 2017
History of experienced surpluses and deficitsDifference between actual and expected returns on assets (£’000) 1,600 25,200% of scheme assets 1.0% 16.1%
Experienced losses on liabilities (£’000) (2,000) (34,700)% of scheme liabilities (1.2%) (20.4%)
Total amount recognised in (OCI) (£’000) (400) (9,500)% of scheme liabilities (0.2%) (5.6%)
114

Pension information – continued26 2018 2017 £’000 £’000
Reconciliation of assetsAssets at beginning of period 156,100 129,000Employer contributions 1,600 800Benefits paid (5,500) (3,300)Interest income 3,900 4,400Return on scheme assets excluding amounts included in net interest 1,600 25,200 ———— ————Assets at end of period 157,700 156,100 ———— ————Reconciliation of liabilitiesProjected benefit obligation at the beginning of period (169,800) (133,800)Operating charge — —Interest expense (4,200) (4,600)Benefits paid 5,500 3,300Actuarial loss (2,000) (34,700)Change in assumptions — — ———— ————Projected benefit obligation at end of period (170,500) (169,800) ———— ————Recognition of surplusDeficit brought forward (13,700) (4,800)Net interest expense (300) (200)Return assets less interest income 1,600 25,200Actuarial loss (2,000) (34,700)Contribution gain 1,600 800 ———— ————Deficit carried forward (12,800) (13,700) ———— ————
115

ii) Other defined benefit pension schemesDuring the year the Riverside Group also made contributions to other defined benefit pension schemes: Merseyside Pension Fund, East Riding Pension Fund and the Surrey Pension Fund.
At 31 March 2017 the Group ceased accrual to the Cumbria Local Government Pension Fund and the Strathclyde Pension Fund.
The most recent actuarial valuations of these schemes have been updated for FRS 102 purposes by independent qualified actuaries. The disclosures represent the Group’s share of the overall scheme’s assets and liabilities. The assumptions used, which have been combined on a weighted average basis on asset values, are the best estimates chosen from a range of possible actuarial assumptions, which due to the timescale covered may not necessarily be borne out in practice.
The major assumptions used in this valuation are:
2018 2017
Inflation CPI 2.1% 2.3%Rate of discount on scheme liabilities 2.6% 3.0%Rate of salary increase 3.4% 3.5%Rate of increase of pensions in payment 2.2% 2.3%Rate of increase of deferred pensions 2.5% 2.3%
Life expectancy at age 65- male future non-pensioner 24.7 24.6- female future non-pensioner 27.5 27.1- male current pensioner 22.0 22.2- female current pensioner 24.7 24.5
The Chancellor of the Exchequer announced on 22 June 2010 as part of the Emergency Budget that with effect from April 2011 public service pensions would have their pension increases calculated by reference to CPI rather than RPI. The majority of local government pension schemes have taken the view that a constructive obligation to increase pensions in line with RPI exists and as a result the change was regarded as a change in benefits and was shown in 2011 as a credit to past service cost.
The fair value of the schemes’ assets at 31 March 2018 which are not intended to be realised in the short term and may be subject to significant change before they are realised, and the present value of the schemes’ liabilities, which are derived from cash flow projections over long periods and are thus inherently uncertain, were:
2018 2017 £’000 £’000
Fair value of assets 10,439 10,122Present value of liabilities (12,788) (12,830) ———— ————Deficit in the schemes (2,349) (2,708) ———— ————
Pension information – continued26
116

Pension information – continued26The market value of the assets of the scheme and the expected long term rates of return at 31 March 2018 were:
2018 2017 £’000 £’000Market value Equities 4,900 5,761Bonds 2,857 1,494Property 805 816Other 1,383 1,705Cash 494 346 ———— ————Total 10,439 10,122 ———— ———— 2018 2017 £’000 £’000Analysis of the amount charged to operating profit Current service cost 303 206 ———— ————Total operating charge 303 206 ———— ————Analysis of interest Interest on assets 254 285Interest on pension liabilities (323) (336) ———— ————Net interest expense (69) (51) ———— ———— 2018 2017 £’000 £’000Amount recognised in Other Comprehensive Income (OCI)Return on assets excluding amounts included in net interest 1 179Remeasurement of assets (39) 1,549Experienced losses arising on scheme liabilities — (729)Changes in assumptions underlying the present value of the scheme liabilities 496 (2,241) ———— ————Remeasurements 458 (1,242) ———— ————Total defined benefit credit/(cost) 389 (1,293) ———— ————
117

2018 2017 £’000 £’000
Movement in deficit during yearDeficit in scheme at beginning of the year (2,708) (2,713)Movement in year: Schemes exited in year — 1,278Current service cost (303) (206)Contributions 273 226Net interest expense (69) (51)Remeasurements 458 (1,242) ———— ————Deficit in scheme at end of the year (2,349) (2,708) ———— ———— 2018 2017
History of experienced surpluses and deficitsDifference between actual and expected returns on assets (£’000) (38) 1,727% of scheme assets (0.4%) 17.1%
Experienced gains/(losses) on liabilities (£’000) 496 (2,969)% of scheme liabilities 3.9% (23.1%)
Total amount recognised in OCI (£’000) 458 (1,242)% of scheme liabilities 3.6% (9.7%)
Pension information – continued26
118
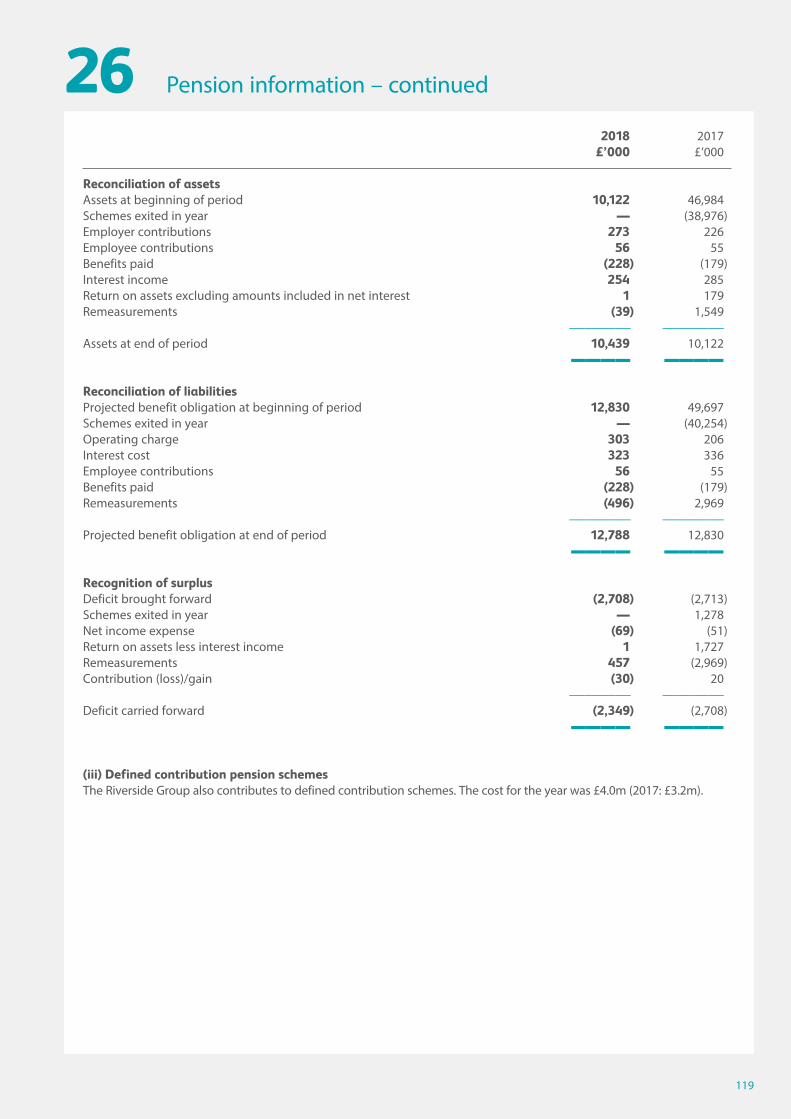
Pension information – continued26 2018 2017 £’000 £’000
Reconciliation of assetsAssets at beginning of period 10,122 46,984Schemes exited in year — (38,976)Employer contributions 273 226Employee contributions 56 55Benefits paid (228) (179)Interest income 254 285Return on assets excluding amounts included in net interest 1 179Remeasurements (39) 1,549 ———— ————Assets at end of period 10,439 10,122 ———— ————Reconciliation of liabilitiesProjected benefit obligation at beginning of period 12,830 49,697Schemes exited in year — (40,254)Operating charge 303 206Interest cost 323 336Employee contributions 56 55Benefits paid (228) (179)Remeasurements (496) 2,969 ———— ————Projected benefit obligation at end of period 12,788 12,830 ———— ————Recognition of surplusDeficit brought forward (2,708) (2,713)Schemes exited in year — 1,278Net income expense (69) (51)Return on assets less interest income 1 1,727Remeasurements 457 (2,969)Contribution (loss)/gain (30) 20 ———— ————Deficit carried forward (2,349) (2,708) ———— ————(iii) Defined contribution pension schemesThe Riverside Group also contributes to defined contribution schemes. The cost for the year was £4.0m (2017: £3.2m).
119

Pension information – continued26(iv) The Social Housing Pension SchemeFrom August 2013 the defined contribution scheme is the vehicle the organisation uses for Auto Enrolment. The scheme is split into two separate sections with auto enrolment contribution rates currently set at employer 4%, employee 1% and enhanced rates of employer 9%, employee 6% with an exclusive tier for eligible members of employer 12%, employee 9%.
Both the Final Salary and CARE sections of the SHPS Defined Benefit Scheme were closed to future accrual on 31 March 2016.
Following the closure of the Riverside Group Pension Scheme to future accrual on 31 March 2016 members transferred to the SHPS defined contribution scheme.
As at the balance sheet date 396 employees of the Group were active members of the SHPS Defined Contribution scheme with rates set at employer 12%, employee 9%, 408 members with rates set at employer 9%, employee 6% and 1,204 members in the Auto Enrolment Scheme.
The scheme is classified as a ‘last-man standing arrangement’. Therefore the Group is potentially liable for other participating employers’ obligations if those employers are unable to meet their share of the scheme deficit following withdrawal from the scheme. Participating employers are legally required to meet their share of the scheme deficit on an annuity purchase basis on withdrawal from the scheme.
The Trustee commissions an actuarial valuation of the Scheme every three years. The main purpose of the valuation is to determine the financial position of the Scheme in order to address the level of future contributions required so that the Scheme can meet its pension obligations as they fall due.
The last formal valuation of the Scheme was performed as at 30 September 2014 by a professionally qualified Actuary using the Projected Unit Method. The market value of the Scheme’s assets at the valuation date was £3,123 million. The valuation revealed a shortfall of assets compared with the value of liabilities of £1,323 million, equivalent to a past service funding level of 70%.
Where the scheme is in deficit and where the company has agreed to a deficit funding arrangement, the company recognises a liability for this obligation. The amount recognised is the net present value of the deficit reduction contributions payable under the agreement that relates to the deficit. The present value is calculated using the discount rate detailed in these disclosures. The unwinding of the discount rate is recognised as a finance cost.SHPS deficit payment agreementThe association has a contractual obligation under an agreement to pay additional deficit payments to SHPS each year for nine years to September 2026. During the year the Riverside Group contributed £1.9m.
In calculating the net present value of the liability included within provisions the association has used a discount rate of 1.72% based on a market rate AA corporate bond for the same period as the recovery plan contributions.
Group 2018 2017 £,000 £,000
Reconciliation of opening and closing provisionsAt start of the year 15,173 16,255Deficit contributions paid (1,915) (1,846)Unwinding of discount factor (interest rate) 189 313Remeasurements – Impact of changes in assumptions (193) 451Remeasurements – Amendments to the contribution schedule — — ———— ———— 13,254 15,173 ———— ————Income and expenditure impactInterest expense 189 313Remeasurements - Impact of changes in assumptions (193) 451Remeasurements - Amendments to the contribution schedule — — ———— ————Net (income)/expense recognised in income and expenditure account (4) 764 ———— ————
120
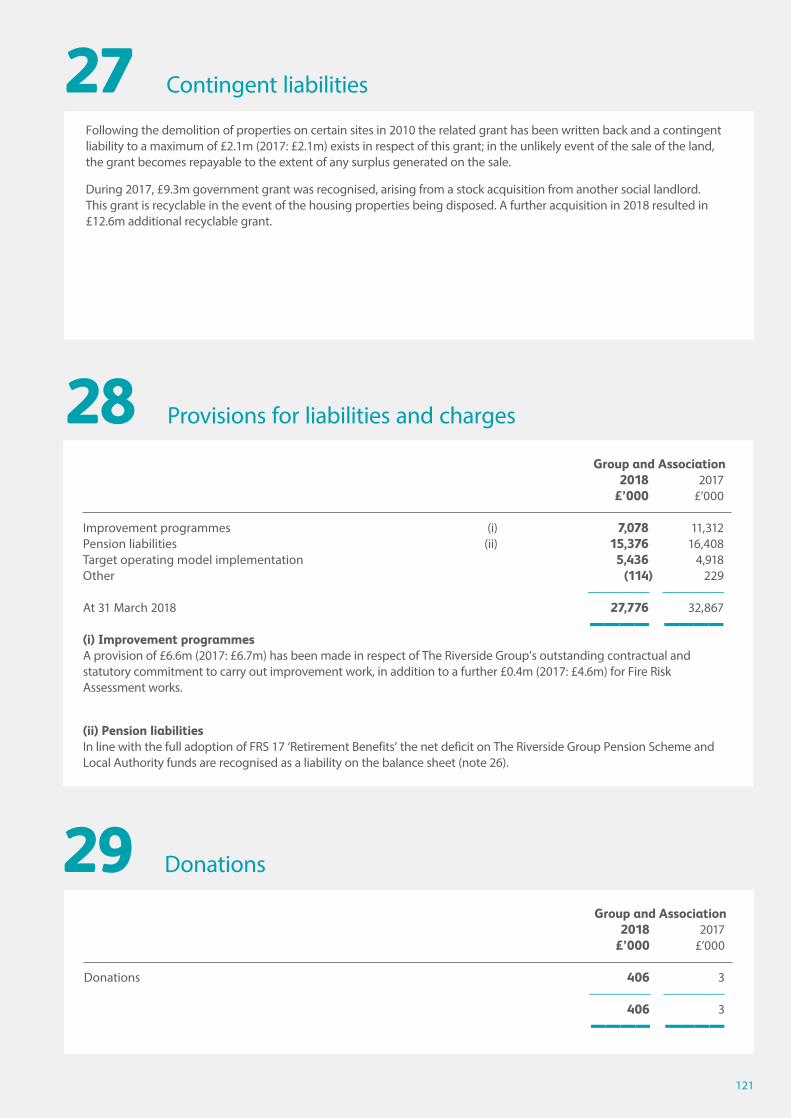
Contingent liabilities27
Provisions for liabilities and charges28
Following the demolition of properties on certain sites in 2010 the related grant has been written back and a contingent liability to a maximum of £2.1m (2017: £2.1m) exists in respect of this grant; in the unlikely event of the sale of the land, the grant becomes repayable to the extent of any surplus generated on the sale.
During 2017, £9.3m government grant was recognised, arising from a stock acquisition from another social landlord. This grant is recyclable in the event of the housing properties being disposed. A further acquisition in 2018 resulted in £12.6m additional recyclable grant.
Group and Association 2018 2017 £’000 £’000
Improvement programmes (i) 7,078 11,312Pension liabilities (ii) 15,376 16,408Target operating model implementation 5,436 4,918Other (114) 229 ———— ————At 31 March 2018 27,776 32,867 ———— ————(i) Improvement programmes A provision of £6.6m (2017: £6.7m) has been made in respect of The Riverside Group’s outstanding contractual and statutory commitment to carry out improvement work, in addition to a further £0.4m (2017: £4.6m) for Fire Risk Assessment works.
(ii) Pension liabilitiesIn line with the full adoption of FRS 17 ‘Retirement Benefits’ the net deficit on The Riverside Group Pension Scheme and Local Authority funds are recognised as a liability on the balance sheet (note 26).
Group and Association 2018 2017 £’000 £’000
Donations 406 3 ———— ———— 406 3 ———— ————
Donations29
121

Accommodation in management and development30 Group Group Association Association 2018 2017 2018 2017 Number Number Number Number
Social housing ownershipGeneral housing social rent 30,255 31,444 28,095 29,277Intermediate rent 246 252 246 252Affordable rent 6,945 5,821 6,945 5,821Housing for older people 4,689 4,738 4,647 4,696Supported housing 4,092 4,178 4,078 4,164Care homes 266 271 266 271Leasehold where purchaser owns less than 100% 1,674 1,476 1,674 1,476Leasehold where purchaser owns 100% 1,056 1,012 1,056 1,012 ———— ———— ———— ————Total social housing owned 49,223 49,192 47,007 46,969
Social housing management onlyGeneral housing social rent 1,191 1,199 1,191 1,199Supported housing 429 185 429 185Leasehold where purchaser owns less than 100% 39 44 39 44Leasehold where purchaser owns 100% 85 85 85 85Housing for older people — — — — ———— ———— ———— ————Total managed 1,744 1,513 1,744 1,513
Non-social housingRented owned 358 354 358 354Rented managed for others — 8 — 8Leased owned 660 549 660 549Leased managed for others 957 994 957 994 ———— ———— ———— ————Total non-social housing 1,975 1,905 1,975 1,905 ———— ———— ———— ————Total stock 52,942 52,610 50,726 50,387 ———— ———— ———— ————Accommodation in development at the year end 1,031 751 1,031 629 ———— ———— ———— ————
122

Related party transactions31One Board member of The Riverside Group Limited is a tenant of The Riverside Group Limited. Their tenancy is on normal commercial terms, and they cannot use their position to their advantage. There are no other related party transactions.
The Riverside Group Limited provides a number of central services for its subsidiaries including unregulated entities Prospect (GB) Limited and Evolve Facility Services Limited and these are recharged accordingly.
Evolve Facility Services Limited is a wholly owned subsidiary which performs maintenance services for the Group. Its income is derived entirely from the repair contracts it has in place with the Group.
During the year the parent association, The Riverside Group Limited, transacted with its subsidiary undertakings as follows:
2018 2017 £’000 £’000
Net payments to/(from) related entities Caribou Green Warmth LLP — —The Compendium Group Limited (3,975) (3,948)Evolve Facility Services Limited 45,964 40,418Irvine Housing Association Limited (2,218) (2,885)Prospect (GB) Limited (1,425) 5,214Riverside Consultancy Services Limited 21,173 33,882Riverside Finance plc — —Riverside Estuary Ltd (392) (4,349)Circle Limited 107 112 ———— ————Total 59,234 68,444 ———— ————
123

The Riverside Group Limited Registered Office: 2 Estuary Boulevard, Estuary Commerce Park, Liverpool L24 8RF
A charitable Registered Society under the Co-operative and Community Benefit Societies Act 2014
September 2018
Details correct at time of publishing
R8/046-0918V1.0E
The Riverside Group LimitedRegistered office: 2 Estuary Boulevard, Estuary Commerce Park, Liverpool L24 8RF
A charitable Registered Society under the Co-operative and Community Benefit Societies Act 2014
Details correct at time of printing
Get in touch or find out more www.riverside.org.uk email: [email protected] Follow us on Twitter @RiversideUK
Customer Service Centre 24 hours, 365 days a year. So you can call at the weekend or even on Christmas Day 0345 111 0000
Speak to a member of our team
We are happy to accept Next Generation Text (NGT) calls. Press ‘3’ once connected
If you need this information in another format, please contact us 0345 111 0000
The Riverside Group LimitedRegistered office: 2 Estuary Boulevard, Estuary Commerce Park, Liverpool L24 8RF
A charitable Registered Society under the Co-operative and Community Benefit Societies Act 2014
Details correct at time of printing