financialanalysis_power sector (1)
DESCRIPTION
projectTRANSCRIPT

7/17/2019 FinancialAnalysis_Power Sector (1)
http://slidepdf.com/reader/full/financialanalysispower-sector-1 1/12
D016 Rishabh DhallD018 Vishwajeet GrewalD020 Rohan JagetiyaD021 Baibhav JhaD022 Geetaman Singh JoharD028 Yash Khatri
Financial
Analysis of
Companies inPower sector
Submitted to
Dr. Arunima Haldar
Analysis of NTPC, Adani Power,
Reliance Power, Tata Power from theview point of manangement, lenders andinvestors

7/17/2019 FinancialAnalysis_Power Sector (1)
http://slidepdf.com/reader/full/financialanalysispower-sector-1 2/12Page 1 of 11
Contents
Power Sector Overview ..................................................................................................................... 2
History of the sector .......................................................................................................................... 2
Present Overview ............................................................................................................................. 2
Future Outlook .................................................................................................................................. 2
Company Overview ............................................................................................................................ 2
NTPC Limited .................................................................................................................................... 2
Adani Power Limited ......................................................................................................................... 2
Reliance Power ................................................................................................................................. 2
Tata Power ........................................................................................................................................ 3
Analysis from the view point of Management ................................................................................ 3
Average Payable Period – Creditors Turnover Ratio ...................................................................... 3
Average Receivable Period – Debtors Turnover Ratio ................................................................... 3
Inventory Turnover Ratio .................................................................................................................. 3
EBITDA Margin % ............................................................................................................................. 4
Analysis from the view point of Lenders ........................................................................................ 4
Long term Debt Equity Ratio ............................................................................................................ 4
Interest Coverage Ratio .................................................................................................................... 4
Liquidity Ratios .................................................................................................................................. 5
Analysis from the view point of Investors ...................................................................................... 5
Return on Equity ............................................................................................................................... 5
Return on Capital Employed ............................................................................................................ 5
Earnings Per Share & Dividend per share ....................................................................................... 6
DuPont Analysis for year 2015 ......................................................................................................... 6
Appendix .............................................................................................................................................. 7
Bibliography ...................................................................................................................................... 11

7/17/2019 FinancialAnalysis_Power Sector (1)
http://slidepdf.com/reader/full/financialanalysispower-sector-1 3/12Page 2 of 11
Power Sector Overview
History of the sector
The power sector has evolved over a period of time. Keeping generation under the state ownership during the
nationalisation stage from 1956-1991 to letting private players participate in generation from 1991. Industrial Policy
Resolution 1956 made generation, transmission and distribution exclusively in the hands of the government. This era
saw a growth in Companies like NHPC, NTPC and Power Grid etc. Post 1991, laws have been amended to Electricity
Act 2003 which eliminates licensing, competitive bidding among a few changes. The National Tariff Policy 2006 provides
with the guidelines for price fixation keeping in mind adequate returns to Companies involved in generation, transmission
and distribution. The production capabilities have grown many folds from just a meagre 1713 Mw in 1950 to 2.71 Lac
Mw as on March 31, 2015.
Present Overview
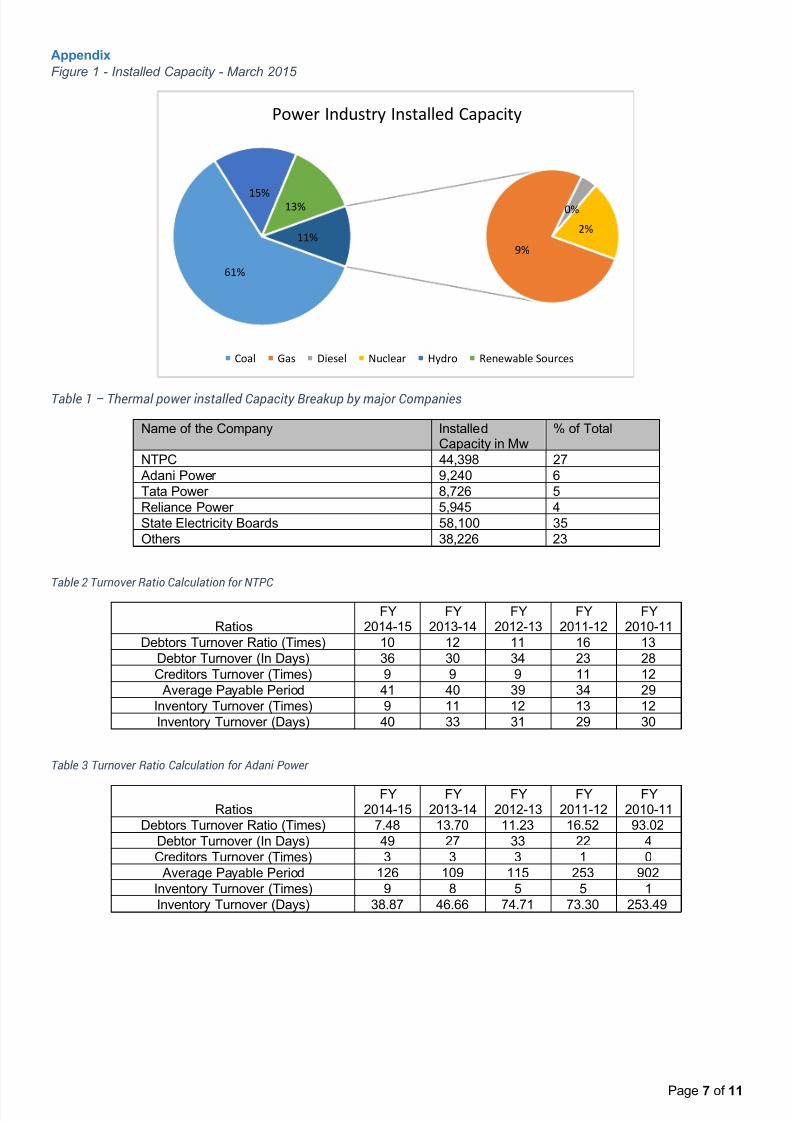
India is the fourth largest consumer and third largest producer of electricity in the world. India has an installed capacity
of 2.71 lac MW as on March 31, 2015. The breakup based on source of power is shown in figure 1. Approximately 70
% of the power is generated through thermal sources like coal, gas & diesel. (Refer Figure 1 )
The installed capacities are divided amongst state utilities, central government owned plants and private players. Under
the thermal power sector, 27 % of the installed capacities i.e. 44,398 Mw is owned by National Thermal Power
Corporation (NTPC) whereas Adani Power Limited (APL), TATA Power Limited (TPL) and Reliance Power (RPL)
totalling to 23,911 Mw 15% of the capacities. Various states in total have a power capacity of 58,100 Mw in total. (Refer
Table 1). Though generation has grown many folds, consumption has outpaced it and still India remains an overall
power deficit country with power cuts in areas.
Future Outlook
Successful coal allocation during Q4 2014-15 and government focus to address supply issues from domestic coal
production from Coal India should improve fuel scenario which will help Companies reduce their dependence on foreign
coal which has become expensive over the period of years. At the same time, premiums offered during coal auctions
will put pressure on Companies to quote higher prices for power purchase agreements (PPA). At the same time,
consolidation is the sector is continuities due to the pressure of high amount of debt from banks.
With coal supplies improving over a period and reforms under implementation should revive interest in the sector. With
a target of adding 100 Gw under the 13 th 5 year Plan along with the growing demand and increasing penetration will
provide a stimulus in the sector.
Company Overview
NTPC Limited
NTPC Limited, formerly known as National Thermal Power Corporation Limited, a Maharatana Company, is a
Government Company incorporated in 1975. It started its commercial operations from Singrauli in Uttar Pradesh in
1983. Over the period of time, NTPC has constructed green field projects as well has taken over plants owned by state
utilities. With a total of 24 plants out of which 17 plants are thermal based, it has become the largest power producer in
India.
The management is planning to add approximately 16.5 Gw under its belt and also targeting to tap in solar energy which
will eventually form a significant part of its portfolio. The Company has been able to earn higher RoEs due to high
efficient plants and economies of scale of its operations and secured fuel supplies from Coal India Limited.
Adani Power LimitedIncorporated as a subsidiary of Adani Enterprises Limited, APL started off as a power trading Company in 1996. With
coal trading and ports being developed by sister concerns, power seemed a natural extension its businesses. With an
installed capacity of 9,240 Mw as on March 31, 2015, the Company is the largest private producer of power. The
Company operates a UMPP (Ultra Mega Power Project) at Mundra along with generation facilities in Tiroda, Kawai.
Over the recent times, APL has acquired existing power plants in Udupi from Lanco Infrafratech in August 2014. The
Company also operates transmission & distribution facilities of over 2,070 km. APL has diversified from thermal power
projects and has forayed into Solar Power in Gujarat. Recently it inked a JV with Government of Rajasthan to set up
India’s largest solar project generating 5,000 Mw of electricity. The Company has a target of 20,000 Mw of power
generation by 2020.
Reliance Power
Reliance power generates 5,945 Mw of electricity with 3960Mw being generated at its Sasan UMPP. The Company
started off as a private Company in 1995 and has undergone a lot of changes to its present form. The Company also
operates plants at Rosa in Uttarpradesh and Butibori in Maharashtra. The Company had a record breaking IPO with
over 3.1mn applicants in 2008.

7/17/2019 FinancialAnalysis_Power Sector (1)
http://slidepdf.com/reader/full/financialanalysispower-sector-1 4/12Page 3 of 11
Tata Power
Tata Power had its inception in 1915, establishing India's first large hydro-electric project in KhopoliToday, Tata Power
With an installed electricity generation capacity of about 8,747 MW, it is India's second largest private power producer.
Tata power is poised for multi-fold growth. It is one of the largest renewable energy players in India and it has developed
the country's first 4000 MW Ultra Mega Power Project at Mundra in Gujarat. The Company has entered into various joint
ventures for coal based as well as solar power plants.
Analysis from the view point of Management
Average Payable Period – Creditors Turnover RatioCreditor turnover ratio depicts the rate at which the
Company is paying off its suppliers. The same ratio in days
tells us the average payable period in days.
An analysis of all the ratios are showing an increasing
trends in the number of days the suppliers are being paid
for purchases of goods and services.
Specifically for APL, the ratio for 2010-11 has been ignored
as the project was into the implementation phase with no
COGS and high levels of accounts payable for capital
goods. Post that, the ratio has decreased but has remained
higher than the average of all other Companies which
stood at 48 days.
Amongst all Companies, RPL has the lowest payable days
in 2014-15 but NTPC has been a consistent performer.
Average Receivable Period – Debtors Turnover Ratio
Debtors turnover ratio depicts the number of times the
debtors are realised in the year. With the same in number
of days, it shows in how many days the debtors are
realised.
NTPC, being a government company enjoys the lowest
ratio amongst the competition whereas the ratio for RPL is
very high at 106 days. Analysing the same with the creditor
turnover ratio, the company is seen as not utilizing working
capital and might be using other funds for payment of its
suppliers. APL which had negligent revenue in 2010-11
has increased to 49 days which is the most efficient
company in the private sector. TPL is also close to 54 days.
It can be said that the power sector companies generally
offer a credit period of 30-60 days.
Inventory Turnover RatioInventory holding period shows the number of days of
inventory which is being held by the Company. As
electricity is not stored and transferred over the grid, the
inventory represents the stock of Coal and machinery
spares.
With issues in procuring coal from India and other countries
as well, this ratio is of huge importance. The ratios for RPL
and APL in the initial years are high due to starting of
commercial operations where the inventory is stored but
revenue is not generated. NTPC may have lower holding
days as the Company has secured supplies from Coal Indiaas it is a government Company. APL also has a holding
days of 40 days.
126
253
33
117
6685
41
29-
50
100
150
200
250
300
2014-152013-142012-132011-122010-11
Average Payable Period
NTPC APL RPL TPL
3628
49
4
106
64
5449
-
20
40
60
80
100
120
2014-152013-142012-132011-122010-11
Average Receivable Period
NTPC APL RPL TPL
4030 39
253
71
222
2626-
50
100
150
200
250
300
2014-152013-142012-132011-122010-11
Inventory Turnover in days
NTPC APL RPL TPL

7/17/2019 FinancialAnalysis_Power Sector (1)
http://slidepdf.com/reader/full/financialanalysispower-sector-1 5/12
7/17/2019 FinancialAnalysis_Power Sector (1)
http://slidepdf.com/reader/full/financialanalysispower-sector-1 6/12Page 5 of 11
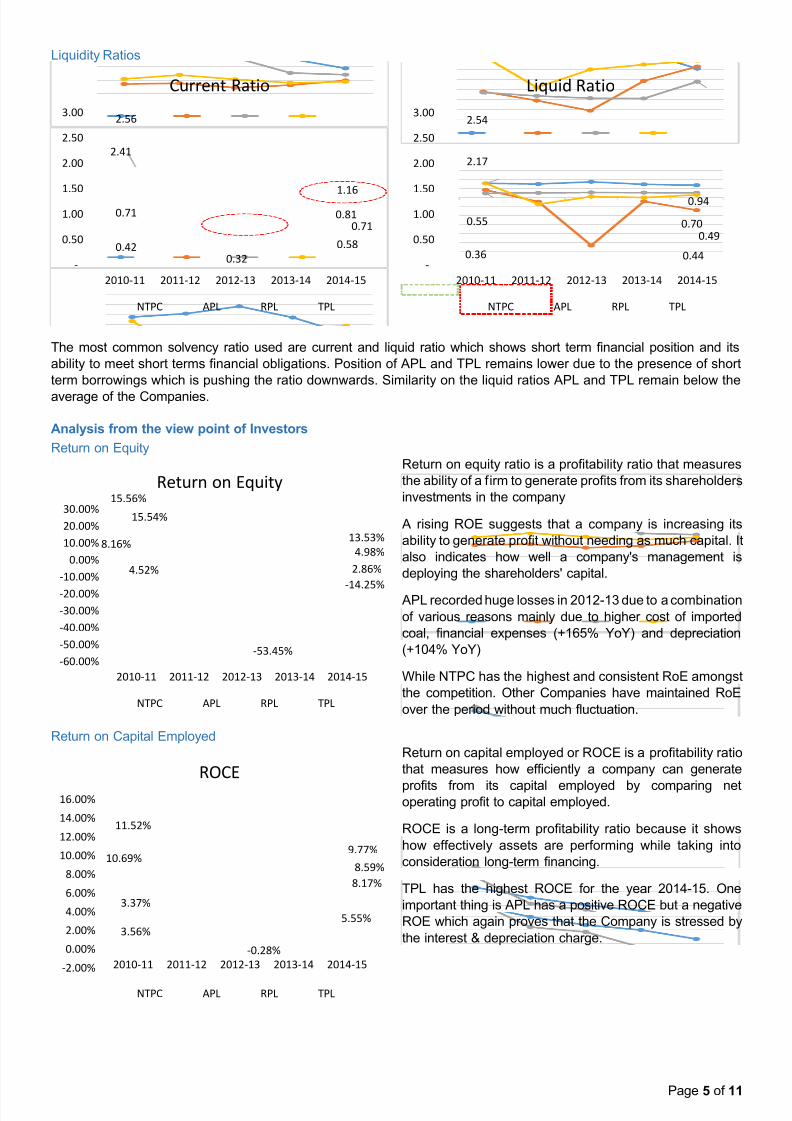
Liquidity Ratios
The most common solvency ratio used are current and liquid ratio which shows short term financial position and its
ability to meet short terms financial obligations. Position of APL and TPL remains lower due to the presence of short
term borrowings which is pushing the ratio downwards. Similarity on the liquid ratios APL and TPL remain below the
average of the Companies.
Analysis from the view point of Investors
Return on Equity
Return on equity ratio is a profitability ratio that measures
the ability of a firm to generate profits from its shareholders
investments in the company
A rising ROE suggests that a company is increasing its
ability to generate profit without needing as much capital. It
also indicates how well a company's management is
deploying the shareholders' capital.
APL recorded huge losses in 2012-13 due to a combination
of various reasons mainly due to higher cost of imported
coal, financial expenses (+165% YoY) and depreciation
(+104% YoY)
While NTPC has the highest and consistent RoE amongst
the competition. Other Companies have maintained RoE
over the period without much fluctuation.
Return on Capital Employed
Return on capital employed or ROCE is a profitability ratio
that measures how efficiently a company can generate
profits from its capital employed by comparing netoperating profit to capital employed.
ROCE is a long-term profitability ratio because it shows
how effectively assets are performing while taking into
consideration long-term financing.
TPL has the highest ROCE for the year 2014-15. One
important thing is APL has a positive ROCE but a negative
ROE which again proves that the Company is stressed by
the interest & depreciation charge.
0.94
2.17
0.49
0.36
0.70
2.54
0.44
0.55
-
0.50
1.00
1.50
2.00
2.50
3.00
2014-152013-142012-132011-122010-11
Liquid Ratio
NTPC APL RPL TPL
1.16
2.41
0.58
0.320.42
0.81
2.56
0.71
0.71
-
0.50
1.00
1.50
2.00
2.50
3.00
2014-152013-142012-132011-122010-11
Current Ratio
NTPC APL RPL TPL
-14.25%
-53.45%
8.16%13.53%
15.54%
4.98%
4.52% 2.86%
15.56%
-60.00%
-50.00%
-40.00%
-30.00%
-20.00%
-10.00%
0.00%
10.00%
20.00%
30.00%
2014-152013-142012-132011-122010-11
Return on Equity
NTPC APL RPL TPL
8.17%
11.52%
8.59%
-0.28%
3.56%
5.55%
3.37%
9.77%10.69%
-2.00%
0.00%
2.00%
4.00%
6.00%
8.00%
10.00%
12.00%
14.00%
16.00%
2014-152013-142012-132011-122010-11
ROCE
NTPC APL RPL TPL

7/17/2019 FinancialAnalysis_Power Sector (1)
http://slidepdf.com/reader/full/financialanalysispower-sector-1 7/12Page 6 of 11
Earnings Per Share & Dividend per share
Earnings per share serves as an indicator of a company's profitability. It measures the amount of net income earned
per share of stock outstanding and this can be used by a shareholder while making decisions about the particular
investment, in comparison to other alternate investments.
EPS for the NTPC has almost been consistent in last five years and is the highest among all companies while for RPL
it has been steadily increasing which is a good sign for investors. After a major drop in EPS from 2010-11 to 2011-12,
TPL is on recovery mode and gaining since then. EPS for APL has been decreasing since because of losses.
Only NTPC and TPL have declared dividends in the last 5 years.
DuPont Analysis for year 2015
DuPont analysis bifurcates the return on equity into Net Profit Margin, Asset Turnover and its capital structure.
It can be observed that APL has a skewed capital structure which is also evident by its debt equity ratio.
2.5
5.755.75
43.8
1.31.251.151.251.25
0
1
2
3
4
5
6
7
2014-152013-142012-132011-122010-11
Dividend Per Share
NTPC TPL
12.1211.34
-2.84
-9.592.35
3.672.85 1.51
9.19
-15
-10
-5
0
5
10
15
20
2014-152013-142012-132011-122010-11
Earnings Per Share
NTPC APL RPL TPL
-200%
0%
200%
400%
600%
800%
1000%
1200%
NTPC
APL
RPL
TPL
Dupont Analysis
Net Profit Margin Asset Turnover Capital Structure
7/17/2019 FinancialAnalysis_Power Sector (1)
http://slidepdf.com/reader/full/financialanalysispower-sector-1 8/12Page 7 of 11
Appendix
Figure 1 - Installed Capacity - March 2015
Table 1–
Thermal power installed Capacity Breakup by major Companies
Name of the Company InstalledCapacity in Mw
% of Total
NTPC 44,398 27
Adani Power 9,240 6
Tata Power 8,726 5
Reliance Power 5,945 4
State Electricity Boards 58,100 35
Others 38,226 23
Table 2 Turnover Ratio Calculation for NTPC
RatiosFY
2014-15FY
2013-14FY
2012-13FY
2011-12FY
2010-11
Debtors Turnover Ratio (Times) 10 12 11 16 13
Debtor Turnover (In Days) 36 30 34 23 28
Creditors Turnover (Times) 9 9 9 11 12
Average Payable Period 41 40 39 34 29
Inventory Turnover (Times) 9 11 12 13 12
Inventory Turnover (Days) 40 33 31 29 30
Table 3 Turnover Ratio Calculation for Adani Power
RatiosFY
2014-15FY
2013-14FY
2012-13FY
2011-12FY
2010-11
Debtors Turnover Ratio (Times) 7.48 13.70 11.23 16.52 93.02
Debtor Turnover (In Days) 49 27 33 22 4
Creditors Turnover (Times) 3 3 3 1 0
Average Payable Period 126 109 115 253 902
Inventory Turnover (Times) 9 8 5 5 1
Inventory Turnover (Days) 38.87 46.66 74.71 73.30 253.49
61%
9%
0%
2%
15%13%
11%
Power Industry Installed Capacity
Coal Gas Diesel Nuclear Hydro Renewable Sources

7/17/2019 FinancialAnalysis_Power Sector (1)
http://slidepdf.com/reader/full/financialanalysispower-sector-1 9/12Page 8 of 11
Table 4 Turnover Ratio Calculation for Reliance Power
RatiosFY
2014-15FY
2013-14FY
2012-13FY
2011-12FY
2010-11
Debtors Turnover Ratio (Times) 3.43 4.30 4.96 4.03 5.73
Debtor Turnover (In Days) 106 85 74 91 64
Creditors Turnover (Times) 11 13 17 10 3
Average Payable Period 33 29 22 35 117
Inventory Turnover (Times) 5 6 9 13 2
Inventory Turnover (Days) 70.60 64.87 39.54 28.03 222.25
Table 5 Turnover Ratio Calculation for Tata Power
RatiosFY
2014-15FY
2013-14FY
2012-13FY
2011-12FY
2010-11
Debtors Turnover Ratio (Times) 6.80 9.09 11.84 13.20 7.51
Debtor Turnover (In Days) 54 40 31 28 49
Creditors Turnover (Times) 6 7 9 6 4
Average Payable Period 66 52 43 58 85
Inventory Turnover (Times) 14 14 14 15 14
Inventory Turnover (Days) 26.18 26.16 25.22 24.13 25.54
Table 6 Solvency Ratios
₹ in crores
NTPC 2014-15 2013-14 2012-13 2011-12 2010-11
CA 41,791.62 44,385.39 44,818.67 41,211.10 38,685.71
Stock 7,972.46 5,988.48 4,575.78 4,177.91 3,910.83
Quick Assets 33,819.16 38,396.91 40,242.89 37,033.19 34,774.88
CL 35,946.33 29,665.11 26,702.39 20,795.01 16,060.32
Current 1.16 1.50 1.68 1.98 2.41
Liquid Ratio 0.94 1.29 1.51 1.78 2.17
₹ in crores
Adani Power Limited 2014-15 2013-14 2012-13 2011-12 2010-11
CA 10,192.14 7,104.23 5,052.41 5,988.61 1,861.52
CL 17,440.73 18,288.98 15,614.22 13,338.76 4,385.44
Stock 1,629.05 1,280.96 1,555.67 826.75 283.61
Quick Assets 8,563.09 5,823.27 3,496.74 5,161.86 1,577.91
Current 0.58 0.39 0.32 0.45 0.42
Liquid Ratio 0.49 0.32 0.22 0.39 0.36
₹ in crores
Reliance Power 2014-15 2013-14 2012-13 2011-12 2010-11
CA 8,150.33 6,355.94 8,834.07 5,699.04 8,030.19
CL 10,076.03 7,442.28 6,206.78 3,552.54 3,135.96
Stock 1,047.47 622.77 535.55 160.69 53.65
Quick Assets 7,102.86 5,733.17 8,298.52 5,538.35 7,976.54
Current 0.81 0.85 1.42 1.60 2.56
Liquid 0.70 0.77 1.34 1.56 2.54

7/17/2019 FinancialAnalysis_Power Sector (1)
http://slidepdf.com/reader/full/financialanalysispower-sector-1 10/12Page 9 of 11
Table 7 Long Term Equity Ratios
Table 8 EBITDA Margin
₹ in crores
Tata Power 2014-15 2013-14 2012-13 2011-12 2010-11
CA 14,916.36 13,360.88 12,150.12 11,470.09 7,234.48
CL 21,111.12 21,726.72 16,642.57 13,201.48 10,182.63
Stock 5,563.95 4,542.61 3,305.01 2,271.35 1,668.94
Liquid Assets 9,352.41 8,818.27 8,845.11 9,198.74 5,565.54
Current Ratio 0.71 0.61 0.73 0.87 0.71
Liquid Ratio 0.44 0.41 0.53 0.70 0.55
NTPC 2014-15 2013-14 2012-13 2011-12 2010-11
Long Term Borrowings 93,362.92 75,542.30 64,587.72 54,851.94 47,059.57
Net Worth 82,093.98 87,003.49 81,240.95 74,275.81 68,384.56
DE Ratio 1.14 0.87 0.80 0.74 0.69
Adani
Long term debt 35,089.66 33,131.48 33,191.60 29,584.83 21,687.82
Net Worth 5,724.62 6,543.39 4,293.41 6,041.31 6,287.32
DE Ratio 6.13 5.06 7.73 4.90 3.45
Reliance
Long term debt 28,220.55 26,253.51 24,186.03 14,262.00 5,525.26
Net Worth 20,631.99 19,469.93 18,582.58 17,569.62 16,833.44
DE Ratio 1.37 1.35 1.30 0.81 0.33
TPL
Long term debt 32,618.38 30,469.94 31,599.34 29,733.11 17,757.84Net Worth 14,310.59 12,392.25 12,326.88 12,664.99 14,019.54
DE Ratio 2.28 2.46 2.56 2.35 1.27
NTPC 2014-15 2013-14 2012-13 2011-12 2010-11
Sales 80622.04 78921.66 69376.82 65893.25 57607.17
EBITDA 17,194.06 19,693.23 18,148.67 15,113.78 12,774.63
21% 25% 26% 23% 22%
Adani
Sales 18823.73 15768.08 6779.36 4089.79 2135.19EBITDA 5,159.37 4,672.59 959.61 1,325.18 1,245.65
27% 30% 14% 32% 58%
Reliance
Sales 6852.74 5174.75 4926.59 2019.21 1054.76
EBITDA 2,011.30 1,712.89 623.89 229.02 -105.62
29% 33% 13% 11% -10%
Tata Power
Sales 34366.85 35648.7 33025.43 26001.4 19450.76
EBITDA 6,940.48 6,917.33 6,444.70 4,900.22 4,593.59
20% 19% 20% 19% 24%

7/17/2019 FinancialAnalysis_Power Sector (1)
http://slidepdf.com/reader/full/financialanalysispower-sector-1 11/12Page 10 of 11
Table 9 ICR Calculation
Table 10 Return on Equity Calculation
NTPC 15 14 13 12 11
PBIT 10,456.21 14,485.76 16,610.95 13,137.26 12,392.33
Interest 3,570.37 3,203.07 2,480.54 2,134.72 1,725.75
ICR 2.93 4.52 6.70 6.15 7.18
Reliance
PBIT 1,238.81 1,199.61 952.39 771.89 702.60
Interest 3,699.27 3,439.90 2,635.53 1,527.09 866.15
ICR 0.33 0.35 0.36 0.51 0.81
TATA
PBIT 1,483.74 975.07 1,276.68 507.25 3,156.88
Interest 3,699.27 3,439.90 2,635.53 1,527.09 866.15
ICR 0.40 0.28 0.48 0.33 3.64
Adani
PBIT -815.63 -1,369.54 -1,818.22 0.34 813.20
Interest 4,863.53 4,010.00 1,702.86 737.53 255.03
ICR -0.17 -0.34 -1.07 0.00 3.19
NTPC 2015 2014 2013 2012 2011
NP 9,992.37 11,403.40 12,586.22 9,814.66 9,348.23
NW 73848.52 78758.03 72995.49 66030.35 60139.1
RoE 13.5309 14.47903 17.24246 14.86386 15.54435
Reliance
NP 1028.32 1,026.67 1,011.46 866.78 760.44
NW 20631.99 19,469.93 18,582.58 17,569.62 16,833.44
RoE 4.98% 5.27% 5.44% 4.93% 4.52%
TATA
NP 408.82 -33.31 98.72 -968.29 2,181.91
NW 14,310.59 12,392.25 12,326.88 12,664.99 14,019.54
RoE 3% -0.27% 1% -8% 16%
Adani
NP -815.63 -290.55 -2,295.01 -294.50 513.18
NW 5,724.62 6,543.39 4,293.41 6,041.31 6,287.32
RoE -14% -4% -53% -5% 8%

7/17/2019 FinancialAnalysis_Power Sector (1)
http://slidepdf.com/reader/full/financialanalysispower-sector-1 12/12
Bibliography
1) http://www.ntpc.co.in/en/investors/annual-reports
2) http://www.adanipower.com/financials-and-filings
3) http://www.reliancepower.co.in/investor_information/investor_desk.htm
4) http://www.tatapower.com/investor-relations/anlreport-archive.aspx
5) http://site.securities.com.ezproxy.svkm.ac.in:2048
6) https://www.crisilresearch.com.ezproxy.svkm.ac.in/industryasync.jspx?serviceId=31&State=null
7) http://www.cea.nic.in/installed_capacity.html
8) http://www.investopedia.com/
9) Edelweiss Sector Reports
10) IBEF Power Sector Report
11) Financial Accounting – A South Asian Perspective by Godwin, Alderman and Sanyal
12) Financial Accounting for Management by N. Ramachandran and Ram Kumar Kakani