finding balance, 2012; png
DESCRIPTION
Finding Balance, 2012. Benchmarking the Performance of State-Owned Enterprises in Papua New GuineaThis is the first state-owned enterprise (SOE) benchmarking study to include Papua New Guinea (PNG). It has been undertaken at the request of the government of PNG in order to inform its efforts to improve SOE performance and contribute to the increased transparency in the sector.- State-Owned Enterprises in Papua New Guinea: Economic Impact- Comparative Financial Performance of the Papua New Guinea State-Owned Enterprise Portfolio- Unique Characteristics of the Papua New Guinea State-Owned Enterprise Sector- State-Owned Enterprise Reform in the Pacific: Progress and Lessons for Papua New Guinea- Commercialization Delivers Results- State-Owned Enterprise Reform: Common MythsTRANSCRIPT
Benchmarking the Performance of State-Owned Enterprises in Papua New Guinea
FINDING BALANCE
Finding BalanceBenchmarking the Performance of State-Owned Enterprises in Papua New Guinea
State-owned enterprises (SOEs) play a significant role in the economy of Papua New Guinea (PNG), as they do in other Pacific countries. They provide a range of essential services, most notably power, water, telecommunications, and transport that are vital to commerce and to the livelihoods of all communities. The performance of the SOEs therefore has an important impact on PNG’s ability to achieve inclusive economic growth.
This study benchmarks the performance of PNG’s SOEs with those of Fiji, the Marshall Islands, Samoa, Solomon Islands, and Tonga; assesses the key drivers of this performance; and identifies successful reform strategies that can guide future policy action. Particular attention is given to the legal, regulatory, governance, and monitoring frameworks of each country, given their known impact on the performance of the SOEs.
Pacific Private Sector Development Initiative
The Pacific Private Sector Development Initiative (PSDI) is a regional technical assistance facility cofinanced by the Australian Agency for International Development. PSDI is designed to support efforts by ADB Pacific developing member countries to encourage inclusive, private sector-led, sustainable economic growth. PSDI focuses on improving access to financial services, business law reform, and state-owned enterprise reform and public–private partnerships in the region.
About the Asian Development Bank
ADB’s vision is an Asia and Pacific region free of poverty. Its mission is to help its developing member countries reduce poverty and improve the quality of life of their people. Despite the region’s many successes, it remains home to two-thirds of the world’s poor: 1.8 billion people who live on less than $2 a day, with 903 million struggling on less than $1.25 a day. ADB is committed to reducing poverty through inclusive economic growth, environmentally sustainable growth, and regional integration.
Based in Manila, ADB is owned by 67 members, including 48 from the region. Its main instruments for helping its developing member countries are policy dialogue, loans, equity investments, guarantees, grants, and technical assistance.
Asian Development Bank6 ADB Avenue, Mandaluyong City 1550 Metro Manila, Philippineswww.adb.org
Pacific Liaison and Coordination OfficeLevel 18, 1 Margaret StreetSydney, NSW 2000, Australiawww.adb.org/pacific
Printed in AustraliaPrinted on recycled paper

Benchmarking the Performance of State-Owned Enterprises in Papua New Guinea
FiNdiNG BalaNcE
© 2012 Asian Development Bank
All rights reserved. Published 2012. Printed in Australia.
ISBN 978-92-9092-830-0 (Print), 978-92-9092-831-7 (PDF)Publication Stock No. RPS124943
Cataloging-In-Publication Data
Asian Development Bank. Finding balance: Benchmarking the performance of state-owned enterprises in Papua New Guinea.Mandaluyong City, Philippines: Asian Development Bank, 2012.
1. Economic growth. 2. Private sector development. 3. State-owned enterprises. I. Asian Development Bank.
The views expressed in this publication are those of the authors and do not necessarily reflect the views and policies of the Asian Development Bank (ADB) or its Board of Governors or the governments they represent.
ADB does not guarantee the accuracy of the data included in this publication and accepts no responsibility for any consequence of their use.
By making any designation of or reference to a particular territory or geographic area, or by using the term “country” in this document, ADB does not intend to make any judgments as to the legal or other status of any territory or area.
ADB encourages printing or copying information exclusively for personal and noncommercial use with proper acknowledgment of ADB. Users are restricted from reselling, redistributing, or creating derivative works for commercial purposes without the express, written consent of ADB.
6 ADB Avenue, Mandaluyong City1550 Metro Manila, PhilippinesTel +63 2 632 4444Fax +63 2 636 2444www.adb.org
Pacific Liaison and Coordination OfficeLevel 18, 1 Margaret StreetSydney, NSW 2000, AustraliaTel +61 2 827 09444Fax +61 2 827 09445www.adb.org/pacific
For orders, please contact: Department of External RelationsFax +63 2 636 [email protected]
Printed on recycled paper
iii
Contents
Figures, Tables, and Boxes iv
Foreword v
Abbreviations vi
Executive Summary vii
Introduction 1
I. State-Owned Enterprises in Papua New Guinea: Economic Impact 3
A. Providing Low Returns on Scarce Capital Stock 3 B. Crowding out the Private Sector 4 C. Opportunity Costs of State-Owned Enterprise Investment 5
II. Comparative Financial Performance of the Papua New Guinea State-Owned Enterprise Portfolio 7
A. Portfolio Composition and Performance 7 B. State-Owned Enterprise Contributions within the Portfolio 9 C. Selected Nonfi nancial Performance Indicators 11
III. Unique Characteristics of the Papua New Guinea State-Owned Enterprise Sector 12
A. Policy, Legal, and Regulatory Framework 12 B. Ongoing Reforms 15
IV. State-Owned Enterprise Reform in the Pacifi c: Progress and Lessons for Papua New Guinea 17
A. Challenges and Progress with State-Owned Enterprise Reform in the Pacifi c 17 B. Lessons for Papua New Guinea 19
V. Commercialization Delivers Results 20
A. Core Elements of Commercialization 20 B. Promoting Private Sector Participation 25
VI. State-Owned Enterprise Reform: Common Myths 27
VII. Conclusions 31
Appendixes
1 Sector Benchmarking: Power, Water, Ports, and Development Banking 32 2 Review of Amendments to the 2002 Independent Public Business Corporation Act 41 3 Summary of State-Owned Enterprise Financial Data, 2010 43 4 Notes on the Methodology 49
iv
Figures, Tables, and Boxes
Figures1 Value of PNG State-Owned Enterprises and Other Public Investments, 2010 12 State-Owned Enterprise Contribution to Gross Domestic Product 43 Average Cost of State-Owned Enterprise Debt vs. Commercial Debt Rate, FY2002–FY2009 54 Total Government Transfers Net of State-Owned Enterprise Profi ts, FY2002–FY2009 55 Cumulative Government Transfers to State-Owned Enterprises as % of Total Health Expenditure,
FY2002–FY2008 66 State-Owned Enterprise Portfolio Composition, FY2009 77 State-Owned Enterprise Return on Equity, FY2002–FY2010 88 State-Owned Enterprise Return on Assets, FY2002–FY2010 89 PNG State-Owned Enterprise Portfolio Return on Equity and Return on Assets, FY2002–FY2010 910 Growth of Book Value of State-Owned Enterprise Portfolio Assets, FY2002–FY2009 911 Cumulative State-Owned Enterprise Profi ts, FY2002–FY2010 912 Average Return on Equity, FY2004–FY2006 and FY2007–FY2010 10
Tables1 Economic Impact Indicators of SOEs 32 State-Owned Enterprise Profi tability Indicators, FY2002–FY2010 43 Composition of State-Owned Enterprise Boards, 2012 21A1.1 Sector Benchmarking—Power 33A1.2 Sector Benchmarking—Water 35A1.3 Sector Benchmarking—Ports 37A1.4 Sector Benchmarking—Development Banks 39A3.1 Fiji SOE Performance Indicators, FY2009 43A3.2 Marshall Islands SOE Performance Indicators, FY2010 44A3.3 Papua New Guinea SOE Performance Indicators, FY2010 45A3.4 Samoa SOE Performance Indicators, FY2010 46A3.5 Solomon Islands SOE Performance Indicators, FY2010 47A3.6 Tonga SOE Performance Indicators, FY2010 48
Boxes1 PNG State-Owned Enterprises Included in the Benchmarking Study 12 Pacifi c Island Countries Innovate with Private Provision of Public Services 83 Evolution of Pacifi c State-Owned Enterprise Legislation and Governance Practices 124 Successful Implementation of Community Service Obligation Guidelines in Tonga 185 Lessons from New Zealand 206 Does Political Interference Impact Performance of State-Owned Enterprises? 227 Best Practices for Delivering Community Service Obligations 238 State-Owned Enterprise Subsidies Create Negative Performance Incentives 24
v
Foreword
The Government of Papua New Guinea (PNG) has long recognized the importance of a robust and vibrant private sector to drive economic growth. Foreign investment in the extractive sectors in recent years has fueled economic expansion, but sustainable and inclusive growth requires much broader participation in the economy. State-owned enterprises (SOEs) continue to constrain PNG’s economy through their absorption of large amounts of scarce capital, low productivity, and relatively limited service coverage. PNG’s government has emphasized that SOE reform is vital for private sector development, as it will create opportunities for private investment, reduce the costs of doing business, and improve basic service delivery. Recent eff orts to improve SOE performance are already showing results.
This is the third major assessment of the progress of SOE reform in the Pacifi c region undertaken by the Asian Development Bank (ADB), and the fi rst to include PNG. The purpose of the study is to benchmark the performance of SOEs and reform experiences across the region and draw lessons to inform PNG’s future policy action. Finding the balance between the roles of the public and private sectors is an overriding theme.
The participation of PNG and fi ve other ADB Pacifi c developing member countries (Fiji, the Marshall Islands, Samoa, Solomon Islands, and Tonga) must be commended, as it demonstrates their government’s willingness to publicly identify and address the core issues within their SOE sectors. The study is being published at a critical juncture for PNG, with a newly elected government forming its policy priorities. PNG’s recent eff orts to strengthen the governance, disclosure, and accountability frameworks of SOEs have already begun to bear fruit, and should serve as a solid foundation for continued reform.
I wish to convey my sincere thanks to the governments of PNG, Fiji, the Marshall Islands, Samoa, Solomon Islands, and Tonga for their extensive inputs, without which this study would not have been possible. I also wish to thank the authors (Laure Darcy and Christopher Russell) for their eff orts in its preparation, and the Australian Agency for International Development, which provided cofi nancing under the Private Sector Development Initiative.
I am confi dent that the study will provide thought-provoking reading and stimulate useful discussions toward further progress in SOE reforms in the Pacifi c and other regions facing similar challenges.
Xianbin YaoDirector GeneralPacifi c DepartmentAsian Development Bank

vi
Abbreviations
ADB – Asian Development BankCSO – community service obligationsDBS – Development Bank of SamoaFEA – Fiji Electricity AuthorityFPCL – Fiji Ports Corporation LimitedFY – fi scal yearIPBC – Independent Public Business CorporationGBT – General Business Trust GDP – gross domestic productK – kinakWh – kilowatt-hourMIDB – Marshall Islands Development BankMIPA – Marshall Islands Port AuthorityNDB – National Development Bank (PNG)NEC – National Executive CouncilPNG – Papua New GuineaPPCL – PNG Ports Corporation LimitedPPP – public–private partnershipROA – return on assetsROE – return on equityRMI – Republic of the Marshall IslandsSIPA – Solomon Islands Port AuthoritySPA – Samoa Port AuthoritySOE – state-owned enterpriseTDB – Tonga Development Bank
Notes:
“$” refers to US dollars.“FY” is the fi scal year as defi ned by each country.“F$” refers to Fiji dollars.“K” refers to Papua New Guinea kina.“NZ$” refers to New Zealand dollars.“SI$” refers to Solomon Islands dollars.“ST” refers to Samoan tala.“T$” refers to Tongan pa’anga.
vii
Introduction
Executive Summary
This is the fi rst state-owned enterprise (SOE) benchmarking study to include Papua New Guinea (PNG). It has been undertaken at the request of the government of PNG in order to inform its eff orts to improve SOE performance and contribute to the increased transparency in the sector. Participation in this study must be commended as a demonstration of the government’s willingness to identify and address the core issues within the SOE portfolio, as transparency is an essential precursor to successful reform.
The study builds upon the SOE benchmarking analysis conducted by the Asian Development Bank (ADB) for fi ve Pacifi c countries and published under the title Finding Balance 2011: Benchmarking the Performance of SOEs in Fiji, the Marshall Islands, Samoa, Solomon Islands, and Tonga; and updates the fi nancial data to the most recently available fi scal year (FY), 2010.
The purpose of the study is to assess the impact of the SOE sectors on the economies of the participating Pacifi c countries, and identify the key performance drivers and reform strategies that can guide future policy action. In the year since the 2011 study was published and presented to the senior policy makers of each participating Pacifi c country, further progress has been made in establishing a more commercial framework for the SOE sectors, implementing robust SOE legislation, and strengthening the governance and monitoring frameworks to guide improved SOE performance.
The fi ndings of the study reveal that while PNG’s SOEs have produced net profi ts that are in the upper range of the SOE portfolios in the six Pacifi c countries benchmarked, they have done so at a substantial cost to the government in terms of ongoing fi scal transfers and other subsidies, and to the detriment of the poorer segments of the population due to the generally poor quality of the services provided and limited range of delivery. By absorbing large amounts of scarce capital stock on which they provide very low returns, crowding out the private sector, and diverting public funds that could otherwise be invested in such high-yielding social sectors as health and education, SOEs act as a drag on economic growth.
From FY2002 to FY2010, the SOE portfolio average return on equity (ROE) was 4.2% in PNG, –0.6% in Fiji, –13.3% in the Marshall Islands (the RMI), 0.3% in Samoa, –11.0% in Solomon Islands, and 5.6% in Tonga. In each country, this rate is substantially below the profi tability target set by the government and/or a commercially established risk adjusted return. In the RMI and Solomon Islands, the chronic operating losses of the SOEs require regular capital infusions from the central budget, further weakening their government’s fi scal position. In PNG as in the other countries, the poor performance of the SOEs is due to weak governance arrangements, confl icting mandates, the absence of hard budget constraints, and lack of accountability. SOEs do not operate with the same effi ciency incentives as private sector fi rms; there are few consequences for poor fi nancial and operating performance and few rewards for achieving profi tability targets. It is therefore not surprising that the best performing SOEs are those that operate in an environment that demands a full commercial orientation; and with strong governance arrangements, high levels of transparency, performance incentives, and hard budget constraints.
viii
Executive Summary
While all six countries recognize the need for SOE reform, results have been mixed. Progress appears to be directly correlated to each government’s eff ectiveness in protecting SOEs from undue political infl uence. This reality underscores both the vital nature of political commitment and the sensitivities surrounding SOE reform. In Pacifi c island countries, political opposition to SOE reform stems from concerns about: (i) the potential loss of patronage; (ii) the loss of direct control over SOEs, which are perceived to be important policy implementation tools; and (iii) potential job losses as SOEs are restructured and made more effi cient. In some cases, opposition to SOE reform is also rooted in a distrust of the private sector and a belief that in small economies, market forces and competition erode consumer welfare rather than enhance it.
In the 9 months from September 2011 to May 2012, PNG’s government made remarkable progress in strengthening the framework for PNG’s SOEs, including the:
• restructuring of all of the boards of the SOEs,
• fi rst ever publication of the accounts and annual plan of the Independent Public Business Corporation (IPBC),
• fi rst ever preparation of annual plans for all of the SOEs, and
• preparation of amendments to the IPBC Act to strengthen the accountability mechanisms of the SOEs.
More remains to be done to complete the framework, including the development of a dividend policy, guidelines for the delivery of community service obligations (CSOs) by SOEs, and a public–private partnership policy; increased transparency of SOE performance; and strengthened governance and implementation of an on-lending policy. Taken together, these reforms will allow the SOEs to operate as commercial entities, improve service delivery, and be held accountable for results.
The pace of reform has varied in the fi ve other Pacifi c countries participating in this study, specifi cally in:
(i) Fiji. While the government is currently preparing several SOEs for greater private sector involvement, and is looking to corporatize additional government functions, only limited progress has been made in recent years in restructuring SOEs and introducing greater transparency in the management of CSOs.
(ii) The RMI. Eff orts to reform SOEs over the past 2 decades have had little sustained impact, as they have failed to address the more fundamental issues, which include the inability of the SOEs to recover the full costs of service delivery and operate on commercial terms within an appropriate accountability structure. The situation is set to improve, however, with the Cabinet approving a new SOE policy in 2012; the preparation of a legislative framework for the SOEs; and the ongoing restructuring of the electricity utility, which is the largest SOE.
(iii) Samoa. The appointment of 180 new SOE directors drawn from the private sector was completed in 2012, and a further two SOEs are being prepared for privatization.
(iv) Solomon Islands. Substantial progress has been made since 2008 to implement its SOE Act and place SOEs on a fi rm commercial footing. The implementation of a robust CSO framework is well underway; a rigorous SOE director selection process is being implemented; and all elected offi cials have been removed from SOE boards.
(v) Tonga. From 2006–2010, Tonga arguably had the strongest political commitment to SOE reform in the Pacifi c. During this period, it restructured all of its SOE boards, developed rationalization strategies for all but three SOEs, privatized two SOEs, and strengthened its SOE Act; and was the fi rst Pacifi c country
ix
Introduction
to publish its SOE accounts in local newspapers. Reform progress, however, has slowed since 2011 with the change in government.
The SOE reform experiences of all of the countries participating in this study provide some very clear lessons:
(i) Sustained political commitment is vital to successful reform.
(ii) Continued fi nancing of poorly performing SOEs does not restore their profi tability, and often creates negative performance incentives.
(iii) There is a clear link between weak governance arrangements and poor SOE performance.
(iv) The most successful SOEs are those that operate on strict commercial principles with consequences for poor performance.
(v) The private sector has the capacity to invest in SOEs and to deliver CSOs.
The key to successful SOE reform is therefore to infuse SOEs with private sector discipline, competitive market pressures, and clear consequences for nonperformance. This forces SOEs to meet their costs of capital and divest any activities that are not commercially viable. When SOEs remain under public ownership, the process of “commercialization” is incremental and, where political commitment to ongoing reform is weak, can be reversed. Privatization, in contrast, is immediate; it relies on a transfer of ownership to accelerate, intensify, and lock in the benefi ts of commercialization. Full privatization, however, is not always politically feasible nor the most suitable reform mechanism. In these cases, partial privatization (such as joint ventures and public–private partnerships) can help improve SOE performance.
This study demonstrates the signifi cant economic costs generated by poor SOE management and the progress that can be made in reforming SOEs where the political will to do so exists. PNG and other Pacifi c countries participating in this study have demonstrated that SOE reform is both possible and benefi cial. Placing SOEs on a fully commercial and transparent footing, thereby freeing up scarce public capital, will not only enable SOEs to begin to make a positive contribution to inclusive economic growth, but will also lead to increased investment opportunities and expansion of the private sector as the engine of this growth.
Executive Summary

1
Introduction
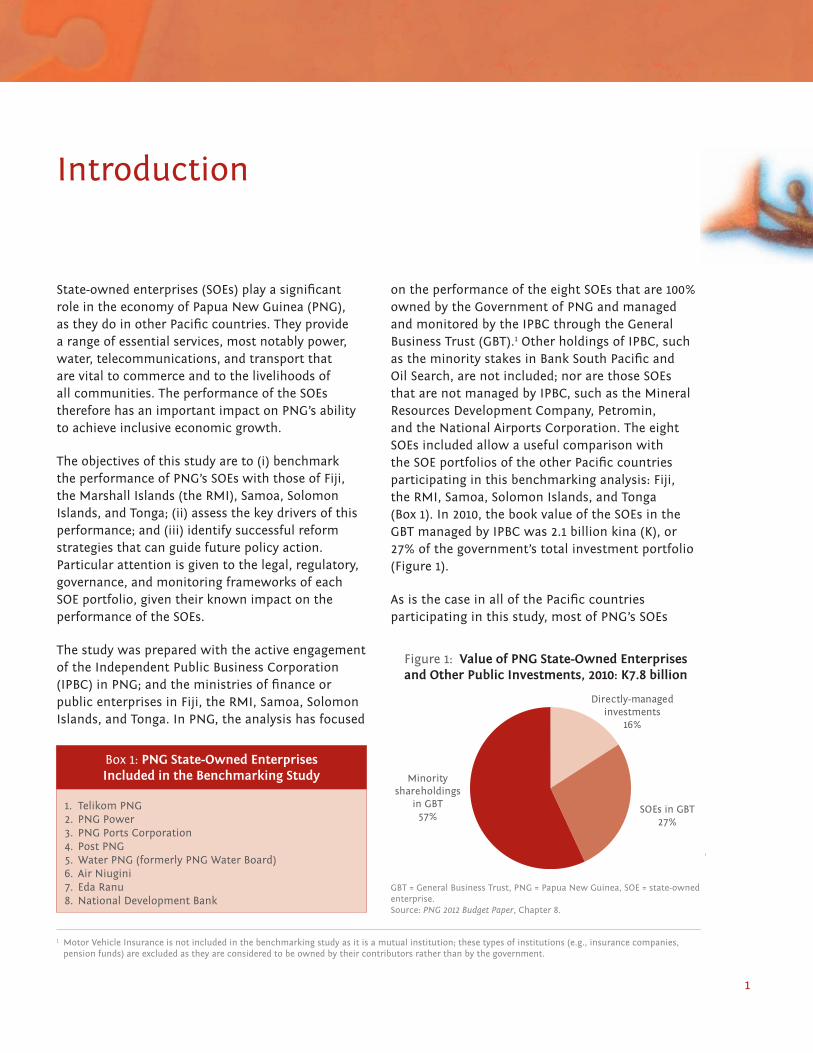
on the performance of the eight SOEs that are 100% owned by the Government of PNG and managed and monitored by the IPBC through the General Business Trust (GBT).1 Other holdings of IPBC, such as the minority stakes in Bank South Pacifi c and Oil Search, are not included; nor are those SOEs that are not managed by IPBC, such as the Mineral Resources Development Company, Petromin, and the National Airports Corporation. The eight SOEs included allow a useful comparison with the SOE portfolios of the other Pacifi c countries participating in this benchmarking analysis: Fiji, the RMI, Samoa, Solomon Islands, and Tonga (Box 1). In 2010, the book value of the SOEs in the GBT managed by IPBC was 2.1 billion kina (K), or 27% of the government’s total investment portfolio (Figure 1).
As is the case in all of the Pacifi c countries participating in this study, most of PNG’s SOEs
State-owned enterprises (SOEs) play a signifi cant role in the economy of Papua New Guinea (PNG), as they do in other Pacifi c countries. They provide a range of essential services, most notably power, water, telecommunications, and transport that are vital to commerce and to the livelihoods of all communities. The performance of the SOEs therefore has an important impact on PNG’s ability to achieve inclusive economic growth.
The objectives of this study are to (i) benchmark the performance of PNG’s SOEs with those of Fiji, the Marshall Islands (the RMI), Samoa, Solomon Islands, and Tonga; (ii) assess the key drivers of this performance; and (iii) identify successful reform strategies that can guide future policy action. Particular attention is given to the legal, regulatory, governance, and monitoring frameworks of each SOE portfolio, given their known impact on the performance of the SOEs.
The study was prepared with the active engagement of the Independent Public Business Corporation (IPBC) in PNG; and the ministries of fi nance or public enterprises in Fiji, the RMI, Samoa, Solomon Islands, and Tonga. In PNG, the analysis has focused
1 Motor Vehicle Insurance is not included in the benchmarking study as it is a mutual institution; these types of institutions (e.g., insurance companies, pension funds) are excluded as they are considered to be owned by their contributors rather than by the government.
Figure 1: Value of PNG State-Owned Enterprises and Other Public Investments, 2010: K7.8 billion
GBT = General Business Trust, PNG = Papua New Guinea, SOE = state-owned enterprise.Source: PNG 2012 Budget Paper, Chapter 8.
Directly-managedinvestments
16%
SOEs in GBT27%
Minorityshareholdings
in GBT57%
Box 1: PNG State-Owned Enterprises Included in the Benchmarking Study
1. Telikom PNG 2. PNG Power 3. PNG Ports Corporation4. Post PNG 5. Water PNG (formerly PNG Water Board)6. Air Niugini 7. Eda Ranu 8. National Development Bank
2
Finding Balance
were created to provide core infrastructure and related services—power, water, port services, telecommunications, air transport, and postal services—and were established at a time when it was believed that either the private sector did not have the capacity to provide these services, or that it was in the government’s best interest to exercise control over their delivery through ownership of the assets.
While the SOEs have provided these core infrastructure services to PNG, this study has found that they have done so ineffi ciently and at
signifi cant cost to the economy.2 When government allocates resources into activities where productivity is low, the long-run growth rate of the economy is adversely aff ected. Ongoing investment in ineffi cient SOEs and their continued dominance as the sole providers of infrastructure services have the multiple impacts of (i) limiting the opportunities for private investment, (ii) limiting access to services by the poorer segments of the population, and (iii) generating low returns on the signifi cant amount of scarce capital stock that they absorb. Combined, these factors serve as a heavy drag on economic growth.
2 The impact of SOEs on the economy and the urgency of reform is further underscored in ADB. 2012. Papua New Guinea: Critical Development Constraints. Country Diagnostic Studies. Manila.
3
Introduction
I. State-Owned Enterprises in Papua New Guinea: Economic Impact
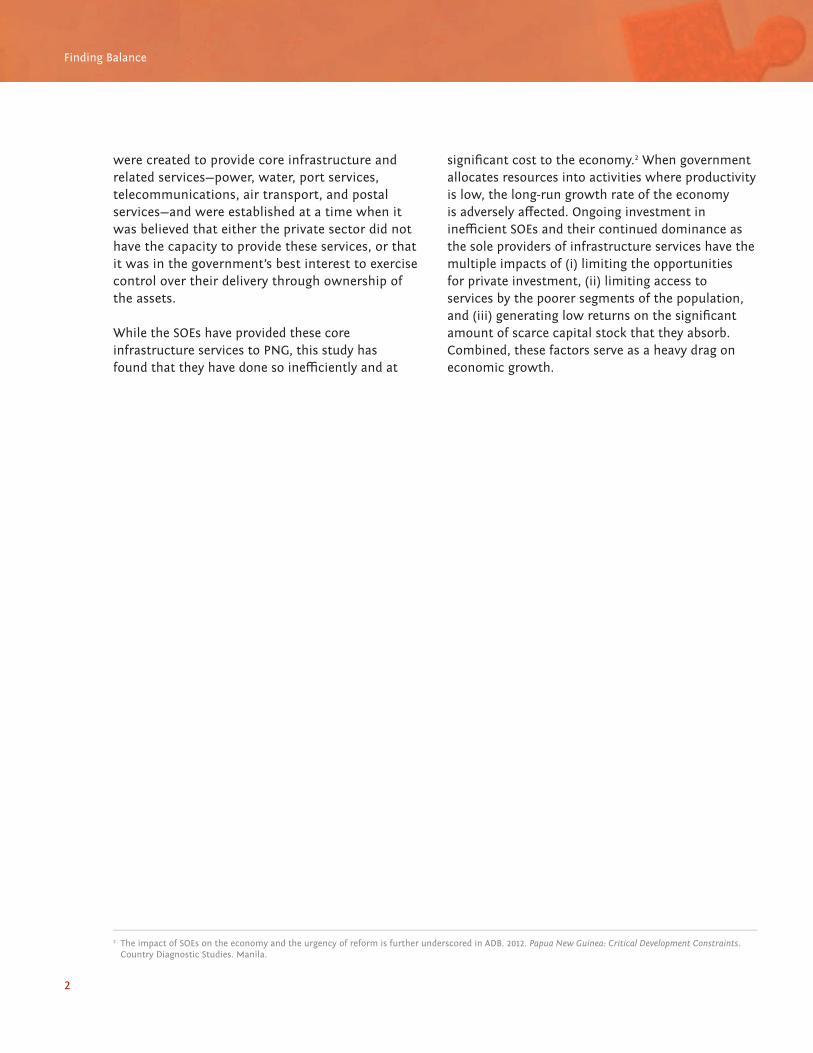
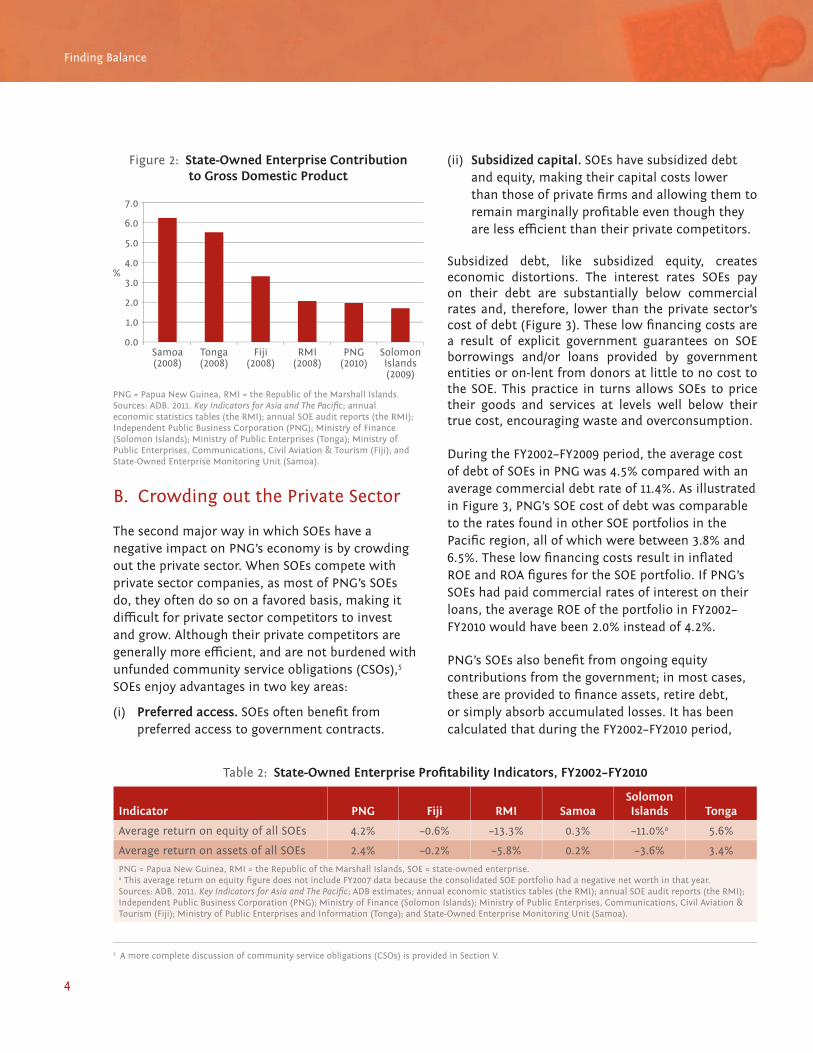
produced seven times less output than the same dollar invested in the rest of the economy. Moreover, in PNG, the SOEs contributed less to GDP than four of the fi ve other SOE portfolios benchmarked in this study, with 3.3% in Fiji, 2.1% in the Marshall Islands (the RMI), 6.2% in Samoa, 1.7% in Solomon Islands, and 5.5% in Tonga (Figure 2).
These fi gures are consistent with the poor fi nancial returns of the SOEs. During the 9-year period from FY2002–FY2010, the PNG SOE portfolio averaged a 4.2% return on equity (ROE) and 2.4% return on assets (ROA).4
A. Providing Low Returns on Scarce Capital Stock
In all of the Pacifi c countries participating in this study, the investment in state-owned enterprises (SOEs) is substantial, representing 10%–31% of total fi xed assets in the economy (Table 1).3 In Papua New Guinea (PNG), the SOEs absorbed an estimated 10%–15% of total fi xed assets in 2010. Despite these sizeable investments, the contribution of PNG’s SOEs to gross domestic product (GDP) in 2010 was very low, just 1.9%. Every dollar invested in PNG’s SOEs
Table 1: Economic Impact Indicators of SOEs
Indicator
Papua New Guinea
(FY2010)Fiji
(FY2008)RMI
(FY2008)Samoa
(FY2008)
Solomon Islands
(FY2009)Tonga
(FY2008)
SOE proportion of total fi xed assets in the economy
10%–15% 12%–26% NA NA 7%–12% 15%–31%
SOE contribution to GDPa 1.9% 3.3% 2.1%b 6.2% 1.7% 5.5%
Contribution to GDP per $1 of investment in SOEs
$0.12 $0.19 $0.04 $0.13 $0.21 $0.27
Contribution to GDP per $1 of investment in non-SOE sector
$0.83 $1.26 NA NA $1.32 $1.35
Number of SOEs 8 20 11 14 11 13
GDP = gross domestic product, NA = not available, RMI = the Republic of the Marshall Islands, SOE = state-owned enterprise.a SOE contribution to GDP is calculated by adding the operating profi t (excluding depreciation) and the total wage expenditure of the SOE and dividing
by GDP.b The RMI’s annual economics statistics tables, which are prepared by the Economic Policy, Planning, and Statistics Offi ce, calculate the SOE value added
using a similar formula, but with diff erent estimates of the variables, resulting in an SOE contribution to GDP of 4.4% in 2008.Sources: ADB. 2011. Key Indicators for Asia and The Pacifi c; ADB staff estimates; Independent Public Business Corporation (PNG); Ministry of Public Enterprises, Communications, Civil Aviation & Tourism (Fiji); annual economic statistics tables (the RMI); annual SOE audit reports (the RMI); State-Owned Enterprise Monitoring Unit (Samoa); Ministry of Finance (Solomon Islands); and Ministry of Public Enterprises (Tonga).
3 Limited data availability does not allow the calculation of the percent of total investment in the economy that is represented by the state-owned enterprise (SOE) sector in the Republic of the Marshall Islands (RMI) or Samoa; but the size of the SOE sector in these countries is substantial, with the book value of SOE assets in FY2008 equal to 73% of GDP in the RMI and 68% of gross domestic product (GDP) in Samoa. If the mutual SOEs in Samoa are included, this fi gure increases to 103% of GDP.
4 Return on assets (ROA) is calculated by dividing net income by total assets. This is an indicator of how effi cient a fi rm is in extracting profi ts from its assets. ROE is calculated by dividing net income by shareholder equity. This is an indicator of how effi ciently a fi rm uses its invested capital. While both are indicators of profi tability and should follow a similar trend, they can vary signifi cantly depending on the amount of debt a fi rm is carrying. This study, therefore, presents both indicators, thus providing a more complete picture of SOE profi tability.
4
Finding Balance
B. Crowding out the Private Sector
The second major way in which SOEs have a negative impact on PNG’s economy is by crowding out the private sector. When SOEs compete with private sector companies, as most of PNG’s SOEs do, they often do so on a favored basis, making it diffi cult for private sector competitors to invest and grow. Although their private competitors are generally more effi cient, and are not burdened with unfunded community service obligations (CSOs),5 SOEs enjoy advantages in two key areas:
(i) Preferred access. SOEs often benefi t from preferred access to government contracts.
(ii) Subsidized capital. SOEs have subsidized debt and equity, making their capital costs lower than those of private fi rms and allowing them to remain marginally profi table even though they are less effi cient than their private competitors.
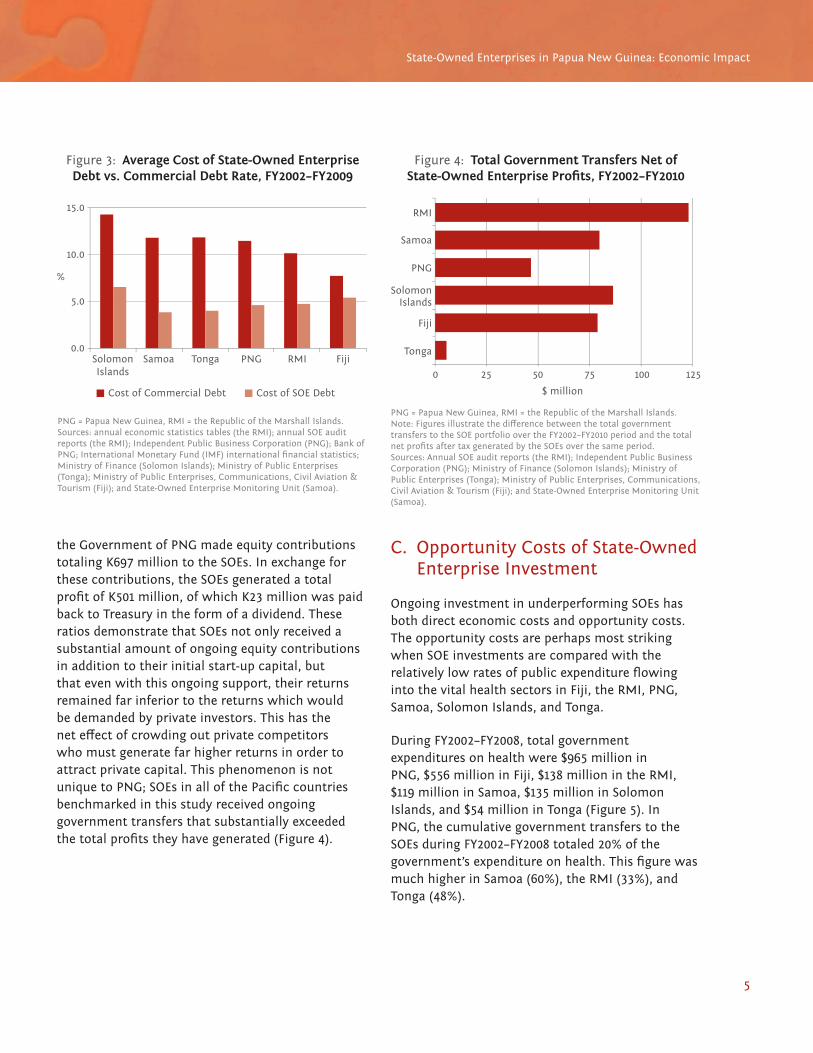
Subsidized debt, like subsidized equity, creates economic distortions. The interest rates SOEs pay on their debt are substantially below commercial rates and, therefore, lower than the private sector’s cost of debt (Figure 3). These low fi nancing costs are a result of explicit government guarantees on SOE borrowings and/or loans provided by government entities or on-lent from donors at little to no cost to the SOE. This practice in turns allows SOEs to price their goods and services at levels well below their true cost, encouraging waste and overconsumption.
During the FY2002–FY2009 period, the average cost of debt of SOEs in PNG was 4.5% compared with an average commercial debt rate of 11.4%. As illustrated in Figure 3, PNG’s SOE cost of debt was comparable to the rates found in other SOE portfolios in the Pacifi c region, all of which were between 3.8% and 6.5%. These low fi nancing costs result in infl ated ROE and ROA fi gures for the SOE portfolio. If PNG’s SOEs had paid commercial rates of interest on their loans, the average ROE of the portfolio in FY2002–FY2010 would have been 2.0% instead of 4.2%.
PNG’s SOEs also benefi t from ongoing equity contributions from the government; in most cases, these are provided to fi nance assets, retire debt, or simply absorb accumulated losses. It has been calculated that during the FY2002–FY2010 period,
Table 2: State-Owned Enterprise Profi tability Indicators, FY2002–FY2010
Indicator PNG Fiji RMI SamoaSolomon Islands Tonga
Average return on equity of all SOEs 4.2% –0.6% –13.3% 0.3% –11.0%a 5.6%
Average return on assets of all SOEs 2.4% –0.2% –5.8% 0.2% –3.6% 3.4%
PNG = Papua New Guinea, RMI = the Republic of the Marshall Islands, SOE = state-owned enterprise.a This average return on equity fi gure does not include FY2007 data because the consolidated SOE portfolio had a negative net worth in that year.Sources: ADB. 2011. Key Indicators for Asia and The Pacifi c; ADB estimates; annual economic statistics tables (the RMI); annual SOE audit reports (the RMI); Independent Public Business Corporation (PNG); Ministry of Finance (Solomon Islands); Ministry of Public Enterprises, Communications, Civil Aviation & Tourism (Fiji); Ministry of Public Enterprises and Information (Tonga); and State-Owned Enterprise Monitoring Unit (Samoa).
Figure 2: State-Owned Enterprise Contribution to Gross Domestic Product
PNG = Papua New Guinea, RMI = the Republic of the Marshall Islands.Sources: ADB. 2011. Key Indicators for Asia and The Pacifi c; annual economic statistics tables (the RMI); annual SOE audit reports (the RMI); Independent Public Business Corporation (PNG); Ministry of Finance (Solomon Islands); Ministry of Public Enterprises (Tonga); Ministry of Public Enterprises, Communications, Civil Aviation & Tourism (Fiji); and State-Owned Enterprise Monitoring Unit (Samoa).
7.0
6.0
5.0
4.0
3.0
2.0
1.0
0.0Samoa(2008)
Tonga(2008)
Fiji(2008)
RMI(2008)
PNG(2010)
SolomonIslands(2009)
%
5 A more complete discussion of community service obligations (CSOs) is provided in Section V.
5
State-Owned Enterprises in Papua New Guinea: Economic Impact
the Government of PNG made equity contributions totaling K697 million to the SOEs. In exchange for these contributions, the SOEs generated a total profi t of K501 million, of which K23 million was paid back to Treasury in the form of a dividend. These ratios demonstrate that SOEs not only received a substantial amount of ongoing equity contributions in addition to their initial start-up capital, but that even with this ongoing support, their returns remained far inferior to the returns which would be demanded by private investors. This has the net eff ect of crowding out private competitors who must generate far higher returns in order to attract private capital. This phenomenon is not unique to PNG; SOEs in all of the Pacifi c countries benchmarked in this study received ongoing government transfers that substantially exceeded the total profi ts they have generated (Figure 4).
C. Opportunity Costs of State-Owned Enterprise Investment
Ongoing investment in underperforming SOEs has both direct economic costs and opportunity costs. The opportunity costs are perhaps most striking when SOE investments are compared with the relatively low rates of public expenditure fl owing into the vital health sectors in Fiji, the RMI, PNG, Samoa, Solomon Islands, and Tonga.
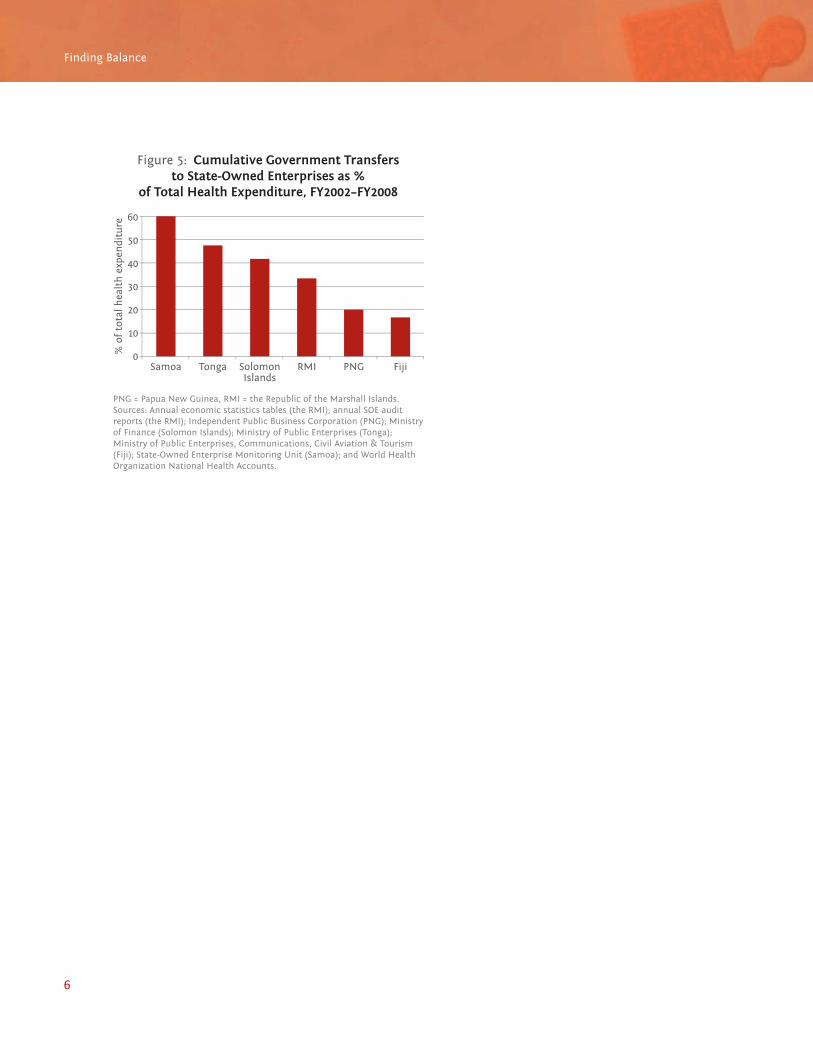
During FY2002–FY2008, total government expenditures on health were $965 million in PNG, $556 million in Fiji, $138 million in the RMI, $119 million in Samoa, $135 million in Solomon Islands, and $54 million in Tonga (Figure 5). In PNG, the cumulative government transfers to the SOEs during FY2002–FY2008 totaled 20% of the government’s expenditure on health. This fi gure was much higher in Samoa (60%), the RMI (33%), and Tonga (48%).
Figure 3: Average Cost of State-Owned Enterprise Debt vs. Commercial Debt Rate, FY2002–FY2009
PNG = Papua New Guinea, RMI = the Republic of the Marshall Islands.Sources: annual economic statistics tables (the RMI); annual SOE audit reports (the RMI); Independent Public Business Corporation (PNG); Bank of PNG; International Monetary Fund (IMF) international fi nancial statistics; Ministry of Finance (Solomon Islands); Ministry of Public Enterprises (Tonga); Ministry of Public Enterprises, Communications, Civil Aviation & Tourism (Fiji); and State-Owned Enterprise Monitoring Unit (Samoa).
15.0
10.0
5.0
0.0
%
SolomonIslands
Samoa Tonga PNG RMI Fiji
Cost of Commercial Debt Cost of SOE Debt
Figure 4: Total Government Transfers Net of State-Owned Enterprise Profi ts, FY2002–FY2010
PNG = Papua New Guinea, RMI = the Republic of the Marshall Islands.Note: Figures illustrate the diff erence between the total government transfers to the SOE portfolio over the FY2002–FY2010 period and the total net profi ts after tax generated by the SOEs over the same period.Sources: Annual SOE audit reports (the RMI); Independent Public Business Corporation (PNG); Ministry of Finance (Solomon Islands); Ministry of Public Enterprises (Tonga); Ministry of Public Enterprises, Communications, Civil Aviation & Tourism (Fiji); and State-Owned Enterprise Monitoring Unit (Samoa).
RMI
Samoa
PNG
SolomonIslands
Fiji
Tonga
0 25 50 75 100 125
$ million
6
Finding Balance
Figure 5: Cumulative Government Transfers to State-Owned Enterprises as %
of Total Health Expenditure, FY2002–FY2008
PNG = Papua New Guinea, RMI = the Republic of the Marshall Islands.Sources: Annual economic statistics tables (the RMI); annual SOE audit reports (the RMI); Independent Public Business Corporation (PNG); Ministry of Finance (Solomon Islands); Ministry of Public Enterprises (Tonga); Ministry of Public Enterprises, Communications, Civil Aviation & Tourism (Fiji); State-Owned Enterprise Monitoring Unit (Samoa); and World Health Organization National Health Accounts.
60
50
40
30
20
10
0Samoa Tonga FijiRMI PNGSolomon
Islands
% o
f to
tal h
ealt
h e
xpen
ditu
re
7
II. Comparative Financial Performance of the Papua New Guinea State-Owned Enterprise Portfolio
contributes to ineffi cient resource allocation, and impairs the government’s ability to assess whether the CSOs provide value for money or achieve the outcomes sought.
Important progress has been made, however, with the contracting of private companies to provide subsidized air and shipping services in Fiji, PNG, Solomon Islands, and Tonga; and the implementation of new legal requirements in Samoa, Solomon Islands, and Tonga requiring the
A. Portfolio Composition and Performance
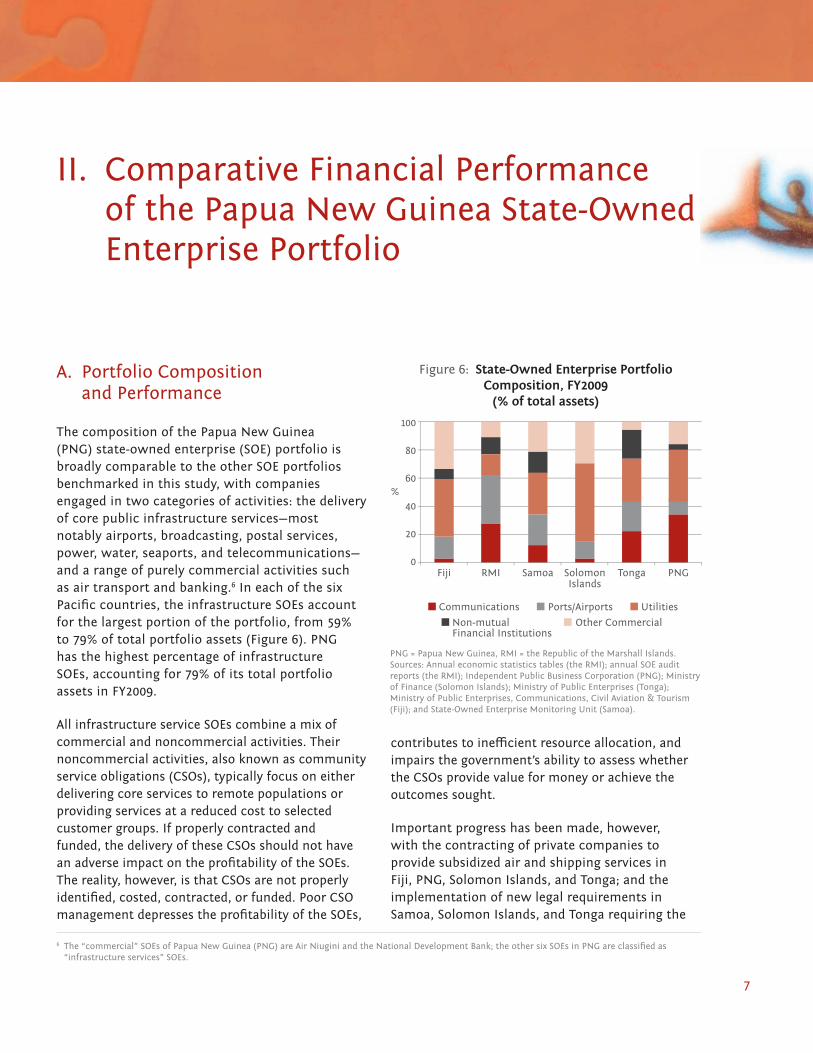
The composition of the Papua New Guinea (PNG) state-owned enterprise (SOE) portfolio is broadly comparable to the other SOE portfolios benchmarked in this study, with companies engaged in two categories of activities: the delivery of core public infrastructure services—most notably airports, broadcasting, postal services, power, water, seaports, and telecommunications—and a range of purely commercial activities such as air transport and banking.6 In each of the six Pacifi c countries, the infrastructure SOEs account for the largest portion of the portfolio, from 59% to 79% of total portfolio assets (Figure 6). PNG has the highest percentage of infrastructure SOEs, accounting for 79% of its total portfolio assets in FY2009.
All infrastructure service SOEs combine a mix of commercial and noncommercial activities. Their noncommercial activities, also known as community service obligations (CSOs), typically focus on either delivering core services to remote populations or providing services at a reduced cost to selected customer groups. If properly contracted and funded, the delivery of these CSOs should not have an adverse impact on the profi tability of the SOEs. The reality, however, is that CSOs are not properly identifi ed, costed, contracted, or funded. Poor CSO management depresses the profi tability of the SOEs,
6 The “commercial” SOEs of Papua New Guinea (PNG) are Air Niugini and the National Development Bank; the other six SOEs in PNG are classifi ed as “infrastructure services” SOEs.
Figure 6: State-Owned Enterprise Portfolio Composition, FY2009
(% of total assets)
PNG = Papua New Guinea, RMI = the Republic of the Marshall Islands.Sources: Annual economic statistics tables (the RMI); annual SOE audit reports (the RMI); Independent Public Business Corporation (PNG); Ministry of Finance (Solomon Islands); Ministry of Public Enterprises (Tonga); Ministry of Public Enterprises, Communications, Civil Aviation & Tourism (Fiji); and State-Owned Enterprise Monitoring Unit (Samoa).
100
80
60
40
20
0Samoa TongaFiji RMI PNGSolomon
Islands
Other CommercialNon-mutualFinancial Institutions
Communications Ports/Airports Utilities
%
8
Finding Balance
transparent management of CSOs.7 These initiatives demonstrate the feasibility and benefi ts of robust CSO management and provide a sound basis for applying these practices to all of the SOEs. PNG, similarly, is developing a CSO policy and guidelines
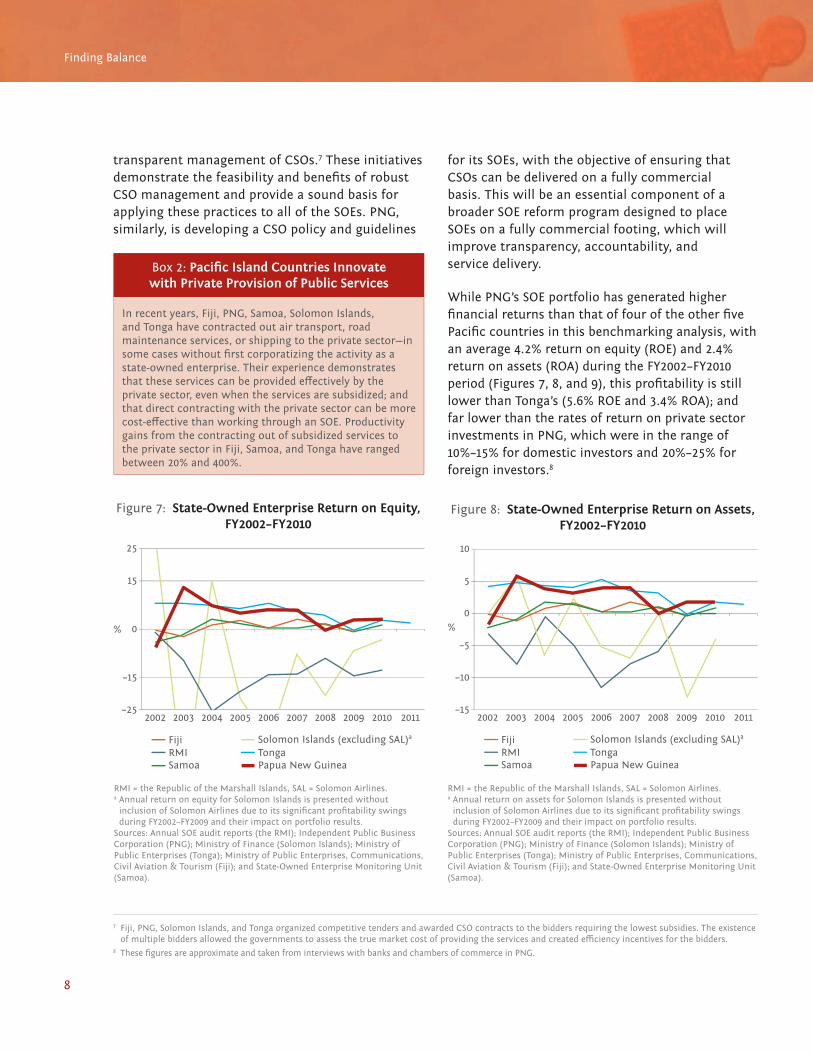
Box 2: Pacifi c Island Countries Innovate with Private Provision of Public Services
In recent years, Fiji, PNG, Samoa, Solomon Islands, and Tonga have contracted out air transport, road maintenance services, or shipping to the private sector—in some cases without fi rst corporatizing the activity as a state-owned enterprise. Their experience demonstrates that these services can be provided eff ectively by the private sector, even when the services are subsidized; and that direct contracting with the private sector can be more cost-eff ective than working through an SOE. Productivity gains from the contracting out of subsidized services to the private sector in Fiji, Samoa, and Tonga have ranged between 20% and 400%.
7 Fiji, PNG, Solomon Islands, and Tonga organized competitive tenders and awarded CSO contracts to the bidders requiring the lowest subsidies. The existence of multiple bidders allowed the governments to assess the true market cost of providing the services and created effi ciency incentives for the bidders.
8 These fi gures are approximate and taken from interviews with banks and chambers of commerce in PNG.
Figure 7: State-Owned Enterprise Return on Equity, FY2002–FY2010
RMI = the Republic of the Marshall Islands, SAL = Solomon Airlines.a Annual return on equity for Solomon Islands is presented without
inclusion of Solomon Airlines due to its signifi cant profi tability swings during FY2002–FY2009 and their impact on portfolio results.
Sources: Annual SOE audit reports (the RMI); Independent Public Business Corporation (PNG); Ministry of Finance (Solomon Islands); Ministry of Public Enterprises (Tonga); Ministry of Public Enterprises, Communications, Civil Aviation & Tourism (Fiji); and State-Owned Enterprise Monitoring Unit (Samoa).
25
15
0
–15
–252002 2003 2004 2005 2006 2007 2008 2009 2010 2011
Solomon Islands (excluding SAL)a
TongaRMISamoa
Fiji
Papua New Guinea
%
Figure 8: State-Owned Enterprise Return on Assets, FY2002–FY2010
RMI = the Republic of the Marshall Islands, SAL = Solomon Airlines.a Annual return on assets for Solomon Islands is presented without
inclusion of Solomon Airlines due to its signifi cant profi tability swings during FY2002–FY2009 and their impact on portfolio results.
Sources: Annual SOE audit reports (the RMI); Independent Public Business Corporation (PNG); Ministry of Finance (Solomon Islands); Ministry of Public Enterprises (Tonga); Ministry of Public Enterprises, Communications, Civil Aviation & Tourism (Fiji); and State-Owned Enterprise Monitoring Unit (Samoa).
10
5
0
–5
–10
–152002 2003 2004 2005 2006 2007 2008 2009 2010 2011
Solomon Islands (excluding SAL)a
TongaRMISamoa
Fiji
Papua New Guinea
%
for its SOEs, with the objective of ensuring that CSOs can be delivered on a fully commercial basis. This will be an essential component of a broader SOE reform program designed to place SOEs on a fully commercial footing, which will improve transparency, accountability, and service delivery.
While PNG’s SOE portfolio has generated higher fi nancial returns than that of four of the other fi ve Pacifi c countries in this benchmarking analysis, with an average 4.2% return on equity (ROE) and 2.4% return on assets (ROA) during the FY2002–FY2010 period (Figures 7, 8, and 9), this profi tability is still lower than Tonga’s (5.6% ROE and 3.4% ROA); and far lower than the rates of return on private sector investments in PNG, which were in the range of 10%–15% for domestic investors and 20%–25% for foreign investors.8
9
Comparative Financial Performance of the Papua New Guinea State-Owned Enterprise Portfolio
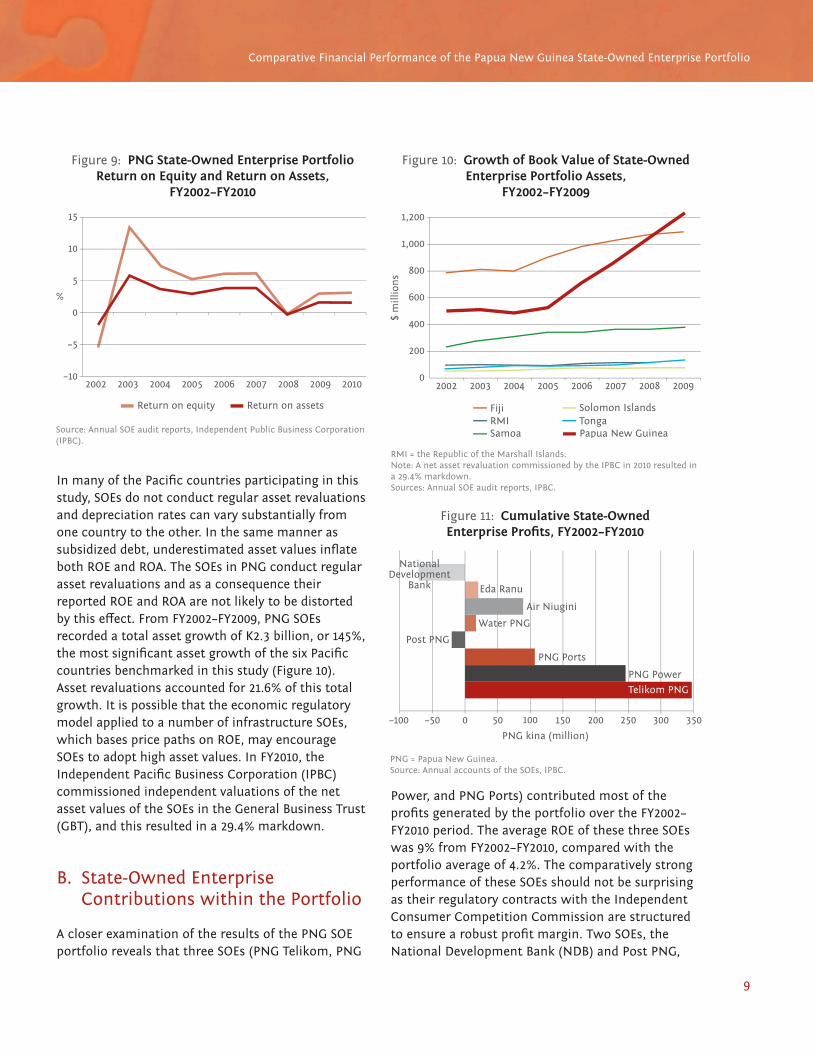
In many of the Pacifi c countries participating in this study, SOEs do not conduct regular asset revaluations and depreciation rates can vary substantially from one country to the other. In the same manner as subsidized debt, underestimated asset values infl ate both ROE and ROA. The SOEs in PNG conduct regular asset revaluations and as a consequence their reported ROE and ROA are not likely to be distorted by this eff ect. From FY2002–FY2009, PNG SOEs recorded a total asset growth of K2.3 billion, or 145%, the most signifi cant asset growth of the six Pacifi c countries benchmarked in this study (Figure 10). Asset revaluations accounted for 21.6% of this total growth. It is possible that the economic regulatory model applied to a number of infrastructure SOEs, which bases price paths on ROE, may encourage SOEs to adopt high asset values. In FY2010, the Independent Pacifi c Business Corporation (IPBC) commissioned independent valuations of the net asset values of the SOEs in the General Business Trust (GBT), and this resulted in a 29.4% markdown.
B. State-Owned Enterprise Contributions within the Portfolio
A closer examination of the results of the PNG SOE portfolio reveals that three SOEs (PNG Telikom, PNG
Figure 9: PNG State-Owned Enterprise Portfolio Return on Equity and Return on Assets,
FY2002–FY2010
Source: Annual SOE audit reports, Independent Public Business Corporation (IPBC).
15
10
5
0
–5
–102002 2003 2004 2005 2006 2007 2008 2009 2010
Return on assetsReturn on equity
%
Figure 10: Growth of Book Value of State-Owned Enterprise Portfolio Assets,
FY2002–FY2009
RMI = the Republic of the Marshall Islands.Note: A net asset revaluation commissioned by the IPBC in 2010 resulted in a 29.4% markdown.Sources: Annual SOE audit reports, IPBC.
1,200
1,000
800
600
400
200
02002 2003 2004 2005 2006 2007 2008 2009
$ m
illio
ns
Solomon IslandsTongaRMI
Samoa
Fiji
Papua New Guinea
Power, and PNG Ports) contributed most of the profi ts generated by the portfolio over the FY2002–FY2010 period. The average ROE of these three SOEs was 9% from FY2002–FY2010, compared with the portfolio average of 4.2%. The comparatively strong performance of these SOEs should not be surprising as their regulatory contracts with the Independent Consumer Competition Commission are structured to ensure a robust profi t margin. Two SOEs, the National Development Bank (NDB) and Post PNG,
Figure 11: Cumulative State-Owned Enterprise Profi ts, FY2002–FY2010
PNG = Papua New Guinea.Source: Annual accounts of the SOEs, IPBC.
–100 –50 0 50 100
PNG kina (million)
150 200 250 300 350
NationalDevelopment
Bank Eda Ranu
Air Niugini
Water PNG
PNG Ports
PNG Power
Telikom PNG
Post PNG
10
Finding Balance
produced a cumulative loss of K91 million, 78% of which was generated by NDB.
NDB generated losses of K70.6 million over the FY2002–FY2010 period, while receiving a total of K111.0 million in government grants to onlend to selected benefi ciaries. It appears that most of these funds have not been recovered, and more funds are being channeled every year with similar results. The 2012 national development budget has allocated a further K130 million funding for NDB to onlend to various benefi ciaries, of which K100 million is earmarked for the agriculture sector.9 NDB’s continued role as the preferred channel for the government’s subsidized credit programs is diffi cult to justify based on its past performance. In FY2009, NDB reported K109 million ($52.8 million) in accumulated losses. NDB’s performance, when compared with other development banks, is one of the worst in the Pacifi c and indeed is far inferior to the Tonga Development Bank and the Development Bank of Samoa, which returned an average ROE of 11% and –0.8%, respectively, during the FY2002–FY2009 period compared with NDB’s –38%. In the benchmarking sample of development banks, NDB only outperformed one bank, the Development Bank of Solomon Islands, which was closed in 2007.10 While the fi nancial statements of NDB for FY2011 were not available for this study, NDB’s chair announced a record profi t for the bank of K9.4 million in 2011, a dramatic turnaround after the bank’s decade of consistent losses.11 The statement did not elaborate on the key drivers of this turnaround.
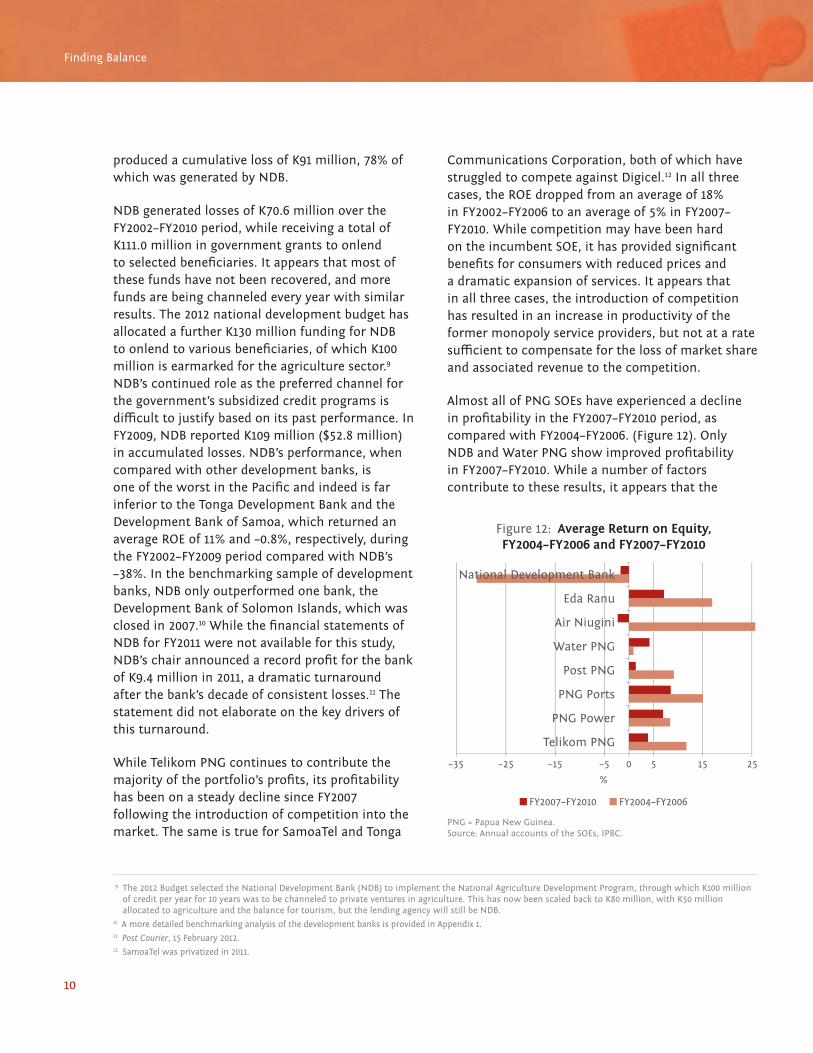
While Telikom PNG continues to contribute the majority of the portfolio’s profi ts, its profi tability has been on a steady decline since FY2007 following the introduction of competition into the market. The same is true for SamoaTel and Tonga
Communications Corporation, both of which have struggled to compete against Digicel.12 In all three cases, the ROE dropped from an average of 18% in FY2002–FY2006 to an average of 5% in FY2007– FY2010. While competition may have been hard on the incumbent SOE, it has provided signifi cant benefi ts for consumers with reduced prices and a dramatic expansion of services. It appears that in all three cases, the introduction of competition has resulted in an increase in productivity of the former monopoly service providers, but not at a rate suffi cient to compensate for the loss of market share and associated revenue to the competition.
Almost all of PNG SOEs have experienced a decline in profi tability in the FY2007–FY2010 period, as compared with FY2004–FY2006. (Figure 12). Only NDB and Water PNG show improved profi tability in FY2007–FY2010. While a number of factors contribute to these results, it appears that the
9 The 2012 Budget selected the National Development Bank (NDB) to implement the National Agriculture Development Program, through which K100 million of credit per year for 10 years was to be channeled to private ventures in agriculture. This has now been scaled back to K80 million, with K50 million allocated to agriculture and the balance for tourism, but the lending agency will still be NDB.
10 A more detailed benchmarking analysis of the development banks is provided in Appendix 1.11 Post Courier, 15 February 2012.12 SamoaTel was privatized in 2011.
Figure 12: Average Return on Equity, FY2004–FY2006 and FY2007–FY2010
PNG = Papua New Guinea.Source: Annual accounts of the SOEs, IPBC.
National Development Bank
Eda Ranu
Air Niugini
Water PNG
Post PNG
PNG Ports
PNG Power
Telikom PNG
–35 –25 –15
%
–5 0 5 15 25
FY2007–FY2010 FY2004–FY2006
11
Comparative Financial Performance of the Papua New Guinea State-Owned Enterprise Portfolio
poorest-performing SOEs are those that are either consistently directed to deliver CSOs without adequate compensation or whose boards may be more responsive to political pressure than commercial imperatives. These fi ndings are explored in more detail in Section III.
While the fi nancial performance of the PNG SOEs compares favorably with that of the other SOE portfolios benchmarked in this study—with the exception of Tonga—fi nancial performance does not provide much insight into the quality of services provided by the SOEs. As most of the SOEs in the PNG portfolio provide core infrastructure services, indicators of service delivery are important measures of the SOE overall performance.
C. Selected Nonfi nancial Performance Indicators
In the power sector, the technical performance of PNG Power is on par with other utilities in the region, with combined transmission and distribution losses of 20%; but a lower load factor of 41% compared with an average of 66% for the other utilities. Because of PNG’s diffi cult topography, a relatively low proportion of the country has access to power; and a rapidly growing demand in the capital city has forced PNG Power to implement rolling blackouts. Most businesses maintain backup
diesel generators to compensate for the unreliability of the power supply.
In the water sector, Water PNG and Eda Ranu compare favorably on technical performance parameters with other water utilities in the Pacifi c region, with high cost-recovery rates and—in the case of Water PNG—low nonrevenue water levels of 38%. Eda Ranu, in contrast, suff ers from very high nonrevenue water rates of 58%, due in large part to its inability to disconnect illegal users. Both utilities provide 24-hour supply and comply 100% with residual chlorine and microbiological quality benchmarks.
In the port sector, PNG Ports is processing by far the highest volume of cargo of the benchmarked ports, yet it has one of the lowest asset utilization rates. This could indicate that the assets are overvalued or overdimensioned, as the revenues of PNG Ports are based on port charges that are at the median of the rates of the other benchmarked ports. PNG Ports has one of the lowest cargo processing costs in the region, at $5.44/unit of cargo compared with $11.33 in Fiji and $6.85 in Solomon Islands; while this is indicative of an effi cient use of resources, it is also helped by the comparatively low depreciation charges of PNG Ports. Appendix 1 provides more detailed benchmarking analyses of the SOEs in the power, water, ports, and development banking sectors.
12
III. Unique Characteristics of the Papua New Guinea State-Owned Enterprise Sector
more usual holding company structures, however, and presents some interesting challenges in relation to eff ective SOE governance and monitoring.
When the IPBC Act was passed in 2002, the intention was that IPBC would operate entirely independent of the state; and not be subject to any direction or infl uence by the state, ministers, or the Parliament, except where explicitly set out in the IPBC Act, the SOE’s empowering legislation (where it exists), the GBT’s deed, or elsewhere in legislation.13 It is understood that this high degree of separation was introduced in response to concerns over the endemic corruption within the PNG government.
A. Policy, Legal, and Regulatory Framework
Benchmarking studies of state-owned enterprises (SOEs) by the Asian Development Bank (ADB) have shown that the design and implementation of a country’s legislative, governance, and monitoring frameworks heavily infl uence the performance of its SOEs. This is certainly true in Papua New Guinea (PNG), whose framework is unique in the region. Whereas the SOEs in most Pacifi c countries are owned directly by the state, in PNG they are owned by a trust, the PNG General Business Trust (GBT). The GBT is managed by a statutory corporation, the Independent Public Business Corporation (IPBC), which has a dual role of trustee and SOE-owner monitor. While this structure may have been originally adopted to improve transparency and accountability in the management of the SOEs, in practice this does not appear to have been achieved. Indeed the trust structure may have instead facilitated the systemic lack of transparency that has characterized IPBC over the past decade.
The use of a holding company to own and monitor SOEs is not unusual. Temasek Holdings—a registered company—owns Singapore’s SOEs, while the Auckland Regional Services Trust—a New Zealand statutory corporation—was established to act as the holding entity for the Auckland region’s commercial assets. The PNG approach is quite diff erent from the
13 Policy Charter for the Independent Public Business Corporation (IPBC), drafted by the Ministry of Public Enterprises, Information and Development Cooperation in October 2006, page 3.
Box 3: Evolution of Pacifi c State-Owned Enterprise Legislation and Governance Practices
The six Pacifi c countries that have participated in this study have adopted diff erent legislative, governance, and monitoring frameworks for their state-owned enterprises (SOEs). In most cases, the diff erence in the legislative framework is a function of how old or new the respective SOE legislation is. The newer acts, such as those in Solomon Islands and Tonga, build upon and improve the legislation adopted by Fiji and Samoa, while amending it for their own particular purposes and needs.
This trend of learning from the early adopters is also evident in governance practices. Monitoring frameworks, in contrast, tend to be more developed in the countries that have operated with established legislative frameworks for longer periods, as they have had more time to develop staff , and fi ne-tune their monitoring agencies.
13
Unique Characteristics of the Papua New Guinea State-Owned Enterprise Sector
Eff ective SOE legislation achieves a sensible balance between legitimate control and oversight and allowing SOEs to operate with clear commercial imperatives without undue political interference. An analysis of the IPBC Act and the various amendments over the period 2002 to 2010—before the most recent amendments were announced in 2012—would indicate that the PNG government has yet to get this balance right.
Indeed, the IPBC Act has both strengths and weaknesses, and it would appear to a large extent that since 2002 the weaknesses have been exploited and the strengths ignored:14
• Accountability and transparency. For most of the period FY2002 to FY2010, the IPBC failed to provide publicly available audited fi nancial statements or annual plans. Similarly, the SOEs failed to produce annual plans and IPBC made no eff ort to publicly disclose the audited accounts of the SOEs.
• IPBC governance. The 2002 IPBC Act stipulated that the IPBC board should comprise representatives from organizations such as the PNG Trade Union Congress, PNG Chamber of Commerce, a person nominated by the National Council of Women, a person appointed by Transparency International (PNG), and others as listed in Section 11 of the Act. This list had been carefully compiled to ensure not only the independence of IPBC, but also transparency, accountability, and confi dence in the board’s decision making. The requirements of Section 11 were subsequently amended but on the whole have been largely ignored.
• IPBC mandate. The original IPBC Act required the board of IPBC, in exercising its powers and functions, to act in accordance with sound business principles; and the care,
diligence, and skill that a prudent person of business would adopt or exercise. This provision was removed in 2007, leaving IPBC with no overarching principle to guide the board in its management of the SOEs.
• SOE governance. In the past, the government has sanctioned political involvement in the selection of SOE directors, contrary to the requirements of the IPBC Act.15 While the Act authorizes IPBC to select and appoint SOE directors with the National Executive Council (NEC) having veto powers only, in practice the Minister of Public Enterprises appears to have acted virtually alone in appointing the directors.16
• Management of the GBT. The SOEs are owned by the GBT. The IPBC is the trustee of the GBT. However, since the establishment of the GBT no trust deed has ever been formalized, which would defi ne, among other matters, the terms of the trust, the obligations of the trustee,17 and the benefi cial owner of the trust’s assets.
• SOE mandate. The 2002 IPBC Act and subsequent amendments lack a statement establishing the primary focus of the SOEs, which should in turn guide all decisions made by the board of directors and senior managers. In most SOE legislation, this statement—often called the “primary objective”—requires the SOE to operate as a successful business; and is then reinforced by clear accountability statements that set out the consequences for not meeting this primary objective.
• Investment oversight. Section 46B of the IPBC Act, introduced in the 2007 amendment, states that no majority-owned SOE can enter into any contract involving the payment
14 A more detailed review of the successive amendments to the 2002 IPBC Act and PNG’s experience with its implementation is included in Appendix 2 of this report.15 The 2007 amendment to the IPBC Act restricted the power of the National Executive Council (NEC) to only being able to veto persons nominated by the
IPBC; prior to this amendment, the NEC made all SOE director appointments on the recommendation of the minister. 16 Speech by the minister of public enterprises on the occasion of the Second Reading of the IPBC Act (Amendment) Bill 2012, 22 March 2012; and interviews
with IPBC staff .17 Other than the obligations set out in the IPBC Act.
14
Finding Balance
or receipt of an amount, or of property to a value exceeding K1 million without fi rst seeking the approval of the minister of public enterprises on the recommendation of the IPBC managing director. The National Development Bank—the poorest-performing SOE over the period of this study—and Telikom PNG (Telikom) have undertaken projects with values over K100 million, in breach of Section 46B.
To strengthen its oversight of the SOEs, IPBC has often required its staff members to attend SOE board meetings as observers. This practice may prove counterproductive, however, as it (i) confuses the accountability relationship between the board and the ownership monitor, (ii) can create confl icts of interest where observers also have speaking rights, and (iii) could result in the staff being “deemed directors” where they carry all of the risks but none of the protections available to properly appointed directors.
The defi ciencies of the governance arrangements in PNG’s SOE sector were underscored in the treasurer’s 2012 national budget statement, which noted that “over the last 9 years IPBC, as the trustee for the GBT, has not been fulfi lling its mandate to ensure the improved commercial performance of the SOEs and that SOEs are managed eff ectively and effi ciently and deliver timely quality services to the benefi t of the people of PNG.” The budget statement observed that progressive amendments to the IPBC Act have allowed governance practices and accountability mechanisms to deteriorate, with the result that confl icts of interest have been permitted within the IPBC board; the powers of IPBC have been expanded; and transparency and accountability have been eroded.
To address these failures, the government introduced a new set of proposed amendments to the IPBC Act in early 2012.18 While some of
these amendments should help to strengthen the accountability mechanisms of the SOEs, they still lack a statement of principal objective and also include a provision that is likely to substantially weaken core governance practices. Specifi cally, the proposed amendment will give the NEC the power to appoint SOE directors on the recommendation of the minister, without any involvement from the IPBC board. This is in contrast to the current process in which the board of IPBC selects and appoints the members of the SOE boards, with the NEC having only a limited veto power.19
This proposed amendment is therefore likely to not only increase the politicization of the SOE boards, but also to signifi cantly weaken the IPBC’s oversight role. The IPBC cannot be held accountable for the eff ective ownership monitoring and performance of the SOEs if it does not control the selection and appointment of the directors, and is not able to hold them accountable for performance and exercise the ultimate sanction of termination.
It is recommended that PNG consider the following further refi nements to the IPBC Act to strengthen its accountability and oversight mechanisms while empowering the SOEs to pursue clear commercial objectives:
• Specify that the primary objective of all majority-owned SOEs is to operate as successful businesses, which is defi ned as being as profi table as comparable businesses not owned by the state.20
• Retain the provision that IBPC appoint the directors to the SOEs—subject only to NEC veto.
• Specify that IBPC must only appoint directors that the board of IBPC considers have the appropriate skills, knowledge, and experience to assist the SOE to achieve its primary objective.
18 Speech by the minister for public enterprises, the Rt. Hon. Mekere Morauta, KCMG MP, on the occasion of the second reading of the IPBC Act (Amendment) Bill 2012, dated 22 March 2012.
19 Section 9A of the IPBC Act. 20 This principal objective could be inserted into Section 46 of the IPBC Act.
15
Unique Characteristics of the Papua New Guinea State-Owned Enterprise Sector
• Require all SOE annual plans to demonstrate that they are consistent with the achievement of their primary objectives.
• Require annual plans to include fi nancial forecasts and objectives for at least 3 fi nancial years from the date of adoption.
• Insert a provision to ensure that SOE directors are subject to comparable duties and obligations as the IPBC directors and those established in the Companies Act.21
• Require that a summary of the SOE annual plans be published in local newspapers and on the internet together with a summary of the annual accounts, which will contain a statement comparing actual performance against the targets set out in the plan.
B. Ongoing Reforms
In addition to the proposed amendments to the IPBC Act of PNG, the SOE policy framework has shifted signifi cantly since late 2011, as detailed in the treasurer’s 2012 budget paper. The budget identifi es a number of key SOE reforms: (i) a public dividend policy setting out the government’s dividend expectation for the SOEs, (ii) a community service obligaion (CSO) policy framework to ensure SOEs operate commercially and deliver CSOs on a commercial basis, (iii) the development of public–private partnership (PPP) legislation to complement the existing and planned PPP arrangements, (iv) an onlending policy to ensure there is a level playing fi eld between SOEs and the private sector, and (v) an appropriate risk sharing between the state as lender and SOEs as borrowers.
Key achievements by IPBC to date include the following:
• A new managing director and board were appointed to IBPC in 2011 with a mandate to diligently implement the IPBC Act.
• The boards of all of the SOEs have been restructured.
• The IPBC has published its accounts and annual plan for the fi rst time on the IPBC website and is encouraging SOEs to do the same.22 In early 2012, all SOEs produced annual plans for the fi rst time.
• The IPBC has been directed to develop and submit a policy paper on the management of SOEs, including divestment of shares and commercial investments, the extent to which boards should be permitted to operate in a commercial manner independent of government, and improved monitoring mechanisms.
• The government will seek to improve its oversight function to ensure IPBC compliance with current and future provisions of the IPBC Act.
To add to this, IPBC’s business plan for 2012 lists the organization’s priority areas for the next decade and includes the following initiatives:
• Ensure compliance with the planning and reporting requirements contained in the IPBC Act;23
• Establish stronger links with the Independent Consumer Competition Commission in defi ning and enforcing service standards and fi nancial performance outcomes for SOEs;
• Publicly report on SOE service standard outcomes and fi nancial performance;
• Review and report on opportunities for greater private sector involvement through mechanisms such as independent power producers, PPPs, and possible divestment of shares in SOEs; and
• Contribute to the fi nalization of the CSO, dividend, and onlending policies for government consideration, in consultation with the treasury.
21 As established by Section 17 of the IPBC Act.22 The IPBC published the 2010 audited accounts for the General Business Trust (GBT) on its website.23 In particular, Section 34 of IPBC’s annual plan, Section 45 of the IPBC’s annual report, and Section 46E of majority-owned SOE’s annual plans.
16
Finding Balance
If the initiatives outlined in the budget and IPBC’s business plan are implemented, they will go a long way towards creating a legislative and governance framework that will encourage improved SOE performance. Sustained political commitment will be critical to successful implementation. For example, the current practice of allowing certain SOEs to circumvent the legislative requirements and IPBC’s oversight mandate must be stopped; otherwise, it will simply encourage other breaches. The responsible ministers are the only group with the power to enforce full compliance and therefore have the most infl uence over the performance of the SOE portfolio.
In addition, it is recommended that the government consider winding up the GBT and reconstituting IPBC as a company that owns the SOEs. The analysis undertaken through this study shows that the trust structure adds no benefi t to the eff ective control and oversight of the PNG SOEs, nor does it enhance their commercial focus. What it has done is add another level of legal and operational complexity that has assisted in shrouding what is actually happening with and within the SOE portfolio.24 Incorporating IPBC under the Companies Act would give it the same legal status as that of eight of the nine SOEs in its portfolio, and would simplify reporting and accountability mechanisms.
24 This additional level of legal complexity is evidenced by Note 15 to the GBT 2010 audited accounts, where it is recorded that vesting orders issued by the government have vested assets in the IPBC as trustee rather than in the GBT as owner.

17
Unique Characteristics of the Papua New Guinea State-Owned Enterprise Sector
IV. State-Owned Enterprise Reform in the Pacifi c: Progress and Lessons for Papua New Guinea
In Papua New Guinea, the period from 1999–2002 saw very aggressive SOE reforms, including a privatization program, the establishment of the Independent Consumer Competition Commission,25 and the implementation of a policy introducing competition in sectors previously reserved for SOEs. During this 3-year period, the government possessed the required political consensus to pursue these reforms, but with the change of government in 2002 came a very diff erent policy: one focused on the consolidation and growth of the SOE portfolio. Privatization activities were halted and in some cases reversed, and there began a gradual erosion of accountability and transparency, as detailed in Section III of this report. From FY2002 to FY2010, PNG’s SOE portfolio more than doubled in asset size while generating steadily declining returns.
In the other fi ve Pacifi c countries participating in this study, the pace and direction of reforms have diff ered markedly. Tonga has continued to make steady progress in restructuring the SOE boards and improving the commercial focus of its SOEs. Solomon Islands has been rapidly picking up the pace of reforms since 2010. Samoa made important progress in 2011 and 2012, appointing 180 new directors from the private sector, removing ministers from all of its SOE boards, and reducing the number of civil servants from 66 to just 7. This has resulted in a dramatic decline in the number of SOE directors who were also ministers or civil servants from 48% in 2010 to just 6% in 2012. Fiji and the Republic of
A. Challenges and Progress with State-Owned Enterprise Reform in the Pacifi c
While the governments of all six Pacifi c countries participating in this study recognize the need to improve the performance of their state-owned enterprises (SOEs), the pace and extent of reforms have varied in line with the extent of political commitment of successive governments. This reality underscores both the importance of sustained political commitment and the sensitivities surrounding SOE reform. Because the benefi ts of SOE reform are often realized only after costs have been incurred, SOE reform can have negative short-term political consequences. Political opposition to SOE reform often stems from concern about (i) the potential loss of patronage; (ii) the loss of direct control over SOEs, which are perceived to be important policy implementation tools; and (iii) potential job losses as SOEs are restructured and made more effi cient. International experience has amply demonstrated, however, that a government that retains ownership of its SOEs for control is unlikely to be self-disciplined about how it exercises that control. In other cases, opposition to SOE reform is rooted in a distrust of the private sector and a belief that in small economies, like those in the Pacifi c, market forces and competition erode consumer welfare rather than enhance it. Section VI of this report addresses these and other common objections to SOE reform.
25 The Independent Consumer Competition Commission has powers of economic regulation over SOEs with monopoly market positions.
18
Finding Balance
the Marshall Islands (RMI), which have struggled for the past 5 years to implement any substantive SOEs reforms, have shown renewed commitment in 2012, with Cabinet approval of a new SOE policy in the RMI and the launching of a new SOE reform program in Fiji.
Of the six Pacifi c countries participating in this study, Tonga has benefi tted from the strongest political commitment to SOE reform, which has resulted in an ambitious SOE rationalization program. As a result, Tonga’s SOE portfolio has outperformed the fi ve other countries during the FY2002–FY2010 period. Key achievements include the privatization of Leiola Duty Free and Tonga Machinery Pool; the restructuring of 10 SOE boards by replacing all public servants and elected offi cials serving on those boards with independent directors; the publication of the fi nancial results of the SOEs in local newspapers; the implementation of rationalization strategies for all but three of the SOEs; the development and implementation of a director performance evaluation program; and the adoption of the robust Public Enterprise Amendment Act in 2010 to further strengthen governance, accountability, and community service obligation (CSO) provisions applicable to the SOEs. Reform progress, however, slowed in 2011. While a number of reform tasks were commenced, such as the liquidation of the joint venture that owns the International Dateline Hotel, the preparation of
the Tonga Print privatization and a review of Tonga Communications Corporation, where the return on equity (ROE) has fallen from 18.6% in 2004 to –5.8% in 2012, reform implementation has been weak.
Samoa, in contrast, has a history of successful SOE privatization, but has had diffi culty harnessing the needed political commitment to implement the core governance and accountability provisions of its robust SOE legislation. As a result, Samoa’s SOEs have consistently fallen short of their performance targets. New momentum appears to be building since 2009 with the privatization of the Samoa Broadcasting Corporation and SamoaTel; the preparation of another two SOEs for privatization in 2012 and 2013; the implementation of new CSO guidelines for SOEs; the appointment of an independent director selection committee in April 2010; and the passage of the Composition Bill in early 2012, paving the way for the appointment of 180 new SOE directors drawn from the private sector. While these recent reforms show some renewed commitment to improving the performance and accountability of its SOEs, Samoa still fails to restructure or close chronically loss-making SOEs or impose hard budget constraints. Its new Unit Trust, launched in 2009, continues this practice by providing subsidized credit to the SOEs.26
In Fiji, progress on SOE reforms has varied with each successive government. While the government is currently preparing several SOEs for greater private sector involvement, and is looking to corporatize additional government functions, only limited progress has been made in recent years in restructuring SOEs and introducing greater transparency in the management of CSOs. Capacity constraints and limited external support have exacerbated the pace of reform. As a consequence, the SOEs have continued to generate very low returns. This may now be changing, however, as the government has committed to develop a new
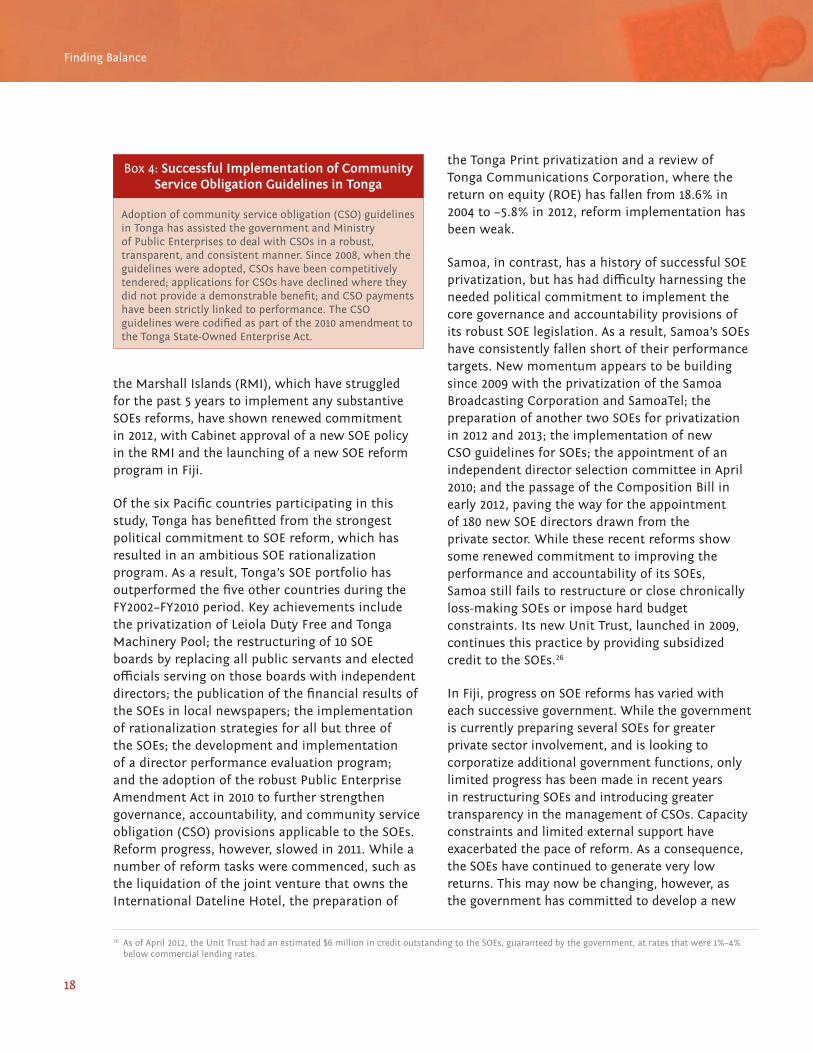
Box 4: Successful Implementation of Community Service Obligation Guidelines in Tonga
Adoption of community service obligation (CSO) guidelines in Tonga has assisted the government and Ministry of Public Enterprises to deal with CSOs in a robust, transparent, and consistent manner. Since 2008, when the guidelines were adopted, CSOs have been competitively tendered; applications for CSOs have declined where they did not provide a demonstrable benefi t; and CSO payments have been strictly linked to performance. The CSO guidelines were codifi ed as part of the 2010 amendment to the Tonga State-Owned Enterprise Act.
26 As of April 2012, the Unit Trust had an estimated $6 million in credit outstanding to the SOEs, guaranteed by the government, at rates that were 1%–4% below commercial lending rates.
19
State-Owned Enterprise Reform in the Pacifi c: Progress and Lessons for Papua New Guinea
SOE reform pipeline in 2012 and undertake the restructuring of several SOEs.
In the RMI, eff orts to reform SOEs over the past 2 decades have had little sustained impact. In essence, these eff orts have failed to address the more fundamental issues, which include the inability of the SOEs to recover the full costs of service delivery and operate on commercial terms within an appropriate accountability structure. This is compounded by the lack of an eff ective legislative framework and ownership monitor for the SOEs, which further diff uses the responsibility for poor SOE performance. The RMI SOE portfolio has generated operating losses annually during FY2002–FY2010. The situation should improve, however, with the Cabinet approving a new SOE policy in 2012, the preparation of a legislative framework for the SOEs, and the ongoing restructuring of the electricity utility, which is the largest SOE.
In Solomon Islands, decades of poor governance practices have led to chronic underperformance. Although the Solomon Islands SOE portfolio is one of the poorest performers among the six Pacifi c countries participating in this study, there are encouraging signs of reform. Since 2008, the privatization of Home Finance, Sasape Marina, Soltai, and Solomon Island Print have been completed; CSO regulations have been enacted and largely implemented; a rigorous SOE director selection process is being implemented; and all elected offi cials have been removed from SOE boards. It is
expected that 15 new SOE directors will be appointed in 2012, all drawn from the private sector.
B. Lessons for Papua New Guinea
The SOE reform experiences of all of the Pacifi c countries participating in this study provide some very clear lessons:
(i) Sustained political commitment is vital to successful reform.
(ii) Continued fi nancing of poorly performing SOEs does not restore their profi tability, and often creates negative performance incentives.
(iii) There is a clear link between weak governance arrangements and poor SOE performance.
(iv) The most successful SOEs are those that operate on strict commercial principles with consequences for poor performance.
(v) The private sector has the capacity to invest in SOEs and to deliver CSOs, and should be given the opportunity to do so.
Through their participation in this benchmarking study and the ensuing high-level dialogue, Fiji, PNG, the RMI, Samoa, Solomon Islands, and Tonga have recognized that successful SOE reform requires SOEs to adopt governance and accountability structures that most closely mirror those arrangements found in listed private sector fi rms.
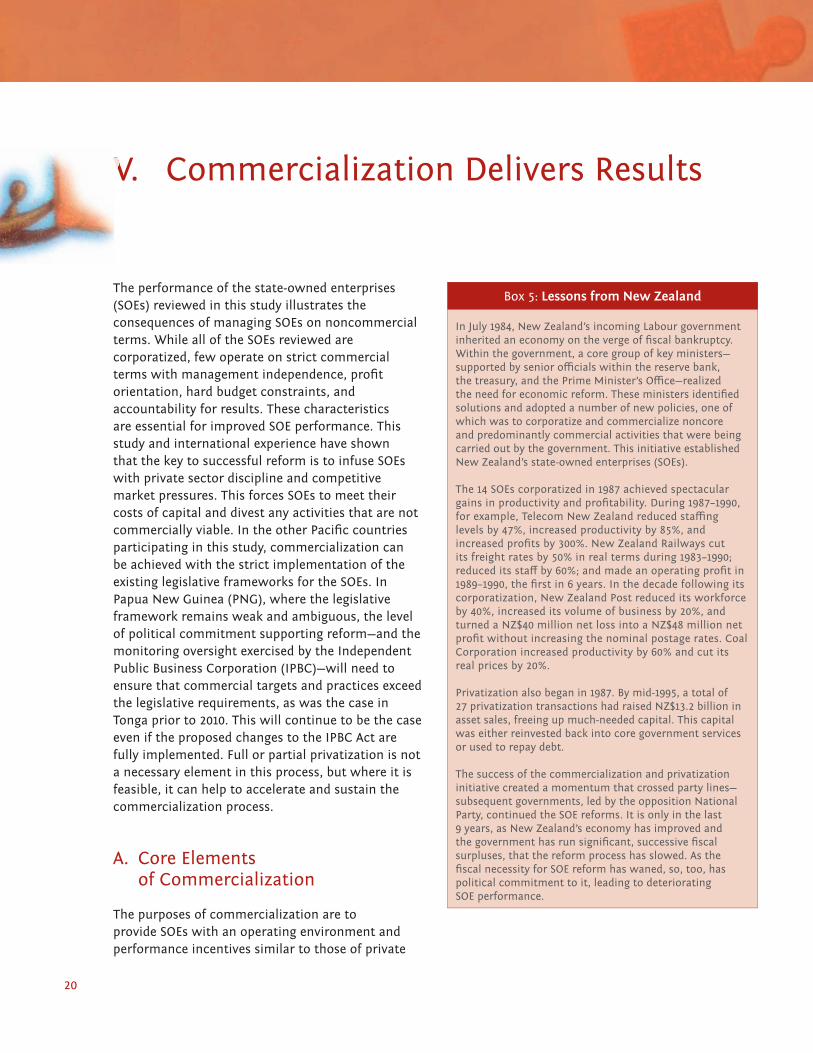
20
V. Commercialization Delivers ResultsV. Commercialization Delivers ResultsV. Commercialization Delivers Results
The performance of the state-owned enterprises (SOEs) reviewed in this study illustrates the consequences of managing SOEs on noncommercial terms. While all of the SOEs reviewed are corporatized, few operate on strict commercial terms with management independence, profi t orientation, hard budget constraints, and accountability for results. These characteristics are essential for improved SOE performance. This study and international experience have shown that the key to successful reform is to infuse SOEs with private sector discipline and competitive market pressures. This forces SOEs to meet their costs of capital and divest any activities that are not commercially viable. In the other Pacifi c countries participating in this study, commercialization can be achieved with the strict implementation of the existing legislative frameworks for the SOEs. In Papua New Guinea (PNG), where the legislative framework remains weak and ambiguous, the level of political commitment supporting reform—and the monitoring oversight exercised by the Independent Public Business Corporation (IPBC)—will need to ensure that commercial targets and practices exceed the legislative requirements, as was the case in Tonga prior to 2010. This will continue to be the case even if the proposed changes to the IPBC Act are fully implemented. Full or partial privatization is not a necessary element in this process, but where it is feasible, it can help to accelerate and sustain the commercialization process.
A. Core Elements of Commercialization
The purposes of commercialization are to provide SOEs with an operating environment and performance incentives similar to those of private
Box 5: Lessons from New Zealand
In July 1984, New Zealand’s incoming Labour government inherited an economy on the verge of fi scal bankruptcy. Within the government, a core group of key ministers—supported by senior offi cials within the reserve bank, the treasury, and the Prime Minister’s Offi ce—realized the need for economic reform. These ministers identifi ed solutions and adopted a number of new policies, one of which was to corporatize and commercialize noncore and predominantly commercial activities that were being carried out by the government. This initiative established New Zealand’s state-owned enterprises (SOEs).
The 14 SOEs corporatized in 1987 achieved spectacular gains in productivity and profi tability. During 1987–1990, for example, Telecom New Zealand reduced staffi ng levels by 47%, increased productivity by 85%, and increased profi ts by 300%. New Zealand Railways cut its freight rates by 50% in real terms during 1983–1990; reduced its staff by 60%; and made an operating profi t in 1989–1990, the fi rst in 6 years. In the decade following its corporatization, New Zealand Post reduced its workforce by 40%, increased its volume of business by 20%, and turned a NZ$40 million net loss into a NZ$48 million net profi t without increasing the nominal postage rates. Coal Corporation increased productivity by 60% and cut its real prices by 20%.
Privatization also began in 1987. By mid-1995, a total of 27 privatization transactions had raised NZ$13.2 billion in asset sales, freeing up much-needed capital. This capital was either reinvested back into core government services or used to repay debt.
The success of the commercialization and privatization initiative created a momentum that crossed party lines—subsequent governments, led by the opposition National Party, continued the SOE reforms. It is only in the last 9 years, as New Zealand’s economy has improved and the government has run signifi cant, successive fi scal surpluses, that the reform process has slowed. As the fi scal necessity for SOE reform has waned, so, too, has political commitment to it, leading to deteriorating SOE performance.
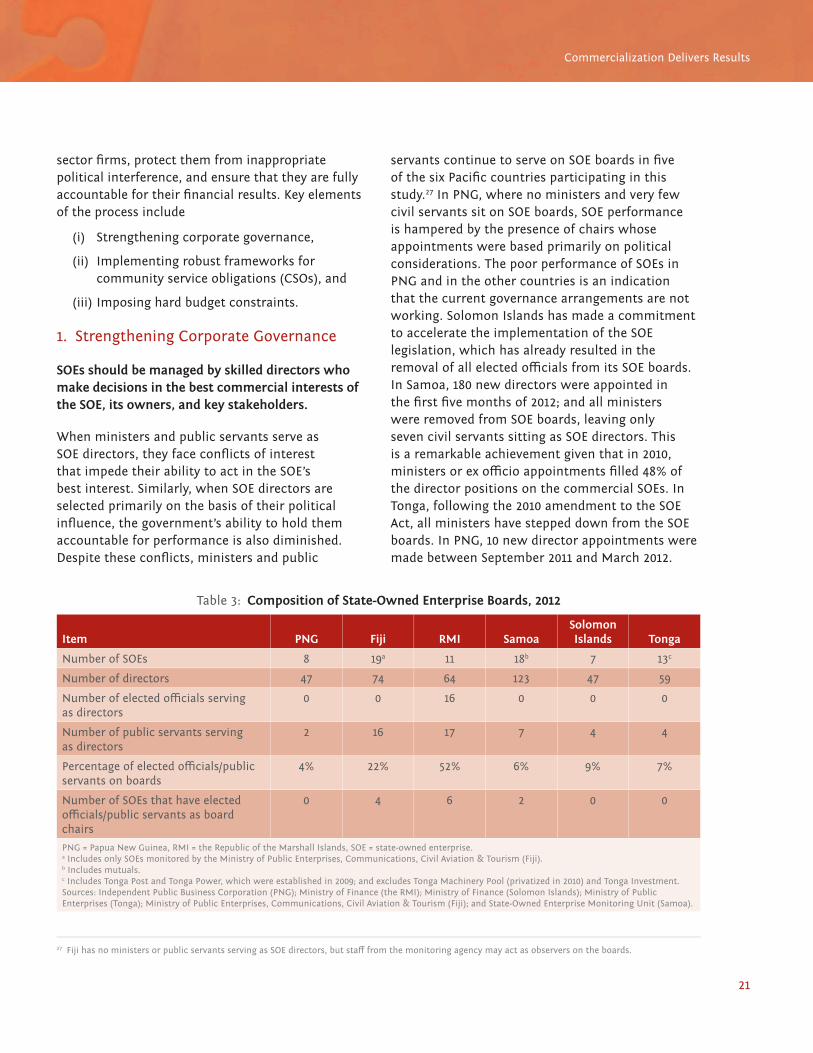
21
Commercialization Delivers Results
sector fi rms, protect them from inappropriate political interference, and ensure that they are fully accountable for their fi nancial results. Key elements of the process include
(i) Strengthening corporate governance,
(ii) Implementing robust frameworks for community service obligations (CSOs), and
(iii) Imposing hard budget constraints.
1. Strengthening Corporate Governance
SOEs should be managed by skilled directors who make decisions in the best commercial interests of the SOE, its owners, and key stakeholders.
When ministers and public servants serve as SOE directors, they face confl icts of interest that impede their ability to act in the SOE’s best interest. Similarly, when SOE directors are selected primarily on the basis of their political infl uence, the government’s ability to hold them accountable for performance is also diminished. Despite these confl icts, ministers and public
servants continue to serve on SOE boards in fi ve of the six Pacifi c countries participating in this study.27 In PNG, where no ministers and very few civil servants sit on SOE boards, SOE performance is hampered by the presence of chairs whose appointments were based primarily on political considerations. The poor performance of SOEs in PNG and in the other countries is an indication that the current governance arrangements are not working. Solomon Islands has made a commitment to accelerate the implementation of the SOE legislation, which has already resulted in the removal of all elected offi cials from its SOE boards. In Samoa, 180 new directors were appointed in the fi rst fi ve months of 2012; and all ministers were removed from SOE boards, leaving only seven civil servants sitting as SOE directors. This is a remarkable achievement given that in 2010, ministers or ex offi cio appointments fi lled 48% of the director positions on the commercial SOEs. In Tonga, following the 2010 amendment to the SOE Act, all ministers have stepped down from the SOE boards. In PNG, 10 new director appointments were made between September 2011 and March 2012.
27 Fiji has no ministers or public servants serving as SOE directors, but staff from the monitoring agency may act as observers on the boards.
Table 3: Composition of State-Owned Enterprise Boards, 2012
Item PNG Fiji RMI SamoaSolomon Islands Tonga
Number of SOEs 8 19a 11 18b 7 13c
Number of directors 47 74 64 123 47 59
Number of elected offi cials serving as directors
0 0 16 0 0 0
Number of public servants serving as directors
2 16 17 7 4 4
Percentage of elected offi cials/public servants on boards
4% 22% 52% 6% 9% 7%
Number of SOEs that have elected offi cials/public servants as board chairs
0 4 6 2 0 0
PNG = Papua New Guinea, RMI = the Republic of the Marshall Islands, SOE = state-owned enterprise.a Includes only SOEs monitored by the Ministry of Public Enterprises, Communications, Civil Aviation & Tourism (Fiji).b Includes mutuals.c Includes Tonga Post and Tonga Power, which were established in 2009; and excludes Tonga Machinery Pool (privatized in 2010) and Tonga Investment.Sources: Independent Public Business Corporation (PNG); Ministry of Finance (the RMI); Ministry of Finance (Solomon Islands); Ministry of Public Enterprises (Tonga); Ministry of Public Enterprises, Communications, Civil Aviation & Tourism (Fiji); and State-Owned Enterprise Monitoring Unit (Samoa).

22
Finding Balance
2. Implementing Robust Frameworks for Community Service Obligations
CSOs should be delivered only on a full cost-recovery basis.
SOEs are often charged with delivering CSOs, even though in many cases they are not adequately compensated for the cost of these services. This practice complicates the resource planning of SOEs and distorts their performance incentives. It also distorts the government’s ability to calculate the actual cost of the CSOs and determine whether or not the benefi ts are worth the costs. All countries should adopt international best practices for managing CSOs, including (i) rigorously identifying, costing, contracting, fi nancing, and monitoring the delivery of CSOs; and (ii) delivering CSOs only on a full cost-recovery basis.
Among Pacifi c island countries, Samoa, Solomon Islands, and Tonga have taken the lead in adopting these best practices, having developed CSO guidelines and mandated that all CSOs must be formally negotiated between the requesting ministry and the SOE. This has resulted in a reduced number of applications for CSOs and an increased scrutiny of the costs and benefi ts associated with each approved CSO. In Samoa, the strict application of the CSO guidelines has resulted in the approval of CSO payments to only three SOEs. All other noncommercial services provided by SOEs (e.g., airports, noncommercial ports, and remote bank branches) should be discontinued, unless formally approved and fi nanced under the guidelines. This has proved diffi cult to implement, however, and the fi nes and penalties, for which violators of the SOE Act and regulations are liable, are rarely enforced. In Solomon Islands, formal CSO contracts have been prepared for one SOE in 2011 and two more in 2012, and the government has successfully implemented a pay-for-performance approach.
Fiji’s CSO framework is not as robust, but it is the fi rst of the Pacifi c island countries to eff ectively outsource CSO provision to the private sector. The government has contracted out remote air and
shipping services to private providers, who bid for the routes in a competitive tender. This has signifi cantly reduced the cost of service provision and has given the government a market-based
Box 6: Does Political Interference Impact Performance of State-Owned Enterprises?
Yes. Political interference can make it very diffi cult for state-owned enterprises (SOEs) to meet their fi nancial performance targets. When SOEs are directed by politicians to undertake activities that are not commercially viable, and are not specifi cally compensated for these activities, their fi nancial performance suff ers. The portfolios of Fiji, the Republic of the Marshall Islands (RMI), Samoa, Solomon Islands, and Tonga contain many examples of political interference in the management decisions of SOEs.
In Fiji. As a government commercial company, Rewa Rice is required to achieve a 10% return on equity (ROE), yet the government has also mandated that it continue to operate the Dreketi rice mill to support the local rice farming community, without a corresponding community service obligation (CSO) payment. The mill is not commercially viable and it represents a drain on the company’s profi tability.
In Tonga. The Tongan Development Bank is required to achieve a target ROE of 10% while also maintaining a branch network that is not commercially sustainable and for which the bank does not receive direct compensation. The Tonga Water Board and the Waste Authority were discouraged by their politically—led boards from instigating improved collections, as requiring payment for water and waste collection services was perceived as politically unpopular.
In the RMI Papua New Guinea, and Solomon Islands. SOEs, particularly infrastructure SOEs, are prohibited from disconnecting defaulting customers, especially where those customers are other SOEs and government ministries. The prohibition can also extend to private sector customers.
In Samoa. The investment decisions of the Samoa National Provident Fund (SNPF) also appear to be subject to political infl uence. The SNPF is owned by its contributors, although its board is appointed by the government. It manages a high-risk, low-return portfolio, in which loans to local organizations and individuals make up 62% of total assets. Many of the SNPF’s borrowers are SOEs that are in arrears and have demonstrated a limited ability to repay. In recent years, the SNPF’s return on assets has averaged under 6% per year (net of administrative fees). It is likely that the SNPF would make diff erent investment decisions and generate higher returns if it were managed on a purely commercial basis, with a focus on maximizing returns to contributors.
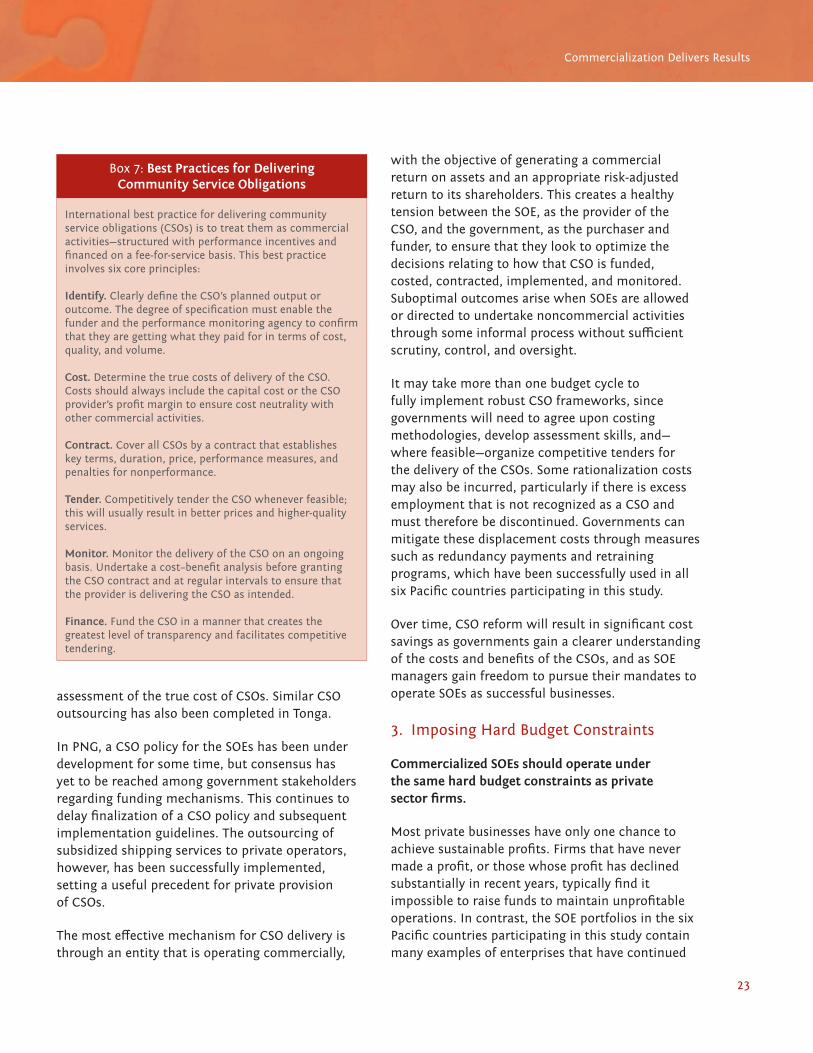
23
Commercialization Delivers Results
assessment of the true cost of CSOs. Similar CSO outsourcing has also been completed in Tonga.
In PNG, a CSO policy for the SOEs has been under development for some time, but consensus has yet to be reached among government stakeholders regarding funding mechanisms. This continues to delay fi nalization of a CSO policy and subsequent implementation guidelines. The outsourcing of subsidized shipping services to private operators, however, has been successfully implemented, setting a useful precedent for private provision of CSOs.
The most eff ective mechanism for CSO delivery is through an entity that is operating commercially,
with the objective of generating a commercial return on assets and an appropriate risk-adjusted return to its shareholders. This creates a healthy tension between the SOE, as the provider of the CSO, and the government, as the purchaser and funder, to ensure that they look to optimize the decisions relating to how that CSO is funded, costed, contracted, implemented, and monitored. Suboptimal outcomes arise when SOEs are allowed or directed to undertake noncommercial activities through some informal process without suffi cient scrutiny, control, and oversight.
It may take more than one budget cycle to fully implement robust CSO frameworks, since governments will need to agree upon costing methodologies, develop assessment skills, and—where feasible—organize competitive tenders for the delivery of the CSOs. Some rationalization costs may also be incurred, particularly if there is excess employment that is not recognized as a CSO and must therefore be discontinued. Governments can mitigate these displacement costs through measures such as redundancy payments and retraining programs, which have been successfully used in all six Pacifi c countries participating in this study.
Over time, CSO reform will result in signifi cant cost savings as governments gain a clearer understanding of the costs and benefi ts of the CSOs, and as SOE managers gain freedom to pursue their mandates to operate SOEs as successful businesses.
3. Imposing Hard Budget Constraints
Commercialized SOEs should operate underthe same hard budget constraints as private sector fi rms.
Most private businesses have only one chance to achieve sustainable profi ts. Firms that have never made a profi t, or those whose profi t has declined substantially in recent years, typically fi nd it impossible to raise funds to maintain unprofi table operations. In contrast, the SOE portfolios in the six Pacifi c countries participating in this study contain many examples of enterprises that have continued
Box 7: Best Practices for Delivering Community Service Obligations
International best practice for delivering community service obligations (CSOs) is to treat them as commercial activities—structured with performance incentives and fi nanced on a fee-for-service basis. This best practice involves six core principles:
Identify. Clearly defi ne the CSO’s planned output or outcome. The degree of specifi cation must enable the funder and the performance monitoring agency to confi rm that they are getting what they paid for in terms of cost, quality, and volume.
Cost. Determine the true costs of delivery of the CSO. Costs should always include the capital cost or the CSO provider’s profi t margin to ensure cost neutrality with other commercial activities.
Contract. Cover all CSOs by a contract that establishes key terms, duration, price, performance measures, and penalties for nonperformance.
Tender. Competitively tender the CSO whenever feasible; this will usually result in better prices and higher-quality services.
Monitor. Monitor the delivery of the CSO on an ongoing basis. Undertake a cost–benefi t analysis before granting the CSO contract and at regular intervals to ensure that the provider is delivering the CSO as intended.
Finance. Fund the CSO in a manner that creates the greatest level of transparency and facilitates competitive tendering.
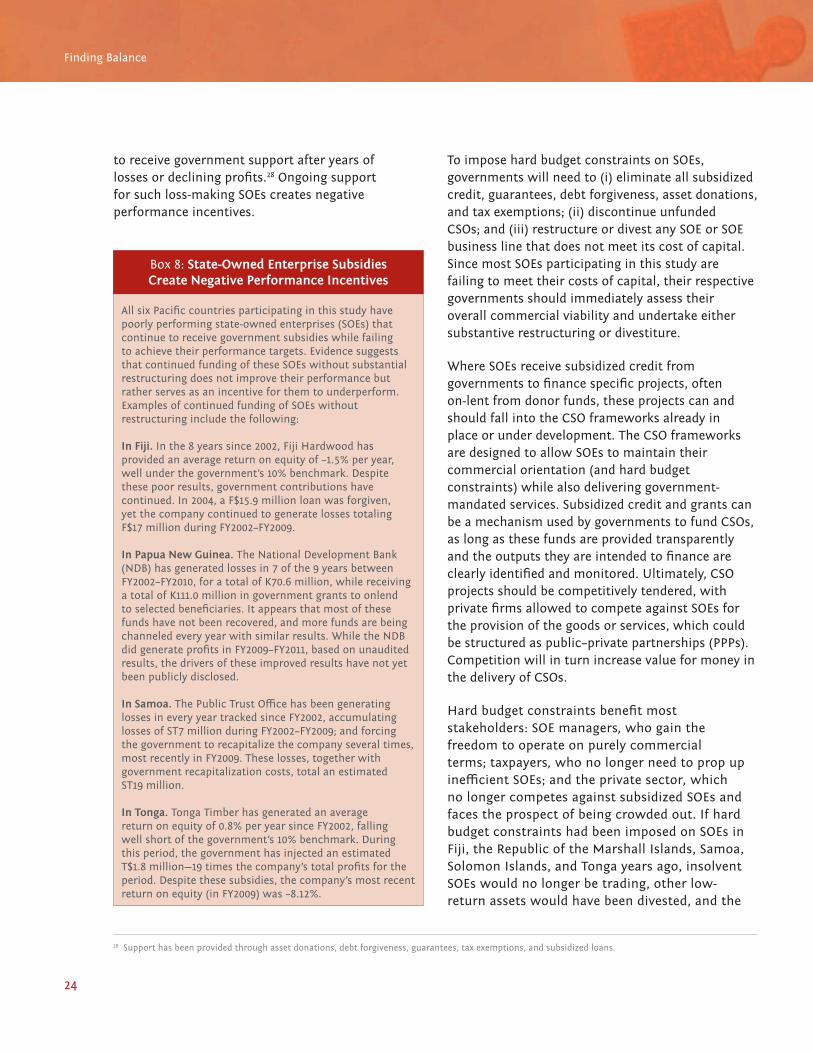
24
Finding Balance
to receive government support after years of losses or declining profi ts.28 Ongoing support for such loss-making SOEs creates negative performance incentives.
28 Support has been provided through asset donations, debt forgiveness, guarantees, tax exemptions, and subsidized loans.
Box 8: State-Owned Enterprise Subsidies Create Negative Performance Incentives
All six Pacifi c countries participating in this study have poorly performing state-owned enterprises (SOEs) that continue to receive government subsidies while failing to achieve their performance targets. Evidence suggests that continued funding of these SOEs without substantial restructuring does not improve their performance but rather serves as an incentive for them to underperform. Examples of continued funding of SOEs without restructuring include the following:
In Fiji. In the 8 years since 2002, Fiji Hardwood has provided an average return on equity of –1.5% per year, well under the government’s 10% benchmark. Despite these poor results, government contributions have continued. In 2004, a F$15.9 million loan was forgiven, yet the company continued to generate losses totaling F$17 million during FY2002–FY2009.
In Papua New Guinea. The National Development Bank (NDB) has generated losses in 7 of the 9 years between FY2002–FY2010, for a total of K70.6 million, while receiving a total of K111.0 million in government grants to onlend to selected benefi ciaries. It appears that most of these funds have not been recovered, and more funds are being channeled every year with similar results. While the NDB did generate profi ts in FY2009–FY2011, based on unaudited results, the drivers of these improved results have not yet been publicly disclosed.
In Samoa. The Public Trust Offi ce has been generating losses in every year tracked since FY2002, accumulating losses of ST7 million during FY2002–FY2009; and forcing the government to recapitalize the company several times, most recently in FY2009. These losses, together with government recapitalization costs, total an estimated ST19 million.
In Tonga. Tonga Timber has generated an average return on equity of 0.8% per year since FY2002, falling well short of the government’s 10% benchmark. During this period, the government has injected an estimated T$1.8 million—19 times the company’s total profi ts for the period. Despite these subsidies, the company’s most recent return on equity (in FY2009) was –8.12%.
To impose hard budget constraints on SOEs, governments will need to (i) eliminate all subsidized credit, guarantees, debt forgiveness, asset donations, and tax exemptions; (ii) discontinue unfunded CSOs; and (iii) restructure or divest any SOE or SOE business line that does not meet its cost of capital. Since most SOEs participating in this study are failing to meet their costs of capital, their respective governments should immediately assess their overall commercial viability and undertake either substantive restructuring or divestiture.
Where SOEs receive subsidized credit from governments to fi nance specifi c projects, often on-lent from donor funds, these projects can and should fall into the CSO frameworks already in place or under development. The CSO frameworks are designed to allow SOEs to maintain their commercial orientation (and hard budget constraints) while also delivering government-mandated services. Subsidized credit and grants can be a mechanism used by governments to fund CSOs, as long as these funds are provided transparently and the outputs they are intended to fi nance are clearly identifi ed and monitored. Ultimately, CSO projects should be competitively tendered, with private fi rms allowed to compete against SOEs for the provision of the goods or services, which could be structured as public–private partnerships (PPPs). Competition will in turn increase value for money in the delivery of CSOs.
Hard budget constraints benefi t most stakeholders: SOE managers, who gain the freedom to operate on purely commercial terms; taxpayers, who no longer need to prop up ineffi cient SOEs; and the private sector, which no longer competes against subsidized SOEs and faces the prospect of being crowded out. If hard budget constraints had been imposed on SOEs in Fiji, the Republic of the Marshall Islands, Samoa, Solomon Islands, and Tonga years ago, insolvent SOEs would no longer be trading, other low-return assets would have been divested, and the
25
Commercialization Delivers Results
remaining SOEs would have been motivated to signifi cantly improve their productivity.
Strengthened governance practices and hard budget constraints will increase the transparency and independence of SOEs, allowing governments to better assess their contributions and hold them accountable for performance.
Statements of corporate intent and corporate plans (also called business plans) should play an important role in setting out the strategies and performance targets of SOEs. Contracts for CSOs should ensure that any noncommercial activities are undertaken on a full cost-recovery basis. With these tools in place, stakeholders will be able to measure the performance of SOE boards and management, in particular by regularly reviewing fi nancial and nonfi nancial outcomes against targets. In addition, increased transparency will enable the government and—more importantly—the media and the general public to monitor SOE performance. This scrutiny will encourage greater accountability of SOEs, especially among their key decision makers. Regular reporting of SOE performance should, in turn, compel governments to restructure or divest SOEs that cannot cover the cost of their capital.
Statements of corporate intent, corporate plans, and CSO contracts would all enhance the transparency and accountability of SOEs. Another valuable tool would be the regular publication of detailed reports on SOE fi nancial and nonfi nancial performance. These reports would provide an overview of the performance relative to targets set in the statement of corporate intent of the SOEs, and would also list all government and interagency transactions with each SOE. These reports would enable both the SOE monitoring unit and the public to assess overall performance; and the degree to which SOEs continue to receive support from the government, the extent to which this support distorts the true fi nancial performance of the SOEs, and whether the support is achieving the outcomes sought. This information would signifi cantly improve the ability of SOE monitoring units to
determine which additional reform measures would be most eff ective, and to allow the public to judge how well the SOEs are achieving the objectives for which they were established.
Among the six Pacifi c countries participating in this study, Tonga was the fi rst to publicly report on the performance of its SOEs by publishing notices in the local press highlighting the fi nancial results of its SOEs in 2008 and 2009. The practice of public disclosure of SOE performance is now mandated in the Solomon Islands SOE Act and the 2010 amendment to the Tonga SOE Act.
In PNG, IPBC published its accounts for the fi rst time in 2011, but the SOEs have not followed suit. While there is no statutory requirement for the SOEs to publish their accounts or annual plans, it is hoped that IBPC will likewise publish the accounts and annual plans for all of the SOEs on its website, which would substantially improve public disclosure and transparency.
B. Promoting Private Sector Participation
Partial privatization and PPPs can help to accelerate commercialization.
When full privatization is not politically feasible or desirable, partial privatization can help to accelerate commercialization and improve SOE performance. One of the most common forms of partial privatization is the joint venture, where the public and private sectors collaborate in forming a company to provide specifi c services (e.g., PolyBlue in Samoa). Another option is PPP, which in certain circumstances can be more suitable than full privatization for attracting private investment. A PPP is not a joint venture; it is a shared-risk contract between the public and private sectors to deliver a specifi c output over a period of time.
PPPs have been used extensively throughout the world, and increasingly in Pacifi c island countries. PPPs are most commonly used in the infrastructure

26
Finding Balance
sectors, particularly where large capital investments are required to produce a specifi c output. PPPs can take a number of diff erent forms, but the most common include the following:
(i) Service co ntracts. The private sector provides a service, such as road maintenance or transport, for a fee.
(ii) Management co ntracts. The private sector manages, but does not own, public assets.
(iii) Concessions. The private sector modernizes public assets to deliver a specifi c output.
(iv) Build–own–lease or build–operate–transfer. The private sector builds a new asset (such as a hospital or power generation unit). The asset is then either leased back to the public sector (e.g., a hospital) or its output (e.g., power) is sold to the public sector or directly to consumers.
PPP concepts are not new to Pacifi c island countries. Fiji, for example, has PPP contracts in place for electricity generation, and it is currently seeking even greater private investment into the power sector. Samoa has successfully contracted out road maintenance services, which resulted in a 400% increase in productivity; and most recently, it developed a wastewater treatment facility on a build–operate–transfer basis. In Tonga, PPPs have been used to encourage investment in tourism infrastructure, and the private sector has been contracted to provide onshore services for the government-owned ferry
operator. In Timor-Leste, where a PPP policy and legal framework were adopted in 2012, three major PPP transactions are now under development in the power and transport sectors.
In PNG, the adoption of the PPP policy in 2008 signalled the government’s intention to facilitate greater private participation in the provision of infrastructure and related services. This is to be done through a structured process of project assessment, preparation, and competitive tendering. Establishing the process under the authority of the treasury, as the sole fi scal agency of the government able to manage the country’s long-term fi scal risks, sends a strong signal to the private sector that future PPP arrangements will be structured in a robust and transparent manner. It is important that the government now adopt the supporting PPP legislation so as to give legitimacy to the process, and, in so doing, facilitate the development of a PPP project pipeline.
The PNG government’s intention to adopt the PPP framework was confi rmed in the 2012 national budget, but the draft legislation—which has been ready since 2010—has yet to be submitted to Parliament for consideration. While the government can continue to prepare selected projects for procurement as PPPs, as is the case currently in the power sector with PNG Power, investors will place a risk premium on these projects until a predictable and transparent PPP preparation and procurement process is in place.
27
State-Owned Enterprise Reform: Common Myths
VI. State-Owned Enterprise Reform: Common Myths
establishes the commercial objective for all SOEs as the primary objective. Without a clear commercial focus, decisions will be made that destroy value and progressively compromise the ability of the SOE to provide the goods or services that it has been mandated to deliver. These negative consequences can be seen in many of the SOEs reviewed in this study, which have become dependent on regular cash injections from their shareholder governments in order to maintain operations.
Myth #2: Only SOEs can fulfi ll community service obligations (CSOs); if SOEs are commercialized or privatized, CSOs will be discontinued.
It is often argued that because CSOs are by defi nition noncommercial activities, only the government (including SOEs) can provide them. This is fl awed thinking. There is a diff erence between the government fi nancing CSOs and the government delivering CSOs. The fact that CSOs cannot be fi nanced solely through user fees does not mean that they cannot be provided by the private sector; it only means that they cannot be provided by the private sector without a public sector subsidy. Because SOEs are also required to operate as commercial enterprises, they, too, would require a subsidy to provide CSOs. It is in a government’s best interest to contract the delivery of CSOs to the most effi cient provider, which may or may not be an SOE. The competitive tendering of CSO provision, where feasible, is most likely to result in a more cost-eff ective outcome. In Solomon Islands, for example, the recent tendering of contracts for interisland shipping services resulted in multiple bids, and the successful awarding of the contracts to private providers. In Fiji, private companies already provide
The fact that state-owned enterprises (SOEs) generally underperform than comparable businesses in the private sector is neither new nor disputed by most observers. What is often debated, however, is whether this poor performance is balanced by other benefi ts provided by SOEs, or whether there are broader justifi cations for continued state ownership in these underperforming assets. Should reform even be attempted, or should the status quo be accepted and embraced? Reform is complex and often controversial, regardless of where it is undertaken. Over the years, a number of myths, which have specifi c resonance in the Pacifi c, have evolved to argue against reform. Critically testing these myths is an important step in securing broad-based commitment to reform.
Myth #1: SOEs should not strive to provide a commercial return; they should instead focus on delivering essential services to the people.
Most SOEs are created through a process of corporatizing government departments or agencies; and this is undertaken to provide more transparency, accountability, and better effi ciency incentives for the delivery of goods or services. To argue that SOEs should not strive to provide a commercial return is therefore to argue against the effi ciency incentives that corporatization is designed to provide. This argument also implies that SOE profi tability is incompatible with public service delivery, which is incorrect. Without the objective of providing a commercial return, it is very diffi cult for SOE management and directors to exercise their responsibilities in a fi scally responsible way. This is precisely why the SOE legislation in Fiji, Samoa, Solomon Islands, and Tonga clearly

28
Finding Balance
both subsidized shipping and air transport services under contract to the government; this process has allowed the subsidy to be reduced over time as the volume of users increases, making the services more commercially viable.
Myth #3: The process of commercialization is not achieving the benefi ts promised.
The continued poor performance of SOEs is often cited as evidence that the process of corporatization and commercialization is not working in Pacifi c island countries. This is misleading, however, because the benefi ts of SOE corporatization and commercialization have been well demonstrated throughout the world. In New Zealand, for example, case experience strongly suggests that “there were major gains in effi ciency from corporatization that were distributed among customers and owners. The movement in real prices and service levels show that customers were major benefi ciaries from the changes. The swing from making no return to the government as owner and making substantial payments in dividends and taxes meant that citizens as owners were a major benefi ciary also.”29
While there are also examples in the Pacifi c of the gains that can be achieved through an eff ective commercialization process (e.g., National Bank of Vanuatu, Samoa Broadcasting Corporation, and Tonga Power), there are unfortunately many more instances where the establishment of an SOE has failed to result in the level of improved performance that was sought.
Why are the gains from SOE commercialization not being seen in every case in the Pacifi c? In many instances, SOE commercialization is still incomplete. Simply transferring a set of activities from a ministry or government department into an SOE corporate structure will not result in improved effi ciencies and service delivery unless a conducive policy and regulatory framework exists and is implemented. This framework would include
(i) an SOE policy setting out the government’s expectations on how the SOE portfolio and individual SOEs will be managed to maximize shareholder value and achieve all of the benefi ts sought from the corporatization process; and
(ii) an SOE legislation establishing a commercial focus for SOEs, the governance principles under which they will be managed, and reporting and accountability structures; identifying a minister who will be responsible for the “ownership” interest in the SOE; and establishing an eff ective “ownership” monitoring oversight.
While fi ve of the six Pacifi c countries participating in this study have SOE policies and enabling legislation, their provisions are not being fully implemented. Consequently, while SOEs have been corporatized, many do not operate with management independence, a profi t orientation, hard budget constraints, or accountability for results. The commercialization process has been started but not completed, leading to the negative performance outcomes observed. A core fi nding from this study is that SOE performance is a function of how quickly and completely governments have implemented robust SOE policy and regulatory frameworks.
Myth #4: SOEs are vital generators of employment.
It is often suggested that the privatization or reform of SOEs will result in layoff s and a reduction in employment. This argument is fl awed on a number of grounds:
(i) SOEs actually employ a relatively small proportion of the formal workforce: 2.6% in Fiji, 8.5% in the Republic of the Marshall Islands (RMI), and 5.8% in Tonga. Data constraints do not allow a similar calculation for Samoa and Solomon Islands, but it should be noted that in Samoa, a country that has close to twice the population of Tonga,
29 G. C. Scott. 1996. Government Reform in New Zealand. Occasional Paper No. 140. Washington, DC: International Monetary Fund.
29
State-Owned Enterprise Reform: Common Myths
SOEs employ 1,992 workers, approximately twice that of the SOE sector in Tonga. It would therefore be expected that the SOE sector in Samoa would employ about the same proportion of the formal workforce as in Tonga. In Solomon Islands, however, SOEs employ 1,877 workers, about the same number as in Samoa, yet the formal workforce is almost twice the size, so the percentage of the formal workforce in the SOE sector will be well under 5%.
(ii) If the SOE is providing valuable goods or services, those goods or services will still be required post-privatization; and employees will therefore continue to be required. While there may be some restructuring resulting in a rationalization of the workforce, this should result in the SOE being more competitive and therefore able to sustainably grow and expand its workforce in the future.
(iii) The SOE portfolios in all of the Pacifi c countries taking part in this study are failing to achieve a reasonable return on their equity. They are therefore not contributing to overall economic growth, but are in fact destroying economic value. Continued government ownership in underperforming SOEs is actually limiting the opportunities for job creation.
(iv) It is widely accepted that the private sector is the engine for economic growth. It is the private sector that will generate sustainable growth in employment. As this study shows, government’s continued ownership of commercial SOEs can have the eff ect of crowding out the private sector and stifl ing growth, thereby stifl ing employment generation.
In New Zealand, during 1988–2004 when signifi cant privatization activity occurred, total employment in the economy grew by 22%.30 This suggests that while privatization may lead to reductions
in employment within individual SOEs, the broader impact of SOE reform and privatization in New Zealand was to support economic expansion and employment growth.
Myth #5: Privatization results in increased tariff s for public services.
It is often thought that increased private participation in the provision of public services will result in increased prices for those services. While in some cases tariff increases do follow privatization or SOE reform, such as in public–private partnership (PPP) arrangements, there is no evidence to suggest that there is a direct cause and eff ect. Services cost money. When they are provided by an SOE at a tariff that does not allow the SOE to recover the full costs of delivery, as is often the case in the Pacifi c, the SOE is unable to make the investments required to maintain infrastructure, improve service quality, and expand access. This does not result in cost savings, but rather a deferred cost because money will need to be invested to maintain these services at some future time. Often, the longer it takes to make this investment, the greater the actual cost.
If the private sector is contracted to provide (and in some cases expand) the services, it will only do so if it can cover its costs of delivery and make a profi t. If tariff s are capped at rates that do not allow this full-cost recovery, then a CSO subsidy will be required. This would be the same whether these services are provided by the private sector or an SOE operating under a commercial mandate. Where tariff s have undergone sharp increases following privatization, this has almost always been due to a concurrent change in the government’s tariff policy, where a decision has been made to reduce the level of subsidy provided to consumers.
Extensive analysis of the impact of private participation in public service delivery internationally over the past 2 decades, particularly in utilities, reveals increased effi ciencies and lower costs of delivery, resulting in improved value for
30 New Zealand Business Roundtable. Policy Backgrounder No. 5. December 2004.
30
Finding Balance
money for government funders. These savings can then be passed onto consumers. It is therefore a myth that private participation drives increased tariff s for public services.
Myth #6: Public servants play a vital role on SOE boards.
Public servants serve as directors on the boards of SOEs in the RMI, Samoa, Solomon Islands, and Tonga; and in Fiji, public servants are appointed as directors and sit as observers on SOE boards. In Papua New Guinea (PNG), the staff members of the Independent Public Business Corporation sit as observers on SOE boards. Two reasons are often given to justify this practice: public servant board members or observers play a useful role in keeping the responsible minister fully informed on what is happening within the particular SOE; and public servants bring vital skills and knowledge to the boards, particularly where they are employed by the ministry responsible for the economic sector in which the SOE operates.
While it is certainly true that public servants can bring very useful knowledge to an SOE board, there are a number of important risks associated with this practice, which make it undesirable:
(i) Confl icts of interest. Ministers who are both SOE chairs and responsible ministers31 violate a basic principle of good governance: SOE ownership responsibilities (as exercised by the responsible or shareholding minister) should be kept separate from SOE management responsibilities (as undertaken by the board of directors). Senior public servants who serve on an SOE board also violate the principle of separation between ownership and management, particularly if they have any public service responsibility for the area in which the SOE operates. It is
impossible for public servants to monitor SOEs eff ectively if they report to ministers or more senior public servants who serve on the boards of those SOEs.
(ii) Time constraints. Public servants are full-time employees, and serving on an SOE board requires a reasonable time commitment—up to 3 days a month for directors and 5 days a month for a chair. Multiple board appointments place an unreasonable burden on the public servant. In Samoa, the chief executive offi cer of the Ministry of Finance sits on 10 boards, 3 as chair. These responsibilities alone would require a commitment of up to 36 days per month on top of the offi cer’s full-time role.
(iii) Liabilities. The practice of having staff from the monitoring ministry as observers on SOE boards creates special complications because the public servant is caught in the middle; while they are not legally directors, they could be seen as “deemed” directors and thereby carry all the risks and responsibilities of directors.
All of the SOE legislation reviewed as part of this study have eff ective statutory mechanisms that allow and empower the shareholding or responsible minister to exert an appropriate and reasonable degree of infl uence over the strategic direction of the SOE. In a well-functioning “owner” monitoring and governance regime, it is unnecessary to have a public servant sitting on a board to pass on information to the minister or provide guidance to the board of the SOE. If a public servant has special skills or knowledge that could assist an SOE, it is better that those skills be “contracted” to the SOE rather than making them available through an appointment as a director.
31 The “responsible minister” is the minister responsible for SOEs generally or for a specifi c SOE.
31
Introduction
VII. Conclusions
essential for improved SOE performance. PNG’s SOE reform agenda should therefore focus on completing this commercial framework with the following priority actions:
(i) Require the SOEs to operate as profi table businesses through an amendment to the Independent Public Business Corporation (IPBC) Act and publicly report their performance;
(ii) Finalize and implement the community service obligation (CSO) policy and guidelines for SOEs;
(iii) Discontinue all forms of ongoing fi nancial support to the SOEs outside of the CSO framework;
(iv) Further strengthen the director selection, appointment, and evaluation process; and
(v) Promote increased private sector participation in SOEs through partial privatization and public–private partnerships.
The experience of PNG and of the other fi ve Pacifi c countries participating in this study demonstrates that SOE commercialization is possible; but it requires a sustained political commitment to enforce the requirements of the underlying SOE legislation, resist the temptation to directly interfere in the business of the SOEs, and allow greater private sector participation in delivering the goods and services traditionally provided by SOEs. These reforms are well within reach. PNG’s 2012 election presents a unique opportunity for the newly-elected government to build upon the SOE reform momentum created in the fi rst half of 2012.
This study benchmarks the performance of the state-owned enterprises (SOEs) of Papua New Guinea (PNG) against those in fi ve other Pacifi c countries: Fiji, the Republic of the Marshall Islands, Samoa, Solomon Islands, and Tonga. It highlights the social and economic costs of ineffi cient SOE portfolios, which absorb substantial amounts of scarce public funds while often failing to provide essential services (e.g., power, water, and sanitation) to the poorer segments of the population. In PNG, the SOEs have absorbed an estimated K700 million in direct government transfers during the FY2002–FY2010 period, against which they generated a net profi t of K500 million, of which only K23 million was paid to the Treasury in the form of a dividend. A chronic lack of accountability has allowed the SOE portfolio to be governed extralegally over most of the 2002–2011 period. Indeed, of all of the countries participating in this benchmarking study, PNG has demonstrated the lowest level of transparency in the management of its SOE portfolio over the past decade. This has begun to change with a notable improvement in disclosure and oversight since late 2011, and a recognition that all SOEs must be placed on a solid commercial footing, operating independently of political interference and held fully accountable for results.
PNG’s SOE reform objectives mirror those of the other Pacifi c countries benchmarked in this study, but the approach is necessarily diff erent. While all of PNG’s SOEs are corporatized, few operate on strict commercial terms with management independence, profi t orientation, hard budget constraints, and accountability for results. These characteristics are
32
1.1 Power
When benchmarking power utilities, consideration must be given to the system structure, size, fuel sources, customer distribution, and regulatory arrangements. Papua New Guinea (PNG) Power, which is the largest utility in the Pacifi c in terms of installed capacity, performs comparatively well when measured by profi tability, with a return on equity (ROE) of 5.7% and return on assets (ROA) of 3% in FY2010—second only to Tonga Power with an ROE of 7.5% and an ROA of 4.8% for the same fi nancial year. Fiji Electricity Authority (FEA)—the second largest utility in the Pacifi c—is much less profi table than PNG Power and Tonga Power, returning only 2.0% on equity and 1.0% on assets in FY2010. This may be largely impacted by price regulation, as power tariff s in Fiji are 50% lower than for residential users in PNG, whereas in Tonga the tariff s are 25% higher than in PNG. FEA is also carrying a signifi cant unfunded community service obligation (CSO), which the board estimates costs the company $16.8 million in lost revenue per year.1
The profi tability ratios are, however, the only benchmarks on which PNG Power seems to outperform most of its Pacifi c neighbors. PNG Power’s operating ratio—which records total operating costs as a percentage of total operating revenue—is comparatively high at 90%, particularly as it generates 85% of the power for its main grids from hydro sources. Most of the other power
utilities in this study, including PNG Power’s smaller grids, are either solely or highly reliant on diesel generation. Tonga Power, with 100% diesel generation, achieved an operating ratio of 87%. PNG Power’s cost structure does not seem to benefi t from economies of scale. FEA, with similar annual power generation volumes, operates at a cost per kilowatt-hour (kWh) of power sold of $0.12. PNG Power’s cost of power sold at $0.30 per kWh is more in line with the much smaller power utilities. Marshall Islands Energy Company and Solomon Islands Electricity Authority, which generate just 10% of the power generated by PNG Power, operate with costs of production of $0.41 and $0.54 per kWh, respectively. The Electric Power Corporation of Samoa, which generates 13% of the power generated by PNG Power, has a cost of power sold of $0.40 per kWh. Tonga Power, which generates 6% of the power generated by PNG Power, has a cost of power sold of $0.43 per kWh. PNG Power also has comparatively low load factor2 of 41%, compared with an average of 66% for the other six utilities, indicating that its generation resource management is comparatively less effi cient.
PNG Power purchased 163,517 megawatt-hour (MWh) from an independent power producer in 2010, approximately 20% of total production. Although the cost of purchasing this power at $0.97 per kWh is higher than PNG Power’s cost of production at $0.83/kWh,3 it would still appear to be a cost-eff ective source of power as the transaction
1 Comment by chair in FEA 2010 Annual Report, page 7.2 Measures the eff ectiveness of the use of generation resources; load factor is the ratio of system average power generated to peak power demand over a
period of time.3 The historic production costs of independent power producers have been adversely impacted by unhedged currency exposure.
Appendix 1
Sector Benchmarking: Power, Water, Ports, and Development Banking
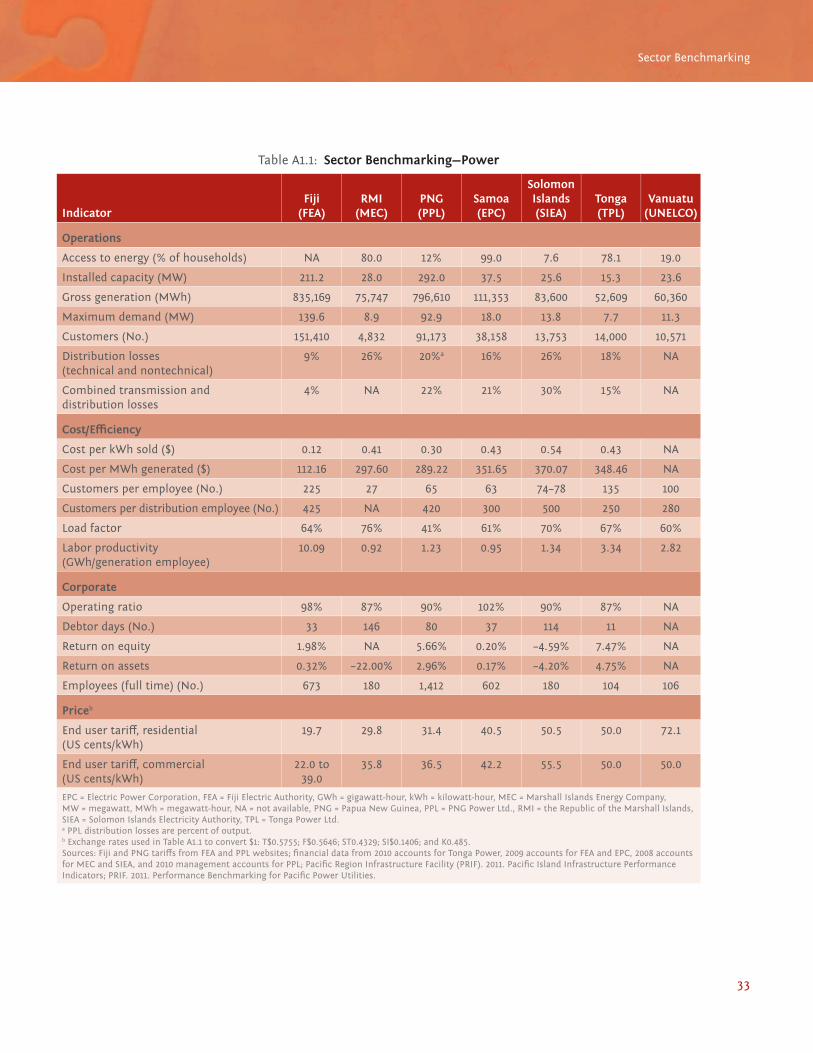
33
Sector Benchmarking
Table A1.1: Sector Benchmarking—Power
IndicatorFiji
(FEA)RMI
(MEC)PNG(PPL)
Samoa(EPC)
SolomonIslands(SIEA)
Tonga(TPL)
Vanuatu(UNELCO)
Operations
Access to energy (% of households) NA 80.0 12% 99.0 7.6 78.1 19.0
Installed capacity (MW) 211.2 28.0 292.0 37.5 25.6 15.3 23.6
Gross generation (MWh) 835,169 75,747 796,610 111,353 83,600 52,609 60,360
Maximum demand (MW) 139.6 8.9 92.9 18.0 13.8 7.7 11.3
Customers (No.) 151,410 4,832 91,173 38,158 13,753 14,000 10,571
Distribution losses (technical and nontechnical)
9% 26% 20%a 16% 26% 18% NA
Combined transmission and distribution losses
4% NA 22% 21% 30% 15% NA
Cost/Effi ciency
Cost per kWh sold ($) 0.12 0.41 0.30 0.43 0.54 0.43 NA
Cost per MWh generated ($) 112.16 297.60 289.22 351.65 370.07 348.46 NA
Customers per employee (No.) 225 27 65 63 74–78 135 100
Customers per distribution employee (No.) 425 NA 420 300 500 250 280
Load factor 64% 76% 41% 61% 70% 67% 60%
Labor productivity (GWh/generation employee)
10.09 0.92 1.23 0.95 1.34 3.34 2.82
Corporate
Operating ratio 98% 87% 90% 102% 90% 87% NA
Debtor days (No.) 33 146 80 37 114 11 NA
Return on equity 1.98% NA 5.66% 0.20% –4.59% 7.47% NA
Return on assets 0.32% –22.00% 2.96% 0.17% –4.20% 4.75% NA
Employees (full time) (No.) 673 180 1,412 602 180 104 106
Priceb
End user tariff , residential (US cents/kWh)
19.7 29.8 31.4 40.5 50.5 50.0 72.1
End user tariff , commercial (US cents/kWh)
22.0 to 39.0
35.8 36.5 42.2 55.5 50.0 50.0
EPC = Electric Power Corporation, FEA = Fiji Electric Authority, GWh = gigawatt-hour, kWh = kilowatt-hour, MEC = Marshall Islands Energy Company, MW = megawatt, MWh = megawatt-hour, NA = not available, PNG = Papua New Guinea, PPL = PNG Power Ltd., RMI = the Republic of the Marshall Islands, SIEA = Solomon Islands Electricity Authority, TPL = Tonga Power Ltd.a PPL distribution losses are percent of output.b Exchange rates used in Table A1.1 to convert $1: T$0.5755; F$0.5646; ST0.4329; SI$0.1406; and K0.485.Sources: Fiji and PNG tariff s from FEA and PPL websites; fi nancial data from 2010 accounts for Tonga Power, 2009 accounts for FEA and EPC, 2008 accounts for MEC and SIEA, and 2010 management accounts for PPL; Pacifi c Region Infrastructure Facility (PRIF). 2011. Pacifi c Island Infrastructure Performance Indicators; PRIF. 2011. Performance Benchmarking for Pacifi c Power Utilities.
34
Appendix 1
carries no capital cost for PNG Power. FEA, whose cost of production was 0.93/kWh in 2009, also purchases a small amount of its power from independent power producers.
PNG Power also carries a heavy fi nancial burden due to the large number of non- or slow-paying customers.4 The number of debtor days, almost 80, is not the highest recorded by the six power companies for which data is available, but is much higher than Tonga Power’s 11 days or Samoa’s Electric Power Corporation’s 37 days.
On purely technical parameters, PNG Power’s performance is at the median of the other utilities in the region, with combined transmission and distribution losses of 22%. This is the same as Samoa’s Electric Power Corporation (21%) and lower than Solomon Islands Electricity Authority (30%), but higher than Tonga Power (15%) and FEA (4%).
PNG Power’s comparatively poor operational performance does not lead to the very low fi nancial returns found in Fiji, the Republic of the Marshall Islands, Samoa, and Solomon Islands, however, and this is due in part to its heavily subsidized debt. With over K$313 million of debt on its balance sheet as of 30 December 2010, it paid K$13.8 million in interest, which represents an average debt cost of 4.4%. If PNG Power paid a commercial rate of interest, the estimated adjusted return on equity for 2010 would have been 2%. While the company’s gearing at almost 50:50 would seem appropriate, retained earnings make up just over 50% of shareholder funds, indicating a history of ongoing shareholder support.
1.2 Water
Water utilities, much like power utilities, are diffi cult to benchmark given the range of factors that shape their performance, such as size, supply type (gravity fed or pumped), customer distribution, and
regulatory arrangements. It is therefore necessary to look at a range of performance indicators.
The two PNG water utilities, Eda Ranu and Water PNG, have on average outperformed other Pacifi c water utilities on a number of fi nancial and technical parameters:
• Eda Ranu and Water PNG achieved an average ROE of 7.49% and 2.25%, respectively, over the period from FY2002 to FY2010, higher than any of the other utilities in this comparative study.5 However, as the two PNG utilities provide both water and wastewater services and separate accounts for the water division are not available, these fi gures should be treated with some caution. Eda Ranu, moreover, is an operator that does not have the responsibility to invest in the network nor does it rely solely on user fees for its revenues. Both of these factors contribute to its higher profi tability. UNELCO, which is a private concession in Vanuatu, does have a responsibility for ongoing investment; and is also profi table, although detailed fi nancial results are not available for comparison. Both UNELCO and Eda Ranu limit their operations to urban centers.
• The median for nonrevenue water for the Pacifi c is 1.0 cubic meter (m3)/connection/day and the mean is 1.5 m3/connection/day. In comparison, Eda Ranu’s nonrevenue water was 5.34 m3/connection/day or 58% of water produced, and for Water PNG, 0.97 m3/connection/day or 38% of water produced. The percentage of nonrevenue water for PNG water utilities is comparable to water utilities in Samoa, Solomon Islands, and Tonga; but well above that for UNELCO (20%) and the Rodney District Council (18%).
• The International Water Association defi nes the two key components of nonrevenue water as (i) commercial loss, which includes
4 This is due to a variety of factors, including poor-paying government departments and the security challenges associated with disconnection activities.5 Financial performance data is not available for the Vanuatu water company, UNELCO, or for the New Zealand comparator used in this study, the Rodney
District Council.
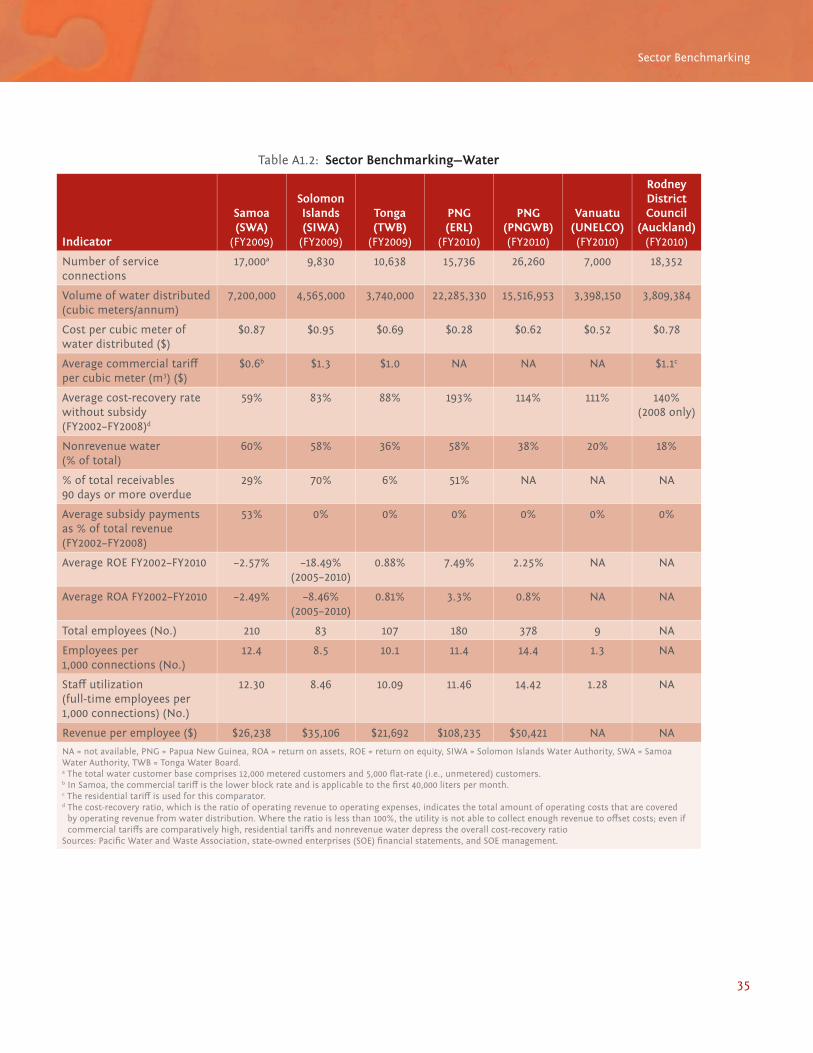
35
Sector Benchmarking
Table A1.2: Sector Benchmarking—Water
Indicator
Samoa (SWA)
(FY2009)
Solomon Islands (SIWA)
(FY2009)
Tonga (TWB)
(FY2009)
PNG(ERL)
(FY2010)
PNG(PNGWB) (FY2010)
Vanuatu(UNELCO) (FY2010)
Rodney District Council
(Auckland)(FY2010)
Number of service connections
17,000a 9,830 10,638 15,736 26,260 7,000 18,352
Volume of water distributed (cubic meters/annum)
7,200,000 4,565,000 3,740,000 22,285,330 15,516,953 3,398,150 3,809,384
Cost per cubic meter of water distributed ($)
$0.87 $0.95 $0.69 $0.28 $0.62 $0.52 $0.78
Average commercial tariff per cubic meter (m3) ($)
$0.6b $1.3 $1.0 NA NA NA $1.1c
Average cost-recovery rate without subsidy (FY2002–FY2008)d
59% 83% 88% 193% 114% 111% 140% (2008 only)
Nonrevenue water (% of total)
60% 58% 36% 58% 38% 20% 18%
% of total receivables 90 days or more overdue
29% 70% 6% 51% NA NA NA
Average subsidy payments as % of total revenue (FY2002–FY2008)
53% 0% 0% 0% 0% 0% 0%
Average ROE FY2002–FY2010 –2.57% –18.49% (2005–2010)
0.88% 7.49% 2.25% NA NA
Average ROA FY2002–FY2010 –2.49% –8.46% (2005–2010)
0.81% 3.3% 0.8% NA NA
Total employees (No.) 210 83 107 180 378 9 NA
Employees per 1,000 connections (No.)
12.4 8.5 10.1 11.4 14.4 1.3 NA
Staff utilization (full-time employees per 1,000 connections) (No.)
12.30 8.46 10.09 11.46 14.42 1.28 NA
Revenue per employee ($) $26,238 $35,106 $21,692 $108,235 $50,421 NA NA
NA = not available, PNG = Papua New Guinea, ROA = return on assets, ROE = return on equity, SIWA = Solomon Islands Water Authority, SWA = Samoa Water Authority, TWB = Tonga Water Board.a The total water customer base comprises 12,000 metered customers and 5,000 fl at-rate (i.e., unmetered) customers.b In Samoa, the commercial tariff is the lower block rate and is applicable to the fi rst 40,000 liters per month. c The residential tariff is used for this comparator.d The cost-recovery ratio, which is the ratio of operating revenue to operating expenses, indicates the total amount of operating costs that are covered
by operating revenue from water distribution. Where the ratio is less than 100%, the utility is not able to collect enough revenue to off set costs; even if commercial tariff s are comparatively high, residential tariff s and nonrevenue water depress the overall cost-recovery ratio
Sources: Pacifi c Water and Waste Association, state-owned enterprises (SOE) fi nancial statements, and SOE management.
36
Appendix 1
inaccuracies associated with customer metering, data handling errors, and unauthorized consumption; and (ii) physical loss, which only includes reservoir leakage, leakage on service connections up to the metering point, and leakage on transmission and distribution mains up to the customer metering point. In 2010, Eda Ranu’s nonrevenue water consisted of 10% physical loss and 48% commercial loss whereas Water PNG’s consisted of 28% physical loss and 10% commercial loss.6 In the case of Eda Ranu, an inability to disconnect illegal users keeps the commercial losses relatively high.
• Although Eda Ranu reports a cost of $0.28 per cubic meter of water distributed, this cannot be fully relied upon, as Eda Ranu does not fully separate costs between its water and wastewater activities. Total costs divided by volume of water distributed amount to $1.75, which if the $0.28 fi gure were accurate would mean that the costs attributable to the wastewater activity are 84% of total costs, which is unlikely. Water PNG reports a cost per cubic meter of water produced of $0.62, which while being more in line with other regional water utilities, must also be read with caution due to a lack of full separation between water and wastewater costs. The costs per cubic meter of water distributed arise from energy utilization, water treatment materials, plant and reticulation system operation, maintenance, and staff wages.
• Eda Ranu and Water PNG both have cost-recovery rates above 100%, which is essential for the commercial viability of the business. On the other hand, three of the seven water utilities benchmarked in this study did not. Other indicators of effi ciency include staffi ng levels. Water companies in larger and more developed markets are typically able to operate with fewer than 4 staff per 1,000 connections. Comparatively, Eda Ranu and Water PNG operate with 11 and 14 employees
per 1,000 connections; Tonga, which is a much smaller utility, operates with a ratio of 10 employees per 1,000 connections; and UNELCO’s ratio is about 1.
• In the Pacifi c Water and Waste Association benchmarking study, Eda Ranu and Water PNG are the best performers in the key results area for drinking water quality, with 100% compliance for residual chlorine and microbiological quality compliance.
1.3 Ports
The performance of the port sector state-owned enterprises (SOEs) in the six Pacifi c countries participating in this study varies widely, with the PNG Ports Corporation Limited (PPCL) achieving the best results in terms of the average ROE (6.64%) and average ROA (4.76%). In relation to revenue per employee, PPCL is also the standout performer, which could be driven by the fact that a number of activities, such as stevedoring, are contracted out. This would also explain why PPCL’s cost per unit of cargo processed is $5.44, second only to Wellington’s CentrePort at $2.64.
The Fiji Port Corporation Limited (FPCL) achieved a ROE of 4.33% and ROA of 2.44% for the 2005–2010 period. While FPCL’s performance may be party explained by economies of scale, size does not tell the whole story. Indeed, FPCL’s average ROA is equivalent to the 2.51% average ROA of the Port Authority of Tonga, which is 26 times smaller than FPCL. Wellington’s CentrePort, which is an effi ciently run port with three times the asset size of FPCL, showed only a slightly healthier 4.34% ROA in 2007–2008. PPCL, which processed more than two and a half times the container volume of CentrePort, achieved a much lower ROA. PPCL operates 14 ports, of which only two, Port Moresby and law, are of international scale and profi table in their own right. The economic regulator in PNG, the Independent Consumer Competition Commission, allows PPCL to cross subsidize
6 Pacifi c Water and Wastes Association. 2011. Development of a Water Utility Benchmarking System. Sydney.

37
Sector Benchmarking
Table A1.3: Sector Benchmarking—Ports
IndicatorFiji
(FPCL)PNG
(PPCL)Samoa (SPA)
Solomon Islands (SIPA)
RMI (MIPA)
Tonga (PAT)
CentrePort Wellington
(NZ)a
Napier Port NZa
Total container throughput (tons)
93,789 258,079 24,487 18,182 2,174 11,937 91,490a 160,479a
Total general cargo processed (tons)
1,605,670 2,684,912 320,553 382,648 NA 184,053 NA NA
Total bulk cargo processed (tons)
263,503 3,819,957 11,418 325,636 NA 3,040 10,700,000a 3,117,500a
Cost per unit of cargo processed ($)
11.33 5.44 14.08 6.85 NA 16.17 2.64 7.52
Receivables as % of total revenue (average FY2002–FY2008)
9.70% (2005–2008)
15.18% 9.50% 27.40% 159.00% 15.80% 13.90% 8.20%
Asset utilization 24.50% 4.77% 10.00% 55.40% 5.40% 30.50% 16.85% 37.04%
Average ROE FY2007–FY2008
3.33% 5.72% 1.22% 10.93% –4.33% 4.52% 7.16% 9.52%
Average ROE FY2002–FY2010
4.33% (2005–2010)
6.64% 0.88% 0.24% –0.75% 3.71% NA NA
Average ROA FY2002–FY2009
2.44% (2005–2010)
4.76% 0.37% 0.15% –0.59% 2.51% 4.34% (2007–2008)
7.45% (2007–2008)
Total employees (No.) 413 446 190 202 58 187 200 NA
Revenue per employee ($)
46,137 102,490 26,401 32,531 37,818 18,946 162,288 NA
FPCL = Fiji Port Corporation Limited, MIPA = Marshall Islands Port Authority, NA = not available, NZ = New Zealand, PAT = Port Authority of Tonga, PPCL = PNG Ports Corporation Limited, RMI = the Republic of the Marshall Islands, ROA = return on assets, ROE = return on equity, SIPA = Solomon Islands Port Authority, SPA = Samoa Port Authority.a Figures for total bulk cargo for CentrePort and Napier are actually total cargo throughput.Source: 2008 annual reports except for CentrePort and Napier ports, which are an average of 2007 and 2008 fi nancial years.
the smaller uneconomic ports from the profi ts generated by the two larger ports.
Both Wellington’s CentrePort and the Port of Napier provide useful benchmarking data for Pacifi c island ports. While these two New Zealand ports handle greater volumes of cargo than fi ve of the six Pacifi c island ports included in this study, their operational and fi nancial ratios remain instructive. CentrePort and the Port of Napier achieved average ROEs of 7.16% and 9.52%, respectively, for the FY2007–FY2008 period, compared with 3.33% for FPCL; 4.52% for the Port Authority of Tonga; 1.22% for the Samoa Port Authority (SPA); 5.72% for PNG PPCL. From this comparative review, size appears to have only a marginal impact on profi tability. Other factors such as the degree of private sector participation,
the effi cient use of the asset base, and governance arrangements play a larger role.
The degree of contracting out of port operations varies among the six Pacifi c island countries. In Samoa, SPA is a pure landlord port with all of the stevedoring, container handling, and major maintenance contracted out to the private sector, with SPA retaining pilotage and dredging as core services. FPCL, however, undertakes many functions at its port, including stevedoring and pilotage; and it will soon own and operate several replacement pilot boats. The Port Authority of Tonga undertakes all port-related services, although it is in the process of moving to the landlord port model. SIPA undertakes all port-related activities within a weak fi nancial management and governance structure, resulting in high costs, poor debtor

38
Appendix 1
collections, and arbitrary allocation of costs and revenues among its business units. Stevedoring, for example, accounts for $2.37 million or 65.5% of total costs, but contributes only $1.75 in operating revenue. A recent study on the operations of the Solomon Islands Port Authority (SIPA) recommends contracting out stevedoring and all commercial activities to allow it to focus on its core activity as a landlord port.7 While prudent levels of contracting out will improve port performance, this study demonstrates that, where contracting out is undertaken within a weak management and accountability framework, the benefi cial impacts are muted.
Underutilization of the signifi cant asset base held by these port authorities clearly has an adverse impact on performance. SIPA, the port with the highest asset utilization rate, however, has one of the lowest average ROAs at 0.15%. SIPA’s high asset utilization is explained by its comparatively low asset value,8 which is lower than that of the Port Authority of Tonga. Setting aside the case of SIPA, it is noted that the port companies with the lowest asset utilization rates in FY2008—PPCL with 4.77%, Marshall Islands Port Authority (MIPA) with 5.4%, and Samoa Port Authority (SPA) at 10%—are also the three with the lowest ROAs in FY2008 at –1.00%, –3.76%, and –0.68%, respectively. MIPA’s comparatively poor performance may be explained by the fact that it also owns and operates the Majuro airport, which accounts for 74% of net assets but only 39% of revenue.
From a review of SPA’s business plan and annual accounts, its comparative underperformance is caused by poor management practices and weak commercial drivers. The target ROA in the business plan is just 0.5%, and is the rate that is used to support the decision to invest in such noncore activities as a fl oating restaurant, marina, and wharf located on the southern side of Upolu Island, despite strong objections from the Ministry of Finance.
All of the port companies suff er the negative eff ects of poor governance. FPCL, which appears to have
robust governance practices, has high director turnover rates, which may adversely impact board performance. In both Samoa and Tonga, the port boards have allowed management to undertake investments in noncore activities at investment rates well below the target ROE set by shareholders. In the Republic of the Marshall Islands (RMI) and Solomon Islands, there are no eff ective owners as monitors and performance targets set by the shareholder ministers; and they generally have weak governance practices. In PNG, the owner of the port company, the Independent Public Business Corporation (IPBC), appears to have had little interest in the performance of its SOE subsidiaries for a number of years, including PPCL. It is telling that the auditor general was unable to give an audit opinion for PPCL’s accounts for the 2007 and 2008 fi nancial years due to a number of factors, including a $7.7 million investment in Lehman Brothers, made just prior to the fi rm’s bankruptcy. It is, therefore, not surprising that operational and fi nancial performance of the port SOEs in these three countries has been comparatively poor.
Because the economies in all of the Pacifi c island countries depend on trade with other countries for virtually everything they consume and much that they produce, high-cost and ineffi cient ports negatively impact every sector of the economy and can create a signifi cant drag on growth and productivity. Reform, which is therefore crucial, will require a combination of initiatives: improved governance, improved accountability, a greater commercial focus with hard budget constraints, sale of noncore assets and business lines, better asset utilization, and clearer management goals and consequences for nonachievement.
1.4 Development Banking
Four Pacifi c countries in the study have development bank SOEs—Development Bank of Samoa (DBS), Marshall Islands Development Bank (MIDB),
7 Pacifi c Region Infrastructure Facility. Honiara Port Scoping Study. February 2012.8 The value of the assets of Solomon Islands Port Authority have not been assessed since 1995.
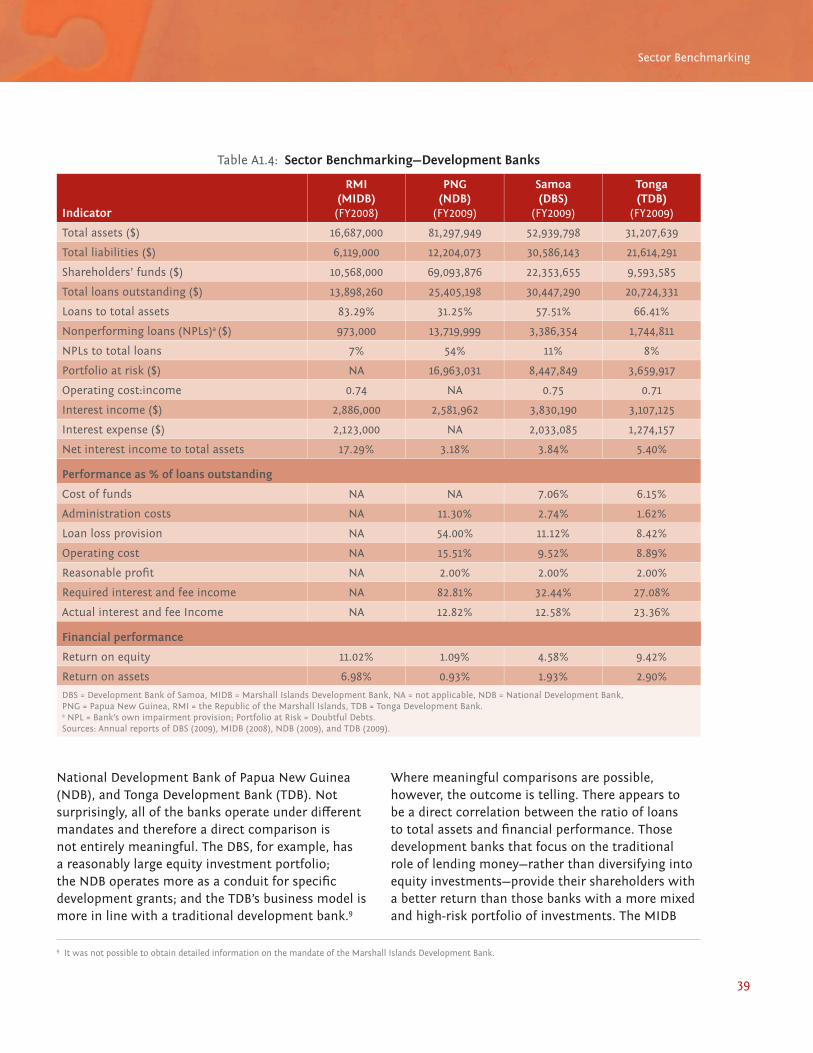
39
Sector Benchmarking
Table A1.4: Sector Benchmarking—Development Banks
Indicator
RMI (MIDB)(FY2008)
PNG (NDB)
(FY2009)
Samoa (DBS)
(FY2009)
Tonga (TDB)
(FY2009)
Total assets ($) 16,687,000 81,297,949 52,939,798 31,207,639
Total liabilities ($) 6,119,000 12,204,073 30,586,143 21,614,291
Shareholders’ funds ($) 10,568,000 69,093,876 22,353,655 9,593,585
Total loans outstanding ($) 13,898,260 25,405,198 30,447,290 20,724,331
Loans to total assets 83.29% 31.25% 57.51% 66.41%
Nonperforming loans (NPLs)a ($) 973,000 13,719,999 3,386,354 1,744,811
NPLs to total loans 7% 54% 11% 8%
Portfolio at risk ($) NA 16,963,031 8,447,849 3,659,917
Operating cost:income 0.74 NA 0.75 0.71
Interest income ($) 2,886,000 2,581,962 3,830,190 3,107,125
Interest expense ($) 2,123,000 NA 2,033,085 1,274,157
Net interest income to total assets 17.29% 3.18% 3.84% 5.40%
Performance as % of loans outstanding
Cost of funds NA NA 7.06% 6.15%
Administration costs NA 11.30% 2.74% 1.62%
Loan loss provision NA 54.00% 11.12% 8.42%
Operating cost NA 15.51% 9.52% 8.89%
Reasonable profi t NA 2.00% 2.00% 2.00%
Required interest and fee income NA 82.81% 32.44% 27.08%
Actual interest and fee Income NA 12.82% 12.58% 23.36%
Financial performance
Return on equity 11.02% 1.09% 4.58% 9.42%
Return on assets 6.98% 0.93% 1.93% 2.90%
DBS = Development Bank of Samoa, MIDB = Marshall Islands Development Bank, NA = not applicable, NDB = National Development Bank, PNG = Papua New Guinea, RMI = the Republic of the Marshall Islands, TDB = Tonga Development Bank.a NPL = Bank’s own impairment provision; Portfolio at Risk = Doubtful Debts.Sources: Annual reports of DBS (2009), MIDB (2008), NDB (2009), and TDB (2009).
National Development Bank of Papua New Guinea (NDB), and Tonga Development Bank (TDB). Not surprisingly, all of the banks operate under diff erent mandates and therefore a direct comparison is not entirely meaningful. The DBS, for example, has a reasonably large equity investment portfolio; the NDB operates more as a conduit for specifi c development grants; and the TDB’s business model is more in line with a traditional development bank.9
Where meaningful comparisons are possible, however, the outcome is telling. There appears to be a direct correlation between the ratio of loans to total assets and fi nancial performance. Those development banks that focus on the traditional role of lending money—rather than diversifying into equity investments—provide their shareholders with a better return than those banks with a more mixed and high-risk portfolio of investments. The MIDB
9 It was not possible to obtain detailed information on the mandate of the Marshall Islands Development Bank.

40
Appendix 1
leads the group with an ROE of 11.02% generated by a loan portfolio that comprises 83% of total assets. At the other end of the range is the NDB with an ROE of just 1.09% and only 31% of assets invested in commercial loans.
Most of the development banks are struggling to keep costs at an acceptable level. To cover their costs—and to achieve even a conservative profi t margin of 2% on total loans outstanding—all of the development banks need higher fee and interest income than they are currently able to generate from their existing business activities. For all of the banks, loan loss provisions and operating costs are comparatively high. High loan loss provisions may not be surprising considering the nature of the business but could indicate an insuffi cient risk margin. High operating costs probably indicate overstaffi ng and the costs of maintaining branch networks with relatively low volumes of business.
NDB has the most atypical business model of the four banks. It receives most of the money it lends through government grants that are designated for specifi c “loans” rather than making and assessing loans based on a traditional development bank model. It does not borrow to support its lending activities as these are fi nanced by “client’s trust funds” amounting to $5.4 million on which it appears to pay no interest. Its assets include 36% property and plant, 17% deferred tax benefi t, and 31% in loans.
The NDB’s lending activities have been consistently loss-making, with the bank carrying $52.8 million of accumulated loan losses in FY2009, almost equal to its paid up capital. From FY2002–FY2009, NDB also wrote off K34 million in bad debts and achieved the lowest ROE among the banks reviewed in this study. The NDB has incurred operating loss annually from FY2002–FY2009. This poor performance continued in FY2009 with a ratio of nonperforming loans to total loans of 54%. This compares with 7% for MIDB, 8% for TDB, and 11% for DBS. While the fi nancial statements of NDB for FY2011 were not available for this study, the NDB’s board chair announced a record profi t for the bank of K9.4 million in 2011, a dramatic turnaround after the bank’s decade of consistent losses.10 The statement did not elaborate on the key drivers of this turnaround.
By keeping close to its core mandate and following a robust commercial model, TDB, in contrast, was able to pay its shareholder a special dividend of $5.8 million in 2009 on top of ordinary dividends of $0.9 million, and achieve a 9.42% ROE.
A thorough review of NDB is needed to shore up ongoing losses, reduce the government’s fi scal risks, and assess its eff ectiveness in delivering mandated lending programs. It is also critical to bring NDB’s governance structure and reporting mechanisms in line with those of the other SOEs so that IBPC can eff ectively execute its role of SOE monitor and shareholder representative.
10 Post Courier, 15 February 2012.
41
Introduction
Appendix 2
Review of Amendments to the 2002 Independent Public Business Corporation Act
The 2002 version of the Independent Public Business Corporation (IPBC) Act made IBPC and the General Business Trust subject to the Public Finances (Management) Act 1995, which sets out basic fi nancial and accountability requirements for state-controlled entities. The Act also prescribed who could be appointed as directors of IPBC and by whom—with four candidates appointed by independent nominators. This provision attempted to limit the degree of political patronage that could be applied to the appointment process.11 Despite this safeguard, practice appears to have fallen well short of the Act’s clear requirement; and due to direct political involvement in the management of IPBC, the independent nominators have been unable to fi nd suitable candidates willing to act as IPBC directors. For much of the last 9 years, the IPBC board has not been fully or properly constituted.12
While the 2002 IPBC Act contained a number of robust safeguards, it also had signifi cant defi ciencies.13 For example, it lacked clear governance guidelines for the state-owned enterprise (SOE) boards. SOE legislation should set clear performance objectives that guide all decisions made by the board of directors and senior managers—often called the “primary objective.” This statement is intended to establish the primary focus of the SOE—usually to operate
as a successful business—and is then reinforced by clear accountability statements that set out the consequences for not meeting this primary objective. This important policy principle is still missing from the Papua New Guinea (PNG) SOE legislation.
Another notable omission from the 2002 IPBC Act was a provision dealing with how politicians could legitimately interface and infl uence the key strategic direction of the SOEs. In most SOE legislation, this is through the annual preparation of a statement of corporate intent.14 Through this process, the SOE board sets out how it is going to manage the SOE—usually over the next 3-year planning period—in a manner consistent with the principal objective. The board then presents this plan to the responsible minister, who provides comments before the plan is fi nalized. The board is subsequently held accountable to ensure the SOE achieves the targets set out in the approved plan. The 2002 Act was entirely silent on this matter, which meant that the performance target-setting process and accountability mechanisms remained thoroughly opaque.
Subsequent amendments to the act have had a mixed impact on its eff ectiveness. While the 2007 amendment removed IPBC and the SOEs from the oversight of the Public Finances (Management)
11 IPBC Act 2002, Section 11 stipulates that nonpolitical stakeholders must nominate three directors; the responsible minister can appoint two members; and two directors are ex offi cio public servants. The managing director of IPBC is, by defi nition, also a director. Section 59 of the IPBC Act 2002 also stated that “No Minister, member of the National Parliament or any member of a Provincial or Local-Level Government may seek to direct or infl uence the exercise by a Director (of the IPBC) of his or her duties, powers or judgments or any Board decision other than through a written communication that is tabled concurrently in the National Parliament.” This provision was repealed in 2007.
12 Drawn from responses to interviews with IPBC staff and other stakeholders.13 For example, Section 6 (5) required that IBPC—in exercising its powers and functions—had to act “in accordance with sound business principles and the care,
diligence and skill that a prudent person of business would adopt or exercise in similar circumstances.” This provision was repealed in 2007.14 Also defi ned in some SOE legislation as the “statement of corporate objectives and business plan.”

42
Appendix 2
Act 1995—thereby weakening accountability mechanisms—it did introduce new reporting provisions that required IPBC and SOEs to produce annual plans similar to a statement of corporate intent.15 In practice, this requirement has been largely ignored. Since 2007 only a few SOEs have actually produced the required annual plan. While the 2007 amendment went further than most SOE legislation in that it stipulated that the Cabinet—the National Executive Council (NEC)—must approve the IPBC’s planning document, in reality IPBC has failed to submit an annual plan since the requirement became law.
The 2007 amendment also introduced a new appointment process for SOE directors. Prior to the amendment, the NEC appointed all SOE directors on the recommendation of the minister; but following the 2007 amendment, the role of the NEC was reduced to a simple veto power, with the IPBC responsible for the selection and appointment of all SOE directors.16 However, practice appears to have fallen well short of the legislative requirements with the minister
of public enterprises regularly usurping the role of the IPBC board to infl uence or direct the appointment process.17
While the 2007 amendment introduced the requirement that IPBC’s audited fi nancial statements be published and presented to the national Parliament, the public notifi ed of their availability, and copies given to any person requesting them, this requirement has also been ignored. The fi rst year that IPBC made its accounts public was in 2011 by publishing them on its website.
It is clear that the successive changes to the IPBC Act since it was fi rst introduced have lacked coherence and are inadequate to support robust SOE governance and accountability. Moreover, where the governance, accountability, and reporting requirements of the Act have been strengthened, often the new provisions have been ignored. The consequences of this lack of clarity and enforcement can be seen in the performance of the portfolio over the FY2002–FY2011 period. Good performance—where it exists—seems to be more of a function of good luck than the application of a robust legislative framework.
15 In sections 34 and 46E.16 Section 9A states that the National Executive Council must advise the IPBC within 21 days if it objects to any person being nominated for appointment to
an SOE board.17 Comments made by IPBC staff .
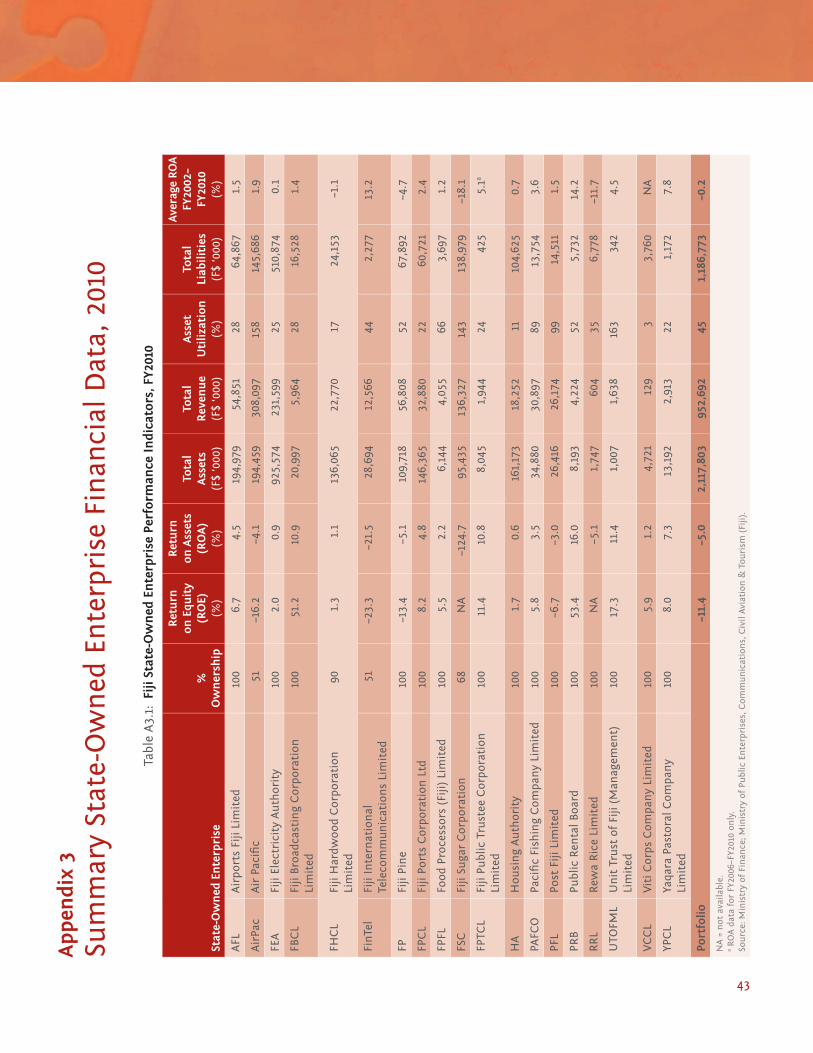
43
IntroductionA
ppen
dix
3
Sum
mar
y St
ate-
Ow
ned
En
terp
rise
Fin
anci
al D
ata,
201
0
Tabl
e A
3.1:
Fiji
Sta
te-O
wn
ed E
nte
rpri
se P
erfo
rman
ce I
ndi
cato
rs, F
Y201
0
Stat
e-O
wn
ed E
nte
rpri
se%
O
wn
ersh
ip
Ret
urn
on
Equ
ity
(RO
E)(%
)
Ret
urn
on
Ass
ets
(RO
A)
(%)
Tota
l A
sset
s(F
$ ‘0
00)
Tota
l R
even
ue
(F$
‘000
)
Ass
et
Uti
liza
tion
(%)
Tota
l Li
abil
itie
s(F
$ ‘0
00)
Aver
age
RO
A
FY20
02–
FY20
10(%
)
AFL
Air
port
s Fi
ji Li
mit
ed10
06.
74.
519
4,97
954
,851
2864
,867
1.5
Air
Pac
Air
Pac
ifi c
51–1
6.2
–4.1
194,
459
308,
097
158
145,
686
1.9
FEA
Fiji
Elec
tric
ity
Au
thor
ity
100
2.0
0.9
925,
574
231,
599
2551
0,87
40.
1
FBC
LFi
ji Br
oadc
asti
ng
Cor
pora
tion
Li
mit
ed10
051
.210
.920
,997
5,96
428
16,5
281.
4
FHC
LFi
ji H
ardw
ood
Cor
pora
tion
Li
mit
ed90
1.3
1.1
136,
065
22,7
7017
24,1
53–1
.1
Fin
Tel
Fiji
Inte
rnat
ion
al
Tele
com
mu
nic
atio
ns
Lim
ited
51–2
3.3
–21.
528
,694
12,5
6644
2,27
713
.2
FPFi
ji Pi
ne
100
–13.
4–5
.110
9,71
856
,808
5267
,892
–4.7
FPC
LFi
ji Po
rts
Cor
pora
tion
Ltd
100
8.2
4.8
146,
365
32,8
8022
60,7
212.
4
FPFL
Food
Pro
cess
ors
(Fiji
) Li
mit
ed10
05.
52.
26,
144
4,05
566
3,69
71.
2
FSC
Fiji
Suga
r C
orpo
rati
on68
NA
–124
.795
,435
136,
327
143
138,
979
–18.
1
FPTC
LFi
ji Pu
blic
Tru
stee
Cor
pora
tion
Li
mit
ed10
011
.410
.88,
045
1,94
424
425
5.1a
HA
Hou
sin
g A
uth
orit
y10
01.
70.
616
1,17
318
,252
1110
4,62
50.
7
PAFC
OPa
cifi
c Fi
shin
g C
ompa
ny
Lim
ited
100
5.8
3.5
34,8
8030
,897
89 1
3,75
4 3.
6
PFL
Post
Fiji
Lim
ited
100
–6.7
–3.0
26,4
1626
,174
9914
,511
1.5
PRB
Publ
ic R
enta
l Boa
rd10
053
.416
.08,
193
4,22
452
5,73
214
.2
RR
LR
ewa
Ric
e Li
mit
ed10
0N
A–5
.11,
747
604
356,
778
–11.
7
UTO
FML
Un
it T
rust
of
Fiji
(Man
agem
ent)
Li
mit
ed10
017
.311
.41,
007
1,63
816
334
24.
5
VC
CL
Viti
Cor
ps C
ompa
ny
Lim
ited
100
5.9
1.2
4,72
112
93
3,76
0N
A
YPC
LYa
qara
Pas
tora
l Com
pan
y Li
mit
ed10
08.
07.
313
,192
2,91
322
1,17
27.
8
Port
foli
o–1
1.4
–5.0
2,11
7,80
395
2,69
245
1,18
6,77
3–0
.2
NA
= n
ot a
vaila
ble.
a RO
A d
ata
for
FY20
06–F
Y201
0 on
ly.
Sou
rce:
Min
istr
y of
Fin
ance
; Min
istr
y of
Pu
blic
En
terp
rise
s, C
omm
un
icat
ion
s, C
ivil
Avia
tion
& T
ouri
sm (
Fiji)
.
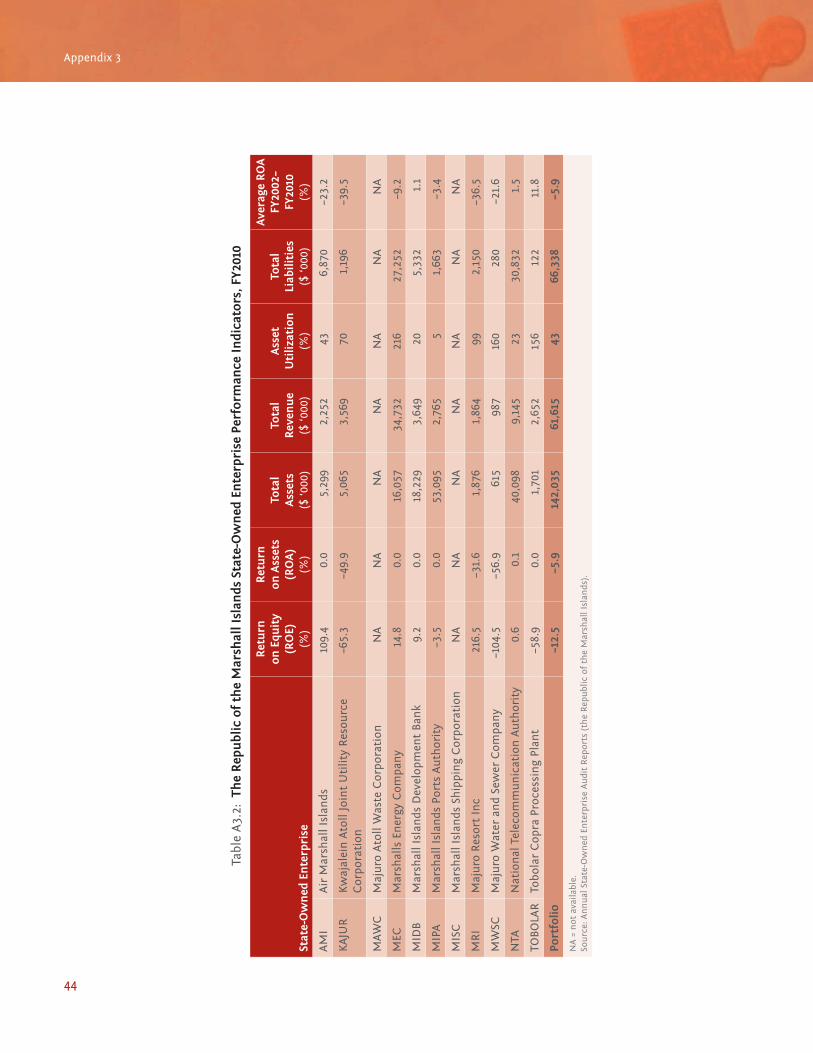
44
Appendix 3
Tabl
e A
3.2:
Th
e R
epu
blic
of
the
Mar
shal
l Isl
ands
Sta
te-O
wn
ed E
nte
rpri
se P
erfo
rman
ce I
ndi
cato
rs, F
Y201
0
Stat
e-O
wn
ed E
nte
rpri
se
Ret
urn
on
Equ
ity
(RO
E)(%
)
Ret
urn
on
Ass
ets
(RO
A)
(%)
Tota
l A
sset
s($
‘000
)
Tota
l R
even
ue
($ ‘0
00)
Ass
et
Uti
liza
tion
(%)
Tota
l Li
abil
itie
s($
‘000
)
Aver
age
RO
AFY
2002
–FY
2010
(%)
AM
IA
ir M
arsh
all I
slan
ds10
9.4
0.0
5,29
92,
252
436,
870
–23.
2
KA
JUR
Kw
ajal
ein
Ato
ll Jo
int
Uti
lity
Res
ourc
e C
orpo
rati
on–6
5.3
–49.
95,
065
3,56
970
1,19
6–3
9.5
MAW
CM
aju
ro A
toll
Was
te C
orpo
rati
onN
AN
AN
AN
AN
AN
AN
A
MEC
Mar
shal
ls E
ner
gy C
ompa
ny
14.8
0.0
16,0
5734
,732
216
27,2
52–9
.2
MID
BM
arsh
all I
slan
ds D
evel
opm
ent
Ban
k9.
20.
018
,229
3,64
920
5,33
21.
1
MIP
AM
arsh
all I
slan
ds P
orts
Au
thor
ity
–3.5
0.0
53,0
952,
765
51,
663
–3.4
MIS
CM
arsh
all I
slan
ds S
hip
pin
g C
orpo
rati
onN
AN
AN
AN
AN
AN
AN
A
MR
IM
aju
ro R
esor
t In
c21
6.5
–31.
61,
876
1,86
499
2,15
0–3
6.5
MW
SCM
aju
ro W
ater
an
d Se
wer
Com
pan
y–1
04.5
–56.
961
598
716
028
0–2
1.6
NTA
Nat
ion
al T
elec
omm
un
icat
ion
Au
thor
ity
0.6
0.1
40,0
989,
145
2330
,832
1.5
TOBO
LAR
Tobo
lar
Cop
ra P
roce
ssin
g Pl
ant
–58.
90.
01,
701
2,65
215
612
211
.8
Port
foli
o–1
2.5
–5.9
142,
035
61,6
1543
66,3
38–5
.9
NA
= n
ot a
vaila
ble.
Sou
rce:
An
nu
al S
tate
-Ow
ned
En
terp
rise
Au
dit
Rep
orts
(th
e R
epu
blic
of
the
Mar
shal
l Isl
ands
).
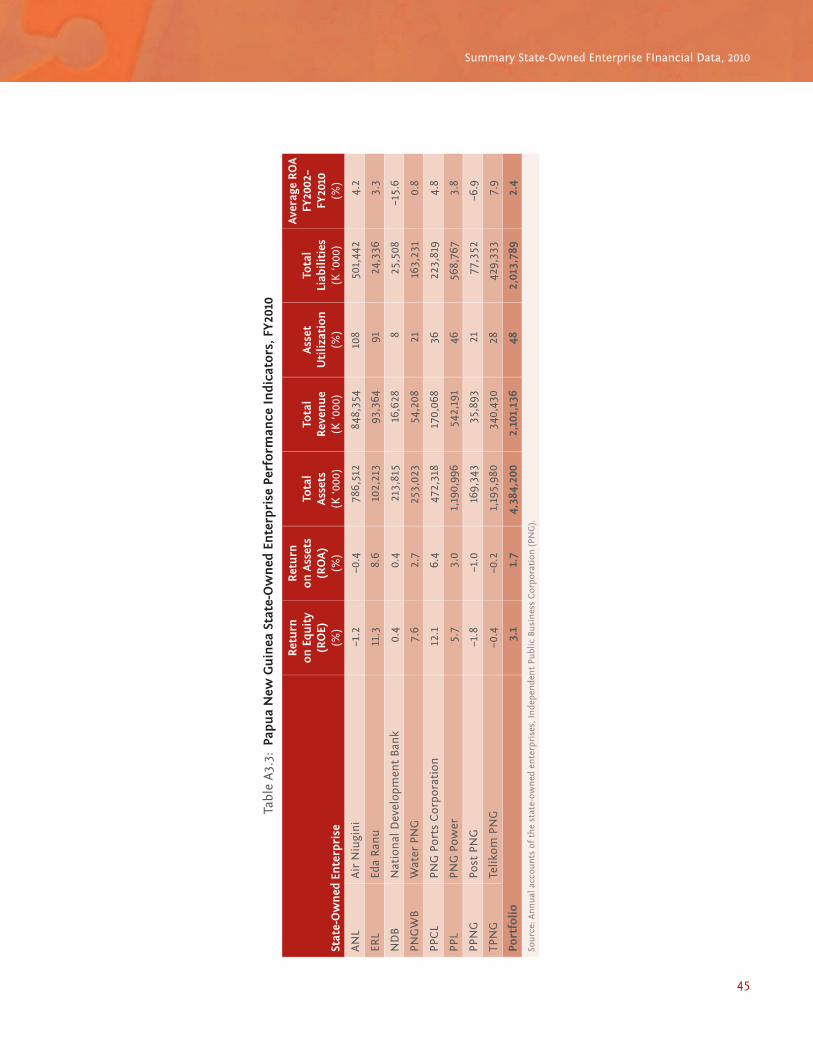
45
Summary State-Owned Enterprise FInancial Data, 2010
Tabl
e A
3.3:
Pap
ua
New
Gu
inea
Sta
te-O
wn
ed E
nte
rpri
se P
erfo
rman
ce I
ndi
cato
rs, F
Y201
0
Stat
e-O
wn
ed E
nte
rpri
se
Ret
urn
on
Equ
ity
(RO
E)(%
)
Ret
urn
on
Ass
ets
(RO
A)
(%)
Tota
l A
sset
s(K
‘000
)
Tota
l R
even
ue
(K ‘0
00)
Ass
et
Uti
liza
tion
(%)
Tota
l Li
abil
itie
s(K
‘000
)
Aver
age
RO
A
FY20
02–
FY20
10(%
)
AN
LA
ir N
iugi
ni
–1.2
–0.4
786
,512
8
48,3
54
108
501
,442
4.
2
ERL
Eda
Ran
u
11.3
8.6
102
,213
9
3,36
4 91
24,
336
3.3
ND
BN
atio
nal
Dev
elop
men
t Ba
nk
0.4
0.4
213
,815
1
6,62
8 8
25,
508
–15.
6
PNG
WB
Wat
er P
NG
7.6
2.7
253
,023
5
4,20
8 21
163
,231
0.
8
PPC
LPN
G P
orts
Cor
pora
tion
12.1
6.4
472
,318
1
70,0
68
36 2
23,8
19
4.8
PPL
PNG
Pow
er
5.7
3.0
1,1
90,9
96
542
,191
46
568
,767
3.
8
PPN
GPo
st P
NG
–1
.8–1
.0 1
69,3
43
35,
893
21 7
7,35
2 –6
.9
TPN
GTe
likom
PN
G
–0.4
–0.2
1,1
95,9
80
340
,430
28
429
,333
7.
9
Port
foli
o3.
11.
7 4
,384
,200
2
,101
,136
48
2,0
13,7
89
2.4
Sou
rce:
An
nu
al a
ccou
nts
of
the
stat
e-ow
ned
en
terp
rise
s, I
nde
pen
den
t Pu
blic
Bu
sin
ess
Cor
pora
tion
(PN
G).
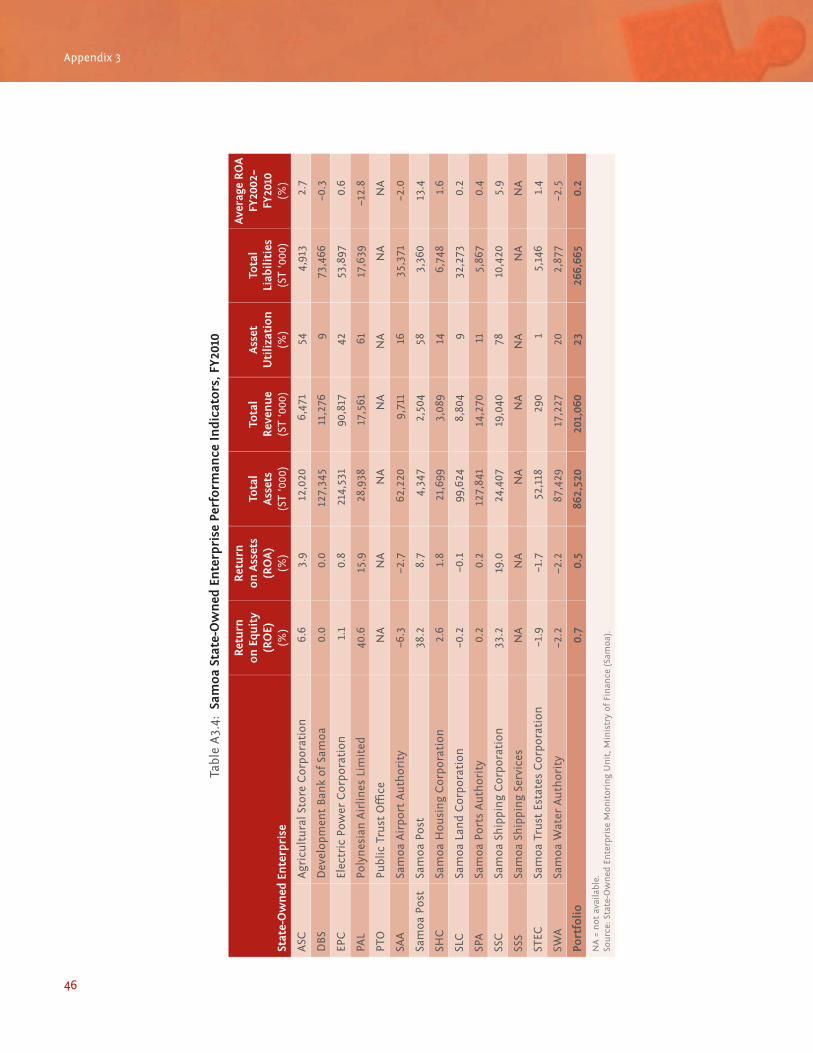
46
Appendix 3
Tabl
e A
3.4:
Sam
oa S
tate
-Ow
ned
En
terp
rise
Per
form
ance
In
dica
tors
, FY2
010
Stat
e-O
wn
ed E
nte
rpri
se
Ret
urn
on
Equ
ity
(RO
E)(%
)
Ret
urn
on
Ass
ets
(RO
A)
(%)
Tota
l A
sset
s(S
T ‘0
00)
Tota
l R
even
ue
(ST
‘000
)
Ass
et
Uti
liza
tion
(%)
Tota
l Li
abil
itie
s(S
T ‘0
00)
Aver
age
RO
A
FY20
02–
FY20
10(%
)
ASC
Agr
icu
ltu
ral S
tore
Cor
pora
tion
6.6
3.9
12,0
206,
471
544,
913
2.7
DBS
Dev
elop
men
t Ba
nk
of S
amoa
0.0
0.0
127,
345
11,2
769
73,4
66–0
.3
EPC
Elec
tric
Pow
er C
orpo
rati
on1.
10.
821
4,53
190
,817
4253
,897
0.6
PAL
Poly
nes
ian
Air
lines
Lim
ited
40.6
15.9
28,9
3817
,561
6117
,639
–12.
8
PTO
Publ
ic T
rust
Offi
ce
NA
NA
NA
NA
NA
NA
NA
SAA
Sam
oa A
irpo
rt A
uth
orit
y–6
.3–2
.762
,220
9,71
116
35,3
71–2
.0
Sam
oa P
ost
Sam
oa P
ost
38.2
8.7
4,34
72,
504
583,
360
13.4
SHC
Sam
oa H
ousi
ng
Cor
pora
tion
2.6
1.8
21,6
993,
089
146,
748
1.6
SLC
Sam
oa L
and
Cor
pora
tion
–0.2
–0.1
99,6
248,
804
932
,273
0.2
SPA
Sam
oa P
orts
Au
thor
ity
0.2
0.2
127,
841
14,2
7011
5,86
70.
4
SSC
Sam
oa S
hip
pin
g C
orpo
rati
on33
.219
.024
,407
19,0
4078
10,4
205.
9
SSS
Sam
oa S
hip
pin
g Se
rvic
esN
AN
AN
AN
AN
AN
AN
A
STEC
Sam
oa T
rust
Est
ates
Cor
pora
tion
–1.9
–1.7
52,1
1829
01
5,14
61.
4
SWA
Sam
oa W
ater
Au
thor
ity
–2.2
–2.2
87,4
2917
,227
202,
877
–2.5
Port
foli
o0.
70.
586
2,52
020
1,06
023
266,
665
0.2
NA
= n
ot a
vaila
ble.
Sou
rce:
Sta
te-O
wn
ed E
nte
rpri
se M
onit
orin
g U
nit
, Min
istr
y of
Fin
ance
(Sa
moa
).
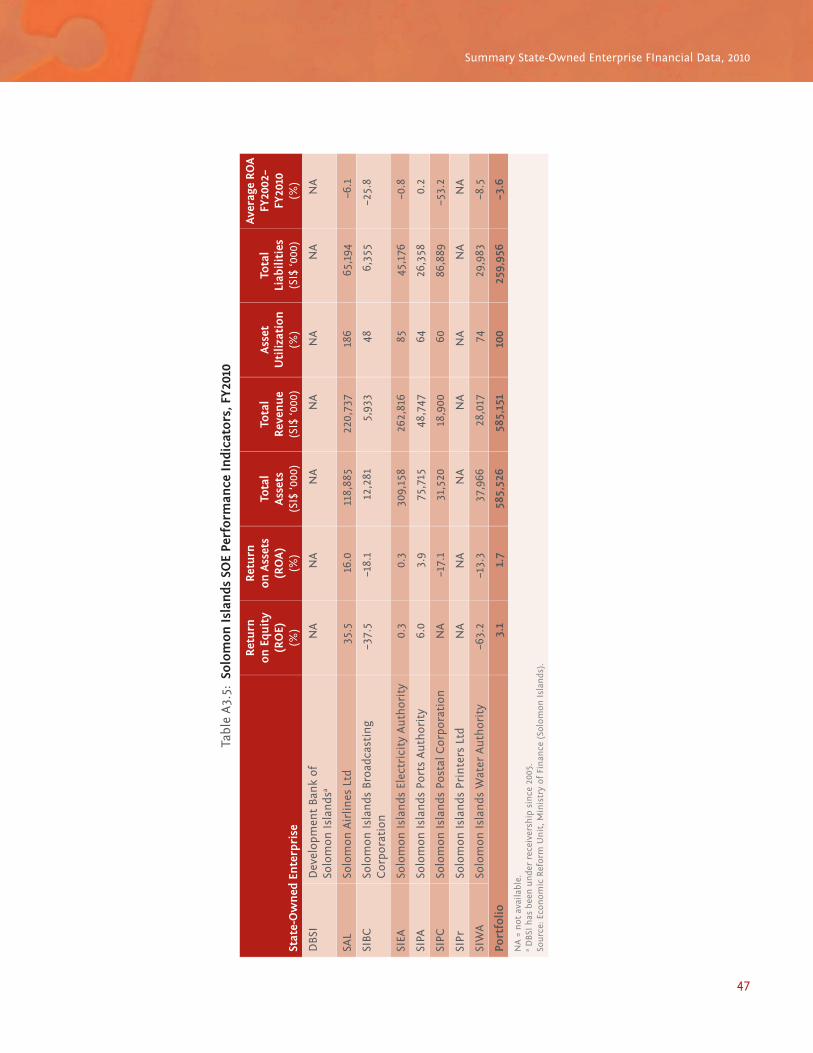
47
Summary State-Owned Enterprise FInancial Data, 2010
Tabl
e A
3.5:
Sol
omon
Isl
ands
SO
E Pe
rfor
man
ce I
ndi
cato
rs, F
Y201
0
Stat
e-O
wn
ed E
nte
rpri
se
Ret
urn
on
Equ
ity
(RO
E)(%
)
Ret
urn
on
Ass
ets
(RO
A)
(%)
Tota
l A
sset
s(S
I$ ‘0
00)
Tota
l R
even
ue
(SI$
‘000
)
Ass
et
Uti
liza
tion
(%)
Tota
l Li
abil
itie
s(S
I$ ‘0
00)
Aver
age
RO
A
FY20
02–
FY20
10(%
)
DBS
ID
evel
opm
ent
Ban
k of
So
lom
on I
slan
dsa
NA
NA
NA
N
A
NA
N
A
NA
SAL
Solo
mon
Air
lines
Ltd
35.5
16.0
118
,885
2
20,7
37
186
65,
194
–6.1
SIBC
Solo
mon
Isl
ands
Bro
adca
stin
g C
orpo
rati
on–3
7.5
–18.
1 1
2,28
1 5
,933
48
6,3
55
–25.
8
SIEA
Solo
mon
Isl
ands
Ele
ctri
city
Au
thor
ity
0.3
0.3
309
,158
2
62,8
16
85 4
5,17
6 –0
.8
SIPA
Solo
mon
Isl
ands
Por
ts A
uth
orit
y6.
03.
9 7
5,71
5 4
8,74
7 64
26,
358
0.2
SIPC
Solo
mon
Isl
ands
Pos
tal C
orpo
rati
onN
A–1
7.1
31,
520
18,
900
60 8
6,88
9 –5
3.2
SIPr
Solo
mon
Isl
ands
Pri
nte
rs L
tdN
AN
A N
A
NA
N
A
NA
N
A
SIW
ASo
lom
on I
slan
ds W
ater
Au
thor
ity
–63.
2–1
3.3
37,
966
28,
017
74 2
9,98
3 –8
.5
Port
foli
o3.
11.
758
5,52
658
5,15
110
025
9,95
6–3
.6
NA
= n
ot a
vaila
ble.
a DBS
I h
as b
een
un
der
rece
iver
ship
sin
ce 2
005.
Sou
rce:
Eco
nom
ic R
efor
m U
nit
, Min
istr
y of
Fin
ance
(So
lom
on I
slan
ds).

48
Appendix 3
Tabl
e A
3.6:
Ton
ga S
tate
-Ow
ned
En
terp
rise
Per
form
ance
In
dica
tors
, FY2
010
Stat
e-O
wn
ed E
nte
rpri
se
Ret
urn
on
Equ
ity
(RO
E)(%
)
Ret
urn
on
Ass
ets
(RO
A)
(%)
Tota
l A
sset
s(T
$ ‘0
00)
Tota
l R
even
ue
(T$
‘000
)
Ass
et
Uti
liza
tion
(%)
Tota
l Li
abil
itie
s(T
$ ‘0
00)
Aver
age
RO
A
FY20
02–
FY20
10(%
)
PAT
Port
s A
uth
orit
y To
nga
3.5
2.7
20,1
127,
081
354,
824
2.5
TAL
Ton
ga A
irpo
rt L
imit
ed–2
.5–2
.437
,192
6,46
617
2,29
7–1
.5a
TBC
Ton
ga B
road
cast
ing
Com
mis
sion
3.8
2.6
3,70
12,
289
621,
147
–2.5
TCC
Ton
ga C
omm
un
icat
ion
Cor
pora
tion
0.4
0.3
57,9
4324
,100
4211
,835
7.5
TDB
Ton
ga D
evel
opm
ent
Ban
k8.
22.
557
,202
7,61
013
39,8
203.
3
TIL
Ton
ga I
nve
stm
ent
Lim
ited
NA
NA
NA
NA
NA
NA
NA
TML
Ton
ga M
arke
t Li
mit
ed0.
00.
03,
307
524
161,
866
3.2b
TPos
tTo
nga
Pos
t Li
mit
ed–1
.0–1
.01,
877
612
3344
–3.7
c
TPow
erTo
nga
Pow
er L
imit
ed7.
54.
860
,635
36,3
2260
22,0
711.
8c
TPri
nt
Ton
ga P
rin
t Li
mit
ed–1
1.5
–10.
51,
450
705
4913
00.
6d
TTL
Ton
ga T
imbe
r Li
mit
edN
AN
AN
AN
AN
AN
A0.
7e
TWB
Ton
ga W
ater
Boa
rd4.
03.
822
,632
5,19
623
1,13
20.
8
WA
LW
aste
Au
thor
ity
Lim
ited
NA
NA
NA
NA
NA
NA
NA
Port
foli
o2.
51.
726
6,05
190
,905
3485
,166
3.4
NA
= n
ot a
vaila
ble.
a FY2
008–
2010
on
ly.
b FY
2004
–201
0 on
ly.
c FY2
009–
2010
on
ly.
d FY
2005
–201
0 on
ly.
e FY2
002–
2009
on
ly.
Sou
rce:
Min
istr
y of
Pu
blic
En
terp
rise
s an
d In
form
atio
n (
Ton
ga).
49
Introduction
Appendix 4
Notes on the Methodology
Selection of state-owned enterprises. The fi nancial analysis focused on the “for-profi t” state-owned enterprises (SOEs) within the respective portfolios. In Fiji, there are four SOEs that are “not-for-profi t” but two of these have functions which are similar to commercial SOEs in the other portfolios; therefore, they are included in the analysis for comparative purposes.18 The other two not-for-profi t SOEs in Fiji have been excluded from the fi nancial analysis.19 All not-for-profi t SOEs in Samoa are likewise excluded. In Samoa, the National Provident Fund and two insurance companies that are classifi ed by the government as public trading bodies are not included in the analysis, since their shares are owned by their contributors, not by the government. Similarly, in Papua New Guinea (PNG), Motor Vehicle Insurance is not included as it, too, is an insurance company. In Solomon Islands, two SOEs that are listed under the State-Owned Enterprises Act are not included in the analysis. The Commodities Export and Marketing Agency is excluded because it is a regulatory agency with no real commercial functions. And the Investment Corporation of Solomon Islands is excluded because it is a holding company whose assets are composed either of other majority-owned SOEs or minority holdings. Including it would distort the results by double-counting the results of the majority-owned SOEs and counting the results of minority holdings, which was not done for the other SOE portfolios. Soltai Fishing and Processing, which is not an SOE under the SOE Act but is majority-owned by the Investment Corporation of Solomon Islands, is included as a separate SOE in this study. In summary, unless the context otherwise requires, the terms “SOE portfolio” and “trading SOEs” used in this report relate to the for-profi t SOEs only.
There are also some SOEs that are minority-owned within the respective portfolios; however, these have been excluded because they are not eff ectively controlled by the governments, and the scope of this report is to assess the impact of government control on SOEs. A number of minority shareholdings within the General Business Trust of PNG are therefore excluded. SOEs that are majority-owned but not 100% owned have been included in the report. Where consolidated fi nancial results are presented, portfolio fi nancial results are calculated as the simple proportional addition of each SOE in the portfolio.
Source data. The source data for the fi nancial analysis are primarily the audited fi nancial statements of each SOE, as provided by the SOE monitoring units of each country, augmented by quarterly reports where audited fi nancial statements were not available. Where some SOEs have recorded debt forgiveness as extraordinary income, an adjustment was made to remove this impact on the income statement. No further adjustments were made to the fi nancial statements, but some line items have been reclassifi ed to provide a fi ner distinction among core, noncore, and extraordinary items. Where SOEs are reporting using diff erent fi scal years (e.g., one SOE in the portfolio ends its year in September, while the rest do so in December, and another SOE has a 9-month fi scal year) then these were simply summed on a calendar year basis. Thus, portfolio results for FY2004 include fi nancial results summed for all SOEs with any fi scal year ending in calendar 2004.
18 These are Fiji Electricity Authority and Housing Authority.19 These are Public Rental Board and Meat Industry Board.

Benchmarking the Performance of State-Owned Enterprises in Papua New Guinea
FINDING BALANCE
Finding BalanceBenchmarking the Performance of State-Owned Enterprises in Papua New Guinea
State-owned enterprises (SOEs) play a significant role in the economy of Papua New Guinea (PNG), as they do in other Pacific countries. They provide a range of essential services, most notably power, water, telecommunications, and transport that are vital to commerce and to the livelihoods of all communities. The performance of the SOEs therefore has an important impact on PNG’s ability to achieve inclusive economic growth.
This study benchmarks the performance of PNG’s SOEs with those of Fiji, the Marshall Islands, Samoa, Solomon Islands, and Tonga; assesses the key drivers of this performance; and identifies successful reform strategies that can guide future policy action. Particular attention is given to the legal, regulatory, governance, and monitoring frameworks of each country, given their known impact on the performance of the SOEs.
Pacific Private Sector Development Initiative
The Pacific Private Sector Development Initiative (PSDI) is a regional technical assistance facility cofinanced by the Australian Agency for International Development. PSDI is designed to support efforts by ADB Pacific developing member countries to encourage inclusive, private sector-led, sustainable economic growth. PSDI focuses on improving access to financial services, business law reform, and state-owned enterprise reform and public–private partnerships in the region.
About the Asian Development Bank
ADB’s vision is an Asia and Pacific region free of poverty. Its mission is to help its developing member countries reduce poverty and improve the quality of life of their people. Despite the region’s many successes, it remains home to two-thirds of the world’s poor: 1.8 billion people who live on less than $2 a day, with 903 million struggling on less than $1.25 a day. ADB is committed to reducing poverty through inclusive economic growth, environmentally sustainable growth, and regional integration.
Based in Manila, ADB is owned by 67 members, including 48 from the region. Its main instruments for helping its developing member countries are policy dialogue, loans, equity investments, guarantees, grants, and technical assistance.
Asian Development Bank6 ADB Avenue, Mandaluyong City 1550 Metro Manila, Philippineswww.adb.org
Pacific Liaison and Coordination OfficeLevel 18, 1 Margaret StreetSydney, NSW 2000, Australiawww.adb.org/pacific
Printed in AustraliaPrinted on recycled paper