findings of the 2013 workshop on statistical machine
TRANSCRIPT
Findings of the 2013 Workshop on Statistical Machine TranslationOndrej Bojar
Charles University in PragueChristian Buck
University of EdinburghChris Callison-Burch
University of Pennsylvania
Christian FedermannSaarland University
Barry HaddowUniversity of Edinburgh
Philipp KoehnUniversity of Edinburgh
Christof MonzUniversity of Amsterdam
Matt PostJohns Hopkins University
Radu SoricutGoogle
Lucia SpeciaUniversity of Sheffield
Abstract
This paper presents the results of theWMT13 shared tasks, which included atranslation task, a task for run-time estima-tion of machine translation quality, and anunofficial metrics task. This year, 143 ma-chine translation systems were submittedto the ten translation tasks from 23 insti-tutions. An additional 6 anonymized sys-tems were included, and were then evalu-ated both automatically and manually, inour largest manual evaluation to date. Thequality estimation task had four subtasks,with a total of 14 teams, submitting 55 en-tries.
1 Introduction
We present the results of the shared tasks ofthe Workshop on Statistical Machine Translation(WMT) held at ACL 2013. This workshop buildson seven previous WMT workshops (Koehn andMonz, 2006; Callison-Burch et al., 2007, 2008,2009, 2010, 2011, 2012).
This year we conducted three official tasks: atranslation task, a human evaluation of transla-tion results, and a quality estimation task.1 Inthe translation task (§2), participants were askedto translate a shared test set, optionally restrict-ing themselves to the provided training data. Weheld ten translation tasks this year, between En-glish and each of Czech, French, German, Span-ish, and Russian. The Russian translation taskswere new this year, and were also the most popu-lar. The system outputs for each task were evalu-ated both automatically and manually.
The human evaluation task (§3) involves ask-ing human judges to rank sentences output byanonymized systems. We obtained large numbers
1The traditional metrics task is evaluated in a separate pa-per (Machacek and Bojar, 2013).
of rankings from two groups: researchers (whocontributed evaluations proportional to the numberof tasks they entered) and workers on Amazon’sMechanical Turk (who were paid). This year’s ef-fort was our largest yet by a wide margin; we man-aged to collect an order of magnitude more judg-ments than in the past, allowing us to achieve sta-tistical significance on the majority of the pairwisesystem rankings. This year, we are also clusteringthe systems according to these significance results,instead of presenting a total ordering over systems.
The focus of the quality estimation task (§6)is to produce real-time estimates of sentence- orword-level machine translation quality. This taskhas potential usefulness in a range of settings, suchas prioritizing output for human post-editing, orselecting the best translations from a number ofsystems. This year the following subtasks wereproposed: prediction of percentage of word editsnecessary to fix a sentence, ranking of up to five al-ternative translations for a given source sentence,prediction of post-editing time for a sentence, andprediction of word-level scores for a given trans-lation (correct/incorrect and types of edits). Thedatasets included English-Spanish and German-English news translations produced by a numberof machine translation systems. This marks thesecond year we have conducted this task.
The primary objectives of WMT are to evaluatethe state of the art in machine translation, to dis-seminate common test sets and public training datawith published performance numbers, and to re-fine evaluation methodologies for machine trans-lation. As before, all of the data, translations,and collected human judgments are publicly avail-able.2 We hope these datasets serve as a valu-able resource for research into statistical machinetranslation, system combination, and automaticevaluation or prediction of translation quality.
2http://statmt.org/wmt13/results.html

2 Overview of the Translation Task
The recurring task of the workshop examinestranslation between English and five other lan-guages: German, Spanish, French, Czech, and —new this year — Russian. We created a test set foreach language pair by translating newspaper arti-cles and provided training data.
2.1 Test dataThe test data for this year’s task was selected fromnews stories from online sources. A total of 52articles were selected, in roughly equal amountsfrom a variety of Czech, English, French, German,Spanish, and Russian news sites:3
Czech: aktualne.cz (1), CTK (1), denık (1),iDNES.cz (3), lidovky.cz (1), Novinky.cz (2)
French: Cyber Presse (3), Le Devoir (1), LeMonde (3), Liberation (2)
Spanish: ABC.es (2), BBC Spanish (1), El Peri-odico (1), Milenio (3), Noroeste (1), PrimeraHora (3)
English: BBC (2), CNN (2), Economist (1),Guardian (1), New York Times (2), The Tele-graph (1)
German: Der Standard (1), Deutsche Welle (1),FAZ (1), Frankfurter Rundschau (2), Welt (2)
Russian: AIF (2), BBC Russian (2), Izvestiya (1),Rosbalt (1), Vesti (1)
The stories were translated by the professionaltranslation agency Capita, funded by the EUFramework Programme 7 project MosesCore, andby Yandex, a Russian search engine.4 All of thetranslations were done directly, and not via an in-termediate language.
2.2 Training dataAs in past years we provided parallel corpora totrain translation models, monolingual corpora totrain language models, and development sets totune system parameters. Some training corporawere identical from last year (Europarl5, UnitedNations, French-English 109 corpus, CzEng),some were updated (News Commentary, mono-lingual data), and new corpora were added (Com-mon Crawl (Smith et al., 2013), Russian-English
3For more details see the XML test files. The docid taggives the source and the date for each document in the test set,and the origlang tag indicates the original source language.
4http://www.yandex.com/5As of Fall 2011, the proceedings of the European Parlia-
ment are no longer translated into all official languages.
parallel data provided by Yandex, Russian-EnglishWikipedia Headlines provided by CMU).
Some statistics about the training materials aregiven in Figure 1.
2.3 Submitted systemsWe received 143 submissions from 23 institu-tions. The participating institutions and their en-try names are listed in Table 1; each system didnot necessarily appear in all translation tasks. Wealso included three commercial off-the-shelf MTsystems and three online statistical MT systems,6
which we anonymized.For presentation of the results, systems are
treated as either constrained or unconstrained, de-pending on whether their models were trained onlyon the provided data. Since we do not know howthey were built, these online and commercial sys-tems are treated as unconstrained during the auto-matic and human evaluations.
3 Human Evaluation
As with past workshops, we contend that auto-matic measures of machine translation quality arean imperfect substitute for human assessments.We therefore conduct a manual evaluation of thesystem outputs and define its results to be the prin-cipal ranking of the workshop. In this section, wedescribe how we collected this data and computethe results, and then present the official results ofthe ranking.
We run the evaluation campaign using an up-dated version of Appraise (Federmann, 2012); thetool has been extended to support collecting judg-ments using Amazon’s Mechanical Turk, replac-ing the annotation system used in previous WMTs.The software, including all changes made for thisyear’s workshop, is available from GitHub.7
This year differs from prior years in a few im-portant ways:
• We collected about ten times more judgmentsthat we have in the past, using judgmentsfrom both participants in the shared task andnon-experts hired on Amazon’s MechanicalTurk.
• Instead of presenting a total ordering of sys-tems for each pair, we cluster them and reporta ranking over the clusters.
6Thanks to Herve Saint-Amand and Martin Popel for har-vesting these entries.
7https://github.com/cfedermann/Appraise

Europarl Parallel CorpusSpanish↔ English French↔ English German↔ English Czech↔ English
Sentences 1,965,734 2,007,723 1,920,209 646,605Words 56,895,229 54,420,026 60,125,563 55,642,101 50,486,398 53,008,851 14,946,399 17,376,433
Distinct words 176,258 117,481 140,915 118,404 381,583 115,966 172,461 63,039
News Commentary Parallel CorpusSpanish↔ English French↔ English German↔ English Czech↔ English Russian↔ English
Sentences 174,441 157,168 178,221 140,324 150,217Words 5,116,388 4,520,796 4,928,135 4,066,721 4,597,904 4,541,058 3,206,423 3,507,249 3,841,950 4,008,949
Distinct words 84,273 61,693 69,028 58,295 142,461 61,761 138,991 54,270 145,997 57,991
Common Crawl Parallel CorpusSpanish↔ English French↔ English German↔ English Czech↔ English Russian↔ English
Sentences 1,845,286 3,244,152 2,399,123 161,838 878,386Words 49,561,060 46,861,758 91,328,790 81,096,306 54,575,405 58,870,638 3,529,783 3,927,378 21,018,793 21,535,122
Distinct words 710,755 640,778 889,291 859,017 1,640,835 823,480 210,170 128,212 764,203 432,062
United Nations Parallel CorpusSpanish↔ English French↔ English
Sentences 11,196,913 12,886,831Words 318,788,686 365,127,098 411,916,781 360,341,450
Distinct words 593,567 581,339 565,553 666,077
109 Word Parallel CorpusFrench↔ English
Sentences 22,520,400Words 811,203,407 668,412,817
Distinct words 2,738,882 2,861,836
CzEng Parallel CorpusCzech↔ English
Sentences 14,833,358Words 200,658,857 228,040,794
Distinct words 1,389,803 920,824
Yandex 1M Parallel CorpusRussian↔ English
Sentences 1,000,000Words 24,121,459 26,107,293
Distinct words 701,809 387,646
Wiki Headlines Parallel CorpusRussian↔ English
Sentences 514,859Words 1,191,474 1,230,644
Distinct words 282,989 251,328
Europarl Language Model DataEnglish Spanish French German Czech
Sentence 2,218,201 2,123,835 2,190,579 2,176,537 668,595Words 59,848,044 60,476,282 63,439,791 53,534,167 14,946,399
Distinct words 123,059 181,837 145,496 394,781 172,461
News Language Model DataEnglish Spanish French German Czech Russian
Sentence 68,521,621 13,384,314 21,195,476 54,619,789 27,540,749 19,912,911Words 1,613,778,461 386,014,234 524,541,570 983,818,841 456,271,247 351,595,790
Distinct words 3,392,137 1,163,825 1,590,187 6,814,953 2,655,813 2,195,112
News Test SetEnglish Spanish French German Czech Russian
Sentences 3000Words 64,810 73,659 73,659 63,412 57,050 58,327
Distinct words 8,935 10,601 11,441 12,189 15,324 15,736
Figure 1: Statistics for the training and test sets used in the translation task. The number of words and the number of distinctwords (case-insensitive) is based on the provided tokenizer.

ID InstitutionBALAGUR Yandex (Borisov et al., 2013)CMU
CMU-TREE-TO-TREE
Carnegie Mellon University (Ammar et al., 2013)
CU-BOJAR,CU-DEPFIX,CU-TAMCHYNA
Charles University in Prague (Bojar et al., 2013)
CU-KAREL, CU-ZEMAN Charles University in Prague (Bılek and Zeman, 2013)CU-PHRASEFIX,CU-TECTOMT
Charles University in Prague (Galuscakova et al., 2013)
DCU Dublin City University (Rubino et al., 2013a)DCU-FDA Dublin City University (Bicici, 2013a)DCU-OKITA Dublin City University (Okita et al., 2013)DESRT Universita di Pisa (Miceli Barone and Attardi, 2013)ITS-LATL University of GenevaJHU Johns Hopkins University (Post et al., 2013)KIT Karlsruhe Institute of Technology (Cho et al., 2013)LIA Universite d’Avignon (Huet et al., 2013)LIMSI LIMSI (Allauzen et al., 2013)MES-* Munich / Edinburgh / Stuttgart (Durrani et al., 2013a; Weller et al., 2013)OMNIFLUENT SAIC (Matusov and Leusch, 2013)PROMT PROMT Automated Translations SolutionsQCRI-MES Qatar / Munich / Edinburgh / Stuttgart (Sajjad et al., 2013)QUAERO QUAERO (Peitz et al., 2013a)RWTH RWTH Aachen (Peitz et al., 2013b)SHEF University of SheffieldSTANFORD Stanford University (Green et al., 2013)TALP-UPC TALP Research Centre (Formiga et al., 2013a)TUBITAK TUBITAK-BILGEM (Durgar El-Kahlout and Mermer, 2013)UCAM University of Cambridge (Pino et al., 2013)UEDIN,UEDIN-HEAFIELD
University of Edinburgh (Durrani et al., 2013b)
UEDIN-SYNTAX University of Edinburgh (Nadejde et al., 2013)UMD University of Maryland (Eidelman et al., 2013)UU Uppsala University (Stymne et al., 2013)COMMERCIAL-1,2,3 Anonymized commercial systemsONLINE-A,B,G Anonymized online systems
Table 1: Participants in the shared translation task. Not all teams participated in all language pairs. The translations from thecommercial and online systems were not submitted by their respective companies but were obtained by us, and are thereforeanonymized in a fashion consistent with previous years of the workshop.
3.1 Ranking translations of sentencesThe ranking among systems is produced by col-lecting a large number of rankings between thesystems’ translations. Every language task hadmany participating systems (the largest was 19,for the Russian-English task). Rather than askingjudges to provide a complete ordering over all thetranslations of a source segment, we instead ran-domly select five systems and ask the judge to rankjust those. We call each of these a ranking task.A screenshot of the ranking interface is shown inFigure 2.
For each ranking task, the judge is presentedwith a source segment, a reference translation,and the outputs of five systems (anonymized andrandomly-ordered). The following simple instruc-tions are provided:
You are shown a source sentence fol-lowed by several candidate translations.Your task is to rank the translations frombest to worst (ties are allowed).
The rankings of the systems are numbered from 1to 5, with 1 being the best translation and 5 be-ing the worst. Each ranking task has the potentialto provide 10 pairwise rankings, and fewer if thejudge chooses any ties. For example, the ranking
{A:1, B:2, C:4, D:3, E:5}
provides 10 pairwise rankings, while the ranking
{A:3, B:3, C:4, D:3, E:1}
provides just 7. The absolute value of the rankingor the degree of difference is not considered.
We use the collected pairwise rankings to assigneach system a score that reflects how highly thatsystem was usually ranked by the annotators. Thescore for some system A reflects how frequently itwas judged to be better than other systems whencompared on the same segment; its score is thenumber of pairwise rankings where it was judgedto be better, divided by the total number of non-tying pairwise comparisons. These scores wereused to compute clusters of systems and rankingsbetween them (§3.4).
3.2 Collecting the dataA goal this year was to collect enough data toachieve statistical significance in the rankings. Wedistributed the workload among two groups ofjudges: researchers and Turkers. The researcher
group comprised partipants in the shared task, whowere asked to contribute judgments on 300 sen-tences for each system they contributed. The re-searcher evaluation was held over three weeksfrom May 17–June 7, and yielded about 280k pair-wise rankings.
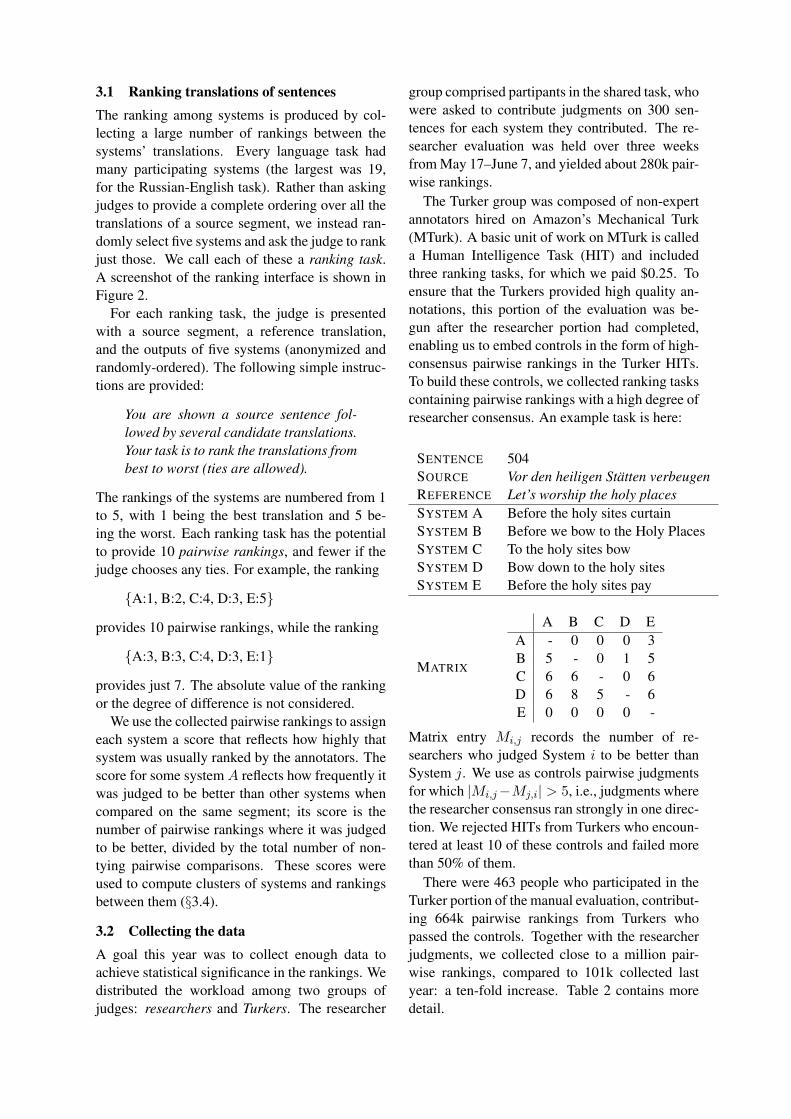
The Turker group was composed of non-expertannotators hired on Amazon’s Mechanical Turk(MTurk). A basic unit of work on MTurk is calleda Human Intelligence Task (HIT) and includedthree ranking tasks, for which we paid $0.25. Toensure that the Turkers provided high quality an-notations, this portion of the evaluation was be-gun after the researcher portion had completed,enabling us to embed controls in the form of high-consensus pairwise rankings in the Turker HITs.To build these controls, we collected ranking taskscontaining pairwise rankings with a high degree ofresearcher consensus. An example task is here:
SENTENCE 504SOURCE Vor den heiligen Statten verbeugenREFERENCE Let’s worship the holy placesSYSTEM A Before the holy sites curtainSYSTEM B Before we bow to the Holy PlacesSYSTEM C To the holy sites bowSYSTEM D Bow down to the holy sitesSYSTEM E Before the holy sites pay
MATRIX
A B C D EA - 0 0 0 3B 5 - 0 1 5C 6 6 - 0 6D 6 8 5 - 6E 0 0 0 0 -
Matrix entry Mi,j records the number of re-searchers who judged System i to be better thanSystem j. We use as controls pairwise judgmentsfor which |Mi,j−Mj,i| > 5, i.e., judgments wherethe researcher consensus ran strongly in one direc-tion. We rejected HITs from Turkers who encoun-tered at least 10 of these controls and failed morethan 50% of them.
There were 463 people who participated in theTurker portion of the manual evaluation, contribut-ing 664k pairwise rankings from Turkers whopassed the controls. Together with the researcherjudgments, we collected close to a million pair-wise rankings, compared to 101k collected lastyear: a ten-fold increase. Table 2 contains moredetail.

Figure 2: Screenshot of the Appraise interface used in the human evaluation campaign. The annotator is presented with asource segment, a reference translation, and the outputs of five systems (anonymized and randomly-ordered) and has to rankthese according to their translation quality, ties are allowed. For technical reasons, annotators on Amazon’s Mechanical Turkreceived all three ranking tasks for a single HIT on a single page, one upon the other.
3.3 Annotator agreementEach year we calculate annotator agreementscores for the human evaluation as a measure ofthe reliability of the rankings. We measured pair-wise agreement among annotators using Cohen’skappa coefficient (κ) (Cohen, 1960), which is de-fined as
κ =P (A)− P (E)
1− P (E)
where P (A) is the proportion of times that the an-notators agree, and P (E) is the proportion of timethat they would agree by chance. Note that κ is ba-sically a normalized version of P (A), one whichtakes into account how meaningful it is for anno-tators to agree with each other, by incorporatingP (E). The values for κ range from 0 to 1, withzero indicating no agreement and 1 perfect agree-ment.
We calculate P (A) by examining all pairs ofsystems which had been judged by two or morejudges, and calculating the proportion of time thatthey agreed that A > B, A = B, or A < B. Inother words, P (A) is the empirical, observed rate
at which annotators agree, in the context of pair-wise comparisons.
As for P (E), it should capture the probabilitythat two annotators would agree randomly. There-fore:
P (E) = P (A>B)2 + P (A=B)2 + P (A<B)2
Note that each of the three probabilities in P (E)’sdefinition are squared to reflect the fact that we areconsidering the chance that two annotators wouldagree by chance. Each of these probabilities iscomputed empirically, by observing how often an-notators actually rank two systems as being tied.
Table 3 gives κ values for inter-annotator agree-ment for WMT11–WMT13 while Table 4 de-tails intra-annotator agreement scores. Due to thechange of annotation software, we used a slightlydifferent way of computing annotator agreementscores. Therefore, we chose to re-compute valuesfor previous WMTs to allow for a fair comparison.The exact interpretation of the kappa coefficient isdifficult, but according to Landis and Koch (1977),0–0.2 is slight, 0.2–0.4 is fair, 0.4–0.6 is moderate,

LANGUAGE PAIR Systems Rankings AverageCzech-English 11 85,469 7,769.91English-Czech 12 102,842 8,570.17German-English 17 128,668 7,568.71English-German 15 77,286 5,152.40Spanish-English 12 67,832 5,652.67English-Spanish 13 60,464 4,651.08French-English 13 80,741 6,210.85English-French 17 100,783 5,928.41Russian-English 19 151,422 7,969.58English-Russian 14 87,323 6,237.36Total 148 942,840 6,370.54WMT12 103 101,969 999.69WMT11 133 63,045 474.02
Table 2: Amount of data collected in the WMT13 manual evaluation. The final two rows report summary information from theprevious two workshops.
LANGUAGE PAIR WMT11 WMT12 WMT13 WMT13r WMT13mCzech-English 0.400 0.311 0.244 0.342 0.279English-Czech 0.460 0.359 0.168 0.408 0.075German-English 0.324 0.385 0.299 0.443 0.324English-German 0.378 0.356 0.267 0.457 0.239Spanish-English 0.494 0.298 0.277 0.415 0.295English-Spanish 0.367 0.254 0.206 0.333 0.249French-English 0.402 0.272 0.275 0.405 0.321English-French 0.406 0.296 0.231 0.434 0.237Russian-English — — 0.278 0.315 0.324English-Russian — — 0.243 0.416 0.207
Table 3: κ scores measuring inter-annotator agreement. The WMT13r and WMT13m columns provide breakdowns for re-searcher annotations and MTurk annotations, respectively. See Table 4 for corresponding intra-annotator agreement scores.
0.6–0.8 is substantial, and 0.8–1.0 is almost per-fect. We find that the agreement rates are more orless the same as in prior years.
The WMT13 column contains both researcherand Turker annotations at a roughly 1:2 ratio. Thefinal two columns break out agreement numbersbetween these two groups. The researcher agree-ment rates are similar to agreement rates from pastyears, while the Turker agreement are well belowresearcher agreement rates, varying widely, but of-ten comparable to WMT11 and WMT12. Clearly,researchers are providing us with more consistentopinions, but whether these differences are ex-plained by Turkers racing through jobs, the partic-ularities that inform researchers judging systemsthey know well, or something else, is hard to tell.Intra-annotator agreement scores are also on parfrom last year’s level, and are often much better.We observe better intra-annotator agreement forresearchers compared to Turkers.
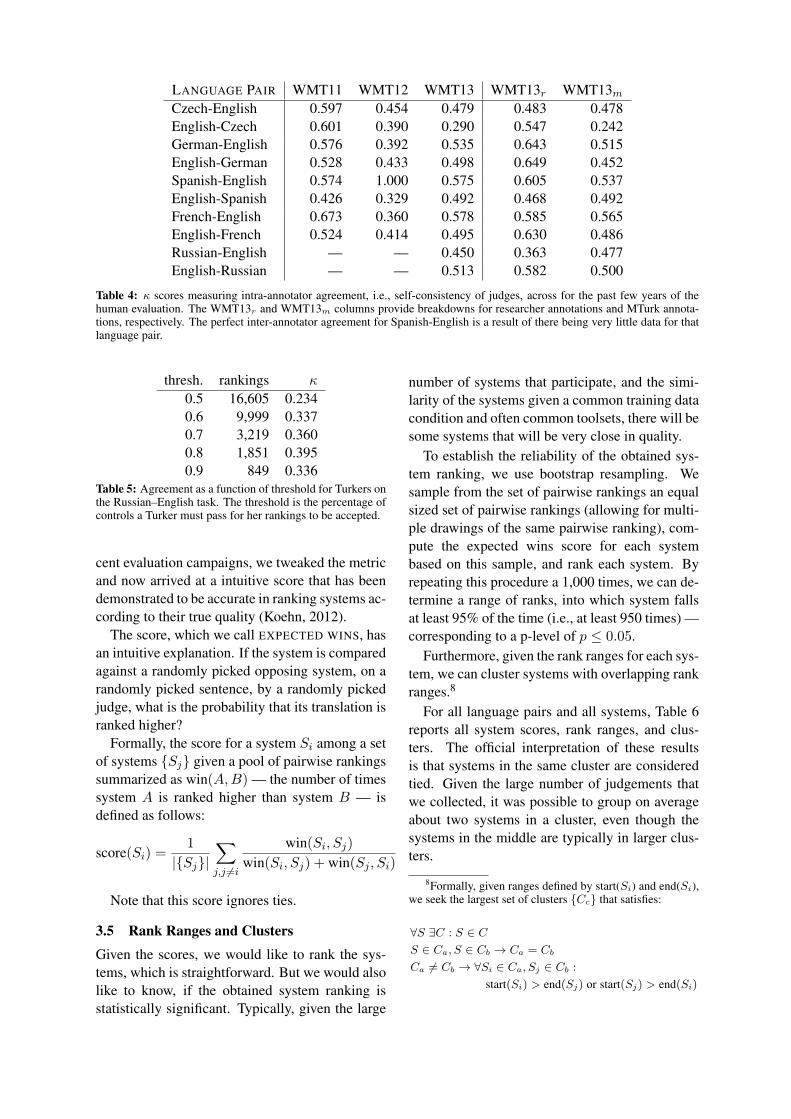
As a small test, we varied the threshold of ac-ceptance against the controls for the Turker dataalone and computed inter-annotator agreementscores on the datasets for the Russian–English task(the only language pair where we had enough dataat high thresholds). Table 5 shows that higherthresholds do indeed give us better agreements,but not monotonically. The increasing κs sug-gests that we can find a segment of Turkers whodo a better job and that perhaps a slightly higherthreshold of 0.6 would serve us better, while theremaining difference against the researchers sug-gests there may be different mindsets informingthe decisions. In any case, getting the best perfor-mance out of the Turkers remains difficult.
3.4 System Score
Given the multitude of pairwise comparisons, wewould like to rank the systems according to asingle score computed for each system. In re-
LANGUAGE PAIR WMT11 WMT12 WMT13 WMT13r WMT13mCzech-English 0.597 0.454 0.479 0.483 0.478English-Czech 0.601 0.390 0.290 0.547 0.242German-English 0.576 0.392 0.535 0.643 0.515English-German 0.528 0.433 0.498 0.649 0.452Spanish-English 0.574 1.000 0.575 0.605 0.537English-Spanish 0.426 0.329 0.492 0.468 0.492French-English 0.673 0.360 0.578 0.585 0.565English-French 0.524 0.414 0.495 0.630 0.486Russian-English — — 0.450 0.363 0.477English-Russian — — 0.513 0.582 0.500
Table 4: κ scores measuring intra-annotator agreement, i.e., self-consistency of judges, across for the past few years of thehuman evaluation. The WMT13r and WMT13m columns provide breakdowns for researcher annotations and MTurk annota-tions, respectively. The perfect inter-annotator agreement for Spanish-English is a result of there being very little data for thatlanguage pair.
thresh. rankings κ
0.5 16,605 0.2340.6 9,999 0.3370.7 3,219 0.3600.8 1,851 0.3950.9 849 0.336
Table 5: Agreement as a function of threshold for Turkers onthe Russian–English task. The threshold is the percentage ofcontrols a Turker must pass for her rankings to be accepted.
cent evaluation campaigns, we tweaked the metricand now arrived at a intuitive score that has beendemonstrated to be accurate in ranking systems ac-cording to their true quality (Koehn, 2012).
The score, which we call EXPECTED WINS, hasan intuitive explanation. If the system is comparedagainst a randomly picked opposing system, on arandomly picked sentence, by a randomly pickedjudge, what is the probability that its translation isranked higher?
Formally, the score for a system Si among a setof systems {Sj} given a pool of pairwise rankingssummarized as win(A,B) — the number of timessystem A is ranked higher than system B — isdefined as follows:
score(Si) =1
|{Sj}|∑j,j 6=i
win(Si, Sj)win(Si, Sj) + win(Sj , Si)
Note that this score ignores ties.
3.5 Rank Ranges and Clusters
Given the scores, we would like to rank the sys-tems, which is straightforward. But we would alsolike to know, if the obtained system ranking isstatistically significant. Typically, given the large
number of systems that participate, and the simi-larity of the systems given a common training datacondition and often common toolsets, there will besome systems that will be very close in quality.
To establish the reliability of the obtained sys-tem ranking, we use bootstrap resampling. Wesample from the set of pairwise rankings an equalsized set of pairwise rankings (allowing for multi-ple drawings of the same pairwise ranking), com-pute the expected wins score for each systembased on this sample, and rank each system. Byrepeating this procedure a 1,000 times, we can de-termine a range of ranks, into which system fallsat least 95% of the time (i.e., at least 950 times) —corresponding to a p-level of p ≤ 0.05.
Furthermore, given the rank ranges for each sys-tem, we can cluster systems with overlapping rankranges.8
For all language pairs and all systems, Table 6reports all system scores, rank ranges, and clus-ters. The official interpretation of these resultsis that systems in the same cluster are consideredtied. Given the large number of judgements thatwe collected, it was possible to group on averageabout two systems in a cluster, even though thesystems in the middle are typically in larger clus-ters.
8Formally, given ranges defined by start(Si) and end(Si),we seek the largest set of clusters {Cc} that satisfies:
∀S ∃C : S ∈ CS ∈ Ca, S ∈ Cb → Ca = Cb
Ca 6= Cb → ∀Si ∈ Ca, Sj ∈ Cb :
start(Si) > end(Sj) or start(Sj) > end(Si)

Czech-English# score range system1 0.607 1 UEDIN-HEAFIELD2 0.582 2-3 ONLINE-B
0.573 2-4 MES0.562 3-5 UEDIN0.547 4-7 ONLINE-A0.542 5-7 UEDIN-SYNTAX0.534 6-7 CU-ZEMAN
8 0.482 8 CU-TAMCHYNA9 0.458 9 DCU-FDA10 0.321 10 JHU11 0.297 11 SHEF-WPROA
English-Czech# score range system1 0.580 1-2 CU-BOJAR
0.578 1-2 CU-DEPFIX3 0.562 3 ONLINE-B4 0.525 4 UEDIN5 0.505 5-7 CU-ZEMAN
0.502 5-7 MES0.499 5-8 ONLINE-A0.484 7-9 CU-PHRASEFIX0.476 8-9 CU-TECTOMT
10 0.457 10-11 COMMERCIAL-10.450 10-11 COMMERCIAL-2
12 0.389 12 SHEF-WPROA
Spanish-English# score range system1 0.624 1 UEDIN-HEAFIELD2 0.595 2 ONLINE-B3 0.570 3-5 UEDIN
0.570 3-5 ONLINE-A0.567 3-5 MES
6 0.537 6 LIMSI-SOUL7 0.514 7 DCU8 0.488 8-9 DCU-OKITA
0.484 8-9 DCU-FDA10 0.462 10 CU-ZEMAN11 0.425 11 JHU12 0.169 12 SHEF-WPROA
English-Spanish# rank range system1 0.637 1 ONLINE-B2 0.582 2-4 ONLINE-A
0.578 2-4 UEDIN0.567 3-4 PROMT
5 0.535 5-6 MES0.528 5-6 TALP-UPC
7 0.491 7-8 LIMSI0.474 7-9 DCU0.472 8-10 DCU-FDA0.455 9-11 DCU-OKITA0.446 10-11 CU-ZEMAN
12 0.417 12 JHU13 0.324 13 SHEF-WPROA
German-English# rank range system1 0.660 1 ONLINE-B2 0.620 2-3 ONLINE-A
0.608 2-3 UEDIN-SYNTAX4 0.586 4-5 UEDIN
0.584 4-5 QUAERO0.571 5-7 KIT0.562 6-7 MES
8 0.543 8-9 RWTH-JANE0.533 8-10 MES-REORDER0.526 9-10 LIMSI-SOUL
11 0.480 11 TUBITAK12 0.462 12-13 UMD
0.462 12-13 DCU14 0.396 14 CU-ZEMAN15 0.367 15 JHU16 0.311 16 SHEF-WPROA17 0.238 17 DESRT
English-German# rank range system1 0.637 1-2 ONLINE-B
0.636 1-2 PROMT3 0.614 3 UEDIN-SYNTAX
0.587 3-5 ONLINE-A0.571 4-6 UEDIN0.554 5-6 KIT
7 0.523 7 STANFORD8 0.507 8 LIMSI-SOUL9 0.477 9-11 MES-REORDER
0.476 9-11 JHU0.460 10-12 CU-ZEMAN0.453 11-12 TUBITAK
13 0.361 13 UU14 0.329 14-15 SHEF-WPROA
0.323 14-15 RWTH-JANE
English-Russian# rank range system1 0.641 1 PROMT2 0.623 2 ONLINE-B3 0.556 3-4 CMU
0.542 3-6 ONLINE-G0.538 3-7 ONLINE-A0.531 4-7 UEDIN0.520 5-7 QCRI-MES
8 0.498 8 CU-KAREL9 0.478 9-10 MES-QCRI
0.469 9-10 JHU11 0.434 11-12 COMMERCIAL-3
0.426 11-13 LIA0.419 12-13 BALAGUR
14 0.331 14 CU-ZEMAN
French-English# rank range system1 0.638 1 UEDIN-HEAFIELD2 0.604 2-3 UEDIN
0.591 2-3 ONLINE-B4 0.573 4-5 LIMSI-SOUL
0.562 4-5 KIT0.541 5-6 ONLINE-A
7 0.512 7 MES-SIMPLIFIED8 0.486 8 DCU9 0.439 9-10 RWTH
0.429 9-11 CMU-T2T0.420 10-11 CU-ZEMAN
12 0.389 12 JHU13 0.322 13 SHEF-WPROA
English-French# rank range system1 0.607 1-2 UEDIN
0.600 1-3 ONLINE-B0.588 2-4 LIMSI-SOUL0.584 3-4 KIT
5 0.553 5-7 PROMT0.551 5-8 STANFORD0.547 5-8 MES0.537 6-9 MES-INFLECTION0.533 7-10 RWTH-PB0.516 9-11 ONLINE-A0.499 10-11 DCU
12 0.427 12 CU-ZEMAN13 0.408 13 JHU14 0.382 14 OMNIFLUENT15 0.350 15 ITS-LATL16 0.326 16 ITS-LATL-PE
Russian-English# rank range system1 0.657 1 ONLINE-B2 0.604 2-3 CMU
0.588 2-3 ONLINE-A4 0.562 4-6 ONLINE-G
0.561 4-6 PROMT0.550 5-7 QCRI-MES0.546 5-7 UCAM
8 0.527 8-9 BALAGUR0.519 8-10 MES-QCRI0.507 9-11 UEDIN0.497 10-12 OMNIFLUENT0.492 11-14 LIA0.483 12-15 OMNIFLUENT-C0.481 12-15 UMD0.476 13-15 CU-KAREL
16 0.432 16 COMMERCIAL-317 0.417 17 UEDIN-SYNTAX18 0.396 18 JHU19 0.215 19 CU-ZEMAN
Table 6: Official results for the WMT13 translation task. Systems are ordered by the expected win score. Lines betweensystems indicate clusters according to bootstrap resampling at p-level p ≤ .05. This method is also used to determine therange of ranks into which system falls. Systems with grey background indicate use of resources that fall outside the constraintsprovided for the shared task.
4 Understandability of English→Czech
For the English-to-Czech translation, we con-ducted a variation of the “understandability” testas introduced in WMT09 (Callison-Burch et al.,2009) and used in WMT10. In order to obtainadditional reference translations, we conflated thistest with post-editing. The procedure was as fol-lows:
1. Monolingual editing (also called blind edit-ing). The first annotator is given just the MToutput and requested to correct it. Given er-rors in MT outputs, some guessing of theoriginal meaning is often inevitable and theannotators are welcome to try. If unable, theycan mark the sentences as incomprehensible.
2. Review. A second annotator is asked tovalidate the monolingual edit given both thesource and reference translations. Our in-structions specify three options:
(a) If the monolingual edit is an adequatetranslation and acceptably fluent Czech,confirm it without changes.
(b) If the monolingual edit is adequate butneeds polishing, modify the sentenceand prefix it with the label ‘OK:’.
(c) If the monolingual edit is wrong, cor-rect it. You may start from the origi-nal unedited MT output, if that is eas-ier. Avoid using the reference directly,prefer words from MT output wheneverpossible.
The motivation behind this procedure is that wewant to save the time necessary for reading thesentence. If the reviewer has already consideredwhether the sentence is an acceptable translation,they do not need to read the MT output again inorder to post-edit it. Our approach is thus some-what the converse of Aziz et al. (2013) who ana-lyze post-editing effort to obtain rankings of MTsystems. We want to measure the understandabil-ity of MT outputs and obtain post-edits at the sametime.
Both annotation steps were carried out inthe CASMACAT/Matecat post-editing user inter-face.9, modified to provide the relevant variants ofthe sentence next to the main edit box. Screen-shots of the two annotation phases are given inFigure 3 and Figure 4.
9http://www.casmacat.eu/index.php?n=Workbench
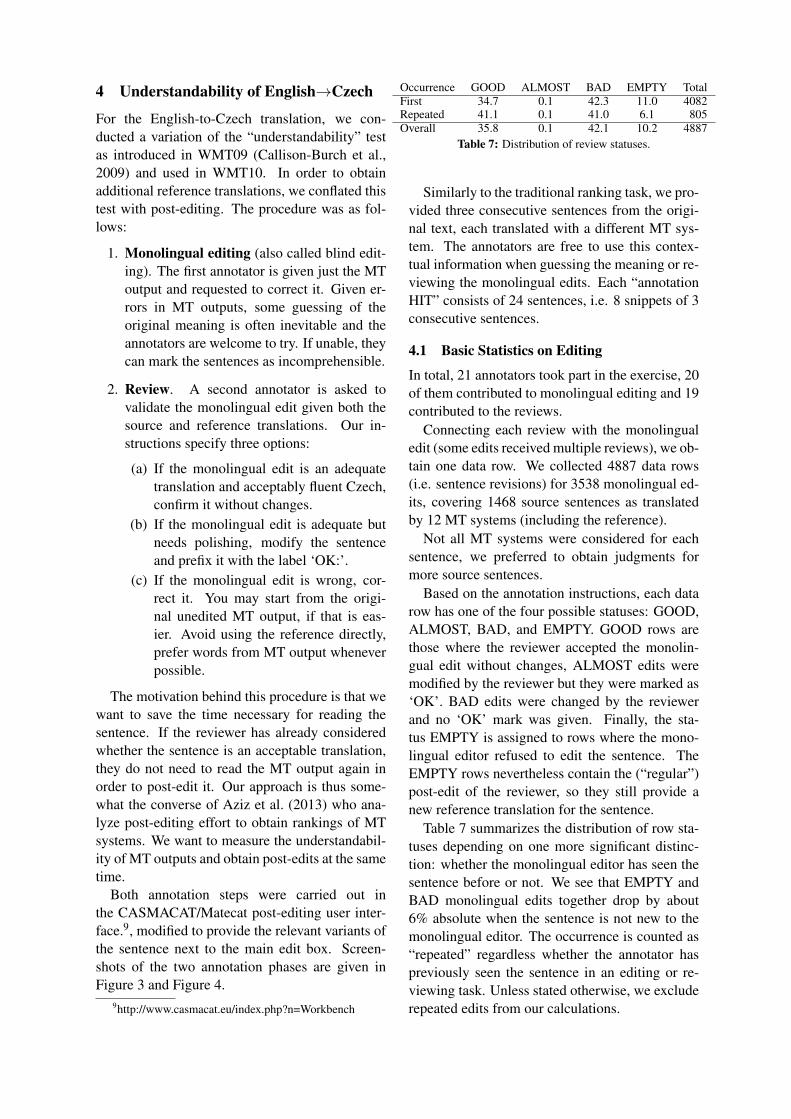
Occurrence GOOD ALMOST BAD EMPTY TotalFirst 34.7 0.1 42.3 11.0 4082Repeated 41.1 0.1 41.0 6.1 805Overall 35.8 0.1 42.1 10.2 4887
Table 7: Distribution of review statuses.
Similarly to the traditional ranking task, we pro-vided three consecutive sentences from the origi-nal text, each translated with a different MT sys-tem. The annotators are free to use this contex-tual information when guessing the meaning or re-viewing the monolingual edits. Each “annotationHIT” consists of 24 sentences, i.e. 8 snippets of 3consecutive sentences.
4.1 Basic Statistics on Editing
In total, 21 annotators took part in the exercise, 20of them contributed to monolingual editing and 19contributed to the reviews.
Connecting each review with the monolingualedit (some edits received multiple reviews), we ob-tain one data row. We collected 4887 data rows(i.e. sentence revisions) for 3538 monolingual ed-its, covering 1468 source sentences as translatedby 12 MT systems (including the reference).
Not all MT systems were considered for eachsentence, we preferred to obtain judgments formore source sentences.
Based on the annotation instructions, each datarow has one of the four possible statuses: GOOD,ALMOST, BAD, and EMPTY. GOOD rows arethose where the reviewer accepted the monolin-gual edit without changes, ALMOST edits weremodified by the reviewer but they were marked as‘OK’. BAD edits were changed by the reviewerand no ‘OK’ mark was given. Finally, the sta-tus EMPTY is assigned to rows where the mono-lingual editor refused to edit the sentence. TheEMPTY rows nevertheless contain the (“regular”)post-edit of the reviewer, so they still provide anew reference translation for the sentence.
Table 7 summarizes the distribution of row sta-tuses depending on one more significant distinc-tion: whether the monolingual editor has seen thesentence before or not. We see that EMPTY andBAD monolingual edits together drop by about6% absolute when the sentence is not new to themonolingual editor. The occurrence is counted as“repeated” regardless whether the annotator haspreviously seen the sentence in an editing or re-viewing task. Unless stated otherwise, we excluderepeated edits from our calculations.
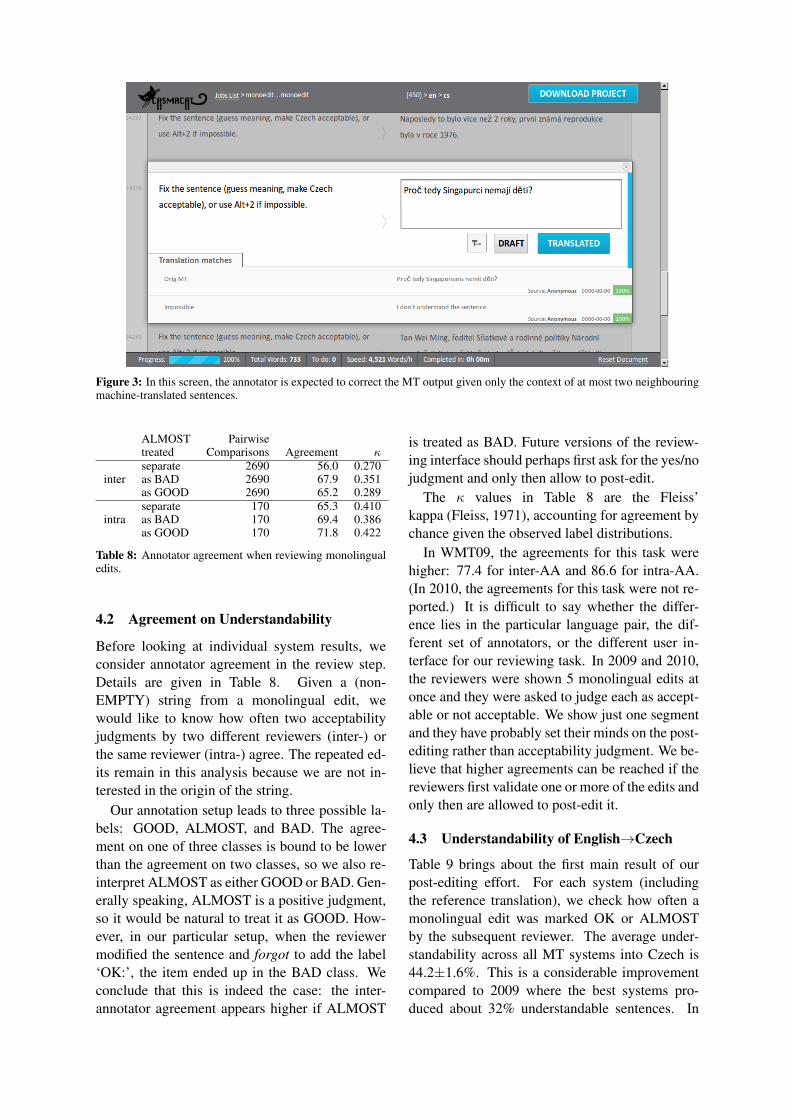
Figure 3: In this screen, the annotator is expected to correct the MT output given only the context of at most two neighbouringmachine-translated sentences.
ALMOST Pairwisetreated Comparisons Agreement κ
interseparate 2690 56.0 0.270as BAD 2690 67.9 0.351as GOOD 2690 65.2 0.289
intraseparate 170 65.3 0.410as BAD 170 69.4 0.386as GOOD 170 71.8 0.422
Table 8: Annotator agreement when reviewing monolingualedits.
4.2 Agreement on Understandability
Before looking at individual system results, weconsider annotator agreement in the review step.Details are given in Table 8. Given a (non-EMPTY) string from a monolingual edit, wewould like to know how often two acceptabilityjudgments by two different reviewers (inter-) orthe same reviewer (intra-) agree. The repeated ed-its remain in this analysis because we are not in-terested in the origin of the string.
Our annotation setup leads to three possible la-bels: GOOD, ALMOST, and BAD. The agree-ment on one of three classes is bound to be lowerthan the agreement on two classes, so we also re-interpret ALMOST as either GOOD or BAD. Gen-erally speaking, ALMOST is a positive judgment,so it would be natural to treat it as GOOD. How-ever, in our particular setup, when the reviewermodified the sentence and forgot to add the label‘OK:’, the item ended up in the BAD class. Weconclude that this is indeed the case: the inter-annotator agreement appears higher if ALMOST
is treated as BAD. Future versions of the review-ing interface should perhaps first ask for the yes/nojudgment and only then allow to post-edit.
The κ values in Table 8 are the Fleiss’kappa (Fleiss, 1971), accounting for agreement bychance given the observed label distributions.
In WMT09, the agreements for this task werehigher: 77.4 for inter-AA and 86.6 for intra-AA.(In 2010, the agreements for this task were not re-ported.) It is difficult to say whether the differ-ence lies in the particular language pair, the dif-ferent set of annotators, or the different user in-terface for our reviewing task. In 2009 and 2010,the reviewers were shown 5 monolingual edits atonce and they were asked to judge each as accept-able or not acceptable. We show just one segmentand they have probably set their minds on the post-editing rather than acceptability judgment. We be-lieve that higher agreements can be reached if thereviewers first validate one or more of the edits andonly then are allowed to post-edit it.
4.3 Understandability of English→Czech
Table 9 brings about the first main result of ourpost-editing effort. For each system (includingthe reference translation), we check how often amonolingual edit was marked OK or ALMOSTby the subsequent reviewer. The average under-standability across all MT systems into Czech is44.2±1.6%. This is a considerable improvementcompared to 2009 where the best systems pro-duced about 32% understandable sentences. In
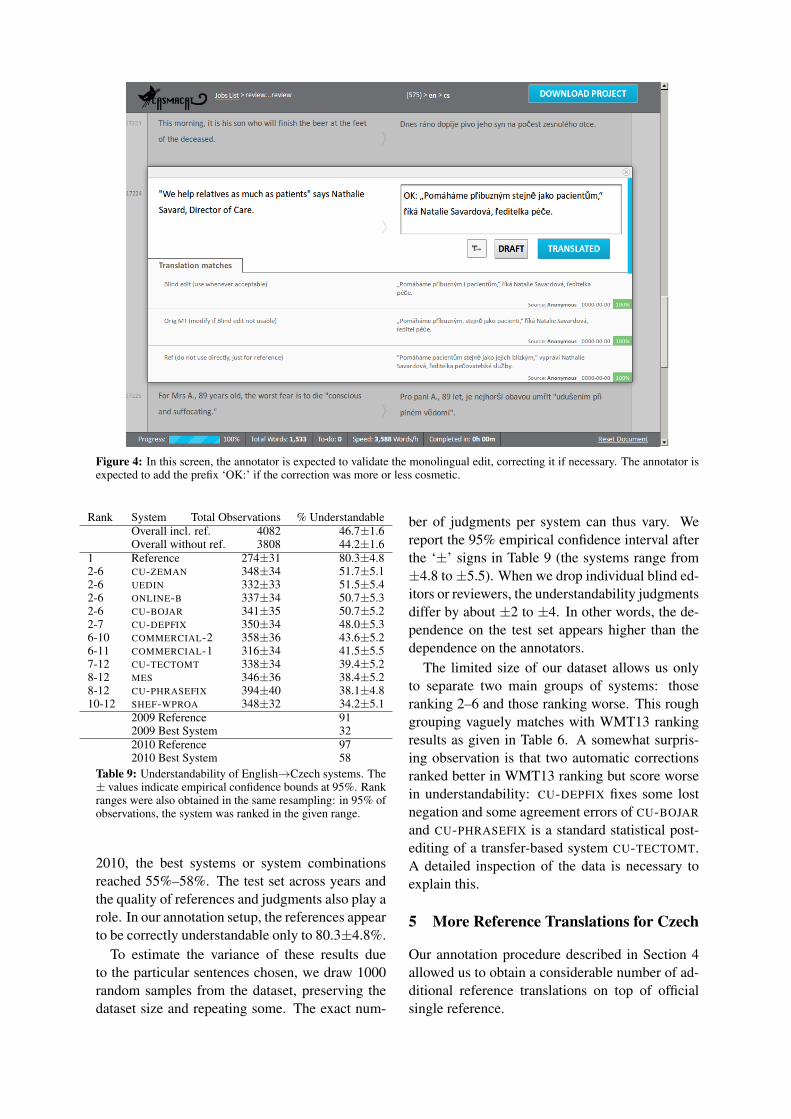
Figure 4: In this screen, the annotator is expected to validate the monolingual edit, correcting it if necessary. The annotator isexpected to add the prefix ‘OK:’ if the correction was more or less cosmetic.
Rank System Total Observations % UnderstandableOverall incl. ref. 4082 46.7±1.6Overall without ref. 3808 44.2±1.6
1 Reference 274±31 80.3±4.82-6 CU-ZEMAN 348±34 51.7±5.12-6 UEDIN 332±33 51.5±5.42-6 ONLINE-B 337±34 50.7±5.32-6 CU-BOJAR 341±35 50.7±5.22-7 CU-DEPFIX 350±34 48.0±5.36-10 COMMERCIAL-2 358±36 43.6±5.26-11 COMMERCIAL-1 316±34 41.5±5.57-12 CU-TECTOMT 338±34 39.4±5.28-12 MES 346±36 38.4±5.28-12 CU-PHRASEFIX 394±40 38.1±4.810-12 SHEF-WPROA 348±32 34.2±5.1
2009 Reference 912009 Best System 322010 Reference 972010 Best System 58
Table 9: Understandability of English→Czech systems. The± values indicate empirical confidence bounds at 95%. Rankranges were also obtained in the same resampling: in 95% ofobservations, the system was ranked in the given range.
2010, the best systems or system combinationsreached 55%–58%. The test set across years andthe quality of references and judgments also play arole. In our annotation setup, the references appearto be correctly understandable only to 80.3±4.8%.
To estimate the variance of these results dueto the particular sentences chosen, we draw 1000random samples from the dataset, preserving thedataset size and repeating some. The exact num-
ber of judgments per system can thus vary. Wereport the 95% empirical confidence interval afterthe ‘±’ signs in Table 9 (the systems range from±4.8 to±5.5). When we drop individual blind ed-itors or reviewers, the understandability judgmentsdiffer by about ±2 to ±4. In other words, the de-pendence on the test set appears higher than thedependence on the annotators.
The limited size of our dataset allows us onlyto separate two main groups of systems: thoseranking 2–6 and those ranking worse. This roughgrouping vaguely matches with WMT13 rankingresults as given in Table 6. A somewhat surpris-ing observation is that two automatic correctionsranked better in WMT13 ranking but score worsein understandability: CU-DEPFIX fixes some lostnegation and some agreement errors of CU-BOJAR
and CU-PHRASEFIX is a standard statistical post-editing of a transfer-based system CU-TECTOMT.A detailed inspection of the data is necessary toexplain this.
5 More Reference Translations for Czech
Our annotation procedure described in Section 4allowed us to obtain a considerable number of ad-ditional reference translations on top of officialsingle reference.

Refs 1 2 3 4 5 6 7 8 9 10-16Sents 233 709 174 123 60 48 40 27 25 29
Table 10: Number of source sentences with the given numberof distinct reference translations.
In total, our edits cover 1468 source sentences,i.e. about a half of the official test set size, and pro-vide 4311 unique references. On average, one sen-tence in our set has 2.94±2.17 unique referencetranslations. Table 10 provides a histogram.
It is well known that automatic MT evalua-tion methods perform better with more references,because a single one may not confirm a correctpart of MT output. This issue is more severefor morphologically rich languages like Czechwhere about 1/3 of MT output was correct but notconfirmed by the reference (Bojar et al., 2010).Advanced evaluation methods apply paraphras-ing to smooth out some of the lexical divergence(Kauchak and Barzilay, 2006; Snover et al., 2009;Denkowski and Lavie, 2010). Simpler techniquessuch as lemmatizing are effective for morphologi-cally rich languages (Tantug et al., 2008; Kos andBojar, 2009) but they will lose resolution once thesystems start performing generally well.
WMTs have taken the stance that a big enoughtest set with just a single reference should compen-sate for the lack of other references. We use ourpost-edited reference translations to check this as-sumption for BLEU and NIST as implemented inmteval-13a (international tokenization switchedon, which is not the default setting).
We run many probes, randomly picking the testset size (number of distinct sentences) and thenumber of distinct references per sentence. Notethat such test sets are somewhat artificially morediverse; in narrow domains, source sentences canrepeat and even appear verbatim in the trainingdata, and in natural test sets with multiple refer-ences, short sentences can receive several identicaltranslations.
For each probe, we measure the Spearman’srank correlation coefficient ρ of the ranks pro-posed by BLEU or NIST and the manual ranks.We use the same implementation as applied in theWMT13 Shared Metrics Task (Machacek and Bo-jar, 2013). Note that the WMT13 metrics task stilluses the WMT12 evaluation method ignoring ties,not the expected wins. As Koehn (2012) shows,the two methods do not differ much.
Overall, the correlation is strongly impacted by
Figure 5: Correlation of BLEU and WMT13 manual ranksfor English→Czech translation
Figure 6: Correlation of NIST and WMT13 manual ranksfor English→Czech translation
the particular choice of test sentences and refer-ence translations. By picking sentences randomly,similarly or equally sized test sets can reach dif-ferent correlations. Indeed, e.g. for a test set ofabout 1500 distinct sentences selected from the3000-sentence official test set (1 reference trans-lation), we obtain correlations for BLEU between0.86 and 0.94.
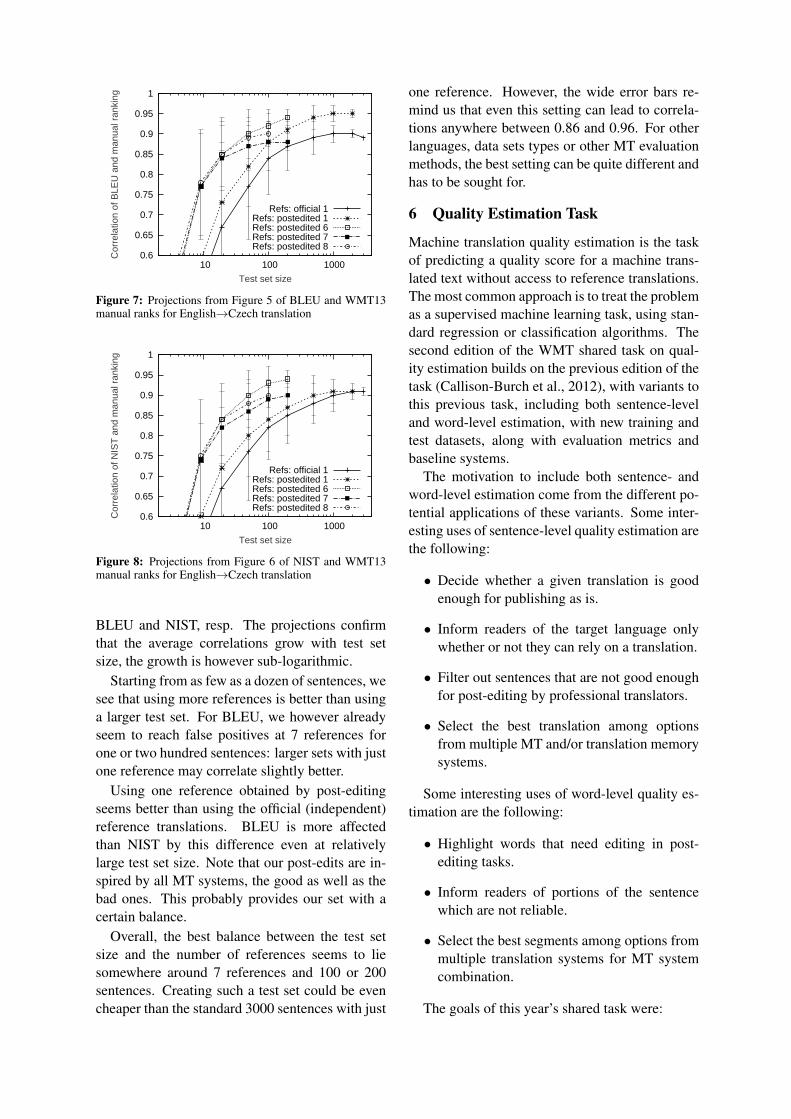
Figure 5 plots the correlations of BLEU and thesystem rankings, Figure 6 provides the same pic-ture for NIST. The upper triangular part of the plotcontains samples from our post-edited referencetranslations, the lower rectangular part containsprobes from the official test set of 3000 sentenceswith 1 reference translation.
To interpret the observations, we also calculatethe average and standard deviation of correlationsfor each cell in Figures 5 and 6. Figures 7 and8 plot the values for 1, 6, 7 and 8 references for
0.6
0.65
0.7
0.75
0.8
0.85
0.9
0.95
1
10 100 1000
Cor
rela
tion
of B
LEU
and
man
ual r
anki
ng
Test set size
Refs: official 1Refs: postedited 1Refs: postedited 6Refs: postedited 7Refs: postedited 8
Figure 7: Projections from Figure 5 of BLEU and WMT13manual ranks for English→Czech translation
0.6
0.65
0.7
0.75
0.8
0.85
0.9
0.95
1
10 100 1000
Cor
rela
tion
of N
IST
and
man
ual r
anki
ng
Test set size
Refs: official 1Refs: postedited 1Refs: postedited 6Refs: postedited 7Refs: postedited 8
Figure 8: Projections from Figure 6 of NIST and WMT13manual ranks for English→Czech translation
BLEU and NIST, resp. The projections confirmthat the average correlations grow with test setsize, the growth is however sub-logarithmic.
Starting from as few as a dozen of sentences, wesee that using more references is better than usinga larger test set. For BLEU, we however alreadyseem to reach false positives at 7 references forone or two hundred sentences: larger sets with justone reference may correlate slightly better.
Using one reference obtained by post-editingseems better than using the official (independent)reference translations. BLEU is more affectedthan NIST by this difference even at relativelylarge test set size. Note that our post-edits are in-spired by all MT systems, the good as well as thebad ones. This probably provides our set with acertain balance.
Overall, the best balance between the test setsize and the number of references seems to liesomewhere around 7 references and 100 or 200sentences. Creating such a test set could be evencheaper than the standard 3000 sentences with just
one reference. However, the wide error bars re-mind us that even this setting can lead to correla-tions anywhere between 0.86 and 0.96. For otherlanguages, data sets types or other MT evaluationmethods, the best setting can be quite different andhas to be sought for.
6 Quality Estimation Task
Machine translation quality estimation is the taskof predicting a quality score for a machine trans-lated text without access to reference translations.The most common approach is to treat the problemas a supervised machine learning task, using stan-dard regression or classification algorithms. Thesecond edition of the WMT shared task on qual-ity estimation builds on the previous edition of thetask (Callison-Burch et al., 2012), with variants tothis previous task, including both sentence-leveland word-level estimation, with new training andtest datasets, along with evaluation metrics andbaseline systems.
The motivation to include both sentence- andword-level estimation come from the different po-tential applications of these variants. Some inter-esting uses of sentence-level quality estimation arethe following:
• Decide whether a given translation is goodenough for publishing as is.
• Inform readers of the target language onlywhether or not they can rely on a translation.
• Filter out sentences that are not good enoughfor post-editing by professional translators.
• Select the best translation among optionsfrom multiple MT and/or translation memorysystems.
Some interesting uses of word-level quality es-timation are the following:
• Highlight words that need editing in post-editing tasks.
• Inform readers of portions of the sentencewhich are not reliable.
• Select the best segments among options frommultiple translation systems for MT systemcombination.
The goals of this year’s shared task were:

• To explore various granularity levels for thetask (sentence-level and word-level).
• To explore the prediction of more objectivescores such as edit distance and post-editingtime.
• To explore the use of quality estimation tech-niques to replace reference-based MT evalua-tion metrics in the task of ranking alternativetranslations generated by different MT sys-tems.
• To identify new and effective quality indica-tors (features) for all variants of the qualityestimation task.
• To identify effective machine learning tech-niques for all variants of the quality estima-tion task.
• To establish the state of the art performancein the field.
Four subtasks were proposed, as we discuss inSections 6.1 and 6.2. Each subtask provides spe-cific datasets, annotated for quality according tothe subtask (Section 6.3), and evaluates the systemsubmissions using specific metrics (Section 6.6).When available, external resources (e.g. SMTtraining corpus) and translation engine-related re-sources were given to participants (Section 6.4),who could also use any additional external re-sources (no distinction between open and closetracks is made). Participants were also providedwith a software package to extract quality esti-mation features and perform model learning (Sec-tion 6.5), with a suggested list of baseline featuresand learning method (Section 6.7). Participantscould submit up to two systems for each subtask.
6.1 Sentence-level Quality EstimationTask 1.1 Predicting Post-editing Distance Thistask is similar to the quality estimation task inWMT12, but with one important difference in thescoring variant: instead of using the post-editingeffort scores in the [1-5] range, we use HTER(Snover et al., 2006) as quality score. This scoreis to be interpreted as the minimum edit distancebetween the machine translation and its manuallypost-edited version, and its range is [0, 1] (0 whenno edit needs to be made, and 1 when all wordsneed to be edited). Two variants of the resultscould be submitted in the shared task:
• Scoring: A quality score for each sentencetranslation in [0,1], to be interpreted as anHTER score; lower scores mean better trans-lations.
• Ranking: A ranking of sentence translationsfor all source test sentences from best toworst. For this variant, it does not matter howthe ranking is produced (from HTER predic-tions, likert predictions, or even without ma-chine learning). The reference ranking is de-fined based on the true HTER scores.
Task 1.2 Selecting Best Translation This taskconsists in ranking up to five alternative transla-tions for the same source sentence produced bymultiple MT systems. We use essentially the samedata provided to participants of previous yearsWMT’s evaluation metrics task – where MT eval-uation metrics are assessed according to how wellthey correlate with human rankings. However, ref-erence translations produced by humans are not beused in this task.
Task 1.3 Predicting Post-editing Time For thistask systems are required to produce, for eachtranslation, the expected time (in seconds) itwould take a translator to post-edit such an MToutput. The main application for predictions ofthis type is in computer-aided translation wherethe predicted time can be used to select among dif-ferent hypotheses or even to omit any MT outputin cases where no good suggestion is available.
6.2 Word-level Quality EstimationBased on the data of Task 1.3, we define Task 2, aword-level annotation task for which participantsare asked to produce a label for each token thatindicates whether the word should be changed bya post-editor or kept in the final translation. Weconsider the following two sets of labels for pre-diction:
• Binary classification: a keep/change label,the latter meaning that the token should becorrected in the post-editing process.
• Multi-class classification: a label specifyingthe edit action that should be performed onthe token (keep as is, delete, or substitute).
6.3 DatasetsTask 1.1 Predicting post-editing distance Forthe training of models, we provided the WMT12

quality estimation dataset: 2,254 English-Spanish news sentences extracted from previousWMT translation task English-Spanish test sets(WMT09, WMT10, and WMT12). These weretranslated by a phrase-based SMT Moses systemtrained on Europarl and News Commentaries cor-pora as provided by WMT, along with their sourcesentences, reference translations, post-editedtranslations, and HTER scores. We used TERp(default settings: tokenised, case insensitive,etc., but capped to 1)10 to compute the HTERscores. Likert scores in [1,5] were also provided,as participants may choose to use them for theranking variant.
As test data, we use a subset of the WMT13English-Spanish news test set with 500 sentences,whose translations were produced by the sameSMT system used for the training set. To com-pute the true HTER labels, the translations werepost-edited under the same conditions as those onthe training set. As in any blind shared task, theHTER scores were solely used to evaluate the sub-missions, and were only released to participantsafter they submitted their systems.
A few variations of the training and test datawere provided, including a version with cases re-stored and a version detokenized. In addition,we provided a number of engine-internal informa-tion from Moses for glass-box feature extraction,such as phrase and word alignments, model scores,word graph, n-best lists and information from thedecoder’s search graph.
Task 1.2 Selecting best translation As trainingdata, we provided a large set of up to five alter-native machine translations produced by differentMT systems for each source sentence and rankedfor quality by humans. This was the outcome ofthe manual evaluation of the translation task fromWMT09-WMT12. It includes two language pairs:German-English and English-Spanish, with 7,098and 4,592 source sentences and up to five rankedtranslations, totalling 32,922 and 22,447 transla-tions, respectively.
As test data, a set of up to five alternative ma-chine translations per source sentence from theWMT08 test sets was provided, with 365 (1,810)and 264 (1,315) source sentences (translations)for German-English and English-Spanish, respec-tively. We note that there was some overlap be-tween the MT systems used in the training data
10http://www.umiacs.umd.edu/˜snover/terp/
and test datasets, but not all systems were thesame, as different systems participate in WMTover the years.
Task 1.3 and Task 2 Predicting post-editingtime and word-level edits For Tasks 1.3 and 2we provides a new dataset consisting of 22 Englishnews articles which were translated into Span-ish using Moses and post-edited during a CAS-MACAT11 field trial. Of these, 15 documents havebeen processed repeatedly by at least 2 out of 5translators, resulting in a total of 1,087 segments.For each segment we provided:
• English source and Spanish translation.
• Spanish MT output which was used as basisfor post-editing.
• Document and translator ID.
• Position of the segment within the document.
The metadata about translator and document wasmade available as we expect that translator perfor-mance and normalisation over document complex-ity can be helpful when predicting the time spendon a given segment.
For the training portion of the data we also pro-vided:
• Time to post-edit in seconds (Task 1.3).
• Binary (Keep, Change) and multiclass (Keep,Substitute, Delete) labels on word level alongwith explicit tokenization (Task 2).
The labels in Task 2 are derived by comput-ing WER between the original machine translationand its post-edited version.
6.4 ResourcesFor all tasks, we provided resources to extractquality estimation features when these were avail-able:
• The SMT training corpus (WMT News andEuroparl): source and target sides of the cor-pus used to train the SMT engines for Tasks1.1, 1.3, and 2, and truecase models gener-ated from these. These corpora can also beused for Task 1.2, but we note that some ofthe MT systems used in the datasets of thistask were not statistical or did not use (only)the training corpus provided by WMT.
11http://casmacat.eu/

• Language models: n-gram language modelsof source and target languages generated us-ing the SMT training corpora and standardtoolkits such as SRILM Stolcke (2002), anda language model of POS tags for the targetlanguage. We also provided unigram, bigramand trigram counts.
• IBM Model 1 lexical tables generated byGIZA++ using the SMT training corpora.
• Phrase tables with word alignment informa-tion generated by scripts provided by Mosesfrom the parallel corpora.
• For Tasks 1.1, 1.3 and 2, the Moses config-uration file used for decoding or the code tore-run the entire Moses system.
• For Task 1.1, both English and Spanish re-sources for a number of advanced featuressuch as pre-generated PCFG parsing models,topic models, global lexicon models and mu-tual information trigger models.
We refer the reader to the QUEST website12 fora detailed list of resources provided for each task.
6.5 QUEST Framework
QUEST (Specia et al., 2013) is an open sourceframework for quality estimation which provides awide variety of feature extractors from source andtranslation texts and external resources and tools.These range from simple, language-independentfeatures, to advanced, linguistically motivated fea-tures. They include features that rely on informa-tion from the MT system that generated the trans-lations (glass-box features), and features that areoblivious to the way translations were produced(black-box features).
QUEST also integrates a well-known machinelearning toolkit, scikit-learn,13 and other algo-rithms that are known to perform well on this task(e.g. Gaussian Processes), providing a simple andeffective way of experimenting with techniquesfor feature selection and model building, as wellas parameter optimisation through grid search.
From QUEST, a subset of 17 features and anSVM regression implementation were used asbaseline for Tasks 1.1, 1.2 and 1.3. The softwarewas made available to all participants.
12http://www.quest.dcs.shef.ac.uk/13http://scikit-learn.org/
6.6 Evaluation Metrics
Task 1.1 Predicting post-editing distanceEvaluation is performed against the HTER and/orranking of translations using the same metrics asin WMT12. For the scoring variant of the task,we use two standard metrics for regression tasks:Mean Absolute Error (MAE) as a primary metric,and Root of Mean Squared Error (RMSE) as asecondary metric. To improve readability, wereport these error numbers by first mapping theHTER values to the [0, 100] interval, to be readas percentage-points of the HTER metric. For agiven test set S with entries si, 1 ≤ i ≤ |S|, wedenote by H(si) the proposed score for entry si(hypothesis), and by V (si) the reference value forentry si (gold-standard value):
MAE =
∑Ni=1 |H(si)− V (si)|
|S|
RMSE =
√∑Ni=1(H(si)− V (si))2
|S|
Both these metrics are non-parametric, auto-matic and deterministic (and therefore consistent),and extrinsically interpretable. For instance, aMAE value of 10 means that, on average, the ab-solute difference between the hypothesized scoreand the reference score value is 10 percentagepoints (i.e., 0.10 difference in HTER scores). Theinterpretation of RMSE is similar, with the differ-ence that RMSE penalises larger errors more (viathe square function).
For the ranking variant of the task, we use theDeltaAvg metric proposed in the 2012 edition ofthe task (Callison-Burch et al., 2012) as our mainmetric. This metric assumes that each referencetest instance has an extrinsic number associatedwith it that represents its ranking with respect tothe other test instances. For completeness, wepresent here again the definition of DeltaAvg.
The goal of the DeltaAvg metric is to measurehow valuable a proposed ranking (which we call ahypothesis ranking) is, according to the true rank-ing values associated with the test instances. Wefirst define a parametrised version of this metric,called DeltaAvg[n]. The following notations areused: for a given entry sentence s, V (s) representsthe function that associates an extrinsic value tothat entry; we extend this notation to a set S, withV (S) representing the average of all V (s), s ∈ S.
Intuitively, V (S) is a quantitative measure of the“quality” of the set S, as induced by the extrinsicvalues associated with the entries in S. For a setof ranked entries S and a parameter n, we denoteby S1 the first quantile of set S (the highest-rankedentries), S2 the second quantile, and so on, for nquantiles of equal sizes.14 We also use the nota-tion Si,j =
⋃jk=i Sk. Using these notations, we
define:
DeltaAvgV [n] =∑n−1
k=1 V (S1,k)
n− 1− V (S)
When the valuation function V is clear from thecontext, we write DeltaAvg[n] for DeltaAvgV [n].The parameter n represents the number of quan-tiles we want to split the set S into. For instance,n = 2 gives DeltaAvg[2] = V (S1)−V (S), hence itmeasures the difference between the quality of thetop quantile (top half) S1 and the overall quality(represented by V (S)). For n = 3, DeltaAvg[3] =(V (S1)+V (S1,2)/2−V (S) = ((V (S1)−V (S))+(V (S1,2−V (S)))/2, hence it measures an averagedifference across two cases: between the quality ofthe top quantile (top third) and the overall quality,and between the quality of the top two quantiles(S1 ∪ S2, top two-thirds) and the overall quality.In general, DeltaAvg[n] measures an average dif-ference in quality across n − 1 cases, with eachcase measuring the impact in quality of adding anadditional quantile, from top to bottom. Finally,we define:
DeltaAvgV =
∑Nn=2 DeltaAvgV [n]
N − 1
where N = |S|/2. As before, we write DeltaAvgfor DeltaAvgV when the valuation function V isclear from the context. The DeltaAvg metric is anaverage across all DeltaAvg[n] values, for thosen values for which the resulting quantiles have atleast 2 entries (no singleton quantiles).
We present results for DeltaAvg using as valu-ation function V the HTER scores, as defined inSection 6.3. We also use Spearman’s rank correla-tion coefficient ρ as a secondary metric.
Task 1.2 Selecting best translation The perfor-mance on the task of selecting the best transla-tion from a pool of translation candidates is mea-
14If the size |S| is not divisible by n, then the last quantileSn is assumed to contain the rest of the entries.
sured by comparing proposed (hypothesis) rank-ings against human-produced rankings. The met-ric used is Kendall’s τ rank correlation coefficient,computed as follows:
τ =|concordant pairs| − |discordant pairs|
|total pairs|
where a concordant pair is a pair of two transla-tions for the same source segment in which theranking order proposed by a human annotator andthe ranking order of the hypothesis agree; in a dis-cordant pair, they disagree. The possible values ofτ range between 1 (where all pairs are concordant)and −1 (where all pairs are discordant). Thus asystem with ranking predictions having a higherτ value makes predictions that are more similarto human judgements than a system with rankingpredictions having a lower τ . Note that, in general,being able to predict rankings with an accuracyof τ = −1 is as difficult as predicting rankingswith an accuracy of τ = 1, whereas a completelyrandom ranking would have an expected value ofτ = 0. The range is therefore said to be symmet-ric.
However, there are two distinct ways of mea-suring rank correlation using Kendall’s τ , relatedto the way ties are treated. They greatly affect howKendall’s τ numbers are to be interpreted, and es-pecially the symmetry property. We explain thedifference in detail in what follows.
Kendall’s τ with ties penalised If the goal isto measure to what extent the difference in qual-ity visible to a human annotator has been capturedby an automatically produced hypothesis (recall-oriented view), then proposing a tie between t1and t2 (t1-equal-to-t2) when the pair was judged(in the reference) as t1-better-than-t2 is treated asa failure-to-recall. In other words, it is as bad asproposing t1-worse-than-t2. Henceforth, we callthis recall-oriented measure “Kendall’s τ with tiespenalised”. This metric has the following proper-ties:
• it is completely fair when comparing differ-ent methods to produce ranking hypotheses,because the denominator (number of totalpairs) is the same (it is the number of non-tied pairs under the human judgements).
• it is non-symmetric, in the sense that a valueof τ = −1 is not as difficult to obtain as τ =

1 (simply proposing only ties gets a τ = −1);hence, the sign of the τ value matters.
• the expected value of a completely randomranking is not necessarily τ = 0, but ratherdepends on the number of ties in the refer-ence rankings (i.e., it is test set dependent).
Kendall’s τ with ties ignored If the goalis to measure to what extent the difference inquality signalled by an automatically producedhypothesis is reflected in the human annota-tion (precision-oriented view), then proposing t1-equal-to-t2 when the pair was judged differentlyin the reference does no harm the metric.
Henceforth, we call this precision-orientedmeasure ”Kendall’s τ with ties ignored”. Thismetric has the following properties:
• it is not completely fair when comparing dif-ferent methods to produce ranking hypothe-ses, because the denominator (number of to-tal pairs) may not be the same (it is the num-ber of non-tied pairs under each system’s pro-posal).
• it is symmetric, in the sense that a value ofτ = −1 is as difficult to obtain as τ = 1;hence, the sign of the τ value may not mat-ter. 15
• the expected value of a completely randomranking is τ = 0 (test-set independent).
The first property is the most worrisome fromthe perspective of reporting the results of a sharedtask, because a system may fare very well on thismetric simply because it choses not to commit(proposes ties) most of the time. Therefore, togive a better understanding of the systems’ perfor-mance, for Kendall’s τ with ties ignored we alsoprovide the number of non-ties proposed by eachsystem.
Task 1.3 Predicting post-editing time Submis-sions are evaluated in terms of Mean Average Er-ror (MAE) against the actual time spent by post-editors (in seconds). By using a linear error mea-sure we limit the influence of outliers: sentencesthat took very long to edit or where the measure-ment taken is questionable.
15In real life applications this distinction matters. Evenif, from a computational perspective, it is as hard to get τclose to−1 as it is to get it close to 1, knowing the sign is thedifference between selecting the best or the worse translation.
To further analyse the influence of extreme val-ues, we also compute Spearman’s rank correlationρ coefficient which does not depend on the abso-lute values of the predictions.
We also give RMSE and Pearson’s correlationcoefficient r for reference.
Task 2 Predicting word-level scores The word-level task is primarily evaluated by macro-averaged F-measure. Because the class distribu-tion is skewed – in the test data about one thirdof the tokens are marked as correct – we computeprecision and recall and F1 for each class individ-ually. Consider the following confusion matrix forthe two classes Keep and Change:
predicted(K)eep (C)hange
expected(K)eep 10 20(C)hange 30 40
For the given example we derive true-positive(tp), true-negative (tn), false-positive (fp), andfalse-negative (fn) counts:
tpK = 10 fpK = 30 fnK = 20tpC = 40 fpC = 20 fnC = 30
precisionK =tpK
tpK + fpK= 10/40
recallK =tpK
tpK + fnK= 10/30
F1,K =2 · precisionK · recallKprecisionK +recallK
A single cumulative statistic can be computedby averaging the resulting F-measures (macro av-eraging) or by micro averaging in which case pre-cision and recall are first computed by accumulat-ing the relevant values for all classes (Ozgur et al.,2005), e.g.
precision =tpK + tpC
(tpK + fpK) + (tpC + fpC)
The latter gives equal weight to each exam-ple and is therefore dominated by performance onthe largest class while macro-averaged F-measuregives equal weight to each class.
The same setup is used to evaluate the perfor-mance in the multiclass setting. Please note thathere the test data only contains 4% examples forclass (D)elete.
ID Participating teamCMU Carnegie Mellon University, USA (Hildebrand and Vogel, 2013)
CNGL Centre for Next Generation Localization, Ireland (Bicici, 2013b)DCU Dublin City University, Ireland (Almaghout and Specia, 2013)
DCU-SYMC Dublin City University & Symantec, Ireland (Rubino et al., 2013b)DFKI German Research Centre for Artificial Intelligence, Germany (Avramidis and
Popovic, 2013)FBK-UEdin Fondazione Bruno Kessler, Italy & University of Edinburgh, UK (Camargo de
Souza et al., 2013)LIG Laboratoire d’Informatique Grenoble, France (Luong et al., 2013)
LIMSI Laboratoire d’Informatique pour la Mecanique et les Sciences de l’Ingenieur,France (Singh et al., 2013)
LORIA Lorraine Laboratory of Research in Computer Science and its Applications,France (Langlois and Smaili, 2013)
SHEF University of Sheffield, UK (Beck et al., 2013)TCD-CNGL Trinity College Dublin & CNGL, Ireland (Moreau and Rubino, 2013)
TCD-DCU-CNGL Trinity College Dublin, Dublin City University & CNGL, Ireland (Moreau andRubino, 2013)
UMAC University of Macau, China (Han et al., 2013)UPC Universitat Politecnica de Catalunya, Spain (Formiga et al., 2013b)
Table 11: Participants in the WMT13 Quality Estimation shared task.
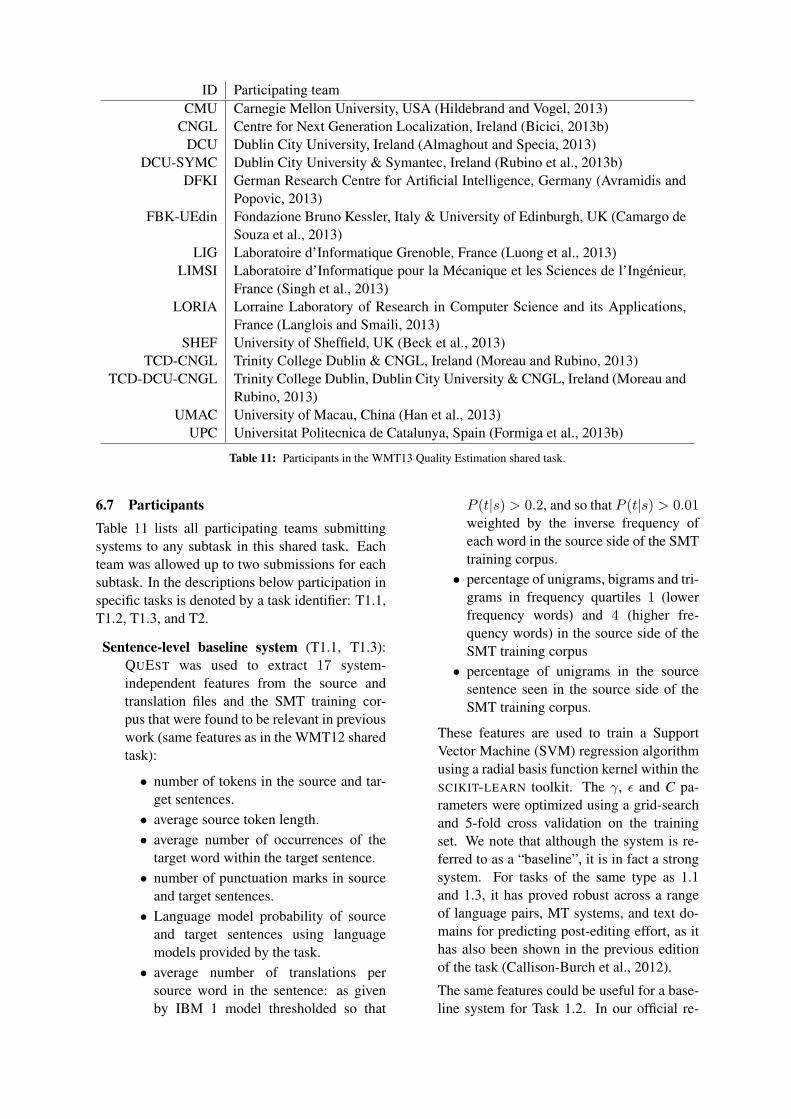
6.7 ParticipantsTable 11 lists all participating teams submittingsystems to any subtask in this shared task. Eachteam was allowed up to two submissions for eachsubtask. In the descriptions below participation inspecific tasks is denoted by a task identifier: T1.1,T1.2, T1.3, and T2.
Sentence-level baseline system (T1.1, T1.3):QUEST was used to extract 17 system-independent features from the source andtranslation files and the SMT training cor-pus that were found to be relevant in previouswork (same features as in the WMT12 sharedtask):
• number of tokens in the source and tar-get sentences.• average source token length.• average number of occurrences of the
target word within the target sentence.• number of punctuation marks in source
and target sentences.• Language model probability of source
and target sentences using languagemodels provided by the task.• average number of translations per
source word in the sentence: as givenby IBM 1 model thresholded so that
P (t|s) > 0.2, and so that P (t|s) > 0.01weighted by the inverse frequency ofeach word in the source side of the SMTtraining corpus.• percentage of unigrams, bigrams and tri-
grams in frequency quartiles 1 (lowerfrequency words) and 4 (higher fre-quency words) in the source side of theSMT training corpus• percentage of unigrams in the source
sentence seen in the source side of theSMT training corpus.
These features are used to train a SupportVector Machine (SVM) regression algorithmusing a radial basis function kernel within theSCIKIT-LEARN toolkit. The γ, ε and C pa-rameters were optimized using a grid-searchand 5-fold cross validation on the trainingset. We note that although the system is re-ferred to as a “baseline”, it is in fact a strongsystem. For tasks of the same type as 1.1and 1.3, it has proved robust across a rangeof language pairs, MT systems, and text do-mains for predicting post-editing effort, as ithas also been shown in the previous editionof the task (Callison-Burch et al., 2012).
The same features could be useful for a base-line system for Task 1.2. In our official re-

sults, however, the baseline for Task 1.2 issimpler than that: it proposes random ranksfor each pair of alternative translations for agiven source sentence, as we will discuss inSection 6.8.
CMU (T1.1, T1.2, T1.3): The CMU qualityestimation system was trained on featuresbased on language models, the MT sys-tem’s distortion model and phrase table fea-tures, statistical word lexica, several sentencelength statistics, source language word andbi-gram frequency statistics, n-best list agree-ment and diversity, source language parse,source-target word alignment and a depen-dency parse based cohesion penalty. Thesefeatures were extracted using GIZA++, aforced alignment algorithm and the Stanfordparser (de Marneffe et al., 2006). The pre-diction models were trained using four clas-sifiers in the Weka toolkit (Hall et al., 2009):linear regression, M5P trees, multi layer per-ceptron and SVM regression. In addition tomain system submission, a classic n-best listre-ranking approach was used for Task 1.2.
CNGL (T1.1, T1.2, T1.3, T2): CNGL systemsare based on referential translation machines(RTM) (Bicici and van Genabith, 2013), par-allel feature decay algorithms (FDA) (Bicici,2013a), and machine translation performancepredictor (MTPP) (Bicici et al., 2013), allof which allow to obtain language and MTsystem-independent predictions. For eachtask, RTM models were developed using theparallel corpora and the language model cor-pora distributed by the WMT13 translationtask and the language model corpora pro-vided by LDC for English and Spanish.
The sentence-level features are described inMTPP (Bicici et al., 2013); they includemonolingual or bilingual features using n-grams defined over text or common coverlink (CCL) (Seginer, 2007) structures as thebasic units of information over which sim-ilarity calculations are made. RTMs use308 features about coverage and diversity,IBM1, and sentence translation performance,retrieval closeness and minimum Bayes re-trieval risk, distributional similarity and en-tropy, IBM2 alignment, character n-grams,and sentence readability. The learning mod-
els are Support Vector Machines (SVR) andSVR with partial least squares (SVRPLS).
The word-level features include CCL links,word length, location, prefix, suffix, form,context, and alignment, totalling 511K fea-tures for binary classification, and 637K formulticlass classification. Generalised lin-ear models (GLM) (Collins, 2002) and GLMwith dynamic learning (GLMd) were used.
DCU (T1.2): The main German-English submis-sion uses six Combinatory Categorial Gram-mar (CCG) features: CCG supertag lan-guage model perplexity and log probability,the number of maximal CCG constituents inthe translation output which are the highest-probability minimum number of CCG con-stituents that span the translation output, thepercentage of CCG argument mismatches be-tween each subsequent CCG supertags, thepercentage of CCG argument mismatches be-tween each subsequent CCG maximal cate-gories and the minimum number of phrasesdetected in the translation output. A secondsubmission uses the aforementioned CCGfeatures combined with 80 features fromQUEST as described in (Specia, 2011). Forthe CCG features, the C&C parser was usedto parse the translation output. Moses wasused to build the phrase table from the SMTtraining corpus with maximum phrase lengthset to 7. The language model of supertagswas built using the SRILM toolkit. As learn-ing algorithm, Logistic Regression as pro-vided by the SCIKIT-LEARN toolkit was used.The training data was prepared by convertingeach ranking of translation outputs to a setof pairwise comparisons according to the ap-proach proposed by Avramidis et al. (2011).The rankings were generated back from pair-wise comparisons predicted by the model.
DCU-SYMC (T1.1): The DCU-Symantec teamemployed a wide set of features which in-cluded language model, n-gram counts andword-alignment features as well as syntac-tic features, topic model features and pseudo-reference features. The main learning algo-rithm was SVR, but regression tree learningwas used to perform feature selection, re-ducing the initial set of 442 features to 96features (DCU-Symantec alltypes) and 134

(DCU-Symantec combine). Two methodsfor feature selection were used: a best-firstsearch in the feature space using regressiontrees to evaluate the subsets, and reading bi-narised features directly from the nodes ofpruned regression trees.
The following NLP tools were used in featureextraction: the Brown English Wall-Street-Journal-trained statistical parser (Charniakand Johnson, 2005), a Lexical FunctionalGrammar parser (XLE), together with ahand-crafted Lexical Functional Grammar,the English ParGram grammar (Kaplan et al.,2004), and the TreeTagger part-of-speechtagger (Schmidt, 1994) with off-the-shelfpublicly available pre-trained tagging mod-els for English and Spanish. For pseudo-reference features, the Bing, Moses and Sys-tran translation systems were used. The Mal-let toolkit (McCallum, 2002) was used tobuild the topic models and features based ona grammar checker were extracted with Lan-guageTool.16
DFKI (T1.2, T1.3): DFKI’s submission for Task1.2 was based on decomposing rankings intopairs (Avramidis, 2012), where the best sys-tem for each pair was predicted with Lo-gistic Regression (LogReg). For German-English, LogReg was trained with StepwiseFeature Selection (Hosmer, 1989) on twofeature sets: Feature Set 24 includes ba-sic counts augmented with PCFG parsingfeatures (number of VPs, alternative parses,parse probability) on both source and tar-get sentences (Avramidis et al., 2011), andpseudo-reference METEOR score; the mostsuccessful set, Feature Set 33 combines those24 features with the 17 baseline features. ForEnglish-Spanish, LogReg was used with L2Regularisation (Lin et al., 2007) and two fea-ture sets were devised after scoring featureswith ReliefF (Kononenko, 1994) and Infor-mation Gain (Hunt et al., 1966). Feature Set431 combines 30 features with highest abso-lute Relief-F and Information Gain (15 fromeach). features with the highest
Task 1.3 was modelled using feature setsselected after Relief-F scoring of externalblack-box and glass-box features extracted
16http://www.languagetool.org/
from the SMT decoding process. The mostsuccessful submission (linear6) was trainedwith Linear Regression including the 17 fea-tures with highest positive Relief-F. Mostprominent features include the alternativepossible parses of the source and target sen-tence, the positions of the phrases with thelowest and highest probability and futurecost estimate in the translation, the counts ofphrases in the decoding graph whose prob-ability or whether the future cost estimateis higher/lower than their standard deviation,counts of verbs and determiners, etc. Thesecond submission (pls8) was trained withPartial Least Squares regression (Stone andBrooks, 1990) including more glass-box fea-tures.
FBK-Uedin (T1.1, T1.3):
The submissions explored features built onMT engine resources including automaticword alignment, n-best candidate translationlists, back-translations and word posteriorprobabilities. Information about word align-ments is used to extract quantitative (amountand distribution of the alignments) and qual-itative (importance of the aligned terms) fea-tures under the assumption that alignmentinformation can help tasks where sentence-level semantic relations need to be identified(Souza et al., 2013). Three similar English-Spanish systems are built and used to providepseudo-references (Soricut et al., 2012) andback-translations, from which automatic MTevaluation metrics could be computed andused as features.
All features were computed over a concatena-tion of several publicly available parallel cor-pora for the English-Spanish language pairsuch as Europarl, News Commentary, andMultiUN. The models were developed usingsupervised learning algorithms: SVMs (withfeature selection step prior to model learning)and extremely randomized trees.
LIG (T2): The LIG systems are designed todeal with both binary and multiclass variantsof the word level task. They integrate sev-eral features including: system-based (graphtopology, language model, alignment con-text, etc.), lexical (Part-of-Speech tags), syn-tactic (constituent label, distance to the con-

stituent tree root) and semantic (target andsource polysemy count). Besides the exist-ing components of the SMT system, featureextraction requires further external tools andresources, such as: TreeTagger (for POS tag-ging), Bekerley Parser trained with AnCoratreebank (for generating constituent trees inSpanish), WordNet and BabelNet (for pol-ysemy count), Google Translate. The fea-ture set is then combined and trained usinga Conditional Random Fields (CRF) learn-ing method. During the labelling phase, theoptimal threshold is tuned using a small de-velopment set split from the original trainingset. In order to retain the most informativefeatures and eliminate the redundant ones, aSequential Backward Selection algorithm isemployed over the all-feature systems. Withthe binary classifier, the Boosting techniqueis applied to allow a number of sub featuresets to complement each other, resulting inthe “stronger” combined system.
LIMSI (T1.1, T1.3): The two tasks were treatedas regression problems using a simple elas-tic regression, a linear model trained with L1
and L2 regularisers. Regarding features, thesubmissions mainly aimed at evaluating theusefulness for quality estimation of n-gramposterior probabilities (Gispert et al., 2013)that quantify the probability for a given n-gram to be part of the system output. Theircomputation relies on all the hypotheses con-sidered by a SMT system during decoding:intuitively, the more hypotheses a n-gram ap-pears in, the more confident the system isthat this n-gram is part of the correct trans-lation, and the higher its posterior probabil-ity is. The feature set contains 395 other fea-tures that differs, in two ways, from the tra-ditional features used in quality estimation.First, it includes several features based onlarge span continuous space language mod-els (Le et al., 2011) that have already provedtheir efficiency both for the translation taskand the quality estimation task. Second, eachfeature was expanded into two “normalizedforms” in which their value was divided ei-ther by the source length or the target lengthand, when relevant, into a “ratio form” inwhich the feature value computed on the tar-get sentence is divided by its value computed
in the source sentence.
LORIA (T1.1): The system uses the 17 baselinefeatures, plus several numerical and booleanfeatures computed from the source and targetsentences (Langlois et al., 2012). These arebased on language model information (per-plexity, level of back-off, intra-lingual trig-gers), translation table (IBM1 table, inter-lingual triggers). For language models, for-ward and backward models are built. Eachfeature gives a score to each word in the sen-tence, and the score of the sentence is the av-erage of word scores. For several features,the score of a word depends on the score of itsneighbours. This leads to 66 features. Sup-port Vector Machines are used to learn a re-gression model. In training is done in a multi-stage procedure aimed at increasing the sizeof the training corpus. Initially, the train-ing corpus with machine translated sentencesprovided by the task is used to train an SVMmodel. Then this model is applied to the post-edited and reference sentences (also providedas part of the task). These are added to thequality estimation training corpus using as la-bels the SVM predictions. An algorithm totune the predicted scores on a developmentcorpus is used.
SHEF (T1.1, T1.3): These submissions useGaussian Processes, a non-parametric prob-abilistic learning framework for regression,along with two techniques to improve predic-tion performance and minimise the amountof resources needed for the problem: featureselection based on optimised hyperparame-ters and active learning to reduce the trainingset size (and therefore the annotation effort).The initial set features contains all black boxand glass box features available within theQUEST framework (Specia et al., 2013) forthe dataset at hand (160 in total for Task 1.1,and 80 for Task 1.3). The query selectionstrategy for active learning is based on theinformativeness of the instances using Infor-mation Density, a measure that leverages be-tween the variance among instances and howdense the region (in the feature space) wherethe instance is located is. To perform fea-ture selection, following (Shah et al., 2013)features are ranked by the Gaussian Process

algorithm according to their learned lengthscales, which can be interpreted as the rel-evance of such feature for the model. Thisinformation was used for feature selectionby discarding the lowest ranked (least use-ful) ones. based on empirical results foundin (Shah et al., 2013), the top 25 features forboth models were selected and used to retrainthe same regression algorithm.
UPC (T1.2): The methodology used a broad setof features, mainly available through the lastversion of the Asiya toolkit for MT evalua-tion (Gonzalez et al., 2012)17. Concretely,86 features were derived for the German-to-English and 97 features for the English-to-Spanish tasks. These features cover differ-ent approaches and include standard qual-ity estimation features, as provided by theabove mentioned Asiya and QUEST toolk-its, but also a variety of features based onpseudo-references, explicit semantic analy-sis and specialised language models trainedon the parallel and monolingual corpora pro-vided by the WMT Translation Task.
The system selection task is approached bymeans of pairwise ranking decisions. It usesRandom Forest classifiers with ties, expand-ing the work of 402013cFormiga et al.), fromwhich a full ranking can be derived and thebest system per sentence is identified. Oncethe classes are given by the Random Forest,one can build a graph by means of the adja-cency matrix of the pairwise decision. The fi-nal ranking is assigned through a dominancescheme similar to Pighin et al. (2012).
An important remark of the methodology isthe feature selection process, since it was no-ticed that the learner was sensitive to the fea-tures used. Selecting the appropriate set offeatures was crucial to achieve a good per-formance. The best feature combination wascomposed of: i) a baseline quality estimationfeature set (Asiya or Quest) but not both ofthem, ii) Length Model, iii) Pseudo-referencealigned based features, and iv) adapted lan-guage models. However, within the de-entask, substituting Length Model and AlignedPseudo-references by the features based on
17http://asiya.lsi.upc.edu/
Semantic Roles could bring marginally bet-ter accuracy.
TCD-CNGL (T1.1) and TCD-DCU-CNGL(T1.3): The system is based on featureswhich are commonly used for style classifi-cation (e.g. author identification). The as-sumption is that low/high quality translationscan be characterised by some patterns whichare frequent and/or differ significantly fromthe opposite category. Such features are in-tended to focus on striking patterns ratherthan to capture the global quality in a sen-tence, but they are used in conjunction withclassical features for quality estimation (lan-guage modelling, etc.). This requires twosteps in the training process: first the refer-ence categories against which sentences willbe compared are built, then the standard qual-ity estimation model training stage is per-formed. Both datasets (Tasks 1.1 and 1.3)were used for both tasks. Since the numberof features can be very high (up to 65,000),a combination of various heuristics for se-lecting features was used before the trainingstage (the submitted systems were trained us-ing SVM with RBF kernels).
UMAC (T1.1, T1.2, T2): For Task 1.1, the fea-ture set consists in POS sequences of thesource and target languages, using 12 uni-versal tags that are common in both lan-guages. The algorithm is an enhanced ver-sion of the BLEU metric (EBLEU) designedwith a modified length penalty and added re-call factor, and having the precision and re-call components grouped using the harmonicmean. For Task 1.2, in addition to the uni-versal POS sequences of the source and tar-get languages, features include the scores oflength penalty, precision, recall and rank.Variants of EBLEU with different strategiesfor alignment are used, as well as a NaıveBayes classification algorithm. For Task 2,the features used are unigrams (from previous4th to following 3rd tokens), bigrams (fromprevious 2nd to following 2nd tokens), skipbigrams (previous and next token), trigrams(from previous 2nd to following 2nd tokens).The learning algorithms are Conditional Ran-dom Fields and Naıve Bayes.

6.8 Results
In what follows we give the official results for alltasks followed by a discussion that highlights themain findings for each of the tasks.
Task 1.1 Predicting post-editing distance
Table 12 summarises the results for the rankingvariant of the task. They are sorted from best toworse using the DeltaAvg metric scores as primarykey and the Spearman’s rank correlation scores assecondary key.
The winning submissions for the ranking vari-ant of Task 1.1 are CNGL SVRPLS, with aDeltaAvg score of 11.09, and DCU-SYMC all-types, with a DeltaAvg score of 10.13. While theformer holds the higher score, the difference is notsignificant at the p ≤ 0.05 level as estimated by abootstrap resampling test.
Both submissions are better than the baselinesystem by a very wide margin, a larger relative im-provement than that obtained in the correspondingWMT12 task. In addition, five submissions (outof 12 systems) scored significantly higher than thebaseline system (systems above the middle grayarea), which is a larger proportion than that in lastyear’s task (only 3 out of 16 systems), indicat-ing that this shared task succeeded in pushing thestate-of-the-art performance to new levels.
In addition to the performance of the officialsubmission, we report results obtained by two or-acle methods: the gold-label HTER metric com-puted against the post-edited translations as ref-erence (Oracle HTER), and the BLEU metric (1-BLEU to obtain the same range as HTER) com-puted against the same post-edited translations asreference (Oracle HBLEU). The “Oracle HTER”DeltaAvg score of 16.38 gives an upperbound interms of DeltaAvg for the test set used in this eval-uation. It indicates that, for this set, the differ-ence in post-editing effort between the top qualityquantiles and the overall quality is 16.38 on aver-age. The oracle based on HBLEU gives a lowerDeltaAvg score, which is expected since HTERwas our actual gold label. However, it is stillsignificantly higher than the score of the winningsubmission, which shows that there is significantroom for improvement even by the highest scor-ing submissions.
The results for the scoring variant of the taskare presented in Table 13, sorted from best toworse by using the MAE metric scores as primary
key and the RMSE metric scores as secondary key.According to MAE scores, the winning submis-
sion is SHEF FS (MAE = 12.42), which uses fea-ture selection and a novel learning algorithm forthe task, Gaussian Processes. The baseline sys-tem is measured to have an MAE of 14.81, withsix other submissions having performances thatare not different from the baseline at a statisti-cally significant level, as shown by the gray areain the middle of Table 13). Nine submissions (outof 16) scored significantly higher than the base-line system (systems above the middle gray area),a considerably higher proportion of submissionsas compared to last year (5 out of 19), which indi-cates that this shared task also succeeded in push-ing the state-of-the-art performance to new levelsin terms of absolute scoring. Only one (6%) sys-tem scored significantly lower than the baseline,as opposed to 8 (42%) in last year’s task.
For the sake of completeness, we also show or-acles figures using the same methods as for theranking variant of the task. Here the lowerboundin error (Oracle HTER) will clearly be zero, asboth MAE and RMSE are measured against thesame gold label used for the oracle computation.“Oracle HBLEU” is also not indicative in thiscase, as the although the values for the two metrics(HTER and HBLEU) are within the same ranges,they are not directly comparable. This explains thelarger MAE/RMSE figures for “Oracle HBLEU”than those for most submissions.
Task 1.2 Selecting the best translationBelow we present the results for this task for eachof the two Kendall’s τ flavours presented in Sec-tion 6.6, for the German-English test set (Tables 14and 16) and the English-Spanish test set (Tables 15and 17). The results are sorted from best to worseusing each of the Kendall’s τ metric flavours.
For German-English, the winning submission isDFKI’s logRegFss33 entry, for both Kendall’s τwith ties penalised and ties ignored, with τ = 0.31(since this submission has no ties, the two met-rics give the same τ value). A trivial baseline thatproposes random ranks (with ties allowed) has aKendall’s τ with ties penalised of -0.12 (as thismetric penalises the system’s ties that were non-ties in the reference), and a Kendall’s τ with tiesignored of 0.08. Most of the submissions per-formed better than this simple baseline. More in-terestingly perhaps is the comparison between thebest submission and the performance by an ora-

System ID DeltaAvg Spearman ρ• CNGL SVRPLS 11.09 0.55
• DCU-SYMC alltypes 10.13 0.59SHEF FS 9.76 0.57
CNGL SVR 9.88 0.51DCU-SYMC combine 9.84 0.59
CMU noB 8.98 0.57SHEF FS-AL 8.85 0.50
Baseline bb17 SVR 8.52 0.46CMU full 8.23 0.54
LIMSI 8.15 0.44TCD-CNGL open 6.03 0.33
TCD-CNGL restricted 5.85 0.31UMAC 2.74 0.11
Oracle HTER 16.38 1.00Oracle HBLEU 15.74 0.93
Table 12: Official results for the ranking variant of the WMT13 Quality Estimation Task 1.1. The winning submissions areindicated by a • (they are significantly better than all other submissions according to bootstrap resampling (10k times) with95% confidence intervals). The systems in the gray area are not different from the baseline system at a statistically significantlevel according to the same test. Oracle results that use human-references are also shown for comparison purposes.
System ID MAE RMSE• SHEF FS 12.42 15.74
SHEF FS-AL 13.02 17.03CNGL SVRPLS 13.26 16.82
LIMSI 13.32 17.22DCU-SYMC combine 13.45 16.64DCU-SYMC alltypes 13.51 17.14
CMU noB 13.84 17.46CNGL SVR 13.85 17.28
FBK-UEdin extra 14.38 17.68FBK-UEdin rand-svr 14.50 17.73
LORIA inctrain 14.79 18.34Baseline bb17 SVR 14.81 18.22
TCD-CNGL open 14.81 19.00LORIA inctraincont 14.83 18.17
TCD-CNGL restricted 15.20 19.59CMU full 15.25 18.97
UMAC 16.97 21.94Oracle HTER 0.00 0.00
Oracle HBLEU (1-HBLEU) 16.85 19.72
Table 13: Official results for the scoring variant of the WMT13 Quality Estimation Task 1.1. The winning submission isindicated by a • (it is significantly better than the other submissions according to bootstrap resampling (10k times) with 95%confidence intervals). The systems in the gray area are not different from the baseline system at a statistically significant levelaccording to the same test. Oracle results that use human-references are also shown for comparison purposes.

German-English System ID Kendall’s τ with ties penalised• DFKI logRegFss33 0.31
DFKI logRegFss24 0.28CNGL SVRPLSF1 0.17
CNGL SVRF1 0.17DCU CCG 0.15
UPC AQE+SEM+LM 0.11UPC AQE+LeM+ALGPR+LM 0.10
DCU baseline+CCG 0.00Baseline Random-ranks-with-ties -0.12
UMAC EBLEU-I -0.39UMAC NB-LPR -0.49
Oracle Human 1.00Oracle BLEU (margin 0.00) 0.19Oracle BLEU (margin 0.01) 0.05
Oracle METEOR-ex (margin 0.00) 0.23Oracle METEOR-ex (margin 0.01) 0.06
Table 14: Official results for the Task 1.2 of the WMT13 Quality Estimation shared task for German-English, using as metricKendall’s τ with ties penalised. The winning submissions are indicated by a •. Oracle results that use human-references arealso shown for comparison purposes.
English-Spanish System ID Kendall’s τ with ties penalised• CNGL SVRPLSF1 0.15
CNGL SVRF1 0.13DFKI logRegL2-411 0.09DFKI logRegL2-431 0.04
UPC QQE+LeM+ALGPR+LM -0.03UPC AQE+LeM+ALGPR+LM -0.06
CMU BLEUopt -0.11Baseline Random-ranks-with-ties -0.23
UMAC EBLEU-A -0.27UMAC EBLEU-I -0.35
CMU cls -0.63Oracle Human 1.00
Oracle BLEU (margin 0.00) 0.17Oracle BLEU (margin 0.02) -0.06
Oracle METEOR-ex (margin 0.00) 0.19Oracle METEOR-ex (margin 0.02) 0.05
Table 15: Official results for the Task 1.2 of the WMT13 Quality Estimation shared task for English-Spanish, using as metricKendall’s τ with ties penalised. The winning submissions are indicated by a •. Oracle results that use human-references arealso shown for comparison purposes.

German-English System ID Kendall’s τ with ties ignored Nr. of non-ties / Nr. of decisions• DFKI logRegFss33 0.31 882/882
DFKI logRegFss24 0.28 882/882UPC AQE+SEM+LM 0.27 768/882
UPC AQE+LeM+ALGPR+LM 0.24 788/882DCU CCG 0.18 862/882
CNGL SVRPLSF1 0.17 882/882CNGL SVRF1 0.17 881/882
Baseline Random-ranks-with-ties 0.08 718/882DCU baseline+CCG 0.01 874/882
UMAC NB-LPR 0.01 447/882UMAC EBLEU-I -0.03 558/882
Oracle Human 1.00 882/882Oracle BLEU (margin 0.00) 0.22 859/882Oracle BLEU (margin 0.01) 0.27 728/882
Oracle METEOR-ex (margin 0.00) 0.20 869/882Oracle METEOR-ex (margin 0.01) 0.24 757/882
Table 16: Official results for the Task 1.2 of the WMT13 Quality Estimation shared task for German-English, using as metricKendall’s τ with ties ignored. The winning submissions are indicated by a •. Oracle results that use human-references are alsoshown for comparison purposes.
English-Spanish System ID Kendall’s τ with ties ignored Nr. of non-ties / Nr. of decisions• CMU cls 0.23 192/633
CNGL SVRPLSF1 0.16 632/633CNGL SVRF1 0.13 631/633
DFKI logRegL2-411 0.13 610/633UPC QQE+LeM+ALGPR+LM 0.11 554/633UPC AQE+LeM+ALGPR+LM 0.08 554/633
UMAC EBLEU-A 0.07 430/633DFKI logRegL2-431 0.04 633/633
Baseline Random-ranks-with-ties 0.03 507/633UMAC EBLEU-I 0.02 407/633
CMU BLEUopt -0.11 633/633Oracle Human 1.00 633/633
Oracle BLEU (margin 0.00) 0.19 621/633Oracle BLEU (margin 0.02) 0.26 474/633
Oracle METEOR-ex (margin 0.00) 0.25 623/633Oracle METEOR-ex (margin 0.02) 0.28 517/633
Table 17: Official results for the Task 1.2 of the WMT13 Quality Estimation shared task for English-Spanish, using as metricKendall’s τ with ties ignored. The winning submissions are indicated by a •. Oracle results that use human-references are alsoshown for comparison purposes.

cle method that has access to human-created refer-ences. This oracle uses human references to com-pute BLEU and METEOR scores for each trans-lation segment, and consequently computes rank-ings for the competing translations based on thesescores. To reflect the impact of ties on the twoversions of Kendall’s τ metric we use, we allowthese ranks to be tied if the difference between theoracle BLEU or METEOR scores is smaller thana margin (see lower section of Tables 14 and 16,with margins of 0 and 0.01 for the scores). For ex-ample, under a regime of BLEU with margin 0.01,a translation with BLEU score of 0.172 would getthe same rank as a translation with BLEU score of0.164 (difference of 0.008), but a higher rank thana translation with BLEU score of 0.158 (differenceof 0.014). Not surprisingly, under the Kendall’sτ with ties penalised the best Oracle BLEU orMETEOR performance happens for a 0.0 mar-gin (which makes ties possible only for exactly-matching scores), for a value of τ = 0.19 andτ = 0.23, respectively. Under the Kendall’s τ withties ignored, the Oracle BLEU performance for a0.01 margin (i.e, translations under 1 BLEU pointshould be considered as having the same rank)achieves τ = 0.27, while Oracle METEOR for a0.01 margin achieves τ = 0.24. These values arelower than the τ = 0.31 of the winning submis-sion without access to reference translations, sug-gesting that quality estimation models are capableof better modelling translation differences com-pared to traditional, human reference-based MTevaluation metrics.
For English-Spanish, under Kendall’s τ withties penalised the winning submission is CNGL’sSVRPLSF1, with τ = 0.15. Under Kendall’s τwith ties ignored, the best scoring submission isCMU’s cls with τ = 0.23, but this is achievedby offering non-tie judgements only for 192 of the633 total judgements (30% of them). As we dis-cussed in Section 6.6, the ”Kendall’s τ with tiesignored” metric is weak with respect to compar-ing different submissions, since it favours systemsthat are do not commit to a given rank and ratherproduce a large number of ties. This becomes evenclearer when we look at the performance of the or-acle methods (Tables 15 and 17). Under Kendall’sτ with ties penalised, “Oracle BLEU” (margin0.00) achieves τ = 0.17, while under Kendall’sτ with ties ignored, “Oracle BLEU” (margin 0.02)has a τ = 0.26. This results in 474 non-tie deci-
sions (75% of them), and a better τ value com-pared to “Oracle BLEU” (margin 0.00), with aτ = 0.19 under the same metric. The oracle valuesfor both BLEU and METEOR are close to the τvalues of the winning submissions, supporting theconclusion that quality estimation techniques cansuccessfully replace traditional, human reference-based MT evaluation metrics.
Task 1.3 Predicting post-editing timeResults for this task are presented in Table 18.A third of the submissions was able to beat thebaseline. Among these FBK-UEDIN’s submissionranked best in terms of MAE, our main metric forthis task, and also achieved the lowest RMSE.
Only three systems were able to beat our base-line in terms of MAE. Please note that while allfeatures were available to the participants, ourbaseline is actually a competitive system.
The second-best entry, CNGL SVR, reachedthe highest Spearman’s rank correlation, our sec-ondary metric. Furthermore, in terms of this met-ric all four top-ranking entries, two by CNGL andFBK-UEDIN respectively, are significantly betterthan the baseline (10k bootstrap resampling testwith 95% confidence intervals). As high rankingsubmissions also yield strong rank correlation tothe observed post-editing time, we can be confi-dent that improvements in MAE are not only dueto better handling of extreme cases.
Many participants submitted two variants oftheir systems with different numbers of featuresand/or machine learning approaches. In Table 18we can see these are grouped closely together giv-ing rise to the assumption that the general pool ofavailable features and thereby the used resourcesand strongest features are most relevant for a sys-tem’s performance. Another hint in that directionis the observation the top-ranked systems rely onadditional data and resources to generate their fea-tures.
Task 2 Predicting word-level scoresResults for this task are presented in Table 19 and20, sorted by macro average F1. Since this is anew task, we have yet to establish a strong base-line. For reference we provide a trivial baselinethat predicts the dominant class – (K)eep – for ev-ery token.
The first observation in Table 19 is that this triv-ial baseline is difficult to beat in terms of accuracy.However, considering our main metric – macro-
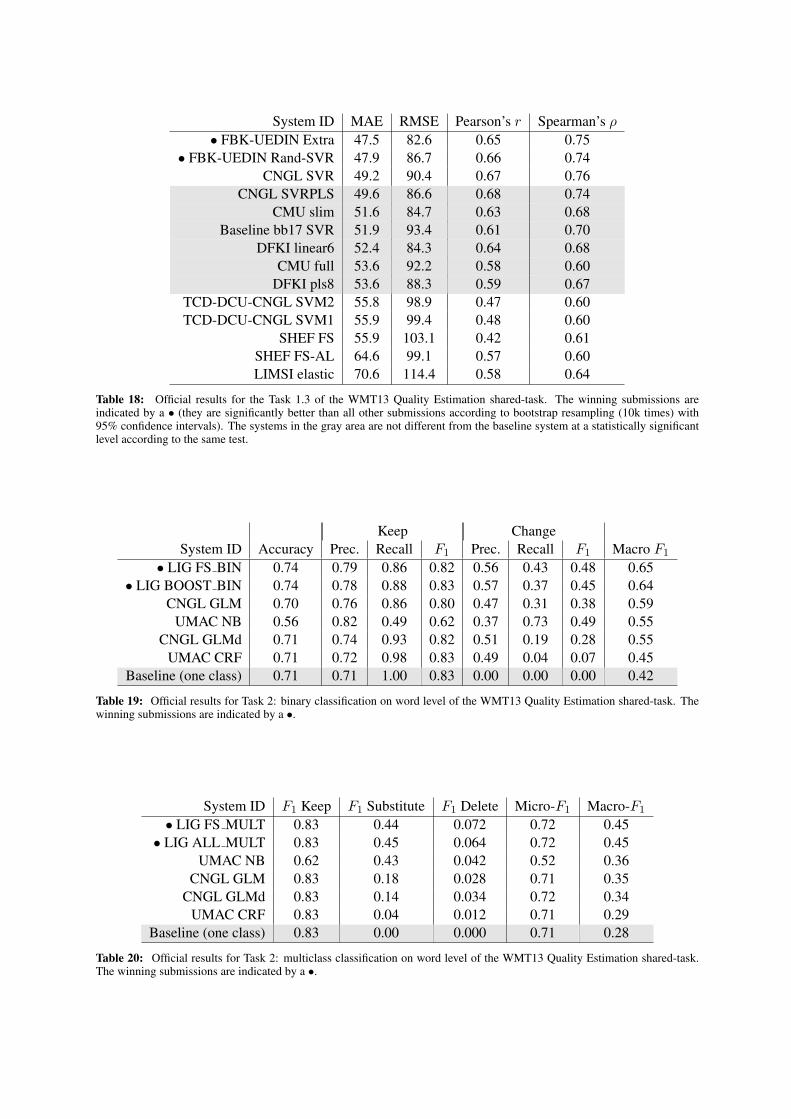
System ID MAE RMSE Pearson’s r Spearman’s ρ• FBK-UEDIN Extra 47.5 82.6 0.65 0.75
• FBK-UEDIN Rand-SVR 47.9 86.7 0.66 0.74CNGL SVR 49.2 90.4 0.67 0.76
CNGL SVRPLS 49.6 86.6 0.68 0.74CMU slim 51.6 84.7 0.63 0.68
Baseline bb17 SVR 51.9 93.4 0.61 0.70DFKI linear6 52.4 84.3 0.64 0.68
CMU full 53.6 92.2 0.58 0.60DFKI pls8 53.6 88.3 0.59 0.67
TCD-DCU-CNGL SVM2 55.8 98.9 0.47 0.60TCD-DCU-CNGL SVM1 55.9 99.4 0.48 0.60
SHEF FS 55.9 103.1 0.42 0.61SHEF FS-AL 64.6 99.1 0.57 0.60LIMSI elastic 70.6 114.4 0.58 0.64
Table 18: Official results for the Task 1.3 of the WMT13 Quality Estimation shared-task. The winning submissions areindicated by a • (they are significantly better than all other submissions according to bootstrap resampling (10k times) with95% confidence intervals). The systems in the gray area are not different from the baseline system at a statistically significantlevel according to the same test.
Keep ChangeSystem ID Accuracy Prec. Recall F1 Prec. Recall F1 Macro F1
• LIG FS BIN 0.74 0.79 0.86 0.82 0.56 0.43 0.48 0.65• LIG BOOST BIN 0.74 0.78 0.88 0.83 0.57 0.37 0.45 0.64
CNGL GLM 0.70 0.76 0.86 0.80 0.47 0.31 0.38 0.59UMAC NB 0.56 0.82 0.49 0.62 0.37 0.73 0.49 0.55
CNGL GLMd 0.71 0.74 0.93 0.82 0.51 0.19 0.28 0.55UMAC CRF 0.71 0.72 0.98 0.83 0.49 0.04 0.07 0.45
Baseline (one class) 0.71 0.71 1.00 0.83 0.00 0.00 0.00 0.42
Table 19: Official results for Task 2: binary classification on word level of the WMT13 Quality Estimation shared-task. Thewinning submissions are indicated by a •.
System ID F1 Keep F1 Substitute F1 Delete Micro-F1 Macro-F1
• LIG FS MULT 0.83 0.44 0.072 0.72 0.45• LIG ALL MULT 0.83 0.45 0.064 0.72 0.45
UMAC NB 0.62 0.43 0.042 0.52 0.36CNGL GLM 0.83 0.18 0.028 0.71 0.35
CNGL GLMd 0.83 0.14 0.034 0.72 0.34UMAC CRF 0.83 0.04 0.012 0.71 0.29
Baseline (one class) 0.83 0.00 0.000 0.71 0.28
Table 20: Official results for Task 2: multiclass classification on word level of the WMT13 Quality Estimation shared-task.The winning submissions are indicated by a •.

average F1 – it is clear that all systems outperformthe baseline. The winning systems by LIG for thebinary task are also the top ranking systems on themulticlass task.
While promising results are found for the bi-nary variant of the task where systems are able toachieve an F1 of almost 0.5 for the relevant class– Change, the multiclass prediction variant of thetask seem to suffer from its severe class imbalance.In fact, none of the systems shows good perfor-mance when predicting deletions.
6.9 DiscussionIn what follows, we discuss the main accomplish-ments of this shared task starting from the goalswe had previously identified for it.
Explore various granularity levels for thequality-prediction task The decision on whichlevel of granularity quality estimation is applieddepends strongly on the intended application. InTask 2 we tested binary word-level classificationin a post-editing setting. If such annotation is pre-sented through a user interface we imagine thatwords marked as incorrect would be hidden fromthe editor, highlighted as possibly wrong or that alist of alternatives would we generated.
With respect to the poor improvements overtrivial baselines, we consider that the results forword-level prediction could be mostly connectedto limitations of the datasets provided, which arevery small for word-level prediction, as comparedto successful previous work such as (Bach et al.,2011). Despite the limited amount of trainingdata, several systems were able to predict dubiouswords (binary variant of the task), showing thatthis can be a promising task. Extending the granu-larity even further by predicting the actual editingaction necessary for a word yielded less positiveresults than the binary setting.
We cannot directly compare sentence- andword-level results. However, since sentence-levelpredictions can benefit from more informationavailable and therefore more signal on which theprediction is based, the natural conclusion is that,if there is a choice in the prediction granularity,to opt for the coarser one possible (i.e., sentence-level over word-level). But certain applicationsmay require finer granularity levels, and thereforeword-level predictions can still be very valuable.
Explore the prediction of more objective scoresGiven the multitude of possible applications for
quality estimation we must decide which predictedvalues are both useful and accurate. In this year’stask we have attempted to address the useful-ness criterion by moving from the subjective, hu-man judgement-based scores, to the prediction ofscores that can be more easily interpreted for prac-tical applications: post-editing distance or types ofedits (word-level), post-editing time, and rankingof alternative translations.
The general promise of using objective scores isthat predicting a value that is related to the use casewill make quality estimation more applicable andyield lower deviance compared to the use of proxymetrics. The magnitude of this benefit should besufficient to account for the possible additional ef-fort related to collecting such scores.
While a direct comparison between the differ-ent types of scores used for this year’s tasks is notpossible as they are based on different datasets, ifwe compare last year’s task on predicting 1-5 lik-ert scores (and generating an overall ranking of alltranslations in the test set) with this year’s Task1.1, which is virtually the same, but using post-editing distance as gold-label, we see that the num-ber of systems that outperform the baseline 18 isproportionally larger this year. We can also noticea higher relative improvement of these submis-sions over the baseline system. While this couldsimply be a consequence of progress in the field, itmay also provide an indication that objective met-rics are more suitable for the problem.
Particularly with respect to post-editing time,given that this label has a long tailed distributionand is not trivial to measure even in a controlledenvironment, the results of Task 1.3 are encour-aging. Comparison with the better results seenon Tasks 1.1 and 1.2, however, suggests that, forTask 1.3, additional data processing, filtering, andmodelling (including modelling translator-specifictraits such as their variance in time) is required, asevidenced in (Cohn and Specia, 2013).
Explore the use of quality estimation tech-niques to replace reference-based MT evalua-tion metrics When it comes to the task of au-tomatically ranking alternative translations gener-ated by different MT systems, the traditional useof reference-based MT evaluation metrics is chal-lenged by the findings of this task.
The top ranking quality estimation submissions18The two baselines are exactly the same, and therefore the
comparison is meaningful.

to Task 1.2 have performances that outperform orare at least at the same level with the ones thatinvolve the use of human references. The most in-teresting property of these techniques is that, be-ing reference-free, they can be used for any sourcesentences, and therefore are ready to be deployedfor arbitrary texts.
An immediate application for this capability isa procedure by which MT system-selection is per-formed, based on the output of such quality esti-mators. Additional measurements are needed todetermine the level of improvement in translationquality that the current performance of these tech-niques can achieve in a system-selection scenario.
Identify new and effective quality indicatorsQuality indicators, or features, are core to theproblem of quality estimation. One significant dif-ference this year with respect to previous year wasthe availability of QUEST, a framework for the ex-traction of a large number of features. A few sub-missions used these larger sets – as opposed to the17 baseline features used in the 2012 edition – astheir starting point, to which they added other fea-tures. Most features available in this framework,however, had already been used in previous work.
Novel families of features used this year whichseems to have played an important role are thoseproposed by CNGL. They include a number oflanguage and MT-system independent monolin-gual and bilingual similarity metrics between thesentences for prediction and corpora of the lan-guage pair under consideration. Based on standardregression algorithm (the same used by the base-line system), the submissions from CNGL usingsuch feature families topped many of the tasks.
Another interesting family of features is thatused by TCD-CNGL and TCD-DCU-CNGL forTasks 1.1 and 1.3. These were borrowed fromwork on style or authorship identification. The as-sumption is that low/high quality translations canbe characterised by some patterns which are fre-quent and/or differ significantly from patterns be-longing to the opposite category.
Like in last year’s task, the vast majority ofthe participating systems used external resourcesin addition to those provided for the task, par-ticularly for linguistically-oriented features, suchas parsers, part-of-speech taggers, named entityrecognizers, etc. A novel set of syntactic fea-tures based on Combinatory Categorial Grammar(CCG) performed reasonably well in Task 1.2:
with six CCG-based features and no additionalfeatures, the system outperformed the baselinesystem and also a second submission where the17 baseline features were added. This highlightsthe potential of linguistically-motivated featuresfor the problem.
As expected, different feature sets were usedfor different tasks. This is essential for Task 2,where word-level features are certainly necessary.For example, LIG used a number of lexical fea-tures such as part-of-speech tag, word-posteriorprobabilities, syntactic (constituent label, distanceto the constituent tree root, and target and sourcepolysemy count). For submissions where a se-quence labelling algorithm such as a ConditionalRandom Fields was used for prediction, the inter-dependencies between adjacent words and labelswas also modelled though features.
Pseudo-references, i.e., scores from standardevaluation metrics such as BLEU based on trans-lations generated by an alternative MT system as“reference”, featured in more than half of the sub-missions for sentence-level tasks. This is not sur-prising given their performance in previous workon quality estimation.
Identify effective machine learning techniquesfor all variants of the quality estimation taskFor the sentence-level tasks, standard regressionmethods such as SVR performed well as in theprevious edition of the shared task, topping theresults for the ranking variant of Task 1.1, bothfirst and second place. In fact this algorithm wasused by most submissions that outperformed thebaseline. An alternative algorithm to SVR withvery promising results and which was introducedfor the problem this year is that of Gaussian Pro-cesses. It was used by SHEF, the winning submis-sion in the scoring variant of Task 1.1, which alsoperformed well in the ranking variant, despite itshyperparameters having been optimised for scor-ing only. Algorithms behave similarly for Task1.3, with SVR performing particularly well.
For Task 1.2, logistic regression performed thebest or among the best, along with SVR. One ofthe most effective approach for this task, however,appears to be one that is better tailored for thetask, namely pair-wise decomposition for ranking.This approach benefits from transforming a k-wayranking problem into a series of simpler, 2-wayranking problems, which can be more accuratelysolved. Another approach that shows promise is

that of ensemble of regressors, in which the outputis the results combining the predictions of differ-ent regression models.
Linear-chain Conditional Random Fields are apopular model of choice for sequence labellingtasks and have been successfully used by severalparticipants in Task 2, along with discriminativelytrained Hidden Markov Models and Naıve Bayes.
As in the previous edition, feature engineer-ing and feature selection prior to model learningwere important components in many submissions.However, the role of individual features is hardto judge separately from the role of the machinelearning techniques employed.
Establish the state of the art performance Allfour tasks addressed in this shared task haveachieved a dual role that is important for the re-search community: (i) to make publicly availablenew data sets that can serve to compare differentapproaches and contributions; and (ii) to estab-lish the present state-of-the-art performance in thefield, so that progress can be easily measured andtracked. In addition, the public availability of thescoring scripts makes evaluation and direct com-parison straightforward.
Many participants submitted predictions forseveral tasks. Comparison of the results showsthat there is little overlap between the best sys-tems when the predicted value is varied. Whilewe did not formally require the participants to usesimilar systems across tasks, these results indicatethat specialised systems with features selected de-pending on the predicted variable can in fact bebeneficial.
As we mentioned before, compared to the pre-vious edition of the task, we noticed (for Task1.1) a larger relative improvement of scores overthe baseline system, as well as a larger propor-tion of systems outperforming the baseline sys-tems, which are a good indication that the field isprogressing over the years. For example, in thescoring variant of Task 1.1, last year only 5 out of20 systems (i.e. 25% of the systems) were able tosignificantly outperform the baseline. This year, 9out 16 systems (i.e. 56%) outperformed the samebaseline. Last year, the relative improvement ofthe winning submission with respect to the base-line system was 13%, while this year the relativeimprovement is of 19%.
Overall, the tables of results presented in Sec-tion 6.8 give a comprehensive view of the current
state-of-the-art on the data sets used for this sharedtask, as well as indications on how much roomthere still is for improvement via figures from ora-cle methods. As a result, people interested in con-tributing to research in these machine translationquality estimation tasks will be able to do so in aprincipled way, with clearly established state-of-the-art levels and straightforward means of com-parison.
7 Summary
As in previous incarnations of this workshop wecarried out an extensive manual and automaticevaluation of machine translation performance,and we used the human judgements that we col-lected to validate automatic metrics of translationquality. This year was also the debut of a newquality estimation task, which tries to predict theeffort involved in having post editors correct MToutput. The quality estimation task differs fromthe metrics task in that it does not involve refer-ence translations.
As in previous years, all data sets generated bythis workshop, including the human judgments,system translations and automatic scores, are pub-licly available for other researchers to analyze.19
Acknowledgments
This work was supported in parts by theMosesCore, Casmacat, Khresmoi, Matecat andQTLaunchPad projects funded by the EuropeanCommission (7th Framework Programme), and bygifts from Google, Microsoft and Yandex.
We would also like to thank our colleagues Ma-tous Machacek and Martin Popel for detailed dis-cussions.
References
Allauzen, A., Pecheux, N., Do, Q. K., Dinarelli,M., Lavergne, T., Max, A., Le, H.-S., and Yvon,F. (2013). LIMSI @ WMT13. In Proceedingsof the Eighth Workshop on Statistical MachineTranslation, pages 60–67, Sofia, Bulgaria. As-sociation for Computational Linguistics.
Almaghout, H. and Specia, L. (2013). A CCG-based Quality Estimation Metric for StatisticalMachine Translation. In Proceedings of MTSummit XIV (to appear), Nice, France.
19http://statmt.org/wmt13/results.html

Ammar, W., Chahuneau, V., Denkowski, M., Han-neman, G., Ling, W., Matthews, A., Murray,K., Segall, N., Lavie, A., and Dyer, C. (2013).The CMU machine translation systems at WMT2013: Syntax, synthetic translation options, andpseudo-references. In Proceedings of the EighthWorkshop on Statistical Machine Translation,pages 68–75, Sofia, Bulgaria. Association forComputational Linguistics.
Avramidis, E. (2012). Comparative Quality Es-timation: Automatic Sentence-Level Rankingof Multiple Machine Translation Outputs. InProceedings of 24th International Conferenceon Computational Linguistics, pages 115–132,Mumbai, India.
Avramidis, E. and Popovic, M. (2013). Selectingfeature sets for comparative and time-orientedquality estimation of machine translation out-put. In Proceedings of the Eighth Workshopon Statistical Machine Translation, pages 327–334, Sofia, Bulgaria. Association for Computa-tional Linguistics.
Avramidis, E., Popovic, M., Vilar, D., and Bur-chardt, A. (2011). Evaluate with confidence es-timation: Machine ranking of translation out-puts using grammatical features. In Proceed-ings of the Sixth Workshop on Statistical Ma-chine Translation.
Aziz, W., Mitkov, R., and Specia, L. (2013).Ranking Machine Translation Systems via Post-Editing. In Proc. of Text, Speech and Dialogue(TSD), Lecture Notes in Artificial Intelligence,Berlin / Heidelberg. Zapadoceska univerzita vPlzni, Springer Verlag.
Bach, N., Huang, F., and Al-Onaizan, Y. (2011).Goodness: A method for measuring machinetranslation confidence. In Proceedings of the49th Annual Meeting of the Association forComputational Linguistics: Human LanguageTechnologies, pages 211–219, Portland, Ore-gon, USA.
Beck, D., Shah, K., Cohn, T., and Specia, L.(2013). SHEF-Lite: When less is more fortranslation quality estimation. In Proceedingsof the Eighth Workshop on Statistical MachineTranslation, pages 335–340, Sofia, Bulgaria.Association for Computational Linguistics.
Bicici, E., Groves, D., and van Genabith, J. (2013).Predicting sentence translation quality using ex-
trinsic and language independent features. Ma-chine Translation.
Bicici, E. and van Genabith, J. (2013). CNGL-CORE: Referential translation machines formeasuring semantic similarity. In *SEM 2013:The Second Joint Conference on Lexical andComputational Semantics, Atlanta, Georgia,USA. Association for Computational Linguis-tics.
Bicici, E. (2013a). Feature decay algorithmsfor fast deployment of accurate statistical ma-chine translation systems. In Proceedings of theEighth Workshop on Statistical Machine Trans-lation, pages 76–82, Sofia, Bulgaria. Associa-tion for Computational Linguistics.
Bicici, E. (2013b). Referential translation ma-chines for quality estimation. In Proceedingsof the Eighth Workshop on Statistical MachineTranslation, pages 341–349, Sofia, Bulgaria.Association for Computational Linguistics.
Bılek, K. and Zeman, D. (2013). CUni multilin-gual matrix in the WMT 2013 shared task. InProceedings of the Eighth Workshop on Statis-tical Machine Translation, pages 83–89, Sofia,Bulgaria. Association for Computational Lin-guistics.
Bojar, O., Kos, K., and Marecek, D. (2010). Tack-ling Sparse Data Issue in Machine TranslationEvaluation. In Proceedings of the ACL 2010Conference Short Papers, pages 86–91, Upp-sala, Sweden. Association for ComputationalLinguistics.
Bojar, O., Rosa, R., and Tamchyna, A. (2013).Chimera – three heads for English-to-Czechtranslation. In Proceedings of the Eighth Work-shop on Statistical Machine Translation, pages90–96, Sofia, Bulgaria. Association for Compu-tational Linguistics.
Borisov, A., Dlougach, J., and Galinskaya, I.(2013). Yandex school of data analysis ma-chine translation systems for WMT13. In Pro-ceedings of the Eighth Workshop on StatisticalMachine Translation, pages 97–101, Sofia, Bul-garia. Association for Computational Linguis-tics.
Callison-Burch, C., Fordyce, C., Koehn, P., Monz,C., and Schroeder, J. (2007). (Meta-) evaluationof machine translation. In Proceedings of theSecond Workshop on Statistical Machine Trans-lation (WMT07), Prague, Czech Republic.
Callison-Burch, C., Fordyce, C., Koehn, P., Monz,C., and Schroeder, J. (2008). Further meta-evaluation of machine translation. In Proceed-ings of the Third Workshop on Statistical Ma-chine Translation (WMT08), Colmbus, Ohio.
Callison-Burch, C., Koehn, P., Monz, C., Pe-terson, K., Przybocki, M., and Zaidan, O. F.(2010). Findings of the 2010 joint workshopon statistical machine translation and metricsfor machine translation. In Proceedings of theFourth Workshop on Statistical Machine Trans-lation (WMT10), Uppsala, Sweden.
Callison-Burch, C., Koehn, P., Monz, C., Post, M.,Soricut, R., and Specia, L. (2012). Findings ofthe 2012 workshop on statistical machine trans-lation. In Proceedings of the Seventh Workshopon Statistical Machine Translation, pages 10–51, Montreal, Canada. Association for Compu-tational Linguistics.
Callison-Burch, C., Koehn, P., Monz, C., andSchroeder, J. (2009). Findings of the 2009workshop on statistical machine translation. InProceedings of the Fourth Workshop on Sta-tistical Machine Translation (WMT09), Athens,Greece.
Callison-Burch, C., Koehn, P., Monz, C., andZaidan, O. (2011). Findings of the 2011 work-shop on statistical machine translation. In Pro-ceedings of the Sixth Workshop on StatisticalMachine Translation, pages 22–64, Edinburgh,Scotland.
Camargo de Souza, J. G., Buck, C., Turchi, M.,and Negri, M. (2013). FBK-UEdin participa-tion to the WMT13 quality estimation sharedtask. In Proceedings of the Eighth Workshopon Statistical Machine Translation, pages 350–356, Sofia, Bulgaria. Association for Computa-tional Linguistics.
Charniak, E. and Johnson, M. (2005). Coarse-to-fine n-best parsing and maxent discriminativereranking. In Proceedings of the 43rd AnnualMeeting on Association for Computational Lin-guistics, pages 173–180. Association for Com-putational Linguistics.
Cho, E., Ha, T.-L., Mediani, M., Niehues, J., Her-rmann, T., Slawik, I., and Waibel, A. (2013).The Karlsruhe Institute of Technology transla-tion systems for the WMT 2013. In Proceed-ings of the Eighth Workshop on Statistical Ma-chine Translation, pages 102–106, Sofia, Bul-
garia. Association for Computational Linguis-tics.
Cohen, J. (1960). A coefficient of agreement fornominal scales. Educational and PsychologicalMeasurment, 20(1):37–46.
Cohn, T. and Specia, L. (2013). Modelling Anno-tator Bias with Multi-task Gaussian Processes:An Application to Machine Translation QualityEstimation. In Proceedings of the 51st AnnualMeeting of the Association for ComputationalLinguistics (to appear).
Collins, M. (2002). Discriminative training meth-ods for hidden markov models: theory and ex-periments with perceptron algorithms. In Pro-ceedings of the ACL-02 conference on Empir-ical methods in natural language processing -Volume 10, EMNLP ’02, pages 1–8, Strouds-burg, PA, USA. Association for ComputationalLinguistics.
de Marneffe, M.-C., MacCartney, B., and Man-ning, C. D. (2006). Generating typed depen-dency parses from phrase structure parses. InProceedings of LREC-06, pages 449–454.
Denkowski, M. and Lavie, A. (2010). Meteor-nextand the meteor paraphrase tables: improvedevaluation support for five target languages. InProceedings of the Joint Fifth Workshop on Sta-tistical Machine Translation and MetricsMATR,WMT ’10, pages 339–342, Stroudsburg, PA,USA. Association for Computational Linguis-tics.
Durgar El-Kahlout, I. and Mermer, C. (2013).TUbtak-blgem german-english machine trans-lation systems for w13. In Proceedings of theEighth Workshop on Statistical Machine Trans-lation, pages 107–111, Sofia, Bulgaria. Associ-ation for Computational Linguistics.
Durrani, N., Fraser, A., Schmid, H., Sajjad, H.,and Farkas, R. (2013a). Munich-Edinburgh-Stuttgart submissions of OSM systems atWMT13. In Proceedings of the Eighth Work-shop on Statistical Machine Translation, pages120–125, Sofia, Bulgaria. Association for Com-putational Linguistics.
Durrani, N., Haddow, B., Heafield, K., and Koehn,P. (2013b). Edinburgh’s machine translationsystems for European language pairs. In Pro-ceedings of the Eighth Workshop on Statisti-cal Machine Translation, pages 112–119, Sofia,

Bulgaria. Association for Computational Lin-guistics.
Eidelman, V., Wu, K., Ture, F., Resnik, P., and Lin,J. (2013). Towards efficient large-scale feature-rich statistical machine translation. In Proceed-ings of the Eighth Workshop on Statistical Ma-chine Translation, pages 126–131, Sofia, Bul-garia. Association for Computational Linguis-tics.
Federmann, C. (2012). Appraise: An Open-Source Toolkit for Manual Evaluation of Ma-chine Translation Output. The Prague Bulletinof Mathematical Linguistics (PBML), 98:25–35.
Fleiss, J. L. (1971). Measuring nominal scaleagreement among many raters. PsychologicalBulletin, 76(5):378–382.
Formiga, L., Costa-jussa, M. R., Marino, J. B.,Fonollosa, J. A. R., Barron-Cedeno, A., andMarquez, L. (2013a). The TALP-UPC phrase-based translation systems for WMT13: Systemcombination with morphology generation, do-main adaptation and corpus filtering. In Pro-ceedings of the Eighth Workshop on Statisti-cal Machine Translation, pages 132–138, Sofia,Bulgaria. Association for Computational Lin-guistics.
Formiga, L., Gonzalez, M., Barron-Cedeno, A.,Fonollosa, J. A. R., and Marquez, L. (2013b).The TALP-UPC approach to system selection:Asiya features and pairwise classification usingrandom forests. In Proceedings of the EighthWorkshop on Statistical Machine Translation,pages 357–362, Sofia, Bulgaria. Association forComputational Linguistics.
Formiga, L., Marquez, L., and Pujantell, J.(2013c). Real-life translation quality estimationfor mt system selection. In Proceedings of MTSummit XIV (to appear), Nice, France.
Galuscakova, P., Popel, M., and Bojar, O. (2013).PhraseFix: Statistical post-editing of TectoMT.In Proceedings of the Eighth Workshop on Sta-tistical Machine Translation, pages 139–145,Sofia, Bulgaria. Association for ComputationalLinguistics.
Gispert, A., Blackwood, G., Iglesias, G., andByrne, W. (2013). N-gram posterior probabil-ity confidence measures for statistical machinetranslation: an empirical study. Machine Trans-lation, 27:85–114.
Gonzalez, M., Gimenez, J., and Marquez, L.(2012). A graphical interface for mt evaluationand error analysis. In Proceedings of the ACL2012 System Demonstrations, pages 139–144,Jeju Island, Korea.
Green, S., Cer, D., Reschke, K., Voigt, R., Bauer,J., Wang, S., Silveira, N., Neidert, J., and Man-ning, C. D. (2013). Feature-rich phrase-basedtranslation: Stanford University’s submission tothe WMT 2013 translation task. In Proceed-ings of the Eighth Workshop on Statistical Ma-chine Translation, pages 146–151, Sofia, Bul-garia. Association for Computational Linguis-tics.
Hall, M., Frank, E., Holmes, G., Pfahringer,B., Reutemann, P., and Witten, I. H. (2009).The weka data mining software: an update.SIGKDD Explor. Newsl., 11(1):10–18.
Han, A. L.-F., Wong, D. F., Chao, L. S., Lu, Y., He,L., Wang, Y., and Zhou, J. (2013). A descrip-tion of tunable machine translation evaluationsystems in WMT13 metrics task. In Proceed-ings of the Eighth Workshop on Statistical Ma-chine Translation, pages 412–419, Sofia, Bul-garia. Association for Computational Linguis-tics.
Hildebrand, S. and Vogel, S. (2013). MT qualityestimation: The CMU system for WMT’13. InProceedings of the Eighth Workshop on Statisti-cal Machine Translation, pages 371–377, Sofia,Bulgaria. Association for Computational Lin-guistics.
Hosmer, D. (1989). Applied logistic regression.Wiley, New York, 8th edition.
Huet, S., Manishina, E., and Lefevre, F.(2013). Factored machine translation systemsfor Russian-English. In Proceedings of theEighth Workshop on Statistical Machine Trans-lation, pages 152–155, Sofia, Bulgaria. Associ-ation for Computational Linguistics.
Hunt, E., Martin, J., and Stone, P. (1966). Experi-ments in Induction. Academic Press, New York.
Kaplan, R., Riezler, S., King, T., Maxwell, J.,Vasserman, A., and Crouch, R. (2004). Speedand accuracy in shallow and deep stochasticparsing. In Proceedings of the Human Lan-guage Technology Conference and the 4th An-nual Meeting of the North American Chapter ofthe Association for Computational Linguistics(HLT/NAACL 04).

Kauchak, D. and Barzilay, R. (2006). Paraphras-ing for automatic evaluation. In Proceedingsof the main conference on Human LanguageTechnology Conference of the North AmericanChapter of the Association of ComputationalLinguistics, HLT-NAACL ’06, pages 455–462,Stroudsburg, PA, USA. Association for Compu-tational Linguistics.
Koehn, P. (2012). Simulating human judgment inmachine translation evaluation campaigns. InInternational Workshop on Spoken LanguageTranslation (IWSLT).
Koehn, P. and Monz, C. (2006). Manual and au-tomatic evaluation of machine translation be-tween European languages. In Proceedings ofNAACL 2006 Workshop on Statistical MachineTranslation, New York, New York.
Kononenko, I. (1994). Estimating attributes: anal-ysis and extensions of RELIEF. In Proceedingsof the European conference on machine learn-ing on Machine Learning, pages 171–182, Se-caucus, NJ, USA. Springer-Verlag New York,Inc.
Kos, K. and Bojar, O. (2009). Evaluation of Ma-chine Translation Metrics for Czech as the Tar-get Language. Prague Bulletin of MathematicalLinguistics, 92:135–147.
Landis, J. R. and Koch, G. G. (1977). The mea-surement of observer agreement for categoricaldata. Biometrics, 33:159–174.
Langlois, D., Raybaud, S., and Smaıli, K. (2012).Loria system for the wmt12 quality estimationshared task. In Proceedings of the SeventhWorkshop on Statistical Machine Translation,pages 114–119, Montreal, Canada.
Langlois, D. and Smaili, K. (2013). LORIA sys-tem for the WMT13 quality estimation sharedtask. In Proceedings of the Eighth Workshopon Statistical Machine Translation, pages 378–383, Sofia, Bulgaria. Association for Computa-tional Linguistics.
Le, H. S., Oparin, I., Allauzen, A., Gauvain, J.-L.,and Yvon, F. (2011). Structured output layerneural network language model. In ICASSP,pages 5524–5527.
Lin, C.-J., Weng, R. C., and Keerthi, S. S. (2007).Trust region Newton methods for large-scale lo-gistic regression. In Proceedings of the 24thinternational conference on Machine learning
- ICML ’07, pages 561–568, New York, NewYork, USA. ACM Press.
Luong, N. Q., Lecouteux, B., and Besacier, L.(2013). LIG system for WMT13 QE task: In-vestigating the usefulness of features in wordconfidence estimation for MT. In Proceedingsof the Eighth Workshop on Statistical MachineTranslation, pages 384–389, Sofia, Bulgaria.Association for Computational Linguistics.
Machacek, M. and Bojar, O. (2013). Results of theWMT13 metrics shared task. In Proceedingsof the Eighth Workshop on Statistical MachineTranslation, pages 43–49, Sofia, Bulgaria. As-sociation for Computational Linguistics.
Matusov, E. and Leusch, G. (2013). OmnifluentEnglish-to-French and Russian-to-English sys-tems for the 2013 Workshop on Statistical Ma-chine Translation. In Proceedings of the EighthWorkshop on Statistical Machine Translation,pages 156–161, Sofia, Bulgaria. Association forComputational Linguistics.
McCallum, A. K. (2002). MALLET: a machinelearning for language toolkit.
Miceli Barone, A. V. and Attardi, G. (2013).Pre-reordering for machine translation usingtransition-based walks on dependency parsetrees. In Proceedings of the Eighth Workshopon Statistical Machine Translation, pages 162–167, Sofia, Bulgaria. Association for Computa-tional Linguistics.
Moreau, E. and Rubino, R. (2013). An approachusing style classification features for quality es-timation. In Proceedings of the Eighth Work-shop on Statistical Machine Translation, pages427–432, Sofia, Bulgaria. Association for Com-putational Linguistics.
Nadejde, M., Williams, P., and Koehn, P. (2013).Edinburgh’s syntax-based machine translationsystems. In Proceedings of the Eighth Work-shop on Statistical Machine Translation, pages168–174, Sofia, Bulgaria. Association for Com-putational Linguistics.
Okita, T., Liu, Q., and van Genabith, J. (2013).Shallow semantically-informed PBSMT andHPBSMT. In Proceedings of the Eighth Work-shop on Statistical Machine Translation, pages175–182, Sofia, Bulgaria. Association for Com-putational Linguistics.
Ozgur, A., Ozgur, L., and Gungor, T. (2005). Text
categorization with class-based and corpus-based keyword selection. In Proceedings ofthe 20th International Conference on Computerand Information Sciences, ISCIS’05, pages606–615, Berlin, Heidelberg. Springer.
Peitz, S., Mansour, S., Huck, M., Freitag, M.,Ney, H., Cho, E., Herrmann, T., Mediani,M., Niehues, J., Waibel, A., Allauzen, A.,Khanh Do, Q., Buschbeck, B., and Wand-macher, T. (2013a). Joint WMT 2013 submis-sion of the QUAERO project. In Proceedingsof the Eighth Workshop on Statistical MachineTranslation, pages 183–190, Sofia, Bulgaria.Association for Computational Linguistics.
Peitz, S., Mansour, S., Peter, J.-T., Schmidt, C.,Wuebker, J., Huck, M., Freitag, M., and Ney,H. (2013b). The RWTH aachen machine trans-lation system for WMT 2013. In Proceedingsof the Eighth Workshop on Statistical MachineTranslation, pages 191–197, Sofia, Bulgaria.Association for Computational Linguistics.
Pighin, D., Formiga, L., and Marquez, L.(2012). A graph-based strategy to streamlinetranslation quality assessments. In Proceed-ings of the Tenth Conference of the Associa-tion for Machine Translation in the Americas(AMTA’2012), San Diego, USA.
Pino, J., Waite, A., Xiao, T., de Gispert, A., Flego,F., and Byrne, W. (2013). The University ofCambridge Russian-English system at WMT13.In Proceedings of the Eighth Workshop on Sta-tistical Machine Translation, pages 198–203,Sofia, Bulgaria. Association for ComputationalLinguistics.
Post, M., Ganitkevitch, J., Orland, L., Weese, J.,Cao, Y., and Callison-Burch, C. (2013). Joshua5.0: Sparser, better, faster, server. In Proceed-ings of the Eighth Workshop on Statistical Ma-chine Translation, pages 204–210, Sofia, Bul-garia. Association for Computational Linguis-tics.
Rubino, R., Toral, A., Cortes Vaıllo, S., Xie, J.,Wu, X., Doherty, S., and Liu, Q. (2013a). TheCNGL-DCU-Prompsit translation systems forWMT13. In Proceedings of the Eighth Work-shop on Statistical Machine Translation, pages211–216, Sofia, Bulgaria. Association for Com-putational Linguistics.
Rubino, R., Wagner, J., Foster, J., Roturier, J.,Samad Zadeh Kaljahi, R., and Hollowood, F.
(2013b). DCU-Symantec at the WMT 2013quality estimation shared task. In Proceedingsof the Eighth Workshop on Statistical MachineTranslation, pages 390–395, Sofia, Bulgaria.Association for Computational Linguistics.
Sajjad, H., Smekalova, S., Durrani, N., Fraser, A.,and Schmid, H. (2013). QCRI-MES submis-sion at WMT13: Using transliteration miningto improve statistical machine translation. InProceedings of the Eighth Workshop on Statisti-cal Machine Translation, pages 217–222, Sofia,Bulgaria. Association for Computational Lin-guistics.
Schmidt, H. (1994). Probabilistic part-of-speechtagging using decision trees. In Proceedings ofthe International Conference on New Methodsin Natural Language Processing.
Seginer, Y. (2007). Learning Syntactic Structure.PhD thesis, University of Amsterdam.
Shah, K., Cohn, T., and Specia, L. (2013). An In-vestigation on the Effectiveness of Features forTranslation Quality Estimation. In Proceedingsof MT Summit XIV (to appear), Nice, France.
Singh, A. K., Wisniewski, G., and Yvon, F.(2013). LIMSI submission for the WMT’13quality estimation task: an experiment with n-gram posteriors. In Proceedings of the EighthWorkshop on Statistical Machine Translation,pages 396–402, Sofia, Bulgaria. Association forComputational Linguistics.
Smith, J., Saint-Amand, H., Plamada, M., Koehn,P., Callison-Burch, C., and Lopez, A. (2013).Dirt cheap web-scale parallel text from theCommon Crawl. In Proceedings of the 2013Conference of the Association for Computa-tional Linguistics (ACL 2013), Sofia, Bulgaria.Association for Computational Linguistics.
Snover, M., Dorr, B., Schwartz, R., Micciulla, L.,and Makhoul, J. (2006). A study of transla-tion edit rate with targeted human annotation.In Proceedings of the 7th Biennial Conferenceof the Association for Machine Translation inthe Americas (AMTA-2006), Cambridge, Mas-sachusetts.
Snover, M., Madnani, N., Dorr, B. J., andSchwartz, R. (2009). Fluency, adequacy, orhter?: exploring different human judgmentswith a tunable mt metric. In Proceedings of theFourth Workshop on Statistical Machine Trans-

lation, StatMT ’09, pages 259–268, Strouds-burg, PA, USA. Association for ComputationalLinguistics.
Soricut, R., Bach, N., and Wang, Z. (2012). TheSDL Language Weaver Systems in the WMT12Quality Estimation Shared Task. In Proceed-ings of the 7th Workshop on Statistical MachineTranslation, pages 145–151.
Souza, J. G. C. d., Espl-Gomis, M., Turchi, M.,and Negri, M. (2013). Exploiting qualitative in-formation from automatic word alignment forcross-lingual nlp tasks. In The 51st AnnualMeeting of the Association for ComputationalLinguistics - Short Papers (ACL Short Papers2013).
Specia, L. (2011). Exploiting Objective Annota-tions for Measuring Translation Post-editing Ef-fort. In Proceedings of the 15th Conference ofthe European Association for Machine Transla-tion, pages 73–80, Leuven.
Specia, L., Shah, K., de Souza, J. G. C., and Cohn,T. (2013). QuEst - A Translation Quality Esti-mation Framework. In Proceedings of the 51thConference of the Association for Computa-tional Linguistics (ACL), Demo Session, Sofia,Bulgaria. Association for Computational Lin-guistics.
Stolcke, A. (2002). SRILM – An extensible lan-guage modeling toolkit. In Proceedings of the7th International Conference on Spoken Lan-guage Processing (ICSLP 2002), pages 901–904.
Stone, M. and Brooks, R. J. (1990). Contin-uum regression: cross-validated sequentiallyconstructed prediction embracing ordinary leastsquares, partial least squares and principal com-ponents regression. Journal of the RoyalStatistical Society Series B Methodological,52(2):237–269.
Stymne, S., Hardmeier, C., Tiedemann, J., andNivre, J. (2013). Tunable distortion limits andcorpus cleaning for SMT. In Proceedings of theEighth Workshop on Statistical Machine Trans-lation, pages 223–229, Sofia, Bulgaria. Associ-ation for Computational Linguistics.
Tantug, A. C., Oflazer, K., and El-Kahlout, I. D.(2008). BLEU+: a Tool for Fine-Grained BLEUComputation. In (ELRA), E. L. R. A., edi-tor, Proceedings of the Sixth International Lan-
guage Resources and Evaluation (LREC’08),Marrakech, Morocco.
Weller, M., Kisselew, M., Smekalova, S., Fraser,A., Schmid, H., Durrani, N., Sajjad, H., andFarkas, R. (2013). Munich-Edinburgh-Stuttgartsubmissions at WMT13: Morphological andsyntactic processing for SMT. In Proceedingsof the Eighth Workshop on Statistical MachineTranslation, pages 230–237, Sofia, Bulgaria.Association for Computational Linguistics.

A Pairwise System Comparisons by Human Judges
Tables 21–30 show pairwise comparisons between systems for each language pair. The numbers in eachof the tables’ cells indicate the percentage of times that the system in that column was judged to be betterthan the system in that row, ignoring ties. Bolding indicates the winner of the two systems.
Because there were so many systems and data conditions the significance of each pairwise compar-ison needs to be quantified. We applied the Sign Test to measure which comparisons indicate genuinedifferences (rather than differences that are attributable to chance). In the following tables ? indicates sta-tistical significance at p ≤ 0.10, † indicates statistical significance at p ≤ 0.05, and ‡ indicates statisticalsignificance at p ≤ 0.01, according to the Sign Test.
Each table contains final rows showing how likely a system would win when paired against a randomlyselected system (the expected win ratio score) and the rank range according bootstrap resampling (p ≤0.05). Gray lines separate clusters based on non-overlapping rank ranges.
UE
DIN
-HE
AFI
EL
D
ON
LIN
E-B
ME
S
UE
DIN
ON
LIN
E-A
UE
DIN
-SY
NTA
X
CU
-ZE
MA
N
CU
-TA
MC
HY
NA
DC
U-F
DA
JHU
SH
EF-W
PR
OA
UEDIN-HEAFIELD – .50 .48† .43‡ .47† .43‡ .44‡ .38‡ .32‡ .25‡ .26‡ONLINE-B .50 – .46‡ .48† .47† .49 .44‡ .40‡ .39‡ .29‡ .27‡
MES .52† .54‡ – .49 .47? .44‡ .45‡ .42‡ .41‡ .27‡ .25‡UEDIN .57‡ .52† .51 – .51 .48† .47‡ .42‡ .39‡ .28‡ .25‡
ONLINE-A .53† .53† .53? .49 – .48 .51 .44‡ .42‡ .31‡ .30‡UEDIN-SYNTAX .57‡ .51 .56‡ .52† .52 – .51 .43‡ .41‡ .29‡ .26‡
CU-ZEMAN .56‡ .56‡ .55‡ .53‡ .49 .49 – .45‡ .42‡ .32‡ .29‡CU-TAMCHYNA .62‡ .60‡ .58‡ .58‡ .56‡ .57‡ .55‡ – .46‡ .35‡ .32‡
DCU-FDA .68‡ .61‡ .59‡ .61‡ .58‡ .59‡ .58‡ .54‡ – .32‡ .32‡JHU .75‡ .71‡ .73‡ .72‡ .69‡ .71‡ .68‡ .65‡ .68‡ – .46‡
SHEF-WPROA .74‡ .73‡ .75‡ .75‡ .70‡ .74‡ .71‡ .68‡ .68‡ .54‡ –score .60 .58 .57 .56 .54 .54 .53 .48 .45 .32 .29rank 1 2-3 2-4 3-5 4-7 5-7 6-7 8 9 10 11
Table 21: Head to head comparison, ignoring ties, for Czech-English systems
CU
-BO
JAR
CU
-DE
PFI
X
ON
LIN
E-B
UE
DIN
CU
-ZE
MA
N
ME
S
ON
LIN
E-A
CU
-PH
RA
SE
FIX
CU
-TE
CT
OM
T
CO
MM
ER
CIA
L-1
CO
MM
ER
CIA
L-2
SH
EF-W
PR
OA
CU-BOJAR – .51 .47† .44‡ .42‡ .43‡ .48 .41‡ .37‡ .39‡ .38‡ .33‡CU-DEPFIX .49 – .48? .42‡ .43‡ .41‡ .47† .42‡ .40‡ .40‡ .39‡ .34‡ONLINE-B .53† .52? – .47‡ .44‡ .44‡ .44‡ .44‡ .44‡ .41‡ .36‡ .34‡
UEDIN .56‡ .58‡ .53‡ – .47† .47‡ .48 .45‡ .44‡ .42‡ .43‡ .38‡CU-ZEMAN .58‡ .57‡ .56‡ .53† – .49 .49 .48† .46‡ .47‡ .47‡ .35‡
MES .57‡ .59‡ .56‡ .53‡ .51 – .50 .47† .46‡ .43‡ .44‡ .42‡ONLINE-A .52 .53† .56‡ .52 .51 .50 – .52 .47? .47† .47† .46†
CU-PHRASEFIX .59‡ .58‡ .56‡ .55‡ .52† .53† .48 – .49 .48† .49 .42‡CU-TECTOMT .63‡ .60‡ .56‡ .56‡ .54‡ .54‡ .53? .51 – .46‡ .46‡ .40‡
COMMERCIAL-1 .61‡ .60‡ .59‡ .58‡ .53‡ .57‡ .53† .52† .54‡ – .49 .42‡COMMERCIAL-2 .62‡ .61‡ .64‡ .57‡ .53‡ .56‡ .53† .51 .54‡ .51 – .43‡
SHEF-WPROA .67‡ .66‡ .66‡ .62‡ .65‡ .58‡ .54† .58‡ .60‡ .58‡ .57‡ –score .58 .57 .56 .52 .50 .50 .49 .48 .47 .45 .45 .38rank 1-2 1-2 3 4 5-7 5-7 5-8 7-9 8-9 10-11 10-11 12
Table 22: Head to head comparison, ignoring ties, for English-Czech systems

ON
LIN
E-B
ON
LIN
E-A
UE
DIN
-SY
NTA
X
UE
DIN
QU
AE
RO
KIT
ME
S
RW
TH
-JA
NE
ME
S-S
ZE
GE
D-R
EO
RD
ER
-SP
LIT
LIM
SI-
NC
OD
E-S
OU
L
TU
BIT
AK
UM
D
DC
U
CU
-ZE
MA
N
JHU
SH
EF-W
PR
OA
DE
SR
T
ONLINE-B – .48 .44‡ .37‡ .44‡ .41‡ .42‡ .40‡ .35‡ .37‡ .32‡ .31‡ .31‡ .27‡ .23‡ .18‡ .16‡ONLINE-A .52 – .47 .45† .47 .43‡ .42‡ .41‡ .44‡ .40‡ .35‡ .36‡ .34‡ .31‡ .27‡ .25‡ .21‡
UEDIN-SYNTAX .56‡ .53 – .48 .46† .48? .46† .46† .45‡ .45‡ .35‡ .35‡ .34‡ .28‡ .25‡ .20‡ .19‡UEDIN .63‡ .55† .52 – .51 .46‡ .47† .49 .44‡ .43‡ .39‡ .34‡ .35‡ .32‡ .28‡ .24‡ .22‡
QUAERO .56‡ .53 .54† .49 – .49 .52 .44‡ .46‡ .44‡ .39‡ .38‡ .37‡ .30‡ .31‡ .25‡ .21‡KIT .59‡ .57‡ .52? .54‡ .51 – .45‡ .51 .43‡ .46‡ .37‡ .38‡ .41‡ .35‡ .31‡ .25‡ .21‡
MES .58‡ .58‡ .54† .53† .48 .55‡ – .49 .49 .46‡ .44‡ .37‡ .40‡ .34‡ .30‡ .26‡ .20‡RWTH-JANE .60‡ .59‡ .54† .51 .56‡ .49 .51 – .46‡ .50 .45‡ .46‡ .47† .38‡ .33‡ .28‡ .20‡
MES-SZEGED-REORDER-SPLIT .65‡ .56‡ .55‡ .56‡ .54‡ .57‡ .51 .54‡ – .53? .44‡ .41‡ .41‡ .36‡ .34‡ .31‡ .21‡LIMSI-NCODE-SOUL .63‡ .60‡ .55‡ .57‡ .56‡ .54‡ .54‡ .50 .47? – .51 .45‡ .43‡ .37‡ .34‡ .30‡ .22‡
TUBITAK .68‡ .65‡ .65‡ .61‡ .61‡ .63‡ .56‡ .55‡ .56‡ .49 – .48? .49 .39‡ .41‡ .30‡ .25‡UMD .69‡ .64‡ .65‡ .66‡ .62‡ .62‡ .63‡ .54‡ .59‡ .55‡ .52? – .48? .41‡ .40‡ .33‡ .27‡DCU .69‡ .66‡ .66‡ .65‡ .63‡ .59‡ .60‡ .53† .59‡ .57‡ .51 .52? – .41‡ .38‡ .37‡ .25‡
CU-ZEMAN .73‡ .69‡ .72‡ .68‡ .70‡ .65‡ .66‡ .62‡ .64‡ .63‡ .61‡ .59‡ .59‡ – .44‡ .43‡ .29‡JHU .77‡ .73‡ .75‡ .72‡ .69‡ .69‡ .70‡ .67‡ .66‡ .66‡ .59‡ .60‡ .62‡ .56‡ – .43‡ .30‡
SHEF-WPROA .82‡ .75‡ .80‡ .76‡ .75‡ .75‡ .74‡ .72‡ .69‡ .70‡ .70‡ .67‡ .63‡ .57‡ .57‡ – .41‡DESRT .84‡ .79‡ .81‡ .78‡ .79‡ .79‡ .80‡ .80‡ .79‡ .78‡ .75‡ .73‡ .75‡ .71‡ .70‡ .59‡ –
score .66 .62 .60 .58 .58 .57 .56 .54 .53 .52 .48 .46 .46 .39 .36 .31 .23rank 1 2-3 2-3 4-5 4-5 5-7 6-7 8-9 8-10 9-10 11 12-13 12-13 14 15 16 17
Table 23: Head to head comparison, ignoring ties, for German-English systems
ON
LIN
E-B
PR
OM
T
UE
DIN
-SY
NTA
X
ON
LIN
E-A
UE
DIN
KIT
STA
NF
OR
D
LIM
SI-
NC
OD
E-S
OU
L
ME
S-R
EO
RD
ER
JHU
CU
-ZE
MA
N
TU
BIT
AK
UU
SH
EF-W
PR
OA
RW
TH
-JA
NE
ONLINE-B – .55‡ .50 .45? .45‡ .34‡ .37‡ .37‡ .37‡ .32‡ .32‡ .33‡ .24‡ .21‡ .26‡PROMT .45‡ – .48? .50 .43‡ .40‡ .39‡ .36‡ .37‡ .31‡ .31‡ .32‡ .27‡ .24‡ .27‡
UEDIN-SYNTAX .50 .52? – .57† .45‡ .43‡ .38‡ .41‡ .39‡ .38‡ .33‡ .33‡ .26‡ .25‡ .22‡ONLINE-A .55? .50 .43† – .51 .42† .48 .41‡ .36‡ .44? .44? .38‡ .32‡ .27‡ .29‡
UEDIN .55‡ .57‡ .55‡ .49 – .52 .45‡ .45‡ .42‡ .43‡ .37‡ .34‡ .29‡ .27‡ .31‡KIT .66‡ .60‡ .57‡ .58† .48 – .48 .45‡ .42‡ .36‡ .39‡ .40‡ .30‡ .29‡ .26‡
STANFORD .63‡ .61‡ .62‡ .52 .55‡ .52 – .50 .44‡ .48 .44‡ .43‡ .34‡ .29‡ .32‡LIMSI-NCODE-SOUL .63‡ .64‡ .59‡ .59‡ .55‡ .55‡ .50 – .44‡ .44‡ .44‡ .47† .40‡ .34‡ .33‡
MES-REORDER .63‡ .63‡ .61‡ .64‡ .58‡ .58‡ .56‡ .56‡ – .50 .46‡ .49 .38‡ .37‡ .34‡JHU .68‡ .69‡ .62‡ .56? .57‡ .64‡ .52 .56‡ .50 – .48? .45‡ .36‡ .37‡ .34‡
CU-ZEMAN .68‡ .69‡ .67‡ .56? .63‡ .61‡ .56‡ .56‡ .54‡ .52? – .48 .40‡ .33‡ .34‡TUBITAK .67‡ .68‡ .67‡ .62‡ .66‡ .60‡ .57‡ .53† .51 .55‡ .52 – .38‡ .40‡ .32‡
UU .76‡ .73‡ .74‡ .68‡ .71‡ .70‡ .66‡ .60‡ .62‡ .64‡ .60‡ .62‡ – .44‡ .46†SHEF-WPROA .79‡ .76‡ .75‡ .73‡ .73‡ .71‡ .71‡ .66‡ .63‡ .63‡ .67‡ .60‡ .56‡ – .47†
RWTH-JANE .74‡ .73‡ .78‡ .71‡ .69‡ .74‡ .68‡ .67‡ .66‡ .66‡ .66‡ .68‡ .54† .53† –score .63 .63 .61 .58 .57 .55 .52 .50 .47 .47 .46 .45 .36 .32 .32rank 1-2 1-2 3 3-5 4-6 5-6 7 8 9-11 9-11 10-12 11-12 13 14-15 14-15
Table 24: Head to head comparison, ignoring ties, for English-German systems

UE
DIN
-HE
AFI
EL
D
UE
DIN
ON
LIN
E-B
LIM
SI-
NC
OD
E-S
OU
L
KIT
ON
LIN
E-A
ME
S-S
IMP
LIF
IED
FR
EN
CH
DC
U
RW
TH
CM
U-T
RE
E-T
O-T
RE
E
CU
-ZE
MA
N
JHU
SH
EF-W
PR
OA
UEDIN-HEAFIELD – .45‡ .46‡ .46‡ .42‡ .42‡ .34‡ .34‡ .29‡ .33‡ .31‡ .28‡ .24‡UEDIN .55‡ – .52? .43‡ .45‡ .46? .40‡ .38‡ .33‡ .36‡ .33‡ .32‡ .23‡
ONLINE-B .54‡ .48? – .49 .46‡ .44‡ .45‡ .40‡ .38‡ .34‡ .36‡ .31‡ .26‡LIMSI-NCODE-SOUL .54‡ .57‡ .51 – .52? .47 .45‡ .42‡ .38‡ .36‡ .34‡ .31‡ .28‡
KIT .58‡ .55‡ .54‡ .48? – .47 .46‡ .44‡ .39‡ .38‡ .37‡ .33‡ .28‡ONLINE-A .58‡ .54? .56‡ .53 .53 – .47 .45† .40‡ .40‡ .39‡ .34‡ .32‡
MES-SIMPLIFIEDFRENCH .66‡ .60‡ .55‡ .55‡ .54‡ .53 – .48? .44‡ .40‡ .39‡ .39‡ .32‡DCU .66‡ .62‡ .60‡ .58‡ .56‡ .55† .52? – .45‡ .45‡ .42‡ .41‡ .36‡
RWTH .71‡ .67‡ .62‡ .62‡ .61‡ .60‡ .56‡ .55‡ – .48? .47† .47? .38‡CMU-TREE-TO-TREE .67‡ .64‡ .66‡ .64‡ .62‡ .60‡ .60‡ .55‡ .52? – .50 .48 .37‡
CU-ZEMAN .69‡ .67‡ .64‡ .66‡ .63‡ .61‡ .61‡ .58‡ .53† .50 – .47† .39‡JHU .72‡ .68‡ .69‡ .69‡ .67‡ .66‡ .61‡ .59‡ .53? .52 .53† – .45‡
SHEF-WPROA .76‡ .77‡ .74‡ .72‡ .72‡ .68‡ .68‡ .64‡ .62‡ .63‡ .61‡ .55‡ –score .63 .60 .59 .57 .56 .54 .51 .48 .43 .42 .42 .38 .32rank 1 2-3 2-3 4-5 4-5 5-6 7 8 9-10 9-11 10-11 12 13
Table 25: Head to head comparison, ignoring ties, for French-English systems
UE
DIN
ON
LIN
E-B
LIM
SI-
NC
OD
E-S
OU
L
KIT
PR
OM
T
STA
NF
OR
D
ME
S
ME
S-I
NFL
EC
TIO
N
RW
TH
-PH
RA
SE
-BA
SE
D-J
AN
E
ON
LIN
E-A
DC
U
CU
-ZE
MA
N
JHU
OM
NIF
LU
EN
T
ITS-L
AT
L
ITS-L
AT
L-P
E
UEDIN – .49 .47? .48 .50 .44‡ .41‡ .40‡ .47? .39‡ .41‡ .35‡ .29‡ .30‡ .27‡ .24‡ONLINE-B .51 – .46‡ .47? .47† .44‡ .49 .43‡ .43‡ .43‡ .38‡ .35‡ .36‡ .28‡ .25‡ .25‡
LIMSI-NCODE-SOUL .53? .54‡ – .45‡ .48 .48 .45‡ .43‡ .44‡ .45† .41‡ .32‡ .34‡ .30‡ .27‡ .27‡KIT .52 .53? .55‡ – .48 .46† .45‡ .43‡ .45‡ .46? .38‡ .30‡ .33‡ .31‡ .29‡ .29‡
PROMT .50 .53† .52 .52 – .50 .48 .52? .45‡ .47 .48? .38‡ .36‡ .36‡ .34‡ .31‡STANFORD .56‡ .56‡ .52 .54† .50 – .52 .48 .44‡ .49 .44‡ .39‡ .34‡ .36‡ .30‡ .29‡
MES .59‡ .51 .55‡ .55‡ .52 .48 – .52 .51 .45? .45‡ .36‡ .37‡ .34‡ .29‡ .29‡MES-INFLECTION .60‡ .57‡ .57‡ .57‡ .48? .52 .48 – .54† .51 .46† .37‡ .35‡ .31‡ .33‡ .31‡
RWTH-PHRASE-BASED-JANE .53? .57‡ .56‡ .55‡ .55‡ .56‡ .49 .46† – .53 .49 .38‡ .36‡ .34‡ .35‡ .31‡ONLINE-A .61‡ .57‡ .55† .54? .53 .51 .55? .49 .47 – .50 .45† .38‡ .38‡ .39‡ .35‡
DCU .59‡ .62‡ .59‡ .62‡ .52? .56‡ .55‡ .54† .51 .50 – .42‡ .40‡ .40‡ .36‡ .35‡CU-ZEMAN .65‡ .65‡ .68‡ .70‡ .62‡ .61‡ .64‡ .63‡ .62‡ .55† .58‡ – .50 .42‡ .41‡ .37‡
JHU .71‡ .64‡ .66‡ .67‡ .64‡ .66‡ .63‡ .65‡ .64‡ .62‡ .60‡ .50 – .47‡ .42‡ .38‡OMNIFLUENT .70‡ .72‡ .70‡ .69‡ .64‡ .64‡ .66‡ .69‡ .66‡ .62‡ .60‡ .58‡ .53‡ – .43‡ .42‡
ITS-LATL .73‡ .75‡ .72‡ .71‡ .66‡ .70‡ .71‡ .67‡ .65‡ .61‡ .64‡ .59‡ .58‡ .57‡ – .45‡ITS-LATL-PE .76‡ .75‡ .73‡ .71‡ .69‡ .71‡ .71‡ .69‡ .69‡ .65‡ .65‡ .63‡ .62‡ .58‡ .55‡ –
score .60 .60 .58 .58 .55 .55 .54 .53 .53 .51 .49 .42 .40 .38 .35 .32rank 1-2 1-3 2-4 3-4 5-7 5-8 5-8 6-9 7-10 9-11 10-11 12 13 14 15 16
Table 26: Head to head comparison, ignoring ties, for English-French systems
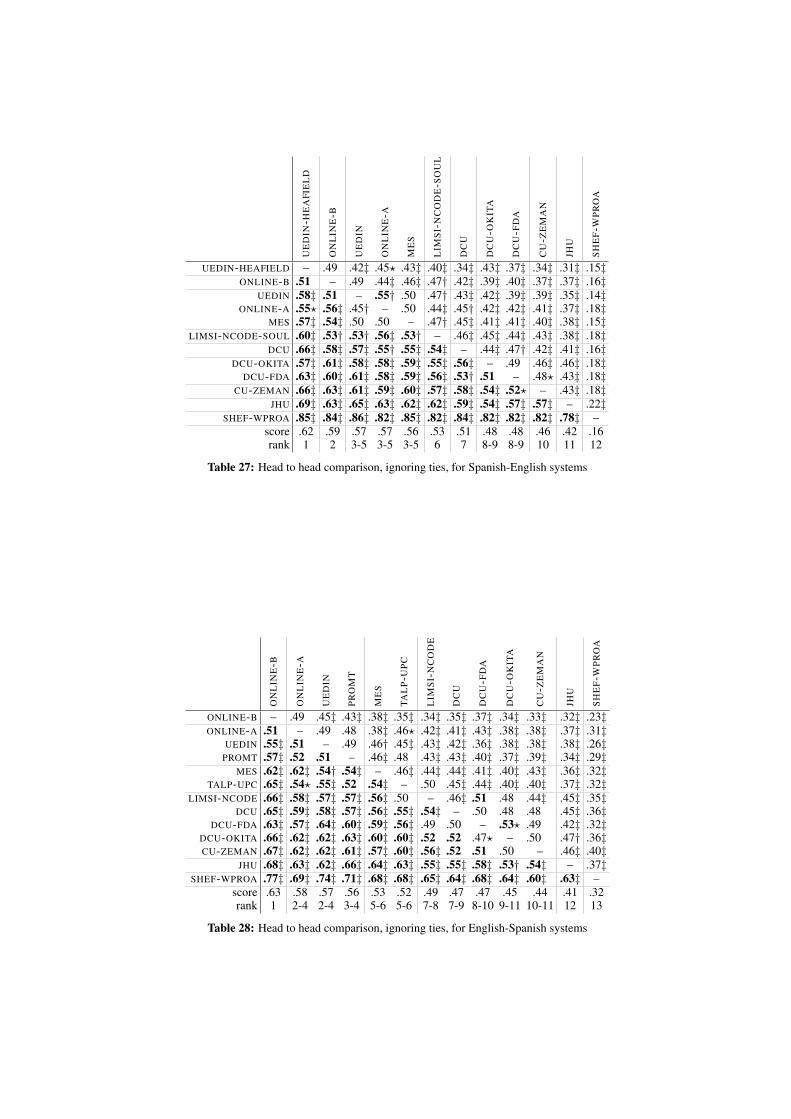
UE
DIN
-HE
AFI
EL
D
ON
LIN
E-B
UE
DIN
ON
LIN
E-A
ME
S
LIM
SI-
NC
OD
E-S
OU
L
DC
U
DC
U-O
KIT
A
DC
U-F
DA
CU
-ZE
MA
N
JHU
SH
EF-W
PR
OA
UEDIN-HEAFIELD – .49 .42‡ .45? .43‡ .40‡ .34‡ .43‡ .37‡ .34‡ .31‡ .15‡ONLINE-B .51 – .49 .44‡ .46‡ .47† .42‡ .39‡ .40‡ .37‡ .37‡ .16‡
UEDIN .58‡ .51 – .55† .50 .47† .43‡ .42‡ .39‡ .39‡ .35‡ .14‡ONLINE-A .55? .56‡ .45† – .50 .44‡ .45† .42‡ .42‡ .41‡ .37‡ .18‡
MES .57‡ .54‡ .50 .50 – .47† .45‡ .41‡ .41‡ .40‡ .38‡ .15‡LIMSI-NCODE-SOUL .60‡ .53† .53† .56‡ .53† – .46‡ .45‡ .44‡ .43‡ .38‡ .18‡
DCU .66‡ .58‡ .57‡ .55† .55‡ .54‡ – .44‡ .47† .42‡ .41‡ .16‡DCU-OKITA .57‡ .61‡ .58‡ .58‡ .59‡ .55‡ .56‡ – .49 .46‡ .46‡ .18‡
DCU-FDA .63‡ .60‡ .61‡ .58‡ .59‡ .56‡ .53† .51 – .48? .43‡ .18‡CU-ZEMAN .66‡ .63‡ .61‡ .59‡ .60‡ .57‡ .58‡ .54‡ .52? – .43‡ .18‡
JHU .69‡ .63‡ .65‡ .63‡ .62‡ .62‡ .59‡ .54‡ .57‡ .57‡ – .22‡SHEF-WPROA .85‡ .84‡ .86‡ .82‡ .85‡ .82‡ .84‡ .82‡ .82‡ .82‡ .78‡ –
score .62 .59 .57 .57 .56 .53 .51 .48 .48 .46 .42 .16rank 1 2 3-5 3-5 3-5 6 7 8-9 8-9 10 11 12
Table 27: Head to head comparison, ignoring ties, for Spanish-English systems
ON
LIN
E-B
ON
LIN
E-A
UE
DIN
PR
OM
T
ME
S
TAL
P-U
PC
LIM
SI-
NC
OD
E
DC
U
DC
U-F
DA
DC
U-O
KIT
A
CU
-ZE
MA
N
JHU
SH
EF-W
PR
OA
ONLINE-B – .49 .45‡ .43‡ .38‡ .35‡ .34‡ .35‡ .37‡ .34‡ .33‡ .32‡ .23‡ONLINE-A .51 – .49 .48 .38‡ .46? .42‡ .41‡ .43‡ .38‡ .38‡ .37‡ .31‡
UEDIN .55‡ .51 – .49 .46† .45‡ .43‡ .42‡ .36‡ .38‡ .38‡ .38‡ .26‡PROMT .57‡ .52 .51 – .46‡ .48 .43‡ .43‡ .40‡ .37‡ .39‡ .34‡ .29‡
MES .62‡ .62‡ .54† .54‡ – .46‡ .44‡ .44‡ .41‡ .40‡ .43‡ .36‡ .32‡TALP-UPC .65‡ .54? .55‡ .52 .54‡ – .50 .45‡ .44‡ .40‡ .40‡ .37‡ .32‡
LIMSI-NCODE .66‡ .58‡ .57‡ .57‡ .56‡ .50 – .46‡ .51 .48 .44‡ .45‡ .35‡DCU .65‡ .59‡ .58‡ .57‡ .56‡ .55‡ .54‡ – .50 .48 .48 .45‡ .36‡
DCU-FDA .63‡ .57‡ .64‡ .60‡ .59‡ .56‡ .49 .50 – .53? .49 .42‡ .32‡DCU-OKITA .66‡ .62‡ .62‡ .63‡ .60‡ .60‡ .52 .52 .47? – .50 .47† .36‡CU-ZEMAN .67‡ .62‡ .62‡ .61‡ .57‡ .60‡ .56‡ .52 .51 .50 – .46‡ .40‡
JHU .68‡ .63‡ .62‡ .66‡ .64‡ .63‡ .55‡ .55‡ .58‡ .53† .54‡ – .37‡SHEF-WPROA .77‡ .69‡ .74‡ .71‡ .68‡ .68‡ .65‡ .64‡ .68‡ .64‡ .60‡ .63‡ –
score .63 .58 .57 .56 .53 .52 .49 .47 .47 .45 .44 .41 .32rank 1 2-4 2-4 3-4 5-6 5-6 7-8 7-9 8-10 9-11 10-11 12 13
Table 28: Head to head comparison, ignoring ties, for English-Spanish systems

ON
LIN
E-B
CM
U
ON
LIN
E-A
ON
LIN
E-G
PR
OM
T
QC
RI-
ME
S
UC
AM
-MU
LTIF
RO
NT
EN
D
BA
LA
GU
R
ME
S-Q
CR
I
UE
DIN
OM
NIF
LU
EN
T-U
NC
NS
TR
LIA
OM
NIF
LU
EN
T-C
NS
TR
UM
D
CU
-KA
RE
L
CO
MM
ER
CIA
L-3
UE
DIN
-SY
NTA
X
JHU
CU
-ZE
MA
N
ONLINE-B – .40‡ .42‡ .41‡ .37‡ .37‡ .41‡ .33‡ .33‡ .37‡ .33‡ .33‡ .35‡ .38‡ .34‡ .33‡ .29‡ .28‡ .14‡CMU .60‡ – .50 .46† .43‡ .47† .42‡ .42‡ .39‡ .43‡ .41‡ .41‡ .40‡ .38‡ .36‡ .30‡ .30‡ .29‡ .17‡
ONLINE-A .58‡ .50 – .50 .51 .43‡ .47? .44‡ .40‡ .41‡ .43‡ .38‡ .40‡ .38‡ .38‡ .39‡ .34‡ .30‡ .19‡ONLINE-G .59‡ .54† .50 – .55† .50 .51 .48 .42‡ .41‡ .44‡ .43‡ .46† .40‡ .44‡ .36‡ .34‡ .33‡ .19‡
PROMT .63‡ .57‡ .49 .45† – .43‡ .47† .43‡ .47† .47† .43‡ .39‡ .44‡ .43‡ .37‡ .41‡ .40‡ .38‡ .25‡QCRI-MES .63‡ .53† .57‡ .50 .57‡ – .48 .46† .47? .45‡ .43‡ .45‡ .45‡ .38‡ .42‡ .37‡ .33‡ .40‡ .19‡
UCAM-MULTIFRONTEND .59‡ .58‡ .53? .49 .53† .52 – .47† .48 .46‡ .46‡ .42‡ .45‡ .46‡ .45‡ .40‡ .39‡ .33‡ .17‡BALAGUR .67‡ .58‡ .56‡ .52 .57‡ .54† .53† – .47† .49 .45‡ .53? .40‡ .44‡ .44‡ .41‡ .36‡ .33‡ .23‡MES-QCRI .67‡ .61‡ .60‡ .58‡ .53† .53? .52 .53† – .49 .47† .47? .43‡ .43‡ .44‡ .38‡ .42‡ .39‡ .17‡
UEDIN .63‡ .57‡ .59‡ .59‡ .53† .55‡ .54‡ .51 .51 – .48 .52 .44‡ .52 .49 .42‡ .43‡ .35‡ .21‡OMNIFLUENT-UNCNSTR .67‡ .59‡ .57‡ .56‡ .57‡ .57‡ .54‡ .55‡ .53† .52 – .51 .46† .48 .48 .44‡ .40‡ .39‡ .25‡
LIA .67‡ .59‡ .62‡ .57‡ .61‡ .55‡ .58‡ .47? .53? .48 .49 – .51 .49 .48 .50 .41‡ .39‡ .20‡OMNIFLUENT-CNSTR .65‡ .60‡ .60‡ .54† .56‡ .55‡ .55‡ .60‡ .57‡ .56‡ .54† .49 – .51 .48 .47? .40‡ .40‡ .25‡
UMD .62‡ .62‡ .62‡ .60‡ .57‡ .62‡ .54‡ .56‡ .57‡ .48 .52 .51 .49 – .53† .42‡ .46‡ .42‡ .19‡CU-KAREL .66‡ .64‡ .62‡ .56‡ .63‡ .58‡ .55‡ .56‡ .56‡ .51 .52 .52 .52 .47† – .44‡ .40‡ .47? .24‡
COMMERCIAL-3 .67‡ .70‡ .61‡ .64‡ .59‡ .63‡ .60‡ .59‡ .62‡ .58‡ .56‡ .50 .53? .58‡ .56‡ – .51 .44‡ .32‡UEDIN-SYNTAX .71‡ .70‡ .66‡ .66‡ .60‡ .67‡ .61‡ .64‡ .58‡ .57‡ .60‡ .59‡ .60‡ .54‡ .60‡ .49 – .45‡ .25‡
JHU .72‡ .71‡ .70‡ .67‡ .62‡ .60‡ .67‡ .67‡ .61‡ .65‡ .61‡ .61‡ .60‡ .58‡ .53? .56‡ .55‡ – .24‡CU-ZEMAN .86‡ .83‡ .81‡ .81‡ .75‡ .81‡ .83‡ .77‡ .83‡ .79‡ .75‡ .80‡ .75‡ .81‡ .76‡ .68‡ .75‡ .76‡ –
score .65 .60 .58 .56 .56 .55 .54 .52 .51 .50 .49 .49 .48 .48 .47 .43 .41 .39 .21rank 1 2-3 2-3 4-6 4-6 5-7 5-7 8-9 8-10 9-11 10-12 11-14 12-15 12-15 13-15 16 17 18 19
Table 29: Head to head comparison, ignoring ties, for Russian-English systems
PR
OM
T
ON
LIN
E-B
CM
U
ON
LIN
E-G
ON
LIN
E-A
UE
DIN
QC
RI-
ME
S
CU
-KA
RE
L
ME
S-Q
CR
I
JHU
CO
MM
ER
CIA
L-3
LIA
BA
LA
GU
R
CU
-ZE
MA
N
PROMT – .44‡ .39‡ .47 .46? .36‡ .37‡ .37‡ .32‡ .35‡ .28‡ .30‡ .32‡ .24‡ONLINE-B .56‡ – .44‡ .41‡ .44† .38‡ .37‡ .35‡ .33‡ .39‡ .33‡ .31‡ .35‡ .24‡
CMU .61‡ .56‡ – .52 .49 .47† .43‡ .41‡ .39‡ .44‡ .44‡ .40‡ .35‡ .28‡ONLINE-G .53 .59‡ .48 – .48 .50 .48 .46 .46? .42‡ .38‡ .43‡ .38‡ .36‡ONLINE-A .54? .56† .51 .52 – .47 .49 .49 .48 .44† .38‡ .40‡ .40‡ .34‡
UEDIN .64‡ .62‡ .53† .50 .53 – .49 .46† .42‡ .39‡ .44‡ .41‡ .38‡ .29‡QCRI-MES .63‡ .63‡ .57‡ .52 .51 .51 – .48 .45‡ .44‡ .42‡ .39‡ .40‡ .29‡
CU-KAREL .63‡ .65‡ .59‡ .54 .51 .54† .52 – .50 .46† .43‡ .40‡ .42‡ .34‡MES-QCRI .68‡ .67‡ .61‡ .54? .52 .58‡ .55‡ .50 – .48? .47‡ .43‡ .45‡ .34‡
JHU .65‡ .61‡ .56‡ .58‡ .56† .61‡ .56‡ .54† .52? – .51 .44‡ .44‡ .33‡COMMERCIAL-3 .72‡ .67‡ .56‡ .62‡ .62‡ .56‡ .58‡ .57‡ .53‡ .49 – .52 .48 .44‡
LIA .70‡ .69‡ .60‡ .57‡ .60‡ .59‡ .61‡ .60‡ .57‡ .56‡ .48 – .47† .41‡BALAGUR .68‡ .65‡ .65‡ .62‡ .60‡ .62‡ .60‡ .58‡ .55‡ .56‡ .52 .53† – .41‡
CU-ZEMAN .76‡ .76‡ .72‡ .64‡ .66‡ .71‡ .71‡ .66‡ .66‡ .67‡ .56‡ .59‡ .59‡ –score .64 .62 .55 .54 .53 .53 .52 .49 .47 .46 .43 .42 .41 .33rank 1 2 3-4 3-6 3-7 4-7 5-7 8 9-10 9-10 11-12 11-13 12-13 14
Table 30: Head to head comparison, ignoring ties, for English-Russian systems