findings of the 2012 workshop on statistical machine ... · proceedings of the 7th workshop on...
TRANSCRIPT
Proceedings of the 7th Workshop on Statistical Machine Translation, pages 10–51,Montreal, Canada, June 7-8, 2012. c©2012 Association for Computational Linguistics
Findings of the 2012 Workshop on Statistical Machine Translation
Chris Callison-BurchJohns Hopkins University
Philipp KoehnUniversity of Edinburgh
Christof MonzUniversity of Amsterdam
Matt PostJohns Hopkins University
Radu SoricutSDL Language Weaver
Lucia SpeciaUniversity of Sheffield
Abstract
This paper presents the results of the WMT12shared tasks, which included a translationtask, a task for machine translation evaluationmetrics, and a task for run-time estimation ofmachine translation quality. We conducted alarge-scale manual evaluation of 103 machinetranslation systems submitted by 34 teams.We used the ranking of these systems to mea-sure how strongly automatic metrics correlatewith human judgments of translation qualityfor 12 evaluation metrics. We introduced anew quality estimation task this year, and eval-uated submissions from 11 teams.
1 Introduction
This paper presents the results of the shared tasksof the Workshop on statistical Machine Translation(WMT), which was held at NAACL 2012. Thisworkshop builds on six previous WMT workshops(Koehn and Monz, 2006; Callison-Burch et al.,2007; Callison-Burch et al., 2008; Callison-Burchet al., 2009; Callison-Burch et al., 2010; Callison-Burch et al., 2011). In the past, the workshops havefeatured a number of shared tasks: a translation taskbetween English and other languages, a task for au-tomatic evaluation metrics to predict human judg-ments of translation quality, and a system combina-tion task to get better translation quality by combin-ing the outputs of multiple translation systems. Thisyear we discontinued the system combination task,and introduced a new task in its place:
• Quality estimation task – Structured predic-tion tasks like MT are difficult, but the dif-
ficulty is not uniform across all input types.It would thus be useful to have some mea-sure of confidence in the quality of the output,which has potential usefulness in a range of set-tings, such as deciding whether output needshuman post-editing or selecting the best trans-lation from outputs from a number of systems.This shared task focused on sentence-level es-timation, and challenged participants to ratethe quality of sentences produced by a stan-dard Moses translation system on an English-Spanish news corpus in one of two tasks:ranking and scoring. Predictions were scoredagainst a blind test set manually annotated withrelevant quality judgments.
The primary objectives of WMT are to evaluatethe state of the art in machine translation, to dissem-inate common test sets and public training data withpublished performance numbers, and to refine eval-uation methodologies for machine translation. Aswith previous workshops, all of the data, transla-tions, and collected human judgments are publiclyavailable.1 We hope these datasets form a valuableresource for research into statistical machine transla-tion, system combination, and automatic evaluationor automatic prediction of translation quality.
2 Overview of the Shared Translation Task
The recurring task of the workshop examines trans-lation between English and four other languages:German, Spanish, French, and Czech. We created a
1http://statmt.org/wmt12/results.html
10

test set for each language pair by translating newspa-per articles. We additionally provided training dataand two baseline systems.
2.1 Test data
The test data for this year’s task was created by hir-ing people to translate news articles that were drawnfrom a variety of sources from November 15, 2011.A total of 99 articles were selected, in roughly equalamounts from a variety of Czech, English, French,German, and Spanish news sites:2
Czech: Blesk (1), CTK (1), E15 (1), denık (4),iDNES.cz (3), iHNed.cz (3), Ukacko (2),Zheny (1)
French: Canoe (3), Croix (3), Le Devoir (3), LesEchos (3), Equipe (2), Le Figaro (3), Libera-tion (3)
Spanish: ABC.es (4), Milenio (4), Noroeste (4),Nacion (3), El Pais (3), El Periodico (3), PrensaLibre (3), El Universal (4)
English: CNN (3), Fox News (2), Los AngelesTimes (3), New York Times (3), Newsweek (1),Time (3), Washington Post (3)
German: Berliner Kurier (1), FAZ (3), GiessenerAllgemeine (2), Morgenpost (3), Spiegel (3),Welt (3)
The translations were created by the professionaltranslation agency CEET.3 All of the translationswere done directly, and not via an intermediate lan-guage.
Although the translations were done profession-ally, we observed a number of errors. These errorsranged from minor typographical mistakes (I wasterrible. . . instead of It was terrible. . . ) to moreserious errors of incorrect verb choices and nonsen-sical constructions. An example of the latter is theFrench sentence (translated from German):
Il a gratte une planche de beton, perdit despieces du vehicule.(He scraped against a concrete crash bar-rier and lost parts of the car.)
2For more details see the XML test files. The docid taggives the source and the date for each document in the test set,and the origlang tag indicates the original source language.
3http://www.ceet.eu/
Here, the French verb gratter is incorrect, and thephrase planche de beton does not make any sense.
We did not quantify errors, but collected a numberof examples during the course of the manual evalua-tion. These errors were present in the data availableto all the systems and therefore did not bias the re-sults, but we suggest that next year a manual reviewof the professionally-collected translations be takenprior to releasing the data in order to correct mis-takes and provide feedback to the translation agency.
2.2 Training data
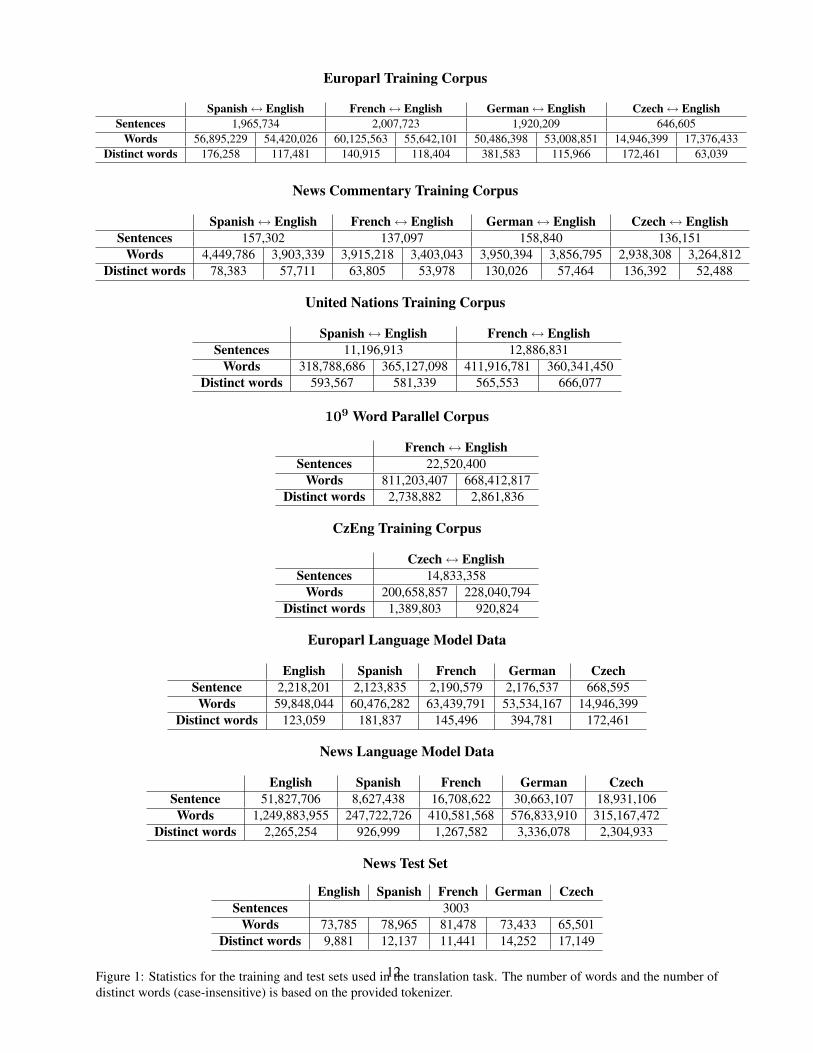
As in past years we provided parallel corpora to traintranslation models, monolingual corpora to train lan-guage models, and development sets to tune systemparameters. Some statistics about the training mate-rials are given in Figure 1.
2.3 Submitted systems
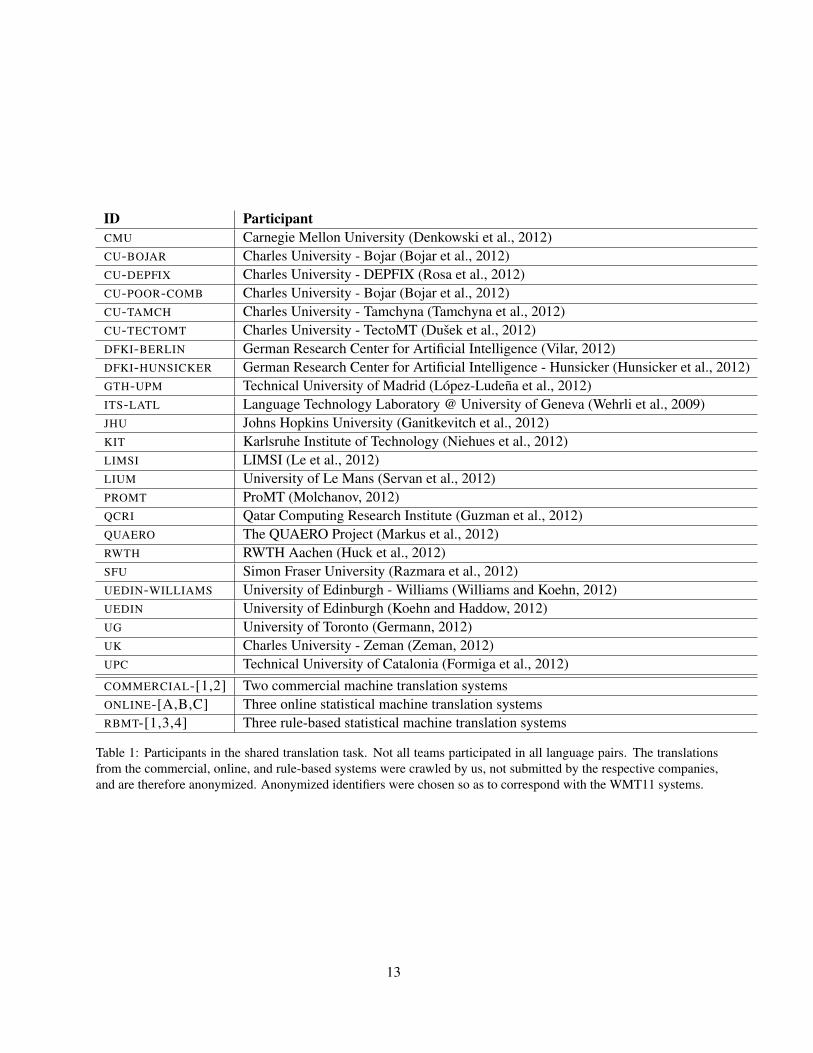
We received submissions from 34 groups across 18institutions. The participants are listed in Table 1.We also included two commercial off-the-shelf MTsystems, three online statistical MT systems, andthree online rule-based MT systems. Not all systemssupported all language pairs. We note that the eightcompanies that developed these systems did not sub-mit entries themselves, but were instead gathered bytranslating the test data via their interfaces (web orPC).4 They are therefore anonymized in this paper.The data used to construct these systems is not sub-ject to the same constraints as the shared task partic-ipants. It is possible that part of the reference trans-lations that were taken from online news sites couldhave been included in the systems’ models, for in-stance. We therefore categorize all commercial sys-tems as unconstrained when evaluating the results.
3 Human Evaluation
As with past workshops, we placed greater empha-sis on the human evaluation than on the automaticevaluation metric scores. It is our contention thatautomatic measures are an imperfect substitute forhuman assessment of translation quality. Therefore,we define the manual evaluation to be primary, and
4We would like to thank Ondrej Bojar for harvesting thecommercial entries, Christian Federmann for the statistical MTentries, and Herve Saint-Amand for the rule-based MT entries.
11
Europarl Training Corpus
Spanish↔ English French↔ English German↔ English Czech↔ EnglishSentences 1,965,734 2,007,723 1,920,209 646,605
Words 56,895,229 54,420,026 60,125,563 55,642,101 50,486,398 53,008,851 14,946,399 17,376,433Distinct words 176,258 117,481 140,915 118,404 381,583 115,966 172,461 63,039
News Commentary Training Corpus
Spanish↔ English French↔ English German↔ English Czech↔ EnglishSentences 157,302 137,097 158,840 136,151
Words 4,449,786 3,903,339 3,915,218 3,403,043 3,950,394 3,856,795 2,938,308 3,264,812Distinct words 78,383 57,711 63,805 53,978 130,026 57,464 136,392 52,488
United Nations Training Corpus
Spanish↔ English French↔ EnglishSentences 11,196,913 12,886,831
Words 318,788,686 365,127,098 411,916,781 360,341,450Distinct words 593,567 581,339 565,553 666,077
109 Word Parallel Corpus
French↔ EnglishSentences 22,520,400
Words 811,203,407 668,412,817Distinct words 2,738,882 2,861,836
CzEng Training Corpus
Czech↔ EnglishSentences 14,833,358
Words 200,658,857 228,040,794Distinct words 1,389,803 920,824
Europarl Language Model Data
English Spanish French German CzechSentence 2,218,201 2,123,835 2,190,579 2,176,537 668,595Words 59,848,044 60,476,282 63,439,791 53,534,167 14,946,399
Distinct words 123,059 181,837 145,496 394,781 172,461
News Language Model Data
English Spanish French German CzechSentence 51,827,706 8,627,438 16,708,622 30,663,107 18,931,106Words 1,249,883,955 247,722,726 410,581,568 576,833,910 315,167,472
Distinct words 2,265,254 926,999 1,267,582 3,336,078 2,304,933
News Test Set
English Spanish French German CzechSentences 3003
Words 73,785 78,965 81,478 73,433 65,501Distinct words 9,881 12,137 11,441 14,252 17,149
Figure 1: Statistics for the training and test sets used in the translation task. The number of words and the number ofdistinct words (case-insensitive) is based on the provided tokenizer.
12
ID ParticipantCMU Carnegie Mellon University (Denkowski et al., 2012)CU-BOJAR Charles University - Bojar (Bojar et al., 2012)CU-DEPFIX Charles University - DEPFIX (Rosa et al., 2012)CU-POOR-COMB Charles University - Bojar (Bojar et al., 2012)CU-TAMCH Charles University - Tamchyna (Tamchyna et al., 2012)CU-TECTOMT Charles University - TectoMT (Dusek et al., 2012)DFKI-BERLIN German Research Center for Artificial Intelligence (Vilar, 2012)DFKI-HUNSICKER German Research Center for Artificial Intelligence - Hunsicker (Hunsicker et al., 2012)GTH-UPM Technical University of Madrid (Lopez-Ludena et al., 2012)ITS-LATL Language Technology Laboratory @ University of Geneva (Wehrli et al., 2009)JHU Johns Hopkins University (Ganitkevitch et al., 2012)KIT Karlsruhe Institute of Technology (Niehues et al., 2012)LIMSI LIMSI (Le et al., 2012)LIUM University of Le Mans (Servan et al., 2012)PROMT ProMT (Molchanov, 2012)QCRI Qatar Computing Research Institute (Guzman et al., 2012)QUAERO The QUAERO Project (Markus et al., 2012)RWTH RWTH Aachen (Huck et al., 2012)SFU Simon Fraser University (Razmara et al., 2012)UEDIN-WILLIAMS University of Edinburgh - Williams (Williams and Koehn, 2012)UEDIN University of Edinburgh (Koehn and Haddow, 2012)UG University of Toronto (Germann, 2012)UK Charles University - Zeman (Zeman, 2012)UPC Technical University of Catalonia (Formiga et al., 2012)COMMERCIAL-[1,2] Two commercial machine translation systemsONLINE-[A,B,C] Three online statistical machine translation systemsRBMT-[1,3,4] Three rule-based statistical machine translation systems
Table 1: Participants in the shared translation task. Not all teams participated in all language pairs. The translationsfrom the commercial, online, and rule-based systems were crawled by us, not submitted by the respective companies,and are therefore anonymized. Anonymized identifiers were chosen so as to correspond with the WMT11 systems.
13

Language Pair Num Label Labels perSystems Count System
Czech-English 6 6,470 1,078.3English-Czech 13 11,540 887.6German-English 16 7,135 445.9English-German 15 8,760 584.0Spanish-English 12 5,705 475.4English-Spanish 11 7,375 670.4French-English 15 6,975 465.0English-French 15 7,735 515.6Overall 103 61,695 598
Table 2: A summary of the WMT12 ranking task, show-ing the number of systems and number of labels (rank-ings) collected for each of the language translation tasks.
use the human judgments to validate automatic met-rics.
Manual evaluation is time consuming, and it re-quires a large effort to conduct on the scale of ourworkshop. We distributed the workload across anumber of people, beginning with shared-task par-ticipants and interested volunteers. This year, wealso opened up the evaluation to non-expert anno-tators hired on Amazon Mechanical Turk (Callison-Burch, 2009). To ensure that the Turkers providedhigh quality annotations, we used controls con-structed from the machine translation ranking tasksfrom prior years. Control items were selected suchthat there was high agreement across the system de-velopers who completed that item. In all, there were229 people who participated in the manual evalua-tion, with 91 workers putting in more than an hour’sworth of effort, and 21 putting in more than fourhours. After filtering Turker rankings against thecontrols to discard Turkers who fell below a thresh-old level of agreement on the control questions,there was a collective total of 336 hours of usablelabor. This is similar to the total of 361 hours oflabor collected for WMT11.
We asked annotators to evaluate system outputsby ranking translated sentences relative to eachother. This was our official determinant of trans-lation quality. The total number of judgments col-lected for each of the language pairs is given in Ta-ble 2.
3.1 Ranking translations of sentences
Ranking translations relative to each other is a rea-sonably intuitive task. We therefore kept the instruc-tions simple:
You are shown a source sentence followedby several candidate translations.Your task is to rank the translations frombest to worst (ties are allowed).
Each screen for this task involved judging trans-lations of three consecutive source segments. Foreach source segment, the annotator was shown theoutputs of five submissions, and asked to rank them.We refer to each of these as ranking tasks or some-times blocks.
Every language task had more than five partici-pating systems — up to a maximum of 16 for theGerman-English task. Rather than attempting to geta complete ordering over the systems in each rank-ing task, we instead relied on random selection anda reasonably large sample size to make the compar-isons fair.
We use the collected rank labels to assign eachsystem a score that reflects how highly that systemwas usually ranked by the annotators. The score forsome systemA reflects how frequently it was judgedto be better than other systems. Specifically, eachblock in whichA appears includes four implicit pair-wise comparisons (against the other presented sys-tems). A is rewarded once for each of the four com-parisons in which A wins, and its score is the num-ber of such winning pairwise comparisons, dividedby the total number of non-tying pairwise compar-isons involving A.
This scoring metric is different from that used inprior years in two ways. First, the score previouslyincluded ties between system rankings. In that case,the score for A reflected how often A was rated asbetter than or equal to other systems, and was nor-malized by all comparisons involving A. However,this approach unfairly rewards systems that are sim-ilar (and likely to be ranked as tied). This is prob-lematic since many of the systems use variations ofthe same underlying decoder (Bojar et al., 2011).
A second difference is that this year we no longerinclude comparisons against reference translations.In the past, reference translations were included
14
among the systems to be ranked as controls, andthe pairwise comparisons were used in determin-ing the best system. However, workers have a veryclear preference for reference translations, so includ-ing them unduly penalized systems that, through(un)luck of the draw, were pitted against the ref-erences more often. These changes are part of abroader discussion of the best way to produce thesystem ranking, which we discuss at length in Sec-tion 4.
The system scores are reported in Section 3.3.Appendix A provides detailed tables that containpairwise head-to-head comparisons between pairs ofsystems.
3.2 Inter- and Intra-annotator agreement inthe ranking task
Each year we calculate the inter- and intra-annotatoragreement for the human evaluation, since a reason-able degree of agreement must exist to support ourprocess as a valid evaluation setup. To ensure wehad enough data to measure agreement, we occa-sionally showed annotators items that were repeatedfrom previously completed items. These repeateditems were drawn from ones completed by the sameannotator and from different annotators.
We measured pairwise agreement among anno-tators using Cohen’s kappa coefficient (κ) (Cohen,1960), which is defined as
κ =P (A)− P (E)
1− P (E)
where P (A) is the proportion of times that the anno-tators agree, and P (E) is the proportion of time thatthey would agree by chance. Note that κ is basicallya normalized version of P (A), one which takes intoaccount how meaningful it is for annotators to agreewith each other, by incorporating P (E). Note alsothat κ has a value of at most 1 (and could possiblybe negative), with higher rates of agreement result-ing in higher κ.
We calculate P (A) by examining all pairs ofsystems which had been judged by two or morejudges, and calculating the proportion of time thatthey agreed that A > B, A = B, or A < B. Inother words, P (A) is the empirical, observed rate atwhich annotators agree, in the context of pairwise
comparisons. P (A) is computed similarly for intra-annotator agreement (i.e. self-consistency), but overpairwise comparisons that were annotated more thanonce by a single annotator.
As for P (E), it should capture the probability thattwo annotators would agree randomly. Therefore:
P (E) = P (A>B)2 + P (A=B)2 + P (A<B)2
Note that each of the three probabilities in P (E)’sdefinition are squared to reflect the fact that we areconsidering the chance that two annotators wouldagree by chance. Each of these probabilities is com-puted empirically, by observing how often annota-tors actually rank two systems as being tied. Wenote here that this empirical computation is a depar-ture from previous years’ analyses, where we hadassumed that the three categories are equally likely(yielding P (E) = 1
9 + 19 + 1
9 = 13 ). We believe that
this is a more principled approach, which faithfullyreflects the motivation of accounting for P (E) in thefirst place.
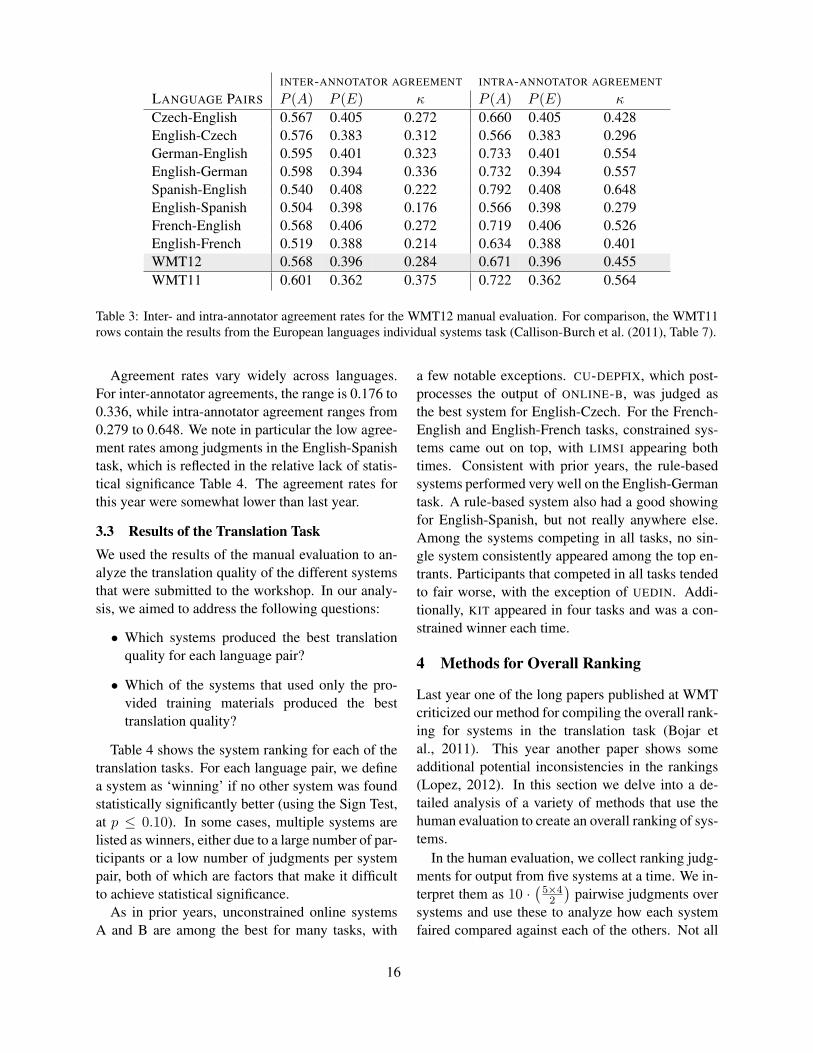
Table 3 gives κ values for inter-annotator andintra-annotator agreement. These give an indica-tion of how often different judges agree, and howoften single judges are consistent for repeated judg-ments, respectively. The exact interpretation of thekappa coefficient is difficult, but according to Lan-dis and Koch (1977), 0 − 0.2 is slight, 0.2 − 0.4is fair, 0.4 − 0.6 is moderate, 0.6 − 0.8 is sub-stantial, and 0.8 − 1.0 is almost perfect. Based onthese interpretations, the agreement for sentence-level ranking is fair for inter-annotator and moder-ate for intra-annotator agreement. Consistent withprevious years, intra-annotator agreement is higherthan inter-annotator agreement, except for English–Czech.
An important difference from last year is that theevaluations were not constrained only to workshopparticipants, but were made available to all Turk-ers. The workshop participants were trusted to com-plete the tasks in good faith, and we have multipleyears of data establishing general levels of inter- andintra-annotator agreement. Their HITs were unpaid,and access was limited with the use of a qualifica-tion. The Turkers completed paid tasks, and we usedcontrols to filter out fraudulent and unconscientiousworkers.
15
INTER-ANNOTATOR AGREEMENT INTRA-ANNOTATOR AGREEMENT
LANGUAGE PAIRS P (A) P (E) κ P (A) P (E) κ
Czech-English 0.567 0.405 0.272 0.660 0.405 0.428English-Czech 0.576 0.383 0.312 0.566 0.383 0.296German-English 0.595 0.401 0.323 0.733 0.401 0.554English-German 0.598 0.394 0.336 0.732 0.394 0.557Spanish-English 0.540 0.408 0.222 0.792 0.408 0.648English-Spanish 0.504 0.398 0.176 0.566 0.398 0.279French-English 0.568 0.406 0.272 0.719 0.406 0.526English-French 0.519 0.388 0.214 0.634 0.388 0.401WMT12 0.568 0.396 0.284 0.671 0.396 0.455WMT11 0.601 0.362 0.375 0.722 0.362 0.564
Table 3: Inter- and intra-annotator agreement rates for the WMT12 manual evaluation. For comparison, the WMT11rows contain the results from the European languages individual systems task (Callison-Burch et al. (2011), Table 7).
Agreement rates vary widely across languages.For inter-annotator agreements, the range is 0.176 to0.336, while intra-annotator agreement ranges from0.279 to 0.648. We note in particular the low agree-ment rates among judgments in the English-Spanishtask, which is reflected in the relative lack of statis-tical significance Table 4. The agreement rates forthis year were somewhat lower than last year.
3.3 Results of the Translation TaskWe used the results of the manual evaluation to an-alyze the translation quality of the different systemsthat were submitted to the workshop. In our analy-sis, we aimed to address the following questions:
• Which systems produced the best translationquality for each language pair?
• Which of the systems that used only the pro-vided training materials produced the besttranslation quality?
Table 4 shows the system ranking for each of thetranslation tasks. For each language pair, we definea system as ‘winning’ if no other system was foundstatistically significantly better (using the Sign Test,at p ≤ 0.10). In some cases, multiple systems arelisted as winners, either due to a large number of par-ticipants or a low number of judgments per systempair, both of which are factors that make it difficultto achieve statistical significance.
As in prior years, unconstrained online systemsA and B are among the best for many tasks, with
a few notable exceptions. CU-DEPFIX, which post-processes the output of ONLINE-B, was judged asthe best system for English-Czech. For the French-English and English-French tasks, constrained sys-tems came out on top, with LIMSI appearing bothtimes. Consistent with prior years, the rule-basedsystems performed very well on the English-Germantask. A rule-based system also had a good showingfor English-Spanish, but not really anywhere else.Among the systems competing in all tasks, no sin-gle system consistently appeared among the top en-trants. Participants that competed in all tasks tendedto fair worse, with the exception of UEDIN. Addi-tionally, KIT appeared in four tasks and was a con-strained winner each time.
4 Methods for Overall Ranking
Last year one of the long papers published at WMTcriticized our method for compiling the overall rank-ing for systems in the translation task (Bojar etal., 2011). This year another paper shows someadditional potential inconsistencies in the rankings(Lopez, 2012). In this section we delve into a de-tailed analysis of a variety of methods that use thehuman evaluation to create an overall ranking of sys-tems.
In the human evaluation, we collect ranking judg-ments for output from five systems at a time. We in-terpret them as 10 ·
(5×42
)pairwise judgments over
systems and use these to analyze how each systemfaired compared against each of the others. Not all
16

Czech-English3,603–3,718 comparisons/system
System C? >othersONLINE-B • N 0.65UEDIN ? Y 0.60CU-BOJAR Y 0.53ONLINE-A N 0.53UK Y 0.37JHU Y 0.32
Spanish-English1,527–1,775 comparisons/system
System C? >othersONLINE-A • N 0.62ONLINE-B • N 0.61QCRI ? Y 0.60UEDIN •? Y 0.58UPC Y 0.57GTH-UPM Y 0.52RBMT-3 N 0.51JHU Y 0.48RBMT-4 N 0.46RBMT-1 N 0.42ONLINE-C N 0.42UK Y 0.19
French-English1,437–1,701 comparisons/system
System C? >othersLIMSI •? Y 0.63KIT •? Y 0.61ONLINE-A • N 0.59CMU •? Y 0.57ONLINE-B • N 0.57UEDIN Y 0.55LIUM Y 0.52RWTH Y 0.52RBMT-1 N 0.46RBMT-3 N 0.46UK Y 0.44SFU Y 0.44RBMT-4 N 0.43JHU Y 0.41ONLINE-C N 0.32
English-Czech2,652–3,146 comparisons/system
System C? >othersCU-DEPFIX • N 0.66ONLINE-B N 0.63UEDIN ? Y 0.56CU-TAMCH N 0.56CU-BOJAR ? Y 0.54CU-TECTOMT ? Y 0.53ONLINE-A N 0.53COMMERCIAL-1 N 0.48COMMERCIAL-2 N 0.46CU-POOR-COMB Y 0.44UK Y 0.44SFU Y 0.36JHU Y 0.32
English-Spanish2,013–2,294 comparisons/system
System C? >othersONLINE-B • N 0.65RBMT-3 N 0.58ONLINE-A • N 0.56PROMT N 0.55UPC ? Y 0.52UEDIN ? Y 0.52RBMT-4 N 0.46RBMT-1 N 0.45ONLINE-C N 0.43UK Y 0.41JHU Y 0.36
English-French1,410–1,697 comparisons/system
System C? >othersLIMSI •? Y 0.66RWTH Y 0.62ONLINE-B N 0.60KIT •? Y 0.59LIUM Y 0.55UEDIN Y 0.53RBMT-3 N 0.52ONLINE-A N 0.51PROMT N 0.51RBMT-1 N 0.48JHU Y 0.44UK Y 0.40RBMT-4 N 0.39ONLINE-C N 0.39ITS-LATL N 0.36
German-English1,386–1,567 comparisons/systemSystem C? >othersONLINE-A • N 0.65ONLINE-B • N 0.65QUAERO Y 0.61RBMT-3 N 0.60UEDIN ? Y 0.60RWTH ? Y 0.56KIT ? Y 0.55LIMSI Y 0.54QCRI Y 0.52RBMT-1 N 0.51RBMT-4 N 0.50ONLINE-C N 0.43DFKI-BERLIN Y 0.40UK Y 0.37JHU Y 0.34UG Y 0.17
English-German1,777–2,160 comparisons/system
System C? >othersONLINE-B • N 0.64RBMT-3 N 0.63RBMT-4 • N 0.58RBMT-1 N 0.56LIMSI ? Y 0.55ONLINE-A N 0.54UEDIN-WILLIAMS ? Y 0.51KIT ? Y 0.50DFKI-HUNSICKER N 0.48UEDIN ? Y 0.47RWTH ? Y 0.47ONLINE-C N 0.47UK Y 0.45JHU Y 0.43DFKI-BERLIN Y 0.25
C? indicates whether system is constrained (unhighlighted rows): trained only using supplied training data, standardmonolingual linguistic tools, and, optionally, LDC’s English Gigaword.• indicates a win: no other system is statistically significantly better at p-level ≤ 0.10 in pairwise comparison.? indicates a constrained win: no other constrained system is statistically better.
Table 4: Official results for the WMT12 translation task. Systems are ordered by their > others score, reflecting howoften their translations won in pairwise comparisons. For detailed head-to-head comparisons, see Appendix A.
17

pairwise comparisons detect statistical significantlysuperior quality of either system, and we note thisaccordingly.
It is desirable to additionally produce an overallranking. In the past evaluation campaigns, we usedtwo different methods to obtain such a ranking, andthis year we use yet another one. In this section, wediscuss each of these overall ranking methods and afew more.
4.1 Rank Ranges
In the first human evaluation, we use fluency andadequacy judgments on a scale from 1 to 5 (Koehnand Monz, 2006). We normalized the scores on aper-sentence basis, thus converting them to a rela-tive ranking in a 5-system comparison. We listedsystems by the average of these scores over all sen-tences, in which they were judged.
We did not report ranks, but rank ranges. Togive an example: if a system scored neither sta-tistically significantly better nor statistically signif-icantly worse than 3 other systems, we assign it therank range 1–4. The given evidence is not sufficientto rank it exactly, but it does rank somewhere in thetop 4.
In subsequent years, we did not continue the re-porting of rank ranges (although they can be ob-tained by examining the pairwise comparison ta-bles), but we continued to report systems as win-ners whenever there was not statistically signifi-cantly outperformed by any other system.
4.2 Ratio of Wins and Ties
In the following years (Callison-Burch et al., 2007;Callison-Burch et al., 2008; Callison-Burch et al.,2009; Callison-Burch et al., 2010; Callison-Burch etal., 2011), we abandoned the idea of using fluencyand adequacy judgments, since they showed to beless reliable than simple ranking of system transla-tions. We also started to interpret the 5-system com-parison as a set of pairwise comparisons.
Systems were then ranked by the ratio of how of-ten they were ranked better or equal to any of theother systems.
Given a set J of sentence-level judgments(s1, s2, c) where s1 ∈ S and s2 ∈ S are two sys-
tems and
c =
win if s1 better than s2
tie if s1 equal to s2
loss if s1 worse than s2
(1)
then we can count the total number of wins and tiesof a system s as
win(s) = |{(s1, s2, c) ∈ J : s = s1, c = win}|+|{(s1, s2, c) ∈ J : s = s2, c = loss}|
loss(s) = |{(s1, s2, c) ∈ J : s = s1, c = loss}|+|{(s1, s2, c) ∈ J : s = s2, c = win}|
tie(s) = |{(s1, s2, c) ∈ J : s = s1, c = tie}|+|{(s1, s2, c) ∈ J : s = s2, c = tie}|
(2)and rank systems by the ratio
score(s) =win(s) + tie(s)
win(s) + loss(s) + tie(s)(3)
This ratio was used for the official rankings overthe last five years.
4.3 Ratio of Wins (Ignoring Ties)Bojar et al. (2011) present a persuasive argumentthat our ranking scheme is biased towards systemsthat are similar to many other systems. Given thatmost of the systems are based on phrase-based mod-els trained on the same training data, this is indeed avalid concern.
They suggest ignoring ties, and using as rankingscore instead the following ratio:
score(s) =win(s)
win(s) + loss(s)(4)
This ratio is used for the official ranking this year.
4.4 Minimizing Pairwise Ranking ViolationsLopez (2012, in this volume) argues against usingaggregate statistics over a set of very diverse judg-ments. Instead, a ranking that has the least numberof pairwise ranking violations is said to be preferred.
If we define the number of pairwise wins as
win(s1, s2) = |{(s1, s2, c) ∈ J : c = win}|+|{(s2, s1, c) ∈ J : c = loss}|
(5)then we define a count function for pairwise orderviolations as
18
score(s1, s2) = max(0,win(s2, s1)− win(s1, s2))(6)
Given a bijective ranking function R(s)→ i withthe codomain of consecutive integers starting at 1,the total number of pairwise ranking violations is de-fined as
score(R) =∑
R(si)<R(sj)
score(si, sj) (7)
Finding the optimal rankingR that minimizes thisscore is not trivial, but given the number of systemsinvolved in this evaluation campaign, it is quite man-ageable.
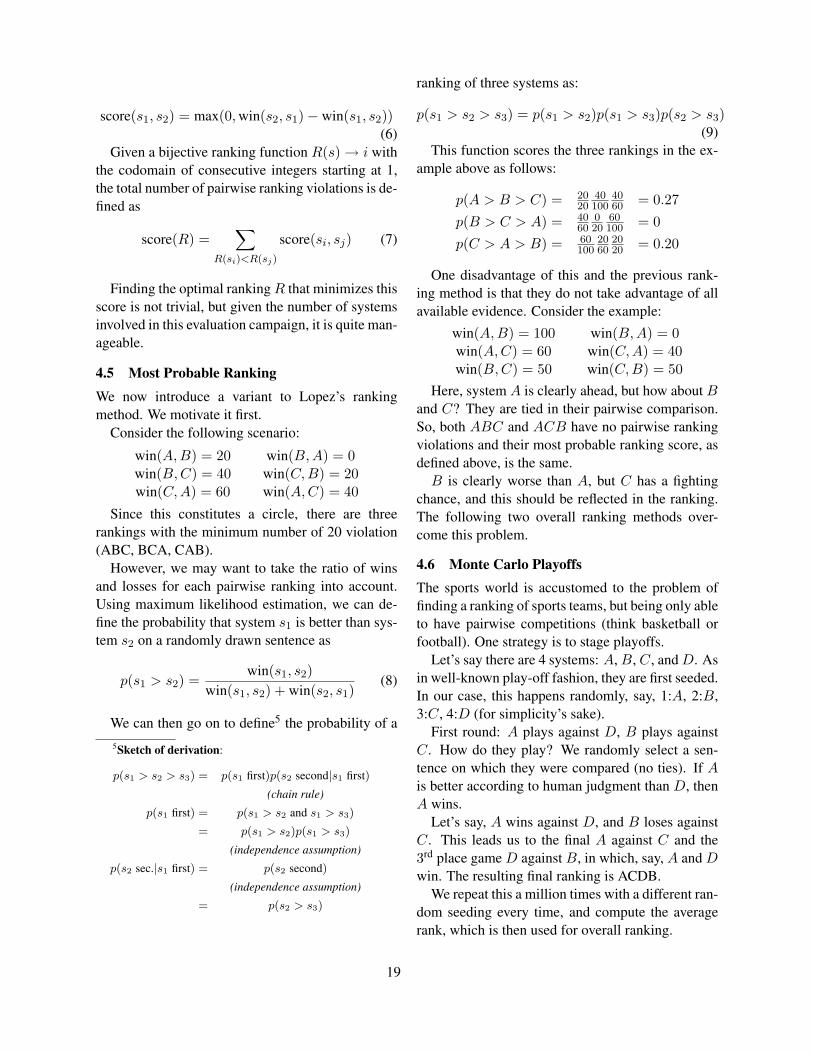
4.5 Most Probable RankingWe now introduce a variant to Lopez’s rankingmethod. We motivate it first.
Consider the following scenario:
win(A,B) = 20 win(B,A) = 0win(B,C) = 40 win(C,B) = 20win(C,A) = 60 win(A,C) = 40
Since this constitutes a circle, there are threerankings with the minimum number of 20 violation(ABC, BCA, CAB).
However, we may want to take the ratio of winsand losses for each pairwise ranking into account.Using maximum likelihood estimation, we can de-fine the probability that system s1 is better than sys-tem s2 on a randomly drawn sentence as
p(s1 > s2) =win(s1, s2)
win(s1, s2) + win(s2, s1)(8)
We can then go on to define5 the probability of a5Sketch of derivation:
p(s1 > s2 > s3) = p(s1 first)p(s2 second|s1 first)
(chain rule)
p(s1 first) = p(s1 > s2 and s1 > s3)
= p(s1 > s2)p(s1 > s3)
(independence assumption)
p(s2 sec.|s1 first) = p(s2 second)
(independence assumption)
= p(s2 > s3)
ranking of three systems as:
p(s1 > s2 > s3) = p(s1 > s2)p(s1 > s3)p(s2 > s3)(9)
This function scores the three rankings in the ex-ample above as follows:
p(A > B > C) = 2020
40100
4060 = 0.27
p(B > C > A) = 4060
020
60100 = 0
p(C > A > B) = 60100
2060
2020 = 0.20
One disadvantage of this and the previous rank-ing method is that they do not take advantage of allavailable evidence. Consider the example:
win(A,B) = 100 win(B,A) = 0win(A,C) = 60 win(C,A) = 40win(B,C) = 50 win(C,B) = 50
Here, system A is clearly ahead, but how about Band C? They are tied in their pairwise comparison.So, both ABC and ACB have no pairwise rankingviolations and their most probable ranking score, asdefined above, is the same.B is clearly worse than A, but C has a fighting
chance, and this should be reflected in the ranking.The following two overall ranking methods over-come this problem.
4.6 Monte Carlo PlayoffsThe sports world is accustomed to the problem offinding a ranking of sports teams, but being only ableto have pairwise competitions (think basketball orfootball). One strategy is to stage playoffs.
Let’s say there are 4 systems: A,B, C, andD. Asin well-known play-off fashion, they are first seeded.In our case, this happens randomly, say, 1:A, 2:B,3:C, 4:D (for simplicity’s sake).
First round: A plays against D, B plays againstC. How do they play? We randomly select a sen-tence on which they were compared (no ties). If Ais better according to human judgment than D, thenA wins.
Let’s say, A wins against D, and B loses againstC. This leads us to the final A against C and the3rd place game D against B, in which, say, A and Dwin. The resulting final ranking is ACDB.
We repeat this a million times with a different ran-dom seeding every time, and compute the averagerank, which is then used for overall ranking.
19
Bojar Lopez Most Probable MC Playoffs Expected Wins1 0.641: ONLINE-B RBMT-4 RBMT-4 6.16: ONLINE-B 0.640 (1-2): ONLINE-B
2 0.627: RBMT-3 ONLINE-B ONLINE-B 6.39: RBMT-3 0.622 (1-2): RBMT-33 0.577: RBMT-4 RBMT-3 RBMT-3 6.98: RBMT-4 0.578 (3-5): RBMT-44 0.557: RBMT-1 RBMT-1 RBMT-1 7.32: RBMT-1 0.553 (3-6): RBMT-15 0.547: LIMSI ONLINE-A ONLINE-A 7.46: LIMSI 0.543 (3-7): LIMSI
6 0.537: ONLINE-A UEDIN-WILLIAMS LIMSI 7.57: ONLINE-A 0.534 (4-8): ONLINE-A
7 0.509: UEDIN-WILLIAMS LIMSI UEDIN-WILLIAMS 7.87: UEDIN-WILLIAMS 0.511 (5-9): UEDIN-WILLIAMS
8 0.503: KIT KIT KIT 7.98: KIT 0.503 (6-11): KIT
9 0.476: DFKI-HUNSICKER DFKI-HUNSICKER DFKI-HUNSICKER 8.32: UEDIN 0.477 (7-13): UEDIN
10 0.475: UEDIN ONLINE-C ONLINE-C 8.38: DFKI-HUNSICKER 0.472 (8-13): DFKI-HUNSICKER
11 0.470: RWTH UEDIN UEDIN 8.41: ONLINE-C 0.470 (8-13): ONLINE-C
12 0.470: ONLINE-C UK UK 8.44: RWTH 0.468 (8-13): RWTH
13 0.448: UK RWTH RWTH 8.72: UK 0.447 (10-14): UK
14 0.435: JHU JHU JHU 8.87: JHU 0.434 (12-14): JHU
15 0.249: DFKI-BERLIN DFKI-BERLIN DFKI-BERLIN 11.15: DFKI-BERLIN 0.249 (15): DFKI-BERLIN
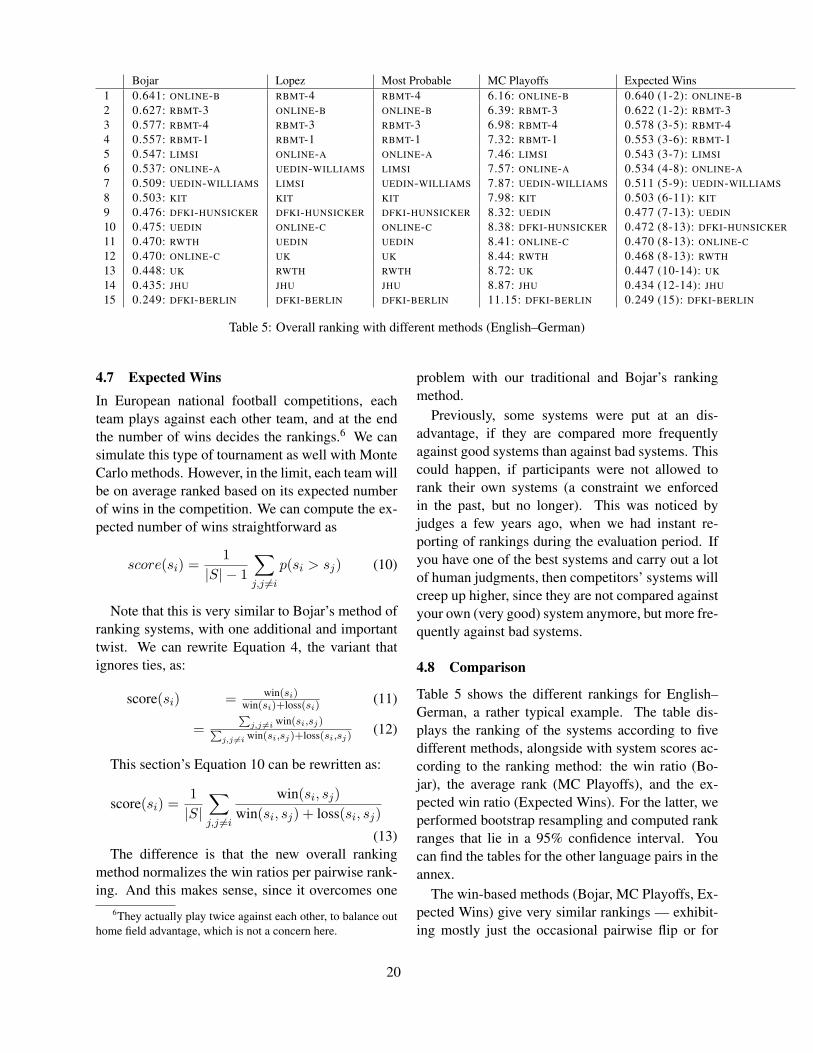
Table 5: Overall ranking with different methods (English–German)
4.7 Expected WinsIn European national football competitions, eachteam plays against each other team, and at the endthe number of wins decides the rankings.6 We cansimulate this type of tournament as well with MonteCarlo methods. However, in the limit, each team willbe on average ranked based on its expected numberof wins in the competition. We can compute the ex-pected number of wins straightforward as
score(si) =1
|S| − 1
∑j,j 6=i
p(si > sj) (10)
Note that this is very similar to Bojar’s method ofranking systems, with one additional and importanttwist. We can rewrite Equation 4, the variant thatignores ties, as:
score(si) = win(si)win(si)+loss(si)
(11)
=∑
j,j 6=i win(si,sj)∑j,j 6=i win(si,sj)+loss(si,sj)
(12)
This section’s Equation 10 can be rewritten as:
score(si) =1
|S|∑j,j 6=i
win(si, sj)
win(si, sj) + loss(si, sj)
(13)The difference is that the new overall ranking
method normalizes the win ratios per pairwise rank-ing. And this makes sense, since it overcomes one
6They actually play twice against each other, to balance outhome field advantage, which is not a concern here.
problem with our traditional and Bojar’s rankingmethod.
Previously, some systems were put at an dis-advantage, if they are compared more frequentlyagainst good systems than against bad systems. Thiscould happen, if participants were not allowed torank their own systems (a constraint we enforcedin the past, but no longer). This was noticed byjudges a few years ago, when we had instant re-porting of rankings during the evaluation period. Ifyou have one of the best systems and carry out a lotof human judgments, then competitors’ systems willcreep up higher, since they are not compared againstyour own (very good) system anymore, but more fre-quently against bad systems.
4.8 Comparison
Table 5 shows the different rankings for English–German, a rather typical example. The table dis-plays the ranking of the systems according to fivedifferent methods, alongside with system scores ac-cording to the ranking method: the win ratio (Bo-jar), the average rank (MC Playoffs), and the ex-pected win ratio (Expected Wins). For the latter, weperformed bootstrap resampling and computed rankranges that lie in a 95% confidence interval. Youcan find the tables for the other language pairs in theannex.
The win-based methods (Bojar, MC Playoffs, Ex-pected Wins) give very similar rankings — exhibit-ing mostly just the occasional pairwise flip or for
20

many language pairs the ranking is identical. Thesame is true for the two methods based on pairwiserankings (Lopez, Most Probable). However, the twotypes of ranking lead to significantly different out-comes.
For instance, the win-based methods are prettysure that ONLINE-B and RBMT-3 are the two topperformers. Bootstrap resampling of rankings ac-cording to Expected Wins ranking draws a clearline between them and the rest. However, Lopez’smethod ranks RBMT-4 first. Why? In direct com-parison of the three systems, RBMT-4 beats statis-tically insignificantly ONLINE-B 45% wins against42% wins and essentially ties with RBMT-3 41%wins against 41% wins (ONLINE-B beats RBMT-349%–35%, p ≤ 0.01).
We use Bojar’s method as our official method forranking in Table 4 and as the human judgments thatwe used when calculating how well automatic eval-uation metrics correlate with human judgments.
4.9 Number of Judgments Needed
In general, there are not enough judgments to ranksystems unambiguously. How many judgments dowe need?
We may extrapolate this number from the num-ber of judgments we have. Figure 2 provides somehints. The outlier is Czech–English, for which only6 systems were submitted and we can separate themalmost completely even at p-level 0.01. For all theother language pairs, we can only draw for around40% of the pairwise comparisons conclusions withthat level of statistical significance.
Since the plots also contains the ratio of signifi-cant conclusions when sub-sampling the number ofjudgments, we obtain curves with a clear upwardslope. For English–Czech, for which we were ableto collect much more judgments, we can draw over60% significant conclusions. The curve for this lan-guage pair does not look much different than theother languages, suggesting that doubling the num-ber of judgments should allow similar levels forthem as well.
5 Metrics Task
In addition to allowing us to analyze the translationquality of different systems, the data gathered during
p-level 0.01
0
20
40
60
80
100
0 5000 10000 15000 20000 25000
Czech-English (6 systems)French-English (15 systems)
Spanish-English (12 systems)German-English (16 systems)
English-Czech (13 systems)English-French (15 systems)
English-Spanish (11 systems)English-German (15 systems)
p-level 0.05
0
20
40
60
80
100
0 5000 10000 15000 20000 25000
Czech-English (6 systems)French-English (15 systems)
Spanish-English (12 systems)German-English (16 systems)
English-Czech (13 systems)English-French (15 systems)
English-Spanish (11 systems)English-German (15 systems)
p-level 0.10
0
20
40
60
80
100
0 5000 10000 15000 20000 25000
Czech-English (6 systems)French-English (15 systems)
Spanish-English (12 systems)German-English (16 systems)
English-Czech (13 systems)English-French (15 systems)
English-Spanish (11 systems)English-German (15 systems)
Figure 2: Ratio of statistically significant pairwise com-parisons at different p-levels, based on number of pair-wise judgments collected.
21

Metric IDs ParticipantAMBER National Research Council Canada (Chen et al., 2012)METEOR CMU (Denkowski and Lavie, 2011)SAGAN-STS FaMAF, UNC, Argentina (Castillo and Estrella, 2012)SEMPOS Charles University (Machacek and Bojar, 2011)SIMBLEU University of Sheffield (Song and Cohn, 2011)SPEDE Stanford University (Wang and Manning, 2012)TERRORCAT University of Zurich, DFKI, Charles U (Fishel et al., 2012)BLOCKERRCATS, ENXERRCATS, WORD-BLOCKERRCATS, XENERRCATS, POSF
DFKI (Popovic, 2012)
Table 6: Participants in the metrics task.
the manual evaluation is useful for validating auto-matic evaluation metrics. Table 6 lists the partici-pants in this task, along with their metrics.
A total of 12 metrics and their variants were sub-mitted to the metrics task by 8 research groups. Weprovided BLEU and TER scores as baselines. Weasked metrics developers to score the outputs ofthe machine translation systems and system com-binations at the system-level and at the segment-level. The system-level metrics scores are given inthe Appendix in Tables 29–36. The main goal ofthe metrics shared task is not to score the systems,but instead to validate the use of automatic metricsby measuring how strongly they correlate with hu-man judgments. We used the human judgments col-lected during the manual evaluation for the transla-tion task and the system combination task to calcu-late how well metrics correlate at system-level andat the segment-level.
5.1 System-Level Metric AnalysisWe measured the correlation of the automatic met-rics with the human judgments of translation qual-ity at the system-level using Spearman’s rank cor-relation coefficient ρ. We converted the raw scoresassigned to each system into ranks. We assigned ahuman ranking to the systems based on the percentof time that their translations were judged to be bet-ter than the translations of any other system in themanual evaluation (Equation 4).
When there are no ties, ρ can be calculated usingthe simplified equation:
ρ = 1− 6∑d2
i
n(n2 − 1)
CS-E
N-
6S
YS
TE
MS
DE
-EN
-16
SY
ST
EM
S
ES-E
N-
12S
YS
TE
MS
FR
-EN
-15
SY
ST
EM
S
AV
ER
AG
E
System-level correlation for translations into EnglishSEMPOS .94 .92 .94 .80 .90AMBER .83 .79 .97 .85 .86METEOR .66 .89 .95 .84 .83
TERRORCAT .71 .76 .97 .88 .83SIMPBLEU .89 .70 .89 .82 .82
TER -.89 -.62 -.92 -.82 .81BLEU .89 .67 .87 .81 .81
POSF .66 .66 .87 .83 .75BLOCKERRCATS -.64 -.75 -.88 -.74 .75WORDBLOCKEC -.66 -.67 -.85 -.77 .74
XENERRCATS -.66 -.64 -.87 -.77 .74SAGAN-STS .66 n/a .91 n/a n/a
Table 7: System-level Spearman’s rho correlation of theautomatic evaluation metrics with the human judgmentsfor translation into English, ordered by average absolutevalue.
22

EN
-CZ
-10
SY
ST
EM
S
EN
-DE
-22
SY
ST
EM
S
EN
-ES
-15
SY
ST
EM
S
EN
-FR
-17
SY
ST
EM
S
AV
ER
AG
E
System-level correlation for translations out of EnglishSIMPBLEU .83 .46 .42 .94 .66
BLOCKERRCATS -.65 -.53 -.47 -.93 .64ENXERRCATS -.74 -.38 -.47 -.93 .63
POSF .80 .54 .37 .69 .60WORDBLOCKEC -.71 -.37 -.47 -.81 .59
TERRORCAT .65 .48 .58 .53 .56AMBER .71 .25 .50 .75 .55
TER -.69 -.41 -.45 -.66 .55METEOR .73 .18 .45 .82 .54
BLEU .80 .22 .40 .71 .53SEMPOS .52 n/a n/a n/a n/a
Table 8: System-level Spearman’s rho correlation of theautomatic evaluation metrics with the human judgmentsfor translation out of English, ordered by average abso-lute value.
where di is the difference between the rank forsystemi and n is the number of systems. The pos-sible values of ρ range between 1 (where all systemsare ranked in the same order) and−1 (where the sys-tems are ranked in the reverse order). Thus an auto-matic evaluation metric with a higher absolute valuefor ρ is making predictions that are more similar tothe human judgments than an automatic evaluationmetric with a lower absolute ρ.
The system-level correlations are shown in Ta-ble 7 for translations into English, and Table 8 outof English, sorted by average correlation across thelanguage pairs. The highest correlation for eachlanguage pair and the highest overall average arebolded. Once again this year, many of the metricshad stronger correlation with human judgments thanBLEU. The metrics that had the strongest correlationthis year were SEMPOS for the into English direc-tion and SIMPBLEU for the out of English direc-tion.
5.2 Segment-Level Metric Analysis
We measured the metrics’ segment-level scores withthe human rankings using Kendall’s tau rank corre-
FR
-EN
(115
94PA
IRS)
DE
-EN
(119
34PA
IRS)
ES-E
N(9
796
PAIR
S)
CS-E
N(1
1021
PAIR
S)
AV
ER
AG
E
Segment-level correlation for translations into EnglishSPEDE07-PP .26 .28 .26 .21 .25
METEOR .25 .27 .25 .21 .25AMBER .24 .25 .23 .19 .23
SIMPBLEU .19 .17 .19 .13 .17TERRORCAT .18 .19 .18 .19 .19
XENERRCATS .17 .18 .18 .13 .17POSF .16 .18 .15 .12 .15
WORDBLOCKEC .15 .16 .17 .13 .15BLOCKERRCATS .07 .08 .08 .06 .07
SAGAN-STS n/a n/a .21 .20 n/a
Table 9: Segment-level Kendall’s tau correlation of theautomatic evaluation metrics with the human judgmentsfor translation into English, ordered by average correla-tion.
EN
-FR
(115
62PA
IRS)
EN
-DE
(145
53PA
IRS)
EN
-ES
(118
34PA
IRS)
EN
-CS
(188
05PA
IRS)
AV
ER
AG
E
Segment-level correlation for translations out of EnglishMETEOR .26 .18 .21 .16 .20AMBER .23 .17 .22 .15 .19
TERRORCAT .18 .19 .18 .18 .18SIMPBLEU .2 .13 .18 .10 .15
ENXERRCATS .20 .11 .17 .09 .14POSF .15 .13 .15 .13 .14
WORDBLOCKEC .19 .1 .17 .1 .14BLOCKERRCATS .13 .04 .12 .01 .08
Table 10: Segment-level Kendall’s tau correlation of theautomatic evaluation metrics with the human judgmentsfor translation out of English, ordered by average corre-lation.
23
lation coefficient. We calculated Kendall’s tau as:
τ =num concordant pairs - num discordant pairs
total pairs
where a concordant pair is a pair of two translationsof the same segment in which the ranks calculatedfrom the same human ranking task and from the cor-responding metric scores agree; in a discordant pair,they disagree. In order to account for accuracy- vs.error-based metrics correctly, counts of concordantvs. discordant pairs were calculated specific to thesetwo metric types. The possible values of τ rangebetween 1 (where all pairs are concordant) and −1(where all pairs are discordant). Thus an automaticevaluation metric with a higher value for τ is mak-ing predictions that are more similar to the humanjudgments than an automatic evaluation metric witha lower τ .
We did not include cases where the human rank-ing was tied for two systems. As the metrics produceabsolute scores, compared to five relative ranks inthe human assessment, it would be potentially un-fair to the metric to count a slightly different met-ric score as discordant with a tie in the relative hu-man rankings. A tie in automatic metric rank fortwo translations was counted as discordant with twocorresponding non-tied human judgments.
The correlations are shown in Table 9 for trans-lations into English, and Table 10 out of English,sorted by average correlation across the four lan-guage pairs. The highest correlation for each lan-guage pair and the highest overall average arebolded. For the into English direction SPEDE andMETEOR tied for the highest segment-level correla-tion. METEOR performed the best for the out of En-glish direction, with AMBER doing admirably wellin both the into- and the out-of-English directions.
6 Quality Estimation task
Quality estimation aims to provide a quality indica-tor for machine translated sentences at various gran-ularity levels. It differs from MT evaluation, becausequality estimation techniques do not rely on refer-ence translations. Instead, quality estimation is gen-erally addressed using machine learning techniquesto predict quality scores. Potential applications ofquality estimation include:
• Deciding whether a given translation is goodenough for publishing as is
• Informing readers of the target language onlywhether or not they can rely on a translation
• Filtering out sentences that are not goodenough even for post-editing by professionaltranslators
• Selecting the best translation among optionsfrom multiple systems.
This shared-task provides a first common groundfor development and comparison of quality estima-tion systems, focusing on sentence-level estimation.It provides training and test datasets, along withevaluation metrics and a baseline system. The goalsof this shared task are:
• To identify new and effective quality indicators(features)
• To identify alternative machine learning tech-niques for the problem
• To test the suitability of the proposed evalua-tion metrics for quality estimation systems
• To establish the state of the art performance inthe field
• To contrast the performance of regression andranking techniques.
The task provides datasets for a single languagepair, text domain and MT system: English-Spanishnews texts produced by a phrase-based SMT sys-tem (Moses) trained on Europarl and News Com-mentaries corpora provided in the WMT10 transla-tion task. As training data, translations were man-ually annotated for quality in terms of post-editingeffort (1-5 scores) and were provided together withtheir source sentences, reference translations, andpost-edited translations (Section 6.1). The shared-task consisted on automatically producing quality-estimations for a blind test-set, where English sourcesentences and their MT-translations were used as in-puts. Hidden (and subsequently publicly-released)manual effort-annotations of those translations (ob-tained in the same fashion as for the training data)
24
were used as reference labels to evaluate the per-formance of the participating systems (Section 6.1).Participants also had full access to the translationengine-related resources (Section 6.1) and could useany additional external resources. We have also pro-vided a software package to extract baseline qualityestimation features (Section 6.3).
Participants could submit up to two systems fortwo variations of the task: ranking, where par-ticipants submit a ranking of translations (no tiesallowed), without necessarily giving any explicitscores for translations, and scoring, where partici-pants submit a score for each sentence (in the [1,5]range). Each of these subtasks is evaluated usingspecific metrics (Section 6.2).
6.1 Datasets and resources
Training dataThe training data used was selected from data
available from previous WMT shared-tasks formachine-translation: a subset of the WMT10English-Spanish test set, and a subset of the WMT09English-Spanish test set, for a total of 1832 sen-tences.
The training data consists of the following re-sources:
• English source sentences
• Spanish machine-translation outputs, createdusing the SMT Moses engine
• Effort scores, created by using three profes-sional post-editors using guidelines describ-ing Post-Editing (PE) effort from highest effort(score 1) to lowest effort (score 5)
• Post-Editing output, created by a pool of pro-fessional post-editors starting from the sourcesentences and the Moses translations; these PEoutputs were created before the effort scoreswere elicited, and were shown to the PE-effortjudges to facilitate their effort estimates
• Spanish translation outputs, created as part ofthe WMT machine-translation shared-task asreference translations for the English sourcesentences (independent of any MT output).
The guidelines used by the PE-effort judges to as-sign scores 1-5 for each of the 〈source, MT-output,PE-output〉 triplets are the following:
[1] The MT output is incomprehensible, with lit-tle or no information transferred accurately. Itcannot be edited, needs to be translated fromscratch.
[2] About 50-70% of the MT output needs to beedited. It requires a significant editing effort inorder to reach publishable level.
[3] About 25-50% of the MT output needs to beedited. It contains different errors and mis-translations that need to be corrected.
[4] About 10-25% of the MT output needs to beedited. It is generally clear and intelligible.
[5] The MT output is perfectly clear and intelligi-ble. It is not necessarily a perfect translation,but requires little or no editing.
Providing reliable effort estimates turned out tobe a difficult task for the PE-effort judges, even inthe current set-up (with post edited outputs availablefor consultation). To eliminate some of the noisefrom these judgments, we performed an intermedi-ate cleaning step, in which we eliminated the sen-tences for which the difference between the max-imum score and the minimum score assigned be-tween the three judges was > 1. We started thedata-creation process from a total of 2000 sentencesfor the training set, and the final 1832 sentences weselected as training data were the ones that passedthrough this intermediate cleaning step.
Besides score disagreement, we noticed anothertrend on the human judgements of PE-effort. Somejudges tend to give more moderate scores (in themiddle of available range), while others like to com-mit also to scores that are more in the extremes ofthe available range. Since the quality estimation taskwould be negatively influenced by having most ofthe scores in the middle of the range, we have chosento compute the final effort scores as an weighted av-erage between the three PE-effort scores, with moreweight given to the judges with higher standard de-viation from their own mean score. We have used
25

weights 3, 2, and 1 for the three PE-effort judges ac-cording to this criterion. There is an additional ad-vantage resulting from this weighted average score:instead of obtaining average numbers only at val-ues x.0, x.33, and x.66 (for unweighted average)7,the weighted averages are spread more evenly in therange [1, 5].
A few variations of the training data were pro-vided, including version with cases restored and aversion detokenized. In addition, engine-internalinformation from Moses such as phrase and wordalignments, detailed model scores, etc. (parameter-trace), n-best lists and stack information from thesearch graph as a word graph (parameter -output-word-graph) as produced by the Moses engine wereprovided.
The rationale behind releasing this engine-internal data was to make it possible for this shared-task to address quality estimation using a glass-boxapproach, that is, making use of information fromthe internal workings of the MT engine.
Test dataThe test data was a subset of the WMT12 English-
Spanish test set, consisting of 442 sentences. Thetest data consists of the following files:
• English source sentences
• Spanish machine-translation outputs, createdusing the same SMT Moses engine used to cre-ate the training data
• Effort scores, created by using three profes-sional post-editors8 using guidelines describingPE effort from highest effort (score 1) to lowesteffort (score 5)
The first two files were the input for the quality-estimation shared-task participating systems. Sincethe Moses engine used to create the MT outputs wasthe same as the one used for generating the train-ing data, the engine-internal resources are the same
7These three values are the only ones possible given thecleaning step we perform prior to averaging the scores, whichensures that the difference between the maximum score and theminimum score is at most 1.
8The same post-editors that were used to create the trainingdata were used to create the test data.
as the ones we released as part of the training datapackage.
The effort scores were released after the partic-ipants submitted their shared-task submission, andwere solely used to evaluate the submissions accord-ing to the established metrics. The guidelines usedby the PE-effort judges to assign 1-5 scores were thesame as the ones used for creating the training data.We have used the same criteria to ensure the con-sistency of the human judgments. The initial set ofcandidates consisted of 604 sentences, of which only442 met this criteria. The final scores used as gold-values have been obtained using the same weighted-average scheme as for the training data.
ResourcesIn addition to the training and test materials, we
made several additional resources that were used forthe baseline QE system and/or the SMT system thatproduced the training and test datasets:
• The SMT training corpus: source and targetsides of the corpus used to train the Moses en-gine. These are a concatenation of the Eu-roparl and the news-commentary data sets fromWMT10 that were tokenized, cleaned (remov-ing sentences longer than 80 tokens) and true-cased.
• Two Language models: 5-gram LM generatedfrom the interpolation of the two target cor-pora after tokenization and truecasing (usedby Moses) and a trigram LM generated fromthe two source corpora and filtered to removesingletons (used by the baseline QE system).We also provided unigram, bigram and trigramcounts (used in the baseline QE system).
• An IBM Model 1 table that generated byGiza++ using the SMT training corpora.
• A word-alignment file as produced by thegrow-diag-final heuristic in Moses for the SMTtraining set.
• A phrase table with word alignment informa-tion generated from the parallel corpora.
• The Moses configuration file used for decod-ing.
26

6.2 Evaluation metrics
Ranking metricsFor the ranking task, we defined a novel met-
ric that provides some advantages over a more tra-ditional ranking metrics like Spearman correlation.Our metric, called DeltaAvg, assumes that the refer-ence test set has a number associated with each en-try that represents its extrinsic value. For instance,using the effort scale we described in Section 6.1,we associate a value between 1 and 5 with eachsentence, representing the quality of that sentence.Given these values, our metric does not need an ex-plicit reference ranking, the way the Spearman rank-ing correlation does.9 The goal of the DeltaAvg met-ric is to measure how valuable a proposed ranking(which we call a hypothesis ranking) is according tothe extrinsic values associated with the test entries.
We first define a parameterized version of thismetric, called DeltaAvg[n]. The following notationsare used: for a given entry sentence s, V (s) repre-sents the function that associates an extrinsic valueto that entry; we extend this notation to a set S, withV (S) representing the average of all V (s), s ∈ S.Intuitively, V (S) is a quantitative measure of the“quality” of the set S, as induced by the extrinsicvalues associated with the entries in S. For a setof ranked entries S and a parameter n, we denoteby S1 the first quantile of set S (the highest-rankedentries), S2 the second quantile, and so on, for nquantiles of equal sizes.10 We also use the notationSi,j =
⋃jk=i Sk. Using these notations, we define:
DeltaAvgV [n] =
∑n−1k=1 V (S1,k)
n− 1− V (S) (14)
When the valuation function V is clear from the con-text, we write DeltaAvg[n] for DeltaAvgV [n]. Theparameter n represents the number of quantiles wewant to split the set S into. For instance, n = 2gives DeltaAvg[2] = V (S1) − V (S), hence it mea-sures the difference between the quality of the top
9A reference ranking can be implicitly induced according tothese values; if, as in our case, higher values mean better sen-tences, then the reference ranking is defined such that higher-scored sentences rank higher than lower-scored sentences.
10If the size |S| is not divisible by n, then the last quantileSn is assumed to contain the rest of the entries.
quantile (top half) S1 and the overall quality (rep-resented by V (S)). For n = 3, DeltaAvg[3] =(V (S1)+V (S1,2)/2−V (S) = ((V (S1)−V (S))+(V (S1,2 − V (S)))/2, hence it measures an aver-age difference across two cases: between the qualityof the top quantile (top third) and the overall qual-ity, and between the quality of the top two quan-tiles (S1∪S2, top two-thirds) and the overall quality.In general, DeltaAvg[n] measures an average differ-ence in quality across n − 1 cases, with each casemeasuring the impact in quality of adding an addi-tional quantile, from top to bottom. Finally, we de-fine:
DeltaAvgV =
∑Nn=2 DeltaAvgV [n]
N − 1(15)
whereN = |S|/2. As before, we write DeltaAvg forDeltaAvgV when the valuation function V is clearfrom the context. The DeltaAvg metric is an aver-age across all DeltaAvg[n] values, for those n valuesfor which the resulting quantiles have at least 2 en-tries (no singleton quantiles). The DeltaAvg metrichas some important properties that are desired for aranking metric (see Section 6.4 for the results of theshared-task that substantiate these claims):
• it is non-parametric (i.e., it does not depend onsetting particular parameters)
• it is automatic and deterministic (and thereforeconsistent)
• it measures the quality of a hypothesis rank-ing from an extrinsic perspective (as offered byfunction V )
• its values are interpretable: for a given set ofranked entries, a value DeltaAvg of 0.5 meansthat, on average, the difference in quality be-tween the top-ranked quantiles and the overallquality is 0.5
• it has a high correlation with the Spearman rankcorrelation coefficient, which makes it as use-ful as the Spearman correlation, with the addedadvantage of its values being extrinsically in-terpretable.
27
In the rest of this paper, we present results forDeltaAvg using as valuation function V the Post-Editing effort scores, as defined in Section 6.1.
We also report the results of the ranking task usingthe more-traditional Spearman correlation.
Scoring metricsFor the scoring task, we use two metrics that have
been traditionally used for measuring performancefor regression tasks: Mean Absolute Error (MAE) asa primary metric, and Root of Mean Squared Error(RMSE) as a secondary metric. For a given test setS with entries si, 1 ≤ i ≤ |S|, we denote by H(si)the proposed score for entry si (hypothesis), and byV (si) the reference value for entry si (gold-standardvalue). We formally define our metrics as follows:
MAE =
∑Ni=1 |H(si)− V (si)|
N(16)
RMSE =
√∑Ni=1(H(si)− V (si))2
N(17)
where N = |S|. Both these metrics are non-parametric, automatic and deterministic (and there-fore consistent), and extrinsically interpretable. Forinstance, a MAE value of 0.5 means that, on aver-age, the absolute difference between the hypothe-sized score and the reference score value is 0.5. Theinterpretation of RMSE is similar, with the differ-ence that RMSE penalizes larger errors more (viathe square function).
6.3 ParticipantsEleven teams (listed in Table 11) submitted one ormore systems to the shared task, with most teamssubmitting for both ranking and scoring subtasks.Each team was allowed up to two submissions (foreach subtask). In the descriptions below participa-tion in the ranking is denoted (R) and scoring is de-noted (S).
Baseline system (R, S): the baseline system usedthe feature extraction software (also providedto all participants). It analyzed the source andtranslation files and the SMT training corpusto extract the following 17 system-independentfeatures that were found to be relevant in previ-ous work (Specia et al., 2009):
• number of tokens in the source and targetsentences• average source token length• average number of occurrences of the tar-
get word within the target sentence• number of punctuation marks in source
and target sentences• LM probability of source and target sen-
tences using language models described inSection 6.1• average number of translations per source
word in the sentence: as given by IBM 1model thresholded so that P (t|s) > 0.2,and so that P (t|s) > 0.01 weighted bythe inverse frequency of each word in thesource side of the SMT training corpus• percentage of unigrams, bigrams and tri-
grams in frequency quartiles 1 (lower fre-quency words) and 4 (higher frequencywords) in the source side of the SMT train-ing corpus• percentage of unigrams in the source sen-
tence seen in the source side of the SMTtraining corpus
These features are used to train a Support Vec-tor Machine (SVM) regression algorithm usinga radial basis function kernel with the LIBSVMpackage (Chang and Lin, 2011). The γ, ε and Cparameters were optimized using a grid-searchand 5-fold cross validation on the training set.We note that although the system is referred toas a “baseline”, it is in fact a strong system.Although it is simple it has proved to be ro-bust across a range of language pairs, MT sys-tems, and text domains. It is a simpler variantof the system used in (Specia, 2011). The ratio-nale behind having such a strong baseline wasto push systems to exploit alternative sourcesof information and combination / learning ap-proaches.
SDLLW (R, S): Both systems use 3 sets of fea-tures: the 17 baseline features, 8 system-dependent features from the decoder logs ofMoses, and 20 features developed internally.Some of these features made use of additionaldata and/or resources, such as a secondary
28
ID Participating teamPRHLT-UPV Universitat Politecnica de Valencia, Spain (Gonzalez-Rubio et al., 2012)
UU Uppsala University, Sweden (Hardmeier et al., 2012)SDLLW SDL Language Weaver, USA (Soricut et al., 2012)
Loria LORIA Institute, France (Langlois et al., 2012)UPC Universitat Politecnica de Catalunya, Spain (Pighin et al., 2012)
DFKI DFKI, Germany (Avramidis, 2012)WLV-SHEF University of Wolverhampton & University of Sheffield, UK (Felice and Specia, 2012)
SJTU Shanghai Jiao Tong University, China (Wu and Zhao, 2012)DCU-SYMC Dublin City University, Ireland & Symantec, Ireland (Rubino et al., 2012)
UEdin University of Edinburgh, UK (Buck, 2012)TCD Trinity College Dublin, Ireland (Moreau and Vogel, 2012)
Table 11: Participants in the WMT12 Quality Evaluation shared task.
MT system that was used as pseudo-referencefor the hypothesis, and POS taggers for bothlanguages. Feature-selection algorithms wereused to select subsets of features that directlyoptimize the metrics used in the task. System“SDLLW M5PbestAvgDelta” uses a resulting15-feature set optimized towards the AvgDeltametric. It employs an M5P model to learn adecision-tree with only two linear equations.System “SDLLW SVM” uses a 20-feature setand an SVM epsilon regression model with ra-dial basis function kernel with parameters C,gamma, and epsilon tuned on a developmentset (305 training instances). The model wastrained with 10-fold cross validation and thetuning process was restarted several times us-ing different starting points and step sizes toavoid overfitting. The final model was selectedbased on its performance on the developmentset and the number of support vectors.
UU (R, S): System “UU best” uses the 17 base-line features, plus 82 features from Hardmeier(2011) (with some redundancy and some over-lap with baseline features), and constituencytrees over input sentences generated by theStanford parser and dependency trees over bothinput and output sentences generated by theMaltParser. System “UU bltk” uses only the17 baseline features plus constituency and de-pendency trees as above. The machine learn-ing component in both cases is SVM regres-sion (SVMlight software). For the ranking task,
the ranking induced by the regression outputis used. The system uses polynomial kernelsof degree 2 (UU best) and 3 (UU bltk) as wellas two different types of tree kernels for con-stituency and dependency trees, respectively.The SVM margin/error trade-off, the mixtureproportion between tree kernels and polyno-mial kernels and the degree of the polynomialkernels were optimised using grid search with5-fold cross-validation over the training set.
TCD (R, S): “TCD M5P-resources-only” usesonly the baseline features, while “TCD M5P-all” uses the baseline and additional features.A number of metrics (used as features inTCD M5P-all) were proposed which work inthe following way: given a sentence to eval-uate (source sentence for complexity or targetsentence for fluency), it is compared againstsome reference data using similarity mea-sures (various metrics which compare distri-butions of n-grams). The training data wasused as reference, along with the Google n-grams dataset. Several learning methods weretested using Weka on the training data (10-fold cross-validation). The system submissionuses the M5P (regression with decision trees)algorithm which performed best. Contrary towhat had been observed on the training datausing cross-validation, “TCD M5P-resources-only” performs better than “TCD M5P-all” onthe test data.
29
PRHLT-UPV (R, S): The system addresses thetask using a regression algorithm with 475 fea-tures, including the 17 the baseline features.Most of the features are defined as word scores.Among them, the features obtained form asmoothed naive Bayes classifier have shown tobe particularly interesting. Different methodsto combine word-level scores into sentence-level features were investigated. For modelbuilding, SVM regression was used. Giventhe large number of features, the training dataprovided as part of the task was insufficientyielding unstable systems with not so good per-formance. Different feature selection methodswere implemented to determine a subset of rel-evant features. The final submission used theserelevant features to train an SVM system whoseparameters were optimized with respect to thefinal evaluation metrics.
UEDIN (R, S): The system uses the baseline fea-tures along with some additional features: bi-nary features for named entities in source usingStanford NER Tagger; binary indicators for oc-currence of quotes or parenthetical segments,words in upper case and numbers; geometricmean of target word probabilities and proba-bility of worst scoring word under a Discrim-inative Word Lexicon Model; Sparse NeuralNetwork directly mapping from source to tar-get (using the vector space model) with sourceand target side either filtered to relevant wordsor hashed to reduce dimensionality; number oftimes at least a 3-gram is seen normalized bysentence length; and Levenshtein distance ofeither source or translation to closest entry ofthe SMT training corpus on word or characterlevel. An ensemble of neural networks opti-mized for RMSE was used for prediction (scor-ing) and ranking. The contribution of new fea-tures was tested by adding them to the baselinefeatures using 5-fold cross-validation. Mostfeatures did not result in any improvement overthe baseline. The final submission was a com-bination of all feature sets that showed im-provement.
SJTU (R, S): The task is treated as a regressionproblem using the epsilon-SVM method. Allfeatures are extracted from the official data, in-volving no external NLP tools/resources. Mostof them come from the phrase table, decod-ing data and SMT training data. The focusis on special word relations and special phrasepatterns, thus several feature templates on thistopic are extracted. Since the training data isnot large enough to assign weights to all fea-tures, methods for estimating common stringsor sequences of words are used. The trainingdata is divided in 3/4 for training and 1/4 fordevelopment to filter ineffective features. Be-sides the baseline features, the final submissioncontains 18 feature templates and about 4 mil-lion features in total.
WLV-SHEF (R, S): The systems integrates novellinguistic features from the source and targettexts in an attempt to overcome the limitationsof existing shallow features for quality estima-tion. These linguistically-informed features in-clude part-of-speech information, phrase con-stituency, subject-verb agreement and targetlexicon analysis, which are extracted usingparsers, corpora and auxiliary resources. Sys-tems are built using epsilon-SVM regressionwith parameters optimised using 5-fold cross-validation on the training set and two differ-ent feature sets: “WLV-SHEF BL” uses the 17baseline features plus 70 linguistically inspiredfeatures, while “WLV-SHEF FS” uses a largerset of 70 linguistic plus 77 shallow features (in-cluding the baseline). Although results indicatethat the models fall slightly below the baseline,further analysis shows that linguistic informa-tion is indeed informative and complementaryto shallow indicators.
DFKI (R, S): “DFKI morphPOSibm1LM” (R) isa simple linear interpolation of POS 6-gramlanguage model scores, morpheme 6-gram lan-guage model scores, IBM 1 scores (both “di-rect” and “inverse”) for POS 4-grams and formorphemes. The parallel News corpora fromWMT10 is used as extra data to train the lan-guage model and the IBM 1 model. “DFKI cfs-
30
plsreg” and “DFKI grcfs-mars” (S) use a col-lection of 264 features generated containingthe baseline features and additional resources.Numerous methods of feature selection weretested using 10-fold cross validation on thetraining data, reducing these to 23 feature sets.Several regression and (discretized) classifica-tion algorithms were employed to train predic-tion models. The best-performing models in-cluded features derived from PCFG parsing,language quality checking and LM scoring, ofboth source and target, besides features fromthe SMT search graph and a few baseline fea-tures. “DFKI cfs-plsreg” uses a Best Firstcorrelation-based feature selection technique,trained with Partial Least Squares Regression,while “DFKI grcfs-mars” uses a Greedy Step-wise correlation-based feature selection tech-nique, trained with multivariate adaptive re-gression splines.
DCU-SYMC (R, S): Systems are based on a clas-sification approach using a set of features thatincludes the baseline features. The manuallyassigned quality scores provided for each MToutput in the training set were rounded in or-der to apply classification algorithms on a lim-ited set of classes (integer values from 1 to 5).Three classifiers were combined by averagingthe predicted classes: SVM using sequentialminimal optimization and RBF kernel (parame-ters optimized by grid search), Naive Bayes andRandom Forest. “DCU-SYMC constrained” isbased on a set of 70 features derived only fromthe data provided for the task. These includea set of features which attempt to model trans-lation adequacy using a bilingual topic modelbuilt using Latent Dirichlet Allocation. “DCU-SYMC unconstrained” is based on 308 fea-tures including the constrained ones and oth-ers extracted using external tools: grammatical-ity features extracted from the source segmentsusing the TreeTagger part-of-speech tagger, anEnglish precision grammar, the XLE parser andthe Brown re-ranking parser and features basedon part-of-speech tag counts extracted from theMT output using a Spanish TreeTagger model.
Loria (S): Several numerical or boolean featuresare computed from the source and target sen-tences and used to train an SVM regression al-gorithm with linear (“Loria SVMlinear”) andradial basis function (“Loria SVMrbf”) as ker-nel. For the radial basis function, a grid searchis performed to optimise the parameter γ. Theofficial submission use the baseline featuresand a number of features proposed in previouswork (Raybaud et al., 2011), amounting to 66features. A feature selection algorithm is usedin order to remove non-informative features.No additional data other than that provided forthe shared task is considered. The training datais split into a training part (1000 sentences) anda development part (832 sentences) to learn theregression model and optimise the parametersof the regression and for feature selection.
UPC (R, S): The systems use several features ontop of the baseline features. These are mostlybased on different language models estimatedon reference and automatic Spanish transla-tions of the news-v7 corpus. The automatictranslations are generated by the system usedfor the shared task. N-gram LMs are esti-mated on word forms, POS tags, stop wordsinterleaved by POS tags, stop-word patterns,plus variants in which the POS tags are re-placed with the stem or root of each targetword. The POS tags on the target side are ob-tained by projecting source side annotations viaautomatic alignments. The resulting featuresare: the perplexity of each additional languagemodel, according to the two translations, andthe ratio between the two perplexities. Addi-tionally, features that estimate the likelihoodof the projection of dependency parses on thetwo translations are encoded. For learning, lin-ear SVM regression is used. Optimization wasdone via 5-fold cross-validation on a develop-ment data. Features are encoded by means oftheir z-scores, i.e. how many standard devia-tions the observed value is above or below themean. A variant of the system, “UPC-2” usesan option of SVMLight that removes inconsis-tent points from the training set and retrains themodel until convergence.
31
6.4 Results
Here we give the official results for the ranking andscoring subtasks followed by a discussion that high-lights the main findings of the task.
Ranking subtaskTable 12 gives the results for the ranking sub-
task. The table is sorted from best to worse usingthe DeltaAvg metric scores (Equation 15) as pri-mary key and the Spearman correlation scores assecondary key.
The winning submissions for the ranking subtaskare SDLLW’s M5PbestDeltaAvg and SVM entries,which have DeltaAvg scores of 0.63 and 0.61, re-spectively. The difference with respect to all theother submissions is statistically significant at p =0.05, using pairwise bootstrap resampling (Koehn,2004). The state-of-the-art baseline system has aDeltaAvg score of 0.55 (Spearman rank correla-tion of 0.58). Five other submissions have perfor-mances that are not different from the baseline at astatistically-significant level (p = 0.05), as shownby the gray area in the middle of Table 12. Threesubmissions scored higher than the baseline systemat p = 0.05 (systems above the middle gray area),which indicates that this shared-task succeeded inpushing the state-of-the-art performance to new lev-els. The range of performance for the submissionsin the ranking task varies from a DeltaAvg of 0.65down to a DeltaAvg of 0.15 (with Spearman valuesvarying from 0.64 down to 0.19).
In addition to the performance of the official sub-mission, we report here results obtained by var-ious oracle methods. The oracle methods makeuse of various metrics that are associated in a or-acle manner to the test input: the gold-label Ef-fort metric for “Oracle Effort”, the HTER metriccomputed against the post-edited translations as ref-erence for “Oracle HTER”, and the BLEU metriccomputed against the same post-edited translationsas reference for “Oracle (H)BLEU”.11 The “OracleEffort” DeltaAvg score of 0.95 gives an upperboundin terms of DeltaAvg for the test set used in thisevaluation. It basically indicates that, for this set,
11We use the (H)BLEU notation to underscore the use ofPost-Edited translations as reference, as opposed to using ref-erences that are not the product of a Post-Editing process, as forthe traditional BLEU metric.
the difference in PE effort between the top-qualityquantiles and the overall quality is 0.95 on average.We would like to emphasize here that the DeltaAvgmetric does not have any a-priori range for its values.The upperbound, for instance, is test-dependent, andtherefore an “Oracle Effort” score is useful for un-derstanding the performance level of real system-submissions. The “Oracle HTER” DeltaAvg scoreof 0.77 is a more realistic upperbound for the cur-rent set. Since the HTER metric is considered agood approximation for the effort required in post-editing, ranking the test set based on the HTERscores (from lowest HTER to highest HTER) pro-vides a good oracle comparison point. The oraclebased on (H)BLEU gives a lower DeltaAvg score,which can be interpreted to mean that the BLEUmetric provides a lower correlation to post-editingeffort compared to HTER. We also note here thatthere is room for improvement between the highest-scoring submission (at DeltaAvg 0.63) and the “Ora-cle HTER” DeltaAvg score of 0.77. We are not sureif this difference can be bridged completely, but hav-ing measured a quantitative difference between thecurrent best-performance and a realistic upperboundis an important achievement of this shared-task.
Scoring subtaskThe results for the scoring task are presented in
Table 13, sorted from best to worse by using theMAE metric scores (Equation 16) as primary keyand the RMSE metric scores (Equation 17) as sec-ondary key.
The winning submission is SDLLW’sM5PbestDeltaAvg, with an MAE of 0.61 andan RMSE of 0.75 (the difference with respect toall the other submissions is statistically significantat p = 0.05, using pairwise bootstrap resam-pling (Koehn, 2004)). The strong, state-of-the-artquality-estimation baseline system is measured tohave an MAE of 0.69 and RMSE of 0.82, with sixother submissions having performances that arenot different from the baseline at a statistically-significant level (p = 0.05), as shown by the grayarea in the middle of Table 13). Five submissionsscored higher than the baseline system at p = 0.05(systems above the middle gray area), whichindicates that this shared-task also succeeded inpushing the state-of-the-art performance to new
32
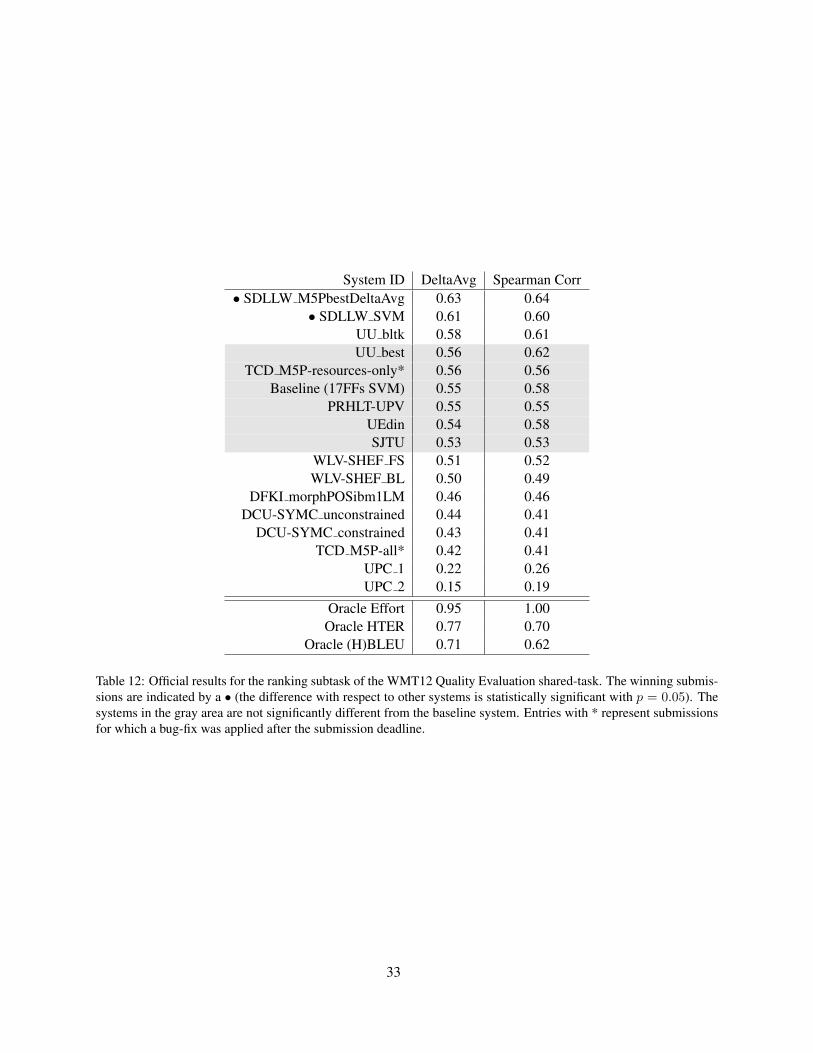
System ID DeltaAvg Spearman Corr• SDLLW M5PbestDeltaAvg 0.63 0.64
• SDLLW SVM 0.61 0.60UU bltk 0.58 0.61UU best 0.56 0.62
TCD M5P-resources-only* 0.56 0.56Baseline (17FFs SVM) 0.55 0.58
PRHLT-UPV 0.55 0.55UEdin 0.54 0.58SJTU 0.53 0.53
WLV-SHEF FS 0.51 0.52WLV-SHEF BL 0.50 0.49
DFKI morphPOSibm1LM 0.46 0.46DCU-SYMC unconstrained 0.44 0.41
DCU-SYMC constrained 0.43 0.41TCD M5P-all* 0.42 0.41
UPC 1 0.22 0.26UPC 2 0.15 0.19
Oracle Effort 0.95 1.00Oracle HTER 0.77 0.70
Oracle (H)BLEU 0.71 0.62
Table 12: Official results for the ranking subtask of the WMT12 Quality Evaluation shared-task. The winning submis-sions are indicated by a • (the difference with respect to other systems is statistically significant with p = 0.05). Thesystems in the gray area are not significantly different from the baseline system. Entries with * represent submissionsfor which a bug-fix was applied after the submission deadline.
33

System ID MAE RMSE• SDLLW M5PbestDeltaAvg 0.61 0.75
UU best 0.64 0.79SDLLW SVM 0.64 0.78
UU bltk 0.64 0.79Loria SVMlinear 0.68 0.82
UEdin 0.68 0.82TCD M5P-resources-only* 0.68 0.82
Baseline (17FFs SVM) 0.69 0.82Loria SVMrbf 0.69 0.83
SJTU 0.69 0.83WLV-SHEF FS 0.69 0.85
PRHLT-UPV 0.70 0.85WLV-SHEF BL 0.72 0.86
DCU-SYMC unconstrained 0.75 0.97DFKI grcfs-mars 0.82 0.98DFKI cfs-plsreg 0.82 0.99
UPC 1 0.84 1.01DCU-SYMC constrained 0.86 1.12
UPC 2 0.87 1.04TCD M5P-all 2.09 2.32Oracle Effort 0.00 0.00
Oracle HTER (linear mapping into [1.5-5.0]) 0.56 0.73Oracle (H)BLEU (linear mapping into [1.5-5.0]) 0.61 0.84
Table 13: Official results for the scoring subtask of the WMT12 Quality Evaluation shared-task. The winning submis-sion is indicated by a • (the difference with respect to the other submissions is statistically significant at p = 0.05).The systems in the gray area are not different from the baseline system at a statistically significant level (p = 0.05).Entries with * represent submissions for which a bug-fix was applied after the submission deadline.
34
levels in terms of absolute scoring. The range ofperformance for the submissions in the scoring taskvaries from an MAE of 0.61 up to an MAE of 0.87(the outlier MAE of 2.09 is reportedly due to bugs).
We also calculate scoring Oracles using the meth-ods used for the ranking Oracles. The difference isthat the HTER and (H)BLEU oracles need a wayof mapping their scores (which are usually in the[0, 100] range) into the [1, 5] range. For the compar-ison here, we did the mapping by excluding the 5%top and bottom outlier scores, and then linearly map-ping the remaining range into the [1.5, 5] range. The“Oracle Effort” scores are not very indicative in thiscase. However, the “Oracle HTER” MAE score of0.56 is a somewhat realistic lowerbound for the cur-rent set (although the score could be decreased by asmarter mapping from the HTER range to the Effortrange). We argue that since the HTER metric is con-sidered a good approximation for the effort requiredin post-editing, effort-like scores derived from theHTER score provide a good way to compute oraclescores in a deterministic manner. Note that againthe oracle based on (H)BLEU gives a worse MAEscore at 0.61, which support the interpretation thatthe (H)BLEU metric provides a lower correlationto post-editing effort compared to (H)TER. Over-all, we consider the MAE values for these HTERand (H)BLEU-based oracles to indicate high errormargins. Most notably the performance of the bestsystem gets the same MAE score as the (H)BLEUoracle, at 0.61 MAE. We take this to mean that thescoring task is more difficult compared to the rank-ing task, since even oracle-based solutions get higherror scores.
6.5 Discussion
When looking back at the goals that we identified forthis shared-task, most of them have been success-fully accomplished. In addition, we have achievedadditional ones that were not explicitly stated fromthe beginning. In this section, we discuss the accom-plishments of this shared-task in more detail, start-ing from the defined goals and beyond.
Identify new and effective quality indicatorsThe vast majority of the participating systems useexternal resources in addition to those provided forthe task, such as parsers, part-of-speech taggers,
named entity recognizers, etc. This has resulted ina wide variety of features being used. Many of thenovel features have tried to exploit linguistically-oriented features. While some systems did notachieve improvements over the baseline while ex-ploiting such features, others have (the “UU” sub-missions, for instance, exploiting both constituencyand dependency trees).
Another significant set of features that has beenpreviously overlooked is the feature set of the MTdecoder. Considering statistical engines, these fea-tures are immediately available for quality predic-tion from the internal trace of the MT decoder (ina glass-box prediction scenario), and its contribu-tion is significant. These features, which reflect the“confidence” of the SMT system on the translationsit produces, have been shown to be complemen-tary to other, system-independent (black-box) fea-tures. For example, the “SDLLW” submissions in-corporate these features, and their feature selectionstrategy consistently favored this feature set. Thepower of this set of features alone is enough to yield(when used with an M5P model) outputs that wouldhave been placed 4th in the ranking task and 5thin the scoring task, a remarkable achievement. An-other interesting feature used by the “SDLLW” sub-missions rely on pseudo-references, i.e., translationsproduced by other MT systems for the same inputsentence.
Identify alternative machine learning techniquesAlthough SVM regression was used to compute thebaseline performance, the baseline “system” pro-vided for the task consisted solely of a software toextract features, as opposed to a model built us-ing the regression algorithm. The rationale behindthis decision was to encourage participants to exper-iment with alternative methods for combining differ-ent quality indicators. This was achieved to a largeextent.
The best-performing machine learning techniqueswere found to be the M5P Regression Trees and theSVM Regression (SVR) models. The merit of theM5P Regression Trees is that it provides compactmodels that are less prone to overfitting. In contrast,the SVR models can easily overfit given the smallamount of training data available and the large num-bers of features commonly used. Indeed, many of
35
the submissions that fell below the baseline perfor-mance can blame overfitting for (part of) their sub-optimal performance. However, SVR models canachieve high performance through the use of tun-ing and feature selection techniques to avoid overfit-ting. Structured learning techniques were success-fully used by the “UU” submissions – the secondbest performing team – to represent parse trees. Thisseems an interesting direction to encode other sortsof linguistic information about source and trans-lation texts. Other interesting learning techniqueshave been tried, such as Neural Networks, Par-tial Least Squares Regression, or multivariate adap-tive regression splines, but their performance doesnot suggest they are strong candidates for learninghighly-performing quality-estimation models.
Test the suitability of evaluation metrics for qual-ity estimation DeltaAvg, our proposed metric formeasuring ranking performance, proved suitable forscoring the ranking subtask. Its high correlation withthe Spearman ranking metric, coupled with its ex-trinsic interpretability, makes it a preferred choicefor future measurements. It is also versatile, in thesense that the its valuation function V can change toreflect different extrinsic measures of quality.
Establish the state of the art performance Theresults on both the ranking and the scoring subtasksestablished new state of the art levels on the test setused in this shared task. In addition to these lev-els, the oracle performance numbers also help under-stand the current performance level, and how muchof a gap in performance there still exists. Addi-tional data points regarding quality estimation per-formance are needed to establish how stable thismeasure of the performance gap is.
Contrast the performance of regression andranking techniques Most of the submissions inthe ranking task used the results provided by a re-gression solution (submitted for the scoring task) toinfer the rankings. Also, optimizing for ranking per-formance via a regression solution seems to result inregression models that perform very well, as in thecase of the top-ranked submission.
6.6 Quality Estimation Conclusions
There appear to be significant differences betweenconsidering the quality estimation task as a rankingproblem versus a scoring problem. The ranking-based approach appears to be somewhat simplerand more easily amenable to automatic solutions,and at the same time provides immediate benefitswhen integrated into larger applications (see, for in-stance, the post-editing application described in Spe-cia (2011)). The scoring-based approach is more dif-ficult, as the high error rate even of oracle-based so-lutions indicates. It is also well-known from humanevaluations of MT outputs that human judges alsohave a difficult time agreeing on absolute-numberjudgements to translations.
Our experience in creating the current datasetsconfirms that, even with highly-trained profession-als, it is difficult to arrive at consistent judge-ments. We plan to have future investigations onhow to achieve more consistent ways of generatingabsolute-number scores that reflect the quality of au-tomated translations.
7 Summary
As in previous incarnations of this workshop we car-ried out an extensive manual and automatic evalu-ation of machine translation performance, and weused the human judgements that we collected to val-idate automatic metrics of translation quality. Thisyear was also the debut of a new quality estimationtask, which tries to predict the effort involved in hav-ing post editors correct MT output. The quality es-timation task differs from the metrics task in that itdoes not involve reference translations.
As in previous years, all data sets generated bythis workshop, including the human judgments, sys-tem translations and automatic scores, are publiclyavailable for other researchers to analyze.12
Acknowledgments
This work was supported in parts by the Euro-MatrixPlus project funded by the European Com-mission (7th Framework Programme), the GALEprogram of the US Defense Advanced ResearchProjects Agency, Contract No. HR0011-06-C-0022,
12http://statmt.org/wmt12/results.html
36
the US National Science Foundation under grantIIS-0713448, and the CoSyne project FP7-ICT-4-248531 funded by the European Commission. Theviews and findings are the authors’ alone. Thanksfor Adam Lopez for discussions about alternativeways of ranking the overall system scores. TheQuality Estimation shared task organizers thankWilker Aziz for his help with the SMT models andresources, and Mariano Felice for his help with thesystem for the extraction of baseline features.
ReferencesEleftherios Avramidis. 2012. Quality estimation for
machine translation output using linguistic analysisand decoding features. In Proceedings of the SeventhWorkshop on Statistical Machine Translation, Mon-treal, Canada, June. Association for ComputationalLinguistics.
Ondrej Bojar, Milos Ercegovcevic, Martin Popel, andOmar Zaidan. 2011. A grain of salt for the wmt man-ual evaluation. In Proceedings of the Sixth Workshopon Statistical Machine Translation, pages 1–11, Edin-burgh, Scotland, July. Association for ComputationalLinguistics.
Ondrej Bojar, Bushra Jawaid, and Amir Kamran. 2012.Probes in a taxonomy of factored phrase-based mod-els. In Proceedings of the Seventh Workshop on Sta-tistical Machine Translation, Montreal, Canada, June.Association for Computational Linguistics.
Christian Buck. 2012. Black box features for the WMT2012 quality estimation shared task. In Proceedings ofthe Seventh Workshop on Statistical Machine Transla-tion, Montreal, Canada, June. Association for Compu-tational Linguistics.
Chris Callison-Burch, Cameron Fordyce, Philipp Koehn,Christof Monz, and Josh Schroeder. 2007. (Meta-)evaluation of machine translation. In Proceedings ofthe Second Workshop on Statistical Machine Transla-tion (WMT07), Prague, Czech Republic.
Chris Callison-Burch, Cameron Fordyce, Philipp Koehn,Christof Monz, and Josh Schroeder. 2008. Furthermeta-evaluation of machine translation. In Proceed-ings of the Third Workshop on Statistical MachineTranslation (WMT08), Colmbus, Ohio.
Chris Callison-Burch, Philipp Koehn, Christof Monz,and Josh Schroeder. 2009. Findings of the 2009 work-shop on statistical machine translation. In Proceedingsof the Fourth Workshop on Statistical Machine Trans-lation (WMT09), Athens, Greece.
Chris Callison-Burch, Philipp Koehn, Christof Monz,Kay Peterson, Mark Przybocki, and Omar F. Zaidan.
2010. Findings of the 2010 joint workshop on statisti-cal machine translation and metrics for machine trans-lation. In Proceedings of the Fourth Workshop on Sta-tistical Machine Translation (WMT10), Uppsala, Swe-den.
Chris Callison-Burch, Philipp Koehn, Christof Monz,and Omar Zaidan. 2011. Findings of the 2011 work-shop on statistical machine translation. In Proceedingsof the Sixth Workshop on Statistical Machine Transla-tion, pages 22–64, Edinburgh, Scotland, July.
Chris Callison-Burch. 2009. Fast, cheap, and creative:Evaluating translation quality using Amazon’s Me-chanical Turk. In Proceedings of the 2009 Conferenceon Empirical Methods in Natural Language Process-ing (EMNLP-2009), Singapore.
Julio Castillo and Paula Estrella. 2012. Semantic tex-tual similarity for MT evaluation. In Proceedings ofthe Seventh Workshop on Statistical Machine Transla-tion, Montreal, Canada, June. Association for Compu-tational Linguistics.
Chih-Chung Chang and Chih-Jen Lin. 2011. LIB-SVM: A library for support vector machines. ACMTransactions on Intelligent Systems and Technology,2:27:1–27:27. Software available at http://www.csie.ntu.edu.tw/˜cjlin/libsvm.
Boxing Chen, Roland Kuhn, and George Foster. 2012.Improving amber, an MT evaluation metric. In Pro-ceedings of the Seventh Workshop on Statistical Ma-chine Translation, Montreal, Canada, June. Associa-tion for Computational Linguistics.
Jacob Cohen. 1960. A coefficient of agreement for nom-inal scales. Educational and Psychological Measur-ment, 20(1):37–46.
Michael Denkowski and Alon Lavie. 2011. Meteor 1.3:Automatic metric for reliable optimization and evalu-ation of machine translation systems. In Proceedingsof the Sixth Workshop on Statistical Machine Transla-tion.
Michael Denkowski, Greg Hanneman, and Alon Lavie.2012. The CMU-avenue French-English translationsystem. In Proceedings of the Seventh Workshop onStatistical Machine Translation, Montreal, Canada,June. Association for Computational Linguistics.
Ondrej Dusek, Zdenek Zabokrtsky, Martin Popel, Mar-tin Majlis, Michal Novak, and David Marecek. 2012.Formemes in English-Czech deep syntactic mt. InProceedings of the Seventh Workshop on StatisticalMachine Translation, Montreal, Canada, June. Asso-ciation for Computational Linguistics.
Mariano Felice and Lucia Specia. 2012. Linguistic fea-tures for quality estimation. In Proceedings of theSeventh Workshop on Statistical Machine Translation,Montreal, Canada, June. Association for Computa-tional Linguistics.
37
Mark Fishel, Rico Sennrich, Maja Popovic, and OndrejBojar. 2012. TerrorCat: a translation errorcategorization-based MT quality metric. In Proceed-ings of the Seventh Workshop on Statistical MachineTranslation, Montreal, Canada, June. Association forComputational Linguistics.
Lluis Formiga, Carlos A. Henrıquez Q., AdolfoHernandez, Jose B. Marino, Enric Monte, and JoseA. R. Fonollosa. 2012. The TALP-UPC phrase-basedtranslation systems for WMT12: Morphology simpli-fication and domain adaptation. In Proceedings ofthe Seventh Workshop on Statistical Machine Trans-lation, Montreal, Canada, June. Association for Com-putational Linguistics.
Juri Ganitkevitch, Yuan Cao, Jonathan Weese, Matt Post,and Chris Callison-Burch. 2012. Joshua 4.0: Packing,PRO, and paraphrases. In Proceedings of the SeventhWorkshop on Statistical Machine Translation, Mon-treal, Canada, June. Association for ComputationalLinguistics.
Ulrich Germann. 2012. Syntax-aware phrase-based sta-tistical machine translation: System description. InProceedings of the Seventh Workshop on StatisticalMachine Translation, Montreal, Canada, June. Asso-ciation for Computational Linguistics.
Jesus Gonzalez-Rubio, Alberto Sanchıs, and FranciscoCasacuberta. 2012. PRHLT submission to theWMT12 quality estimation task. In Proceedings ofthe Seventh Workshop on Statistical Machine Trans-lation, Montreal, Canada, June. Association for Com-putational Linguistics.
Francisco Guzman, Preslav Nakov, Ahmed Thabet, andStephan Vogel. 2012. QCRI at WMT12: Exper-iments in Spanish-English and German-English ma-chine translation of news text. In Proceedings of theSeventh Workshop on Statistical Machine Translation,Montreal, Canada, June. Association for Computa-tional Linguistics.
Christian Hardmeier, Joakim Nivre, and Jorg Tiedemann.2012. Tree kernels for machine translation qualityestimation. In Proceedings of the Seventh Workshopon Statistical Machine Translation, Montreal, Canada,June. Association for Computational Linguistics.
Christian Hardmeier. 2011. Improving machine transla-tion quality prediction with syntactic tree kernels. InProceedings of the 15th conference of the EuropeanAssociation for Machine Translation, pages 233–240,Leuven, Belgium.
Matthias Huck, Stephan Peitz, Markus Freitag, MalteNuhn, and Hermann Ney. 2012. The RWTH aachenmachine translation system for WMT 2012. In Pro-ceedings of the Seventh Workshop on Statistical Ma-chine Translation, Montreal, Canada, June. Associa-tion for Computational Linguistics.
Sabine Hunsicker, Chen Yu, and Christian Federmann.2012. Machine learning for hybrid machine transla-tion. In Proceedings of the Seventh Workshop on Sta-tistical Machine Translation, Montreal, Canada, June.Association for Computational Linguistics.
Philipp Koehn and Barry Haddow. 2012. Towards effec-tive use of training data in statistical machine transla-tion. In Proceedings of the Seventh Workshop on Sta-tistical Machine Translation, Montreal, Canada, June.Association for Computational Linguistics.
Philipp Koehn and Christof Monz. 2006. Manual andautomatic evaluation of machine translation betweenEuropean languages. In Proceedings of NAACL 2006Workshop on Statistical Machine Translation, NewYork, New York.
Philipp Koehn. 2004. Statistical Significance Tests forMachine Translation Evaluation. In Proceedings ofthe Empirical Methods in Natural Language Process-ing Conference.
J. Richard Landis and Gary G. Koch. 1977. The mea-surement of observer agreement for categorical data.Biometrics, 33:159–174.
David Langlois, Sylvain Raybaud, and Kamel Smaıli.2012. LORIA system for the WMT12 quality esti-mation shared task. In Proceedings of the SeventhWorkshop on Statistical Machine Translation, Mon-treal, Canada, June. Association for ComputationalLinguistics.
Hai-Son Le, Thomas Lavergne, Alexandre Allauzen,Marianna Apidianaki, Li Gong, Aurelien Max, ArtemSokolov, Guillaume Wisniewski, and Francois Yvon.2012. LIMSI @ WMT12. In Proceedings of theSeventh Workshop on Statistical Machine Translation,Montreal, Canada, June. Association for Computa-tional Linguistics.
Veronica Lopez-Ludena, Ruben San-Segundo, andJuan M. Montero. 2012. UPM system for WMT 2012.In Proceedings of the Seventh Workshop on StatisticalMachine Translation, Montreal, Canada, June. Asso-ciation for Computational Linguistics.
Adam Lopez. 2012. Putting human assessments of ma-chine translation systems in order. In Proceedings ofthe Seventh Workshop on Statistical Machine Transla-tion, Montreal, Canada, June. Association for Compu-tational Linguistics.
Matous Machacek and Ondej Bojar. 2011. Approxi-mating a deep-syntactic metric for mt evaluation andtuning. In Proceedings of the Sixth Workshop on Sta-tistical Machine Translation, pages 373–379, Edin-burgh, Scotland, July. Association for ComputationalLinguistics.
Freitag Markus, Peitz Stephan, Huck Matthias, Ney Her-mann, Niehues Jan, Herrmann Teresa, Waibel Alex,
38
Hai-son Le, Lavergne Thomas, Allauzen Alexandre,Buschbeck Bianka, Crego Joseph Maria, and Senel-lart Jean. 2012. Joint WMT 2012 submission ofthe QUAERO project. In Proceedings of the SeventhWorkshop on Statistical Machine Translation, Mon-treal, Canada, June. Association for ComputationalLinguistics.
Alexander Molchanov. 2012. PROMT deephybrid sys-tem for WMT12 shared translation task. In Proceed-ings of the Seventh Workshop on Statistical MachineTranslation, Montreal, Canada, June. Association forComputational Linguistics.
Erwan Moreau and Carl Vogel. 2012. Quality estima-tion: an experimental study using unsupervised simi-larity measures. In Proceedings of the Seventh Work-shop on Statistical Machine Translation, Montreal,Canada, June. Association for Computational Linguis-tics.
Jan Niehues, Yuqi Zhang, Mohammed Mediani, TeresaHerrmann, Eunah Cho, and Alex Waibel. 2012. Thekarlsruhe institute of technology translation systemsfor the WMT 2012. In Proceedings of the SeventhWorkshop on Statistical Machine Translation, Mon-treal, Canada, June. Association for ComputationalLinguistics.
Daniele Pighin, Meritxell Gonzalez, and Lluıs Marquez.2012. The upc submission to the WMT 2012 sharedtask on quality estimation. In Proceedings of theSeventh Workshop on Statistical Machine Translation,Montreal, Canada, June. Association for Computa-tional Linguistics.
Maja Popovic. 2012. Class error rates for evaluationof machine translation output. In Proceedings of theSeventh Workshop on Statistical Machine Translation,Montreal, Canada, June. Association for Computa-tional Linguistics.
Sylvain Raybaud, David Langlois, and Kamel Smaıli.2011. ”This sentence is wrong.” Detecting errors inmachine-translated sentences. Machine Translation,25(1):1–34.
Majid Razmara, Baskaran Sankaran, Ann Clifton, andAnoop Sarkar. 2012. Kriya - the SFU system fortranslation task at WMT-12. In Proceedings of theSeventh Workshop on Statistical Machine Translation,Montreal, Canada, June. Association for Computa-tional Linguistics.
Rudolf Rosa, David Marecek, and Ondrej Dusek. 2012.DEPFIX: A system for automatic correction of czechMT outputs. In Proceedings of the Seventh Workshopon Statistical Machine Translation, Montreal, Canada,June. Association for Computational Linguistics.
Raphael Rubino, Jennifer Foster, Joachim Wagner, Jo-hann Roturier, Rasul Samad Zadeh Kaljahi, and FredHollowood. 2012. DCU-Symantec submission for the
WMT 2012 quality estimation task. In Proceedings ofthe Seventh Workshop on Statistical Machine Transla-tion, Montreal, Canada, June. Association for Compu-tational Linguistics.
Christophe Servan, Patrik Lambert, Anthony Rousseau,Holger Schwenk, and Loıc Barrault. 2012. LIUM’ssmt machine translation systems for WMT 2012. InProceedings of the Seventh Workshop on StatisticalMachine Translation, Montreal, Canada, June. Asso-ciation for Computational Linguistics.
Xingyi Song and Trevor Cohn. 2011. Regression andranking based optimisation for sentence level MT eval-uation. In Proceedings of the Sixth Workshop on Sta-tistical Machine Translation.
Radu Soricut, Nguyen Bach, and Ziyuan Wang. 2012.The SDL Language Weaver systems in the WMT12quality estimation shared task. In Proceedings of theSeventh Workshop on Statistical Machine Translation,Montreal, Canada, June. Association for Computa-tional Linguistics.
Lucia Specia, Marco Turchi, Nicola Cancedda, MarcDymetman, and Nello Cristianini. 2009. Estimat-ing the Sentence-Level Quality of Machine Transla-tion Systems. In Proceedings of the 13th Conferenceof the European Association for Machine Translation,pages 28–37, Barcelona.
Lucia Specia. 2011. Exploiting Objective Annotationsfor Measuring Translation Post-editing Effort. In Pro-ceedings of the 15th Conference of the European As-sociation for Machine Translation, pages 73–80, Leu-ven.
Ales Tamchyna, Petra Galuscakova, Amir Kamran, MilosStanojevic, and Ondrej Bojar. 2012. Selecting data forEnglish-to-Czech machine translation. In Proceedingsof the Seventh Workshop on Statistical Machine Trans-lation, Montreal, Canada, June. Association for Com-putational Linguistics.
David Vilar. 2012. DFKI’s smt system for WMT 2012.In Proceedings of the Seventh Workshop on StatisticalMachine Translation, Montreal, Canada, June. Asso-ciation for Computational Linguistics.
Mengqiu Wang and Christopher Manning. 2012.SPEDE: Probabilistic edit distance metrics for MTevaluation. In Proceedings of the Seventh Workshopon Statistical Machine Translation, Montreal, Canada,June. Association for Computational Linguistics.
Eric Wehrli, Luka Nerima, and Yves Scherrer. 2009.Deep linguistic multilingual translation and bilingualdictionaries. In Proceedings of the Fourth Workshopon Statistical Machine Translation, pages 90–94.
Philip Williams and Philipp Koehn. 2012. GHKM ruleextraction and scope-3 parsing in Moses. In Proceed-ings of the Seventh Workshop on Statistical Machine
39
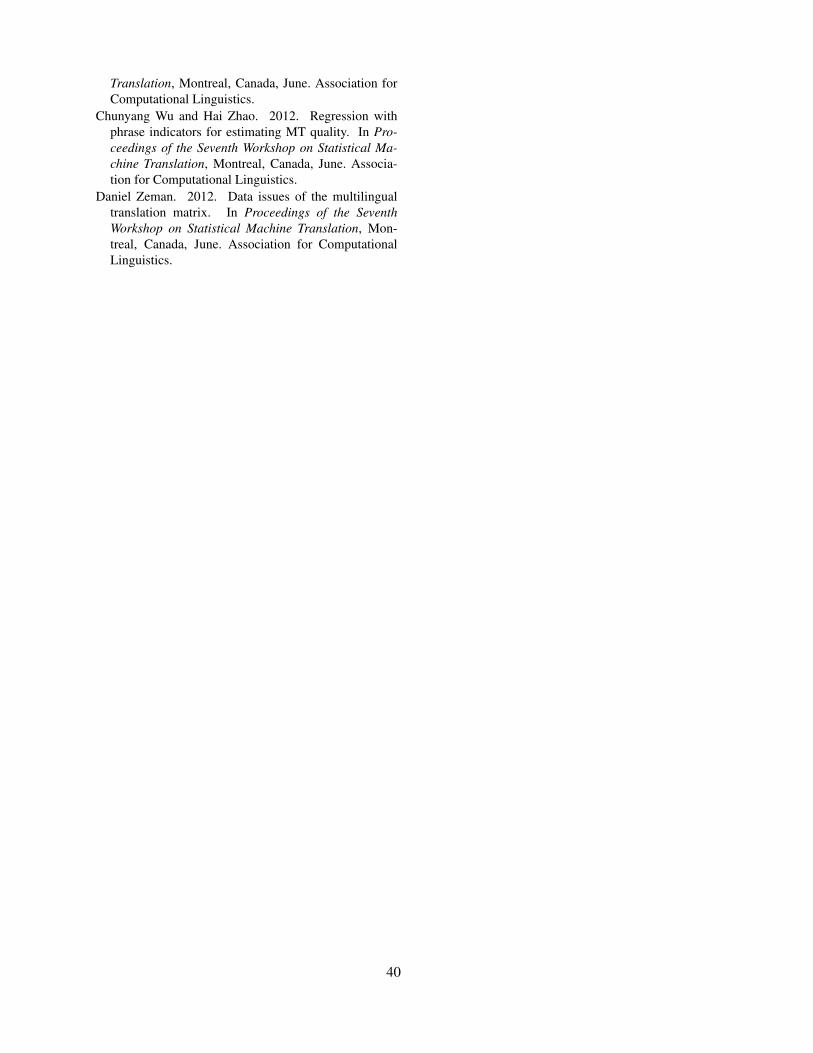
Translation, Montreal, Canada, June. Association forComputational Linguistics.
Chunyang Wu and Hai Zhao. 2012. Regression withphrase indicators for estimating MT quality. In Pro-ceedings of the Seventh Workshop on Statistical Ma-chine Translation, Montreal, Canada, June. Associa-tion for Computational Linguistics.
Daniel Zeman. 2012. Data issues of the multilingualtranslation matrix. In Proceedings of the SeventhWorkshop on Statistical Machine Translation, Mon-treal, Canada, June. Association for ComputationalLinguistics.
40
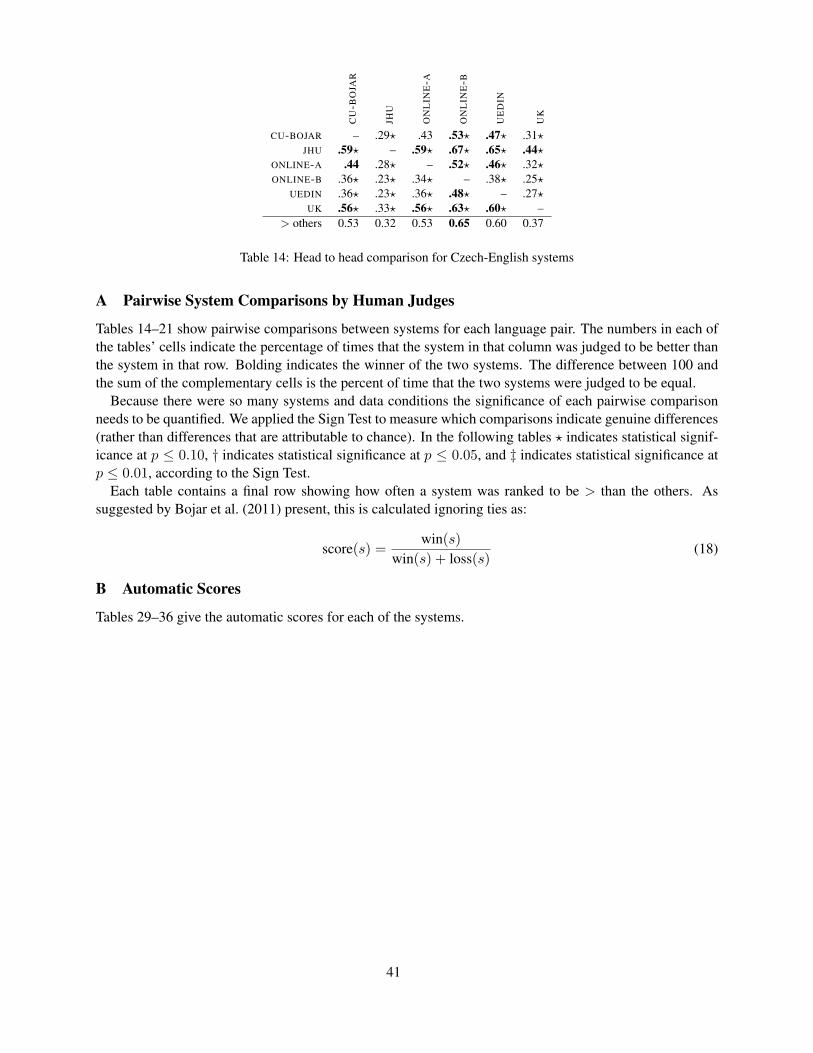
CU
-BO
JAR
JHU
ON
LIN
E-A
ON
LIN
E-B
UE
DIN
UK
CU-BOJAR – .29? .43 .53? .47? .31?JHU .59? – .59? .67? .65? .44?
ONLINE-A .44 .28? – .52? .46? .32?ONLINE-B .36? .23? .34? – .38? .25?
UEDIN .36? .23? .36? .48? – .27?UK .56? .33? .56? .63? .60? –
> others 0.53 0.32 0.53 0.65 0.60 0.37
Table 14: Head to head comparison for Czech-English systems
A Pairwise System Comparisons by Human Judges
Tables 14–21 show pairwise comparisons between systems for each language pair. The numbers in each ofthe tables’ cells indicate the percentage of times that the system in that column was judged to be better thanthe system in that row. Bolding indicates the winner of the two systems. The difference between 100 andthe sum of the complementary cells is the percent of time that the two systems were judged to be equal.
Because there were so many systems and data conditions the significance of each pairwise comparisonneeds to be quantified. We applied the Sign Test to measure which comparisons indicate genuine differences(rather than differences that are attributable to chance). In the following tables ? indicates statistical signif-icance at p ≤ 0.10, † indicates statistical significance at p ≤ 0.05, and ‡ indicates statistical significance atp ≤ 0.01, according to the Sign Test.
Each table contains a final row showing how often a system was ranked to be > than the others. Assuggested by Bojar et al. (2011) present, this is calculated ignoring ties as:
score(s) =win(s)
win(s) + loss(s)(18)
B Automatic Scores
Tables 29–36 give the automatic scores for each of the systems.
41
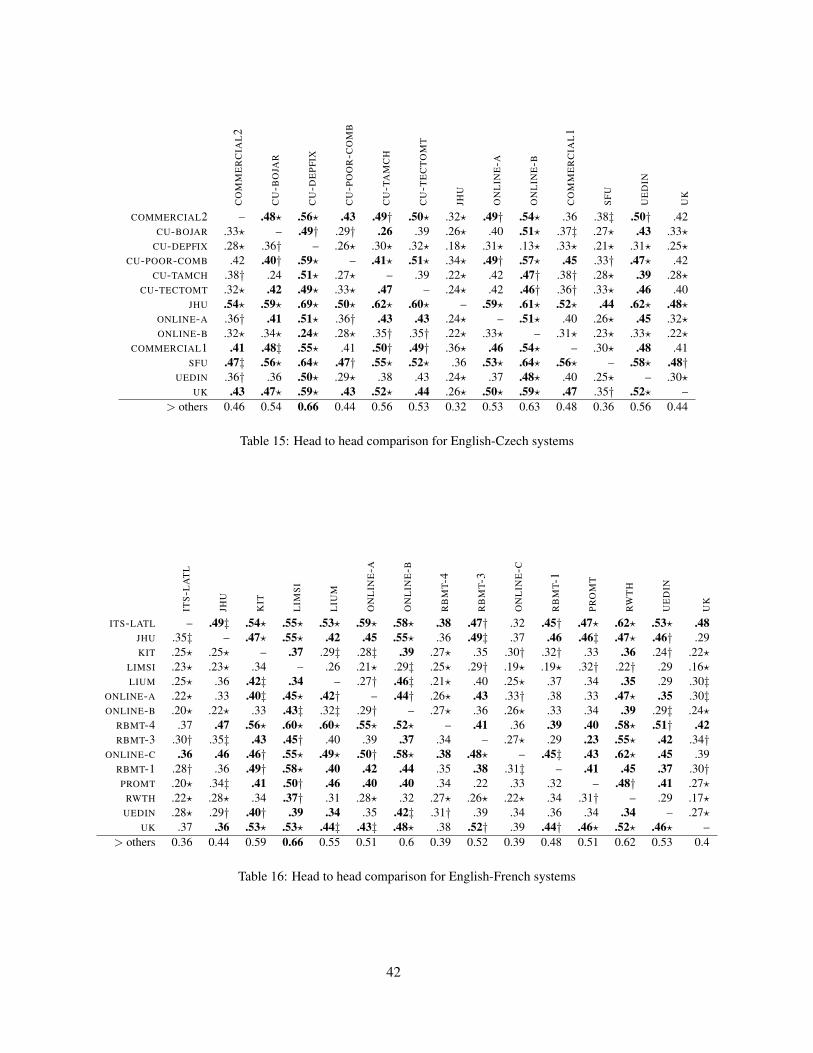
CO
MM
ER
CIA
L2
CU
-BO
JAR
CU
-DE
PFI
X
CU
-PO
OR
-CO
MB
CU
-TA
MC
H
CU
-TE
CT
OM
T
JHU
ON
LIN
E-A
ON
LIN
E-B
CO
MM
ER
CIA
L1
SF
U
UE
DIN
UK
COMMERCIAL2 – .48? .56? .43 .49† .50? .32? .49† .54? .36 .38‡ .50† .42CU-BOJAR .33? – .49† .29† .26 .39 .26? .40 .51? .37‡ .27? .43 .33?
CU-DEPFIX .28? .36† – .26? .30? .32? .18? .31? .13? .33? .21? .31? .25?CU-POOR-COMB .42 .40† .59? – .41? .51? .34? .49† .57? .45 .33† .47? .42
CU-TAMCH .38† .24 .51? .27? – .39 .22? .42 .47† .38† .28? .39 .28?CU-TECTOMT .32? .42 .49? .33? .47 – .24? .42 .46† .36† .33? .46 .40
JHU .54? .59? .69? .50? .62? .60? – .59? .61? .52? .44 .62? .48?ONLINE-A .36† .41 .51? .36† .43 .43 .24? – .51? .40 .26? .45 .32?ONLINE-B .32? .34? .24? .28? .35† .35† .22? .33? – .31? .23? .33? .22?
COMMERCIAL1 .41 .48‡ .55? .41 .50† .49† .36? .46 .54? – .30? .48 .41SFU .47‡ .56? .64? .47† .55? .52? .36 .53? .64? .56? – .58? .48†
UEDIN .36† .36 .50? .29? .38 .43 .24? .37 .48? .40 .25? – .30?UK .43 .47? .59? .43 .52? .44 .26? .50? .59? .47 .35† .52? –
> others 0.46 0.54 0.66 0.44 0.56 0.53 0.32 0.53 0.63 0.48 0.36 0.56 0.44
Table 15: Head to head comparison for English-Czech systems
ITS-L
AT
L
JHU
KIT
LIM
SI
LIU
M
ON
LIN
E-A
ON
LIN
E-B
RB
MT-
4
RB
MT-
3
ON
LIN
E-C
RB
MT-
1
PR
OM
T
RW
TH
UE
DIN
UK
ITS-LATL – .49‡ .54? .55? .53? .59? .58? .38 .47† .32 .45† .47? .62? .53? .48JHU .35‡ – .47? .55? .42 .45 .55? .36 .49‡ .37 .46 .46‡ .47? .46† .29KIT .25? .25? – .37 .29‡ .28‡ .39 .27? .35 .30† .32† .33 .36 .24† .22?
LIMSI .23? .23? .34 – .26 .21? .29‡ .25? .29† .19? .19? .32† .22† .29 .16?LIUM .25? .36 .42‡ .34 – .27† .46‡ .21? .40 .25? .37 .34 .35 .29 .30‡
ONLINE-A .22? .33 .40‡ .45? .42† – .44† .26? .43 .33† .38 .33 .47? .35 .30‡ONLINE-B .20? .22? .33 .43‡ .32‡ .29† – .27? .36 .26? .33 .34 .39 .29‡ .24?
RBMT-4 .37 .47 .56? .60? .60? .55? .52? – .41 .36 .39 .40 .58? .51† .42RBMT-3 .30† .35‡ .43 .45† .40 .39 .37 .34 – .27? .29 .23 .55? .42 .34†
ONLINE-C .36 .46 .46† .55? .49? .50† .58? .38 .48? – .45‡ .43 .62? .45 .39RBMT-1 .28† .36 .49† .58? .40 .42 .44 .35 .38 .31‡ – .41 .45 .37 .30†PROMT .20? .34‡ .41 .50† .46 .40 .40 .34 .22 .33 .32 – .48† .41 .27?
RWTH .22? .28? .34 .37† .31 .28? .32 .27? .26? .22? .34 .31† – .29 .17?UEDIN .28? .29† .40† .39 .34 .35 .42‡ .31† .39 .34 .36 .34 .34 – .27?
UK .37 .36 .53? .53? .44‡ .43‡ .48? .38 .52† .39 .44† .46? .52? .46? –> others 0.36 0.44 0.59 0.66 0.55 0.51 0.6 0.39 0.52 0.39 0.48 0.51 0.62 0.53 0.4
Table 16: Head to head comparison for English-French systems
42

DF
KI-
BE
RL
IN
DF
KI-
HU
NS
ICK
ER
JHU
KIT
LIM
SI
ON
LIN
E-A
ON
LIN
E-B
RB
MT-
4
RB
MT-
3
ON
LIN
E-C
RB
MT-
1
RW
TH
UE
DIN
-WIL
LIA
MS
UE
DIN
UK
DFKI-BERLIN – .62? .58? .64? .71? .68? .80? .68? .71? .58? .65? .62? .64? .61? .60?DFKI-HUNSICKER .28? – .42 .48 .51‡ .47 .52† .49? .57? .38 .53? .39 .39 .41 .39
JHU .24? .45 – .43† .43 .47‡ .62? .56? .60? .46 .47‡ .46† .47† .39 .42KIT .22? .41 .27† – .39 .45 .60? .54? .58? .37 .47 .33 .43 .39 .26?
LIMSI .15? .37‡ .34 .36 – .47 .49‡ .43 .43 .35 .48 .36 .37 .32 .31?ONLINE-A .20? .37 .35‡ .41 .39 – .45† .42 .51† .38 .49 .42 .40 .37 .36‡ONLINE-B .15? .35† .26? .27? .35‡ .30† – .45 .35‡ .29? .41 .30? .34? .30? .18?
RBMT-4 .25? .22? .31? .31? .45 .45 .42 – .41 .38 .40 .44 .35† .36† .36†RBMT-3 .18? .27? .24? .28? .38 .36† .49‡ .41 – .33? .26? .29? .28? .31? .34†
ONLINE-C .27? .47 .35 .49 .46 .44 .63? .48 .55? – .49† .40 .43 .43 .46RBMT-1 .19? .30? .33‡ .41 .41 .39 .45 .45 .50? .32† – .34† .40 .39 .39
RWTH .20? .43 .30† .45 .45 .44 .58? .50 .58? .43 .53† – .41 .40 .41UEDIN-WILLIAMS .20? .46 .30† .36 .36 .45 .54? .52† .54? .41 .46 .38 – .32 .30†
UEDIN .20? .45 .40 .38 .43 .48 .56? .56† .53? .47 .48 .29 .39 – .35UK .25? .49 .40 .45? .51? .49‡ .64? .51† .52† .44 .47 .34 .48† .40 –
> others 0.25 0.48 0.43 0.50 0.55 0.54 0.64 0.58 0.63 0.47 0.56 0.47 0.51 0.47 0.45
Table 17: Head to head comparison for English-German systems
JHU
ON
LIN
E-A
ON
LIN
E-B
RB
MT-
4
RB
MT-
3
ON
LIN
E-C
RB
MT-
1
PR
OM
T
UE
DIN
UK
UP
C
JHU – .52? .59? .50? .58? .48? .49‡ .56? .48? .44† .52?ONLINE-A .27? – .45 .34? .44 .31? .31? .44 .37 .28? .37ONLINE-B .21? .37 – .28? .35‡ .25? .28? .31? .30? .23? .31?
RBMT-4 .35? .52? .56? – .49† .39 .40 .46† .45 .38‡ .45RBMT-3 .26? .39 .46‡ .34† – .32? .28? .24 .34† .32? .37
ONLINE-C .33? .54? .61? .40 .47? – .43 .50? .50? .42 .48RBMT-1 .39‡ .51? .61? .39 .49? .34 – .47† .50† .39 .46PROMT .28? .41 .51? .33† .29 .33? .34† – .42 .32? .40UEDIN .25? .41 .48? .38 .47† .30? .35† .43 – .28? .39
UK .31† .52? .57? .48‡ .53? .42 .44 .52? .42? – .50?UPC .24? .40 .53? .40 .43 .39 .39 .46 .36 .28? –
> others 0.36 0.56 0.65 0.46 0.58 0.43 0.45 0.55 0.52 0.41 0.52
Table 18: Head to head comparison for English-Spanish systems
43
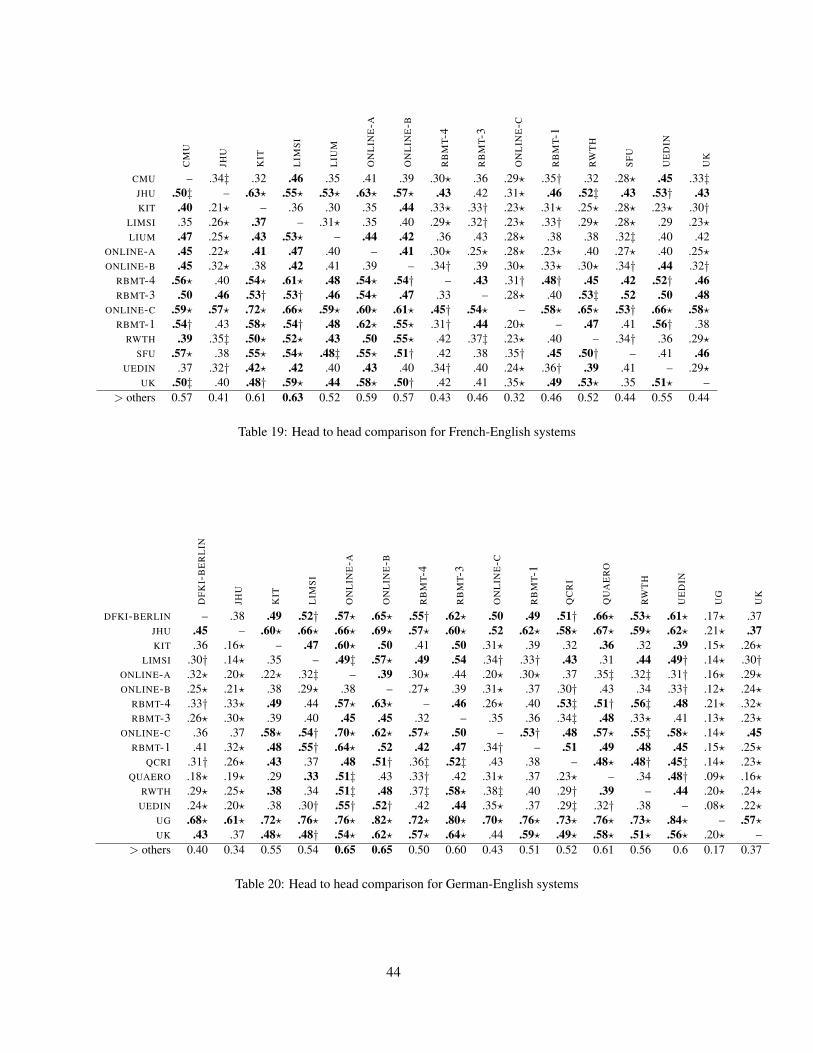
CM
U
JHU
KIT
LIM
SI
LIU
M
ON
LIN
E-A
ON
LIN
E-B
RB
MT-
4
RB
MT-
3
ON
LIN
E-C
RB
MT-
1
RW
TH
SF
U
UE
DIN
UK
CMU – .34‡ .32 .46 .35 .41 .39 .30? .36 .29? .35† .32 .28? .45 .33‡JHU .50‡ – .63? .55? .53? .63? .57? .43 .42 .31? .46 .52‡ .43 .53† .43KIT .40 .21? – .36 .30 .35 .44 .33? .33† .23? .31? .25? .28? .23? .30†
LIMSI .35 .26? .37 – .31? .35 .40 .29? .32† .23? .33† .29? .28? .29 .23?LIUM .47 .25? .43 .53? – .44 .42 .36 .43 .28? .38 .38 .32‡ .40 .42
ONLINE-A .45 .22? .41 .47 .40 – .41 .30? .25? .28? .23? .40 .27? .40 .25?ONLINE-B .45 .32? .38 .42 .41 .39 – .34† .39 .30? .33? .30? .34† .44 .32†
RBMT-4 .56? .40 .54? .61? .48 .54? .54† – .43 .31† .48† .45 .42 .52† .46RBMT-3 .50 .46 .53† .53† .46 .54? .47 .33 – .28? .40 .53‡ .52 .50 .48
ONLINE-C .59? .57? .72? .66? .59? .60? .61? .45† .54? – .58? .65? .53† .66? .58?RBMT-1 .54† .43 .58? .54† .48 .62? .55? .31† .44 .20? – .47 .41 .56† .38
RWTH .39 .35‡ .50? .52? .43 .50 .55? .42 .37‡ .23? .40 – .34† .36 .29?SFU .57? .38 .55? .54? .48‡ .55? .51† .42 .38 .35† .45 .50† – .41 .46
UEDIN .37 .32† .42? .42 .40 .43 .40 .34† .40 .24? .36† .39 .41 – .29?UK .50‡ .40 .48† .59? .44 .58? .50† .42 .41 .35? .49 .53? .35 .51? –
> others 0.57 0.41 0.61 0.63 0.52 0.59 0.57 0.43 0.46 0.32 0.46 0.52 0.44 0.55 0.44
Table 19: Head to head comparison for French-English systems
DF
KI-
BE
RL
IN
JHU
KIT
LIM
SI
ON
LIN
E-A
ON
LIN
E-B
RB
MT-
4
RB
MT-
3
ON
LIN
E-C
RB
MT-
1
QC
RI
QU
AE
RO
RW
TH
UE
DIN
UG
UK
DFKI-BERLIN – .38 .49 .52† .57? .65? .55† .62? .50 .49 .51† .66? .53? .61? .17? .37JHU .45 – .60? .66? .66? .69? .57? .60? .52 .62? .58? .67? .59? .62? .21? .37KIT .36 .16? – .47 .60? .50 .41 .50 .31? .39 .32 .36 .32 .39 .15? .26?
LIMSI .30† .14? .35 – .49‡ .57? .49 .54 .34† .33† .43 .31 .44 .49† .14? .30†ONLINE-A .32? .20? .22? .32‡ – .39 .30? .44 .20? .30? .37 .35‡ .32‡ .31† .16? .29?ONLINE-B .25? .21? .38 .29? .38 – .27? .39 .31? .37 .30† .43 .34 .33† .12? .24?
RBMT-4 .33† .33? .49 .44 .57? .63? – .46 .26? .40 .53‡ .51† .56‡ .48 .21? .32?RBMT-3 .26? .30? .39 .40 .45 .45 .32 – .35 .36 .34‡ .48 .33? .41 .13? .23?
ONLINE-C .36 .37 .58? .54† .70? .62? .57? .50 – .53† .48 .57? .55‡ .58? .14? .45RBMT-1 .41 .32? .48 .55† .64? .52 .42 .47 .34† – .51 .49 .48 .45 .15? .25?
QCRI .31† .26? .43 .37 .48 .51† .36‡ .52‡ .43 .38 – .48? .48† .45‡ .14? .23?QUAERO .18? .19? .29 .33 .51‡ .43 .33† .42 .31? .37 .23? – .34 .48† .09? .16?
RWTH .29? .25? .38 .34 .51‡ .48 .37‡ .58? .38‡ .40 .29† .39 – .44 .20? .24?UEDIN .24? .20? .38 .30† .55† .52† .42 .44 .35? .37 .29‡ .32† .38 – .08? .22?
UG .68? .61? .72? .76? .76? .82? .72? .80? .70? .76? .73? .76? .73? .84? – .57?UK .43 .37 .48? .48† .54? .62? .57? .64? .44 .59? .49? .58? .51? .56? .20? –
> others 0.40 0.34 0.55 0.54 0.65 0.65 0.50 0.60 0.43 0.51 0.52 0.61 0.56 0.6 0.17 0.37
Table 20: Head to head comparison for German-English systems
44
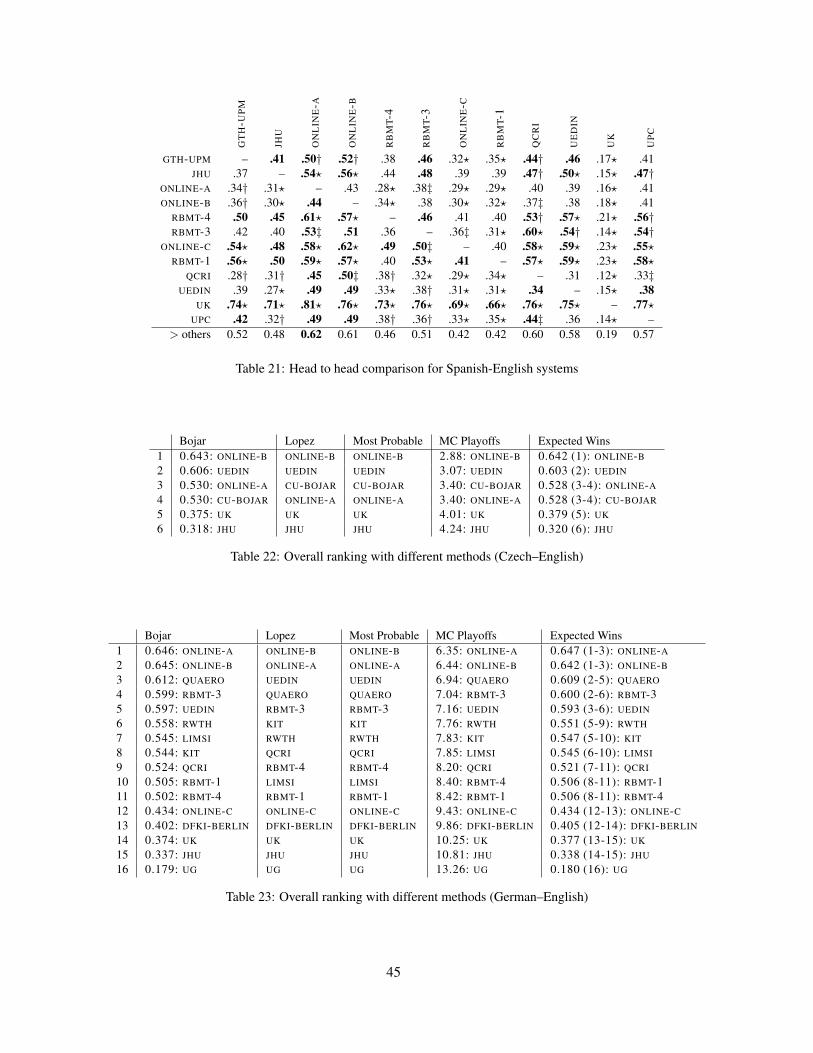
GT
H-U
PM
JHU
ON
LIN
E-A
ON
LIN
E-B
RB
MT-
4
RB
MT-
3
ON
LIN
E-C
RB
MT-
1
QC
RI
UE
DIN
UK
UP
C
GTH-UPM – .41 .50† .52† .38 .46 .32? .35? .44† .46 .17? .41JHU .37 – .54? .56? .44 .48 .39 .39 .47† .50? .15? .47†
ONLINE-A .34† .31? – .43 .28? .38‡ .29? .29? .40 .39 .16? .41ONLINE-B .36† .30? .44 – .34? .38 .30? .32? .37‡ .38 .18? .41
RBMT-4 .50 .45 .61? .57? – .46 .41 .40 .53† .57? .21? .56†RBMT-3 .42 .40 .53‡ .51 .36 – .36‡ .31? .60? .54† .14? .54†
ONLINE-C .54? .48 .58? .62? .49 .50‡ – .40 .58? .59? .23? .55?RBMT-1 .56? .50 .59? .57? .40 .53? .41 – .57? .59? .23? .58?
QCRI .28† .31† .45 .50‡ .38† .32? .29? .34? – .31 .12? .33‡UEDIN .39 .27? .49 .49 .33? .38† .31? .31? .34 – .15? .38
UK .74? .71? .81? .76? .73? .76? .69? .66? .76? .75? – .77?UPC .42 .32† .49 .49 .38† .36† .33? .35? .44‡ .36 .14? –
> others 0.52 0.48 0.62 0.61 0.46 0.51 0.42 0.42 0.60 0.58 0.19 0.57
Table 21: Head to head comparison for Spanish-English systems
Bojar Lopez Most Probable MC Playoffs Expected Wins1 0.643: ONLINE-B ONLINE-B ONLINE-B 2.88: ONLINE-B 0.642 (1): ONLINE-B
2 0.606: UEDIN UEDIN UEDIN 3.07: UEDIN 0.603 (2): UEDIN
3 0.530: ONLINE-A CU-BOJAR CU-BOJAR 3.40: CU-BOJAR 0.528 (3-4): ONLINE-A
4 0.530: CU-BOJAR ONLINE-A ONLINE-A 3.40: ONLINE-A 0.528 (3-4): CU-BOJAR
5 0.375: UK UK UK 4.01: UK 0.379 (5): UK
6 0.318: JHU JHU JHU 4.24: JHU 0.320 (6): JHU
Table 22: Overall ranking with different methods (Czech–English)
Bojar Lopez Most Probable MC Playoffs Expected Wins1 0.646: ONLINE-A ONLINE-B ONLINE-B 6.35: ONLINE-A 0.647 (1-3): ONLINE-A
2 0.645: ONLINE-B ONLINE-A ONLINE-A 6.44: ONLINE-B 0.642 (1-3): ONLINE-B
3 0.612: QUAERO UEDIN UEDIN 6.94: QUAERO 0.609 (2-5): QUAERO
4 0.599: RBMT-3 QUAERO QUAERO 7.04: RBMT-3 0.600 (2-6): RBMT-35 0.597: UEDIN RBMT-3 RBMT-3 7.16: UEDIN 0.593 (3-6): UEDIN
6 0.558: RWTH KIT KIT 7.76: RWTH 0.551 (5-9): RWTH
7 0.545: LIMSI RWTH RWTH 7.83: KIT 0.547 (5-10): KIT
8 0.544: KIT QCRI QCRI 7.85: LIMSI 0.545 (6-10): LIMSI
9 0.524: QCRI RBMT-4 RBMT-4 8.20: QCRI 0.521 (7-11): QCRI
10 0.505: RBMT-1 LIMSI LIMSI 8.40: RBMT-4 0.506 (8-11): RBMT-111 0.502: RBMT-4 RBMT-1 RBMT-1 8.42: RBMT-1 0.506 (8-11): RBMT-412 0.434: ONLINE-C ONLINE-C ONLINE-C 9.43: ONLINE-C 0.434 (12-13): ONLINE-C
13 0.402: DFKI-BERLIN DFKI-BERLIN DFKI-BERLIN 9.86: DFKI-BERLIN 0.405 (12-14): DFKI-BERLIN
14 0.374: UK UK UK 10.25: UK 0.377 (13-15): UK
15 0.337: JHU JHU JHU 10.81: JHU 0.338 (14-15): JHU
16 0.179: UG UG UG 13.26: UG 0.180 (16): UG
Table 23: Overall ranking with different methods (German–English)
45

Bojar Lopez Most Probable MC Playoffs Expected Wins1 0.630: LIMSI LIMSI LIMSI 6.33: LIMSI 0.626 (1-3): LIMSI
2 0.613: KIT CMU CMU 6.55: KIT 0.610 (1-4): KIT
3 0.593: ONLINE-A ONLINE-B ONLINE-B 6.80: ONLINE-A 0.592 (1-5): ONLINE-A
4 0.573: CMU KIT KIT 7.06: CMU 0.571 (2-6): CMU
5 0.569: ONLINE-B ONLINE-A ONLINE-A 7.12: ONLINE-B 0.567 (3-7): ONLINE-B
6 0.546: UEDIN LIUM LIUM 7.51: UEDIN 0.538 (5-8): UEDIN
7 0.523: LIUM RWTH RWTH 7.73: LIUM 0.522 (5-8): LIUM
8 0.515: RWTH UEDIN UEDIN 7.88: RWTH 0.510 (6-9): RWTH
9 0.459: RBMT-1 RBMT-1 RBMT-1 8.51: RBMT-1 0.463 (8-12): RBMT-110 0.457: RBMT-3 UK UK 8.56: RBMT-3 0.458 (9-13): RBMT-311 0.444: UK SFU SFU 8.75: SFU 0.444 (9-14): SFU
12 0.444: SFU RBMT-3 RBMT-3 8.78: UK 0.441 (9-14): UK
13 0.429: RBMT-4 RBMT-4 RBMT-4 8.92: RBMT-4 0.430 (10-14): RBMT-414 0.412: JHU JHU JHU 9.19: JHU 0.409 (12-14): JHU
15 0.321: ONLINE-C ONLINE-C ONLINE-C 10.31: ONLINE-C 0.319 (15): ONLINE-C
Table 24: Overall ranking with different methods (French–English)
Bojar Lopez Most Probable MC Playoffs Expected Wins1 0.617: ONLINE-A ONLINE-A ONLINE-A 5.38: ONLINE-A 0.617 (1-4): ONLINE-A
2 0.612: ONLINE-B ONLINE-B ONLINE-B 5.43: ONLINE-B 0.611 (1-4): ONLINE-B
3 0.603: QCRI QCRI QCRI 5.56: QCRI 0.600 (1-4): QCRI
4 0.585: UEDIN UPC UPC 5.75: UEDIN 0.581 (2-5): UEDIN
5 0.565: UPC UEDIN UEDIN 5.89: UPC 0.567 (3-6): UPC
6 0.528: GTH-UPM RBMT-3 RBMT-3 6.29: GTH-UPM 0.526 (5-7): GTH-UPM
7 0.512: RBMT-3 JHU JHU 6.37: RBMT-3 0.518 (6-8): RBMT-38 0.477: JHU GTH-UPM GTH-UPM 6.73: JHU 0.480 (7-9): JHU
9 0.461: RBMT-4 RBMT-4 RBMT-4 6.92: RBMT-4 0.460 (8-10): RBMT-410 0.423: RBMT-1 ONLINE-C ONLINE-C 7.19: RBMT-1 0.429 (9-11): RBMT-111 0.420: ONLINE-C RBMT-1 RBMT-1 7.24: ONLINE-C 0.423 (9-11): ONLINE-C
12 0.189: UK UK UK 9.25: UK 0.188 (12): UK
Table 25: Overall ranking with different methods (Spanish–English)
Bojar Lopez Most Probable MC Playoffs Expected Wins1 0.662: CU-DEPFIX CU-DEPFIX CU-DEPFIX 5.25: CU-DEPFIX 0.660 (1): CU-DEPFIX
2 0.628: ONLINE-B ONLINE-B ONLINE-B 5.78: ONLINE-B 0.616 (2): ONLINE-B
3 0.557: UEDIN UEDIN UEDIN 6.42: UEDIN 0.557 (3-6): UEDIN
4 0.555: CU-TAMCH CU-TAMCH CU-TAMCH 6.45: CU-TAMCH 0.555 (3-6): CU-TAMCH
5 0.543: CU-BOJAR CU-BOJAR CU-BOJAR 6.58: CU-BOJAR 0.541 (3-7): CU-BOJAR
6 0.531: CU-TECTOMT CU-TECTOMT CU-TECTOMT 6.69: CU-TECTOMT 0.532 (4-7): CU-TECTOMT
7 0.528: ONLINE-A ONLINE-A ONLINE-A 6.72: ONLINE-A 0.529 (4-7): ONLINE-A
8 0.478: COMMERCIAL1 COMMERCIAL2 COMMERCIAL2 7.27: COMMERCIAL1 0.477 (8-10): COMMERCIAL19 0.459: COMMERCIAL2 COMMERCIAL1 COMMERCIAL1 7.46: COMMERCIAL2 0.459 (8-11): COMMERCIAL210 0.442: CU-POOR-COMB CU-POOR-COMB CU-POOR-COMB 7.61: CU-POOR-COMB 0.443 (9-11): CU-POOR-COMB
11 0.437: UK UK UK 7.65: UK 0.440 (9-11): UK
12 0.360: SFU SFU SFU 8.40: SFU 0.362 (12): SFU
13 0.326: JHU JHU JHU 8.72: JHU 0.328 (13): JHU
Table 26: Overall ranking with different methods (English–Czech)
46
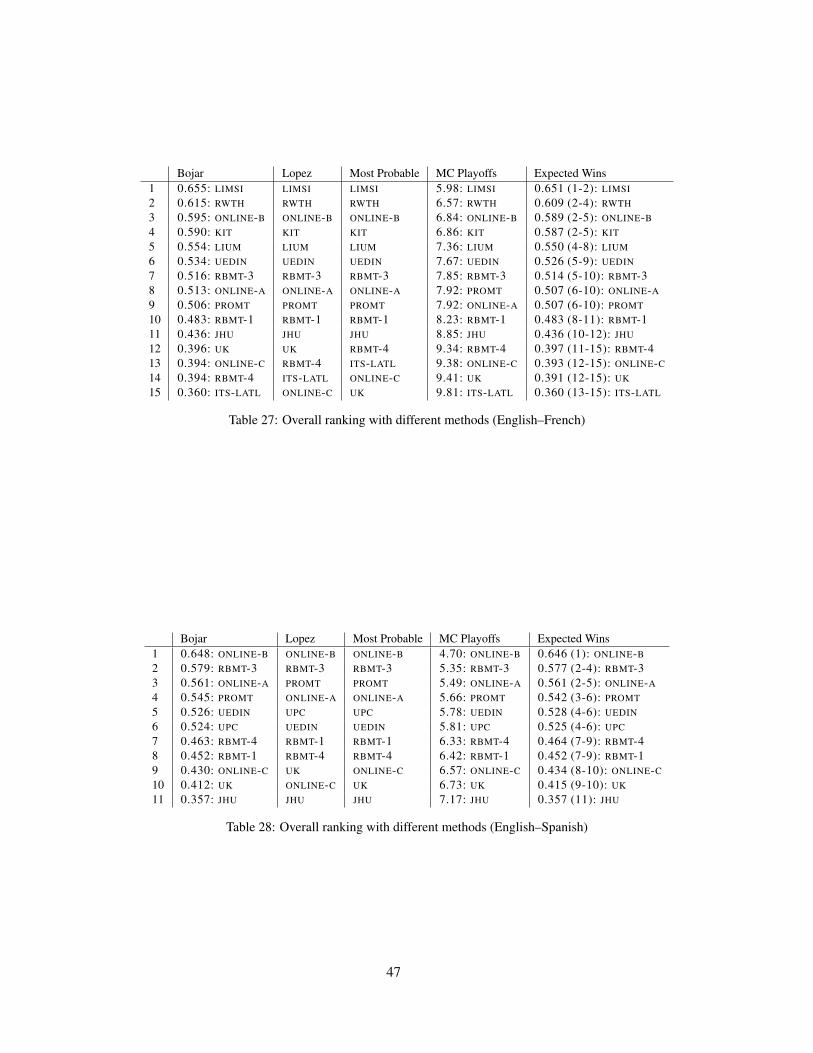
Bojar Lopez Most Probable MC Playoffs Expected Wins1 0.655: LIMSI LIMSI LIMSI 5.98: LIMSI 0.651 (1-2): LIMSI
2 0.615: RWTH RWTH RWTH 6.57: RWTH 0.609 (2-4): RWTH
3 0.595: ONLINE-B ONLINE-B ONLINE-B 6.84: ONLINE-B 0.589 (2-5): ONLINE-B
4 0.590: KIT KIT KIT 6.86: KIT 0.587 (2-5): KIT
5 0.554: LIUM LIUM LIUM 7.36: LIUM 0.550 (4-8): LIUM
6 0.534: UEDIN UEDIN UEDIN 7.67: UEDIN 0.526 (5-9): UEDIN
7 0.516: RBMT-3 RBMT-3 RBMT-3 7.85: RBMT-3 0.514 (5-10): RBMT-38 0.513: ONLINE-A ONLINE-A ONLINE-A 7.92: PROMT 0.507 (6-10): ONLINE-A
9 0.506: PROMT PROMT PROMT 7.92: ONLINE-A 0.507 (6-10): PROMT
10 0.483: RBMT-1 RBMT-1 RBMT-1 8.23: RBMT-1 0.483 (8-11): RBMT-111 0.436: JHU JHU JHU 8.85: JHU 0.436 (10-12): JHU
12 0.396: UK UK RBMT-4 9.34: RBMT-4 0.397 (11-15): RBMT-413 0.394: ONLINE-C RBMT-4 ITS-LATL 9.38: ONLINE-C 0.393 (12-15): ONLINE-C
14 0.394: RBMT-4 ITS-LATL ONLINE-C 9.41: UK 0.391 (12-15): UK
15 0.360: ITS-LATL ONLINE-C UK 9.81: ITS-LATL 0.360 (13-15): ITS-LATL
Table 27: Overall ranking with different methods (English–French)
Bojar Lopez Most Probable MC Playoffs Expected Wins1 0.648: ONLINE-B ONLINE-B ONLINE-B 4.70: ONLINE-B 0.646 (1): ONLINE-B
2 0.579: RBMT-3 RBMT-3 RBMT-3 5.35: RBMT-3 0.577 (2-4): RBMT-33 0.561: ONLINE-A PROMT PROMT 5.49: ONLINE-A 0.561 (2-5): ONLINE-A
4 0.545: PROMT ONLINE-A ONLINE-A 5.66: PROMT 0.542 (3-6): PROMT
5 0.526: UEDIN UPC UPC 5.78: UEDIN 0.528 (4-6): UEDIN
6 0.524: UPC UEDIN UEDIN 5.81: UPC 0.525 (4-6): UPC
7 0.463: RBMT-4 RBMT-1 RBMT-1 6.33: RBMT-4 0.464 (7-9): RBMT-48 0.452: RBMT-1 RBMT-4 RBMT-4 6.42: RBMT-1 0.452 (7-9): RBMT-19 0.430: ONLINE-C UK ONLINE-C 6.57: ONLINE-C 0.434 (8-10): ONLINE-C
10 0.412: UK ONLINE-C UK 6.73: UK 0.415 (9-10): UK
11 0.357: JHU JHU JHU 7.17: JHU 0.357 (11): JHU
Table 28: Overall ranking with different methods (English–Spanish)
47
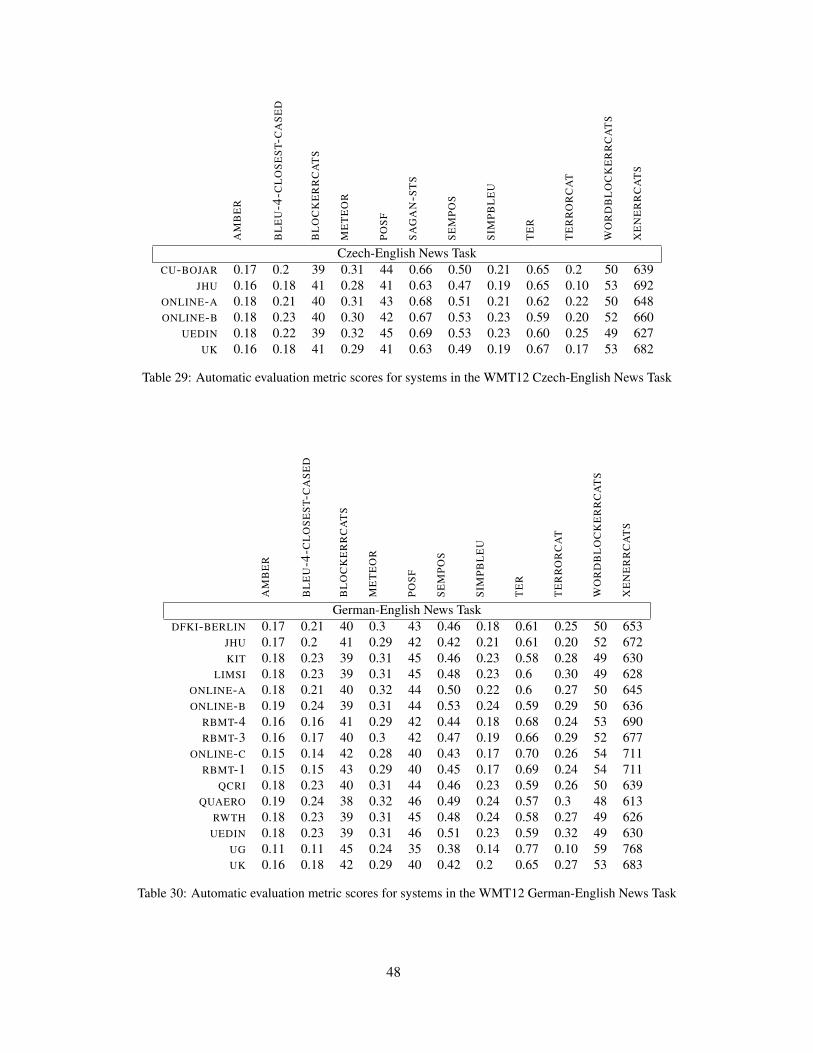
AM
BE
R
BL
EU
-4-C
LO
SE
ST-
CA
SE
D
BL
OC
KE
RR
CA
TS
ME
TE
OR
PO
SF
SA
GA
N-S
TS
SE
MP
OS
SIM
PB
LE
U
TE
R
TE
RR
OR
CA
T
WO
RD
BL
OC
KE
RR
CA
TS
XE
NE
RR
CA
TS
Czech-English News TaskCU-BOJAR 0.17 0.2 39 0.31 44 0.66 0.50 0.21 0.65 0.2 50 639
JHU 0.16 0.18 41 0.28 41 0.63 0.47 0.19 0.65 0.10 53 692ONLINE-A 0.18 0.21 40 0.31 43 0.68 0.51 0.21 0.62 0.22 50 648ONLINE-B 0.18 0.23 40 0.30 42 0.67 0.53 0.23 0.59 0.20 52 660
UEDIN 0.18 0.22 39 0.32 45 0.69 0.53 0.23 0.60 0.25 49 627UK 0.16 0.18 41 0.29 41 0.63 0.49 0.19 0.67 0.17 53 682
Table 29: Automatic evaluation metric scores for systems in the WMT12 Czech-English News Task
AM
BE
R
BL
EU
-4-C
LO
SE
ST-
CA
SE
D
BL
OC
KE
RR
CA
TS
ME
TE
OR
PO
SF
SE
MP
OS
SIM
PB
LE
U
TE
R
TE
RR
OR
CA
T
WO
RD
BL
OC
KE
RR
CA
TS
XE
NE
RR
CA
TS
German-English News TaskDFKI-BERLIN 0.17 0.21 40 0.3 43 0.46 0.18 0.61 0.25 50 653
JHU 0.17 0.2 41 0.29 42 0.42 0.21 0.61 0.20 52 672KIT 0.18 0.23 39 0.31 45 0.46 0.23 0.58 0.28 49 630
LIMSI 0.18 0.23 39 0.31 45 0.48 0.23 0.6 0.30 49 628ONLINE-A 0.18 0.21 40 0.32 44 0.50 0.22 0.6 0.27 50 645ONLINE-B 0.19 0.24 39 0.31 44 0.53 0.24 0.59 0.29 50 636
RBMT-4 0.16 0.16 41 0.29 42 0.44 0.18 0.68 0.24 53 690RBMT-3 0.16 0.17 40 0.3 42 0.47 0.19 0.66 0.29 52 677
ONLINE-C 0.15 0.14 42 0.28 40 0.43 0.17 0.70 0.26 54 711RBMT-1 0.15 0.15 43 0.29 40 0.45 0.17 0.69 0.24 54 711
QCRI 0.18 0.23 40 0.31 44 0.46 0.23 0.59 0.26 50 639QUAERO 0.19 0.24 38 0.32 46 0.49 0.24 0.57 0.3 48 613
RWTH 0.18 0.23 39 0.31 45 0.48 0.24 0.58 0.27 49 626UEDIN 0.18 0.23 39 0.31 46 0.51 0.23 0.59 0.32 49 630
UG 0.11 0.11 45 0.24 35 0.38 0.14 0.77 0.10 59 768UK 0.16 0.18 42 0.29 40 0.42 0.2 0.65 0.27 53 683
Table 30: Automatic evaluation metric scores for systems in the WMT12 German-English News Task
48
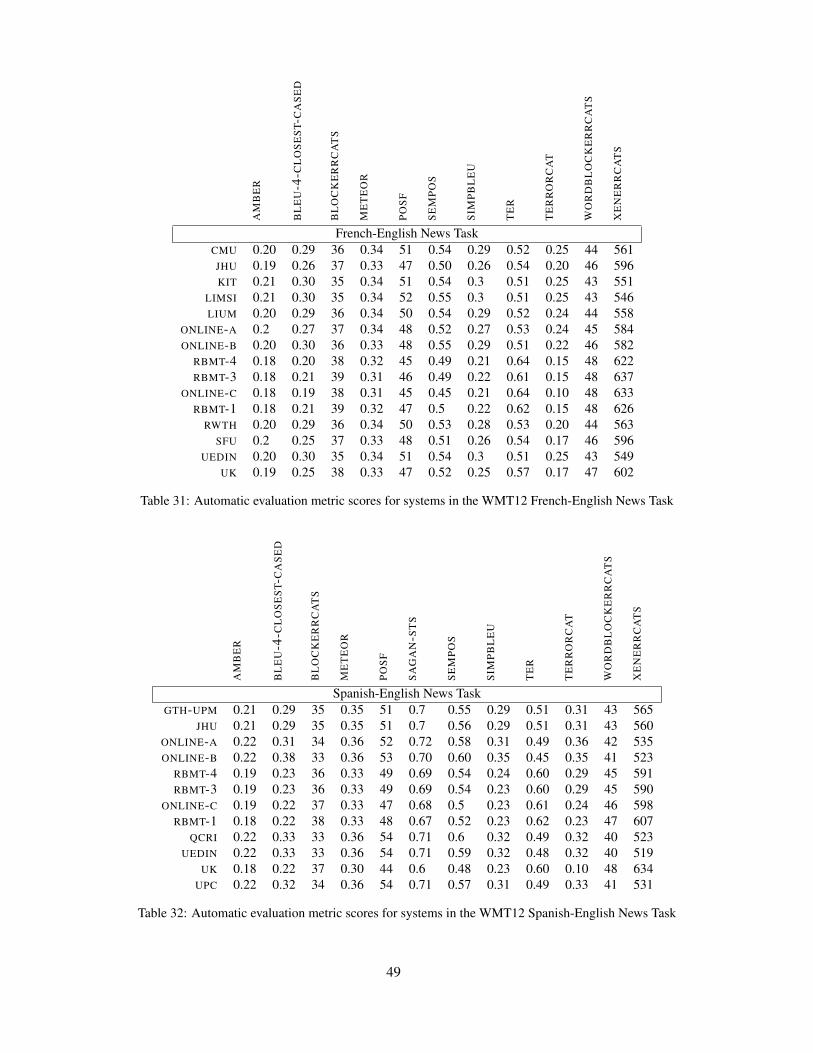
AM
BE
R
BL
EU
-4-C
LO
SE
ST-
CA
SE
D
BL
OC
KE
RR
CA
TS
ME
TE
OR
PO
SF
SE
MP
OS
SIM
PB
LE
U
TE
R
TE
RR
OR
CA
T
WO
RD
BL
OC
KE
RR
CA
TS
XE
NE
RR
CA
TS
French-English News TaskCMU 0.20 0.29 36 0.34 51 0.54 0.29 0.52 0.25 44 561JHU 0.19 0.26 37 0.33 47 0.50 0.26 0.54 0.20 46 596KIT 0.21 0.30 35 0.34 51 0.54 0.3 0.51 0.25 43 551
LIMSI 0.21 0.30 35 0.34 52 0.55 0.3 0.51 0.25 43 546LIUM 0.20 0.29 36 0.34 50 0.54 0.29 0.52 0.24 44 558
ONLINE-A 0.2 0.27 37 0.34 48 0.52 0.27 0.53 0.24 45 584ONLINE-B 0.20 0.30 36 0.33 48 0.55 0.29 0.51 0.22 46 582
RBMT-4 0.18 0.20 38 0.32 45 0.49 0.21 0.64 0.15 48 622RBMT-3 0.18 0.21 39 0.31 46 0.49 0.22 0.61 0.15 48 637
ONLINE-C 0.18 0.19 38 0.31 45 0.45 0.21 0.64 0.10 48 633RBMT-1 0.18 0.21 39 0.32 47 0.5 0.22 0.62 0.15 48 626
RWTH 0.20 0.29 36 0.34 50 0.53 0.28 0.53 0.20 44 563SFU 0.2 0.25 37 0.33 48 0.51 0.26 0.54 0.17 46 596
UEDIN 0.20 0.30 35 0.34 51 0.54 0.3 0.51 0.25 43 549UK 0.19 0.25 38 0.33 47 0.52 0.25 0.57 0.17 47 602
Table 31: Automatic evaluation metric scores for systems in the WMT12 French-English News Task
AM
BE
R
BL
EU
-4-C
LO
SE
ST-
CA
SE
D
BL
OC
KE
RR
CA
TS
ME
TE
OR
PO
SF
SA
GA
N-S
TS
SE
MP
OS
SIM
PB
LE
U
TE
R
TE
RR
OR
CA
T
WO
RD
BL
OC
KE
RR
CA
TS
XE
NE
RR
CA
TS
Spanish-English News TaskGTH-UPM 0.21 0.29 35 0.35 51 0.7 0.55 0.29 0.51 0.31 43 565
JHU 0.21 0.29 35 0.35 51 0.7 0.56 0.29 0.51 0.31 43 560ONLINE-A 0.22 0.31 34 0.36 52 0.72 0.58 0.31 0.49 0.36 42 535ONLINE-B 0.22 0.38 33 0.36 53 0.70 0.60 0.35 0.45 0.35 41 523
RBMT-4 0.19 0.23 36 0.33 49 0.69 0.54 0.24 0.60 0.29 45 591RBMT-3 0.19 0.23 36 0.33 49 0.69 0.54 0.23 0.60 0.29 45 590
ONLINE-C 0.19 0.22 37 0.33 47 0.68 0.5 0.23 0.61 0.24 46 598RBMT-1 0.18 0.22 38 0.33 48 0.67 0.52 0.23 0.62 0.23 47 607
QCRI 0.22 0.33 33 0.36 54 0.71 0.6 0.32 0.49 0.32 40 523UEDIN 0.22 0.33 33 0.36 54 0.71 0.59 0.32 0.48 0.32 40 519
UK 0.18 0.22 37 0.30 44 0.6 0.48 0.23 0.60 0.10 48 634UPC 0.22 0.32 34 0.36 54 0.71 0.57 0.31 0.49 0.33 41 531
Table 32: Automatic evaluation metric scores for systems in the WMT12 Spanish-English News Task
49

AM
BE
R
BL
EU
-4-C
LO
SE
ST-
CA
SE
D
BL
OC
KE
RR
CA
TS
EN
XE
RR
CA
TS
ME
TE
OR
PO
SF
SE
MP
OS
SIM
PB
LE
U
TE
R
TE
RR
OR
CA
T
WO
RD
BL
OC
KE
RR
CA
TS
English-Czech News TaskCOMMERCIAL-2 0.01 0.08 47 693 0.17 23 0.38 0.1 0.76 0.17 61
CU-BOJAR 0.17 0.13 45 644 0.21 28 0.4 0.13 0.69 0.26 57CU-DEPFIX 0.19 0.16 44 623 0.22 28 0.45 0.15 0.66 0.30 55
CU-POOR-COMB 0.14 0.12 48 710 0.19 27 0.35 0.12 0.67 0.23 60CU-TAMCH 0.17 0.13 45 647 0.21 28 0.38 0.13 0.69 0.29 57
CU-TECTOMT 0.16 0.12 48 690 0.19 26 0.36 0.12 0.68 0.22 60JHU 0.16 0.1 47 691 0.2 23 0.39 0.11 0.69 0.10 60
ONLINE-A 0.17 0.13 n/a n/a 0.21 n/a 0.42 0.13 0.67 0.25 n/aONLINE-B 0.19 0.16 44 623 0.21 28 0.45 0.15 0.66 0.30 55
COMMERCIAL-1 0.11 0.09 48 692 0.18 22 0.38 0.10 0.74 0.21 61SFU 0.15 0.11 47 674 0.19 23 0.39 0.11 0.71 0.21 60
UEDIN 0.18 0.15 45 639 0.21 27 0.41 0.14 0.66 0.40 56UK 0.15 0.11 47 669 0.19 25 0.39 0.12 0.71 0.35 59
Table 33: Automatic evaluation metric scores for systems in the WMT12 English-Czech News Task
AM
BE
R
BL
EU
-4-C
LO
SE
ST-
CA
SE
D
BL
OC
KE
RR
CA
TS
EN
XE
RR
CA
TS
ME
TE
OR
PO
SF
SIM
PB
LE
U
TE
R
TE
RR
OR
CA
T
WO
RD
BL
OC
KE
RR
CA
TS
English-German News TaskDFKI-BERLIN 0.18 0.14 46 628 0.35 41 0.13 0.69 0.10 57
DFKI-HUNSICKER 0.18 0.14 45 621 0.35 42 0.15 0.69 0.17 57JHU 0.2 0.15 45 618 0.37 42 0.16 0.68 0.17 56KIT 0.20 0.17 45 606 0.38 43 0.17 0.66 0.14 55
LIMSI 0.2 0.17 45 615 0.37 43 0.17 0.65 0.15 56ONLINE-A 0.20 0.16 45 617 0.38 43 0.17 0.65 0.36 55ONLINE-B 0.22 0.18 43 589 0.38 42 0.18 0.64 0.35 55
RBMT-4 0.18 0.14 45 623 0.35 42 0.15 0.69 0.35 57RBMT-3 0.19 0.15 44 608 0.36 44 0.16 0.68 0.37 56
ONLINE-C 0.16 0.11 47 655 0.32 39 0.13 0.74 0.37 60RBMT-1 0.17 0.13 47 643 0.34 42 0.15 0.70 0.36 58
RWTH 0.2 0.16 44 609 0.37 43 0.16 0.67 0.25 56UEDIN-WILLIAMS 0.19 0.16 45 628 0.37 43 0.17 0.66 0.33 57
UEDIN 0.20 0.16 45 611 0.37 43 0.17 0.66 0.29 55UK 0.18 0.14 46 632 0.36 40 0.15 0.71 0.27 58
Table 34: Automatic evaluation metric scores for systems in the WMT12 English-German News Task
50
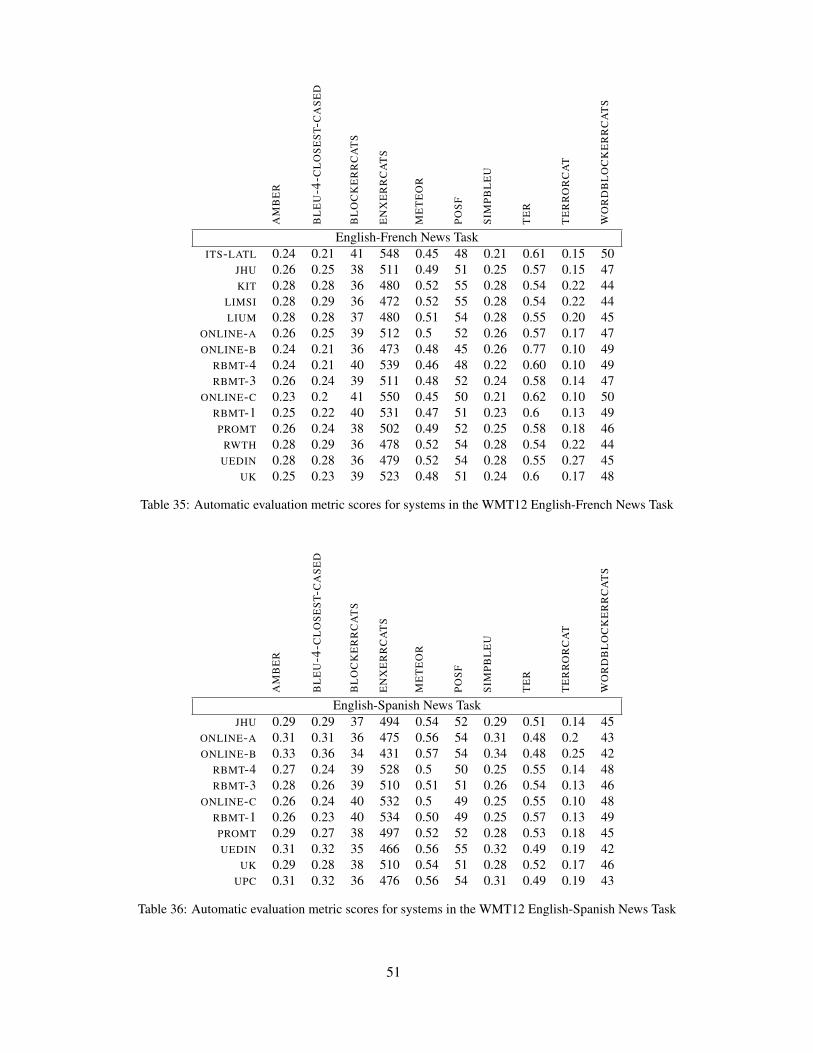
AM
BE
R
BL
EU
-4-C
LO
SE
ST-
CA
SE
D
BL
OC
KE
RR
CA
TS
EN
XE
RR
CA
TS
ME
TE
OR
PO
SF
SIM
PB
LE
U
TE
R
TE
RR
OR
CA
T
WO
RD
BL
OC
KE
RR
CA
TS
English-French News TaskITS-LATL 0.24 0.21 41 548 0.45 48 0.21 0.61 0.15 50
JHU 0.26 0.25 38 511 0.49 51 0.25 0.57 0.15 47KIT 0.28 0.28 36 480 0.52 55 0.28 0.54 0.22 44
LIMSI 0.28 0.29 36 472 0.52 55 0.28 0.54 0.22 44LIUM 0.28 0.28 37 480 0.51 54 0.28 0.55 0.20 45
ONLINE-A 0.26 0.25 39 512 0.5 52 0.26 0.57 0.17 47ONLINE-B 0.24 0.21 36 473 0.48 45 0.26 0.77 0.10 49
RBMT-4 0.24 0.21 40 539 0.46 48 0.22 0.60 0.10 49RBMT-3 0.26 0.24 39 511 0.48 52 0.24 0.58 0.14 47
ONLINE-C 0.23 0.2 41 550 0.45 50 0.21 0.62 0.10 50RBMT-1 0.25 0.22 40 531 0.47 51 0.23 0.6 0.13 49PROMT 0.26 0.24 38 502 0.49 52 0.25 0.58 0.18 46
RWTH 0.28 0.29 36 478 0.52 54 0.28 0.54 0.22 44UEDIN 0.28 0.28 36 479 0.52 54 0.28 0.55 0.27 45
UK 0.25 0.23 39 523 0.48 51 0.24 0.6 0.17 48
Table 35: Automatic evaluation metric scores for systems in the WMT12 English-French News Task
AM
BE
R
BL
EU
-4-C
LO
SE
ST-
CA
SE
D
BL
OC
KE
RR
CA
TS
EN
XE
RR
CA
TS
ME
TE
OR
PO
SF
SIM
PB
LE
U
TE
R
TE
RR
OR
CA
T
WO
RD
BL
OC
KE
RR
CA
TS
English-Spanish News TaskJHU 0.29 0.29 37 494 0.54 52 0.29 0.51 0.14 45
ONLINE-A 0.31 0.31 36 475 0.56 54 0.31 0.48 0.2 43ONLINE-B 0.33 0.36 34 431 0.57 54 0.34 0.48 0.25 42
RBMT-4 0.27 0.24 39 528 0.5 50 0.25 0.55 0.14 48RBMT-3 0.28 0.26 39 510 0.51 51 0.26 0.54 0.13 46
ONLINE-C 0.26 0.24 40 532 0.5 49 0.25 0.55 0.10 48RBMT-1 0.26 0.23 40 534 0.50 49 0.25 0.57 0.13 49PROMT 0.29 0.27 38 497 0.52 52 0.28 0.53 0.18 45UEDIN 0.31 0.32 35 466 0.56 55 0.32 0.49 0.19 42
UK 0.29 0.28 38 510 0.54 51 0.28 0.52 0.17 46UPC 0.31 0.32 36 476 0.56 54 0.31 0.49 0.19 43
Table 36: Automatic evaluation metric scores for systems in the WMT12 English-Spanish News Task
51