findings of the 2014 workshop on statistical machine ... · findings of the 2014 workshop on...
TRANSCRIPT

Proceedings of the Ninth Workshop on Statistical Machine Translation, pages 12–58,Baltimore, Maryland USA, June 26–27, 2014. c©2014 Association for Computational Linguistics
Findings of the 2014 Workshop on Statistical Machine TranslationOndrej Bojar
Charles University in PragueChristian Buck
University of EdinburghChristian Federmann
Microsoft ResearchBarry Haddow
University of Edinburgh
Philipp KoehnJHU / Edinburgh
Johannes LevelingDublin City University
Christof MonzUniversity of Amsterdam
Pavel PecinaCharles University in Prague
Matt PostJohns Hopkins University
Herve Saint-AmandUniversity of Edinburgh
Radu SoricutGoogle
Lucia SpeciaUniversity of Sheffield
Ales TamchynaCharles University in Prague
AbstractThis paper presents the results of theWMT14 shared tasks, which included astandard news translation task, a sepa-rate medical translation task, a task forrun-time estimation of machine translationquality, and a metrics task. This year, 143machine translation systems from 23 insti-tutions were submitted to the ten transla-tion directions in the standard translationtask. An additional 6 anonymized sys-tems were included, and were then evalu-ated both automatically and manually. Thequality estimation task had four subtasks,with a total of 10 teams, submitting 57 en-tries.
1 Introduction
We present the results of the shared tasks ofthe Workshop on Statistical Machine Translation(WMT) held at ACL 2014. This workshop buildson eight previous WMT workshops (Koehn andMonz, 2006; Callison-Burch et al., 2007, 2008,2009, 2010, 2011, 2012; Bojar et al., 2013).
This year we conducted four official tasks: atranslation task, a quality estimation task, a met-rics task1 and a medical translation task. In thetranslation task (§2), participants were asked totranslate a shared test set, optionally restrictingthemselves to the provided training data. We heldten translation tasks this year, between English andeach of Czech, French, German, Hindi, and Rus-sian. The Hindi translation tasks were new thisyear, providing a lesser resourced data conditionon a challenging language pair. The system out-puts for each task were evaluated both automati-cally and manually.
1The metrics task is reported in a separate paper(Machacek and Bojar, 2014).
The human evaluation (§3) involves askinghuman judges to rank sentences output byanonymized systems. We obtained large num-bers of rankings from researchers who contributedevaluations proportional to the number of tasksthey entered. Last year, we dramatically increasedthe number of judgments, achieving much moremeaningful rankings. This year, we developed anew ranking method that allows us to achieve thesame with fewer judgments.
The quality estimation task (§4) this yearincluded sentence- and word-level subtasks:sentence-level prediction of 1-3 likert scores,sentence-level prediction of percentage of wordedits necessary to fix a sentence, sentence-levelprediction of post-editing time, and word-levelprediction of scores at different levels of granular-ity (correct/incorrect, accuracy/fluency errors, andspecific types of errors). Datasets were releasedwith English-Spanish, English-German, Spanish-English and German-English news translationsproduced by 2-3 machine translation systems and,for some subtasks, a human translation.
The medical translation task (§5) was intro-duced this year. Unlike the “standard” translationtask, the test sets come from the very specializeddomain of medical texts. The aim of this task wasnot only domain adaptation but also the utilizationof translation systems in a larger scenario, namelycross-lingual information retrieval (IR). Extrinsicevaluation in an IR setting was a part of this task(on the other hand, manual evaluation of transla-tion quality was not carried out).
The primary objectives of WMT are to evaluatethe state of the art in machine translation, to dis-seminate common test sets and public training datawith published performance numbers, and to re-fine evaluation and estimation methodologies formachine translation. As before, all of the data,
12

translations, and collected human judgments arepublicly available.2 We hope these datasets serveas a valuable resource for research into statisticalmachine translation and automatic evaluation orprediction of translation quality.
2 Overview of the Translation Task
The recurring task of the workshop examinestranslation between English and other languages.As in the previous years, the other languages in-clude German, French, Czech and Russian.
We dropped Spanish and added Hindi this year.From a linguistic point of view, Spanish posessimilar problems as French, making its prior in-clusion less valuable. Hindi is not only interest-ing since it is a more distant language than theEuropean languages we include, but also becausewe have much less training data, thus forcing re-searchers to deal with low resource conditions, butalso providing them with a language pair that doesnot suffer from the computational complexities ofhaving to deal with massive amounts of trainingdata.
We created a test set for each language pair bytranslating newspaper articles and provided train-ing data.
2.1 Test data
The test data for this year’s task was selected fromnews stories from online sources, as before. How-ever, we changed our method to create the test sets.
In previous years, we took equal amounts ofsource sentences from all six languages involved(around 500 sentences each), and translated theminto all other languages. While this produced amulti-parallel test corpus that could be also usedfor language pairs (such as Czech-Russian) thatwe did not include in the evaluation, it did suf-fer from artifacts from the larger distance betweensource and target sentences. Most test sentencesinvolved the translation a source sentence thatwas translated from a their language into a tar-get sentence (which was compared against a trans-lation from that third language as well). Ques-tions have been raised, if the evaluation of, say,French-English translation is best served whentesting on sentences that have been originally writ-ten in, say, Czech. For discussions about trans-lationese please for instance refer to Koppel andOrdan (2011).
2http://statmt.org/wmt14/results.html
This year, we took about 1500 English sen-tences and translated them into the other 5 lan-guages, and then additional 1500 sentences fromeach of the other languages and translated theminto English. This gave us test sets of about 3000sentences for our English-X language pairs, whichhave been either written originally written in En-glish and translated into X, or vice versa.
The composition of the test documents is shownin Table 1. The stories were translated by the pro-fessional translation agency Capita, funded by theEU Framework Programme 7 project MosesCore,and by Yandex, a Russian search engine com-pany.3 All of the translations were done directly,and not via an intermediate language.
2.2 Training data
As in past years we provided parallel corporato train translation models, monolingual cor-pora to train language models, and developmentsets to tune system parameters. Some train-ing corpora were identical from last year (Eu-roparl4, United Nations, French-English 109 cor-pus, CzEng, Common Crawl, Russian-EnglishWikipedia Headlines provided by CMU), somewere updated (Russian-English parallel data pro-vided by Yandex, News Commentary, monolin-gual data), and a new corpus was added (Hindi-English corpus, Bojar et al. (2014)), Hindi-EnglishWikipedia Headline corpus).
Some statistics about the training materials aregiven in Figure 1.
2.3 Submitted systems
We received 143 submissions from 23 institu-tions. The participating institutions and their entrynames are listed in Table 2; each system did notnecessarily appear in all translation tasks. We alsoincluded four commercial off-the-shelf MT sys-tems and four online statistical MT systems, whichwe anonymized.
For presentation of the results, systems aretreated as either constrained or unconstrained, de-pending on whether their models were trained onlyon the provided data. Since we do not know howthey were built, these online and commercial sys-tems are treated as unconstrained during the auto-matic and human evaluations.
3http://www.yandex.com/4As of Fall 2011, the proceedings of the European Parlia-
ment are no longer translated into all official languages.
13

Europarl Parallel CorpusFrench↔ English German↔ English Czech↔ English
Sentences 2,007,723 1,920,209 646,605Words 60,125,563 55,642,101 50,486,398 53,008,851 14,946,399 17,376,433
Distinct words 140,915 118,404 381,583 115,966 172,461 63,039
News Commentary Parallel CorpusFrench↔ English German↔ English Czech↔ English Russian↔ English
Sentences 183,251 201,288 146,549 165,602Words 5,688,656 4,659,619 5,105,101 5,046,157 3,288,645 3,590,287 4,153,847 4,339,974
Distinct words 72,863 62,673 150,760 65,520 139,477 55,547 151,101 60,801
Common Crawl Parallel CorpusFrench↔ English German↔ English Czech↔ English Russian↔ English
Sentences 3,244,152 2,399,123 161,838 878,386Words 91,328,790 81,096,306 54,575,405 58,870,638 3,529,783 3,927,378 21,018,793 21,535,122
Distinct words 889,291 859,017 1,640,835 823,480 210,170 128,212 764,203 432,062
United Nations Parallel CorpusFrench↔ English
Sentences 12,886,831Words 411,916,781 360,341,450
Distinct words 565,553 666,077
109 Word Parallel CorpusFrench↔ English
Sentences 22,520,400Words 811,203,407 668,412,817
Distinct words 2,738,882 2,861,836
CzEng Parallel CorpusCzech↔ English
Sentences 14,833,358Words 200,658,857 228,040,794
Distinct words 1,389,803 920,824
Hindi-English Parallel CorpusHindi↔ English
Sentences 287,202Words 6,002,418 3,953,851
Distinct words 121,236 105,330
Yandex 1M Parallel CorpusRussian↔ English
Sentences 1,000,000Words 24,121,459 26,107,293
Distinct words 701,809 387,646
Wiki Headlines Parallel CorpusRussian↔ English Hindi↔ English
Sentences 514,859 32,863Words 1,191,474 1,230,644 141,042 70,075
Distinct words 282,989 251,328 25,678 26,989
Europarl Language Model DataEnglish French German Czech
Sentence 2,218,201 2,190,579 2,176,537 668,595Words 59,848,044 63,439,791 53,534,167 14,946,399
Distinct words 123,059 145,496 394,781 172,461
News Language Model DataEnglish French German Czech Russian Hindi
Sentence 90,209,983 30,451,749 89,634,193 36,426,900 32,245,651 1,275,921Words 2,109,603,244 748,852,739 1,606,506,785 602,950,410 575,423,682 36,297,394
Distinct words 4,089,792 1,906,470 10,248,707 3,101,846 2,860,837 258,759
News Test SetFrench↔ English German↔ English Czech↔ English Russian↔ English Hindi↔ English
Sentences 3003 3003 3003 3003 2507Words 81,194 71,147 63,078 67,624 60,240 68,866 62,107 69,329 86,974 55,822
Distinct words 11,715 10,610 13,930 10,458 16,774 9,893 17,009 9,938 8,292 9,217
Figure 1: Statistics for the training and test sets used in the translation task. The number of words and the number of distinctwords (case-insensitive) is based on the provided tokenizer.
14

Language Sources (Number of Documents)Czech aktualne.cz (2), blesk.cz (3), blisty.cz (1), denık.cz (9), e15.cz (1), iDNES.cz (17), ihned.cz (14), lidovky.cz (8), medi-
afax.cz (2), metro.cz (1), Novinky.cz (5), pravo.novinky.cz (6), reflex.cz (2), tyden.cz (1), zdn.cz (1).French BBC French Africa (1), Canoe (9), Croix (4), Cyber Presse (12), Dernieres Nouvelles (1), dhnet.be (5), Equipe (1),
Euronews (6), Journal Metro.com (1), La Libre.be (2), La Meuse.be (2), Le Devoir (3), Le Figaro (8), Le Monde (3),Les Echos (15), Lexpress.fr (3), Liberation (1), L’independant (2), Metro France (1), Nice-Matin (6), Le Nouvel Ob-servateur (3), Radio Canada (6), Reuters (7).
English ABC News (5), BBC (5), CBS News (5), CNN (5), Daily Mail (5), Financial Times (5), Fox News (2), Globe andMail (1), Independent (1), Los Angeles Times (1), New Yorker (1), News.com Australia (16), Reuters (3), Scotsman (2),smh.com.au (2), stv.tv (1), Telegraph (6), UPI (2).
German Abendzeitung Nurnberg (1), all-in.de (2), Augsburger Allgemeine (1), AZ Online (1), Borsenzeitung (1), come-on.de (1), Der Westen (2), DZ Online (1), Reutlinger General-Anzeiger (1), Generalanzeiger Bonn (1), GiessenerAnzeiger (1), Goslarsche Zeitung (1), Hersfelder Zeitung (1), Judische Allgemeine (1), Kreisanzeiger (2),Kreiszeitung (2), Krone (1), Lampertheimer Zeitung (2), Lausitzer Rundschau (1), Mittelbayerische (1), Morgen-post (1), nachrichten.at (1), Neue Presse (1), OP Online (1), Potsdamer Neueste Nachrichten (1), Passauer NeuePresse (1), Recklinghauser Zeitung (1), Rhein Zeitung (1), salzburg.com (1), Schwarzwalder Bote (29), SegebergerZeitung (1), Soester Anzeiger (1), Sudkurier (17), svz.de (1), Tagesspiegel (1), Usinger Anzeiger (3), Volksblatt.li (1),Westfalischen Anzeiger (3), Wiener Zeitung (1), Wiesbadener Kurier (1), Westdeutsche Zeitung (1), WilhelmshavenerZeitung (1), Yahoo Deutschland (1).
Hindi Bhaskar (24), Jagran (61), Navbharat Times / India Times (4), ndtv (2).Russian 168.ru (1), aif (3), altapress.ru (2), argumenti.ru (2), BBC Russian (3), belta.by (2), communa.ru (1), dp.ru (1), eg-
online.ru (1), Euronews (2), fakty.ua (2), gazeta.ru (1), inotv.rt.com (1), interfax (1), Izvestiya (1), Kommersant (7),kp (2), lenta.ru (4), lgng (1), litrossia.ru (1), mirnov.ru (5), mk (8), mn.ru (2), newizv (2), nov-pravda.ru (1), no-vayagazeta (1), nr2.ru (8), pnp.ru (1), rbc.ru (3), ria.ru (4), rosbalt.ru (1), sovsport.ru (6), Sport Express (10), trud.ru (4),tumentoday.ru (1), vesti.ru (10), zr.ru (1).
Table 1: Composition of the test set. For more details see the XML test files. The docid tag gives the source and the date foreach document in the test set, and the origlang tag indicates the original source language.
3 Human Evaluation
As with past workshops, we contend that auto-matic measures of machine translation quality arean imperfect substitute for human assessments.We therefore conduct a manual evaluation of thesystem outputs and define its results to be the prin-cipal ranking of the workshop. In this section, wedescribe how we collected this data and computethe results, and then present the official results ofthe ranking.
This year’s evaluation was conducted a bit dif-ferently. The main differences are:
• In contrast to the past two years, we collectedjudgments entirely from researchers partici-pating in the shared tasks and trusted friendsof the community. Last year, about two thirdsof the data were solicited from random volun-teers on the Amazon Mechanical Turk. Forsome language pairs, the Turkers data hadmuch lower inter-annotator agreement com-pared to the researchers.
• As a result, we collected about seventy-fivepercent less data, but were able to obtaingood confidence intervals on the clusters withthe use of new approaches to ranking.
• We compared three different ranking method-ologies, selecting the one with the highest ac-curacy on held-out data.
We also maintain many of our customs fromprior years, including the presentation of the re-sults in terms of a partial ordering (clustering) ofthe systems. Systems in the same cluster could notbe meaningfully distinguished and should be con-sidered ties.
3.1 Data collectionThe system ranking is produced from a large set ofpairwise annotations between system pairs. Thesepairwise annotations are collected in an evaluationcampaign that enlists participants in the sharedtask to contribute one hundred “Human Intelli-gence Tasks” (HITs) per system submitted. EachHIT consists of three ranking tasks. In a rank-ing task, an annotator is presented with a sourcesegment, a human reference translation, and theoutputs of five anonymized systems, randomly se-lected from the set of participating systems, andrandomly ordered.
To run the evaluation, we use Appraise5 (Fe-dermann, 2012), an open-source tool built onPython’s Django framework. At the top of eachHIT, the following instructions are provided:
You are shown a source sentence fol-lowed by several candidate translations.Your task is to rank the translations frombest to worst (ties are allowed).
5https://github.com/cfedermann/Appraise
15

ID InstitutionAFRL, AFRL-PE Air Force Research Lab (Schwartz et al., 2014)CIMS University of Stuttgart / University of Munich (Cap et al., 2014)CMU Carnegie Mellon University (Matthews et al., 2014)CU-* Charles University, Prague (Tamchyna et al., 2014)DCU-FDA Dublin City University (Bicici et al., 2014)DCU-ICTCAS Dublin City University (Li et al., 2014b)DCU-LINGO24 Dublin City University / Lingo24 (wu et al., 2014)EU-BRIDGE EU-BRIDGE Project (Freitag et al., 2014)KIT Karlsruhe Institute of Technology (Herrmann et al., 2014)IIT-BOMBAY IIT Bombay (Dungarwal et al., 2014)IIIT-HYDERABAD IIIT HyderabadIMS-TTT University of Stuttgart / University of Munich (Quernheim and Cap, 2014)IPN-UPV-* IPN-UPV (Costa-jussa et al., 2014)KAZNU Amandyk Kartbayev, FBKLIMSI-KIT LIMSI / Karlsruhe Instutute of Technology (Do et al., 2014)MANAWI-* Universitat des Saarlandes (Tan and Pal, 2014)MATRAN Abu-MaTran Project: Prompsit / DCU / UA (Rubino et al., 2014)PROMT-RULE,PROMT-HYBRID
PROMT
RWTH RWTH Aachen (Peitz et al., 2014)STANFORD Stanford University (Neidert et al., 2014; Green et al., 2014)UA-* University of Alicante (Sanchez-Cartagena et al., 2014)UEDIN-PHRASE,UEDIN-UNCNSTR
University of Edinburgh (Durrani et al., 2014b)
UEDIN-SYNTAX University of Edinburgh (Williams et al., 2014)UU, UU-DOCENT Uppsala University (Hardmeier et al., 2014)Y-SDA Yandex School of Data Analysis (Borisov and Galinskaya, 2014)COMMERCIAL-[1,2] Two commercial machine translation systemsONLINE-[A,B,C,G] Four online statistical machine translation systemsRBMT-[1,4] Two rule-based statistical machine translation systems
Table 2: Participants in the shared translation task. Not all teams participated in all language pairs. The translations from thecommercial and online systems were not submitted by their respective companies but were obtained by us, and are thereforeanonymized in a fashion consistent with previous years of the workshop.
16
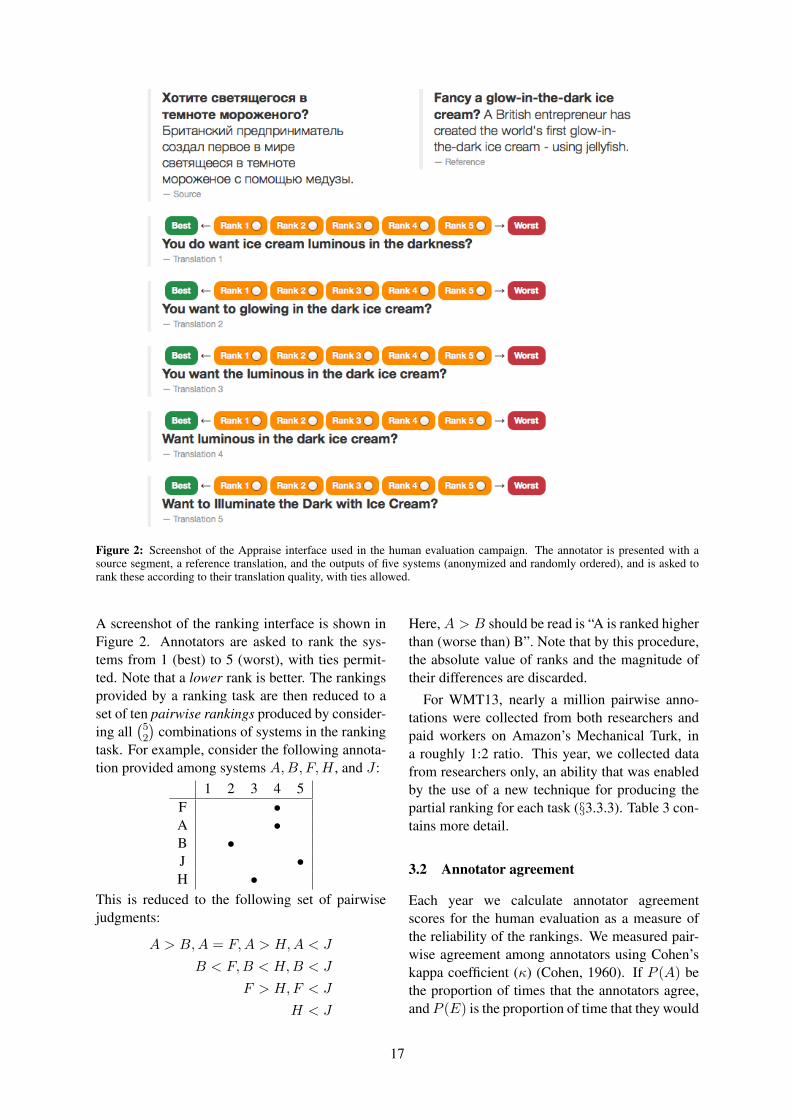
Figure 2: Screenshot of the Appraise interface used in the human evaluation campaign. The annotator is presented with asource segment, a reference translation, and the outputs of five systems (anonymized and randomly ordered), and is asked torank these according to their translation quality, with ties allowed.
A screenshot of the ranking interface is shown inFigure 2. Annotators are asked to rank the sys-tems from 1 (best) to 5 (worst), with ties permit-ted. Note that a lower rank is better. The rankingsprovided by a ranking task are then reduced to aset of ten pairwise rankings produced by consider-ing all
(52
)combinations of systems in the ranking
task. For example, consider the following annota-tion provided among systems A,B, F,H , and J :
1 2 3 4 5F •A •B •J •H •
This is reduced to the following set of pairwisejudgments:
A > B,A = F,A > H,A < J
B < F,B < H,B < J
F > H,F < J
H < J
Here,A > B should be read is “A is ranked higherthan (worse than) B”. Note that by this procedure,the absolute value of ranks and the magnitude oftheir differences are discarded.
For WMT13, nearly a million pairwise anno-tations were collected from both researchers andpaid workers on Amazon’s Mechanical Turk, ina roughly 1:2 ratio. This year, we collected datafrom researchers only, an ability that was enabledby the use of a new technique for producing thepartial ranking for each task (§3.3.3). Table 3 con-tains more detail.
3.2 Annotator agreement
Each year we calculate annotator agreementscores for the human evaluation as a measure ofthe reliability of the rankings. We measured pair-wise agreement among annotators using Cohen’skappa coefficient (κ) (Cohen, 1960). If P (A) bethe proportion of times that the annotators agree,and P (E) is the proportion of time that they would
17

LANGUAGE PAIR Systems Rankings AverageCzech–English 5 21,130 4,226.0English–Czech 10 55,900 5,590.0German–English 13 25,260 1,943.0English–German 18 54,660 3,036.6French–English 8 26,090 3,261.2English–French 13 33,350 2,565.3Russian–English 13 34,460 2,650.7English–Russian 9 28,960 3,217.7Hindi–English 9 20,900 2,322.2English–Hindi 12 28,120 2,343.3TOTAL WMT 14 110 328,830 2,989.3WMT13 148 942,840 6,370.5WMT12 103 101,969 999.6WMT11 133 63,045 474.0
Table 3: Amount of data collected in the WMT14 manual evaluation. The final three rows report summary information fromthe previous two workshops.
agree by chance, then Cohen’s kappa is:
κ =P (A)− P (E)
1− P (E)
Note that κ is basically a normalized version ofP (A), one which takes into account how mean-ingful it is for annotators to agree with each otherby incorporating P (E). The values for κ rangefrom 0 to 1, with zero indicating no agreement and1 perfect agreement.
We calculate P (A) by examining all pairs ofsystems which had been judged by two or morejudges, and calculating the proportion of time thatthey agreed that A < B, A = B, or A > B. Inother words, P (A) is the empirical, observed rateat which annotators agree, in the context of pair-wise comparisons.
As for P (E), it captures the probability that twoannotators would agree randomly. Therefore:
P (E) = P (A<B)2 + P (A=B)2 + P (A>B)2
Note that each of the three probabilities in P (E)’sdefinition are squared to reflect the fact that we areconsidering the chance that two annotators wouldagree by chance. Each of these probabilities iscomputed empirically, by observing how often an-notators actually rank two systems as being tied.
Table 4 gives κ values for inter-annotator agree-ment for WMT11–WMT14 while Table 5 de-tails intra-annotator agreement scores, includingthe division of researchers (WMT13r) and MTurk(WMT13m) data. The exact interpretation of the
kappa coefficient is difficult, but according to Lan-dis and Koch (1977), 0–0.2 is slight, 0.2–0.4 isfair, 0.4–0.6 is moderate, 0.6–0.8 is substantial,and 0.8–1.0 is almost perfect. The agreement ratesare more or less in line with prior years: worse forsome tasks, better for others, and on average, thebest since WMT11 (where agreement scores werelikely inflated due to inclusion of reference trans-lations in the comparisons).
3.3 Models of System Rankings
The collected pairwise rankings are used to pro-duce a ranking of the systems. Machine transla-tion evaluation has always been a subject of con-tention, and no exception to this rule exists for theWMT manual evaluation. While the precise met-ric has varied over the years, it has always shareda common idea of computing the average num-ber of times each system was judged better thanother systems, and ranking from highest to low-est. For example, in WMT11 Callison-Burch et al.(2011), the metric computed the percentage of thetime each system was ranked better than or equalto other systems, and included comparisons to hu-man references. In WMT12 Callison-Burch et al.(2012), comparisons to references were dropped.In WMT13, rankings were produced over 1,000bootstrap-resampled sets of the training data. Arank range was collected for each system acrossthese folds; the average value was used to orderthe systems, and a 95% confidence interval acrossthese ranks was used to organize the systems intoequivalence classes containing systems with over-
18

LANGUAGE PAIR WMT11 WMT12 WMT13 WMT13r WMT13m WMT14Czech–English 0.400 0.311 0.244 0.342 0.279 0.305English–Czech 0.460 0.359 0.168 0.408 0.075 0.360German–English 0.324 0.385 0.299 0.443 0.324 0.368English–German 0.378 0.356 0.267 0.457 0.239 0.427French–English 0.402 0.272 0.275 0.405 0.321 0.357English–French 0.406 0.296 0.231 0.434 0.237 0.302Hindi–English — — — — — 0.400English–Hindi — — — — — 0.413Russian–English — — 0.278 0.315 0.324 0.324English–Russian — — 0.243 0.416 0.207 0.418MEAN 0.395 0.330 0.260 0.367
Table 4: κ scores measuring inter-annotator agreement. See Table 5 for corresponding intra-annotator agreement scores.
LANGUAGE PAIR WMT11 WMT12 WMT13 WMT13r WMT13m WMT14Czech–English 0.597 0.454 0.479 0.483 0.478 0.382English–Czech 0.601 0.390 0.290 0.547 0.242 0.448German–English 0.576 0.392 0.535 0.643 0.515 0.344English–German 0.528 0.433 0.498 0.649 0.452 0.576French–English 0.673 0.360 0.578 0.585 0.565 0.629English–French 0.524 0.414 0.495 0.630 0.486 0.507Hindi–English — — — — — 0.605English–Hindi — — — — — 0.535Russian–English — — 0.450 0.363 0.477 0.629English–Russian — — 0.513 0.582 0.500 0.570MEAN 0.583 0.407 0.479 0.522
Table 5: κ scores measuring intra-annotator agreement, i.e., self-consistency of judges, across for the past few years of thehuman evaluation.
lapping ranges.This year, we introduce two new changes. First,
we pit the WMT13 method against two new ap-proaches: that of Hopkins and May (2013, §3.3.2),and another based on TrueSkill (Sakaguchi et al.,2014, §3.3.3). Second, we compare these twomethods against WMT13’s “Expected Wins” ap-proach, and then select among them by determin-ing which of them has the highest accuracy interms of predicting annotations on a held-out setof pairwise judgments.
3.3.1 Method 1: Expected Wins (EW)Introduced for WMT13, the EXPECTED WINS hasan intuitive score demonstrated to be accurate inranking systems according to an underlying modelof “relative ability” (Koehn, 2012a). The idea isto gauge the probability that a system Si will beranked better than another system randomly cho-sen from a pool of opponents {Sj : j 6= i}. Ifwe define the function win(A,B) as the numberof times system A is ranked better than system B,
then we can define this as follows:
scoreEW (Si) =
1
|{Sj}|∑
j,j 6=i
win(Si, Sj)win(Si, Sj) + win(Sj , Si)
Note that this score ignores ties.
3.3.2 Method 2: Hopkins and May (HM)
Hopkins and May (2013) introduced a graphicalmodel formulation of the task, which makes thenotion of underlying system ability even more ex-plicit. Each system SJ in the pool {Sj} is repre-sented by an associated relative ability µj and avariance σ2a (fixed across all systems) which serveas the parameters of a Gaussian distribution. Sam-ples from this distribution represent the qualityof sentence translations, with higher quality sam-ples having higher values. Pairwise annotations(S1, S2, π) are generated according to the follow-ing process:
19
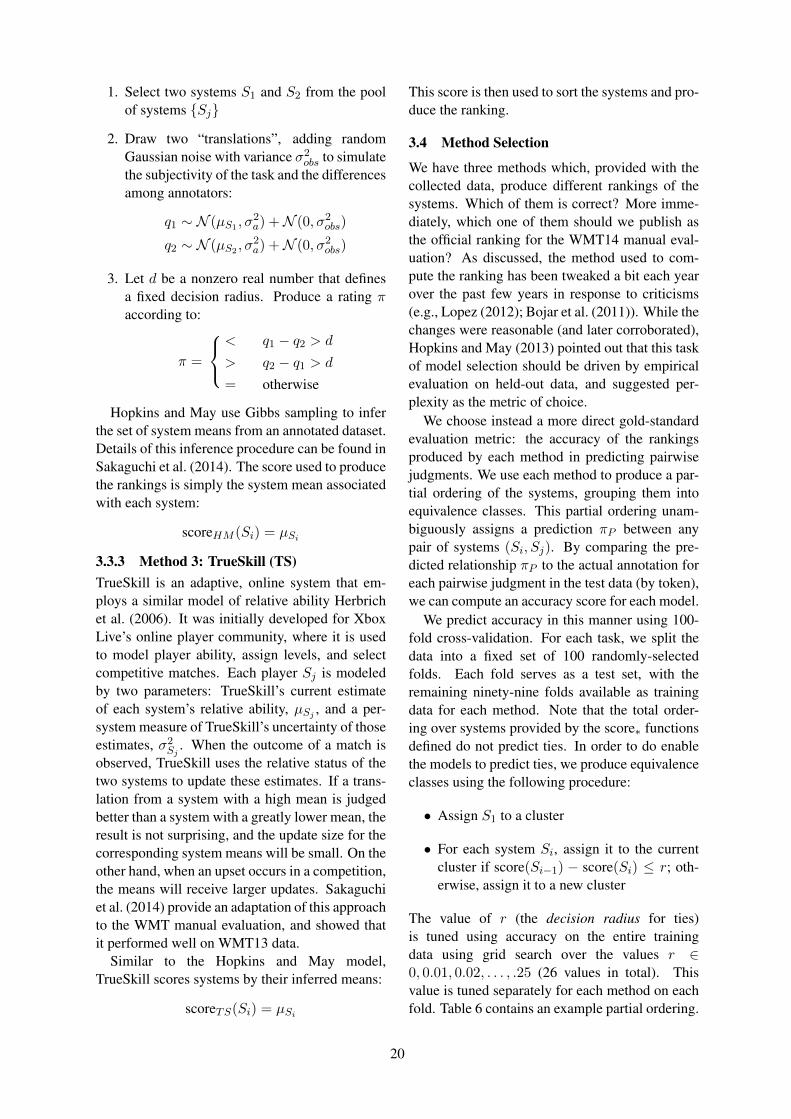
1. Select two systems S1 and S2 from the poolof systems {Sj}
2. Draw two “translations”, adding randomGaussian noise with variance σ2obs to simulatethe subjectivity of the task and the differencesamong annotators:
q1 ∼ N (µS1 , σ2a) +N (0, σ2obs)
q2 ∼ N (µS2 , σ2a) +N (0, σ2obs)
3. Let d be a nonzero real number that definesa fixed decision radius. Produce a rating πaccording to:
π =
< q1 − q2 > d
> q2 − q1 > d
= otherwise
Hopkins and May use Gibbs sampling to inferthe set of system means from an annotated dataset.Details of this inference procedure can be found inSakaguchi et al. (2014). The score used to producethe rankings is simply the system mean associatedwith each system:
scoreHM (Si) = µSi
3.3.3 Method 3: TrueSkill (TS)TrueSkill is an adaptive, online system that em-ploys a similar model of relative ability Herbrichet al. (2006). It was initially developed for XboxLive’s online player community, where it is usedto model player ability, assign levels, and selectcompetitive matches. Each player Sj is modeledby two parameters: TrueSkill’s current estimateof each system’s relative ability, µSj , and a per-system measure of TrueSkill’s uncertainty of thoseestimates, σ2Sj
. When the outcome of a match isobserved, TrueSkill uses the relative status of thetwo systems to update these estimates. If a trans-lation from a system with a high mean is judgedbetter than a system with a greatly lower mean, theresult is not surprising, and the update size for thecorresponding system means will be small. On theother hand, when an upset occurs in a competition,the means will receive larger updates. Sakaguchiet al. (2014) provide an adaptation of this approachto the WMT manual evaluation, and showed thatit performed well on WMT13 data.
Similar to the Hopkins and May model,TrueSkill scores systems by their inferred means:
scoreTS(Si) = µSi
This score is then used to sort the systems and pro-duce the ranking.
3.4 Method Selection
We have three methods which, provided with thecollected data, produce different rankings of thesystems. Which of them is correct? More imme-diately, which one of them should we publish asthe official ranking for the WMT14 manual eval-uation? As discussed, the method used to com-pute the ranking has been tweaked a bit each yearover the past few years in response to criticisms(e.g., Lopez (2012); Bojar et al. (2011)). While thechanges were reasonable (and later corroborated),Hopkins and May (2013) pointed out that this taskof model selection should be driven by empiricalevaluation on held-out data, and suggested per-plexity as the metric of choice.
We choose instead a more direct gold-standardevaluation metric: the accuracy of the rankingsproduced by each method in predicting pairwisejudgments. We use each method to produce a par-tial ordering of the systems, grouping them intoequivalence classes. This partial ordering unam-biguously assigns a prediction πP between anypair of systems (Si, Sj). By comparing the pre-dicted relationship πP to the actual annotation foreach pairwise judgment in the test data (by token),we can compute an accuracy score for each model.
We predict accuracy in this manner using 100-fold cross-validation. For each task, we split thedata into a fixed set of 100 randomly-selectedfolds. Each fold serves as a test set, with theremaining ninety-nine folds available as trainingdata for each method. Note that the total order-ing over systems provided by the score∗ functionsdefined do not predict ties. In order to do enablethe models to predict ties, we produce equivalenceclasses using the following procedure:
• Assign S1 to a cluster
• For each system Si, assign it to the currentcluster if score(Si−1) − score(Si) ≤ r; oth-erwise, assign it to a new cluster
The value of r (the decision radius for ties)is tuned using accuracy on the entire trainingdata using grid search over the values r ∈0, 0.01, 0.02, . . . , .25 (26 values in total). Thisvalue is tuned separately for each method on eachfold. Table 6 contains an example partial ordering.
20
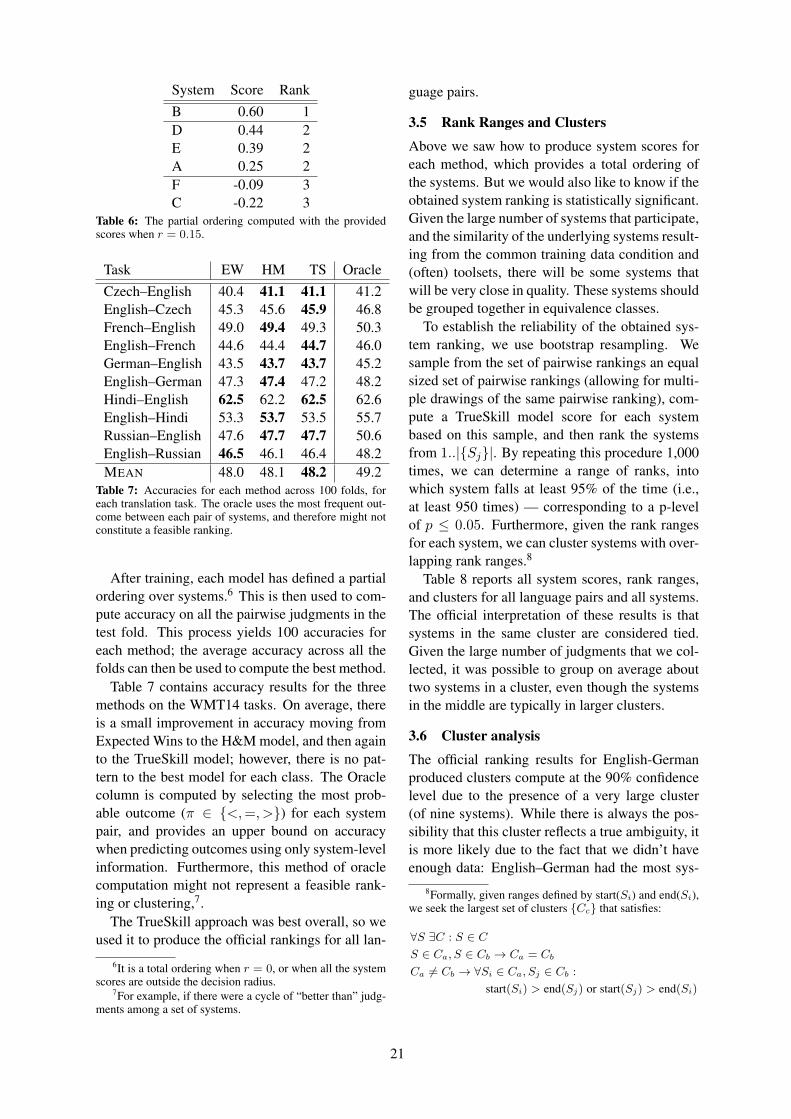
System Score RankB 0.60 1D 0.44 2E 0.39 2A 0.25 2F -0.09 3C -0.22 3
Table 6: The partial ordering computed with the providedscores when r = 0.15.
Task EW HM TS OracleCzech–English 40.4 41.1 41.1 41.2English–Czech 45.3 45.6 45.9 46.8French–English 49.0 49.4 49.3 50.3English–French 44.6 44.4 44.7 46.0German–English 43.5 43.7 43.7 45.2English–German 47.3 47.4 47.2 48.2Hindi–English 62.5 62.2 62.5 62.6English–Hindi 53.3 53.7 53.5 55.7Russian–English 47.6 47.7 47.7 50.6English–Russian 46.5 46.1 46.4 48.2MEAN 48.0 48.1 48.2 49.2
Table 7: Accuracies for each method across 100 folds, foreach translation task. The oracle uses the most frequent out-come between each pair of systems, and therefore might notconstitute a feasible ranking.
After training, each model has defined a partialordering over systems.6 This is then used to com-pute accuracy on all the pairwise judgments in thetest fold. This process yields 100 accuracies foreach method; the average accuracy across all thefolds can then be used to compute the best method.
Table 7 contains accuracy results for the threemethods on the WMT14 tasks. On average, thereis a small improvement in accuracy moving fromExpected Wins to the H&M model, and then againto the TrueSkill model; however, there is no pat-tern to the best model for each class. The Oraclecolumn is computed by selecting the most prob-able outcome (π ∈ {<,=, >}) for each systempair, and provides an upper bound on accuracywhen predicting outcomes using only system-levelinformation. Furthermore, this method of oraclecomputation might not represent a feasible rank-ing or clustering,7.
The TrueSkill approach was best overall, so weused it to produce the official rankings for all lan-
6It is a total ordering when r = 0, or when all the systemscores are outside the decision radius.
7For example, if there were a cycle of “better than” judg-ments among a set of systems.
guage pairs.
3.5 Rank Ranges and Clusters
Above we saw how to produce system scores foreach method, which provides a total ordering ofthe systems. But we would also like to know if theobtained system ranking is statistically significant.Given the large number of systems that participate,and the similarity of the underlying systems result-ing from the common training data condition and(often) toolsets, there will be some systems thatwill be very close in quality. These systems shouldbe grouped together in equivalence classes.
To establish the reliability of the obtained sys-tem ranking, we use bootstrap resampling. Wesample from the set of pairwise rankings an equalsized set of pairwise rankings (allowing for multi-ple drawings of the same pairwise ranking), com-pute a TrueSkill model score for each systembased on this sample, and then rank the systemsfrom 1..|{Sj}|. By repeating this procedure 1,000times, we can determine a range of ranks, intowhich system falls at least 95% of the time (i.e.,at least 950 times) — corresponding to a p-levelof p ≤ 0.05. Furthermore, given the rank rangesfor each system, we can cluster systems with over-lapping rank ranges.8
Table 8 reports all system scores, rank ranges,and clusters for all language pairs and all systems.The official interpretation of these results is thatsystems in the same cluster are considered tied.Given the large number of judgments that we col-lected, it was possible to group on average abouttwo systems in a cluster, even though the systemsin the middle are typically in larger clusters.
3.6 Cluster analysis
The official ranking results for English-Germanproduced clusters compute at the 90% confidencelevel due to the presence of a very large cluster(of nine systems). While there is always the pos-sibility that this cluster reflects a true ambiguity, itis more likely due to the fact that we didn’t haveenough data: English–German had the most sys-
8Formally, given ranges defined by start(Si) and end(Si),we seek the largest set of clusters {Cc} that satisfies:
∀S ∃C : S ∈ CS ∈ Ca, S ∈ Cb → Ca = Cb
Ca 6= Cb → ∀Si ∈ Ca, Sj ∈ Cb :
start(Si) > end(Sj) or start(Sj) > end(Si)
21

Czech–English# score range system1 0.591 1 ONLINE-B2 0.290 2 UEDIN-PHRASE3 -0.171 3-4 UEDIN-SYNTAX
-0.243 3-4 ONLINE-A4 -0.468 5 CU-MOSES
English–Czech# score range system1 0.371 1-3 CU-DEPFIX
0.356 1-3 UEDIN-UNCNSTR0.333 1-4 CU-BOJAR0.287 3-4 CU-FUNKY
2 0.169 5-6 ONLINE-B0.113 5-6 UEDIN-PHRASE
3 0.030 7 ONLINE-A4 -0.175 8 CU-TECTO5 -0.534 9 COMMERCIAL16 -0.950 10 COMMERCIAL2
Russian–English# score range system1 0.583 1 AFRL-PE2 0.299 2 ONLINE-B3 0.190 3-5 ONLINE-A
0.178 3-5 PROMT-HYBRID0.123 4-7 PROMT-RULE0.104 5-8 UEDIN-PHRASE0.069 5-8 Y-SDA0.066 5-8 ONLINE-G
4 -0.017 9 AFRL5 -0.159 10 UEDIN-SYNTAX6 -0.306 11 KAZNU7 -0.487 12 RBMT18 -0.642 13 RBMT4
English–Russian# score range system1 0.575 1-2 PROMT-RULE
0.547 1-2 ONLINE-B2 0.426 3 PROMT-HYBRID3 0.305 4-5 UEDIN-UNCNSTR
0.231 4-5 ONLINE-G4 0.089 6-7 ONLINE-A
0.031 6-7 UEDIN-PHRASE5 -0.920 8 RBMT46 -1.284 9 RBMT1
German–English# score range system1 0.451 1 ONLINE-B2 0.267 2-3 UEDIN-SYNTAX
0.258 2-3 ONLINE-A3 0.147 4-6 LIMSI-KIT
0.146 4-6 UEDIN-PHRASE0.138 4-6 EU-BRIDGE
4 0.026 7-8 KIT-0.049 7-8 RWTH
5 -0.125 9-11 DCU-ICTCAS-0.157 9-11 CMU-0.192 9-11 RBMT4
6 -0.306 12 RBMT17 -0.604 13 ONLINE-C
French–English# score range system1 0.608 1 UEDIN-PHRASE2 0.479 2-4 KIT
0.475 2-4 ONLINE-B0.428 2-4 STANFORD
3 0.331 5 ONLINE-A4 -0.389 6 RBMT15 -0.648 7 RBMT46 -1.284 8 ONLINE-C
English–French# score range system1 0.327 1 ONLINE-B2 0.232 2-4 UEDIN-PHRASE
0.194 2-5 KIT0.185 2-5 MATRAN0.142 4-6 MATRAN-RULES0.120 4-6 ONLINE-A
3 0.003 7-9 UU-DOCENT-0.019 7-10 PROMT-HYBRID-0.033 7-10 UA-0.069 8-10 PROMT-RULE
4 -0.215 11 RBMT15 -0.328 12 RBMT46 -0.540 13 ONLINE-C
English–German# score range system1 0.264 1-2 UEDIN-SYNTAX
0.242 1-2 ONLINE-B2 0.167 3-6 ONLINE-A
0.156 3-6 PROMT-HYBRID0.155 3-6 PROMT-RULE0.155 3-6 UEDIN-STANFORD
3 0.094 7 EU-BRIDGE4 0.033 8-10 RBMT4
0.031 8-10 UEDIN-PHRASE0.012 8-10 RBMT1
5 -0.032 11-12 KIT-0.069 11-13 STANFORD-UNC-0.100 12-14 CIMS-0.126 13-15 STANFORD-0.158 14-16 UU-0.191 15-16 ONLINE-C
6 -0.307 17-18 IMS-TTT-0.325 17-18 UU-DOCENT
Hindi–English# score range system1 1.326 1 ONLINE-B2 0.559 2-3 ONLINE-A
0.476 2-4 UEDIN-SYNTAX0.434 3-4 CMU
3 0.323 5 UEDIN-PHRASE4 -0.198 6-7 AFRL
-0.280 6-7 IIT-BOMBAY5 -0.549 8 DCU-LINGO246 -2.092 9 IIIT-HYDERABAD
English–Hindi# score range system1 1.008 1 ONLINE-B2 0.915 2 ONLINE-A3 0.214 3 UEDIN-UNCNSTR4 0.120 4-5 UEDIN-PHRASE
0.054 4-5 CU-MOSES5 -0.111 6-7 IIT-BOMBAY
-0.142 6-7 IPN-UPV-CNTXT6 -0.233 8-9 DCU-LINGO24
-0.261 8-9 IPN-UPV-NODEV7 -0.449 10-11 MANAWI-H1
-0.494 10-11 MANAWI8 -0.622 12 MANAWI-RMOOV
Table 8: Official results for the WMT14 translation task. Systems are ordered by their inferred system means. Lines betweensystems indicate clusters according to bootstrap resampling at p-level p ≤ .05, except for English–German, where p ≤ 0.1.This method is also used to determine the range of ranks into which system falls. Systems with grey background indicate useof resources that fall outside the constraints provided for the shared task.
22

tems (18, compared to 13 for the next languages),yet only an average amount of per-system data.Here, we look at this language pair in more detail,in order to justify this decision, and to shed lighton the differences between the ranking methods.
Table 9 presents the 95% confidence-level clus-terings for English–German computed with eachof the three methods, along with lines that showthe reorderings of the systems between them. Re-orderings of this type have been used to argueagainst the reliability of the official WMT rank-ing (Lopez, 2012; Hopkins and May, 2013). Thistable shows that these reorderings are captured en-tirely by the clustering approach we used. This rel-ative consensus of these independently-computedand somewhat different models suggests that thepublished ranking is approaching the true ambigu-ity underlying systems within the same cluster.
Looking across all language pairs, we find thatthe total ordering predicted by EW and TS is ex-actly the same for eight of the ten language pairtasks, and is constrained to reorderings withinthe official cluster for the other two (German–English — just one adjacent swap — and English–German, depicted in Table 9).
3.7 Conclusions
The official ranking method employed by WMTover the past few years has changed a few times asa result of error analysis and introspection. Untilthis year, these results were largely based on theintuitions of the community and organizers aboutdeficiencies in the models. In addition to their in-tuitive appeal, many of these changes (such as thedecision to throw out comparisons against refer-ences) have been empirically validated Hopkinsand May (2013). The actual effect of the refine-ments in the ranking metric has been minor pertur-bations in the permutation of systems. The cluster-ing method of Koehn (2012b), in which the officialrankings are presented as a partial (instead of to-tal) ordering, alleviated many of the problems ob-served by Lopez (2012), and also capture all thevariance across the new systems introduced thisyear. In addition, presenting systems as clustersappeals to intuition. As such, we disagree withclaims that there is a problem with irreproducibil-ity of the results of the workshop evaluation task,and especially disagree that there is anything ap-proaching a “crisis of confidence” (Hopkins andMay, 2013). These claims seem to us to be over-
stated.Conducting proper model selection by compar-
ison on held-out data, however, is a welcome sug-gestion, and our inclusion of this process supportsimproved confidence in the ranking results. Thatsaid, it is notable that the different methods com-pute very similar orderings. This avoids hallu-cinating distinctions among systems that are notreally there, and captures the intuition that somesystems are basically equivalent. The chief ben-efit of the TrueSkill model is not in outputting abetter complete ranking of the systems, but lies inits reduced variance, which allow us to cluster thesystems with less data. There is also the unex-plored avenue of using TrueSkill to drive the datacollection, steering the annotations of judges to-wards evenly matched systems during the collec-tion phase, potentially allowing confident resultsto be presented while collecting even less data.
There is, of course, more work to be done.We have produced this year statistically significantclusters with a third of the data required last year,which is an improvement. Models of relative abil-ity are a natural fit for the manual evaluation, andthe introduction of an online Bayesian approachto data collection present further opportunities toreduce the amount of data needed. These methodsalso provide a framework for extending the modelsin a variety of potentially useful ways, includingmodeling annotator bias, incorporating sentencemetadata (such as length, difficulty, or subtopic),and adding features of the sentence pairs.
4 Quality Estimation Task
Machine translation quality estimation is the taskof predicting a quality score for a machine trans-lated text without access to reference translations.The most common approach is to treat the problemas a supervised machine learning task, using stan-dard regression or classification algorithms. Thethird edition of the WMT shared task on qual-ity estimation builds on the previous editions ofthe task (Callison-Burch et al., 2012; Bojar et al.,2013), with tasks including both sentence-leveland word-level estimation, with new training andtest datasets.
The goals of this year’s shared task were:
• To investigate the effectiveness of differentquality labels.
• To explore word-level quality prediction at
23

Expected Wins Hopkins & May TrueSkillUEDIN-SYNTAX UEDIN-SYNTAX UEDIN-SYNTAX
ONLINE-B ONLINE-B ONLINE-B
ONLINE-A UEDIN-STANFORD ONLINE-AUEDIN-STANFORD PROMT-HYBRID PROMT-HYBRID
PROMT-RULE ONLINE-A PROMT-RULE
PROMT-HYBRID PROMT-RULE UEDIN-STANFORD
EU-BRIDGE EU-BRIDGE EU-BRIDGE
RBMT4 UEDIN-PHRASE RBMT4UEDIN-PHRASE RBMT4 UEDIN-PHRASE
RBMT1 RBMT1 RBMT1KIT KIT KIT
STANFORD-UNC STANFORD-UNC STANFORD-UNC
CIMS CIMS CIMS
STANFORD STANFORD STANFORD
UU UU UU
ONLINE-C ONLINE-C ONLINE-C
IMS-TTT UU-DOCENT IMS-TTTUU-DOCENT IMS-TTT UU-DOCENT
Table 9: A comparison of the rankings produced by Expected Wins, Hopkins & May, and TrueSkill for English–German (thetask with the most systems and the largest cluster). The lines extending all the way across mark the official English–Germanclustering (computed from TrueSkill with 90% confidence intervals), while bold entries mark the start of new clusters withineach method or column (computed at the 95% confidence level). The TrueSkill clusterings contain all the system reorderingsacross the other two ranking methods.
different levels of granularity.
• To study the effects of training and testdatasets with mixed domains, language pairsand MT systems.
• To examine the effectiveness of quality pre-diction methods on human translations.
Four tasks were proposed: Tasks 1.1, 1.2, 1.3are defined at the sentence-level (Sections 4.1),while Task 2, at the word-level (Section 4.2). Eachtask provides one or more datasets with up to fourlanguage pairs each: English-Spanish, English-German, German-English, Spanish-English, andup to four alternative translations generated by:a statistical MT system (SMT), a rule-based MTsystem (RBMT), a hybrid MT system, and a hu-man. These datasets were annotated with differ-ent labels for quality by professional translators aspart of the QTLaunchPad9 project. External re-sources (e.g. parallel corpora) were provided toparticipants. Any additional resources, includingadditional quality estimation training data, could
9http://www.qt21.eu/launchpad/
be used by participants (no distinction betweenopen and close tracks is made). Participants werealso provided with a software package to extractquality estimation features and perform modellearning, with a suggested list of baseline featuresand learning method for sentence-level prediction.Participants, described in Section 4.3, could sub-mit up to two systems for each task.
Data used for building specific MT systems orinternal system information (such as n-best lists)were not made available this year as multiple MTsystems were used to produced the datasets, in-cluding rule-based systems. In addition, part ofthe translations were produced by humans. Infor-mation on the sources of translations was not pro-vided either. Therefore, as a general rule, partici-pants were only allowed to use black-box features.
4.1 Sentence-level Quality EstimationFor the sentence-level tasks, two variants of theresults could be submitted for each task and lan-guage pair:
• Scoring: An absolute quality score for eachsentence translation according to the type of
24

prediction, to be interpreted as an error met-ric: lower scores mean better translations.
• Ranking: A ranking of sentence translationsfor all source test sentences from best toworst. For this variant, it does not matter howthe ranking is produced (from HTER predic-tions, likert predictions, or even without ma-chine learning).
Evaluation was performed against the true labeland/or HTER ranking using the same metrics as inprevious years:
• Scoring: Mean Average Error (MAE) (pri-mary metric), Root Mean Squared Error(RMSE).
• Ranking: DeltaAvg (primary metric) (Bojaret al., 2013) and Spearman’s rank correlation.
For all sentence-level these tasks, the same 17features as in WMT12-13 were used to build base-line systems. The SVM regression algorithmwithin QUEST (Specia et al., 2013)10 was appliedfor that with RBF kernel and grid search for pa-rameter optimisation.
Task 1.1 Predicting post-editing effortData in this task is labelled with discrete andabsolute scores for perceived post-editing effort,where:
• 1 = Perfect translation, no post-editingneeded at all.
• 2 = Near miss translation: translation con-tains maximum of 2-3 errors, and possiblyadditional errors that can be easily fixed (cap-italisation, punctuation, etc.).
• 3 = Very low quality translation, cannot beeasily fixed.
The datasets were annotated in a “triage” phaseaimed at selecting translations of type “2” (nearmiss) that could be annotated for errors at theword-level using the MQM metric (see Task 2, be-low) for a more fine-grained and systematic trans-lation quality analysis. Word-level errors in trans-lations of type “3” are too difficult if not impos-sible to annotate and classify, particularly as theyoften contain inter-related errors in contiguous oroverlapping word spans.
10http://www.quest.dcs.shef.ac.uk/
For the training of prediction models, we pro-vide a new dataset consisting of source sen-tences and their human translations, as well astwo-three versions of machine translations (by anSMT system, an RBMT system and, for English-Spanish/German only, a hybrid system), all in thenews domain, extracted from tests sets of variousWMT years and MT systems that participated inthe translation shared task:
# Source sentences # Target sentences954 English 3,816 Spanish350 English 1,400 German350 German 1,050 English350 Spanish 1,050 English
As test data, for each language pair and MT sys-tem (or human translation) we provide a new setof translations produced by the same MT systems(and humans) as those used for the training data:
# Source sentences # Target sentences150 English 600 Spanish150 English 600 German150 German 450 English150 Spanish 450 English
The distribution of true scores in both trainingand test sets for each language pair is given in Fig-ures 3.
0%#
10%#
20%#
30%#
40%#
50%#
60%#
{en-de
-1}#
{en-de
-2}#
{en-de
-3}#
{de-en
-1}#
{de-en
-2}#
{de-en
-3}#
{en-es-1}#
{en-es-2}##
{en-es-3}##
{es-en
-1}#
{es-en
-2}#
{es-en
-3}#
#Training##### #Test####
Figure 3: Distribution of true 1-3 scores by langauge pair.
Additionally, we provide some out of domaintest data. These translations were annotated inthe same way as above, each dataset by one Lan-guage Service Provider (LSP), i.e, one profes-sional translator, with two LPSs producing data in-dependently for English-Spanish. They were gen-erated using the LSPs’ own source data (a differentdomain from news), and own MT system (differ-ent from the three used for the official datasets).The results on these datasets were not considered
25

for the official ranking of the participating sys-tems:
# Source sentences # Target sentences971 English 971 Spanish297 English 297 German388 Spanish 388 English
Task 1.2 Predicting percentage of editsIn this task we use HTER (Snover et al., 2006) asquality score. This score is to be interpreted asthe minimum edit distance between the machinetranslation and its manually post-edited version,and its range is [0, 1] (0 when no edit needs tobe made, and 1 when all words need to be edited).We used TERp (default settings: tokenised, caseinsensitive, etc., but capped to 1)11 to compute theHTER scores.
For practical reasons, the data is a subset ofTask 1.1’s dataset: only translations producedby the SMT system English-Spanish. As train-ing data, we provide 896 English-Spanish trans-lation suggestions and their post-editions. Astest data, we provide a new set of 208 English-Spanish translations produced by the same SMTsystem. Each of the training and test translationswas post-edited by a professional translator usingthe CASMACAT12 web-based tool, which also col-lects post-editing time on a sentence-basis.
Task 1.3 Predicting post-editing timeFor this task systems are required to produce, foreach translation, a real valued estimate of the time(in milliseconds) it takes a translator to post-editthe translation. The training and test sets are a sub-set of that uses in Task 1.2 (subject to filtering ofoutliers). The difference is that the labels are nowthe number of milliseconds that were necessary topost-edit each translation.
As training data, we provide 650 English-Spanish translation suggestions and their post-editions. As test data, we provide a new set of 208English-Spanish translations (same test data as forTask 1.2).
4.2 Word-level Quality Estimation
The data for this task is based on a subset of thedatasets used for Task 1.1, for all language pairs,
11http://www.umiacs.umd.edu/˜snover/terp/12http://casmacat.eu/
human and machine translations: those transla-tions labelled “2” (near misses), plus additionaldata provided by industry (either on the news do-main or on other domains, such as technical doc-umentation, produced using their own MT sys-tems, and also pre-labelled as “2”). All seg-ments were annotated with word-level labels byprofessional translators using the core categoriesin MQM (Multidimensional Quality Metrics)13 aserror typology (see Figure 4). Each word or se-quence of words was annotated with a single error.For (supposedly rare) cases where a decision be-tween multiple fine-grained error types could notbe made, annotators were requested to choose acoarser error category in the hierarchy.
Participants are asked to produce a label foreach token that indicates quality at different lev-els of granularity:
• Binary classification: an OK / bad label,where bad indicates the need for editing thetoken.
• Level 1 classification: an OK / accuracy /fluency label, specifying coarser level cate-gories of errors for each token, or “OK” fortokens with no error.
• Multi-class classification: one of the labelsspecifying the error type for the token (termi-nology, mistranslation, missing word, etc.) inFigure 4, or “OK” for tokens with no error.
As training data, we provide tokenised transla-tion output for all language pairs, human and ma-chine translations, with tokens annotated with allissue types listed above, or “OK”. The annotationwas performed manually by professional transla-tors as part of the QTLaunchPad project. Forthe coarser variants, fine-grained errors are gen-eralised to Accuracy or Fluency, or “bad” for thebinary variant. The amount of available trainingdata varies by language pair:
# Source sentences # Target sentences1,957 English 1,957 Spanish715 English 715 German350 German 350 English900 Spanish 900 English
13http://www.qt21.eu/launchpad/content/training
26

Figure 4: MQM metric as error typology.
As test data, we provide additional data pointsfor all language pairs, human and machine trans-lations:
# Source sentences # Target sentences382 English 382 Spanish150 English 150 German100 German 100 English150 Spanish 150 English
In contrast to Tasks 1.1–1.3, no baseline featureset is provided to the participants.
Similar to last year (Bojar et al., 2013), theword-level task is primarily evaluated by macro-averaged F-measure (in %). Because the class dis-tribution is skewed – in the test data about 78% ofthe tokens are marked as “OK” – we compute pre-cision, recall, and F1 for each class individually,weighting F1 scores by the frequency of the classin the test data. This avoids giving undue impor-tance to less frequent classes. Consider the follow-ing confusion matrix for Level 1 annotation, i.e.the three classes (O)K, (F)luency, and (A)ccuracy:
referenceO F A
predictedO 4172 1482 193F 1819 1333 214A 198 133 69
For each of the three classes we assume a binarysetting (one-vs-all) and derive true-positive (tp),false-positive (fp), and false-negative (fn) countsfrom the rows and columns of the confusion ma-
trix as follows:
tpO = 4172
fpO = 1482 + 193 = 1675
fnO = 1819 + 198 = 2017
tpF = 1333
fpF = 1819 + 214 = 2033
fnF = 1482 + 133 = 1615
tpA = 69
fpA = 198 + 133 = 331
fnA = 193 + 214 = 407
We continue to compute F1 scores for eachclass c ∈ {O,F,A}:
precisionc = tpc/(tpc + fpc)
recallc = tpc/(tpc + fnc)
F1,c =2 · precisionc · recallcprecisionc+recallc
yielding:
precisionO = 4172/(4172 + 1675) = 0.7135
recallO = 4172/(4172 + 2017) = 0.6741
F1,O =2 · 0.7135 · 0.67410.7135 + 0.6741
= 0.6932
· · ·F1,F = 0.4222
F1,A = 0.1575
Finally, we compute the average of F1,c scoresweighted by the occurrence count N(c) of c:
weightedF1,ALL =1∑
cN(c)
∑
c
Nc · F1,c
weightedF1,ERR =1∑
c:c 6=ON(c)
∑
c:c 6=O
Nc · F1,c
27

which for the above example gives:
weightedF1,ALL =1
6189 + 2948 + 476·
(6189 · 0.6932 + 2948 · 0.4222+476 · 0.1575) = 0.5836
weightedF1,ERR =1
2948 + 476·
(2948 · 0.4222 + 476 · 0.1575)= 0.3854
We choose F1,ERR as our primary evaluation mea-sure because it most closely mimics the commonapplication of F1 scores in binary classification:one is interested in the performance in detecting apositive class, which in this case would be erro-neous words. This does, however, ignore the num-ber of correctly classified words of the OK class,which is why we also report F1,ALL. In addition,we follow Powers (2011) and report MatthewsCorrelation Coefficient (MCC), averaged in thesame way as F1, as our secondary metric. Finally,for contrast we also report Accuracy (ACC).
4.3 ParticipantsTable 10 lists all participating teams. Each teamwas allowed up to two submissions for each taskand language pair. In the descriptions below, par-ticipation in specific tasks is denoted by a taskidentifier: T1.1, T1.2, T1.3, and T2.
Sentence-level baseline system (T1.1, T1.2,T1.3): QUEST is used to extract 17 system-independent features from source and trans-lation sentences and parallel corpora (samefeatures as in the WMT12 shared task):
• number of tokens in the source and tar-get sentences.• average source token length.• average number of occurrences of the
target word within the target sentence.• number of punctuation marks in source
and target sentences.• language model (LM) probability of
source and target sentences based onmodels for the WMT News Commen-tary corpus.• average number of translations per
source word in the sentence as given byIBM Model 1 extracted from the WMT
News Commentary parallel corpus, andthresholded so that P (t|s) > 0.2, orso that P (t|s) > 0.01 weighted by theinverse frequency of each word in thesource side of the parallel corpus.
• percentage of unigrams, bigrams and tri-grams in frequency quartiles 1 (lowerfrequency words) and 4 (higher fre-quency words) in the source languageextracted from the WMT News Com-mentary corpus.
• percentage of unigrams in the sourcesentence seen in the source side of theWMT News Commentary corpus.
These features are used to train a SupportVector Machine (SVM) regression algorithmusing a radial basis function kernel withinthe SCIKIT-LEARN toolkit. The γ, ε and Cparameters were optimised via grid searchwith 5-fold cross validation on the trainingset. We note that although the system is re-ferred to as “baseline”, it is in fact a strongsystem. It has proved robust across a rangeof language pairs, MT systems, and text do-mains for predicting various forms of post-editing effort (Callison-Burch et al., 2012;Bojar et al., 2013).
DCU (T1.1): DCU-MIXED and DCU-SVR usea selection of features available in QUEST,such as punctuation statistics, LM perplex-ity, n-gram frequency quartile statistics andcoarse-grained POS frequency ratios, andfour additional feature types: combined POSand stop word LM features, source-sidepseudo-reference features, inverse glass-boxfeatures for translating the translation and er-ror grammar parsing features. For machinelearning, the QUEST framework is expandedto combine logistic regression and supportvector regression and to handle cross- valida-tion and randomisation in a way that trainingitems with the same source side are kept to-gether. External resources are monolingualcorpora taken from the WMT 2014 transla-tion task for LMs, the MT system used for theinverse glass-box features (Li et al., 2014b)and, for error grammar parsing, the Penn-Treebank and an error grammar derived fromit (Foster, 2007).
28

ID Participating teamDCU Dublin City University Team 1, Ireland (Hokamp et al., 2014)DFKI German Research Centre for Artificial Intelligence, Germany (Avramidis,
2014)FBK-UPV-UEDIN Fondazione Bruno Kessler, Italy, UPV Universitat Politecnica de Valencia,
Spain & University of Edinburgh, UK (Camargo de Souza et al., 2014)LIG Laboratoire d’Informatique Grenoble, France (Luong et al., 2014)
LIMSI Laboratoire d’Informatique pour la Mecanique et les Sciences de l’Ingenieur,France (Wisniewski et al., 2014)
MULTILIZER Multilizer, FinlandRTM-DCU Dublin City University Team 2, Ireland (Bicici and Way, 2014)SHEF-lite University of Sheffield Team 1, UK (Beck et al., 2014)USHEFF University of Sheffield Team 2, UK (Scarton and Specia, 2014)
Y-SDA Yandex School of Data Analysis, Russia
Table 10: Participants in the WMT14 Quality Estimation shared task.
DFKI (T1.2): DFKI/SVR builds upon the base-line system (above) by adding non-redundantdata from the WMT13 task for predictingthe same label (HTER) and additional fea-tures such as (a) rule-based language cor-rections (language tool) (b), PCFG parsingstatistics and counts of tree labels, (c) po-sition statistics of parsing labels, (d) posi-tion statistics of trigrams with low probabil-ity. DFKI/SVRxdata uses a similar setting,with the addition of more training data fromnon-minimally post-edited translation out-puts (references), filtered based on a thresh-old on the edit distance between the MT out-put and the freely-translated reference.
FBK-UPV-UEDIN (T1.2, T1.3, T2): The sub-missions for the word-level task (T2) use fea-tures extracted from word posterior probabil-ities and confusion network descriptors com-puted over the 100k-best hypothesis transla-tions generated by a phrase-based SMT sys-tem. They also use features from word lexi-cons, and POS tags of each word for sourceand translation sentences. The predictions ofthe Binary model are used as a feature for theLevel 1 and Multi-class settings. Both condi-tional random fields (CRF) and bidirectionallong short-term memory recurrent neural net-works (BLSTM-RNNs) are used for the Bi-nary setting, and BLSTM-RNNs only for theLevel 1 and Multi-class settings.
The sentence-level QE submissions (T1.2and T1.3) are trained on black-box featuresextracted using QUEST in addition to fea-
tures based on word alignments, word poste-rior probabilities and diversity scores (Souzaet al., 2013). These features are computedover 100k-best hypothesis translations alsoused for task 2. In addition, a set of ratioscomputed from the word-level predictions ofthe model trained on the binary setting oftask 2 is used. A total of 221 features andthe extremely randomised trees (Geurts et al.,2006) learning algorithm are used to train re-gression models.
LIG (T2): Conditional Random Fields classi-fiers are trained with features used in LIG’sWMT13 systems (Luong et al., 2013): tar-get and source words, alignment informa-tion, source and target alignment context,LM scores, target and source POS tags,lexical categorisations (stopword, punctua-tion, proper name, numerical), constituentlabel, depth in the constituent tree, targetpolysemy count, pseudo reference. Theseare combined with novel features: wordoccurrence in multiple translation systemsand POS tag-based LM scores (longest tar-get/source n-gram length and backoff scorefor POS tag). These features require externalNLP tools and resources such as: TreeTag-ger, GIZA++, Bekerley parser, Link Gram-mar parser, WordNet and BabelNet, GoogleTranslate (pseudo-reference). For the binarytask, the optimal classification threshold istuned based on a development set split fromthe original training set. Feature selection isemployed over the all features (for the binary
29

task only), with the Sequential Backward Se-lection algorithm. The best performing fea-ture set is then also used for the Level 1 andMulti-class variants.
LIMSI (T2): The submission relies on a ran-dom forest classifier and considers only 16dense and continuous features. To preventsparsity issues, lexicalised information suchas the word or the previous word identitiesis not included. The features considered aremostly classic MT features and can be cat-egorised into two classes: association fea-tures, which describe the quality of the as-sociation between the source sentence andeach target word, and fluency features, whichdescribe the ’quality’ of the translation hy-potheses. The latter rely on different lan-guage models (either on POS or on words)and the former on IBM Model 1 translationprobabilities and on pseudo- references, i.e.translation produced by an independent MTsystem. Random forests are known to per-form well in tasks like this one, in whichonly a few dense and continuous features areavailable, possibly because of their ability totake into account complex interactions be-tween features and to automatically partitionthe continuous feature values into a discreteset of intervals that achieves the best classifi-cation performance. Since they predict theclass probabilities, it is possible to directlyoptimize the F1 score during training by find-ing, with a grid search method, the decisionthreshold that achieved the best F1 score onthe training set.
MULTILIZER (T1.2, T1.3): The 80 black-boxfeatures from QUEST are used in addition tonew features based on using other MT en-gines for forward and backward translations.In forward translations, the idea is that dif-ferent MT engines make different mistakes.Therefore, when several forward translationsare similar to each other, these translationsare more likely to be correct. This is con-firmed by the Pearson correlation of similar-ities between the forward translations againstthe true scores (above 0.5). A backwardtranslation is very error-prone and thereforeit has to be used in combination with for-ward translations. A single back-translation
similar to original source segment does notbring much information. Instead, when sev-eral MT engines give back-translations simi-lar to this source segment, one can concludethat the translation is reliable. Those transla-tions where similarities both in forward trans-lation and backward translation are high areintuitively more likely to be good. A simplefeature selection method that omits all fea-tures with Pearson correlation against the truescores below 0.2 is used. The systems sub-mitted are obtained using linear regressionmodels.
RTM-DCU (T1.1, T1.2, T1.3, T2): RTM-DCUsystems are based on referential translationmachines (RTM) (Bicici, 2013) and parallelfeature decay algorithms (ParFDA5) (Biciciet al., 2014), which allow language and MTsystem-independent predictions. For eachtask, individual RTM models are developedusing the parallel corpora and the languagemodel corpora distributed by the WMT14translation task and the language model cor-pora provided by LDC for English and Span-ish. RTMs use 337 to 437 sentence-level fea-tures for coverage and diversity, IBM1 andsentence translation performance, retrievalcloseness and minimum Bayes retrieval risk,distributional similarity and entropy, IBM2alignment, character n-grams, sentence read-ability, and parse output tree structures. Thefeatures use ngrams defined over text or com-mon cover link (CCL) (Seginer, 2007) struc-tures as the basic units of information overwhich similarity calculations are performed.Learning models include ridge regression(RR), support vector machines (SVR), andregression trees (TREE), which are appliedafter partial least squares (PLS) or featureselection (FS). For word-level prediction,generalised linear models (GLM) (Collins,2002) and GLM with dynamic learning(GLMd) (Bicici, 2013) are used with word-level features including CCL links, wordlength, location, prefix, suffix, form, context,and alignment, totalling up to a couple of mil-lion features.
SHEF-lite (T1.1, T1.2, T1.3): These submis-sions use the framework of Multi-task Gaus-sian Processes, where multiple datasets are
30

combined in a multi-task setting similar tothe one used by Cohn and Specia (2013).For T1.1, data for all language pairs is puttogether, and each language is considered atask. For T1.2 and T1.3, additional datasetsfrom previous shared task years are used,each encoded as a different task. For all tasks,the QUEST framework is used to extract a setof 80 black-box features (a superset of the 17baseline features). To cope with the large sizeof the datasets, the SHEF-lite-sparse submis-sion uses Sparse Gaussian Processes, whichprovide sensible sparse approximations usingonly a subset of instances (inducing inputs)to speed up training and prediction. For this“sparse” submission, feature selection is per-formed following the approach of Shah et al.(2013) by ranking features according to theirlearned length-scales and selecting the top 40features.
USHEFF (T1.1, T1.2, T1.3): USHEFF submis-sions exploit the use of consensus amongMT systems by comparing the MT sys-tem output to several alternative translationsgenerated by other MT systems (pseudo-references). The comparison is done usingstandard evaluation metrics (BLEU, TER,METEOR, ROUGE for all tasks, and twometrics based on syntactic similarities fromshallow and dependency parser informationfor T1.2 and T1.3). Figures extracted fromsuch metrics are used as features to com-plement prediction models trained on the 17baseline features. Different from the standarduse of pseudo-reference features, these fea-tures do not assume that the alternative MTsystems are better than the system of inter-est. A more realistic scenario is consideredwhere the quality of the pseudo-references isnot known. For T1, no external systems inaddition to those provided for the shared taskare used: for a given translation, all alter-native translations for the same source seg-ment (two or three, depending on the lan-guage pair) are used as pseudo-references.For T1.2 and T1.3, for each source sentence,all alternative translations produced by MTsystems on the same data (WMT12/13) areused as pseudo-references. The hypothesisis that by using translations from several MTsystems one can find consensual information
and this can smooth out the effect of “coinci-dences” in the similarities between systems’translations. SVM regression with radial ba-sis function kernel and hyper-parameters op-timised via grid search is used to build themodels.
Y-SDA (T1.1): Both submissions are basedon the the 80 black-box features, plus anLM score from a larger language model,a pseudo-reference, and several additionalfeatures based on POS tags and syntacticparsers. The first attempt uses an extractof the top 5 features selected with a greedysearch from the set of all features. SVM re-gression is used as machine learning algo-rithm. The second attempt uses the samefeatures processed with Yandex’ implemen-tation of the gradient tree boosting (Ma-trixNet).
4.4 Results
In what follows we give the official results for alltasks followed by a discussion that highlights themain findings for each of the tasks.
Task 1.1 Predicting post-editing effortTable 11 summarises the results for the rankingvariant of Task 1.1. They are sorted from best toworst using the DeltaAvg metric scores as primarykey and the Spearman’s rank correlation scores assecondary key.
The winning submissions for the ranking vari-ant of Task 1.1 are as follows: for English-Spanishit is RTM-DCU/RTM-TREE, with a DeltaAvgscore of 0.26; for Spanish-English it is USH-EFF, with a DeltaAvg score of 0.23; for English-German it is again RTM-DCU/RTM-TREE, with aDeltaAvg score of 0.39; and for German-English itis RTM-DCU/RTM-RR, with a DeltaAvg score of0.38. These winning submissions are better thanthe baseline system by a large margin, which indi-cates that current best performance in MT qualityestimation has reached levels that are clearly be-yond what the baseline system can produce. As forthe other systems, according to DeltaAvg, com-pared to the previous year results a smaller per-centage of systems is able to beat the baseline.This might be a consequence of the use of the met-ric for the prediction of only three discrete labels.
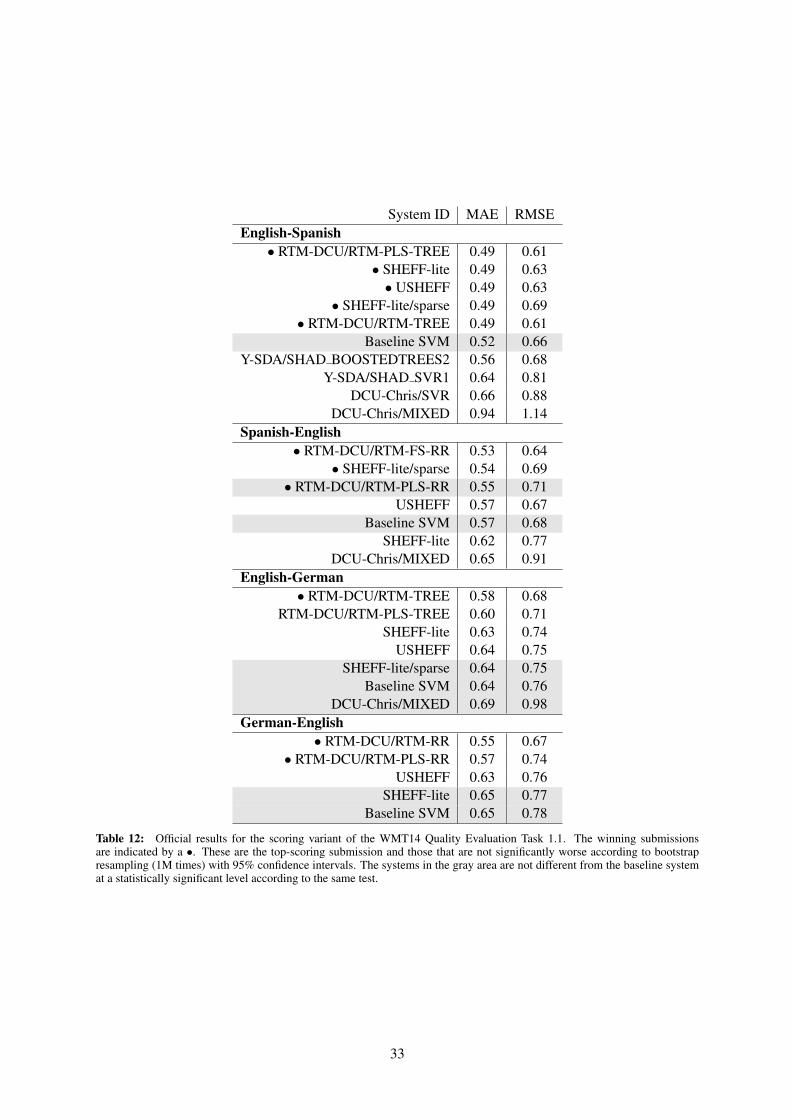
The results for the scoring task are presented inTable 12, sorted from best to worst using the MAE
31

System ID DeltaAvg Spearman CorrEnglish-Spanish
• RTM-DCU/RTM-PLS-TREE 0.26 0.38• RTM-DCU/RTM-TREE 0.26 0.41
• Y-SDA/SHAD BOOSTEDTREES2 0.23 0.35USHEFF 0.21 0.33
SHEFF-lite 0.21 0.33Y-SDA/SHAD SVR1 0.18 0.29
SHEFF-lite-sparse 0.17 0.27Baseline SVM 0.14 0.22
Spanish-English• USHEFF 0.23 0.30
• RTM-DCU/RTM-PLS-RR 0.20 0.35• RTM-DCU/RTM-FS-RR 0.19 0.36
Baseline SVM 0.12 0.21SHEFF-lite-sparse 0.12 0.17
SHEFF-lite 0.11 0.15English-German
• RTM-DCU/RTM-TREE 0.39 0.54RTM-DCU/RTM-PLS-TREE 0.33 0.42
USHEFF 0.26 0.41SHEFF-lite 0.26 0.36
Baseline SVM 0.23 0.34SHEFF-lite-sparse 0.23 0.33
German-English• RTM-DCU/RTM-RR 0.38 0.51
• RTM-DCU/RTM-PLS-RR 0.35 0.45USHEFF 0.28 0.30
SHEFF-lite 0.24 0.27Baseline SVM 0.21 0.25
SHEFF-lite-sparse 0.14 0.17
Table 11: Official results for the ranking variant of the WMT14 Quality Evaluation Task 1.1. The winning submissionsare indicated by a •. These are the top-scoring submission and those that are not significantly worse according to bootstrapresampling (1M times) with 95% confidence intervals. The systems in the gray area are not different from the baseline systemat a statistically significant level according to the same test.
32
System ID MAE RMSEEnglish-Spanish• RTM-DCU/RTM-PLS-TREE 0.49 0.61
• SHEFF-lite 0.49 0.63• USHEFF 0.49 0.63
• SHEFF-lite/sparse 0.49 0.69• RTM-DCU/RTM-TREE 0.49 0.61
Baseline SVM 0.52 0.66Y-SDA/SHAD BOOSTEDTREES2 0.56 0.68
Y-SDA/SHAD SVR1 0.64 0.81DCU-Chris/SVR 0.66 0.88
DCU-Chris/MIXED 0.94 1.14Spanish-English
• RTM-DCU/RTM-FS-RR 0.53 0.64• SHEFF-lite/sparse 0.54 0.69
• RTM-DCU/RTM-PLS-RR 0.55 0.71USHEFF 0.57 0.67
Baseline SVM 0.57 0.68SHEFF-lite 0.62 0.77
DCU-Chris/MIXED 0.65 0.91English-German
• RTM-DCU/RTM-TREE 0.58 0.68RTM-DCU/RTM-PLS-TREE 0.60 0.71
SHEFF-lite 0.63 0.74USHEFF 0.64 0.75
SHEFF-lite/sparse 0.64 0.75Baseline SVM 0.64 0.76
DCU-Chris/MIXED 0.69 0.98German-English
• RTM-DCU/RTM-RR 0.55 0.67• RTM-DCU/RTM-PLS-RR 0.57 0.74
USHEFF 0.63 0.76SHEFF-lite 0.65 0.77
Baseline SVM 0.65 0.78
Table 12: Official results for the scoring variant of the WMT14 Quality Evaluation Task 1.1. The winning submissionsare indicated by a •. These are the top-scoring submission and those that are not significantly worse according to bootstrapresampling (1M times) with 95% confidence intervals. The systems in the gray area are not different from the baseline systemat a statistically significant level according to the same test.
33

metric scores as primary key and the RMSE metricscores as secondary key.
The winning submissions for the scoring variantof Task 1.1 are as follows: for English-Spanish itis RTM-DCU/RTM-TREE with a MAE of 0.49;for Spanish-English it is RTM-DCU/RTM-FS-RR with a MAE of 0.53; for English-Germanit is again RTM-DCU/RTM-TREE, with a MAEof 0.58; and for German-English it is RTM-DCU/RTM-RR with a MAE of 0.55. These sub-missions are again much better than the baselinesystem, which under the scoring variant seemsto perform at a middle-of-the-pack level or lowercompared to the overall pool of submissions.Overall, more systems are able to outperform thebaseline according to the scoring metric.
The top system for most language pairs areessentially based on the same core techniques(RTM-DCU) according to both the DeltaAvg andMAE metrics. The ranking of other systems, how-ever, can be substantially different according to thetwo metrics.
Task 1.2 Predicting percentage of editsTable 13 summarises the results for the rankingvariant of Task 1.2. For readability purposes wehave used a multiplication-factor of 100 in thescoring script, which makes the HTER numbers(both predicted and gold) to be in the [0, 100]range. They are sorted from best to worst usingthe DeltaAvg metric scores as primary key and theSpearman’s rank correlation scores as secondarykey.
The winning submission for the ranking vari-ant of Task 1.2 is RTM-DCU/RTM-SVR, with aDeltaAvg score of 9.31. There is a large mar-gin between this score and the baseline score ofDeltaAvg 5.08, which indicates again that currentbest performance has reached levels that are muchbeyond what this baseline system can produce.The vast majority of the submissions perform bet-ter than the baseline (the only exception is the sub-mission from SHEFF-lite, for which the authorsreport a major issue with the learning algorithm).
The results for the scoring variant are presentedin Table 14, sorted from best to worst by using theMAE metric scores as primary key and the RMSEmetric scores as secondary key.
The winning submission for the scoring variantof Task 1.2 is FBK-UPV-UEDIN/WP with a MAEof 12.89, while the baseline system has a MAEof 15.23. Most of the submissions perform better
than the baseline.
Task 1.3 Predicting post-editing timeTable 15 summarises the results for the rankingvariant of Task 1.3. For readability purposes, wehave used a multiplication-factor of 0.001 in thescoring script, which makes the time (both pre-dicted and gold) to be measured in seconds. Theyare sorted from best to worst using the DeltaAvgmetric scores as primary key and the Spearman’srank correlation scores as secondary key.
The winning submission for the ranking vari-ant of Task 1.3 is RTM-DCU/RTM-RR, with aDeltaAvg score of 17.02 (when predicting sec-onds). The interesting aspect of these results isthat the DeltaAvg numbers have a direct real-world interpretation, in terms of time spent (orsaved, depending on one’s view-point) for post-editing machine-produced translations. A moreelaborate discussion on this point can be found inSection 4.5.
The winning submission for the scoring variantof Task 1.3 is RTM-DCU/RTM-SVR, with a MAEof 16.77. Note that all of the submissions performsignificantly better than the baseline, which has aMAE of 21.49, and that the majority is not signif-icantly worse than the top scoring submission.
Task 2 Predicting word-level editsThe results for Task 2 are summarised in Tables17–19. The results are ordered by F1 score forthe Error (BAD) class. For comparison, two triv-ial baselines are included, one that marks everyword as correct and that marks every word withthe most common error class found in the trainingdata. Both baselines are clearly useless for any ap-plication, but help put the results in perspective.Most teams submitted systems for a single lan-guage pair: English-Spanish; only a single teamproduced predictions for all four pairs.
Table 17 gives the results of the binary (OK vs.BAD) classification variant of Task 2. The win-ning submissions for this variant are as follows:for English-Spanish it is FBK-UPV-UEDIN/RNNwith a weighted F1 of 48.73; for Spanish-English it is RTM-DCU/RTM-GLMd with aweighted F1 of 29.14; for English-German it isRTM-DCU/RTM-GLM with a weighted F1 of45.30; and for German-English it is again RTM-DCU/RTM-GLM with a weighted F1 of 26.13.
Remarkably, for three out of four languagepairs, the systems fail to beat our trivial baseline of
34

System ID DeltaAvg Spearman CorrEnglish-Spanish• RTM-DCU/RTM-SVR 9.31 0.53• RTM-DCU/RTM-TREE 8.57 0.48
• USHEFF 7.93 0.45SHEFF-lite/sparse 7.69 0.43
Baseline 5.08 0.31SHEFF-lite 0.72 0.09
Table 13: Official results for the ranking variant of the WMT14 Quality Evaluation Task 1.2. The winning submissionsare indicated by a •. These are the top-scoring submission and those that are not significantly worse according to bootstrapresampling (100k times) with 95% confidence intervals. The systems in the gray area are not different from the baseline systemat a statistically significant level according to the same test.
System ID MAE RMSEEnglish-Spanish• FBK-UPV-UEDIN/WP 12.89 16.74• RTM-DCU/RTM-SVR 13.40 16.69
• USHEFF 13.61 17.84RTM-DCU/RTM-TREE 14.03 17.48
DFKI/SVR 14.32 17.74FBK-UPV-UEDIN/NOWP 14.38 18.10
SHEFF-lite/sparse 15.04 18.38MULTILIZER 15.04 20.86
Baseline 15.23 19.48DFKI/SVRxdata 16.01 19.52
SHEFF-lite 18.15 23.41
Table 14: Official results for the scoring variant of the WMT14 Quality Evaluation Task 1.2. The winning submissionsare indicated by a •. They are statistically indistinguishable from the top submission according to bootstrap resampling (1Mtimes) with 95% confidence intervals. The systems in the gray area are not different from the baseline system at a statisticallysignificant level according to the same test.
System ID DeltaAvg Spearman CorrEnglish-Spanish• RTM-DCU/RTM-RR 17.02 0.68• RTM-DCU/RTM-SVR 16.60 0.67
SHEFF-lite/sparse 16.33 0.63SHEFF-lite 16.08 0.64
USHEFF 14.98 0.59Baseline 14.71 0.57
Table 15: Official results for the ranking variant of the WMT14 Quality Evaluation Task 1.3. The winning submissionsare indicated by a •. They are statistically indistinguishable from the top submission according to bootstrap resampling (1Mtimes) with a 95% confidence interval. The systems in the gray area are not different from the baseline system at a statisticallysignificant level according to the same test.
35

System ID MAE RMSEEnglish-Spanish• RTM-DCU/RTM-SVR 16.77 26.17•MULTILIZER/MLZ2 17.07 25.83
• SHEFF-lite 17.13 27.33•MULTILIZER/MLZ1 17.31 25.51• SHEFF-lite/sparse 17.42 27.35
• FBK-UPV-UEDIN/WP 17.48 25.31RTM-DCU/RTM-RR 17.50 25.97
FBK-UPV-UEDIN/NOWP 18.69 26.58USHEFF 21.48 34.28Baseline 21.49 34.28
Table 16: Official results for the scoring variant of the WMT14 Quality Evaluation Task 1.3. The winning submissionsare indicated by a •. They are statistically indistinguishable from the top submission according to bootstrap resampling (1Mtimes) with a 95% confidence interval. The systems in the gray area are not different from the baseline system at a statisticallysignificant level according to the same test.
weighted F1 F1
System ID All Bad ↑ MCC ACCEnglish-Spanish
Baseline (always OK) 50.43 0.00 0.00 64.38Baseline (always Bad) 18.71 52.53 0.00 35.62
• FBK-UPV-UEDIN/RNN 62.00 48.73 18.23 61.62LIMSI/RF 60.55 47.32 15.44 60.09
LIG/FS 63.55 44.47 19.41 64.67LIG/BL ALL 63.77 44.11 19.91 65.12
FBK-UPV-UEDIN/RNN+tandem+crf 62.17 42.63 16.32 63.26RTM-DCU/RTM-GLM 60.68 35.08 13.45 63.74
RTM-DCU/RTM-GLMd 60.24 32.89 12.98 63.97Spanish-English
Baseline (always OK) 74.41 0.00 0.00 82.37Baseline (always Bad) 5.28 29.98 0.00 17.63
• RTM-DCU/RTM-GLMd 79.54 29.14 25.47 82.98RTM-DCU/RTM-GLM 79.42 26.91 25.93 83.43
English-GermanBaseline (always OK) 59.39 0.00 0.00 71.33Baseline (always Bad) 12.78 44.57 0.00 28.67
• RTM-DCU/RTM-GLM 71.51 45.30 28.61 72.97RTM-DCU/RTM-GLMd 68.73 36.91 21.32 71.41
German-EnglishBaseline (always OK) 67.82 0.00 0.00 77.60Baseline (always Bad) 8.20 36.60 0.00 22.40
• RTM-DCU/RTM-GLM 72.41 26.13 16.08 76.14RTM-DCU/RTM-GLMd 71.42 22.97 12.63 75.46
Table 17: Official results for the binary part of the WMT14 Quality Evaluation Task 2. The winning submissions are indicatedby a •. All values are given as percentages.
36

marking all the words as wrong. This may eitherindicate that the predictions themselves are of lowquality or the chosen evaluation approach is mis-leading. On the other hand F1 scores are a com-mon measure of binary classification performanceand no averaging is performed here.
Table 18 gives the results of the Level 1classification (OK, Fluency, Accuracy) variantof Task 2. Here the second baseline is toalways predict Fluency errors, as this is themost common error category in the trainingdata. The winning submissions of this vari-ant are as follows: for English-Spanish itis FBK-UPV-UEDIN/RNN+tandem+crf with aweighted F1 of 23.94 and for Spanish-English,English-German, and German-English it is RTM-DCU/RTM-GLMd with weighted F1 scores of23.94, 21.94, and 8.57 respectively.
As before, all systems fail to outperform thesingle-class baseline for the Spanish-English lan-guage pair according to our primary metric. How-ever, for Spanish-English and English-Germanboth submissions are able to beat the baseline bylarge margin. We also observe that the absolutenumbers vary greatly between language pairs.
Table 19 gives the results of the Multi-classclassification variant of Task 2. Again, the sec-ond baseline is to always predict the most commonerror category in the training data, which variesdepending on language pair and produces and in-creasingly weak baseline as the number of classesrises.
The winning submissions of this variant areas follows: for English-Spanish, Spanish-English,and English-German it is RTM-DCU/RTM-GLMwith weighted F1 scores of 26.84, 8.75, and 15.02respectively and and for German-English it isRTM-DCU/RTM-GLMd with a weighted F1 of3.08. Not only do these systems perform aboveour baselines for all but the German-English lan-guage pair, they also outperform all other sub-missions for English-Spanish. Remarkably, RTM-DCU/RTM-GLM wins English-Spanish for all ofthe proposed metrics by a sizeable margin.
4.5 Discussion
In what follows, we discuss the main accomplish-ments of this year’s shared task starting from thegoals we had previously identified for it.
Investigating the effectiveness of differentquality labels
For the sentence-level tasks, the results of thisyear’s shared task allow us to investigate the ef-fectiveness of predicting translation quality usingthree very different quality labels: perceived post-editing effort on a scale of [1-3] (Task 1.1); HTERscores (Task 1.2); and the time that a translatortakes to post-edit the translation (Task 1.3). One ofthe ways one can compare the effectiveness acrossall these different labels is to look at how wellthe models can produce predictions that correlatewith the gold label that we have at our disposal.A measure of correlation that does not dependon the value of the labels is Spearman’s rankingcorrelation. From this perspective, the label thatseems the most effective appears to be post-editingtime (Task 1.3), with the best system (RTM-DCU/RTM-RR) producing a Spearman’s ρ of 0.68(English-Spanish translations, see Table 15). Incomparison, when perceived post-editing effort la-bels are used (Task 1.1), the best systems achievea Spearman’s ρ of 0.38 and 0.30 for English-Spanish and Spanish-English translations, respec-tively, and ρ of 0.54 and 0.51 for English-Germanand German-English, respectively (Table 11); forHTER scores (Task 1.2) the best systems achievea Spearman’s ρ of 0.53 for English-Spanish trans-lations (Table 13).
This comparison across tasks seems to indicatethat, among the three labels we have proposed,post-editing time seems to be the most learnable,in the sense that automatic predictions can vestmatch the gold labels (in this case, with respectto the rankings they induce). A possible reasonfor this is that post-editing time correlates with thelength of the source sentence whereas HTER is anormalised measure.
Compared to the results regarding time predic-tion in the Quality Evaluation shared task from2013 (Bojar et al., 2013), we note that this timeall submissions were able to beat the baseline sys-tem (compared to only 1/3 of the submissions in2013). In addition, better handling of the dataacquisition reduced the number of outliers in thisyear’s dataset allowing for numbers that are morereliably interpretable. As an example of its in-terpretability, consider the following: the winningsubmission for the ranking variant of Task 1.3 isRTM-DCU/RTM-RR, with a a Spearman’s ρ of0.68 and a DeltaAvg score of 17.02 (when predict-
37
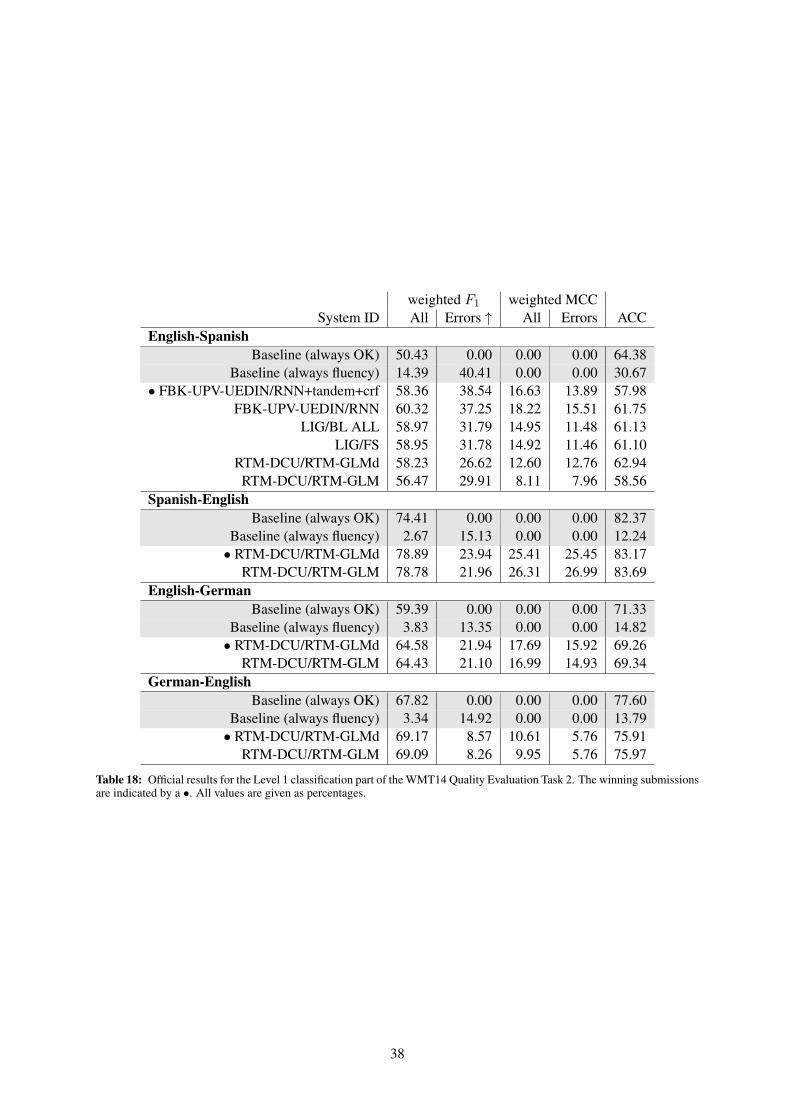
weighted F1 weighted MCCSystem ID All Errors ↑ All Errors ACC
English-SpanishBaseline (always OK) 50.43 0.00 0.00 0.00 64.38
Baseline (always fluency) 14.39 40.41 0.00 0.00 30.67• FBK-UPV-UEDIN/RNN+tandem+crf 58.36 38.54 16.63 13.89 57.98
FBK-UPV-UEDIN/RNN 60.32 37.25 18.22 15.51 61.75LIG/BL ALL 58.97 31.79 14.95 11.48 61.13
LIG/FS 58.95 31.78 14.92 11.46 61.10RTM-DCU/RTM-GLMd 58.23 26.62 12.60 12.76 62.94RTM-DCU/RTM-GLM 56.47 29.91 8.11 7.96 58.56
Spanish-EnglishBaseline (always OK) 74.41 0.00 0.00 0.00 82.37
Baseline (always fluency) 2.67 15.13 0.00 0.00 12.24• RTM-DCU/RTM-GLMd 78.89 23.94 25.41 25.45 83.17
RTM-DCU/RTM-GLM 78.78 21.96 26.31 26.99 83.69English-German
Baseline (always OK) 59.39 0.00 0.00 0.00 71.33Baseline (always fluency) 3.83 13.35 0.00 0.00 14.82• RTM-DCU/RTM-GLMd 64.58 21.94 17.69 15.92 69.26
RTM-DCU/RTM-GLM 64.43 21.10 16.99 14.93 69.34German-English
Baseline (always OK) 67.82 0.00 0.00 0.00 77.60Baseline (always fluency) 3.34 14.92 0.00 0.00 13.79• RTM-DCU/RTM-GLMd 69.17 8.57 10.61 5.76 75.91
RTM-DCU/RTM-GLM 69.09 8.26 9.95 5.76 75.97
Table 18: Official results for the Level 1 classification part of the WMT14 Quality Evaluation Task 2. The winning submissionsare indicated by a •. All values are given as percentages.
38
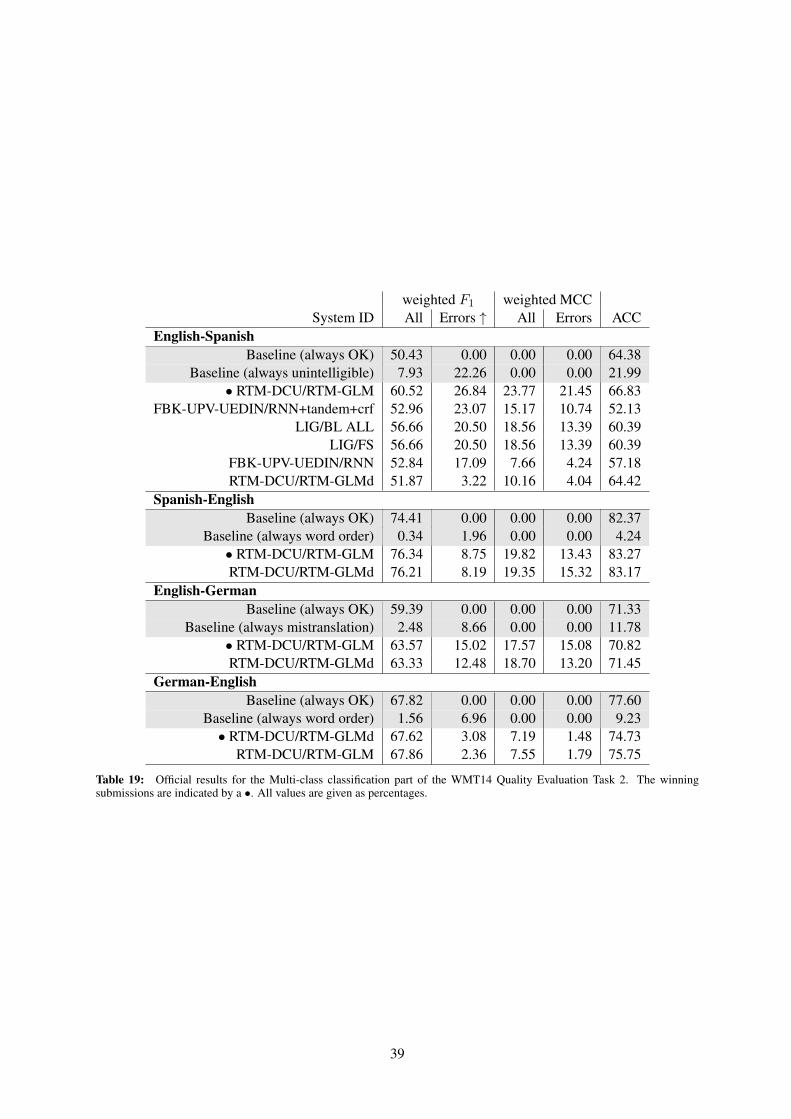
weighted F1 weighted MCCSystem ID All Errors ↑ All Errors ACC
English-SpanishBaseline (always OK) 50.43 0.00 0.00 0.00 64.38
Baseline (always unintelligible) 7.93 22.26 0.00 0.00 21.99• RTM-DCU/RTM-GLM 60.52 26.84 23.77 21.45 66.83
FBK-UPV-UEDIN/RNN+tandem+crf 52.96 23.07 15.17 10.74 52.13LIG/BL ALL 56.66 20.50 18.56 13.39 60.39
LIG/FS 56.66 20.50 18.56 13.39 60.39FBK-UPV-UEDIN/RNN 52.84 17.09 7.66 4.24 57.18RTM-DCU/RTM-GLMd 51.87 3.22 10.16 4.04 64.42
Spanish-EnglishBaseline (always OK) 74.41 0.00 0.00 0.00 82.37
Baseline (always word order) 0.34 1.96 0.00 0.00 4.24• RTM-DCU/RTM-GLM 76.34 8.75 19.82 13.43 83.27RTM-DCU/RTM-GLMd 76.21 8.19 19.35 15.32 83.17
English-GermanBaseline (always OK) 59.39 0.00 0.00 0.00 71.33
Baseline (always mistranslation) 2.48 8.66 0.00 0.00 11.78• RTM-DCU/RTM-GLM 63.57 15.02 17.57 15.08 70.82RTM-DCU/RTM-GLMd 63.33 12.48 18.70 13.20 71.45
German-EnglishBaseline (always OK) 67.82 0.00 0.00 0.00 77.60
Baseline (always word order) 1.56 6.96 0.00 0.00 9.23• RTM-DCU/RTM-GLMd 67.62 3.08 7.19 1.48 74.73
RTM-DCU/RTM-GLM 67.86 2.36 7.55 1.79 75.75
Table 19: Official results for the Multi-class classification part of the WMT14 Quality Evaluation Task 2. The winningsubmissions are indicated by a •. All values are given as percentages.
39
ing seconds). This number has a direct real-worldinterpretation: using the order proposed by thissystem, a human translator would spend, on av-erage, about 17 seconds less on a sentence takenfrom the top of the ranking compared to a sen-tence picked randomly from the set.14 To put thisnumber into perspective, for this dataset the av-erage time to complete a sentence post-editing is39 seconds. As such, one has an immediate inter-pretation for the usefulness of using such a rank-ing: translating around 100 sentences taken fromthe top of the rankings would take around 36min(at about 22 seconds/sentence), while translatingthe same number of sentences extracted randomlyfrom the same dataset would take around 1h5min(at about 39 seconds/sentence). It is in this sensethat we consider post-editing time an interpretablelabel.
Another desirable property of label predictionsis usefulness; this property, however, it highlytask-dependent and therefore cannot be judged inthe absence of a specific task. For instance, an in-terpretable label like post-editing time may not bethat useful in a task the requires one to place themachine translations into “ready to publish” and“not ready to publish” bins. For such an appli-cation, labels such as the ones used by Task 1.1are clearly more useful, and also very much inter-pretable within the scope of the task. Our attemptat presenting the Quality Prediction task with a va-riety of prediction labels illustrates a good rangeof properties for the proposed labels and enablesone to draw certain conclusions depending on theneeds of the specific task at hand.
For the word-level tasks, different quality labelsequate with using different levels of granularity forthe predictions, which we discuss next.
Exploring word-level quality prediction atdifferent levels of granularityPrevious work on word-level predictions, e.g. (Bo-jar et al., 2013) has focused on prediction of auto-matically derived labels, generally due to practicalconsiderations as the manual annotation is labourintensive. While easily applicable, automatic an-notations, using for example TER alignment be-tween the machine translation and reference (orpost-edition), face the same problems as automatic
14Note that the 17.02 seconds figure is a difference in real-time, not predicted time; what is considered in this variant ofTask 1.3 is only the predicted ranking of data points, not theabsolute values of the predictions.
MT evaluation metrics as they fail to account fordifferent word choices and lack the ability to re-liably distinguish meaning preserving reorderingsfrom those that change the semantics of the out-put. Furthermore, previous automatic annotationfor word-level quality estimation has focused onbinary labels: correct / incorrect, or at most, themain edit operations that can be captured by align-ment metrics like TER: correct, insertion, dele-tion, substitution.
In this year’s task we were able to providemanual fine-grained annotations at the word-levelproduced by humans irrespective of references orpost-editions. Error categories range from fre-quent ones, such as unintelligible, mistranslation,and terminology, to rare ones such as additions oromissions. For example, only 10 out of more than3,400 errors in the English-Spanish test set fallinto the latter categories, while over 2,000 wordsare marked as unintelligible. By hierarchicallygrouping errors into coarser categories we aimedto find a compromise between data sparsity andthe expressiveness of the labels. What marks agood compromise depends on the use case, whichwe do not specify here, and the quality of the finergrained predictions: if a system is able to predicteven rare errors these may be grouped later if nec-essary.
Overall, word-level error prediction seems to re-main a challenging task as evidenced by the factthat many submissions were unable to beat a triv-ial baseline. We hypothesise that this is at leastpartially due to a mismatch in loss-functions usedin training and testing. We know from the sys-tem descriptions that some systems were tuned tooptimise squared error or accuracy, while evalua-tion was performed using weighted F1 scores. Onthe other hand, even a comparison of just accuracyshows that systems struggle to obtain a lower errorrates than the “all-OK” baseline.
Such performance problems are consistent overthe three levels of granularity, contrary to the in-tuition that binary classification would be easier.A notable exception is the RTM-DCU/RTM-GLMsystem, which is able to beat both the baseline andall other systems on the Multi-Class variant of theEnglish-Spanish task – cf. Table 19 – with regardto all metrics. For this and most other submis-sions we observe that labels are not consistent fordifferent granularities, i.e. at token marked with aspecific error in the multi-class variant may still
40

carry an “OK” label in binary annotation. Thus,additional coarse grained annotations may be de-rived by automatic means. For example, mappingthe multi-class predictions of the above system tocoarser categories improves the F1,ERR score inTable 17 from 35.08 to 37.02 but does not changethe rank with respect to the other entries.
The fact that coarse grained predictions seemnot to be derived from the fine-grained ones leadsus to believe that most participants treated thedifferent granularities as independent classifica-tion tasks. The FBK-UPV-UEDIN team trans-fers information in the opposite direction by usingtheir binary predictions as features for Level-1 andmulti-class.
Given the current quality of word-level predic-tion it remains unclear if these systems can alreadybe employed in a practical setting, e.g. to focus theattention of post-editors.
Studying the effects of training and testdatasets with mixed domains, language pairsand MT systemsThis year’s shared task made available datasets formore than one language pair with the same or dif-ferent types of annotation, 2-3 multiple MT sys-tems (plus a human translation) per language pair,and out-of-domain test data (Tasks 1.1 and 2). In-stances for each language pair were kept in sep-arate datasets and thus the “language pair” vari-able can be analysed independently. However, fora given language pair, datasets mix translation sys-tems (and humans) in Task 1.1, and also text do-mains in Task 2.
Directly comparing the performance across lan-guage pairs is not possible, given that theirdatasets have different numbers of instances (pro-duced by 3 or 4 systems) and/or different truescore distributions (see Figure 3). For a relativecomparison (although not all systems submittedresults for all language pairs, which is especiallytrue in Task 2), we observe in Task 1.1 that for alllanguage pairs generally at least half of the sys-tems did better than the baseline. To our surprise,only one submission combined data for multiplelanguages together for Task 1.1: SHEF-lite, treat-ing each language pair data as a different task ina multi-task learning setting. However, only forthe ’sparse’ variant of the submission significantgains were reported over modelling each task in-dependently (with the tasks still sharing the samedata kernel and the same hyperparameters).
The interpretation of the results for Task 2 isvery dependent on the evaluation metric used,but generally speaking a large variation in per-formance was found between different languages,with English-Spanish performing the best, possi-bly given the much larger number of training in-stances. Data for Task 2 also presented varied truescore distributions (as shown by the performanceof the baseline (e.g. always “OK”) in Tables 17-19.
One of the main goals with Task 1.1 (and Task 2to some extent) was to test the robustness of mod-els in a blind setting where multiple MT systems(and human translations) are put together and theiridentifiers are now known. All submissions forthese tasks were therefore translation system ag-nostic, with no submission attempting to performmeta-identification of the origins of the transla-tions. For Task 1.1, data from multiple MT sys-tems was explicitly used by USHEFF though theidea of consensus translations. Translations fromall but the system of interest for the same sourcesegment were used as pseudo-references. Thesubmission significantly outperformed the base-line for all language pairs and did particularly wellfor Spanish-English and English-Spanish.
An in depth analysis of Task 1.1’s datasets onthe difference in prediction performance betweenmodels built and applied for individual transla-tion systems and models built and tested for alltranslations pooled together is presented in (Shahand Specia, 2014). Not surprisingly, the formermodels perform significantly better, with MAEscores ranging between 0.35 and 0.5 for differ-ent language pairs and MT systems, and signifi-cantly lower scores for models trained and testedon human translations only (MAE scores between0.2 and 0.35 for different language pairs), againstMAE scores ranging between 0.5 and 0.65 formodels with pooled data.
For Tasks 1.2 and 1.3, two submissions includedEnglish-Spanish data which had been produced byyet different MT systems (SHEF-lite and DFKI).While using these additional instances seemed at-tractive given the small number of instances avail-able for these tasks, it is not clear what their contri-bution was. For example, with a reduced set of in-stances (only 400) from the combined sets, SHEF-lite/sparse performed significantly better than itsvariant SHEF-lite.
Finally, with respect to out-of-domain (different
41

text domain and MT system) test data, for Task1.1, none of the papers submitted included experi-ments. (Shah and Specia, 2014) applied the mod-els trained on pooled datasets (as explained above)for each language pair to the out-of-domain testsets. The results were surprisingly positive, withaverage MAE score of 0.5, compared to the 0.5-0.65 range for in-domain data (see above). Furtheranalysis is necessary to understand the reasons forthat.
In Task 2, the official training and test sets al-ready include out-of-domain data because of thevery small amount of in-domain data available,and thus is is hard to isolate the effect of this dataon the results.
Examining the effectiveness of qualityprediction methods on human translationsDatasets for Tasks 1.1 and 2 contain human trans-lations, in addition to the automatic translationsfrom various MT systems. Predicting humantranslation quality is an area that has been largelyunexplored. Previous work has looked into dis-tinguishing human from machine translations (e.g.(Gamon et al., 2005)), but this problem setting issomehow artificial, and moreover arguably harderto solve nowadays given the higher general qual-ity of current MT systems (Shah and Specia,2014). Although human translations are obviouslyof higher quality in general, many segments aretranslated by MT systems with the same or similarlevels of quality as human translation. This is par-ticularly true for Task 2, since data had been pre-viously categorised and only “near misses” wereselected for the word-level annotation, i.e., humanand machine translations that were both nearlyperfect in this case.
While no distinction was made between humanand machine translations in our tasks, we believethe mix of these two types of translations has hada negative impact in prediction performance. Intu-itively, one can expect errors in human translationto be more subtle, and hence more difficult to cap-ture via standard quality estimation features. Forexample, an incorrect lexical choice (due to, e.g.,ambiguity) which still fits the context and does notmake the translation ungrammatical is unlikely tobe captured. We hoped that participants would de-sign features for this particular type of translation,but although linguistically motivated features havebeen exploited, they did not seem appropriate forhuman translations.
It is interesting to mention the indirect use ofhuman translations by USHEFF for Tasks 1.1-1.3:given a translation for a source segment, all othertranslations for the same segment were used aspseudo-references. Apart from when this transla-tion was actually the human translation, the hu-man translation was effectively used as a refer-ence. While this reference was mixed with 2-3 other pseudo-references (other machine transla-tions) for the feature computations, these featuresled to significant gains in performance over thebaseline features Scarton and Specia (2014).
We believe that more investigation is needed forhuman translation quality prediction. Tasks ded-icated to this type of data at both sentence- andword-level in the next editions of this shared taskwould be a possible starting point. The acquisi-tion of such data is however much more costly, asit is arguably hard to find examples of low qualityhuman translation, unless specific settings, such astranslation learner corpora, are considered.
5 Medical Translation Task
The Medical Translation Task addresses the prob-lem of domain-specific and genre-specific ma-chine translation. The task is split into two sub-tasks: summary translation, focused on transla-tion of sentences from summaries of medical ar-ticles, and query translation, focused on transla-tion of queries entered by users into medical infor-mation search engines.
In general, texts of specific domains and gen-res are characterized by the occurrence of specialvocabulary and syntactic constructions which arerare or even absent in traditional (general-domain)training data and therefore difficult for MT. Spe-cific training data (containing such vocabulary andsyntactic constructions) is usually scarce or notavailable at all. Medicine, however, is an exam-ple of a domain for which in-domain training data(both parallel and monolingual) is publicly avail-able in amounts which allow to train a completeSMT system or to adapt an existing one.
5.1 Task Description
In the Medical Translation Task, we provided linksto various medical-domain training resources andasked participants to use the data to train or adapttheir systems to translate unseen test sets for bothsubtasks between English and Czech (CS), Ger-man (DE), and French (FR), in both directions.
42

The summary translation test data is domain-specific, but otherwise can be considered as ordi-nary sentences. On the other hand, the query trans-lation test data is also specific for its genre (gen-eral style) – it contains short sequences of (moreor less) of independent terms rather than completeand grammatical sentences, the usual target of cur-rent MT systems.
Similarly to the standard Translation Task, theparticipants of the Medical Translation Task wereallowed to use only the provided resources in theconstrained task (in addition to data allowed inthe constrained standard Translation Task), butcould exploit any additional resources in the un-constrained task. The submissions were expectedwith true letter casing and detokenized. The trans-lation quality was measured using automatic eval-uation metrics, manual evaluation was not per-formed.
5.2 Test and Development Data
The test and development data sets for this taskwere provided by the EU FP7 project Khres-moi.15 This projects develops a multi-lingualmulti-modal search and access system for biomed-ical information and documents and its MT com-ponent allows users to use non-English queries tosearch in English documents and see summariesof retrieved documents in their preferred language(Czech, German, or French). The statistics of thedata sets are presented in Tables 20 and 21.
For the summary translation subtask, 1,000and 500 sentences were provided for test devel-opment purposes, respectively. The sentenceswere randomly sampled from automatically gen-erated summaries (extracts) of English documents(web pages) containing medical information rel-evant to 50 topics provided for the CLEF 2013eHealth Task 3.16 Out-of-domain and ungram-matical sentences were manually removed. Thesentences were then translated by medical expertsinto Czech, German and French, and the transla-tions were reviewed. Each sentence was providedwith the corresponding document ID and topic ID.The set also included a description for each of the50 topics. The data package (Khresmoi SummaryTranslation Test Data 1.1) is now available fromthe LINDAT/CLARIN repository17 and more de-
15http://khresmoi.eu/16https://sites.google.com/site/
shareclefehealth/17http://hdl.handle.net/11858/
tails can be found in Zdenka Uresova and Pecina(2014).
For the query translation subtask, the maintest set contains 1,000 queries for test and 508queries for development purposes. The originalEnglish queries were extracted at random fromreal user query logs provided by the Health on theNet foundation18 (queries by general public) andthe Trip database19 (queries by medical experts).Each query was translated into Czech, German,and French by medical experts and the transla-tions were reviewed. The data package (KhresmoiQuery Translation Test Data 1.0) is available fromthe LINDAT/CLARIN repository.20
An additional test set for the query translationsubtask was adopted from the CLEF 2013 eHealthTask 3 (Pecina et al., 2014). It contains 50 queriesconstructed from titles of the test topics (originallyin English) translated into Czech, German, andFrench by medical experts. The participants wereasked to translate the queries back to English andthe resulting translations were used in an informa-tion retrieval (IR) experiment for extrinsic evalua-tion.
5.3 Training Data
This section reviews the in-domain resourceswhich were allowed for the constrained MedicalTranslation Task in addition to resources for theconstrained standard Translation Task (see Section2). Most of the corpora are available for directdownload, others can be obtained upon registra-tion. The corpora usually employ their own, moreor less complex data format. To lower the entrybarrier, we provided a set of easy-to-use scripts toconvert the data to a plain text format suitable forMT training.
5.3.1 Parallel Training DataThe medical-domain parallel data includes the fol-lowing corpora (see Table 22 for statistics): TheEMEA corpus (Tiedemann, 2009) contains doc-uments from the European Medicines Agency,automatically processed and aligned on sentencelevel. It is available for many language pairs, in-cluding those relevant to this task. UMLS is amultilingual metathesaurus of health and biomed-
00-097C-0000-0023-866E-118http://www.hon.ch/19http://www.tripdatabase.com/20http://hdl.handle.net/11858/
00-097C-0000-0022-D9BF-5
43
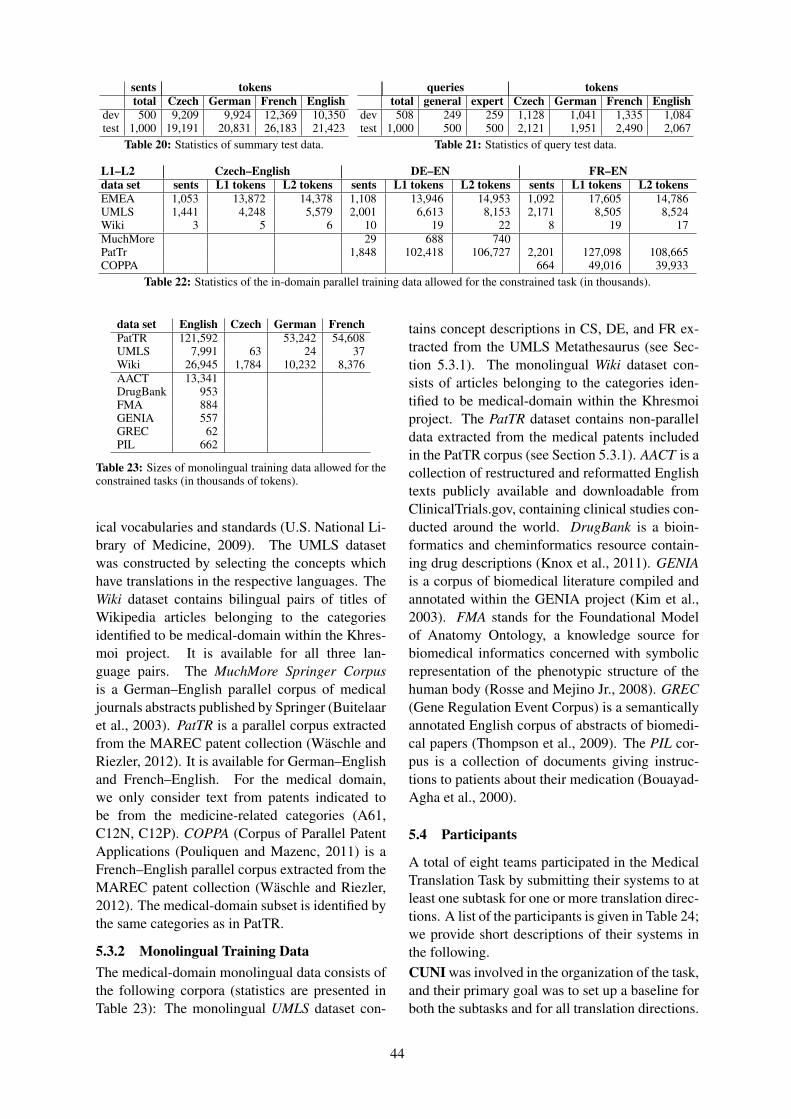
sents tokenstotal Czech German French English
dev 500 9,209 9,924 12,369 10,350test 1,000 19,191 20,831 26,183 21,423
Table 20: Statistics of summary test data.
queries tokenstotal general expert Czech German French English
dev 508 249 259 1,128 1,041 1,335 1,084test 1,000 500 500 2,121 1,951 2,490 2,067
Table 21: Statistics of query test data.
L1–L2 Czech–English DE–EN FR–ENdata set sents L1 tokens L2 tokens sents L1 tokens L2 tokens sents L1 tokens L2 tokensEMEA 1,053 13,872 14,378 1,108 13,946 14,953 1,092 17,605 14,786UMLS 1,441 4,248 5,579 2,001 6,613 8,153 2,171 8,505 8,524Wiki 3 5 6 10 19 22 8 19 17MuchMore 29 688 740PatTr 1,848 102,418 106,727 2,201 127,098 108,665COPPA 664 49,016 39,933
Table 22: Statistics of the in-domain parallel training data allowed for the constrained task (in thousands).
data set English Czech German FrenchPatTR 121,592 53,242 54,608UMLS 7,991 63 24 37Wiki 26,945 1,784 10,232 8,376AACT 13,341DrugBank 953FMA 884GENIA 557GREC 62PIL 662
Table 23: Sizes of monolingual training data allowed for theconstrained tasks (in thousands of tokens).
ical vocabularies and standards (U.S. National Li-brary of Medicine, 2009). The UMLS datasetwas constructed by selecting the concepts whichhave translations in the respective languages. TheWiki dataset contains bilingual pairs of titles ofWikipedia articles belonging to the categoriesidentified to be medical-domain within the Khres-moi project. It is available for all three lan-guage pairs. The MuchMore Springer Corpusis a German–English parallel corpus of medicaljournals abstracts published by Springer (Buitelaaret al., 2003). PatTR is a parallel corpus extractedfrom the MAREC patent collection (Waschle andRiezler, 2012). It is available for German–Englishand French–English. For the medical domain,we only consider text from patents indicated tobe from the medicine-related categories (A61,C12N, C12P). COPPA (Corpus of Parallel PatentApplications (Pouliquen and Mazenc, 2011) is aFrench–English parallel corpus extracted from theMAREC patent collection (Waschle and Riezler,2012). The medical-domain subset is identified bythe same categories as in PatTR.
5.3.2 Monolingual Training DataThe medical-domain monolingual data consists ofthe following corpora (statistics are presented inTable 23): The monolingual UMLS dataset con-
tains concept descriptions in CS, DE, and FR ex-tracted from the UMLS Metathesaurus (see Sec-tion 5.3.1). The monolingual Wiki dataset con-sists of articles belonging to the categories iden-tified to be medical-domain within the Khresmoiproject. The PatTR dataset contains non-paralleldata extracted from the medical patents includedin the PatTR corpus (see Section 5.3.1). AACT is acollection of restructured and reformatted Englishtexts publicly available and downloadable fromClinicalTrials.gov, containing clinical studies con-ducted around the world. DrugBank is a bioin-formatics and cheminformatics resource contain-ing drug descriptions (Knox et al., 2011). GENIAis a corpus of biomedical literature compiled andannotated within the GENIA project (Kim et al.,2003). FMA stands for the Foundational Modelof Anatomy Ontology, a knowledge source forbiomedical informatics concerned with symbolicrepresentation of the phenotypic structure of thehuman body (Rosse and Mejino Jr., 2008). GREC(Gene Regulation Event Corpus) is a semanticallyannotated English corpus of abstracts of biomedi-cal papers (Thompson et al., 2009). The PIL cor-pus is a collection of documents giving instruc-tions to patients about their medication (Bouayad-Agha et al., 2000).
5.4 Participants
A total of eight teams participated in the MedicalTranslation Task by submitting their systems to atleast one subtask for one or more translation direc-tions. A list of the participants is given in Table 24;we provide short descriptions of their systems inthe following.CUNI was involved in the organization of the task,and their primary goal was to set up a baseline forboth the subtasks and for all translation directions.
44
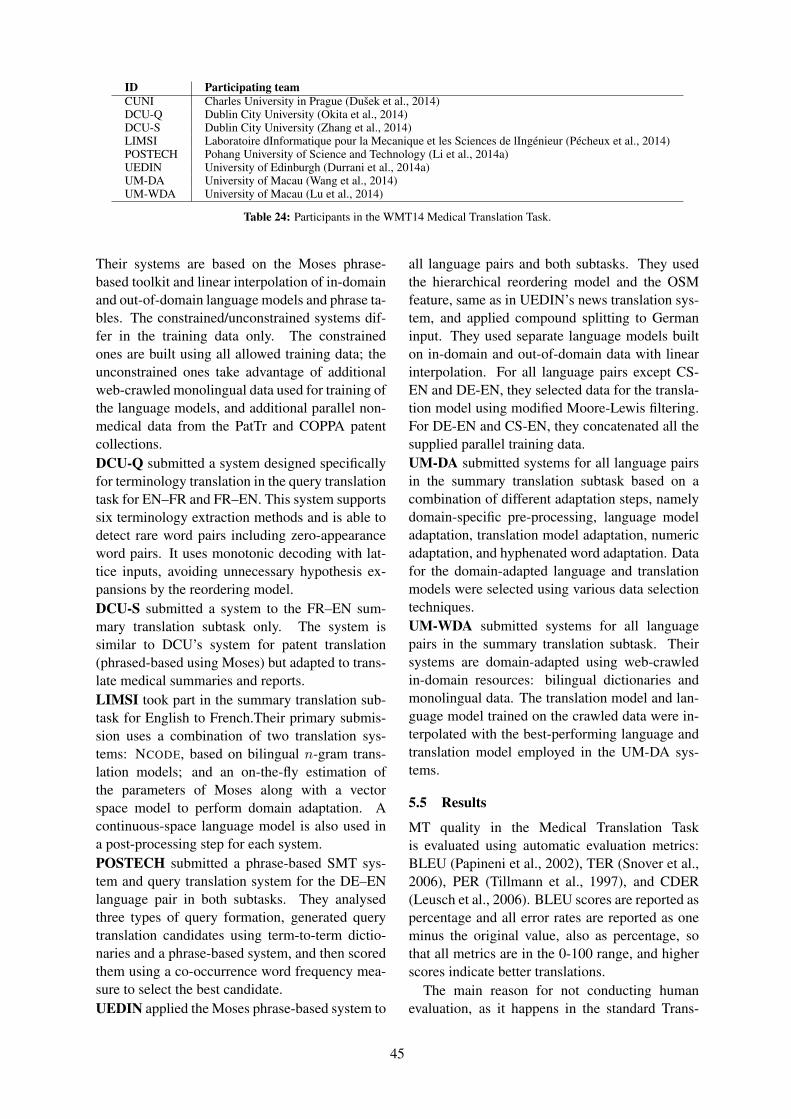
ID Participating teamCUNI Charles University in Prague (Dusek et al., 2014)DCU-Q Dublin City University (Okita et al., 2014)DCU-S Dublin City University (Zhang et al., 2014)LIMSI Laboratoire dInformatique pour la Mecanique et les Sciences de lIngenieur (Pecheux et al., 2014)POSTECH Pohang University of Science and Technology (Li et al., 2014a)UEDIN University of Edinburgh (Durrani et al., 2014a)UM-DA University of Macau (Wang et al., 2014)UM-WDA University of Macau (Lu et al., 2014)
Table 24: Participants in the WMT14 Medical Translation Task.
Their systems are based on the Moses phrase-based toolkit and linear interpolation of in-domainand out-of-domain language models and phrase ta-bles. The constrained/unconstrained systems dif-fer in the training data only. The constrainedones are built using all allowed training data; theunconstrained ones take advantage of additionalweb-crawled monolingual data used for training ofthe language models, and additional parallel non-medical data from the PatTr and COPPA patentcollections.DCU-Q submitted a system designed specificallyfor terminology translation in the query translationtask for EN–FR and FR–EN. This system supportssix terminology extraction methods and is able todetect rare word pairs including zero-appearanceword pairs. It uses monotonic decoding with lat-tice inputs, avoiding unnecessary hypothesis ex-pansions by the reordering model.DCU-S submitted a system to the FR–EN sum-mary translation subtask only. The system issimilar to DCU’s system for patent translation(phrased-based using Moses) but adapted to trans-late medical summaries and reports.LIMSI took part in the summary translation sub-task for English to French.Their primary submis-sion uses a combination of two translation sys-tems: NCODE, based on bilingual n-gram trans-lation models; and an on-the-fly estimation ofthe parameters of Moses along with a vectorspace model to perform domain adaptation. Acontinuous-space language model is also used ina post-processing step for each system.POSTECH submitted a phrase-based SMT sys-tem and query translation system for the DE–ENlanguage pair in both subtasks. They analysedthree types of query formation, generated querytranslation candidates using term-to-term dictio-naries and a phrase-based system, and then scoredthem using a co-occurrence word frequency mea-sure to select the best candidate.UEDIN applied the Moses phrase-based system to
all language pairs and both subtasks. They usedthe hierarchical reordering model and the OSMfeature, same as in UEDIN’s news translation sys-tem, and applied compound splitting to Germaninput. They used separate language models builton in-domain and out-of-domain data with linearinterpolation. For all language pairs except CS-EN and DE-EN, they selected data for the transla-tion model using modified Moore-Lewis filtering.For DE-EN and CS-EN, they concatenated all thesupplied parallel training data.UM-DA submitted systems for all language pairsin the summary translation subtask based on acombination of different adaptation steps, namelydomain-specific pre-processing, language modeladaptation, translation model adaptation, numericadaptation, and hyphenated word adaptation. Datafor the domain-adapted language and translationmodels were selected using various data selectiontechniques.UM-WDA submitted systems for all languagepairs in the summary translation subtask. Theirsystems are domain-adapted using web-crawledin-domain resources: bilingual dictionaries andmonolingual data. The translation model and lan-guage model trained on the crawled data were in-terpolated with the best-performing language andtranslation model employed in the UM-DA sys-tems.
5.5 Results
MT quality in the Medical Translation Taskis evaluated using automatic evaluation metrics:BLEU (Papineni et al., 2002), TER (Snover et al.,2006), PER (Tillmann et al., 1997), and CDER(Leusch et al., 2006). BLEU scores are reported aspercentage and all error rates are reported as oneminus the original value, also as percentage, sothat all metrics are in the 0-100 range, and higherscores indicate better translations.
The main reason for not conducting humanevaluation, as it happens in the standard Trans-
45

original normalized truecased normalized lowercasedID BLEU BLEU 1-TER 1-PER 1-CDER BLEU 1-TER 1-PER 1-CDER
Czech→EnglishCUNI 29.64 29.79±1.07 47.45±1.15 61.64±1.06 52.18±0.98 31.68±1.14 49.84±1.10 64.38±1.06 54.10±0.96CUNI 22.44 22.57±0.95 41.43±1.16 55.46±1.09 46.42±0.96 32.34±1.12 50.24±1.20 65.07±1.10 54.42±0.96
UEDIN 36.65 36.87±1.23 54.35±1.19 67.16±1.00 57.61±1.01 38.02±1.24 56.14±1.17 69.24±1.01 58.96±0.96UM-DA 37.62 37.79±1.26 54.55±1.20 68.29±0.88 57.28±1.03 38.81±1.28 56.04±1.20 70.06±0.82 58.45±1.05
CUNI 22.92 23.06±0.97 42.49±1.10 56.10±1.12 47.13±0.95 33.18±1.15 51.48±1.15 66.00±1.03 55.30±0.96CUNI 22.69 22.84±0.98 42.21±1.14 56.01±1.11 46.79±0.94 32.84±1.13 51.10±1.11 65.79±1.07 54.81±0.96
UM-WDA 37.35 37.53±1.26 54.39±1.19 68.21±0.83 57.16±1.07 38.61±1.27 55.92±1.17 70.02±0.81 58.36±1.07ONLINE 39.57±1.21 58.24±1.14 70.16±0.78 60.04±1.02 40.62±1.23 59.72±1.11 71.94±0.74 61.26±1.01
German→EnglishCUNI 28.20 28.34±1.12 46.66±1.13 61.53±1.03 50.57±0.93 30.69±1.19 48.91±1.16 64.12±1.04 52.52±0.95CUNI 28.85 28.99±1.15 47.12±1.15 61.98±1.07 50.72±0.98 31.37±1.21 49.29±1.13 64.53±1.05 52.64±0.98
POSTECH 25.92 25.99±1.06 43.66±1.14 59.62±0.92 47.13±0.90 26.97±1.06 45.13±1.12 61.53±0.89 48.37±0.88UEDIN 37.31 37.53±1.19 55.72±1.14 68.82±0.99 58.35±0.95 38.60±1.25 57.18±1.12 70.46±0.98 59.53±0.94UM-DA 35.71 35.81±1.23 53.08±1.16 66.82±0.98 55.91±0.96 36.55±1.27 54.01±1.13 68.05±0.97 56.78±0.95
CUNI 30.58 30.71±1.10 48.68±1.09 63.19±1.08 52.72±0.94 33.14±1.19 50.98±1.06 65.88±1.04 54.74±0.94CUNI 30.22 30.32±1.12 47.71±1.18 62.20±1.10 52.17±0.91 32.75±1.20 50.00±1.14 64.87±1.06 54.19±0.92
UM-WDA 32.70 32.88±1.19 49.60±1.18 63.74±1.01 53.50±0.96 33.95±1.23 51.05±1.19 65.54±0.98 54.73±0.96ONLINE 41.18±1.24 59.33±1.09 70.95±0.92 61.92±1.01 42.29±1.23 60.76±1.08 72.51±0.88 63.06±0.96
French→EnglishCUNI 34.42 34.55±1.20 52.24±1.17 64.52±1.03 56.48±0.91 36.52±1.23 54.35±1.12 67.07±1.00 58.34±0.91CUNI 33.67 33.59±1.16 50.39±1.23 61.75±1.16 56.74±0.97 35.55±1.21 52.55±1.26 64.45±1.13 58.63±0.91
DCU-B 44.85 45.01±1.24 62.57±1.12 74.11±0.78 64.33±0.99 46.12±1.26 64.04±1.06 75.84±0.74 65.55±0.94UEDIN 46.44 46.68±1.26 64.12±1.16 74.47±0.87 66.40±0.96 48.01±1.29 65.70±1.15 76.30±0.86 67.76±0.91UM-DA 47.08 47.22±1.33 64.08±1.16 75.41±0.88 66.15±0.96 48.23±1.31 65.36±1.10 76.95±0.89 67.18±0.93
CUNI 34.74 34.89±1.12 52.39±1.16 63.76±1.09 57.29±0.94 36.84±1.17 54.56±1.13 66.43±1.07 59.14±0.90CUNI 35.04 34.99±1.18 52.11±1.24 63.24±1.09 57.51±0.97 37.04±1.18 54.38±1.17 66.02±1.05 59.55±0.93
UM-WDA 43.84 44.06±1.32 61.14±1.18 73.13±0.87 63.09±1.00 45.17±1.36 62.63±1.15 74.94±0.84 64.37±0.99ONLINE 46.99±1.35 64.31±1.12 76.07±0.78 66.09±1.00 47.99±1.33 65.65±1.07 77.65±0.75 67.20±0.96
English→CzechCUNI 17.36 17.65±0.96 37.17±1.02 49.13±0.98 40.31±0.95 18.75±0.96 38.32±1.02 50.82±0.91 41.39±0.94CUNI 16.64 16.89±0.93 36.57±1.05 48.79±0.98 39.46±0.90 17.94±0.96 37.74±1.03 50.50±0.97 40.59±0.91
UEDIN 23.45 23.74±1.00 44.20±1.10 55.38±0.88 46.23±0.99 24.20±1.00 44.92±1.08 56.38±0.90 46.78±1.00UM-DA 22.61 22.72±0.98 42.73±1.16 54.12±0.93 44.73±1.01 23.12±1.01 43.41±1.14 55.11±0.93 45.32±1.02
CUNI 20.56 20.84±1.01 39.98±1.09 51.98±0.99 42.86±1.00 22.03±1.05 41.19±1.08 53.66±0.97 43.93±1.01CUNI 19.50 19.72±0.97 38.09±1.10 50.12±1.06 41.50±0.96 20.91±1.02 39.26±1.12 51.79±1.04 42.59±0.96
UM-WDA 22.14 22.33±0.96 42.30±1.11 53.89±0.92 44.48±1.01 22.72±0.97 43.02±1.09 54.89±0.95 45.08±0.99ONLINE 33.45±1.28 51.64±1.28 61.82±1.10 53.97±1.18 34.02±1.31 52.35±1.22 62.84±1.08 54.52±1.18
English→GermanCUNI 12.52 12.64±0.77 29.84±0.99 45.38±1.14 34.69±0.81 16.63±0.91 33.63±1.07 50.03±1.24 38.43±0.87CUNI 12.42 12.53±0.77 29.02±1.05 44.27±1.16 34.62±0.78 16.41±0.91 32.87±1.08 48.99±1.21 38.37±0.86
POSTECH 15.46 15.59±0.91 34.41±1.01 49.00±0.83 37.11±0.90 15.98±0.92 34.98±1.00 49.94±0.81 37.60±0.87UEDIN 20.88 21.01±1.03 40.03±1.08 55.54±0.91 42.95±0.90 21.40±1.03 40.55±1.08 56.33±0.92 43.41±0.90UM-DA 20.89 21.09±1.07 40.76±1.03 55.45±0.89 43.02±0.93 21.52±1.08 41.31±1.01 56.38±0.90 43.58±0.91
CUNI 14.29 14.42±0.81 31.82±1.03 47.01±1.13 36.81±0.79 18.87±0.90 35.76±1.11 51.76±1.17 40.65±0.87CUNI 13.44 13.58±0.75 30.37±1.03 45.80±1.14 35.80±0.76 17.84±0.89 34.41±1.13 50.75±1.18 39.85±0.78
UM-WDA 18.77 18.91±1.00 37.92±1.02 53.59±0.85 40.90±0.86 19.30±1.02 38.42±1.01 54.40±0.85 41.34±0.86ONLINE 23.92±1.06 44.33±0.97 57.47±0.80 46.35±0.91 24.29±1.07 44.83±0.98 58.20±0.80 46.71±0.92
English→FrenchCUNI 30.30 30.67±1.11 46.59±1.09 59.83±1.04 50.51±0.93 32.06±1.12 48.01±1.09 61.66±1.00 51.83±0.94CUNI 29.35 29.71±1.10 45.84±1.07 58.81±1.04 50.00±0.96 31.02±1.10 47.24±1.09 60.57±1.02 51.31±0.94
LIMSI 40.14 43.54±1.22 59.70±1.04 69.45±0.86 61.35±0.96 44.04±1.22 60.32±1.03 70.20±0.85 61.90±0.94LIMSI 38.83 42.21±1.13 58.88±1.01 68.70±0.81 60.59±0.93 42.69±1.12 59.53±0.98 69.50±0.80 61.17±0.91
UEDIN 40.74 44.24±1.16 60.66±1.07 70.35±0.82 62.28±0.95 44.85±1.17 61.43±1.05 71.27±0.81 62.94±0.91UM-DA 41.24 41.68±1.12 58.72±1.06 69.37±0.78 60.12±0.95 42.16±1.11 59.39±1.05 70.21±0.77 60.71±0.92
CUNI 32.23 32.61±1.09 48.48±1.08 61.13±1.01 52.24±0.93 34.08±1.10 49.93±1.11 62.92±0.99 53.65±0.92CUNI 32.45 32.84±1.06 48.68±1.06 61.32±0.98 52.35±0.94 34.22±1.07 50.09±1.04 63.04±0.96 53.67±0.91
UM-WDA 40.78 41.16±1.13 58.20±0.99 68.93±0.84 59.64±0.94 41.79±1.12 59.10±0.96 70.01±0.84 60.39±0.91ONLINE 58.63±1.26 70.70±1.12 78.22±0.81 71.89±0.96 59.27±1.26 71.50±1.10 79.16±0.81 72.63±0.94
Table 25: Official results of translation quality evaluation in the medical summary translation subtask.
46

original normalized truecased normalized lowercasedID BLEU BLEU 1-TER 1-PER 1-CDER BLEU 1-TER 1-PER 1-CDER
Czech→EnglishCUNI 10.71 10.57±3.42 15.72±2.77 23.37±3.03 18.68±2.42 30.13±4.85 53.38±3.01 62.53±2.84 55.44±2.87CUNI 9.92 9.78±3.04 16.84±2.84 23.80±3.08 19.85±2.40 28.21±4.56 54.15±3.04 62.56±2.99 55.91±2.79
UEDIN 24.66 24.68±4.52 39.88±3.05 49.97±3.29 41.81±2.80 28.25±4.94 45.31±3.14 55.66±3.06 46.67±2.77CUNI 12.00 11.86±3.42 18.49±2.74 24.67±2.85 21.08±2.29 31.91±4.81 57.61±3.13 65.02±2.99 59.24±2.69CUNI 10.54 10.39±3.48 18.86±2.48 26.65±2.05 20.53±2.08 32.39±5.45 56.79±3.02 65.52±2.26 57.96±2.56
ONLINE 28.88±4.96 47.31±3.35 55.19±3.21 49.88±2.89 35.33±5.20 55.80±3.20 64.05±2.97 57.94±2.85German→English
CUNI 10.90 10.74±3.41 18.89±2.39 26.09±2.00 20.29±2.07 32.15±5.23 55.56±2.90 63.68±2.34 56.45±2.62CUNI 10.71 10.55±3.47 18.40±2.35 25.45±2.04 19.84±2.07 32.06±5.19 54.85±2.91 62.87±2.39 55.52±2.61
POSTECH 18.06 17.97±4.38 28.57±3.30 40.38±2.77 31.79±2.80 21.99±4.65 35.76±3.35 47.84±2.82 38.84±2.92POSTECH 17.99 17.88±4.72 29.79±3.04 41.15±2.48 32.49±2.63 24.41±4.83 41.72±3.19 53.33±2.55 44.06±2.88
UEDIN 23.33 23.39±4.37 38.55±3.65 48.21±3.43 40.75±3.05 27.17±4.63 43.87±3.52 53.76±3.48 45.72±3.03CUNI 10.54 10.39±3.48 18.86±2.48 26.65±2.05 20.53±2.08 32.39±5.45 56.79±3.02 65.52±2.26 57.96±2.56CUNI 8.75 8.49±3.60 19.10±2.27 24.98±1.95 19.95±2.02 30.00±5.59 56.07±2.92 62.92±2.32 56.27±2.56
ONLINE 19.97±4.46 37.03±3.26 43.91±3.22 40.95±2.93 33.86±4.87 53.28±3.28 60.86±3.22 56.33±2.98French→English
CUNI 13.90 13.79±3.61 18.49±2.55 28.35±2.81 20.36±2.20 34.97±5.34 59.54±2.94 72.30±2.63 58.86±2.76CUNI 12.10 11.95±3.41 17.23±2.57 27.12±2.88 19.15±2.28 33.74±5.01 58.95±2.96 71.25±2.76 58.20±2.81
DCU-Q 30.85 31.24±5.08 58.88±2.97 67.94±2.62 59.19±2.62 36.88±5.07 66.38±2.85 75.86±2.37 66.29±2.55DCU-Q 26.51 26.16±4.40 48.02±3.72 57.34±3.24 53.56±2.79 28.61±4.52 53.65±3.73 63.51±3.21 59.07±2.79UEDIN 27.20 27.60±3.98 38.54±3.22 48.81±3.26 39.77±2.95 32.23±4.27 43.66±3.20 54.31±3.17 44.53±2.79
CUNI 14.03 14.00±3.30 20.11±2.38 29.00±2.71 21.62±2.22 38.98±5.08 62.90±2.87 74.49±2.45 62.12±2.64CUNI 13.38 13.16±3.52 17.79±2.56 28.84±2.81 19.17±2.23 35.00±5.20 59.52±2.98 73.08±2.57 58.41±2.68
ONLINE 32.96±5.04 53.68±3.21 64.27±2.80 54.40±2.66 38.09±5.52 61.44±3.08 72.59±2.61 61.60±2.78English→Czech
CUNI 8.37 8.00±3.65 17.74±2.23 26.46±1.96 19.48±2.10 19.49±4.60 41.53±2.94 51.34±2.51 42.54±2.74CUNI 9.04 8.75±3.64 18.25±2.27 26.97±1.92 19.69±2.11 21.46±5.05 42.36±3.09 51.99±2.40 43.18±2.68
UEDIN 12.57 12.40±3.61 21.15±2.96 33.56±2.80 22.30±2.67 14.06±3.80 24.92±2.90 37.85±2.72 25.58±2.70UEDIN 6.64 6.21±4.73 -2.35±3.06 5.95±3.48 -0.97±3.12 14.35±3.52 14.51±3.19 24.96±3.50 15.11±3.10
CUNI 9.06 8.64±3.82 19.92±2.24 26.97±1.94 20.82±2.06 22.42±5.24 44.89±2.94 52.89±2.40 45.36±2.78CUNI 8.49 8.01±6.05 18.13±2.28 25.19±1.86 19.19±2.01 21.04±4.80 42.66±2.87 50.34±2.47 43.30±2.74
ONLINE 21.09±4.60 48.56±2.82 54.72±2.51 48.30±2.83 24.37±4.80 51.93±2.74 58.10±2.50 51.62±2.80English→German
CUNI 10.17 10.01±3.92 26.48±3.24 36.71±3.37 29.26±2.96 13.02±4.17 31.96±3.41 42.39±3.21 34.61±2.95CUNI 9.98 9.69±3.94 26.16±3.19 35.50±3.23 28.86±2.94 12.90±4.28 31.75±3.33 41.24±3.21 34.38±3.05
POSTECH 13.43 13.01±5.91 26.38±3.09 35.75±3.16 27.86±2.82 15.05±5.71 30.45±3.10 39.89±3.14 31.79±3.00POSTECH 13.41 13.15±5.21 22.18±3.09 30.89±3.31 24.17±3.06 14.96±5.15 26.13±3.19 34.92±3.40 27.98±3.12
UEDIN 10.45 10.14±3.86 23.44±3.43 34.55±3.34 25.46±3.17 11.91±4.42 27.91±3.45 39.08±3.42 29.63±3.31CUNI 8.91 7.72±6.48 30.05±3.22 40.65±2.71 31.91±2.88 13.66±5.37 35.51±3.28 46.12±2.74 37.27±3.01CUNI 9.14 8.69±6.44 27.66±3.31 37.95±3.45 31.00±2.82 14.03±5.92 33.53±3.45 44.03±3.53 36.73±3.00
ONLINE 20.07±6.06 41.07±3.23 47.41±2.86 41.61±3.02 21.67±6.23 43.78±3.23 50.18±2.95 44.26±3.06English→French
CUNI 13.12 12.92±2.84 21.95±2.41 33.19±2.09 23.70±2.24 28.42±3.98 51.43±2.90 63.74±2.35 52.64±2.58CUNI 12.80 12.65±2.81 19.16±2.61 31.61±2.21 21.91±2.32 27.52±4.05 47.47±3.08 61.43±2.37 49.82±2.72
DCU-Q 27.69 27.84±4.11 48.97±3.06 60.90±2.55 51.84±2.83 28.98±4.16 51.73±3.10 63.84±2.47 54.43±2.76UEDIN 20.16 21.76±3.42 31.66±4.23 44.37±4.13 44.29±2.73 23.25±3.49 35.38±4.19 48.52±4.07 47.94±2.75
CUNI 13.78 13.57±3.00 21.92±2.51 33.47±2.03 24.16±2.32 30.07±4.10 51.12±3.08 63.61±2.45 52.96±2.67CUNI 15.27 15.24±3.12 23.58±2.54 34.39±2.54 25.79±2.32 31.40±4.15 53.60±2.96 65.39±2.57 55.47±2.69
ONLINE 28.93±3.66 49.20±3.08 60.85±2.69 51.68±2.78 30.88±3.66 52.25±3.08 64.06±2.62 54.59±2.68Table 26: Official results of translation quality evaluation in the medical query translation subtask.
source lang. ID P@5 P@10 NDCG@5 NDCG@10 MAP Rprec bpref relCzech→English CUNI 0.3280 0.3340 0.2873 0.2936 0.2217 0.2362 0.3473 1461German→English CUNI 0.2800 0.3000 0.2467 0.2630 0.2057 0.2077 0.3310 1426French→English CUNI 0.3280 0.3380 0.2811 0.2882 0.2206 0.2284 0.3504 1481
DCU-Q 0.3480 0.3460 0.3060 0.3072 0.2252 0.2358 0.3659 1524UEDIN 0.4440 0.4300 0.3793 0.3826 0.2843 0.2935 0.3936 1544
English (monolingual) 0.4600 0.4700 0.4091 0.4205 0.3035 0.3198 0.3858 1638Table 27: Official results of retrieval evaluation in the query translation subtask.
47

lation Task, was the lack of domain expertise ofprospective raters. While in the standard task, theonly requirement for the raters was to be a na-tive speaker of the target language, in the Med-ical Translation Task, a very good knowledge ofthe domain would be necessary to provide reli-able judgements and the raters with such an ex-pertise (medical doctors and native speakers) werenot available.
The complete results of the task are presentedin Table 25 (for summary translation) and Ta-bles 26 and 27 (for query translation). Partici-pant IDs given in bold indicate primary submis-sions, IDs in normal font refer to contrastive sub-missions. The first section for each translation di-rection (white background) refers to constrainedsubmissions and the second one (light-gray back-ground) to unconstrained submissions. The col-umn denoted as “original” contains BLEU scoresas reported by the Matrix submission system ob-tained on the original submitted translations. Dueto punctuation inconsistency in the original refer-ence translations, we decided to perform punctu-ation normalization before calculating the officialscores. The columns denoted as “normalized true-cased” contain scores obtained on the submittedtranslations after punctuation normalization andthe columns denoted as “normalized lowercased”contain scores obtained after punctuation normal-ization and lowercasing. The normalization scriptis available in the package with summary transla-tion test data. The confidence intervals were ob-tained by bootstrap resampling with a confidencelevel of 95%. Figures in bold denote the best con-strained system and, if its score is higher, the bestunconstrained system for each translation direc-tion and each metric. For comparison, we alsopresent results of a major on-line translation sys-tem (denoted as ONLINE).
The results of the extrinsic evaluation of querytranslation submissions are given in 27. We usedthe CLEF 2013 eHealth Task 3 test collection con-taining about 1 million web pages (in English),50 test queries (originally in English and trans-lated to Czech, German, and French), and theirrelevance assessments. Some of the participantsof the WMT Medical Task (three teams with fivesubmissions in total) submitted translations of thequeries (from Czech, German, and French) intoEnglish and these translations were used to querythe CLEF 2013 eHealth Task 3 test collection us-
ing a state-of-the-art system based on a BM25model, described in Pecina et al. (2014). Origi-nally, we asked for 10 best translations for eachquery, but only the best one were used for theevaluation. The results are provided in terms ofstandard IR evaluation measures: precision at acut-off of 5 and 10 documents (P@5, P@10),normalized discounted cumulative gain (Jarvelinand Kekalainen, 2002) at 5 and 10 documents(NDCG@5, NDCG@10), mean average precision(MAP) (Voorhees and Harman, 2005), precisionreached after R documents retrieved, where R in-dicates the number of the relevant documents foreach query in the entire collection (Rprec), binarypreference (bpref) (Buckley and Voorhees, 2004),and number or relevant documents retrieved (rel).The cross-lingual results are also compared withthe monolingual one (obtained by using the refer-ence (English) translations of the test topics) to seehow the system would perform if the queries weretranslated perfectly.
5.6 Discussion and Conclusion
Both the subtasks turned out to be quite challeng-ing not only because of the specific domain – insummary sentences, we can observe much higherdensity of terminology than in ordinary sentences;the queries, which are also rich in terminology, donot form sentences at all.
Most submissions were based on systems par-ticipating in the standard Translation Task andtrained on the provided data or its subsets CUNIprovided baseline systems for all language pairs inboth subtasks, which turned to be relatively strongfor the query translation task, especially in trans-lation to English, but only in terms of scores ob-tained on normalized and lowercased translationssince their truecasing component did not performwell.
In the summary translation subtask, the bestoverall results were achieved by the UEDIN teamwhich won for DE–EN, EN–CS, and EN–FR, fol-lowed by the UM-DA team, which performed onpar with UEDIN in all other translation.
The unconstrained submissions in almost allcases did not outperform the results of the con-strained submissions. Some improvements wereobserved in the query translations subtasks by theCUNI’s unconstrained system with language mod-els trained on larger in-domain data.
The ONLINE system outperforms all other sub-
48

missions with only two exceptions – the UM-DA’sand UEDIN’s systems for the summary translationin the FR–EN direction, though the score differ-ences are within the 95% confidence interval.
In the query translation subtask, DCU-Q builta system designed specifically for terminologytranslation between French and English and out-performed all other participants in translation intoEnglish; however, the confidence intervals in thequery translation task are much wider and most ofthe differences in scores of the automatic metricsare not statistically significant.
The extrinsic evaluation in the cross-lingual in-formation retrieval was conducted for translationsinto English only. CUNI provided the baselinesfor all directions, but other submissions were donefor FR–EN only. Here, the winner is UEDIN, whooutperformed both CUNI and DCU-Q, and theirscores are very close to those obtained using thereference English translations.
Acknowledgments
This work was supported in parts by theMosesCore, Casmacat, Khresmoi, Matecat andQTLaunchPad projects funded by the EuropeanCommission (7th Framework Programme), and bygifts from Yandex.
We would also like to thank our colleagues Ma-tous Machacek and Martin Popel for detailed dis-cussions.
References
Avramidis, E. (2014). Efforts on machine learningover human-mediated translation edit rate. InProceedings of the Ninth Workshop on Statisti-cal Machine Translation, Baltimore, Maryland,USA. Association for Computational Linguis-tics.
Beck, D., Shah, K., and Specia, L. (2014). Shef-lite 2.0: Sparse multi-task gaussian processesfor translation quality estimation. In Proceed-ings of the Ninth Workshop on Statistical Ma-chine Translation, Baltimore, Maryland, USA.Association for Computational Linguistics.
Bicici, E. (2013). Referential translation machinesfor quality estimation. In Proceedings of theEighth Workshop on Statistical Machine Trans-lation, Sofia, Bulgaria.
Bicici, E., Liu, Q., and Way, A. (2014). ParallelFDA5 for fast deployment of accurate statisti-
cal machine translation systems. In Proceed-ings of the Ninth Workshop on Statistical Ma-chine Translation, Baltimore, USA. Associationfor Computational Linguistics.
Bicici, E., Liu, Q., and Way, A. (2014). Parallelfda5 for fast deployment of accurate statisticalmachine translation systems. In Proceedingsof the Ninth Workshop on Statistical MachineTranslation, Baltimore, Maryland, USA. Asso-ciation for Computational Linguistics.
Bicici, E. and Way, A. (2014). Referential transla-tion machines for predicting translation quality.In Proceedings of the Ninth Workshop on Sta-tistical Machine Translation, Baltimore, Mary-land, USA. Association for Computational Lin-guistics.
Bojar, O., Buck, C., Callison-Burch, C., Feder-mann, C., Haddow, B., Koehn, P., Monz, C.,Post, M., Soricut, R., and Specia, L. (2013).Findings of the 2013 Workshop on StatisticalMachine Translation. In Proceedings of theEighth Workshop on Statistical Machine Trans-lation, pages 1–42, Sofia, Bulgaria. Associationfor Computational Linguistics.
Bojar, O., Diatka, V., Rychly, P., Stranak, P.,Tamchyna, A., and Zeman, D. (2014). Hindi-English and Hindi-only Corpus for MachineTranslation. In Proceedings of the Ninth Inter-national Language Resources and EvaluationConference, Reykjavik, Iceland. ELRA.
Bojar, O., Ercegovcevic, M., Popel, M., andZaidan, O. (2011). A grain of salt for the WMTmanual evaluation. In Proceedings of the SixthWorkshop on Statistical Machine Translation,pages 1–11, Edinburgh, Scotland. Associationfor Computational Linguistics.
Borisov, A. and Galinskaya, I. (2014). Yandexschool of data analysis russian-english machinetranslation system for wmt14. In Proceedingsof the Ninth Workshop on Statistical MachineTranslation, Baltimore, Maryland, USA. Asso-ciation for Computational Linguistics.
Bouayad-Agha, N., Scott, D. R., and Power, R.(2000). Integrating content and style in doc-uments: A case study of patient informationleaflets. Information Design Journal, 9(2–3):161–176.
Buckley, C. and Voorhees, E. M. (2004). Re-trieval evaluation with incomplete information.
49

In Proceedings of the 27th Annual InternationalACM SIGIR Conference on Research and De-velopment in Information Retrieval, pages 25–32, Sheffield, United Kingdom.
Buitelaar, P., Sacaleanu, B., Spela Vintar, Stef-fen, D., Volk, M., Dejean, H., Gaussier, E.,Widdows, D., Weiser, O., and Frederking, R.(2003). Multilingual concept hierarchies formedical information organization and retrieval.Public deliverable, MuchMore project.
Callison-Burch, C., Fordyce, C., Koehn, P., Monz,C., and Schroeder, J. (2007). (Meta-) evaluationof machine translation. In Proceedings of theSecond Workshop on Statistical Machine Trans-lation (WMT07), Prague, Czech Republic.
Callison-Burch, C., Fordyce, C., Koehn, P., Monz,C., and Schroeder, J. (2008). Further meta-evaluation of machine translation. In Proceed-ings of the Third Workshop on Statistical Ma-chine Translation (WMT08), Colmbus, Ohio.
Callison-Burch, C., Koehn, P., Monz, C., Pe-terson, K., Przybocki, M., and Zaidan, O. F.(2010). Findings of the 2010 joint workshopon statistical machine translation and metricsfor machine translation. In Proceedings of theFourth Workshop on Statistical Machine Trans-lation (WMT10), Uppsala, Sweden.
Callison-Burch, C., Koehn, P., Monz, C., Post, M.,Soricut, R., and Specia, L. (2012). Findings ofthe 2012 workshop on statistical machine trans-lation. In Proceedings of the Seventh Workshopon Statistical Machine Translation, pages 10–51, Montreal, Canada. Association for Compu-tational Linguistics.
Callison-Burch, C., Koehn, P., Monz, C., andSchroeder, J. (2009). Findings of the 2009workshop on statistical machine translation. InProceedings of the Fourth Workshop on Sta-tistical Machine Translation (WMT09), Athens,Greece.
Callison-Burch, C., Koehn, P., Monz, C., andZaidan, O. (2011). Findings of the 2011 work-shop on statistical machine translation. In Pro-ceedings of the Sixth Workshop on StatisticalMachine Translation, pages 22–64, Edinburgh,Scotland.
Camargo de Souza, J. G., Gonzalez-Rubio, J.,Buck, C., Turchi, M., and Negri, M. (2014).Fbk-upv-uedin participation in the wmt14 qual-ity estimation shared-task. In Proceedings of the
Ninth Workshop on Statistical Machine Trans-lation, Baltimore, Maryland, USA. Associationfor Computational Linguistics.
Cap, F., Weller, M., Ramm, A., and Fraser, A.(2014). Cims – the cis and ims joint submis-sion to wmt 2014 translating from english intogerman. In Proceedings of the Ninth Workshopon Statistical Machine Translation, Baltimore,Maryland, USA. Association for ComputationalLinguistics.
Cohen, J. (1960). A coefficient of agreement fornominal scales. Educational and PsychologicalMeasurment, 20(1):37–46.
Cohn, T. and Specia, L. (2013). Modelling an-notator bias with multi-task gaussian processes:An application to machine translation qualityestimation. In Proceedings of the 51st An-nual Meeting of the Association for Compu-tational Linguistics, ACL-2013, pages 32–42,Sofia, Bulgaria.
Collins, M. (2002). Discriminative training meth-ods for hidden markov models: theory and ex-periments with perceptron algorithms. In Pro-ceedings of the ACL-02 conference on Empir-ical methods in natural language processing -Volume 10, EMNLP ’02, pages 1–8, Strouds-burg, PA, USA. Association for ComputationalLinguistics.
Costa-jussa, M. R., Gupta, P., Rosso, P., andBanchs, R. E. (2014). English-to-hindi sys-tem description for wmt 2014: Deep source-context features for moses. In Proceedingsof the Ninth Workshop on Statistical MachineTranslation, Baltimore, Maryland, USA. Asso-ciation for Computational Linguistics.
Do, Q. K., Herrmann, T., Niehues, J., Allauzen,A., Yvon, F., and Waibel, A. (2014). Thekit-limsi translation system for wmt 2014. InProceedings of the Ninth Workshop on Statisti-cal Machine Translation, Baltimore, Maryland,USA. Association for Computational Linguis-tics.
Dungarwal, P., Chatterjee, R., Mishra, A.,Kunchukuttan, A., Shah, R., and Bhattacharyya,P. (2014). The iit bombay hindi-english transla-tion system at wmt 2014. In Proceedings of theNinth Workshop on Statistical Machine Trans-lation, Baltimore, Maryland, USA. Associationfor Computational Linguistics.
50

Durrani, N., Haddow, B., Koehn, P., and Heafield,K. (2014a). Edinburgh’s phrase-based machinetranslation systems for wmt-14. In Proceedingsof the ACL 2014 Ninth Workshop of StatisticalMachine Translation, Baltimore, USA.
Durrani, N., Haddow, B., Koehn, P., and Heafield,K. (2014b). Edinburghs phrase-based machinetranslation systems for wmt-14. In Proceedingsof the Ninth Workshop on Statistical MachineTranslation, Baltimore, Maryland, USA. Asso-ciation for Computational Linguistics.
Dusek, O., Hajic, J., Hlavacova, J., Novak, M.,Pecina, P., Rosa, R., Tamchyna, A., Uresova,Z., and Zeman, D. (2014). Machine transla-tion of medical texts in the khresmoi project. InProceedings of the ACL 2014 Ninth Workshopof Statistical Machine Translation, Baltimore,USA.
Federmann, C. (2012). Appraise: An Open-Source Toolkit for Manual Evaluation of Ma-chine Translation Output. The Prague Bulletinof Mathematical Linguistics (PBML), 98:25–35.
Foster, J. (2007). Treebanks gone bad: Parser eval-uation and retraining using a treebank of un-grammatical sentences. International Journalon Document Analysis and Recognition, 10(3-4):129–145.
Freitag, M., Peitz, S., Wuebker, J., Ney, H., Huck,M., Sennrich, R., Durrani, N., Nadejde, M.,Williams, P., Koehn, P., Herrmann, T., Cho,E., and Waibel, A. (2014). Eu-bridge mt:Combined machine translation. In Proceedingsof the Ninth Workshop on Statistical MachineTranslation, Baltimore, Maryland, USA. Asso-ciation for Computational Linguistics.
Gamon, M., Aue, A., and Smets, M. (2005).Sentence-level MT evaluation without referencetranslations: beyond language modeling. InProceedings of the Annual Conference of theEuropean Association for Machine Translation,Budapest.
Geurts, P., Ernst, D., and Wehenkel, L. (2006). Ex-tremely randomized trees. Machine Learning,63(1):3–42.
Green, S., Cer, D., and Manning, C. (2014).Phrasal: A toolkit for new directions in statis-tical machine translation. In Proceedings of theNinth Workshop on Statistical Machine Trans-
lation, Baltimore, Maryland, USA. Associationfor Computational Linguistics.
Hardmeier, C., Stymne, S., Tiedemann, J., Smith,A., and Nivre, J. (2014). Anaphora models andreordering for phrase-based smt. In Proceed-ings of the Ninth Workshop on Statistical Ma-chine Translation, Baltimore, Maryland, USA.Association for Computational Linguistics.
Herbrich, R., Minka, T., and Graepel, T. (2006).TrueSkillTM: A Bayesian Skill Rating Sys-tem. In Proceedings of the Twentieth AnnualConference on Neural Information ProcessingSystems, pages 569–576, Vancouver, BritishColumbia, Canada. MIT Press.
Herrmann, T., Mediani, M., Cho, E., Ha, T.-L.,Niehues, J., Slawik, I., Zhang, Y., and Waibel,A. (2014). The karlsruhe institute of technol-ogy translation systems for the wmt 2014. InProceedings of the Ninth Workshop on Statisti-cal Machine Translation, Baltimore, Maryland,USA. Association for Computational Linguis-tics.
Hokamp, C., Calixto, I., Wagner, J., and Zhang,J. (2014). Target-centric features for transla-tion quality estimation. In Proceedings of theNinth Workshop on Statistical Machine Trans-lation, Baltimore, Maryland, USA. Associationfor Computational Linguistics.
Hopkins, M. and May, J. (2013). Models of trans-lation competitions. In Proceedings of the 51stAnnual Meeting of the Association for Compu-tational Linguistics (Volume 1: Long Papers),pages 1416–1424, Sofia, Bulgaria.
Jarvelin, K. and Kekalainen, J. (2002). Cumu-lated gain-based evaluation of ir techniques.ACM Transactions on Information Systems,20(4):422–446.
Kim, J.-D., Ohta, T., Tateisi, Y., and Tsujii, J.(2003). GENIA corpus – a semantically anno-tated corpus for bio-textmining. Bioinformatics,19(suppl 1):i180–i182.
Knox, C., Law, V., Jewison, T., Liu, P., Ly,S., Frolkis, A., Pon, A., Banco, K., Mak, C.,Neveu, V., Djoumbou, Y., Eisner, R., Guo,A. C., and Wishart, D. S. (2011). DrugBank 3.0:a comprehensive resource for Omics researchon drugs. Nucleic acids research, 39(suppl1):D1035–D1041.
Koehn, P. (2012a). Simulating human judgment in
51

machine translation evaluation campaigns. InInternational Workshop on Spoken LanguageTranslation (IWSLT).
Koehn, P. (2012b). Simulating Human Judgmentin Machine Translation Evaluation Campaigns.In Proceedings of the Ninth International Work-shop on Spoken Language Translation, pages179–184, Hong Kong, China.
Koehn, P. and Monz, C. (2006). Manual and au-tomatic evaluation of machine translation be-tween European languages. In Proceedings ofNAACL 2006 Workshop on Statistical MachineTranslation, New York, New York.
Koppel, M. and Ordan, N. (2011). Translationeseand its dialects. In Proceedings of the 49th An-nual Meeting of the Association for Computa-tional Linguistics: Human Language Techolo-gies, pages 1318–1326, Portland, Oregon.
Landis, J. R. and Koch, G. G. (1977). The mea-surement of observer agreement for categoricaldata. Biometrics, 33:159–174.
Leusch, G., Ueffing, N., and Ney, H. (2006). Cder:Efficient mt evaluation using block movements.In Proceedings of the 11th Conference of theEuropean Chapter of the Association for Com-putational Linguistics, pages 241–248, Trento,Italy.
Li, J., Kim, S.-J., Na, H., and Lee, J.-H. (2014a).Postech’s system description for medical texttranslation task. In Proceedings of the ACL2014 Ninth Workshop of Statistical MachineTranslation, Baltimore, USA.
Li, L., Wu, X., Vaillo, S. C., Xie, J., Way, A., andLiu, Q. (2014b). The dcu-ictcas mt system atwmt 2014 on german-english translation task.In Proceedings of the Ninth Workshop on Sta-tistical Machine Translation, Baltimore, Mary-land, USA. Association for Computational Lin-guistics.
Lopez, A. (2012). Putting Human Assessments ofMachine Translation Systems in Order. In Pro-ceedings of the Seventh Workshop on Statisti-cal Machine Translation, pages 1–9, Montreal,Canada. Association for Computational Lin-guistics.
Lu, Y., Wang, L., Wong, D. F., Chao, L. S., Wang,Y., and Oliveira, F. (2014). Domain adapta-tion for medical text translation using web re-sources. In Proceedings of the ACL 2014 Ninth
Workshop of Statistical Machine Translation,Baltimore, USA.
Luong, N. Q., Besacier, L., and Lecouteux, B.(2014). Lig system for word level qe task atwmt14. In Proceedings of the Ninth Workshopon Statistical Machine Translation, Baltimore,Maryland, USA. Association for ComputationalLinguistics.
Luong, N. Q., Lecouteux, B., and Besacier, L.(2013). LIG system for WMT13 QE task: In-vestigating the usefulness of features in wordconfidence estimation for MT. In Proceedingsof the Eighth Workshop on Statistical MachineTranslation, pages 384–389, Sofia, Bulgaria.Association for Computational Linguistics.
Machacek, M. and Bojar, O. (2014). Results ofthe wmt14 metrics shared task. In Proceedingsof the Ninth Workshop on Statistical MachineTranslation, Baltimore, Maryland, USA. Asso-ciation for Computational Linguistics.
Matthews, A., Ammar, W., Bhatia, A., Feely, W.,Hanneman, G., Schlinger, E., Swayamdipta, S.,Tsvetkov, Y., Lavie, A., and Dyer, C. (2014).The cmu machine translation systems at wmt2014. In Proceedings of the Ninth Workshopon Statistical Machine Translation, Baltimore,Maryland, USA. Association for ComputationalLinguistics.
Neidert, J., Schuster, S., Green, S., Heafield, K.,and Manning, C. (2014). Stanford universityssubmissions to the wmt 2014 translation task. InProceedings of the Ninth Workshop on Statisti-cal Machine Translation, Baltimore, Maryland,USA. Association for Computational Linguis-tics.
Okita, T., Vahid, A. H., Way, A., and Liu, Q.(2014). Dcu terminology translation system formedical query subtask at wmt14. In Proceed-ings of the ACL 2014 Ninth Workshop of Statis-tical Machine Translation, Baltimore, USA.
Papineni, K., Roukos, S., Ward, T., and Zhu, W.-J.(2002). BLEU: a method for automatic eval-uation of machine translation. In Proceedingsof the 40th Annual Meeting of the Associationfor Computational Linguistics, pages 311–318,Philadelphia, PA, USA. Association for Com-putational Linguistics.
Pecheux, N., Gong, L., Do, Q. K., Marie, B.,Ivanishcheva, Y., Allauzen, A., Lavergne, T.,
52

Niehues, J., Max, A., and Yvon, Y. (2014).LIMSI @ WMT’14 Medical Translation Task.In Proceedings of the Ninth Workshop on Sta-tistical Machine Translation, Baltimore, USA.
Pecina, P., Dusek, O., Goeuriot, L., Hajic, J.,Hlavacova, J., Jones, G., Kelly, L., Leveling, J.,Marecek, D., Novak, M., Popel, M., Rosa, R.,Tamchyna, A., and Uresova, Z. (2014). Adapta-tion of machine translation for multilingual in-formation retrieval in the medical domain. Arti-ficial Intelligence in Medicine, (0):–.
Peitz, S., Wuebker, J., Freitag, M., and Ney, H.(2014). The rwth aachen german-english ma-chine translation system for wmt 2014. InProceedings of the Ninth Workshop on Statisti-cal Machine Translation, Baltimore, Maryland,USA. Association for Computational Linguis-tics.
Pouliquen, B. and Mazenc, C. (2011). COPPA,CLIR and TAPTA: three tools to assist in over-coming the patent barrier at WIPO. In Pro-ceedings of the Thirteenth Machine TranslationSummit, pages 24–30, Xiamen, China. Asia-Pacific Association for Machine Translation.
Powers, D. M. W. (2011). Evaluation: from preci-sion, recall and f-measure to roc, informedness,markedness & correlation. Journal of MachineLearning Technologies.
Quernheim, D. and Cap, F. (2014). Large-scale ex-act decoding: The ims-ttt submission to wmt14.In Proceedings of the Ninth Workshop on Sta-tistical Machine Translation, Baltimore, Mary-land, USA. Association for Computational Lin-guistics.
Rosse, C. and Mejino Jr., J. L. V. (2008). Thefoundational model of anatomy ontology. InBurger, A., Davidson, D., and Baldock, R., ed-itors, Anatomy Ontologies for Bioinformatics,volume 6 of Computational Biology, pages 59–117. Springer London.
Rubino, R., Toral, A., Sanchez-Cartagena, V. M.,Ferrandez-Tordera, J., Ortiz Rojas, S., Ramırez-Sanchez, G., Sanchez-Martınez, F., and Way,A. (2014). Abu-matran at wmt 2014 transla-tion task: Two-step data selection and rbmt-style synthetic rules. In Proceedings of theNinth Workshop on Statistical Machine Trans-lation, Baltimore, Maryland, USA. Associationfor Computational Linguistics.
Sakaguchi, K., Post, M., and Van Durme, B.(2014). Efficient elicitation of annotations forhuman evaluation of machine translation. InProceedings of the Ninth Workshop on Statisti-cal Machine Translation, Baltimore, Maryland.
Sanchez-Cartagena, V. M., Perez-Ortiz, J. A., andSanchez-Martınez, F. (2014). The ua-prompsithybrid machine translation system for the 2014workshop on statistical machine translation. InProceedings of the Ninth Workshop on Statisti-cal Machine Translation, Baltimore, Maryland,USA. Association for Computational Linguis-tics.
Scarton, C. and Specia, L. (2014). Exploring con-sensus in machine translation for quality esti-mation. In Proceedings of the Ninth Workshopon Statistical Machine Translation, Baltimore,Maryland, USA. Association for ComputationalLinguistics.
Schwartz, L., Anderson, T., Gwinnup, J., andYoung, K. (2014). Machine translation andmonolingual postediting: The afrl wmt-14 sys-tem. In Proceedings of the Ninth Workshopon Statistical Machine Translation, Baltimore,Maryland, USA. Association for ComputationalLinguistics.
Seginer, Y. (2007). Learning Syntactic Structure.PhD thesis, University of Amsterdam.
Shah, K., Cohn, T., and Specia, L. (2013). Aninvestigation on the effectiveness of features fortranslation quality estimation. In Proceedingsof the Machine Translation Summit XIV, pages167–174, Nice, France.
Shah, K. and Specia, L. (2014). Quality estimationfor translation selection. In Proceedings of the17th Annual Conference of the European As-sociation for Machine Translation, Dubrovnik,Croatia.
Snover, M., Dorr, B., Schwartz, R., Micciulla, L.,and Makhoul, J. (2006). A study of transla-tion edit rate with targeted human annotation.In Proceedings of the 7th Biennial Conferenceof the Association for Machine Translation inthe Americas (AMTA-2006), Cambridge, Mas-sachusetts.
Souza, J. G. C. d., Espl-Gomis, M., Turchi, M.,and Negri, M. (2013). Exploiting qualitative in-formation from automatic word alignment forcross-lingual nlp tasks. In The 51st Annual
53
Meeting of the Association for ComputationalLinguistics - Short Papers (ACL Short Papers2013).
Specia, L., Shah, K., de Souza, J. G. C., and Cohn,T. (2013). QuEst - A Translation Quality Esti-mation Framework. In Proceedings of the 51thConference of the Association for Computa-tional Linguistics (ACL), Demo Session, Sofia,Bulgaria.
Tamchyna, A., Popel, M., Rosa, R., and Bojar, O.(2014). Cuni in wmt14: Chimera still awaitsbellerophon. In Proceedings of the Ninth Work-shop on Statistical Machine Translation, Balti-more, Maryland, USA. Association for Compu-tational Linguistics.
Tan, L. and Pal, S. (2014). Manawi: Usingmulti-word expressions and named entities toimprove machine translation. In Proceedingsof the Ninth Workshop on Statistical MachineTranslation, Baltimore, Maryland, USA. Asso-ciation for Computational Linguistics.
Thompson, P., Iqbal, S., McNaught, J., and Ana-niadou, S. (2009). Construction of an annotatedcorpus to support biomedical information ex-traction. BMC bioinformatics, 10(1):349.
Tiedemann, J. (2009). News from OPUS – acollection of multilingual parallel corpora withtools and interfaces. In Recent Advances inNatural Language Processing, volume 5, pages237–248, Borovets, Bulgaria. John Benjamins.
Tillmann, C., Vogel, S., Ney, H., Zubiaga, A.,and Sawaf, H. (1997). Accelerated DP basedsearch for statistical translation. In Kokki-nakis, G., Fakotakis, N., and Dermatas, E., edi-tors, Proceedings of the Fifth European Confer-ence on Speech Communication and Technol-ogy, pages 2667–2670, Rhodes, Greece. Inter-national Speech Communication Association.
U.S. National Library of Medicine (2009). UMLSreference manual. Metathesaurus. Bethesda,MD, USA.
Voorhees, E. M. and Harman, D. K., editors(2005). TREC: Experiment and evaluation ininformation retrieval, volume 63 of Digital li-braries and electronic publishing series. MITpress Cambridge, Cambridge, MA, USA.
Wang, L., Lu, Y., Wong, D. F., Chao, L. S., Wang,Y., and Oliveira., F. (2014). Combining domain
adaptation approaches for medical text transla-tion. In Proceedings of the ACL 2014 NinthWorkshop of Statistical Machine Translation,Baltimore, USA.
Waschle, K. and Riezler, S. (2012). Analyz-ing parallelism and domain similarities in theMAREC patent corpus. In Salampasis, M. andLarsen, B., editors, Multidisciplinary Informa-tion Retrieval, volume 7356 of Lecture Notesin Computer Science, pages 12–27. SpringerBerlin Heidelberg.
Williams, P., Sennrich, R., Nadejde, M., Huck, M.,Hasler, E., and Koehn, P. (2014). Edinburghssyntax-based systems at wmt 2014. In Proceed-ings of the Ninth Workshop on Statistical Ma-chine Translation, Baltimore, Maryland, USA.Association for Computational Linguistics.
Wisniewski, G., Pecheux, N., Allauzen, A., andYvon, F. (2014). Limsi submission for wmt’14qe task. In Proceedings of the Ninth Workshopon Statistical Machine Translation, Baltimore,Maryland, USA. Association for ComputationalLinguistics.
wu, x., Haque, R., Okita, T., Arora, P., Way, A.,and Liu, Q. (2014). Dcu-lingo24 participationin wmt 2014 hindi-english translation task. InProceedings of the Ninth Workshop on Statisti-cal Machine Translation, Baltimore, Maryland,USA. Association for Computational Linguis-tics.
Zdenka Uresova, Ondrej Dusek, J. H. and Pecina,P. (2014). Multilingual test sets for machinetranslation of search queries for cross-lingualinformation retrieval in the medical domain. InTo appear in Proceedings of the Ninth Interna-tional Conference on Language Resources andEvaluation, Reykjavik, Iceland.
Zhang, J., Wu, X., Calixto, I., Vahid, A. H., Zhang,X., Way, A., and Liu, Q. (2014). Experiments inmedical translation shared task at wmt 2014. InProceedings of the ACL 2014 Ninth Workshopof Statistical Machine Translation, Baltimore,USA.
54
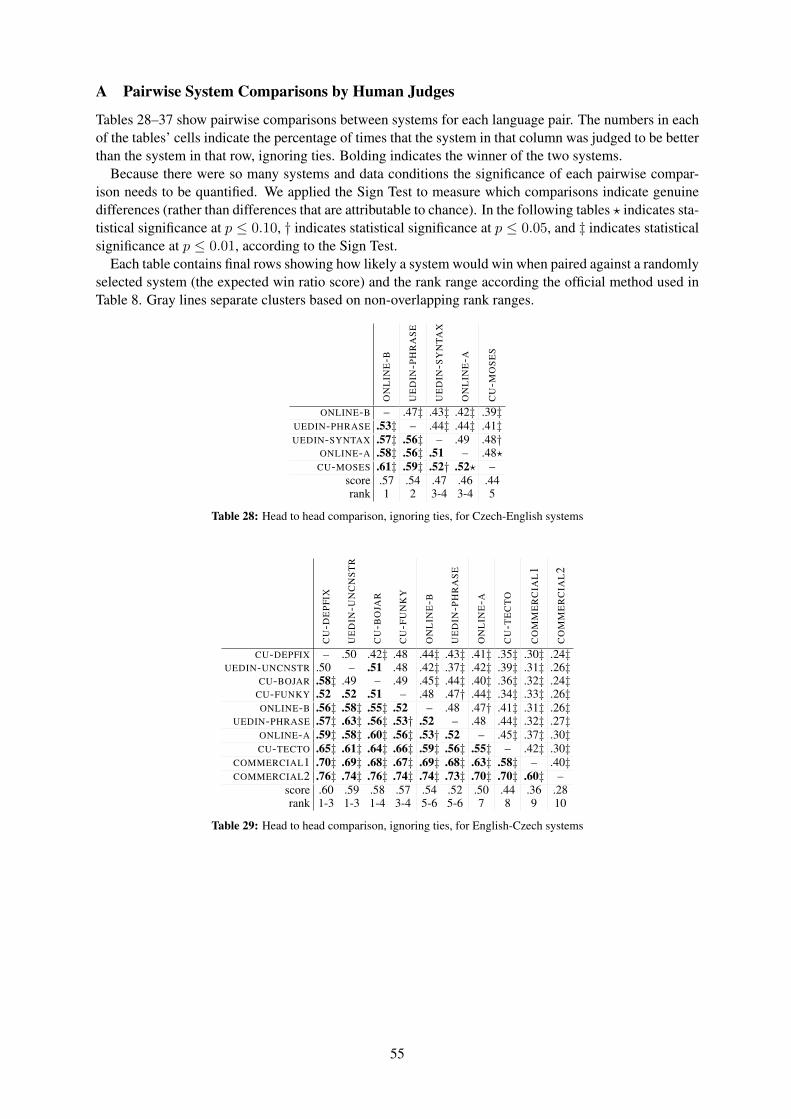
A Pairwise System Comparisons by Human Judges
Tables 28–37 show pairwise comparisons between systems for each language pair. The numbers in eachof the tables’ cells indicate the percentage of times that the system in that column was judged to be betterthan the system in that row, ignoring ties. Bolding indicates the winner of the two systems.
Because there were so many systems and data conditions the significance of each pairwise compar-ison needs to be quantified. We applied the Sign Test to measure which comparisons indicate genuinedifferences (rather than differences that are attributable to chance). In the following tables ? indicates sta-tistical significance at p ≤ 0.10, † indicates statistical significance at p ≤ 0.05, and ‡ indicates statisticalsignificance at p ≤ 0.01, according to the Sign Test.
Each table contains final rows showing how likely a system would win when paired against a randomlyselected system (the expected win ratio score) and the rank range according the official method used inTable 8. Gray lines separate clusters based on non-overlapping rank ranges.
ON
LIN
E-B
UE
DIN
-PH
RA
SE
UE
DIN
-SY
NTA
X
ON
LIN
E-A
CU
-MO
SE
S
ONLINE-B – .47‡ .43‡ .42‡ .39‡UEDIN-PHRASE .53‡ – .44‡ .44‡ .41‡UEDIN-SYNTAX .57‡ .56‡ – .49 .48†
ONLINE-A .58‡ .56‡ .51 – .48?CU-MOSES .61‡ .59‡ .52† .52? –
score .57 .54 .47 .46 .44rank 1 2 3-4 3-4 5
Table 28: Head to head comparison, ignoring ties, for Czech-English systems
CU
-DE
PFI
X
UE
DIN
-UN
CN
ST
R
CU
-BO
JAR
CU
-FU
NK
Y
ON
LIN
E-B
UE
DIN
-PH
RA
SE
ON
LIN
E-A
CU
-TE
CT
O
CO
MM
ER
CIA
L1
CO
MM
ER
CIA
L2
CU-DEPFIX – .50 .42‡ .48 .44‡ .43‡ .41‡ .35‡ .30‡ .24‡UEDIN-UNCNSTR .50 – .51 .48 .42‡ .37‡ .42‡ .39‡ .31‡ .26‡
CU-BOJAR .58‡ .49 – .49 .45‡ .44‡ .40‡ .36‡ .32‡ .24‡CU-FUNKY .52 .52 .51 – .48 .47† .44‡ .34‡ .33‡ .26‡ONLINE-B .56‡ .58‡ .55‡ .52 – .48 .47† .41‡ .31‡ .26‡
UEDIN-PHRASE .57‡ .63‡ .56‡ .53† .52 – .48 .44‡ .32‡ .27‡ONLINE-A .59‡ .58‡ .60‡ .56‡ .53† .52 – .45‡ .37‡ .30‡CU-TECTO .65‡ .61‡ .64‡ .66‡ .59‡ .56‡ .55‡ – .42‡ .30‡
COMMERCIAL1 .70‡ .69‡ .68‡ .67‡ .69‡ .68‡ .63‡ .58‡ – .40‡COMMERCIAL2 .76‡ .74‡ .76‡ .74‡ .74‡ .73‡ .70‡ .70‡ .60‡ –
score .60 .59 .58 .57 .54 .52 .50 .44 .36 .28rank 1-3 1-3 1-4 3-4 5-6 5-6 7 8 9 10
Table 29: Head to head comparison, ignoring ties, for English-Czech systems
55

ON
LIN
E-B
UE
DIN
-SY
NTA
X
ON
LIN
E-A
LIM
SI-
KIT
EU
-BR
IDG
E
UE
DIN
-PH
RA
SE
KIT
RW
TH
DC
U-I
CT
CA
S
CM
U
RB
MT
4
RB
MT
1
ON
LIN
E-C
ONLINE-B – .46 .40‡ .41‡ .35‡ .42‡ .38‡ .35‡ .40‡ .31‡ .33‡ .32‡ .22‡UEDIN-SYNTAX .54 – .51 .47 .47 .45 .45? .39‡ .36‡ .38‡ .35‡ .34‡ .27‡
ONLINE-A .60‡ .49 – .42† .44† .51 .41‡ .38‡ .44? .42‡ .38‡ .31‡ .20‡LIMSI-KIT .59‡ .53 .58† – .55 .53 .31‡ .45? .39‡ .41‡ .37‡ .35‡ .29‡
EU-BRIDGE .65‡ .53 .56† .45 – .45 .44? .48 .40‡ .37‡ .39‡ .37‡ .30‡UEDIN-PHRASE .58‡ .55 .49 .47 .55 – .48 .39‡ .34‡ .45? .40‡ .40‡ .34‡
KIT .62‡ .55? .59‡ .69‡ .56? .52 – .45? .41‡ .45? .47 .40‡ .31‡RWTH .65‡ .61‡ .62‡ .55? .52 .61‡ .55? – .54 .44† .44† .38‡ .37‡
DCU-ICTCAS .60‡ .64‡ .56? .61‡ .60‡ .66‡ .59‡ .46 – .51 .49 .46? .40‡CMU .69‡ .62‡ .58‡ .59‡ .63‡ .55? .55? .56† .49 – .53 .42‡ .43†
RBMT4 .67‡ .65‡ .62‡ .63‡ .61‡ .60‡ .53 .56† .51 .47 – .51 .37‡RBMT1 .68‡ .66‡ .69‡ .65‡ .63‡ .60‡ .60‡ .62‡ .54? .58‡ .49 – .38‡
ONLINE-C .78‡ .73‡ .80‡ .71‡ .70‡ .66‡ .69‡ .63‡ .60‡ .57† .63‡ .62‡ –score .63 .58 .58 .55 .55 .54 .49 .47 .45 .44 .44 .40 .32rank 1 2-3 2-3 4-6 4-6 4-6 7-8 7-8 9-11 9-11 9-11 12 13
Table 30: Head to head comparison, ignoring ties, for German-English systems
UE
DIN
-SY
NTA
X
ON
LIN
E-B
ON
LIN
E-A
PR
OM
T-H
YB
RID
PR
OM
T-R
UL
E
UE
DIN
-STA
NF
OR
D
EU
-BR
IDG
E
RB
MT
4
UE
DIN
-PH
RA
SE
RB
MT
1
KIT
STA
NF
OR
D-U
NC
CIM
S
STA
NF
OR
D
UU
ON
LIN
E-C
IMS-T
TT
UU
-DO
CE
NT
UEDIN-SYNTAX – .55? .46? .45? .46? .44† .41‡ .45† .43‡ .41‡ .38‡ .38‡ .36‡ .33‡ .38‡ .30‡ .30‡ .25‡ONLINE-B .45? – .50 .48 .50 .47 .43† .46? .41‡ .45† .39‡ .39‡ .37‡ .32‡ .35‡ .34‡ .30‡ .29‡ONLINE-A .54? .50 – .44† .52 .50 .45? .43‡ .43† .42‡ .39‡ .41‡ .42‡ .42‡ .37‡ .44† .38‡ .33‡
PROMT-HYBRID .55? .52 .56† – .45? .47 .47 .46? .50 .44† .42‡ .40‡ .41‡ .38‡ .39‡ .39‡ .33‡ .34‡PROMT-RULE .54? .50 .48 .55? – .51 .47 .47 .45? .38‡ .42‡ .40‡ .43† .41‡ .43† .38‡ .35‡ .29‡
UEDIN-STANFORD .56† .53 .50 .53 .49 – .48 .50 .47 .44† .46 .36‡ .36‡ .36‡ .36‡ .35‡ .30‡ .32‡EU-BRIDGE .59‡ .57† .55? .53 .53 .52 – .46? .43† .52 .42‡ .42‡ .45? .35‡ .36‡ .41‡ .38‡ .30‡
RBMT4 .55† .54? .57‡ .54? .53 .50 .54? – .53 .49 .44† .49 .50 .47 .40‡ .42‡ .38‡ .40‡UEDIN-PHRASE .57‡ .59‡ .57† .50 .55? .53 .57† .47 – .50 .55? .47 .45? .44† .43† .42‡ .37‡ .34‡
RBMT1 .59‡ .55† .58‡ .56† .62‡ .56† .48 .51 .50 – .47 .47 .45† .47 .43‡ .42‡ .38‡ .41‡KIT .62‡ .61‡ .61‡ .58‡ .58‡ .54 .58‡ .56† .45? .53 – .47 .49 .46 .43‡ .48 .34‡ .37‡
STANFORD-UNC .62‡ .61‡ .59‡ .60‡ .60‡ .64‡ .58‡ .51 .53 .53 .53 – .48 .47 .45† .45? .39‡ .41‡CIMS .64‡ .63‡ .58‡ .59‡ .57† .64‡ .55? .50 .55? .55† .51 .52 – .53 .42‡ .52 .47 .42‡
STANFORD .67‡ .68‡ .58‡ .62‡ .59‡ .64‡ .65‡ .53 .56† .53 .54 .53 .47 – .53 .42‡ .39‡ .48UU .62‡ .65‡ .62‡ .61‡ .57† .64‡ .64‡ .60‡ .57† .57‡ .57‡ .55† .58‡ .47 – .46? .45† .38‡
ONLINE-C .70‡ .66‡ .56† .61‡ .62‡ .65‡ .59‡ .58‡ .58‡ .58‡ .52 .55? .48 .58‡ .54? – .48 .47IMS-TTT .70‡ .70‡ .62‡ .67‡ .65‡ .70‡ .62‡ .62‡ .63‡ .62‡ .66‡ .61‡ .53 .61‡ .55† .52 – .49
UU-DOCENT .75‡ .71‡ .67‡ .66‡ .71‡ .68‡ .70‡ .60‡ .66‡ .59‡ .63‡ .59‡ .58‡ .52 .62‡ .53 .51 –score .60 .59 .56 .56 .56 .56 .54 .51 .51 .50 .48 .47 .46 .44 .43 .42 .38 .37rank 1-2 1-2 3-6 3-6 3-6 3-6 7 8-10 8-10 8-10 11-12 11-13 12-14 13-15 14-16 15-16 17-18 17-18
Table 31: Head to head comparison, ignoring ties, for English-German systems
56

UE
DIN
-PH
RA
SE
KIT
ON
LIN
E-B
STA
NF
OR
D
ON
LIN
E-A
RB
MT
1
RB
MT
4
ON
LIN
E-C
UEDIN-PHRASE – .48 .48 .45‡ .43‡ .28‡ .28‡ .19‡KIT .52 – .54† .48 .44‡ .31‡ .29‡ .21‡
ONLINE-B .52 .46† – .51 .47 .31‡ .30‡ .24‡STANFORD .55‡ .52 .49 – .46† .34‡ .30‡ .23‡ONLINE-A .57‡ .56‡ .53 .54† – .32‡ .29‡ .21‡
RBMT1 .72‡ .69‡ .69‡ .66‡ .68‡ – .42‡ .33‡RBMT4 .72‡ .71‡ .70‡ .70‡ .71‡ .58‡ – .39‡
ONLINE-C .81‡ .79‡ .76‡ .77‡ .79‡ .67‡ .61‡ –score .63 .60 .59 .58 .57 .40 .35 .25rank 1 2-4 2-4 2-4 5 6 7 8
Table 32: Head to head comparison, ignoring ties, for French-English systems
ON
LIN
E-B
UE
DIN
-PH
RA
SE
KIT
MA
TR
AN
MA
TR
AN
-RU
LE
S
ON
LIN
E-A
UU
-DO
CE
NT
PR
OM
T-H
YB
RID
UA
PR
OM
T-R
UL
E
RB
MT
1
RB
MT
4
ON
LIN
E-C
ONLINE-B – .46? .48 .46? .50 .41‡ .39‡ .39‡ .37‡ .38‡ .37‡ .35‡ .27‡UEDIN-PHRASE .54? – .50 .47 .46 .46? .42‡ .41‡ .46? .42‡ .35‡ .34‡ .33‡
KIT .52 .50 – .53 .51 .50 .43‡ .49 .41‡ .42‡ .35‡ .37‡ .29‡MATRAN .54? .53 .47 – .49 .50 .43‡ .43‡ .38‡ .48 .40‡ .34‡ .32‡
MATRAN-RULES .50 .54 .49 .51 – .53 .40‡ .45† .46? .42‡ .44† .40‡ .34‡ONLINE-A .59‡ .54? .50 .50 .47 – .44† .49 .47 .45? .42‡ .37‡ .34‡
UU-DOCENT .61‡ .58‡ .57‡ .57‡ .60‡ .56† – .43‡ .52 .46? .39‡ .44† .33‡PROMT-HYBRID .61‡ .59‡ .51 .57‡ .55† .51 .57‡ – .50 .41‡ .46? .44† .35‡
UA .63‡ .54? .59‡ .62‡ .54? .53 .48 .50 – .49 .46? .43‡ .34‡PROMT-RULE .62‡ .58‡ .58‡ .52 .58‡ .55? .54? .59‡ .51 – .47 .39‡ .37‡
RBMT1 .63‡ .65‡ .65‡ .60‡ .56† .58‡ .61‡ .54? .54? .53 – .46? .45†RBMT4 .65‡ .66‡ .63‡ .66‡ .60‡ .63‡ .56† .56† .57‡ .61‡ .54? – .45?
ONLINE-C .73‡ .67‡ .71‡ .67‡ .66‡ .66‡ .67‡ .65‡ .66‡ .63‡ .55† .55? –score .59 .57 .55 .55 .54 .53 .49 .49 .48 .47 .43 .40 .34rank 1 2-4 2-5 2-5 4-6 4-6 7-9 7-10 7-10 8-10 11 12 13
Table 33: Head to head comparison, ignoring ties, for English-French systems
ON
LIN
E-B
ON
LIN
E-A
UE
DIN
-SY
NTA
X
CM
U
UE
DIN
-PH
RA
SE
AF
RL
IIT-
BO
MB
AY
DC
U-L
ING
O24
IIIT
-HY
DE
RA
BA
D
ONLINE-B – .36‡ .33‡ .37‡ .31‡ .21‡ .20‡ .14‡ .00ONLINE-A .64‡ – .48 .47? .44‡ .31‡ .30‡ .24‡ .12‡
UEDIN-SYNTAX .67‡ .52 – .47 .46† .33‡ .29‡ .24‡ .12‡CMU .63‡ .53? .53 – .47 .37‡ .31‡ .26‡ .11‡
UEDIN-PHRASE .69‡ .56‡ .54† .53 – .40‡ .33‡ .25‡ .11‡AFRL .79‡ .69‡ .67‡ .63‡ .60‡ – .53 .40‡ .16‡
IIT-BOMBAY .80‡ .70‡ .71‡ .69‡ .67‡ .47 – .44‡ .19‡DCU-LINGO24 .86‡ .76‡ .76‡ .74‡ .75‡ .60‡ .56‡ – .19‡
IIIT-HYDERABAD .94‡ .88‡ .88‡ .89‡ .89‡ .84‡ .81‡ .81‡ –score .75 .62 .61 .60 .57 .44 .41 .34 .13rank 1 2-3 2-4 3-4 5 6-7 6-7 8 9
Table 34: Head to head comparison, ignoring ties, for Hindi-English systems
57

ON
LIN
E-B
ON
LIN
E-A
UE
DIN
-UN
CN
ST
R
UE
DIN
-PH
RA
SE
CU
-MO
SE
S
IIT-
BO
MB
AY
IPN
-UP
V-C
NT
XT
DC
U-L
ING
O24
IPN
-UP
V-N
OD
EV
MA
NA
WI-
H1
MA
NA
WI
MA
NA
WI-
RM
OO
V
ONLINE-B – .49 .28‡ .29‡ .27‡ .23‡ .22‡ .20‡ .17‡ .12‡ .13‡ .13‡ONLINE-A .51 – .31‡ .29‡ .27‡ .25‡ .20‡ .20‡ .21‡ .19‡ .16‡ .15‡
UEDIN-UNCNSTR .72‡ .69‡ – .44† .49 .39‡ .40‡ .34‡ .39‡ .29‡ .30‡ .27‡UEDIN-PHRASE .71‡ .71‡ .56† – .48 .45† .44† .39‡ .37‡ .31‡ .31‡ .32‡
CU-MOSES .73‡ .73‡ .51 .52 – .47 .42‡ .40‡ .45? .36‡ .35‡ .33‡IIT-BOMBAY .77‡ .75‡ .61‡ .55† .53 – .50 .47 .45† .41‡ .40‡ .36‡
IPN-UPV-CNTXT .78‡ .80‡ .60‡ .56† .58‡ .50 – .51 .41‡ .40‡ .40‡ .37‡DCU-LINGO24 .80‡ .80‡ .66‡ .61‡ .60‡ .53 .49 – .52 .41‡ .41‡ .39‡
IPN-UPV-NODEV .83‡ .79‡ .61‡ .63‡ .55? .55† .59‡ .48 – .46? .44† .38‡MANAWI-H1 .88‡ .81‡ .71‡ .69‡ .64‡ .59‡ .60‡ .59‡ .54? – .35‡ .34‡
MANAWI .87‡ .84‡ .70‡ .69‡ .65‡ .60‡ .60‡ .59‡ .56† .65‡ – .39‡MANAWI-RMOOV .87‡ .85‡ .73‡ .68‡ .67‡ .64‡ .63‡ .61‡ .62‡ .66‡ .61‡ –
score .77 .75 .57 .54 .52 .47 .46 .43 .42 .38 .35 .31rank 1 2 3 4-5 4-5 6-7 6-7 8-9 8-9 10-11 10-11 12
Table 35: Head to head comparison, ignoring ties, for English-Hindi systems
AF
RL
-PE
ON
LIN
E-B
ON
LIN
E-A
PR
OM
T-H
YB
RID
PR
OM
T-R
UL
E
UE
DIN
-PH
RA
SE
Y-S
DA
ON
LIN
E-G
AF
RL
UE
DIN
-SY
NTA
X
KA
ZN
U
RB
MT
1
RB
MT
4
AFRL-PE – .42‡ .40‡ .39‡ .39‡ .41‡ .35‡ .39‡ .28‡ .26‡ .26‡ .29‡ .21‡ONLINE-B .58‡ – .42‡ .43‡ .45† .45† .42‡ .43‡ .46? .37‡ .33‡ .29‡ .31‡ONLINE-A .60‡ .58‡ – .50 .45† .51 .47 .45† .42‡ .40‡ .33‡ .32‡ .30‡
PROMT-HYBRID .61‡ .57‡ .50 – .47 .45? .49 .44† .43‡ .44† .39‡ .31‡ .27‡PROMT-RULE .61‡ .55† .55† .53 – .46? .47 .49 .48 .42‡ .36‡ .34‡ .30‡
UEDIN-PHRASE .59‡ .55† .49 .55? .54? – .49 .50 .47 .44† .32‡ .37‡ .29‡Y-SDA .65‡ .58‡ .53 .51 .53 .51 – .48 .50 .43‡ .34‡ .36‡ .34‡
ONLINE-G .61‡ .57‡ .55† .56† .51 .50 .52 – .48 .43‡ .39‡ .35‡ .30‡AFRL .72‡ .54? .58‡ .57‡ .52 .53 .50 .52 – .44† .41‡ .41‡ .37‡
UEDIN-SYNTAX .74‡ .63‡ .60‡ .56† .58‡ .56† .57‡ .57‡ .56† – .51 .36‡ .37‡KAZNU .74‡ .67‡ .67‡ .61‡ .64‡ .68‡ .66‡ .61‡ .59‡ .49 – .44† .38‡RBMT1 .71‡ .71‡ .68‡ .69‡ .66‡ .63‡ .64‡ .65‡ .59‡ .64‡ .56† – .47RBMT4 .79‡ .69‡ .70‡ .73‡ .70‡ .71‡ .66‡ .70‡ .63‡ .63‡ .62‡ .53 –
score .66 .58 .55 .55 .53 .53 .52 .51 .49 .45 .40 .36 .32rank 1 2 3-5 3-5 4-7 5-8 5-8 5-8 9 10 11 12 13
Table 36: Head to head comparison, ignoring ties, for Russian-English systems
PR
OM
T-R
UL
E
ON
LIN
E-B
PR
OM
T-H
YB
RID
UE
DIN
-UN
CN
ST
R
ON
LIN
E-G
ON
LIN
E-A
UE
DIN
-PH
RA
SE
RB
MT
4
RB
MT
1
PROMT-RULE – .51 .45† .43‡ .43‡ .39‡ .38‡ .15‡ .00ONLINE-B .49 – .50 .47? .38‡ .36‡ .38‡ .16‡ .13‡
PROMT-HYBRID .55† .50 – .49 .47 .39‡ .40‡ .18‡ .15‡UEDIN-UNCNSTR .57‡ .53? .51 – .50 .44‡ .36‡ .25‡ .18‡
ONLINE-G .57‡ .62‡ .53 .50 – .46? .44‡ .23‡ .18‡ONLINE-A .61‡ .64‡ .61‡ .56‡ .54? – .49 .24‡ .18‡
UEDIN-PHRASE .62‡ .62‡ .60‡ .64‡ .56‡ .51 – .30‡ .21‡RBMT4 .85‡ .84‡ .82‡ .75‡ .77‡ .76‡ .70‡ – .42‡RBMT1 .91‡ .87‡ .85‡ .82‡ .82‡ .82‡ .79‡ .58‡ –
score .64 .64 .61 .58 .55 .51 .49 .26 .19rank 1-2 1-2 3 4-5 4-5 6-7 6-7 8 9
Table 37: Head to head comparison, ignoring ties, for English-Russian systems
58