fineco: 1q17 results - scegli la semplicità - fineco bank results focus on product areas 4 agenda...
TRANSCRIPT

Fineco: 1Q17 Results
Company overview – June 2017
� This Presentation may contain written and oral “forward-looking statements”, which includes all statements that do not relate solely tohistorical or current facts and which are therefore inherently uncertain. All forward-looking statements rely on a number of assumptions,expectations, projections and provisional data concerning future events and are subject to a number of uncertainties and other factors,many of which are outside the control of FinecoBank S.p.A. (the “Company”). There are a variety of factors that may cause actual resultsand performance to be materially different from the explicit or implicit contents of any forward-looking statements and thus, such forward-looking statements are not a reliable indicator of future performance. The Company undertakes no obligation to publicly update or reviseany forward-looking statements, whether as a result of new information, future events or otherwise, except as may be required byapplicable law. The information and opinions contained in this Presentation are provided as at the date hereof and are subject to changewithout notice. Neither this Presentation nor any part of it nor the fact of its distribution may form the basis of, or be relied on or inconnection with, any contract or investment decision.
� The information, statements and opinions contained in this Presentation are for information purposes only and do not constitute a publicoffer under any applicable legislation or an offer to sell or solicitation of an offer to purchase or subscribe for securities or financialinstruments or any advice or recommendation with respect to such securities or other financial instruments. None of the securitiesreferred to herein have been, or will be, registered under the U.S. Securities Act of 1933, as amended, or the securities laws of any stateor other jurisdiction of the United States or in Australia, Canada or Japan or any other jurisdiction where such an offer or solicitationwould be unlawful (the “Other Countries”), and there will be no public offer of any such securities in the United States. This Presentationdoes not constitute or form a part of any offer or solicitation to purchase or subscribe for securities in the United States or the OtherCountries.
� Pursuant the consolidated law on financial intermediation of 24 February 1998 (article 154-bis, paragraph 2) Lorena Pelliciari, in hercapacity as manager responsible for the preparation of the Company’s financial reports declares that the accounting informationcontained in this Presentation reflects FinecoBank’s documented results, financial accounts and accounting records.
� In order to provide further guidance concerning the performance achieved by the Bank, some alternative performance indicators – IAP(such as Adj. Cost/Income ratio, Cost of Risk, PFA TFA/TFA, Guided Products/AUM, Guided Products/TFA, Adj. RoE) and theirdescriptions are included in 2016 Reports and Accounts and in this Presentation, in accordance with guidelines published on October5th, 2015 by European Securities and Markets Authority (ESMA/2015/1415).
� This Presentation has been prepared on a voluntary basis since the financial disclosure additional to the half-year and annual ones is nolonger compulsory pursuant to law 25/2016 in application of Directive 2013/50/EU, in order to grant continuity with the previous quarterlypresentations.
� Neither the Company nor any of its representatives, directors or employees accept any liability whatsoever in connection with thisPresentation or any of its contents or in relation to any loss arising from its use or from any reliance placed upon it.
2
Disclaimer
Executive Summary
3
(1) 4Q16 non-recurring items: releases of provisions: Solidarity Fund +1.5mln net and Tercas +1.0mln net; Integration costs: -3,7mln net; write-down ofCassa di Risparmio di Cesena stake: -4.5mln net
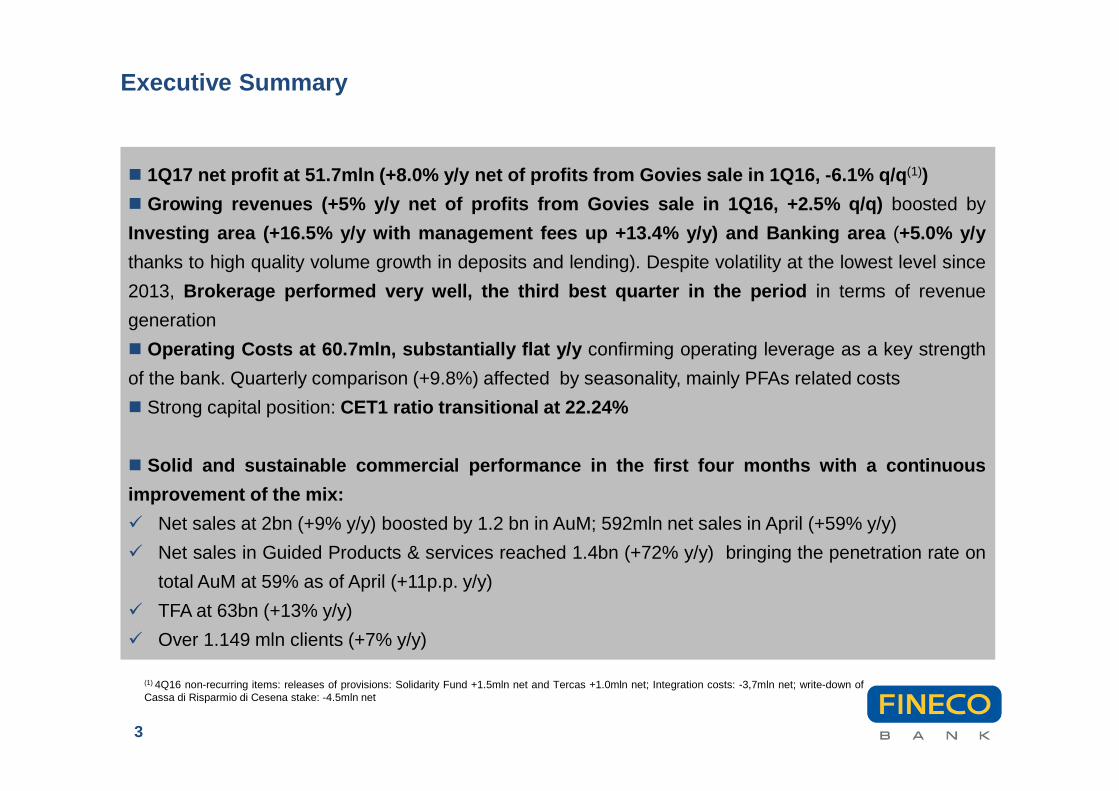
� 1Q17 net profit at 51.7mln (+8.0% y/y net of profits from Govi es sale in 1Q16, -6.1% q/q (1))
� Growing revenues (+5% y/y net of profits from Govies sale in 1 Q16, +2.5% q/q) boosted by
Investing area (+16.5% y/y with management fees up +13.4% y/ y) and Banking area (+5.0% y/y
thanks to high quality volume growth in deposits and lending). Despite volatility at the lowest level since
2013, Brokerage performed very well, the third best quarter in the period in terms of revenue
generation
� Operating Costs at 60.7mln, substantially flat y/y confirming operating leverage as a key strength
of the bank. Quarterly comparison (+9.8%) affected by seasonality, mainly PFAs related costs
� Strong capital position: CET1 ratio transitional at 22.24%
� Solid and sustainable commercial performance in the first f our months with a continuous
improvement of the mix:
� Net sales at 2bn (+9% y/y) boosted by 1.2 bn in AuM; 592mln net sales in April (+59% y/y)
� Net sales in Guided Products & services reached 1.4bn (+72% y/y) bringing the penetration rate on
total AuM at 59% as of April (+11p.p. y/y)
� TFA at 63bn (+13% y/y)
� Over 1.149 mln clients (+7% y/y)
Fineco Results
Focus on product areas
4
Agenda
Key messages and Initiatives monitoring
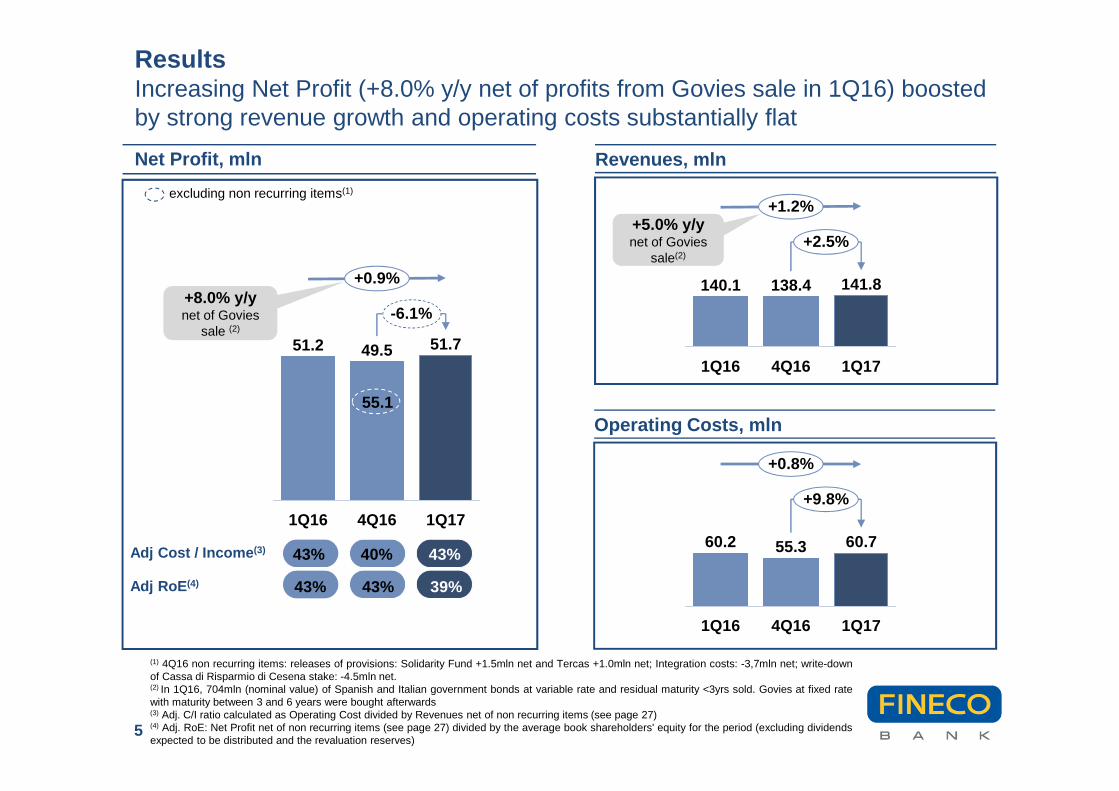
ResultsIncreasing Net Profit (+8.0% y/y net of profits from Govies sale in 1Q16) boosted by strong revenue growth and operating costs substantially flat
5
Revenues, mln
Operating Costs, mln
+2.5%
+1.2%
1Q17
141.8
4Q16
138.4
1Q16
140.1
+0.8%
+9.8%
1Q17
60.7
4Q16
55.3
1Q16
60.2
Net Profit, mln
+0.9%
-6.1%
1Q17
51.7
4Q16
49.5
1Q16
51.2
excluding non recurring items(1)
55.1
Adj Cost / Income (3)
Adj RoE (4) 43% 43% 39%
43% 40% 43%
(1) 4Q16 non recurring items: releases of provisions: Solidarity Fund +1.5mln net and Tercas +1.0mln net; Integration costs: -3,7mln net; write-downof Cassa di Risparmio di Cesena stake: -4.5mln net.(2) In 1Q16, 704mln (nominal value) of Spanish and Italian government bonds at variable rate and residual maturity <3yrs sold. Govies at fixed ratewith maturity between 3 and 6 years were bought afterwards(3) Adj. C/I ratio calculated as Operating Cost divided by Revenues net of non recurring items (see page 27)(4) Adj. RoE: Net Profit net of non recurring items (see page 27) divided by the average book shareholders' equity for the period (excluding dividendsexpected to be distributed and the revaluation reserves)
+8.0% y/ynet of Govies
sale (2)
+5.0% y/y net of Govies
sale(2)
Fees and Commissions, mln
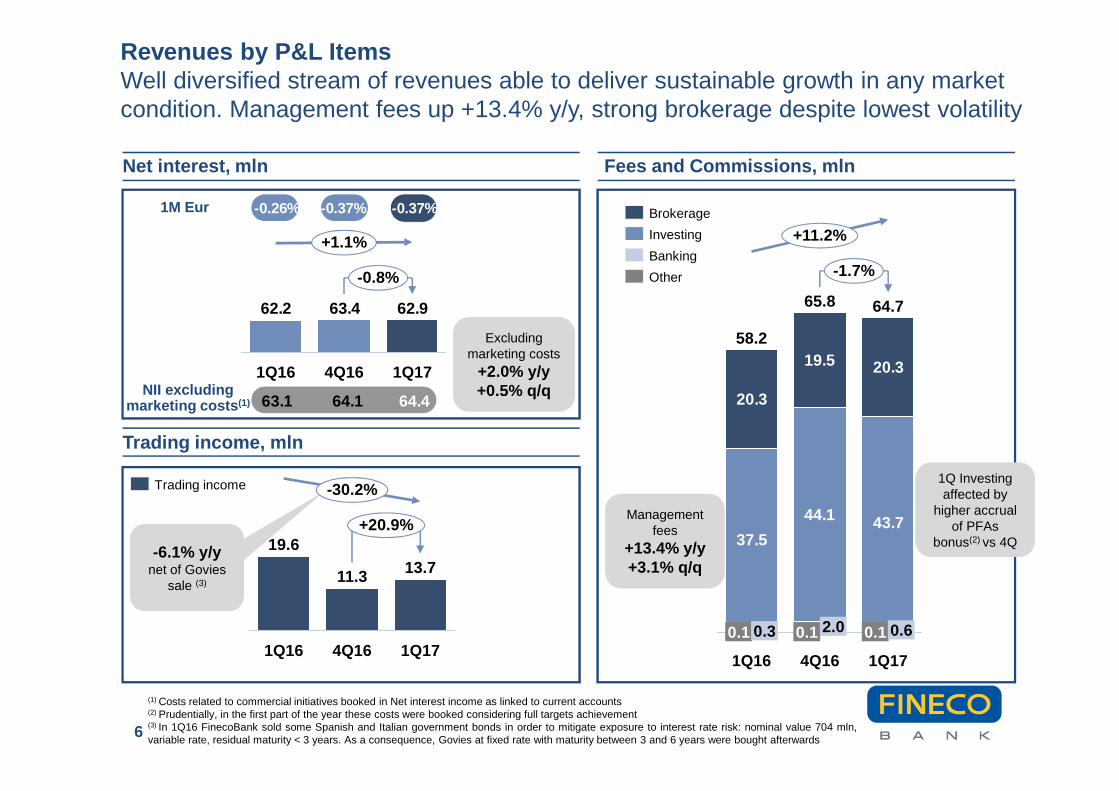
Revenues by P&L ItemsWell diversified stream of revenues able to deliver sustainable growth in any market condition. Management fees up +13.4% y/y, strong brokerage despite lowest volatility
Net interest, mln
Trading income, mln
62.963.462.2
-0.8%
+1.1%
1Q174Q161Q16
6
37.5
44.1 43.7
20.3
19.5 20.3
+11.2%
-1.7%
1Q17
64.7
0.1 0.6
4Q16
65.8
0.1 2.0
1Q16
58.2
0.1 0.3
1M Eur
Other
Banking
Investing
Brokerage-0.26% -0.37%
(1) Costs related to commercial initiatives booked in Net interest income as linked to current accounts(2) Prudentially, in the first part of the year these costs were booked considering full targets achievement(3) In 1Q16 FinecoBank sold some Spanish and Italian government bonds in order to mitigate exposure to interest rate risk: nominal value 704 mln,variable rate, residual maturity < 3 years. As a consequence, Govies at fixed rate with maturity between 3 and 6 years were bought afterwards
-0.37%
-6.1% y/ynet of Govies
sale (3)
13.7
+20.9%
-30.2%
1Q174Q16
11.3
1Q16
19.6
Trading income
Management fees
+13.4% y/y +3.1% q/q
NII excluding marketing costs (1)
Excluding marketing costs
+2.0% y/y +0.5% q/q
63.1 64.1 64.4
1Q Investing affected by
higher accrual of PFAs
bonus(2) vs 4Q
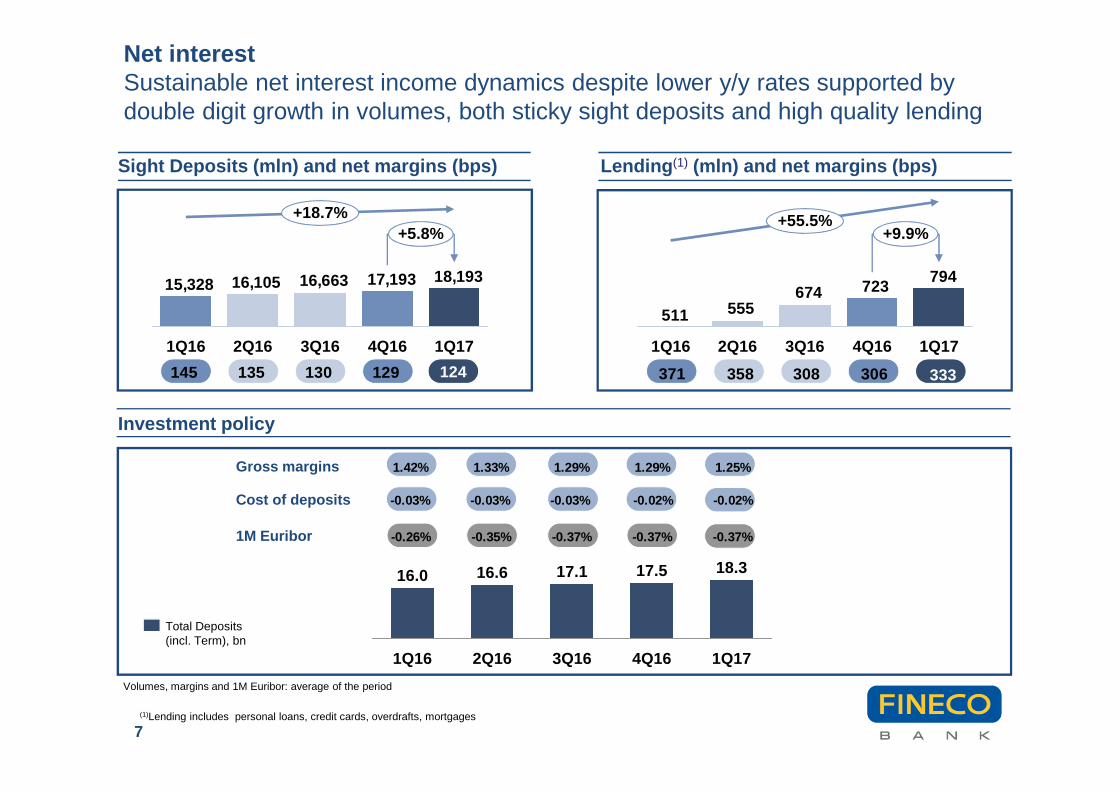
Net interestSustainable net interest income dynamics despite lower y/y rates supported by double digit growth in volumes, both sticky sight deposits and high quality lending
Investment policy
Sight Deposits (mln) and net margins (bps)
18,19317,19316,66316,10515,328
+5.8%+18.7%
1Q174Q163Q162Q161Q16
7
1Q17
18.3
4Q16
17.5
3Q16
17.1
2Q16
16.6
1Q16
16.0
Total Deposits(incl. Term), bn
Gross margins
Cost of deposits
Volumes, margins and 1M Euribor: average of the period
1M Euribor
Lending (1) (mln) and net margins (bps)
145 135 130 129
1.42% 1.33% 1.29% 1.29% 1.25%
-0.03% -0.03% -0.03% -0.02% -0.02%
-0.26% -0.35% -0.37% -0.37% -0.37%
124
723674555511
794
4Q163Q162Q161Q16
+9.9%+55.5%
1Q17
(1)Lending includes personal loans, credit cards, overdrafts, mortgages
371 358 308 306 333
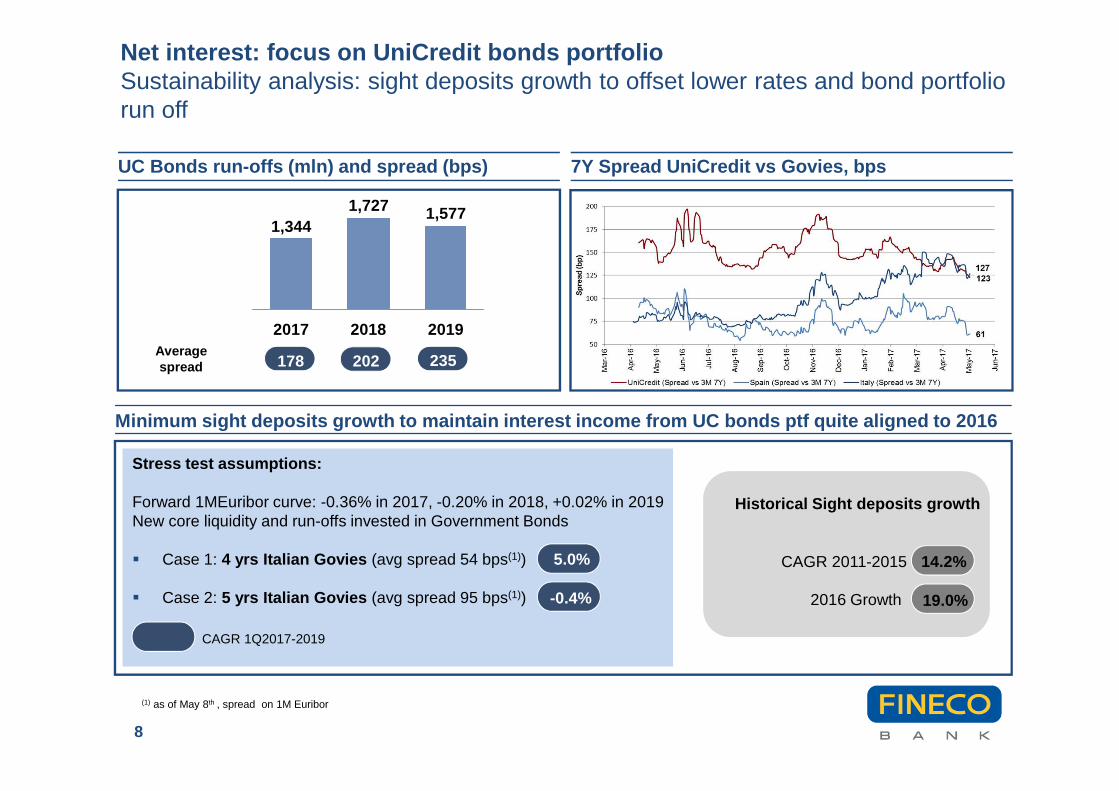
Net interest: focus on UniCredit bonds portfolioSustainability analysis: sight deposits growth to offset lower rates and bond portfolio run off
UC Bonds run-offs (mln) and spread (bps)
8
Average spread
Minimum sight deposits growth to maintain interest income from UC bonds ptf quite aligned to 2016
2019
1,577
2018
1,727
2017
1,344
202
CAGR 2011-2015 14.2%
2016 Growth 19.0%
5.0%
178 202 235
Stress test assumptions:
Forward 1MEuribor curve: -0.36% in 2017, -0.20% in 2018, +0.02% in 2019New core liquidity and run-offs invested in Government Bonds
� Case 1: 4 yrs Italian Govies (avg spread 54 bps(1))
� Case 2: 5 yrs Italian Govies (avg spread 95 bps(1)) -0.4%
Historical Sight deposits growth
CAGR 1Q2017-2019
(1) as of May 8th , spread on 1M Euribor
7Y Spread UniCredit vs Govies, bps
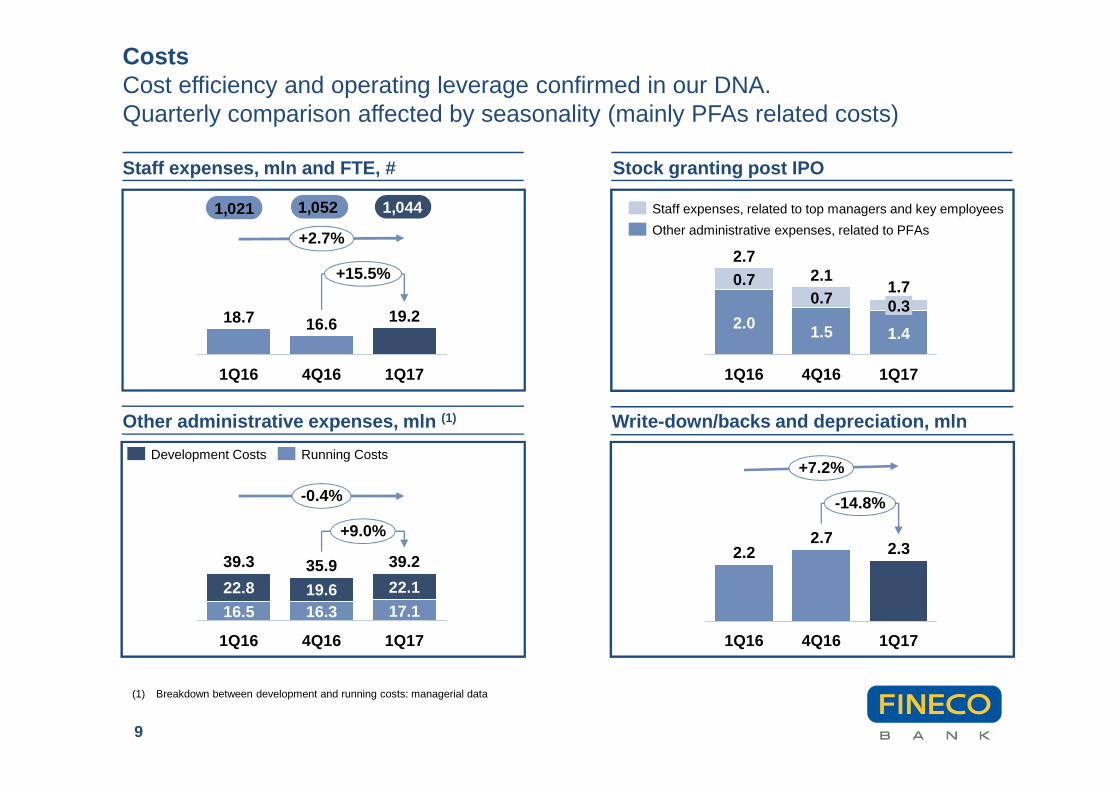
Other administrative expenses, mln (1)
Stock granting post IPOStaff expenses, mln and FTE, #
+2.7%
+15.5%
1Q17
19.2
4Q16
16.6
1Q16
18.7
9
(1) Breakdown between development and running costs: managerial data
1Q17
1.7
1.4
0.3
4Q16
2.1
1.5
0.7
1Q16
2.7
2.0
0.7
Other administrative expenses, related to PFAs
Staff expenses, related to top managers and key employees
+9.0%
-0.4%
1Q17
39.2
17.1
22.1
4Q16
35.9
16.319.6
1Q16
39.3
16.5
22.8
Running CostsDevelopment Costs
Write-down/backs and depreciation, mln
-14.8%
+7.2%
1Q17
2.3
4Q16
2.7
1Q16
2.2
CostsCost efficiency and operating leverage confirmed in our DNA.Quarterly comparison affected by seasonality (mainly PFAs related costs)
1,021 1,052 1,044
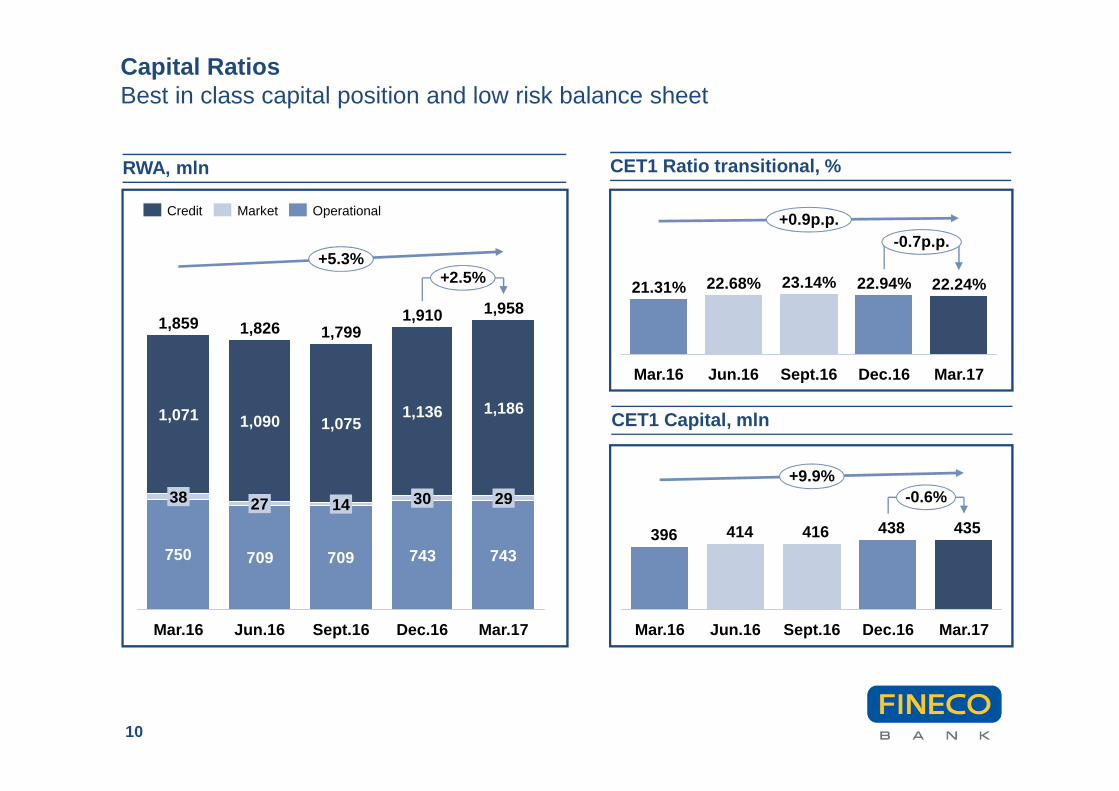
Capital RatiosBest in class capital position and low risk balance sheet
RWA, mln
CET1 Capital, mln
750 709 709 743 743
+2.5%+5.3%
Mar.17
1,958
29
1,186
Dec.16
1,910
30
1,136
Sept.16
1,799
14
1,075
Jun.16
1,826
27
1,090
Mar.16
1,859
38
1,071
435438416414396
+9.9%-0.6%
Mar.17Dec.16Sept.16Jun.16Mar.16
CET1 Ratio transitional, %
OperationalMarketCredit
10
+0.9p.p.-0.7p.p.
Mar.17
22.24%
Dec.16Sept.16
22.94%
Jun.16Mar.16
23.14%22.68%21.31%
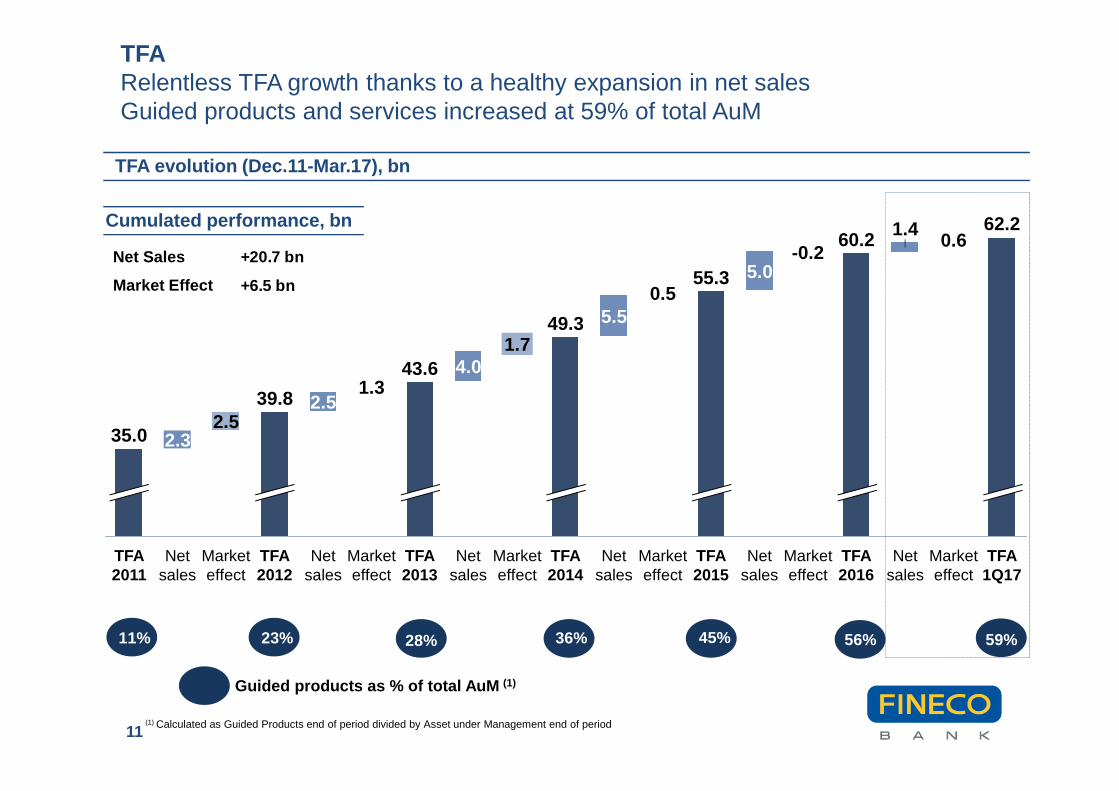
TFARelentless TFA growth thanks to a healthy expansion in net salesGuided products and services increased at 59% of total AuM
49.3
Market effect
1.7
Net sales
4.0
TFA2013
43.6
Market effect
1.3
Net sales
2.5
TFA2012
39.8
Market effect
2.5
Net sales
2.3
55.3
35.0
TFA2015
5.0
Net sales
-0.2
Market effect
60.2
TFA2016
1.4
Market effect
Net sales
0.6
Market effect
62.2
TFA1Q17
0.5
Net sales
5.5
TFA2014
TFA2011
Guided products as % of total AuM (1)
Net Sales
Market Effect
TFA evolution (Dec.11-Mar.17), bn
Cumulated performance, bn
11
36%23%11% 45%28%
(1) Calculated as Guided Products end of period divided by Asset under Management end of period
56%
+20.7 bn
+6.5 bn
59%
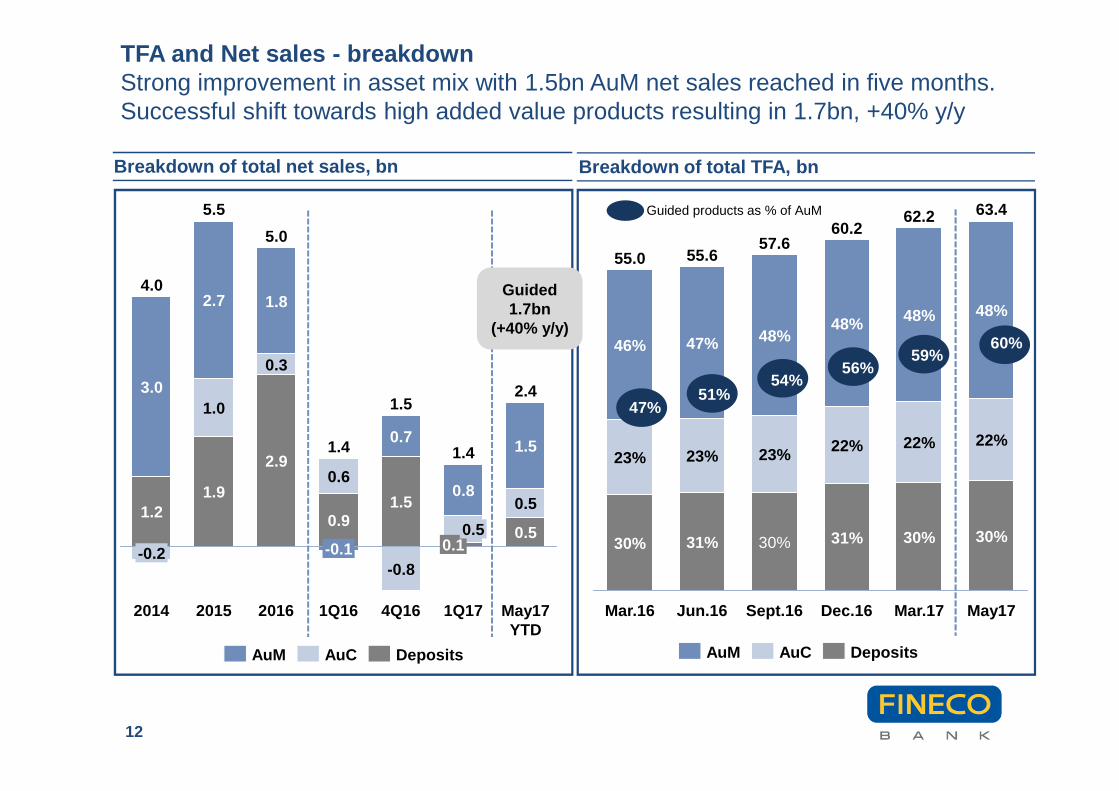
Breakdown of total net sales, bn Breakdown of total TFA, bn
May17 YTD
2.4
0.5
0.5
1.5
1Q17
1.4
0.10.5
0.8
4Q16
1.5
1.5
-0.8
0.7
1Q16
1.4
0.9
0.6
-0.1
2016
5.0
2.9
0.3
1.8
2015
5.5
1.9
1.0
2.7
2014
4.0
1.2
-0.2
3.0
DepositsAuCAuM
12
Guided products as % of AuM
May17
63.4
30%
22%
48%
Mar.17
62.2
30%
22%
48%
Dec.16
60.2
31%
22%
48%
Sept.16
57.6
30%
23%
48%
Jun.16
55.6
31%
23%
47%
Mar.16
55.0
30%
23%
46%
TFA and Net sales - breakdownStrong improvement in asset mix with 1.5bn AuM net sales reached in five months.Successful shift towards high added value products resulting in 1.7bn, +40% y/y
DepositsAuCAuM
47%51%
54%
59%
Guided 1.7bn
(+40% y/y)
56%
60%
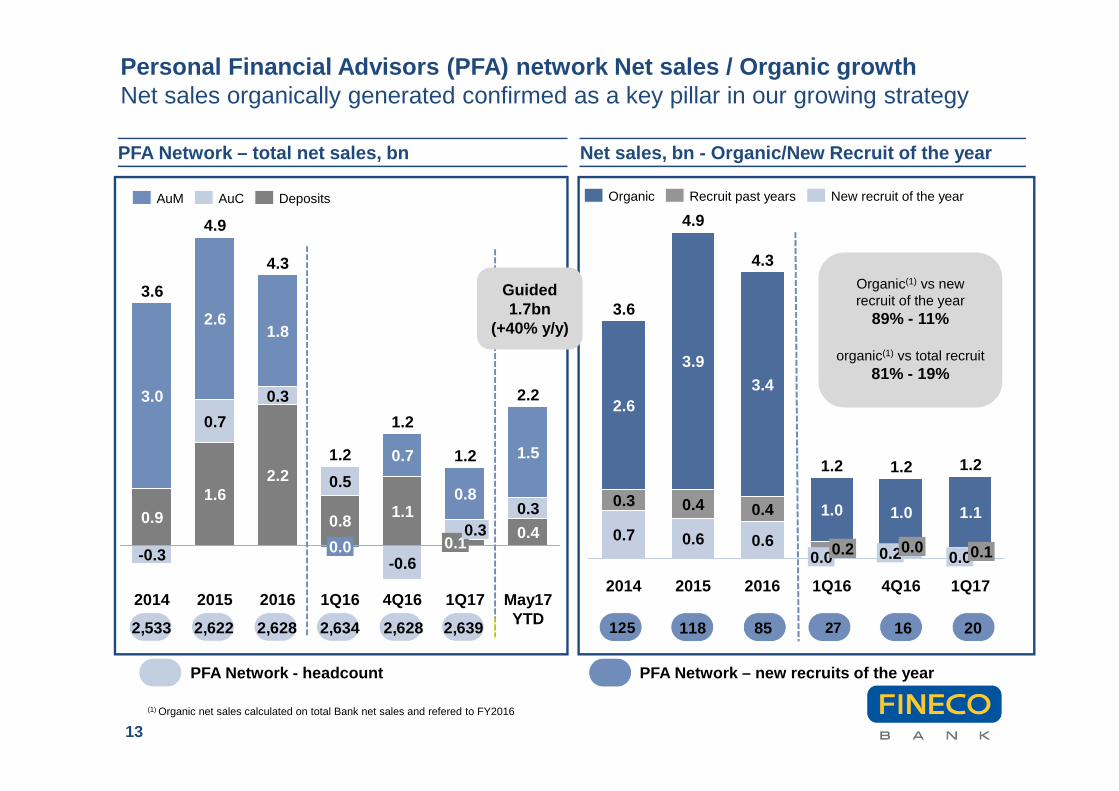
Personal Financial Advisors (PFA) network Net sales / Organic growthNet sales organically generated confirmed as a key pillar in our growing strategy
PFA Network – total net sales, bn
May17 YTD
2.2
0.4
0.3
1.5
1Q17
1.2
0.10.3
0.8
4Q16
1.2
1.1
-0.6
0.7
1Q16
1.2
0.8
0.5
0.0
2016
4.3
2.2
0.3
1.8
2015
4.9
1.6
0.7
2.6
2014
3.6
0.9
-0.3
3.0
DepositsAuCAuM
Net sales, bn - Organic/New Recruit of the year
1Q17
1.2
0.00.1
1.1
4Q16
1.2
0.20.0
1.0
1Q16
1.2
0.00.2
1.0
2016
4.3
0.6
0.4
3.4
2015
4.9
0.6
0.4
3.9
2014
3.6
0.7
0.3
2.6
13
PFA Network - headcount
New recruit of the yearRecruit past yearsOrganic
PFA Network – new recruits of the year
2,533 2,622 2,628 2,634 2,628 125 118 85 27 16 202,639
Organic(1) vs new recruit of the year
89% - 11%
organic(1) vs total recruit81% - 19%
Guided 1.7bn
(+40% y/y)
(1) Organic net sales calculated on total Bank net sales and refered to FY2016
Fineco Results
Focus on product areas
14
Agenda
Key messages and Initiatives monitoring
Banking, mln
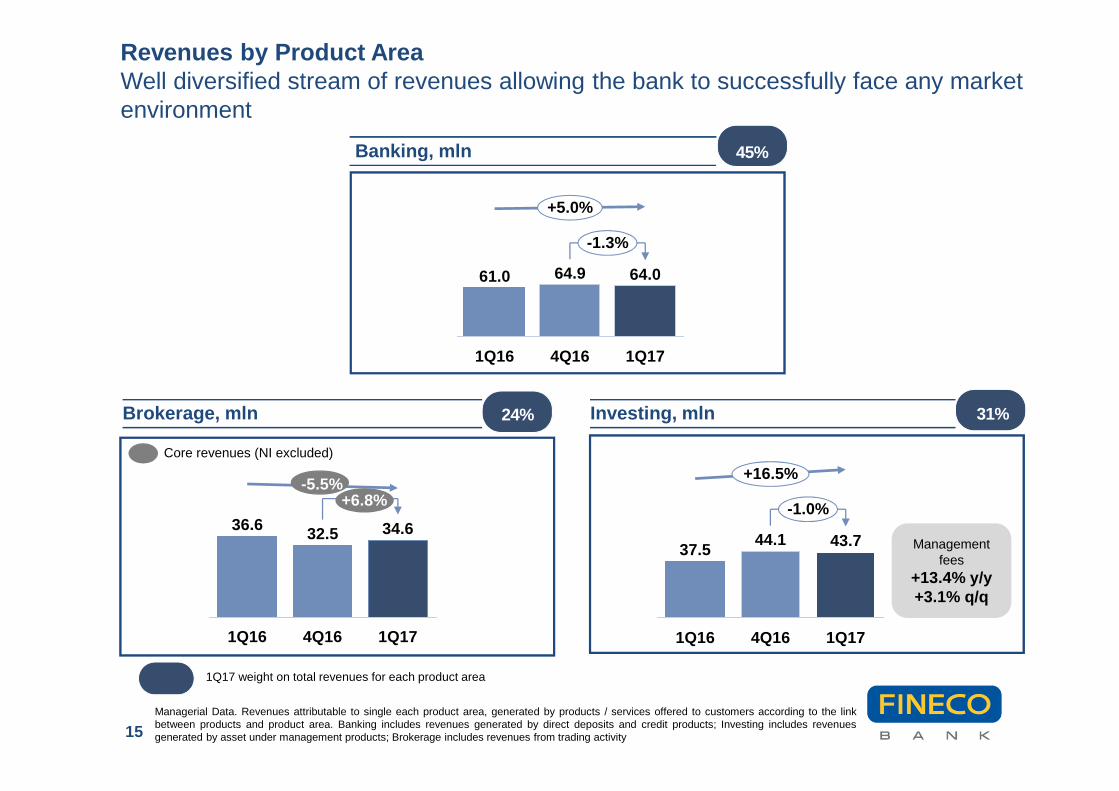
Revenues by Product AreaWell diversified stream of revenues allowing the bank to successfully face any market environment
+5.0%
-1.3%
1Q17
64.0
4Q16
64.9
1Q16
61.0
Investing, mlnBrokerage, mln
-1.0%
+16.5%
1Q17
43.7
4Q16
44.1
1Q16
37.5
1Q17
34.6
4Q16
32.5
1Q16
36.6
15
1Q17 weight on total revenues for each product area
Managerial Data. Revenues attributable to single each product area, generated by products / services offered to customers according to the linkbetween products and product area. Banking includes revenues generated by direct deposits and credit products; Investing includes revenuesgenerated by asset under management products; Brokerage includes revenues from trading activity
Core revenues (NI excluded)
45%
31%24%
-5.5%+6.8%
Management fees
+13.4% y/y +3.1% q/q
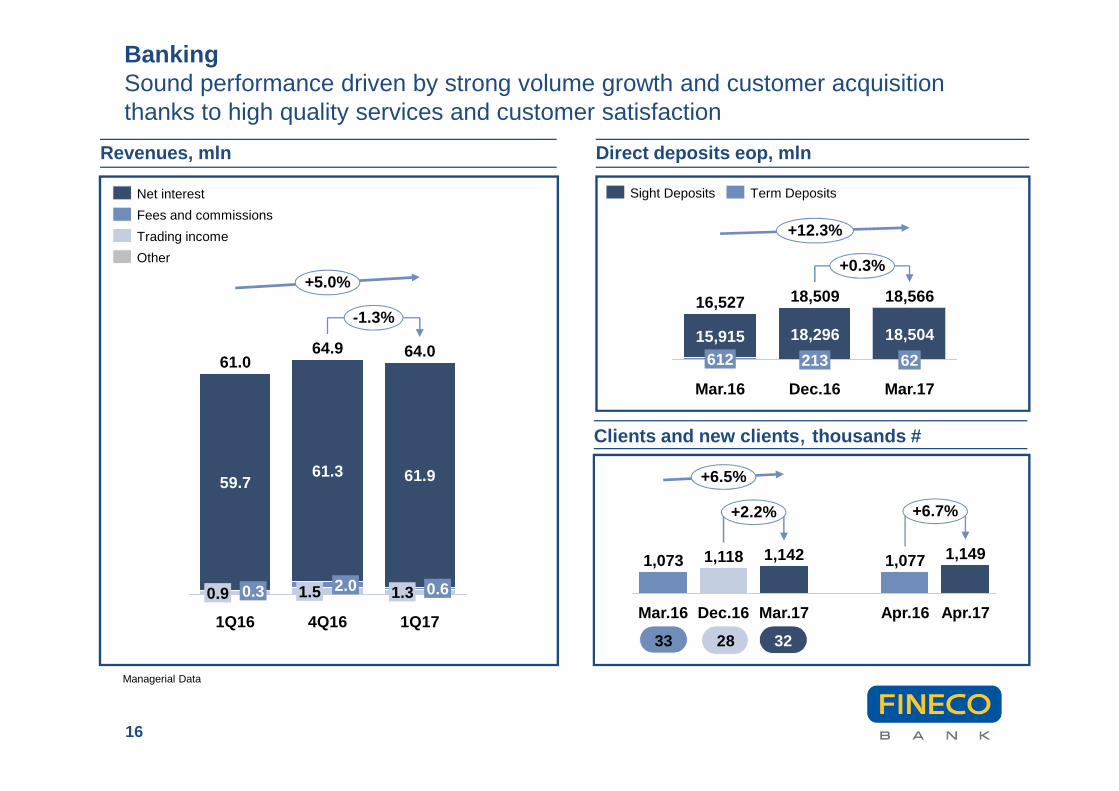
BankingSound performance driven by strong volume growth and customer acquisition thanks to high quality services and customer satisfaction
Revenues, mln Direct deposits eop, mln
Apr.17
1,077 1,149
Apr.16Dec.16 Mar.17
1,142
+6.5%
+2.2%
1,118
Mar.16
1,073
+6.7%
Clients and new clients , thousands #
+0.3%
+12.3%
Mar.17
18,509
213
Mar.16
18,296
18,566
62
Dec.16
18,504
16,527
61215,915
16
1Q17
-1.3%
+5.0%
0.3
59.7
0.9
61.3
2.01.5
64.9
1Q16
64.0
1.3
61.0
4Q16
0.6
61.9
Managerial Data
Term DepositsSight Deposits
Trading income
Fees and commissions
Net interest
Other
33 28 32
10.2
32.5
1Q17
2.834.6
1Q16
11.5
19.5
2.820.3
4Q16
3.036.6
13.3
20.3
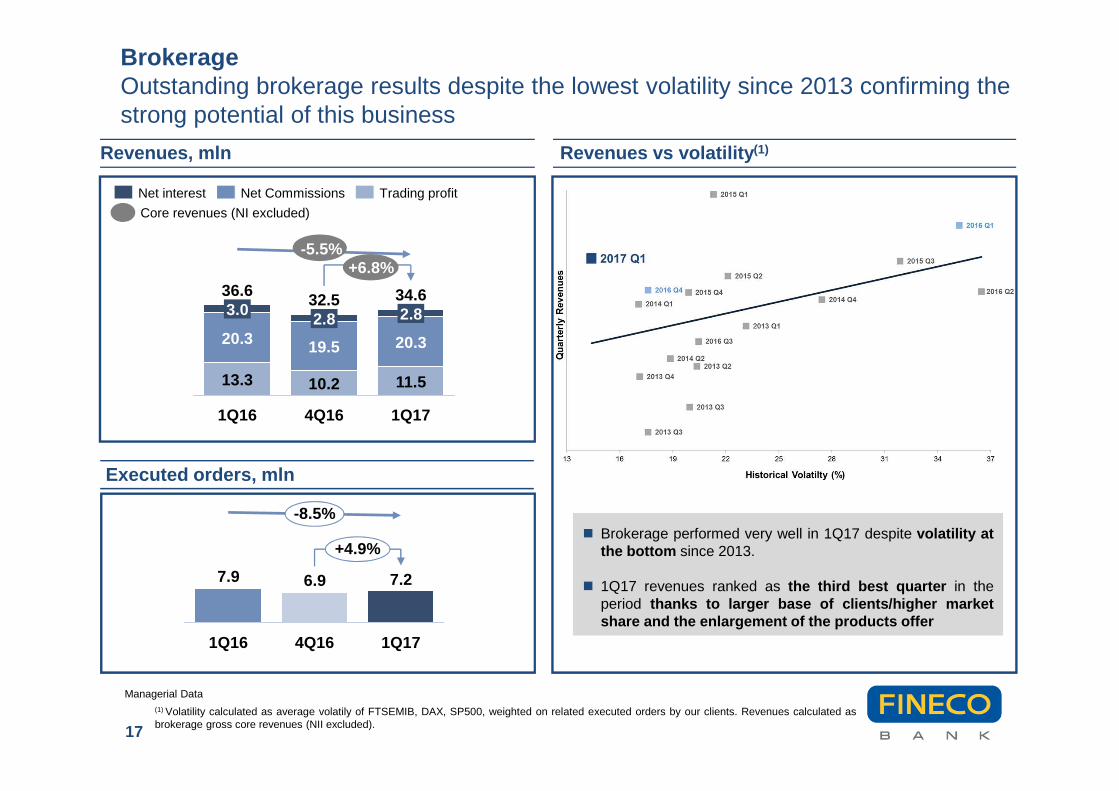
Revenues vs volatility (1)
Executed orders, mln
7.9 6.9
1Q17
-8.5%
+4.9%
7.2
4Q161Q16
17
Trading profitNet CommissionsNet interest
Managerial Data
Revenues, mln
+6.8%-5.5%
BrokerageOutstanding brokerage results despite the lowest volatility since 2013 confirming the strong potential of this business
Core revenues (NI excluded)
� Brokerage performed very well in 1Q17 despite volatility atthe bottom since 2013.
� 1Q17 revenues ranked as the third best quarter in theperiod thanks to larger base of clients/higher marketshare and the enlargement of the products offer
(1) Volatility calculated as average volatily of FTSEMIB, DAX, SP500, weighted on related executed orders by our clients. Revenues calculated asbrokerage gross core revenues (NII excluded).
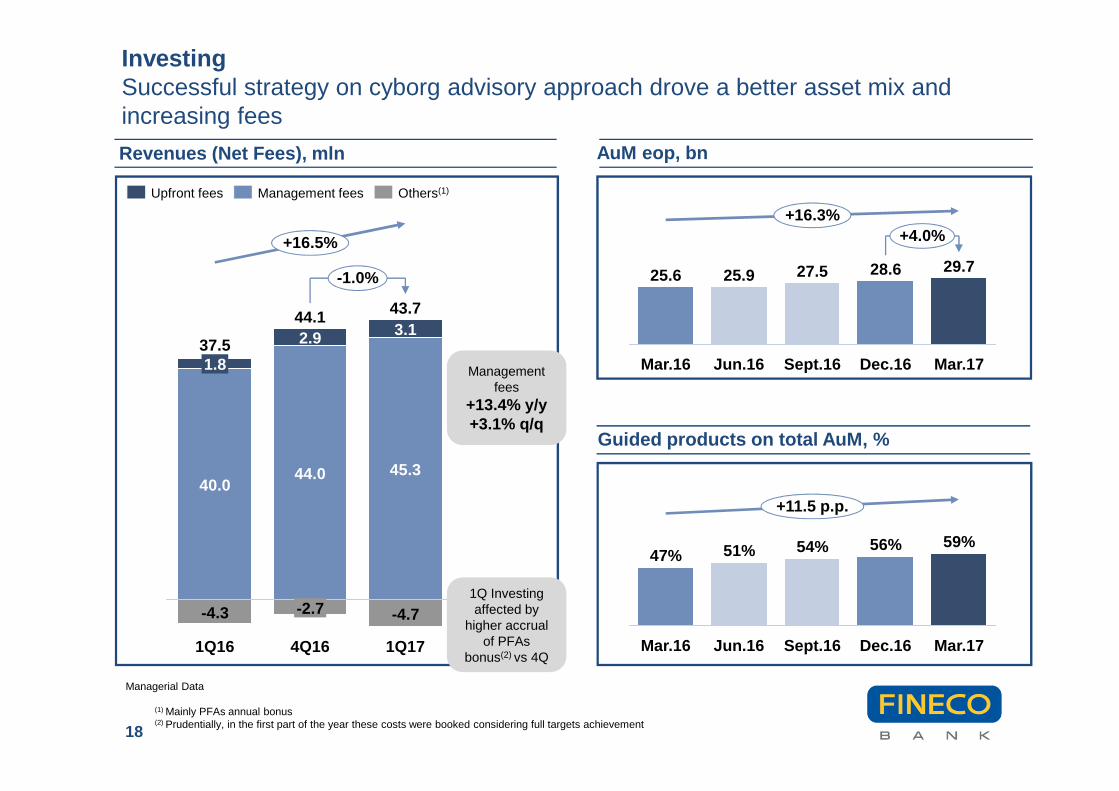
Revenues (Net Fees), mln AuM eop, bn
Guided products on total AuM, %
18
+16.3%+4.0%
Mar.17
29.7
Dec.16
28.6
Sept.16
27.5
Jun.16
25.9
Mar.16
25.6-1.0%
+16.5%
1Q17
43.7
-4.7
45.3
3.1
4Q16
44.1
-2.7
44.0
2.9
1Q16
37.5
-4.3
40.0
1.8
Others(1)Management feesUpfront fees
Managerial Data
+11.5 p.p.
Mar.17
59%
Dec.16
56%
Sept.16
54%
Jun.16
51%
Mar.16
47%
InvestingSuccessful strategy on cyborg advisory approach drove a better asset mix and increasing fees
Management fees
+13.4% y/y +3.1% q/q
(1) Mainly PFAs annual bonus(2) Prudentially, in the first part of the year these costs were booked considering full targets achievement
1Q Investing affected by
higher accrual of PFAs
bonus(2) vs 4Q
Fineco Results
Focus on product areas
19
Agenda
Key messages and Initiatives monitoring
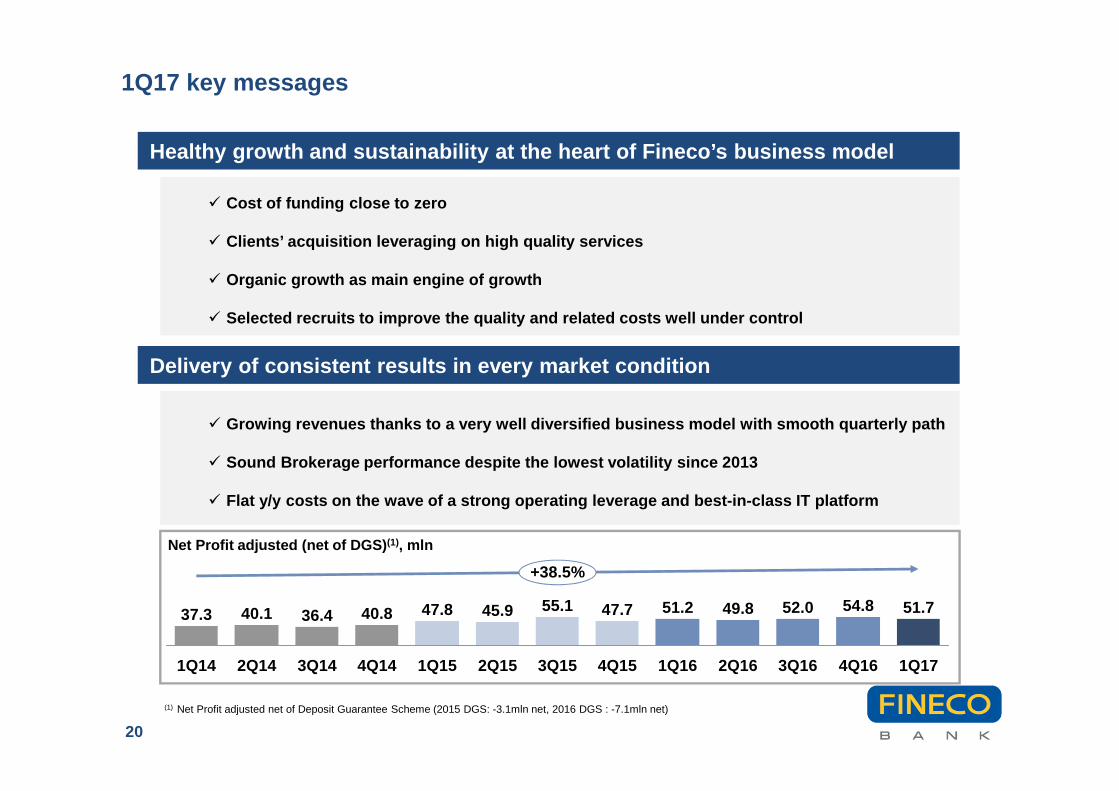
1Q17 key messages
20
� Cost of funding close to zero
� Clients’ acquisition leveraging on high quality ser vices
� Organic growth as main engine of growth
� Selected recruits to improve the quality and relate d costs well under control
(1) Net Profit adjusted net of Deposit Guarantee Scheme (2015 DGS: -3.1mln net, 2016 DGS : -7.1mln net)
Healthy growth and sustainability at the heart of F ineco’s business model
� Growing revenues thanks to a very well diversified business model with smooth quarterly path
� Sound Brokerage performance despite the lowest vola tility since 2013
� Flat y/y costs on the wave of a strong operating le verage and best-in-class IT platform
Delivery of consistent results in every market cond ition
+38.5%
4Q16
54.8
3Q16
52.0
2Q16
49.8
1Q16
51.2
4Q15
47.7
3Q15
55.1
2Q15
45.9
1Q15
47.8
4Q14
40.8
3Q14
36.4
2Q14
40.1
1Q14
37.3 51.7
1Q17
Net Profit adjusted (net of DGS) (1), mln

UK project
Initiatives monitoringStrong commitment in preparing the Bank for a big step forward in our sustainable process of growth
21
1 BANKING AREA
3EXPANSION
ABROAD
Implementation
Personal loans
Mortgages
Rolling Lombard
2 INVESTING AREA Private Banking
Increase productivity
Fineco Asset Management
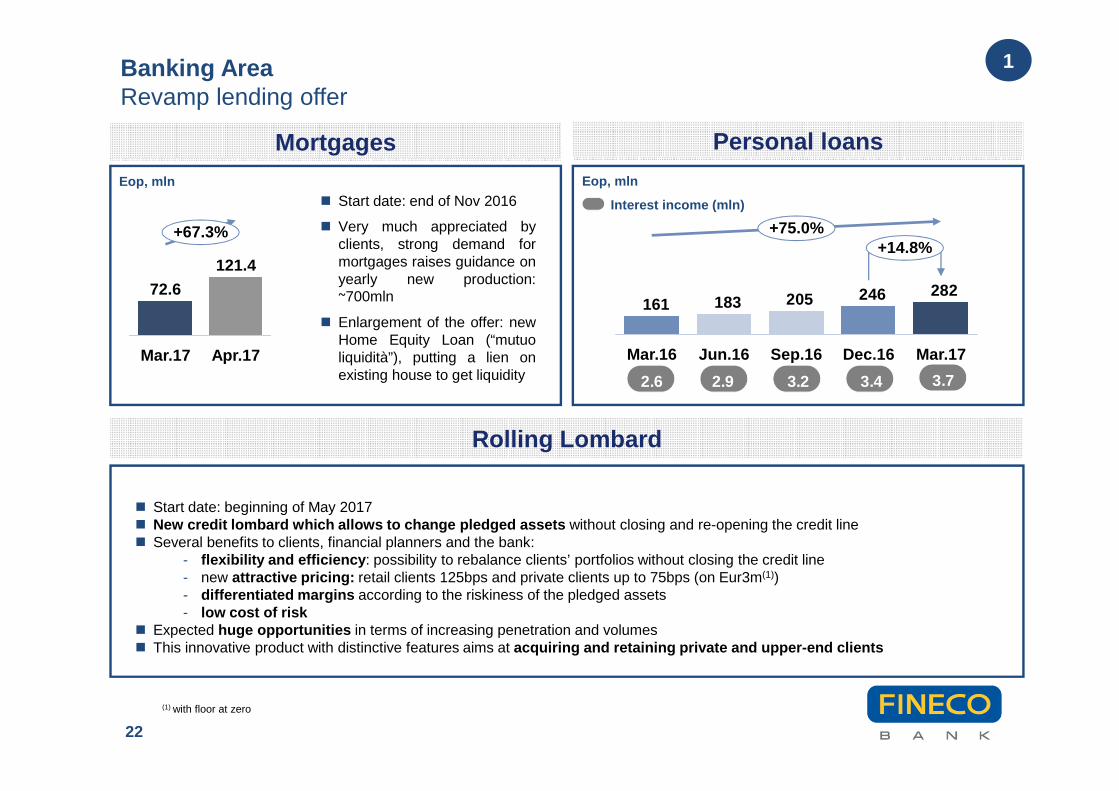
Banking AreaRevamp lending offer
22
Rolling Lombard
282246205183161
+14.8%+75.0%
Mar.17Dec.16Sep.16Jun.16Mar.16
Interest income (mln)
2.6 2.9 3.2 3.4 3.7
Apr.17
+67.3%
Mar.17
72.6
121.4
� Start date: end of Nov 2016
� Very much appreciated byclients, strong demand formortgages raises guidance onyearly new production:~700mln
� Enlargement of the offer: newHome Equity Loan (“mutuoliquidità”), putting a lien onexisting house to get liquidity
Personal loans
� Start date: beginning of May 2017� New credit lombard which allows to change pledged assets without closing and re-opening the credit line� Several benefits to clients, financial planners and the bank:
- flexibility and efficiency : possibility to rebalance clients’ portfolios without closing the credit line- new attractive pricing: retail clients 125bps and private clients up to 75bps (on Eur3m(1))- differentiated margins according to the riskiness of the pledged assets- low cost of risk
� Expected huge opportunities in terms of increasing penetration and volumes� This innovative product with distinctive features aims at acquiring and retaining private and upper-end clients
Eop, mlnEop, mln
1
Mortgages
(1) with floor at zero
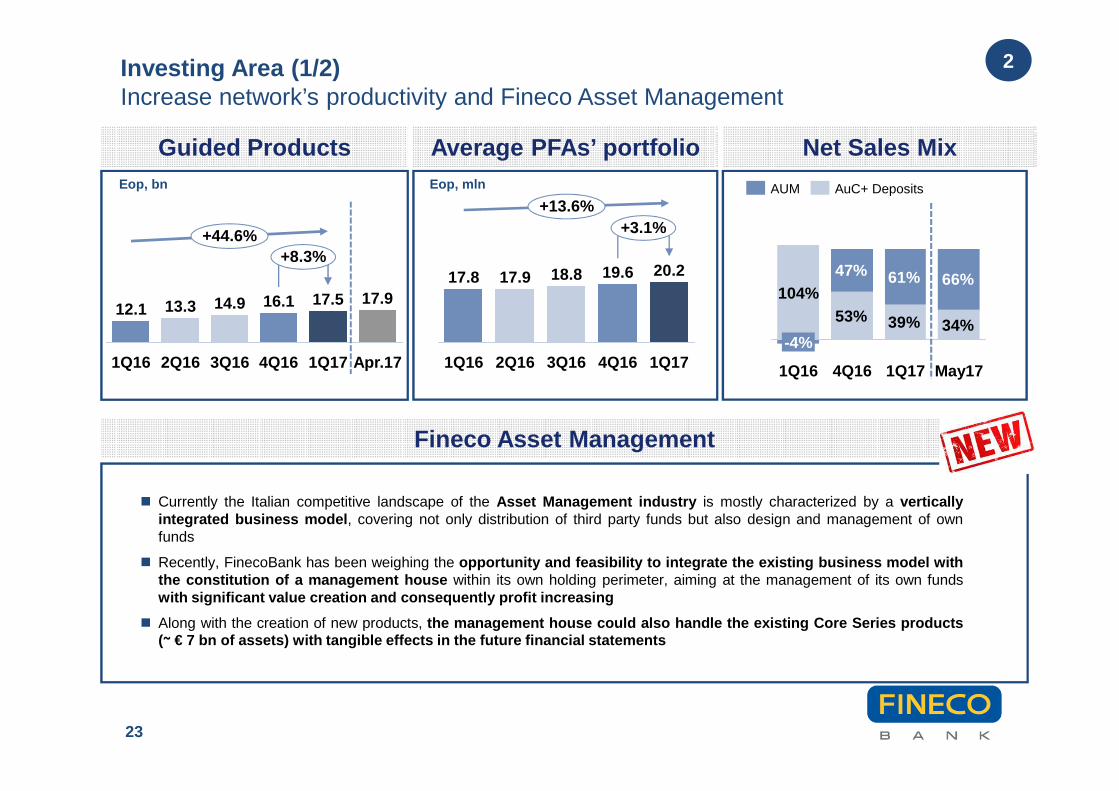
Investing Area (1/2)Increase network’s productivity and Fineco Asset Management
23
Average PFAs’ portfolio
2
Guided Products
+8.3%+44.6%
Apr.17
17.9
1Q17
17.5
4Q16
16.1
3Q16
14.9
2Q16
13.3
1Q16
12.1
Eop, bn
+3.1%+13.6%
1Q17
20.2
4Q16
19.6
3Q16
18.8
2Q16
17.9
1Q16
17.8
Net Sales Mix
Fineco Asset Management
� Currently the Italian competitive landscape of the Asset Management industry is mostly characterized by a verticallyintegrated business model , covering not only distribution of third party funds but also design and management of ownfunds
� Recently, FinecoBank has been weighing the opportunity and feasibility to integrate the existing busi ness model withthe constitution of a management house within its own holding perimeter, aiming at the management of its own fundswith significant value creation and consequently profit in creasing
� Along with the creation of new products, the management house could also handle the existing Core Ser ies products(~ € 7 bn of assets) with tangible effects in the future financia l statements
53% 39% 34%
47% 61% 66%
May171Q174Q161Q16
104%
-4%
AuC+ DepositsAUMEop, mln
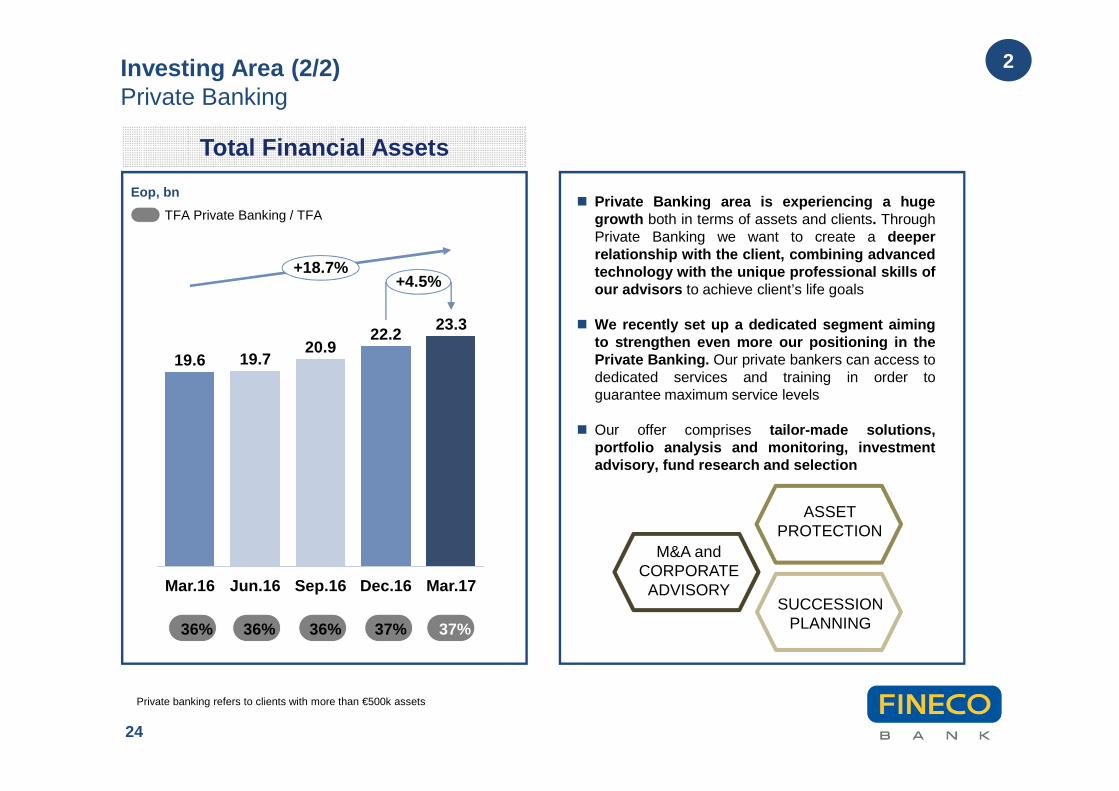
Investing Area (2/2)Private Banking
24
2
Private banking refers to clients with more than €500k assets
Total Financial Assets
+4.5%+18.7%
Mar.17
23.3
Dec.16
22.2
Sep.16
20.9
Jun.16
19.7
Mar.16
19.6
Eop, bn� Private Banking area is experiencing a huge
growth both in terms of assets and clients. ThroughPrivate Banking we want to create a deeperrelationship with the client, combining advancedtechnology with the unique professional skills ofour advisors to achieve client’s life goals
� We recently set up a dedicated segment aimingto strengthen even more our positioning in thePrivate Banking. Our private bankers can access todedicated services and training in order toguarantee maximum service levels
� Our offer comprises tailor-made solutions,portfolio analysis and monitoring, investmentadvisory, fund research and selection
TFA Private Banking / TFA
36% 36% 36% 37% 37%
ASSET PROTECTION
SUCCESSION PLANNING
M&A and CORPORATE
ADVISORY
25
3
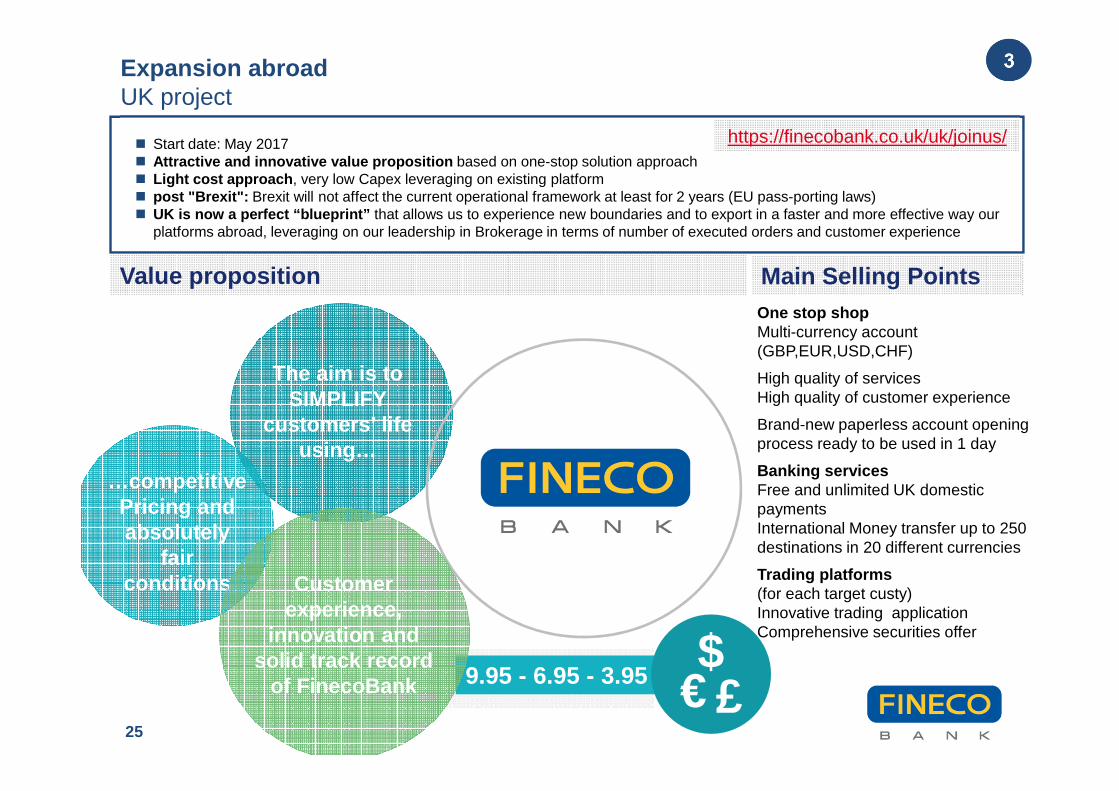
� Start date: May 2017� Attractive and innovative value proposition based on one-stop solution approach� Light cost approach , very low Capex leveraging on existing platform� post "Brexit": Brexit will not affect the current operational framework at least for 2 years (EU pass-porting laws)� UK is now a perfect “blueprint” that allows us to experience new boundaries and to export in a faster and more effective way our
platforms abroad, leveraging on our leadership in Brokerage in terms of number of executed orders and customer experience
One stop shopMulti-currency account (GBP,EUR,USD,CHF)
High quality of servicesHigh quality of customer experience
Brand-new paperless account opening process ready to be used in 1 day
Banking servicesFree and unlimited UK domestic payments International Money transfer up to 250 destinations in 20 different currencies
Trading platforms (for each target custy)Innovative trading applicationComprehensive securities offer
Main Selling Points
9.95 - 6.95 - 3.95
Customer Exeperience,
Innovation and solid track record
of Fineco Bank
…competitive Pricing and absolutely
fair conditions
The aim is to SIMPLIFY
customers’ life using…
Customerexperience,
innovation and solid track record
of FinecoBank €$£
Expansion abroadUK project
Value proposition
https://finecobank.co.uk/uk/joinus/

26
Annex
27
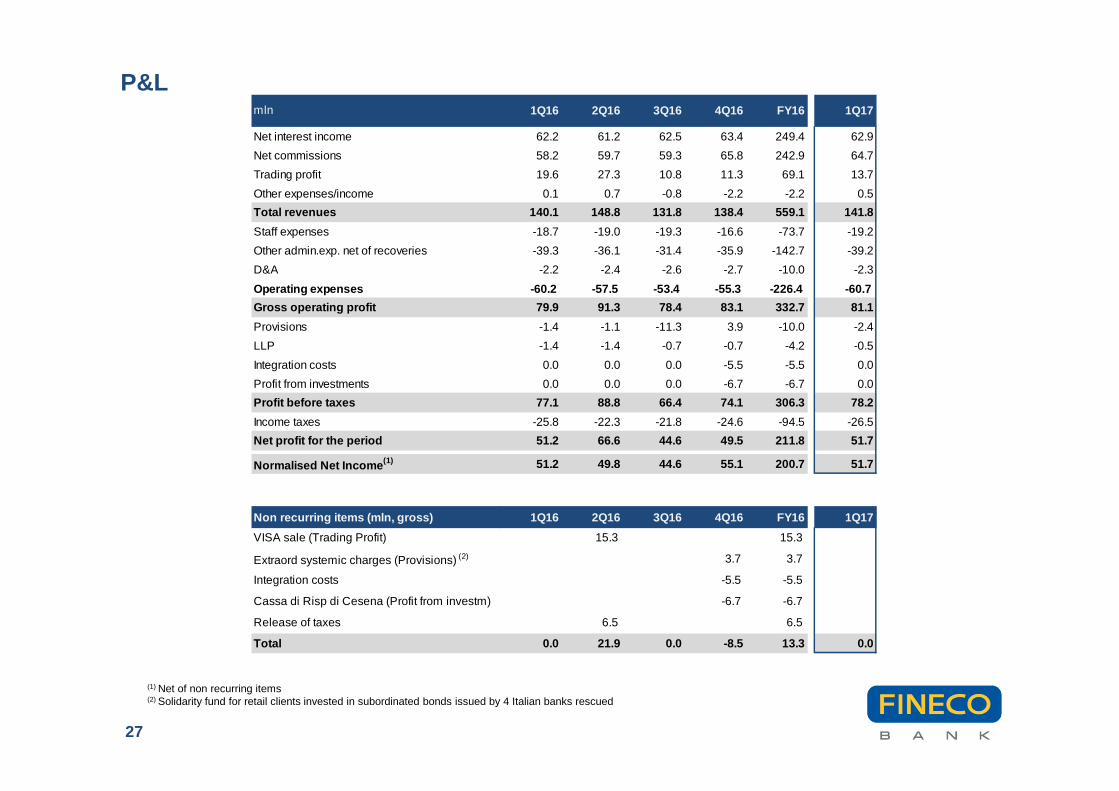
(1) Net of non recurring items(2) Solidarity fund for retail clients invested in subordinated bonds issued by 4 Italian banks rescued
P&Lmln 1Q16 2Q16 3Q16 4Q16 FY16 1Q17
Net interest income 62.2 61.2 62.5 63.4 249.4 62.9
Net commissions 58.2 59.7 59.3 65.8 242.9 64.7
Trading profit 19.6 27.3 10.8 11.3 69.1 13.7
Other expenses/income 0.1 0.7 -0.8 -2.2 -2.2 0.5
Total revenues 140.1 148.8 131.8 138.4 559.1 141.8
Staff expenses -18.7 -19.0 -19.3 -16.6 -73.7 -19.2
Other admin.exp. net of recoveries -39.3 -36.1 -31.4 -35.9 -142.7 -39.2
D&A -2.2 -2.4 -2.6 -2.7 -10.0 -2.3
Operating expenses -60.2 -57.5 -53.4 -55.3 -226.4 -60.7
Gross operating profit 79.9 91.3 78.4 83.1 332.7 81.1
Provisions -1.4 -1.1 -11.3 3.9 -10.0 -2.4
LLP -1.4 -1.4 -0.7 -0.7 -4.2 -0.5
Integration costs 0.0 0.0 0.0 -5.5 -5.5 0.0
Profit from investments 0.0 0.0 0.0 -6.7 -6.7 0.0
Profit before taxes 77.1 88.8 66.4 74.1 306.3 78.2
Income taxes -25.8 -22.3 -21.8 -24.6 -94.5 -26.5
Net profit for the period 51.2 66.6 44.6 49.5 211.8 51.7
Normalised Net Income (1) 51.2 49.8 44.6 55.1 200.7 51.7
Non recurring items (mln, gross) 1Q16 2Q16 3Q16 4Q16 FY1 6 1Q17
VISA sale (Trading Profit) 15.3 15.3
Extraord systemic charges (Provisions) (2) 3.7 3.7
Integration costs -5.5 -5.5
Cassa di Risp di Cesena (Profit from investm) -6.7 -6.7
Release of taxes 6.5 6.5
Total 0.0 21.9 0.0 -8.5 13.3 0.0
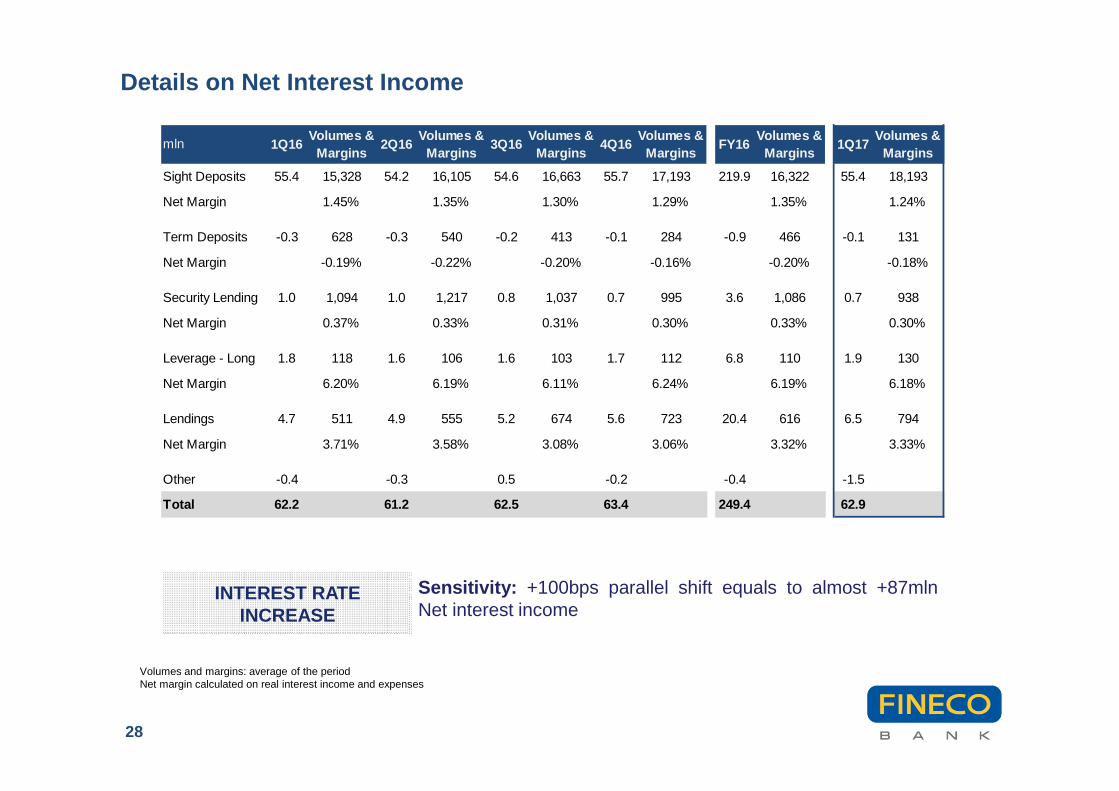
Details on Net Interest Income
28
Volumes and margins: average of the period Net margin calculated on real interest income and expenses
mln 1Q16Volumes &
Margins2Q16
Volumes & Margins
3Q16Volumes &
Margins4Q16
Volumes & Margins
FY16Volumes &
Margins1Q17
Volumes & Margins
Sight Deposits 55.4 15,328 54.2 16,105 54.6 16,663 55.7 17,193 219.9 16,322 55.4 18,193
Net Margin 1.45% 1.35% 1.30% 1.29% 1.35% 1.24%
Term Deposits -0.3 628 -0.3 540 -0.2 413 -0.1 284 -0.9 466 -0.1 131
Net Margin -0.19% -0.22% -0.20% -0.16% -0.20% -0.18%
Security Lending 1.0 1,094 1.0 1,217 0.8 1,037 0.7 995 3.6 1,086 0.7 938
Net Margin 0.37% 0.33% 0.31% 0.30% 0.33% 0.30%
Leverage - Long 1.8 118 1.6 106 1.6 103 1.7 112 6.8 110 1.9 130
Net Margin 6.20% 6.19% 6.11% 6.24% 6.19% 6.18%
Lendings 4.7 511 4.9 555 5.2 674 5.6 723 20.4 616 6.5 794
Net Margin 3.71% 3.58% 3.08% 3.06% 3.32% 3.33%
Other -0.4 -0.3 0.5 -0.2 -0.4 -1.5
Total 62.2 61.2 62.5 63.4 249.4 62.9
INTEREST RATE INCREASE
Sensitivity: +100bps parallel shift equals to almost +87mlnNet interest income
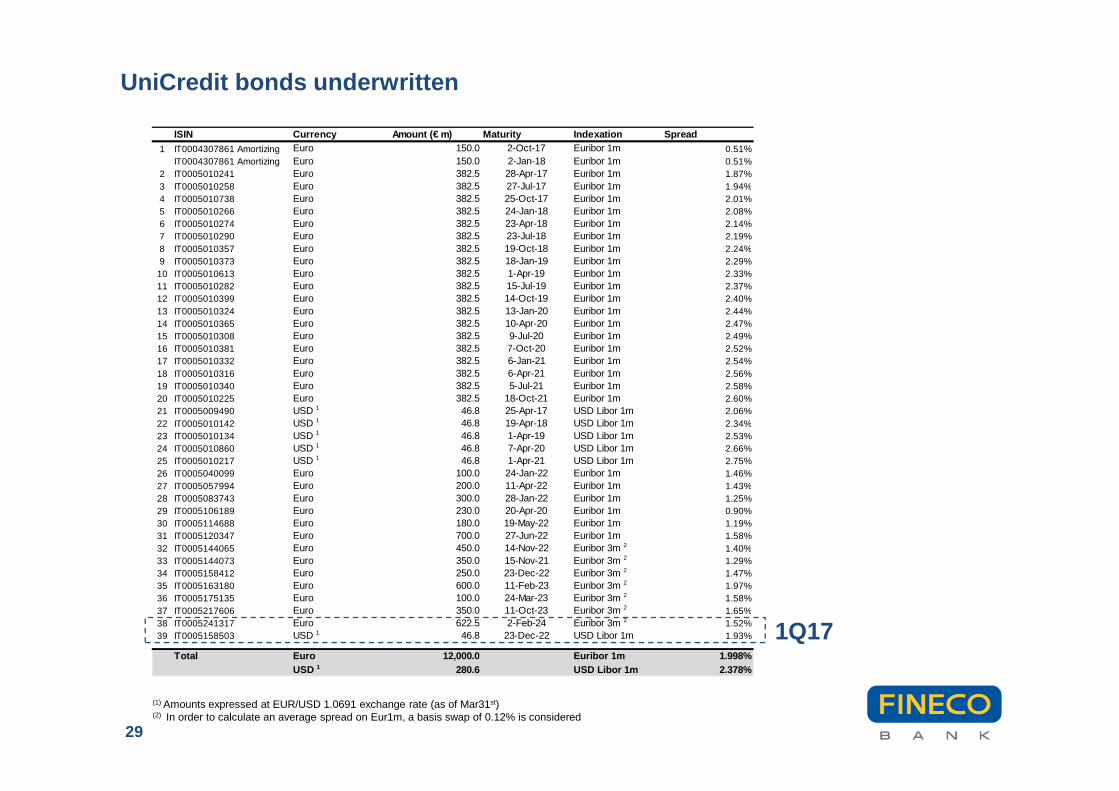
ISIN Currency Amount (€ m) Maturity Indexation Spread1 IT0004307861 Amortizing Euro 150.0 2-Oct-17 Euribor 1m 0.51%
IT0004307861 Amortizing Euro 150.0 2-Jan-18 Euribor 1m 0.51%2 IT0005010241 Euro 382.5 28-Apr-17 Euribor 1m 1.87%3 IT0005010258 Euro 382.5 27-Jul-17 Euribor 1m 1.94%4 IT0005010738 Euro 382.5 25-Oct-17 Euribor 1m 2.01%5 IT0005010266 Euro 382.5 24-Jan-18 Euribor 1m 2.08%6 IT0005010274 Euro 382.5 23-Apr-18 Euribor 1m 2.14%7 IT0005010290 Euro 382.5 23-Jul-18 Euribor 1m 2.19%8 IT0005010357 Euro 382.5 19-Oct-18 Euribor 1m 2.24%9 IT0005010373 Euro 382.5 18-Jan-19 Euribor 1m 2.29%
10 IT0005010613 Euro 382.5 1-Apr-19 Euribor 1m 2.33%11 IT0005010282 Euro 382.5 15-Jul-19 Euribor 1m 2.37%12 IT0005010399 Euro 382.5 14-Oct-19 Euribor 1m 2.40%13 IT0005010324 Euro 382.5 13-Jan-20 Euribor 1m 2.44%14 IT0005010365 Euro 382.5 10-Apr-20 Euribor 1m 2.47%15 IT0005010308 Euro 382.5 9-Jul-20 Euribor 1m 2.49%16 IT0005010381 Euro 382.5 7-Oct-20 Euribor 1m 2.52%17 IT0005010332 Euro 382.5 6-Jan-21 Euribor 1m 2.54%18 IT0005010316 Euro 382.5 6-Apr-21 Euribor 1m 2.56%19 IT0005010340 Euro 382.5 5-Jul-21 Euribor 1m 2.58%20 IT0005010225 Euro 382.5 18-Oct-21 Euribor 1m 2.60%21 IT0005009490 USD 1 46.8 25-Apr-17 USD Libor 1m 2.06%22 IT0005010142 USD 1 46.8 19-Apr-18 USD Libor 1m 2.34%23 IT0005010134 USD 1 46.8 1-Apr-19 USD Libor 1m 2.53%24 IT0005010860 USD 1 46.8 7-Apr-20 USD Libor 1m 2.66%25 IT0005010217 USD 1 46.8 1-Apr-21 USD Libor 1m 2.75%26 IT0005040099 Euro 100.0 24-Jan-22 Euribor 1m 1.46%27 IT0005057994 Euro 200.0 11-Apr-22 Euribor 1m 1.43%28 IT0005083743 Euro 300.0 28-Jan-22 Euribor 1m 1.25%29 IT0005106189 Euro 230.0 20-Apr-20 Euribor 1m 0.90%30 IT0005114688 Euro 180.0 19-May-22 Euribor 1m 1.19%31 IT0005120347 Euro 700.0 27-Jun-22 Euribor 1m 1.58%32 IT0005144065 Euro 450.0 14-Nov-22 Euribor 3m 2 1.40%33 IT0005144073 Euro 350.0 15-Nov-21 Euribor 3m 2 1.29%34 IT0005158412 Euro 250.0 23-Dec-22 Euribor 3m 2 1.47%35 IT0005163180 Euro 600.0 11-Feb-23 Euribor 3m 2 1.97%36 IT0005175135 Euro 100.0 24-Mar-23 Euribor 3m 2 1.58%37 IT0005217606 Euro 350.0 11-Oct-23 Euribor 3m 2 1.65%38 IT0005241317 Euro 622.5 2-Feb-24 Euribor 3m 2 1.52%39 IT0005158503 USD 1 46.8 23-Dec-22 USD Libor 1m 1.93%
Total Euro 12,000.0 Euribor 1m 1.998 %USD 1 280.6 USD Libor 1m 2.378%
UniCredit bonds underwritten
29
(1) Amounts expressed at EUR/USD 1.0691 exchange rate (as of Mar31st)(2) In order to calculate an average spread on Eur1m, a basis swap of 0.12% is considered
1Q17
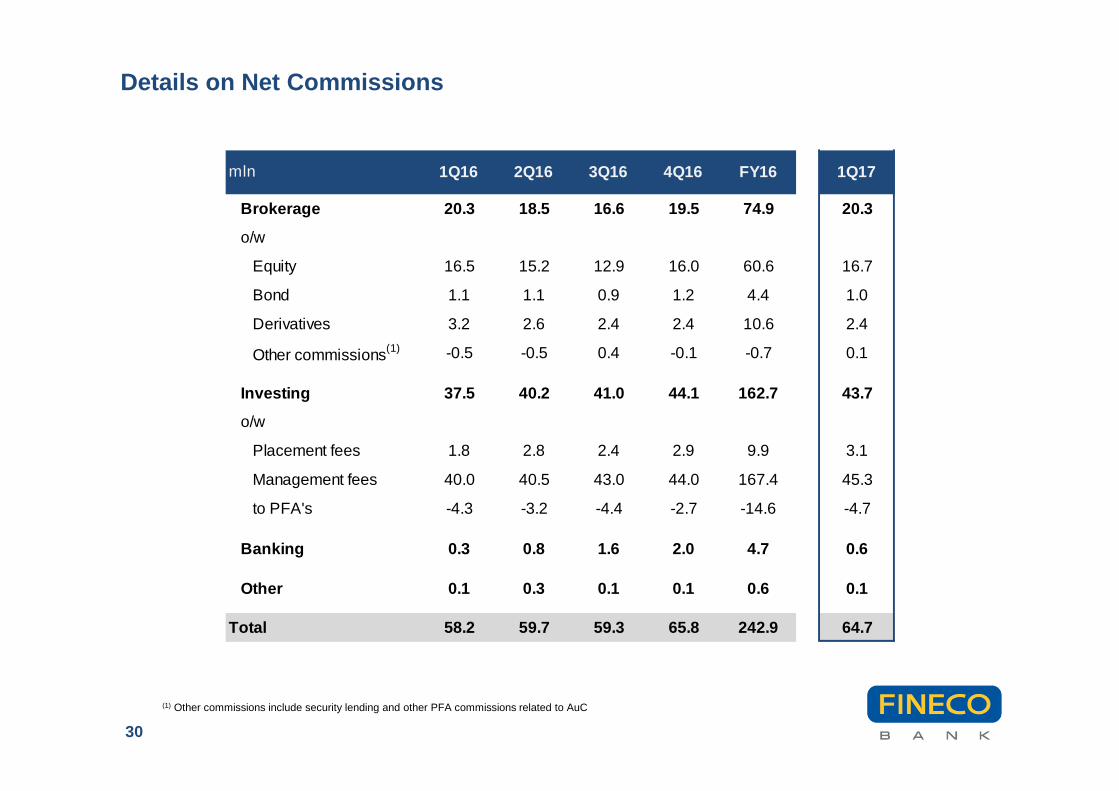
Details on Net Commissions
30
(1) Other commissions include security lending and other PFA commissions related to AuC
mln 1Q16 2Q16 3Q16 4Q16 FY16 1Q17
Brokerage 20.3 18.5 16.6 19.5 74.9 20.3
o/w
Equity 16.5 15.2 12.9 16.0 60.6 16.7
Bond 1.1 1.1 0.9 1.2 4.4 1.0
Derivatives 3.2 2.6 2.4 2.4 10.6 2.4
Other commissions(1) -0.5 -0.5 0.4 -0.1 -0.7 0.1
Investing 37.5 40.2 41.0 44.1 162.7 43.7
o/w
Placement fees 1.8 2.8 2.4 2.9 9.9 3.1
Management fees 40.0 40.5 43.0 44.0 167.4 45.3
to PFA's -4.3 -3.2 -4.4 -2.7 -14.6 -4.7
Banking 0.3 0.8 1.6 2.0 4.7 0.6
Other 0.1 0.3 0.1 0.1 0.6 0.1
Total 58.2 59.7 59.3 65.8 242.9 64.7
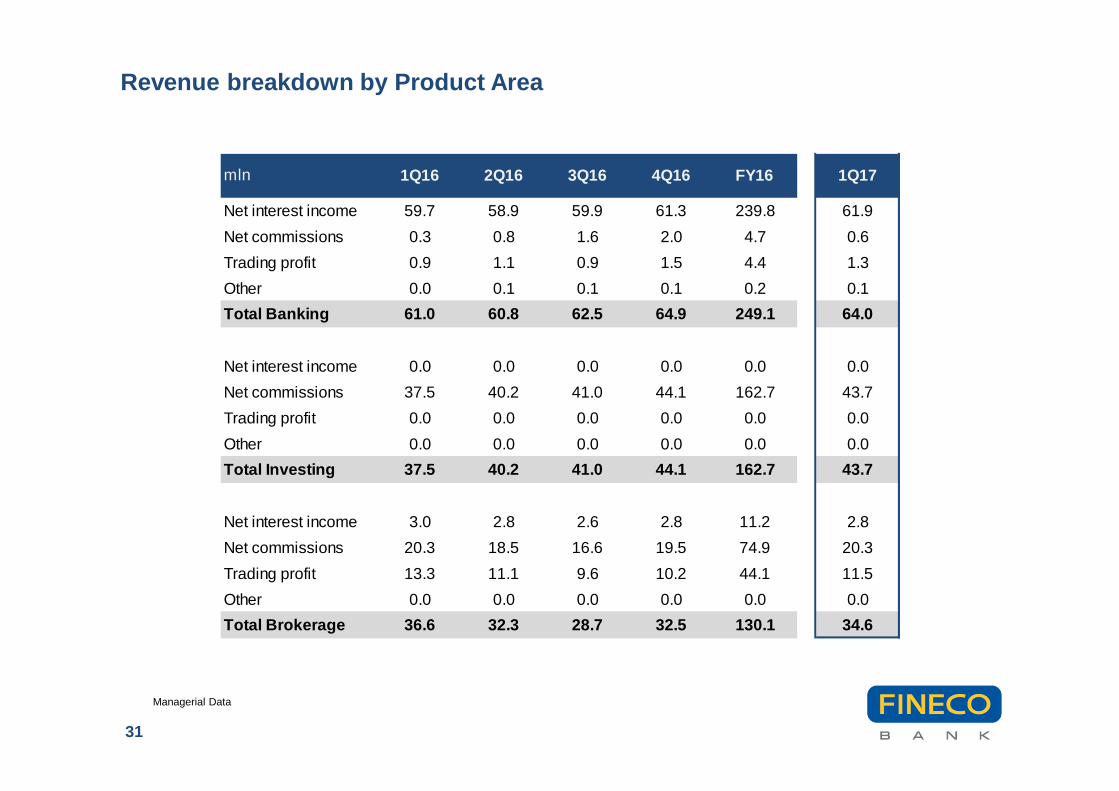
Revenue breakdown by Product Area
31
Managerial Data
mln 1Q16 2Q16 3Q16 4Q16 FY16 1Q17
Net interest income 59.7 58.9 59.9 61.3 239.8 61.9
Net commissions 0.3 0.8 1.6 2.0 4.7 0.6
Trading profit 0.9 1.1 0.9 1.5 4.4 1.3
Other 0.0 0.1 0.1 0.1 0.2 0.1
Total Banking 61.0 60.8 62.5 64.9 249.1 64.0
Net interest income 0.0 0.0 0.0 0.0 0.0 0.0
Net commissions 37.5 40.2 41.0 44.1 162.7 43.7
Trading profit 0.0 0.0 0.0 0.0 0.0 0.0
Other 0.0 0.0 0.0 0.0 0.0 0.0
Total Investing 37.5 40.2 41.0 44.1 162.7 43.7
Net interest income 3.0 2.8 2.6 2.8 11.2 2.8
Net commissions 20.3 18.5 16.6 19.5 74.9 20.3
Trading profit 13.3 11.1 9.6 10.2 44.1 11.5
Other 0.0 0.0 0.0 0.0 0.0 0.0
Total Brokerage 36.6 32.3 28.7 32.5 130.1 34.6
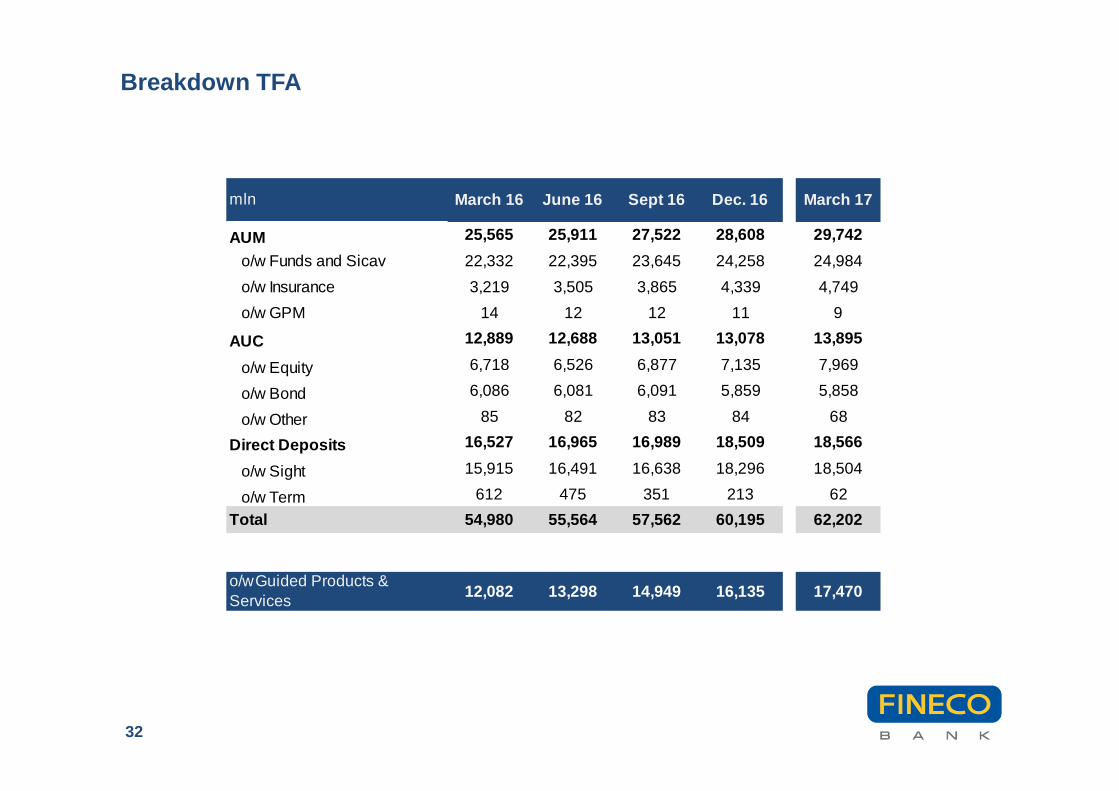
Breakdown TFA
32
mln March 16 June 16 Sept 16 Dec. 16 March 17
AUM 25,565 25,911 27,522 28,608 29,742
o/w Funds and Sicav 22,332 22,395 23,645 24,258 24,984
o/w Insurance 3,219 3,505 3,865 4,339 4,749
o/w GPM 14 12 12 11 9
AUC 12,889 12,688 13,051 13,078 13,895
o/w Equity 6,718 6,526 6,877 7,135 7,969
o/w Bond 6,086 6,081 6,091 5,859 5,858
o/w Other 85 82 83 84 68
Direct Deposits 16,527 16,965 16,989 18,509 18,566
o/w Sight 15,915 16,491 16,638 18,296 18,504
o/w Term 612 475 351 213 62
Total 54,980 55,564 57,562 60,195 62,202
o/w Guided Products & Services
12,082 13,298 14,949 16,135 17,470
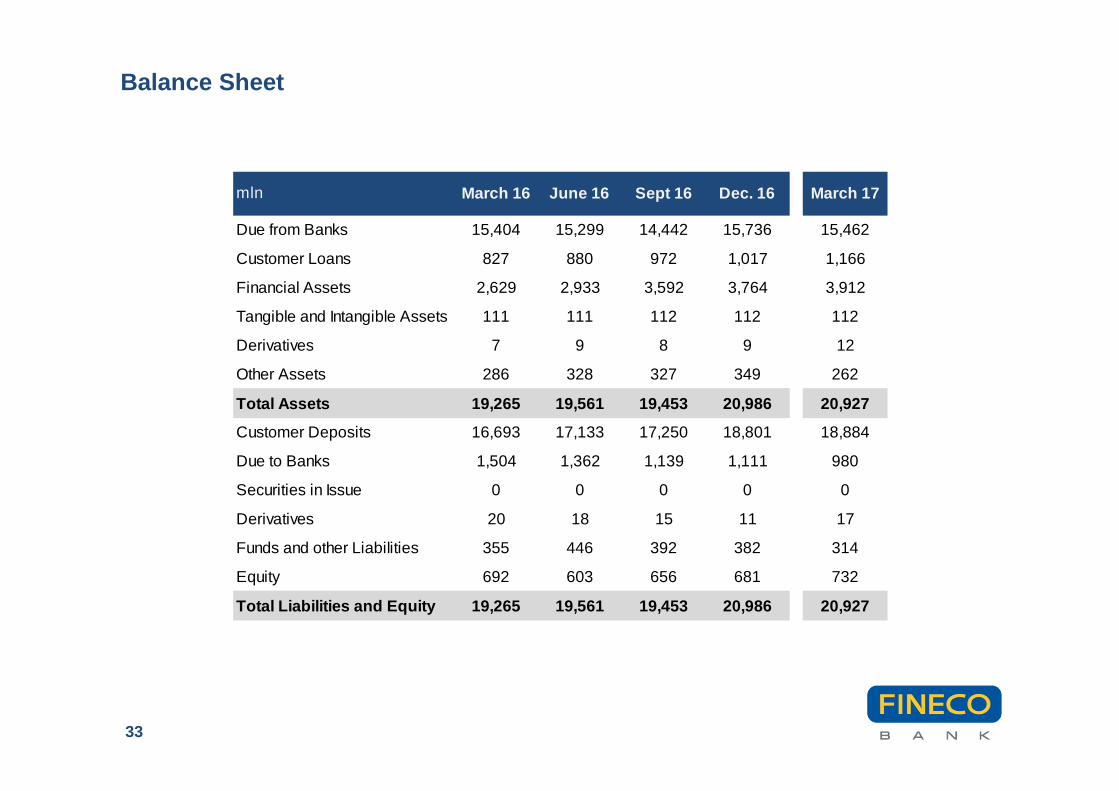
Balance Sheet
33
mln March 16 June 16 Sept 16 Dec. 16 March 17
Due from Banks 15,404 15,299 14,442 15,736 15,462
Customer Loans 827 880 972 1,017 1,166
Financial Assets 2,629 2,933 3,592 3,764 3,912
Tangible and Intangible Assets 111 111 112 112 112
Derivatives 7 9 8 9 12
Other Assets 286 328 327 349 262
Total Assets 19,265 19,561 19,453 20,986 20,927
Customer Deposits 16,693 17,133 17,250 18,801 18,884
Due to Banks 1,504 1,362 1,139 1,111 980
Securities in Issue 0 0 0 0 0
Derivatives 20 18 15 11 17
Funds and other Liabilities 355 446 392 382 314
Equity 692 603 656 681 732
Total Liabilities and Equity 19,265 19,561 19,453 20,98 6 20,927
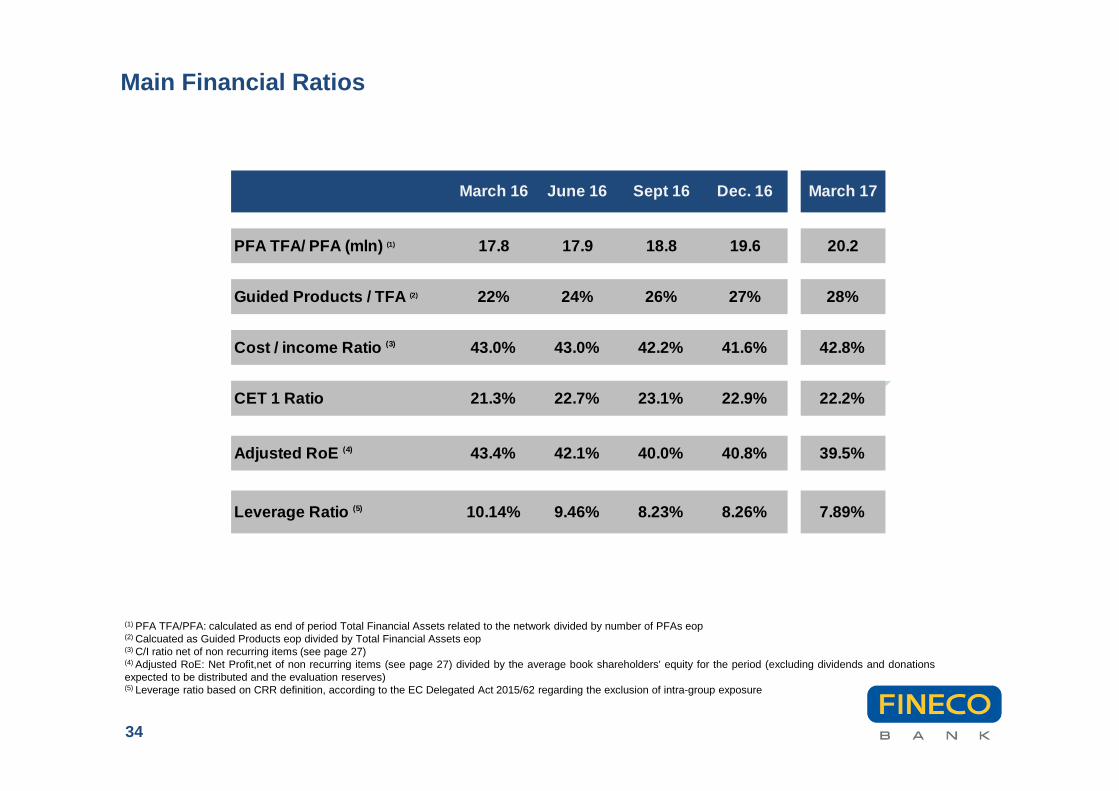
Main Financial Ratios
(1) PFA TFA/PFA: calculated as end of period Total Financial Assets related to the network divided by number of PFAs eop(2) Calcuated as Guided Products eop divided by Total Financial Assets eop(3) C/I ratio net of non recurring items (see page 27)(4) Adjusted RoE: Net Profit,net of non recurring items (see page 27) divided by the average book shareholders' equity for the period (excluding dividends and donationsexpected to be distributed and the evaluation reserves)(5) Leverage ratio based on CRR definition, according to the EC Delegated Act 2015/62 regarding the exclusion of intra-group exposure
34
March 16 June 16 Sept 16 Dec. 16 March 17
PFA TFA/ PFA (mln) (1) 17.8 17.9 18.8 19.6 20.2
Guided Products / TFA (2) 22% 24% 26% 27% 28%
Cost / income Ratio (3) 43.0% 43.0% 42.2% 41.6% 42.8%
CET 1 Ratio 21.3% 22.7% 23.1% 22.9% 22.2%
Adjusted RoE (4) 43.4% 42.1% 40.0% 40.8% 39.5%
Leverage Ratio (5) 10.14% 9.46% 8.23% 8.26% 7.89%