finite element simulations and characterization of …. finite element.full.… · finite element...
TRANSCRIPT
FINITE ELEMENT SIMULATIONS AND CHARACTERIZATION OF AIRBAGS
USING DOE
BHAGEERATHA K R1 & C ANIL KUMAR
2
1PG Student, Department of Mechanical Engineering, KSIT, Bangalore, Karnataka, India
2Professor, Department of Mechanical Engineering, KSIT, Bangalore, Karnataka, India
ABSTRACT
In the present study Low velocity impact tests have been carried out to study the energy absorption capabilities
of airbags, the main objective is to increase the energy absorption capabilities by minimizing the acceleration levels
and the number of bounces after the airbag impacts ground. In the present work, the effect of various parameters on the
energy absorbing capabilities of airbag are studied. The three parameters chosen for the present study are Airbag
Shape, Initial Pressure and the drop height.
Finite Element Method (FEM) and Design of Experiments (DOE) approach are used in order to achieve the
intended model objectives. The combination of both techniques is proposed to result in a reduction of the necessary
experimental cost and effort in addition to getting a higher level of verification. It can be stated that the Finite
Element Method coupled with Design of Experiments approach provides a good contribution in characterizing the
airbag.
The present work is divided into four phases, in the first phase Selection and testing of Airbag material is
carried out, where the material required for the airbag is chosen and tested according to ASTM standards to find out
the properties of the material. The second phase includes fabrication and testing of Airbags, Where three different
kinds of airbags (circular, cylindrical and rectangular) having same surface area are fabricated and tested according to
the Taguchi’s L9 Orthogonal Array experimental plan. In the third phase a Finite Element Model (FEM) which
represents the drop tests on the airbags (carried out in the Low Velocity Impact Test Rig) is developed in order to
evaluate the quality of the process parameters. In the fourth phase results are analyzed using Taguchi’s Signal to Noise
ratio technique, for both experimental testing and simulation of airbags to analyze the data and for the prediction of
optimum results. Finally the two methods are compared (FEM and Experimental) using DOE and the results are
analyzed to get the optimal set of process parameters.
KEYWORDS: Airbag, Shape, Pressure, Drop Height, Airbag Characterization, Finite Element Method, Design of
Experiments
INTRODUCTION
Research and investigations are being carried out to understand the intentional and unintentional injuries of human
beings in society. The injury level is not only causing unnecessary suffering for millions of victims but has also
tremendously increased the cost of aid provided to victims. Since awareness of preventive measures is increasing in
society, effort is focused on developing effective safety devices. Researchers, aided with information obtained by
investigators, have found new techniques to understand the dynamics involved in accidents resulting in injuries [1]. These
have either resulted in the design of new safety devices or helped in improving the existing ones.
International Journal of Automobile Engineering
Research and Development (IJAuERD)
ISSN 2277-4785
Vol. 3, Issue 4, Oct 2013, 23-34
© TJPRC Pvt. Ltd.
24 Bhageeratha K R & C Anil Kumar
In order to achieve optimum occupant safety inflatable restraint technology, commonly referred to as airbags has
been developed. Airbags are the inflatable restraints generally used to absorb the kinetic energy that is dissipated during
high speed crashes [2]. An airbag is a three dimensional structure capable of undergoing large deformations with non-
linear material properties, in recent years some efforts have been made to the design of airbags and improve their
performance in the crashworthiness studies of aircraft structures in low velocity impact.
SELECTION AND TESTING OF AIRBAG MATERIAL
Selection of Airbag Material
Woven fabrics have been the material of choice for materials used in safety air bag Construction. The latest
research on potential airbag materials including polyester fiber, Nylon 6,6, and Neoprene[3]. Among the three materials
Nylon has the advantages over the other two as it has better properties such it has
A high strength-to-weight ratio, Good elongation properties, Minimal weight for minimal space/thickness&
Insensitivity to temperature, It gives a good balance between the strength and elongation, hence acts as god airbag
cushion materials.
Thermodynamically it has high melting point and heat of fusion as compared to other common fibers like
polyester.
Testing of Airbag Material
Tensile and shear tests are conducted on airbag fabric with different orientation of the fabric to know the different
properties of fabric material. The different orientations Chosen for airbag testing are WARP, WEFT and SHEAR
directions.
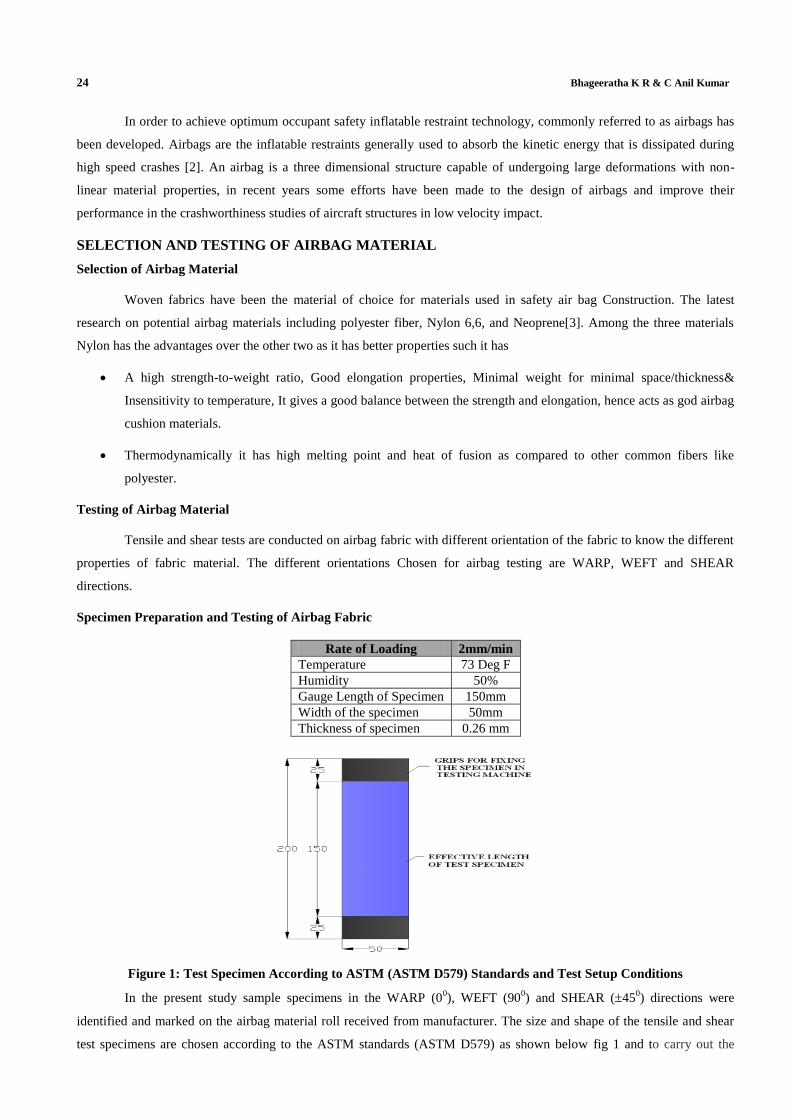
Specimen Preparation and Testing of Airbag Fabric
Rate of Loading 2mm/min
Temperature 73 Deg F
Humidity 50%
Gauge Length of Specimen 150mm
Width of the specimen 50mm
Thickness of specimen 0.26 mm
Figure 1: Test Specimen According to ASTM (ASTM D579) Standards and Test Setup Conditions
In the present study sample specimens in the WARP (00), WEFT (90
0) and SHEAR (45
0) directions were
identified and marked on the airbag material roll received from manufacturer. The size and shape of the tensile and shear
test specimens are chosen according to the ASTM standards (ASTM D579) as shown below fig 1 and to carry out the
Finite Element Simulations and Characterization of Airbags Using DOE 25
tensile and shear testing on airbag fabric INSTRON- 5500 R Series Universal Testing Machine has been used. The test was
conducted with the following test setup conditions.
Results of Tensile and Shear Testing of Airbag Fabric
Based on the tensile tests, the results have are tabulated in the Table 1.
Table 1: Tensile Test Results for Airbag Material
Tensile Test Results for Airbag Material
Specimen Sample Max Load
(Pmax ) N
Ultimate Strength
(UTS) MPa
Max Elongation
mm Modulus MPa
Warp (0º)
1A 472.998 36.38 30.815 47.889
53.054 1B 488.082 37.54 27.333 58.108
1C 369.075 28.39 24.667 53.165
Weft (90º)
2A 764.113 58.77 38.599 86.720
94.356 2B 814.865 62.68 40.833 96.438
2C 818.964 62.99 41.660 99.91
Shear (±45o)
3A 355.136 27.31 84.197 3.569
3.972 3B 448.195 34.47 90.333 4.303
3C 503.884 38.76 95.831 4.043
AIRBAG FABRICATION AND TESTING
Airbag Fabrication
The airbag material was made up of nylon engineering fabric. This fabric was coated one side with Rubber
coating. To compare the response characteristics Airbags with three different shapes are fabricated. All the three Airbags
have same surface area. The three shapes selected are Circular Airbag, Rectangular Airbag, and Cylindrical Airbag.
The three types of airbags (Circular airbag of φ550mm, Rectangular Airbag of 594x400 and Cylindrical Airbag of
φ382 mm and length 205 mm) are fabricated by machine stitching and subsequent bonding around the seam. The required
fabric size was cut from the fabric roll and stitched. Then the stitching was carried out using the sewing machine with
nylon thread. Total three rows of stitching operation were carried out around circumferential direction.
After that, standard epoxy based adhesive with hardener is applied on the stitched area as well as the edge of the
fabric. After 24 hrs room temperature curing, the airbag is inverted and subsequent operations like making a compressed
air inlet port, pressure sensor port and airbag mount were carried out.
Once again epoxy adhesive is applied on to the seam of an inverted airbag in order to minimize the leakage
around the seam. Second time room temperature curing of adhesive was carried out before the airbag subjected to a
‘breathing’ operation.
In this process, inside volume of the airbag is filled with compressed air to avoid any wrinkles around the seam of
an airbag.
Airbag Testing
The airbag drop test studies are carried out in “Low Velocity Impact Test Rig” (LVITF).
The airbag drop test studies are carried out for the cross head mass of 8 kg (includes airbag mount mass), different
drop heights (180 cm, 130 cm and 80 cm) and at different pressures (0.4psig, 0.6psig, 1.0psig) and with different shapes
(Circular, Rectangular, Cylindrical).
26 Bhageeratha K R & C Anil Kumar
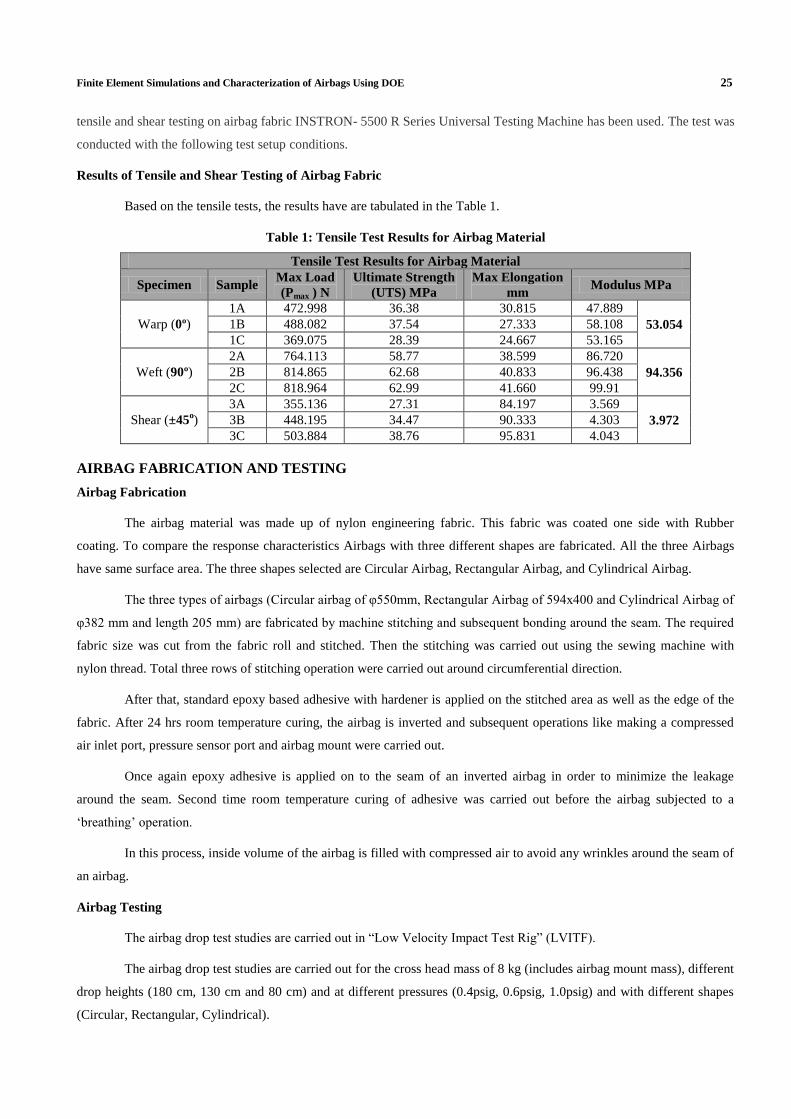
Experiment Set up & Experimental Plan Using Taguchi’s Philosophy
Figure 2: Schematic Diagram of LVITF & Flowchart of the Taguchi Method
Taguchi’s philosophy is an efficient tool for the design of high quality manufacturing systems. Dr. Genichi
Taguchi, a Japanese quality management consultant, has developed a method based on orthogonal array experiments,
which provide much-reduced variance for the experiment with optimum setting of process control parameters and Steps
involved in the Taguchi method are presented in the form of a flowchart [4].
Based on Taguchi’s orthogonal array design, experiments have been conducted with three different levels of
process parameters: Shape of the airbag, Pressure of the airbag, and Drop height. Process parameters with their notations,
unit and values at different levels are listed in Table2 & 3. The output response is listed in table 4.
Table 2: Process Parameters and their Limits
SL.No Parameter Notation Unit Level1 Level2 Level3
1 Shape of the Airbag S - Circular Cylindrical Rectangular
2 Pressure of the Airbag P Psig 0.4 0.6 1.0
3 Drop Height H cm 80 130 180
Table 3: Fractional Factorial Experiment Plan
Airbag
Shape
Pressure
P1(Psig) P2(Psig) P3(Psig)
Drop Height
80cm 130cm 180cm 80cm 130cm 180cm 80cm 130cm 180cm
Circular Exp1 Exp2 Exp3
Cylindrical Exp4 Exp5 Exp6
Rectangular Exp7 Exp8 Exp9
Table 4: Output Responses for Drop Test
Experiment
No.
Peak
Pressure(Psig)
Peak
Acceleration(g)
Bounce
Height(mm)
Compression
(mm)
1 1.84 7.04 304.77 54.062
2 2.75 15.42 635.14 77.131
3 3.44 31.05 916.99 85.810
4 2.49 15.19 551.73 44.549
5 3.10 27.93 819.85 52.304
6 1.95 6.84 293.82 60.850
7 3.83 29.21 956.57 89.341
8 2.17 8.08 352.52 54.960
9 3.17 16.30 685.09 70.381
Finite Element Simulations and Characterization of Airbags Using DOE 27
FINITE ELEMENT SIMULATION OF AIRBAGS
Finite Element simulation of Airbag Experiments (which have been carried out practically in Low Velocity
Impact Test Rig) using LS-DYNA simulation software coupled with HYPERMESH software and comparisons of
simulation results with the Experimental results [5] [6] & [7].[8]
Geometric Modeling
The Drop test Components have been modeled using CATIA modeling software. The Airbag and the rigid plates
are modeled using wireframe and surfaces work bench and they are assembled in assembly work bench. According to the
dimensioned as specified in the chapter 4, the airbags of three shapes (Circular, Cylindrical and rectangular) are modeled.
Then the rigid plate of dimension 1m x 1m is modeled. The models are the converted into IGES format to facilitate its
export to the HYPERMESH software.
Solution and Post Processing
LS-Dyna is used for solving Non-linear finite element analysis code. LS-PrePost is an advanced interactive
program for preparing input data for LS-DYNA and processing the results from LS-DYNA analyses. In the present study
LS-DYNA is used to carry out non liner explicit analysis. After solving the equations, LS-PREPOST module is used for
plotting the time history plots. In the present study three output parameters (pressure, acceleration, and drop height) are
studied to compare it with experimental results. The time history plots for the above said parameter are plotted for all the
drop test experiments conducted in LVITF, and compared with the experimental results.
Simulation of Airbags
The airbag simulations are carried out according to the Taguchi’s Fractional factorial method and Two materials
are chosen for the analysis are Fabric Material and Rigid Material. LS-DYNA provides separate material cards for the two
materials where the properties for the particular material can be entered. For Fabric material it uses MATL-34 material
card and for the rigid material it uses MATL-20 material card. The material properties assigned for the Airbag and Rigid
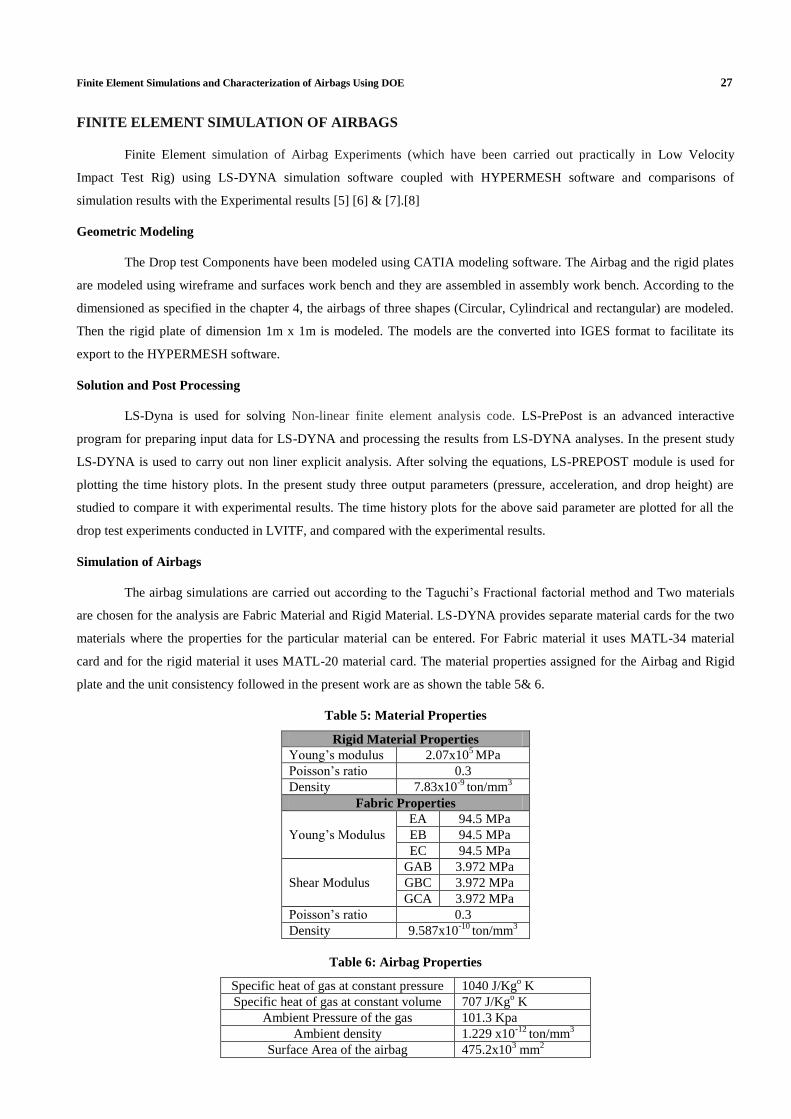
plate and the unit consistency followed in the present work are as shown the table 5& 6.
Table 5: Material Properties
Rigid Material Properties
Young’s modulus 2.07x10⁵ MPa
Poisson’s ratio 0.3
Density 7.83x10⁻⁹
ton/mm3
Fabric Properties
Young’s Modulus
EA 94.5 MPa
EB 94.5 MPa
EC 94.5 MPa
Shear Modulus
GAB 3.972 MPa
GBC 3.972 MPa
GCA 3.972 MPa
Poisson’s ratio 0.3
Density 9.587x10⁻¹⁰
ton/mm3
Table 6: Airbag Properties
Specific heat of gas at constant pressure 1040 J/Kgo K
Specific heat of gas at constant volume 707 J/Kgo K
Ambient Pressure of the gas 101.3 Kpa
Ambient density 1.229 x10⁻¹²
ton/mm3
Surface Area of the airbag 475.2x103 mm
2
28 Bhageeratha K R & C Anil Kumar
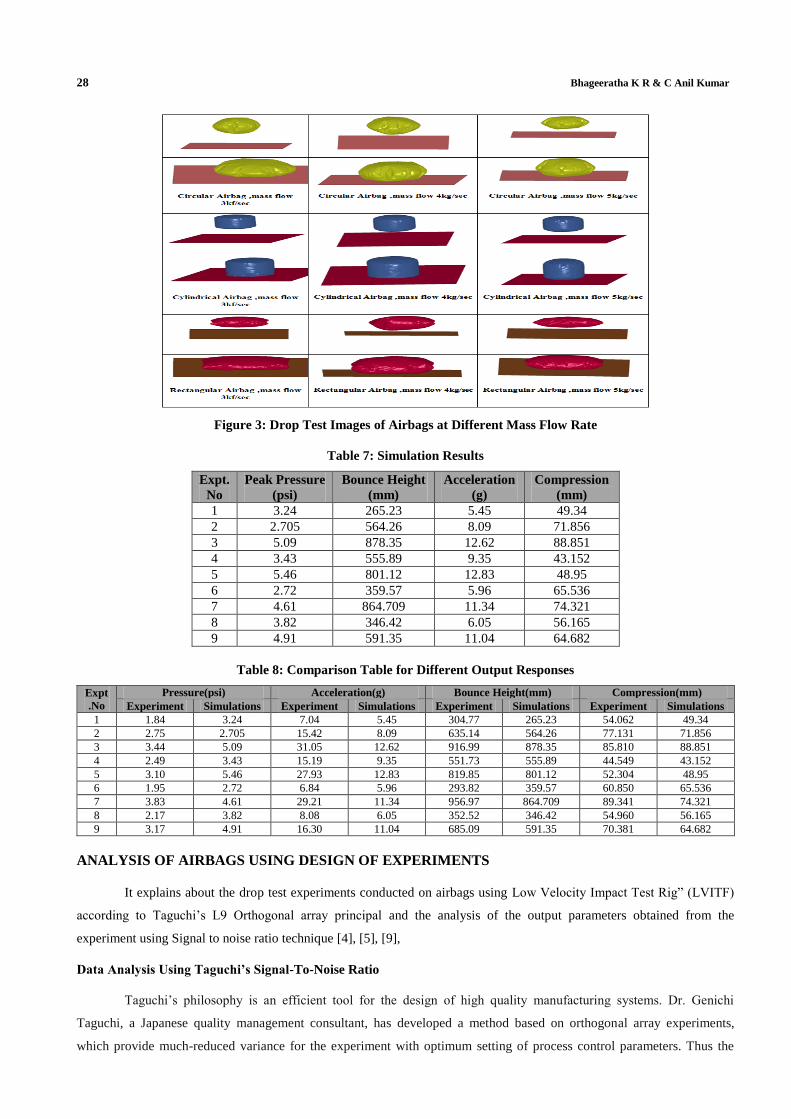
Figure 3: Drop Test Images of Airbags at Different Mass Flow Rate
Table 7: Simulation Results
Expt.
No
Peak Pressure
(psi)
Bounce Height
(mm)
Acceleration
(g)
Compression
(mm)
1 3.24 265.23 5.45 49.34
2 2.705 564.26 8.09 71.856
3 5.09 878.35 12.62 88.851
4 3.43 555.89 9.35 43.152
5 5.46 801.12 12.83 48.95
6 2.72 359.57 5.96 65.536
7 4.61 864.709 11.34 74.321
8 3.82 346.42 6.05 56.165
9 4.91 591.35 11.04 64.682
Table 8: Comparison Table for Different Output Responses
Expt
.No
Pressure(psi) Acceleration(g) Bounce Height(mm) Compression(mm)
Experiment Simulations Experiment Simulations Experiment Simulations Experiment Simulations
1 1.84 3.24 7.04 5.45 304.77 265.23 54.062 49.34
2 2.75 2.705 15.42 8.09 635.14 564.26 77.131 71.856
3 3.44 5.09 31.05 12.62 916.99 878.35 85.810 88.851
4 2.49 3.43 15.19 9.35 551.73 555.89 44.549 43.152
5 3.10 5.46 27.93 12.83 819.85 801.12 52.304 48.95
6 1.95 2.72 6.84 5.96 293.82 359.57 60.850 65.536
7 3.83 4.61 29.21 11.34 956.97 864.709 89.341 74.321
8 2.17 3.82 8.08 6.05 352.52 346.42 54.960 56.165
9 3.17 4.91 16.30 11.04 685.09 591.35 70.381 64.682
ANALYSIS OF AIRBAGS USING DESIGN OF EXPERIMENTS
It explains about the drop test experiments conducted on airbags using Low Velocity Impact Test Rig” (LVITF)
according to Taguchi’s L9 Orthogonal array principal and the analysis of the output parameters obtained from the
experiment using Signal to noise ratio technique [4], [5], [9],
Data Analysis Using Taguchi’s Signal-To-Noise Ratio
Taguchi’s philosophy is an efficient tool for the design of high quality manufacturing systems. Dr. Genichi
Taguchi, a Japanese quality management consultant, has developed a method based on orthogonal array experiments,
which provide much-reduced variance for the experiment with optimum setting of process control parameters. Thus the
Finite Element Simulations and Characterization of Airbags Using DOE 29
integration of design of experiments (DOE) with parametric optimization of process is achieved in the Taguchi method.
This will provide desired results. The desired results refer to the acceptable quality parameters of the product.
An orthogonal array (OA) provides a set of well balanced (minimum experimental runs) experiments and
Taguchi’s signal-to-noise ratios (S/N), which is logarithmic functions of desired output; serve as objective functions for
optimization. This helps in data analysis and prediction of optimum results. In order to evaluate optimal parameter settings,
the Taguchi method uses a statistical measure of performance called signal-to-noise ratio [4]. The S/N ratio developed by
Dr. Taguchi is a performance measure to select control levels that best cope with noise. The S/N ratio takes both the mean
and the variability into account. The S/N ratio is the ratio of the mean (signal) to the standard deviation (noise). The ratio
depends on the quality characteristics of the product/process to be optimized. The standard S/N ratios generally used are as
follows: nominal-is-best (NB), lower-the-better (LB), and higher-the-better (HB).
Nominal the best characteristics
iance
mean
NS
varlog10
2
10
n
Y
Mean
n
i
i 1
1
1
2
n
MeanY
Variance
n
i
i
Smaller the better characteristics
n
Y
NS i
i
2
10log10/
Larger the better characteristics
i
iYNS
210
1log10
Where n is the number of observations and Y is the observed data. For each type of the characteristics, with the
above S/N ratio transformation, the higher the S/N ratio corresponds to the better result. Therefore, the optimal level of the
process parameter is the level with the highest S/N ratio.
Analysis of Results for Experimental Airbag Drop Test
By using the experimental data from table 1, the Signal to noise ratios for each of the features of peak pressure,
peak acceleration, bounce height and compression have been calculated and tabulated in table 9.
The objective is to obtain the factor combination that would optimize S/N ratio, i.e. maximize S/N ratio
(higher-the-better for compression) or minimize S/N ratio (lower-the-better for peak pressure, peak acceleration and
bounce height). To evaluate quantitatively the degree of significance of process parameters on selected response(s),
Taguchi’s signal-to-noise ratios technique has been adopted.
Based on statistical analysis of the collected data, this method can infer which factor is the most significant in
influencing output features associated with peak pressure, peak acceleration, bounce height and compression.
Irrespective of the quality characteristic chosen for a particular response, a greater S/N ratio corresponds to better
quality characteristics. Therefore, the optimal level of the process parameters is the level which ensures greatest S/N ratio.
With the S/N optimization, the optimal parametric combination can be predicted.
30 Bhageeratha K R & C Anil Kumar
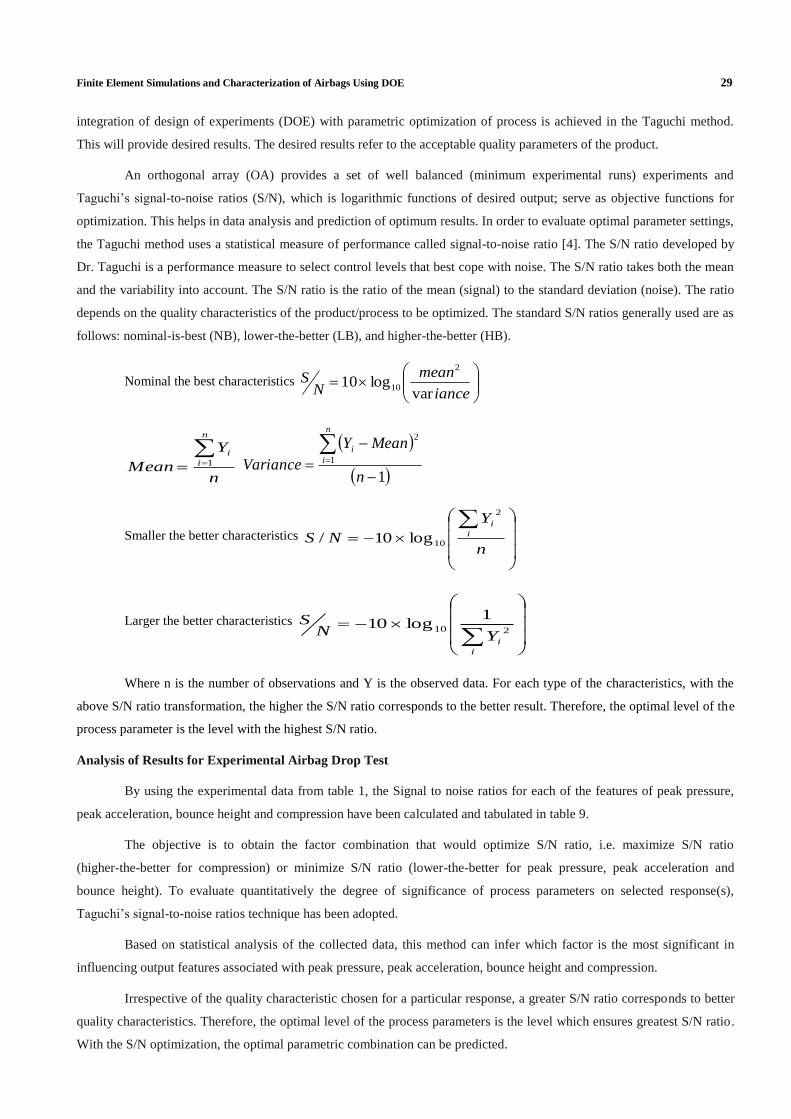
Table 9 represents the S/N ratios corresponding to experimental results for all the features of peak pressure, peak
acceleration, bounce height and compression.
Table 9: Signal to Noise Ratio Plots for Experimental Airbag Drop Test
Expt
No.
S/N Ratio for
Peak Pressure
S/N Ratio for
Peak Acceleration
S/N Ratio for
Bounce Height
S/N Ratio for
Compression
1 -5.2964 -16.9515 -49.6794 34.6578
2 -8.7867 -23.7617 -56.0574 37.7446
3 -10.7312 -29.8412 -59.2473 38.6708
4 -7.9240 -23.6312 -54.8345 32.9768
5 -9.8272 -28.9214 -58.2747 34.3707
6 -5.8007 -16.7011 -49.3616 35.6852
7 -11.6640 -29.3106 -59.6143 39.0210
8 -6.7292 -18.1482 -50.9437 34.8009
9 -10.0212 -24.2438 -56.715 36.9491
Signal to Noise Ratio Plots for Experimental Airbag Drop Test
rectangulacylindricalcircular
-6.0
-7.2
-8.4
-9.6
-10.8
1.00.60.4
18013080
-6.0
-7.2
-8.4
-9.6
-10.8
shape
Me
an
of
SN
ra
tio
s
pressure
Dropheight
Main Effects Plot for SN ratiosData Means
Signal-to-noise: Smaller is better
rectangulacylindricalcircular
-20
-25
-30
1.00.60.4
18013080
-20
-25
-30
shape
Me
an
of
SN
ra
tio
s
pressure
Dropheight
Main Effects Plot for SN ratiosData Means
Signal-to-noise: Smaller is better
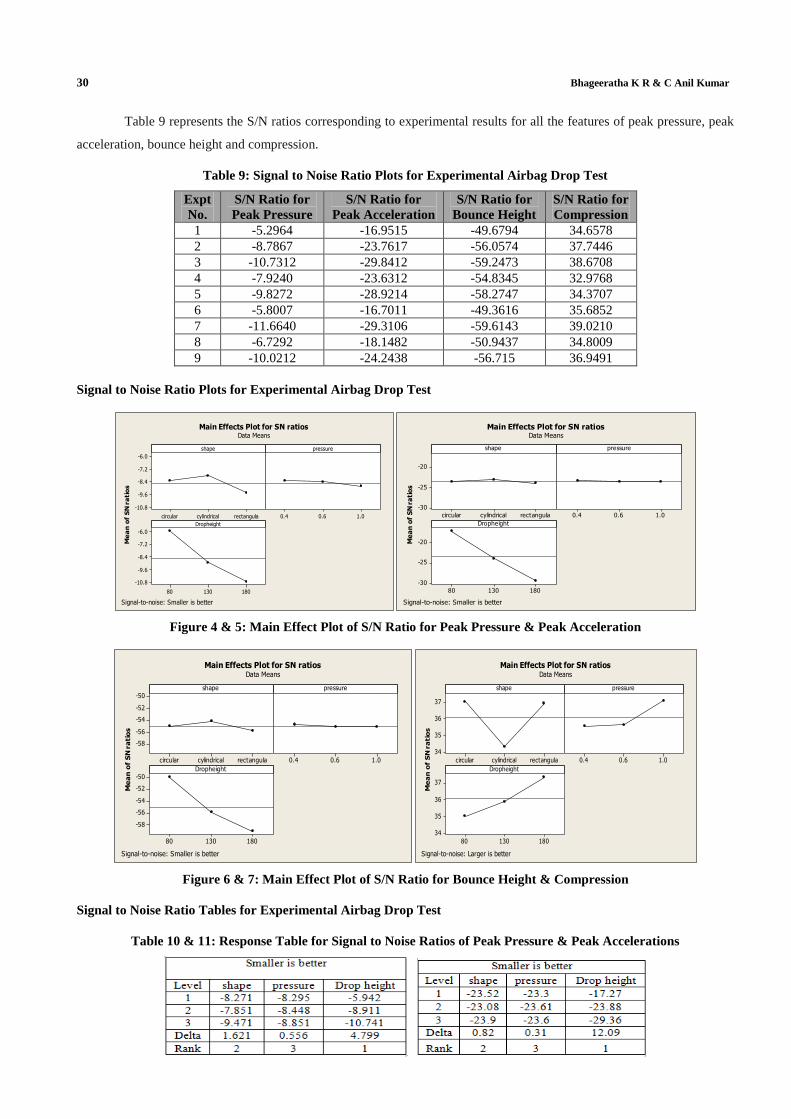
Figure 4 & 5: Main Effect Plot of S/N Ratio for Peak Pressure & Peak Acceleration
rectangulacylindricalcircular
-50
-52
-54
-56
-58
1.00.60.4
18013080
-50
-52
-54
-56
-58
shape
Me
an
of
SN
ra
tio
s
pressure
Dropheight
Main Effects Plot for SN ratiosData Means
Signal-to-noise: Smaller is better
rectangulacylindricalcircular
37
36
35
34
1.00.60.4
18013080
37
36
35
34
shape
Me
an
of
SN
ra
tio
s
pressure
Dropheight
Main Effects Plot for SN ratiosData Means
Signal-to-noise: Larger is better
Figure 6 & 7: Main Effect Plot of S/N Ratio for Bounce Height & Compression
Signal to Noise Ratio Tables for Experimental Airbag Drop Test
Table 10 & 11: Response Table for Signal to Noise Ratios of Peak Pressure & Peak Accelerations
Finite Element Simulations and Characterization of Airbags Using DOE 31
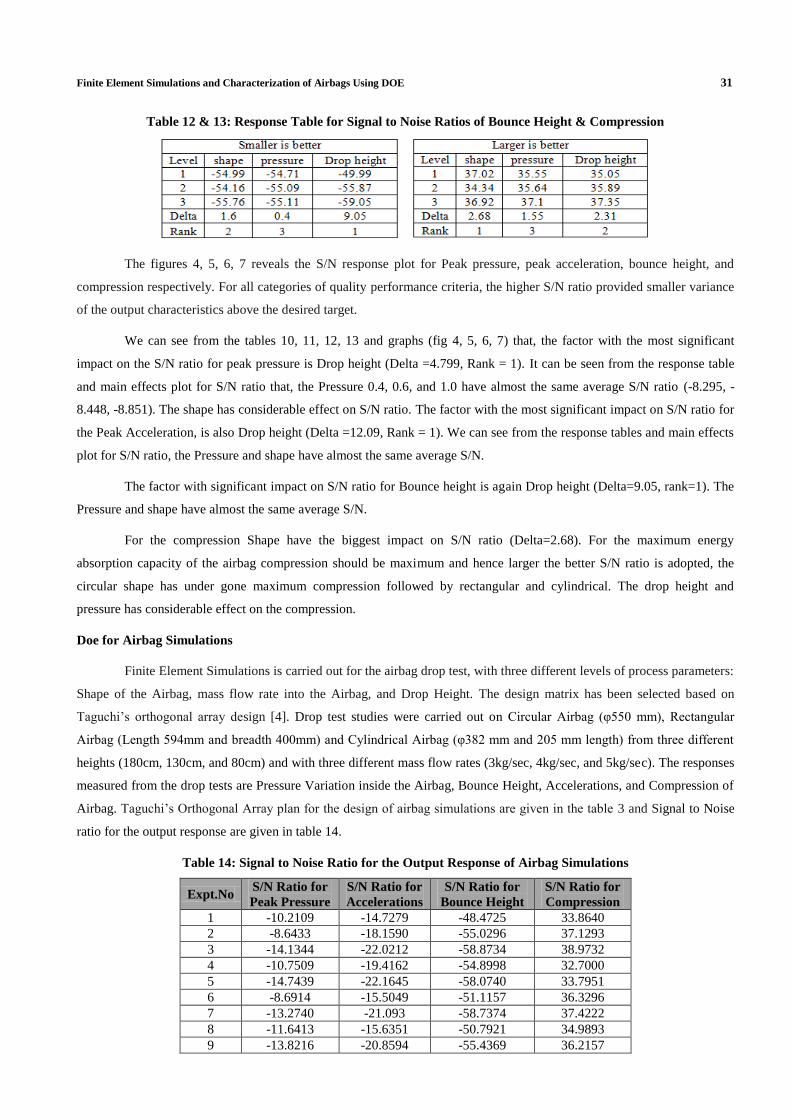
Table 12 & 13: Response Table for Signal to Noise Ratios of Bounce Height & Compression
The figures 4, 5, 6, 7 reveals the S/N response plot for Peak pressure, peak acceleration, bounce height, and
compression respectively. For all categories of quality performance criteria, the higher S/N ratio provided smaller variance
of the output characteristics above the desired target.
We can see from the tables 10, 11, 12, 13 and graphs (fig 4, 5, 6, 7) that, the factor with the most significant
impact on the S/N ratio for peak pressure is Drop height (Delta =4.799, Rank = 1). It can be seen from the response table
and main effects plot for S/N ratio that, the Pressure 0.4, 0.6, and 1.0 have almost the same average S/N ratio (-8.295, -
8.448, -8.851). The shape has considerable effect on S/N ratio. The factor with the most significant impact on S/N ratio for
the Peak Acceleration, is also Drop height (Delta =12.09, Rank = 1). We can see from the response tables and main effects
plot for S/N ratio, the Pressure and shape have almost the same average S/N.
The factor with significant impact on S/N ratio for Bounce height is again Drop height (Delta=9.05, rank=1). The
Pressure and shape have almost the same average S/N.
For the compression Shape have the biggest impact on S/N ratio (Delta=2.68). For the maximum energy
absorption capacity of the airbag compression should be maximum and hence larger the better S/N ratio is adopted, the
circular shape has under gone maximum compression followed by rectangular and cylindrical. The drop height and
pressure has considerable effect on the compression.
Doe for Airbag Simulations
Finite Element Simulations is carried out for the airbag drop test, with three different levels of process parameters:
Shape of the Airbag, mass flow rate into the Airbag, and Drop Height. The design matrix has been selected based on
Taguchi’s orthogonal array design [4]. Drop test studies were carried out on Circular Airbag (φ550 mm), Rectangular
Airbag (Length 594mm and breadth 400mm) and Cylindrical Airbag (φ382 mm and 205 mm length) from three different
heights (180cm, 130cm, and 80cm) and with three different mass flow rates (3kg/sec, 4kg/sec, and 5kg/sec). The responses
measured from the drop tests are Pressure Variation inside the Airbag, Bounce Height, Accelerations, and Compression of
Airbag. Taguchi’s Orthogonal Array plan for the design of airbag simulations are given in the table 3 and Signal to Noise
ratio for the output response are given in table 14.
Table 14: Signal to Noise Ratio for the Output Response of Airbag Simulations
Expt.No S/N Ratio for
Peak Pressure
S/N Ratio for
Accelerations
S/N Ratio for
Bounce Height
S/N Ratio for
Compression
1 -10.2109 -14.7279 -48.4725 33.8640
2 -8.6433 -18.1590 -55.0296 37.1293
3 -14.1344 -22.0212 -58.8734 38.9732
4 -10.7509 -19.4162 -54.8998 32.7000
5 -14.7439 -22.1645 -58.0740 33.7951
6 -8.6914 -15.5049 -51.1157 36.3296
7 -13.2740 -21.093 -58.7374 37.4222
8 -11.6413 -15.6351 -50.7921 34.9893
9 -13.8216 -20.8594 -55.4369 36.2157
32 Bhageeratha K R & C Anil Kumar
Signal to Noise Ratio Plots for Airbag Simulations
rectanglarcylindricalcircular
-10
-11
-12
-13
-14
543
18013080
-10
-11
-12
-13
-14
Shape
Me
an
of
SN
ra
tio
s
mass flow(Kg/sec)
drop height(cm)
Main Effects Plot for SN ratiosData Means
Signal-to-noise: Smaller is better
rectanglarcylindricalcircular
-15.0
-16.5
-18.0
-19.5
-21.0
543
18013080
-15.0
-16.5
-18.0
-19.5
-21.0
Shape
Me
an
of
SN
ra
tio
s
mass flow(Kg/sec)
drop height(cm)
Main Effects Plot for SN ratiosData Means
Signal-to-noise: Smaller is better
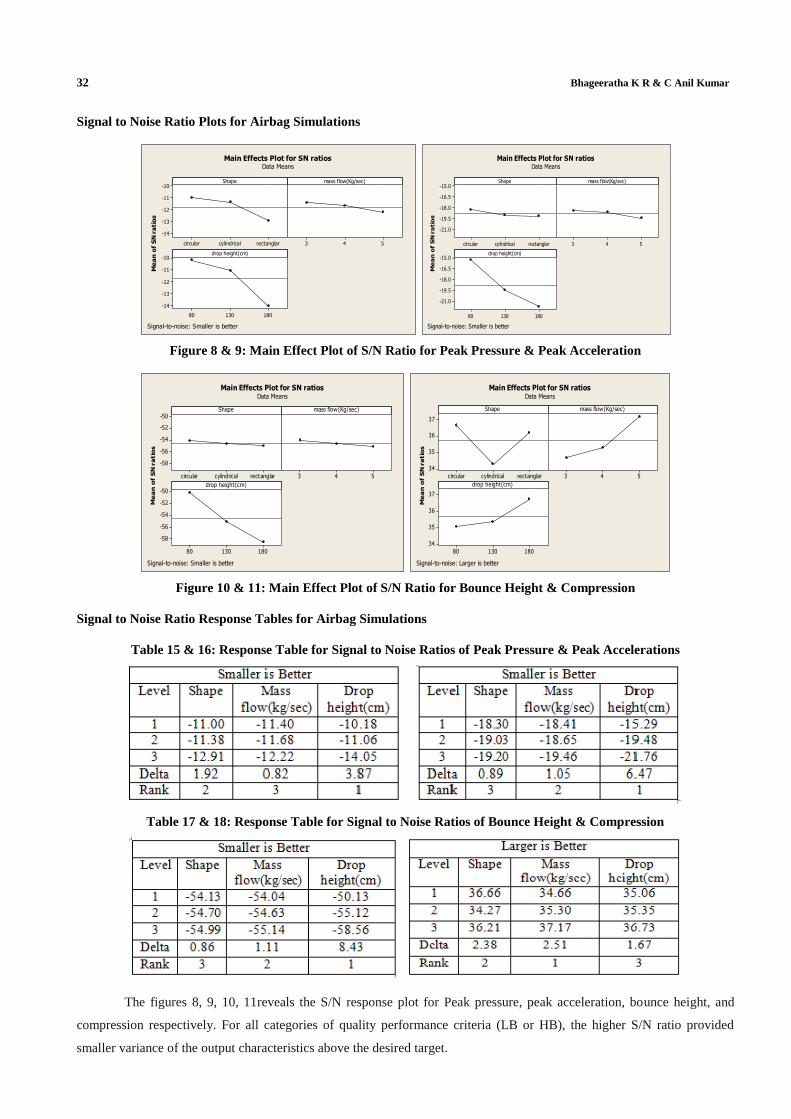
Figure 8 & 9: Main Effect Plot of S/N Ratio for Peak Pressure & Peak Acceleration
rectanglarcylindricalcircular
-50
-52
-54
-56
-58
543
18013080
-50
-52
-54
-56
-58
Shape
Me
an
of
SN
ra
tio
s
mass flow(Kg/sec)
drop height(cm)
Main Effects Plot for SN ratiosData Means
Signal-to-noise: Smaller is better
rectanglarcylindricalcircular
37
36
35
34
543
18013080
37
36
35
34
Shape
Me
an
of
SN
ra
tio
s
mass flow(Kg/sec)
drop height(cm)
Main Effects Plot for SN ratiosData Means
Signal-to-noise: Larger is better
Figure 10 & 11: Main Effect Plot of S/N Ratio for Bounce Height & Compression
Signal to Noise Ratio Response Tables for Airbag Simulations
Table 15 & 16: Response Table for Signal to Noise Ratios of Peak Pressure & Peak Accelerations
Table 17 & 18: Response Table for Signal to Noise Ratios of Bounce Height & Compression
The figures 8, 9, 10, 11reveals the S/N response plot for Peak pressure, peak acceleration, bounce height, and
compression respectively. For all categories of quality performance criteria (LB or HB), the higher S/N ratio provided
smaller variance of the output characteristics above the desired target.
Finite Element Simulations and Characterization of Airbags Using DOE 33
From the signal to noise ratio plots and the response tables (15, 16, 17, 18) the factor with the most significant
impact on the S/N ratio for peak pressure, peak acceleration and bounce height is Drop height of the airbag, but for the
compression, Shape is the most significant factor. For the maximum energy absorption capacity of the airbag compression
should be maximum and hence larger the better S/N ratio is adopted, the circular shape has under gone maximum
compression followed by rectangular and cylindrical. The drop height and pressure has considerable effect on the
compression.
SUMMARY
In this chapter a detailed methodology of the Taguchi optimization technique for experimental testing of airbags
and the airbag testing by simulations is explained and applied for evaluating optimal parametric combinations to achieve
acceptable features of peak pressure, peak acceleration, bounce height and compression.
By comparing the signal to noise ratio plots for experimental testing and simulation of airbags the most significant
factor for peak pressure, peak acceleration and bounce height is Drop height of the airbag but for the compression shape of
the airbag is most significant factor. For the maximum energy absorption capacity of the airbag compression should be
maximum and hence larger the better S/N ratio is adopted, the circular shape has under gone maximum compression
followed by rectangular and cylindrical. The drop height and pressure has considerable effect on the compression.
CONCLUSIONS
In the present work the energy absorption capabilities of airbag have been studied by conducting drop tests on
airbag using low velocity impact test rig, the main objective is to increase the energy absorption capabilities by minimizing
the acceleration levels and the number of bounces after the airbag impacts ground. In the present work, the effects of
various parameters (shape, pressure, drop height) on the energy absorbing capabilities of airbag are studied.
Nylon fabric is chosen as airbag material because of its advantages over the other material such as polyester,
neoprene fabrics. The elastic properties of the material are calculated by conducting tensile and shear testing according to
the ASTM standard.
Three types of airbags with same surface area are fabricated and the experiments are conducted according to the
Taguchi’s L9 orthogonal array method with three factors (shape, pressure, drop height) at three different levels of process
parameters. From the experiments it was found that an average compression was achieved more in case of circular airbag
and less for cylindrical airbag and hence it can be concluded that circular airbag has more energy absorption capabilities
compared to other two types. The acceleration levels are more in case of rectangular airbag and least for cylindrical air bag.
Finite Element Model (FEM) representing an airbag drop test was developed in order to evaluate the quality of the
process parameters. Simulation model tests are carried out according to the Taguchi’s L9 orthogonal array with three
factors (shape, mass flow rate, drop height) at three different levels. The FEA model was validated by comparing it with
the experimental model. It is possible to reduce the lead-time by using the Finite Element Analysis in conjunction with
Design of Experiment technique in the design process, where computer simulations can replace many time consuming
experiments. This will make the design process faster and more reliable.
By comparing the signal to noise ratio plots for experimental testing and simulation of airbags the most significant
factor for peak pressure, peak acceleration and bounce height is Drop height of the airbag but for the compression shape of
the airbag is most significant factor. For the maximum energy absorption capacity of the airbag compression should be
34 Bhageeratha K R & C Anil Kumar
maximum and hence larger the better S/N ratio is adopted, the circular shape has under gone maximum compression
followed by rectangular and cylindrical. The drop height and pressure has considerable effect on the compression.
SCOPE OF FUTURE WORK
In the present work the energy absorption capabilities have been studied for the non porous plain airbags, it can be
extended to the porous airbags and also airbag with vents. Currently airbag has been inflated using air compressor, but it is
difficult to maintain the initial pressure using compressor and hence in the future work airbag inflation can be carried out
using explosives like sodium azide which is the faster method of inflation process.
REFERENCES
1. Jaikanth B. Kumblekere, A Parametric Evaluation Of Vehicle Crash Performance”, College of Engineering and
Technology Ohio University, 1996.
2. Civil Aviation Regulation “Proposed Airworthiness Directive, General series- Upper Torso Restraints for
Occupants in Small Aircraft”, 1998-part39.
3. Jialin Sun, John A. Barnes “Materials Selection for Airbag Fabrics” Airbag End-Use Technology, DuPont
Textiles and Interiors.
4. Saurav Datta & Asish Bandyopadhyay &Pradip Kumar Pal “ Application Of Taguchi Philosophy For
Parametric Optimization Of Bead Geometry And HAZ Width In Submerged Arc Welding Using A Mixture Of
Fresh Flux And Fused Flux”(not got)Dasharath Ram, S. Sai Kumar a n d P . V . Moahan Ram, “Modeling And
Optimization Of Electron Beam Welding Process Using Anova”.
5. Livermore Software Technology Corporation, “LS-DYNA 970 Material Model Database
6. Junning Sun, “Prediction of Energy Absorption of Extruded Tubes”, Texas Tech University December, 2000.
7. Siruvole, S., “Studying the effectiveness of external airbag as a safety device in side impact protection”, Master’s
Thesis, Wichita State University, Wichita, May 2006.
8. A.Hirth, A.Haufe & L. Olovsson, Airbag Simulation with LS-DYNA Past- Present-Future”.
9. Douglas C . Montgomery, “ Experimental d e s i g n fo r P ro d u c t a n d P r o c e s s design and development”
Arizona State University, Tempe, USA.
10. Woodson, “Crashworthiness structure”, http://scholar.lib.vt.edu/thesis/etd 080999132522/chapter1, 1994.
11. R.F.Chandler, Editor of “Aircraft Crashworthiness”, Society of Automotive Engineers, pp71,1995 .
12. H. J.L.M. Consten “Active Airbag Systems, Modeling and feedback control design” DCT nr.: 2004.79