fiscal performance, institutional design and decentralization - imf
TRANSCRIPT
Fiscal Performance, Institutional Design and Decentralization in European Union Countries
Julio Escolano, Luc Eyraud, Marialuz Moreno Badia, Juliane Sarnes, and Anita Tuladhar
WP/12/45
© 2012 International Monetary Fund WP/12/45
IMF Working Paper
Fiscal Affairs Department
Fiscal Performance, Institutional Design and Decentralization in European Union Countries
Prepared by Julio Escolano, Luc Eyraud, Marialuz Moreno Badia, Juliane Sarnes, and Anita Tuladhar1
Authorized for distribution by Carlo Cottarelli
February 2012
Abstract
This paper analyzes the impact of decentralization on overall fiscal performance in the European Union, taking into account fiscal institutional arrangements. We find that spending decentralization has been associated with sizably better fiscal performance, especially when transfer dependency of subnational governments is low. However, subnational fiscal rules do not seem to be associated with better performance. JEL Classification Numbers:H71, H77, H30
Keywords: Fiscal decentralization, fiscal institutions, fiscal rules, European Union
Authors’ E-Mail Addresses: [email protected]; [email protected]; [email protected]; [email protected]; [email protected]
1 The authors would like to thank Carlo Cottarelli, Gerd Schwartz, and participants in the Perugia Fiscal Policy Workshop and various IMF seminars for helpful comments and discussions.
This Working Paper should not be reported as representing the views of the IMF. The views expressed in this Working Paper are those of the author(s) and do not necessarily represent those of the IMF or IMF policy. Working Papers describe research in progress by the author(s) and are published to elicit comments and to further debate.
2
Contents Page
Abstract ......................................................................................................................................1
I. Introduction ............................................................................................................................3
II. The Economic Debate on Fiscal Decentralization ................................................................4
III. Institutional Features of European Subnational Governments ............................................6 A. Subnational government structures and economic functions ....................................6 B. Control mechanisms ..................................................................................................7
IV. Stylized Facts on Decentralization and Fiscal Performance................................................9
V. Econometric Evidence ........................................................................................................13 A. Baseline results .......................................................................................................14 B. Robustness checks ...................................................................................................15
VI. Conclusions........................................................................................................................16 Tables 1. Features of Subnational Governments .................................................................................18 2. Fiscal Decentralization and Fiscal Performance ..................................................................19 3. Do Fiscal Institutions Matter? ..............................................................................................20 4. Robustness Checks...............................................................................................................21 Figures 1. Trends in Subnational Expenditure Shares by Number of Countries,1995–2008 .................6 2. Fiscal Rule Strength and Level of Decentralization ..............................................................8 3. Average Fiscal Balances by Level of Decentralization in the
European Union, 1995–2009 ................................................................................................10 4. Fiscal Performance in the European Union, 1995–2008 .....................................................10 5. Increase in Spending and Revenue Decentralization ...........................................................12 6. Fiscal Rules Indices and Fiscal Performance, 2008.............................................................12 Appendices 1. Expenditure Assignments to Subnational Governments in the European Union ................22 2. Fiscal Rules at the Subnational Level in the European Union .............................................23 3. Selected Episodes of Subnational Bailouts in the European Union ....................................25 4. Data Sources and Definitions ...............................................................................................26 Appendix Tables and Figures 1. Fiscal Rules in the EU Member States by Type of Rule and
Level of Government, 2008 ..................................................................................................23 2. Sanctions and Escape Clauses by Type of Fiscal Rule ........................................................24 References ................................................................................................................................29

3
I. INTRODUCTION
Many European countries have embarked on fiscal decentralization programs over the last decades. They have reassigned spending and revenue collection responsibilities from the center to subnational (local and regional) governments. As a result, the spending carried out at the subnational level in the European Union (EU) has increased from 23 percent of general government spending in 1995 to 26 percent in 2009 with the revenue share increasing to a lesser extent. 2
The economic case for decentralization relies essentially on efficiency arguments. Subnational governments have more information and hence can better match policies with citizens’ preferences (Oates 1972). Another argument is that competition among jurisdictions limits the local tax burden and encourages cost-efficient provision of local public goods (Brennan and Buchanan, 1980). Finally, decentralization is likely to increase accountability and transparency in the delivery of public goods and services.
Yet decentralization could have drawbacks. In particular, subnational governments may not fully internalize the cost of local expenditure when spending decentralization is financed through a “common pool” of transfers from the center. In this case, they are more likely to overspend and lower their tax effort. This effect is aggravated if subnational authorities anticipate that their financing gap will be covered by the center, with bailout expectations “softening” the budget constraint felt at the local level (Rodden et. al. 2003). However, some institutional arrangements—e.g., fiscal rules—could in principle help overcome coordination problems between levels of government and strengthen fiscal discipline by correcting incentives, enhancing accountability and anchoring economic agents’ expectations.
The empirical literature is inconclusive as to the impact of decentralization on fiscal performance. The purpose of this paper is to assess empirically this impact in the EU, examining explicitly the role of institutional arrangements covering subnational governments. This is a timely question, particularly now that many European countries are facing the challenge of restoring fiscal sustainability and financial markets are questioning whether consolidation efforts may be derailed by coordination problems in decentralized countries. Our findings suggest that spending decentralization has in fact been associated with stronger fiscal performance, especially when transfer dependency of subnational governments was low. Nevertheless, subnational fiscal rules do not seem to play a role in ensuring better performance.
2 Subnational spending is local and regional government spending excluding transfers paid. Subnational revenue is defined as the revenues of local and regional governments excluding transfers received, and transfers are net current and capital transfers received from the other levels of government.

4
The paper is organized as follows. Section II briefly reviews the literature on the design of fiscal decentralization. Section III describes the institutional features of subnational governments in the EU. Section IV presents some stylized facts of decentralization and fiscal performance in the EU. Section V approaches these issues through econometric methods and analyzes the results. Section VI concludes.
II. THE ECONOMIC DEBATE ON FISCAL DECENTRALIZATION
In this section, we present some results from the literature on decentralization and fiscal performance. Most of the existing literature is of a theoretical nature or is based on case studies. Theoretical or normative contributions generally point to the risks of decentralization, especially where subnational spending is financed through transfers or local borrowing. However, the empirical literature does not yet provide clear-cut results. Possibly owing to data constraints, econometric cross-country work is scarce and focuses mostly on OECD countries.
The challenges of decentralization in terms of macroeconomic stabilization have long been highlighted in the normative literature. The widespread view is that countercyclical policies are more difficult to pursue in a decentralized framework (Ter-Minassian, 1997a), because the center is deprived of some tax and spending levers (Tanzi, 1995); and subnational governments usually conduct procyclical policies (Tanzi, 2000; IMF, 2009). From an empirical standpoint, the evidence is scant although there are some case studies illustrating the procyclicality of local budgets (Rodden and Wibbels, 2009).
In addition, decentralization may also affect the capacity of countries to reduce chronic deficits. Subnational governments are often suspected of conducting looser fiscal policies, with coordination failures creating “deficit bias” (Oates, 2006). In addition, decentralization may deteriorate the central government performance. This is clearly the case when central governments bail out subnational authorities that become excessively indebted. It can also take more subtle forms, for instance, when high subnational borrowing or difficulties in implementing consolidation plans in a decentralized framework result in higher risk premia for the central government.
However, the cross-country econometric evidence on the effect of decentralization on fiscal performance is mixed. Rodden (2002) finds that revenue decentralization deteriorates the general government balance whereas Neyapti (2010) finds that revenue and spending decentralizations improve it. Afonso and Hauptmeier (2009) report that a higher degree of spending decentralization worsens the primary balance (for high debt levels) while revenue decentralization does not matter. Thornton (2009) also finds no significant impact of revenue decentralization. Baskaran (2010) adopts a different approach by assessing the impact on

5
debt rather than on the fiscal balance; it finds that expenditure decentralization significantly reduces public indebtedness, while the effect of tax decentralization is insignificant.3
The design of the institutional framework seems crucial to reap the benefits of fiscal decentralization. Three institutional features have received particular attention:
Transfer dependency. Rodden (2002) argues that higher reliance on transfers reduces the general government overall balance, in particular when subnational borrowing is not constrained. In addition, subnational spending funded by transfers is found to be additional to central government spending, not a substitute (Fornasari et al., 2000). Transfer growth may become endogenous, with deficits bringing about more grants, which in turn generate higher deficits (De Mello, 2007). Thus, allowing subcentral governments to access own revenue through local taxation is often seen as essential to promoting fiscal discipline.
Subnational borrowing autonomy can also undermine the fiscal discipline of local governments, especially when they resort to “soft” financing—for instance, when bonds are sold to the public banking system or to state-owned enterprises (Oates, 2006). Some studies find that restricting subnational authorities’ access to borrowing—either through cooperative arrangements, market discipline, or formal rules—is associated with better fiscal performance (Rodden, 2002; Plekhanov and Singh, 2007).
Fiscal rules may offset some of these negative effects by addressing coordination problems between levels of government (Sutherland et al., 2005; Ter-Minassian, 1997a, 1997b, 2007). However, the empirical literature does not find conclusive evidence that subnational rules affect the general government performance. In particular, Debrun et al. (2008) find that rules applying to subnational governments have no significant impact on the cyclically adjusted primary balance of the general government, in contrast to rules pertaining to the general and the central government. Afonso and Hauptmeier (2009) report the same result with the general government primary balance.
3 On a related issue, based on a comparative analysis of successful and failed consolidations, Darby et al. (2005) shows that high level of expenditure decentralization reduces the occurrence of successful consolidations; the more decentralized countries rely less on durable expenditure cuts and more on short-lived revenue hikes, probably because decentralization makes coordinated cuts more difficult to achieve.

6
III. INSTITUTIONAL FEATURES OF EUROPEAN SUBNATIONAL GOVERNMENTS
The role of subnational governments varies significantly in the EU. Relatedly, subnational government spending—as a proportion of general government expenditure—ranges widely from less than two per cent in Malta to almost two-thirds in Denmark.4 The relationship between the center and the subnational governments differs reflecting the distribution of political power, economic functions, and institutional arrangements. We examine briefly some of these features in this section.
A. Subnational government structures and economic functions
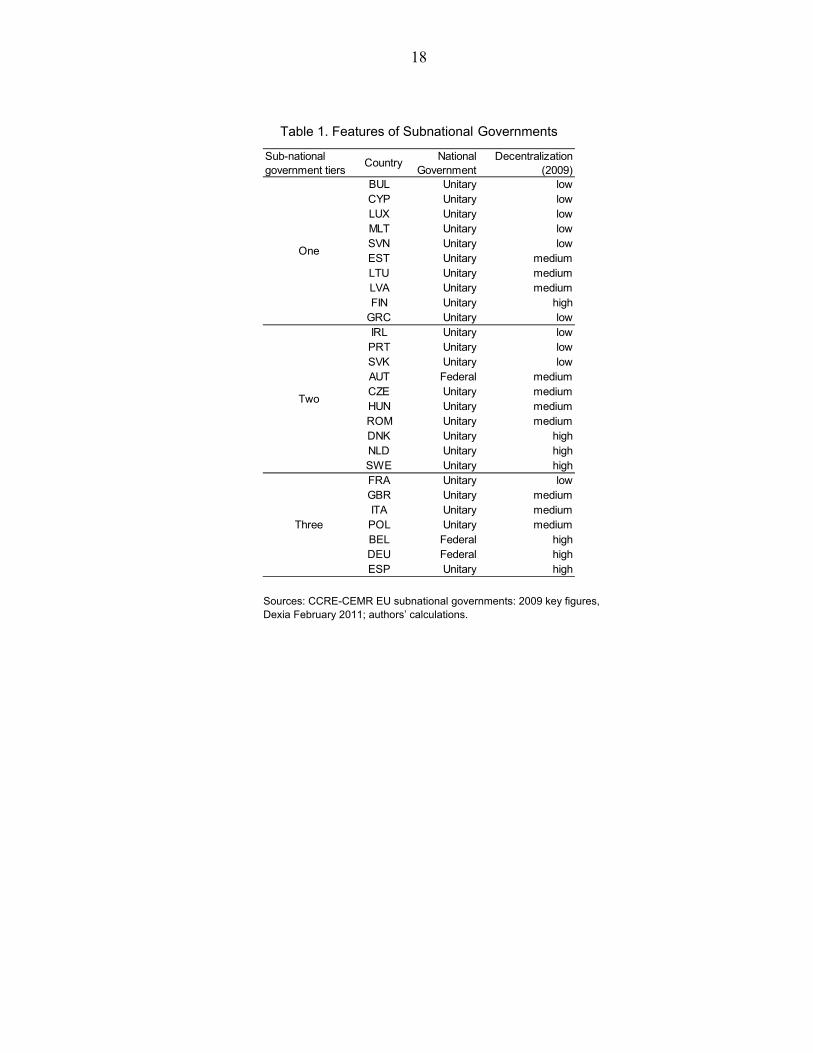
In general, the share of subnational expenditure in total government spending is higher in federal countries, but some unitary countries also have a high level of spending decentralization. The great majority of EU countries are unitary. Only Austria, Belgium, and Germany are organized on a federal basis (see Table 1). While these federal states have a slightly higher level of decentralization, the classification into unitary and federal refers only to the distribution of political power, which does not necessarily coincide with the distribution of economic resources or the level of fiscal decentralization. Hence, there are medium-decentralization federal countries, such as Austria, as well as highly decentralized unitary countries, such as Denmark, Finland, or Spain.
More decentralized countries tend to have more tiers of subnational government (Table 1). About one-third of the EU27 countries have one single level, while the rest have two or three tiers. In general, larger countries with a larger population or surface area tend to have more tiers and a higher number of administrative entities.
4 Expenditure shares are to date the most common way of describing the spending power of subnational governments. In this paper, fiscal decentralization is measured as the share of subnational spending in total general government spending, unless noted otherwise. Countries are divided in three groups of about equal size according to their degree of decentralization. High-decentralization countries have spending share above 33 percent; medium-decentralization countries have spending shares between 25 and 33 percent; while low-decentralization countries have spending share less than 25 percent.
0
2
4
6
8
10
12
14
16
Education Health Welfare
Num
ber o
f Co
untr
ies
Figure 1. Trends in Subnational Expenditure Shares by Number of Countries, 1995-2008
Increase
Decrease
No change
Sources: Eurostat; authors' calculations.

7
The main areas of subnational government expenditure are education, health, and social welfare. While most countries have assigned to the subnational levels at least some responsibility for preschool, primary, and secondary education, universities are mainly in the realm of the center. Nevertheless, in some countries university education is also assigned to the subnational level. Furthermore, some hospitals and basic healthcare are usually assigned to subnational tiers. The same is true for the execution of general social welfare services, such as social housing (see Appendix I). Between 1995 and 2008, subnational expenditure shares for education and social welfare have risen, while the subnational expenditure share of health has decreased in the majority of countries (Figure 1).5
B. Control mechanisms
To control subnational government deficits, it is common to find fiscal rules—mainly borrowing or balanced budget rules—applying to subnational entities.6 The number of fiscal rules has increased substantially at the central and general government levels in the European Union. Nonetheless, the majority of fiscal rules are applied at the local government level (Appendix II). Budget balance rules are more prevalent in EU15 countries, while debt or borrowing rules are common among the new member states (NMS). Expenditure rules, on the other hand, are rare at the subnational level. In some countries this may reflect that, once budget balance rules are imposed, subnational governments do not have much flexibility on spending as they often depend on grants from the central government. Subnational fiscal rules are more prevalent in countries with higher decentralization and when subnational governments are more reliant on own revenues than on transfers.
Fiscal rules for both the central and subnational governments are stronger in more decentralized economies (Figure 2). Not surprisingly, rules at the central government level are also strong for low levels of decentralization where spending is mostly concentrated at the center. But central government rules are weaker in the case of medium-decentralization economies; in these economies, subnational governments are also more reliant on transfers from the center.
5 Overall, eight countries have reduced the subnational expenditure shares for health, three of which significantly by 15-20 percentage points (Estonia, Hungary, and Romania). In Ireland this trend is particularly pronounced: in 2005 the total health budget was reassigned to the center, causing the subnational expenditure share to drop from 95 percent to zero. This is consistent with the trends described in Saltman (2008).
6 The fiscal rule indices used in the paper come from the European Commission Fiscal Rule Index database (European Commission, 2009). Overall fiscal rules comprise all rules applying to either the general, central, or subnational governments.

8
Figure 2. Fiscal Rule Strength and Level of Decentralization
-1.0
0.0
1.0
2.0
3.0
1990 1991 1992 1993 1994 1995 1996 1997 1998 1999 2000 2001 2002 2003 2004 2005 2006 2007 2008
High decentralization Medium decentralization Low decentralization
Central Government Fiscal Rule Index
-1.0
0.0
1.0
2.0
3.0
1990 1991 1992 1993 1994 1995 1996 1997 1998 1999 2000 2001 2002 2003 2004 2005 2006 2007 2008
High decentralization Medium decentralization Low decentralization
Subnational Fiscal Rule Index
Sources: Eurostat; European Commission; and authors’ calculations. Note. The fiscal rule index measures the strength of the rule based on its legal basis, coverage, strictness of monitoring and enforcement (including through sanctions and escape clauses), and media visibility.
Nevertheless, the strength of these rules does not necessarily reflect their effectiveness. Although most countries have fiscal rules on subnational government levels, sanctions in case of rule infringement are often weak, and the central government retains considerable discretion in addressing a breach in rules. Moreover, breaching of the rules does not preclude a bailout by the central government. In the past, lack of control over subnational governments’ fiscal performance has resulted in subnational bailouts in at least nine EU countries (Appendix II). Subnational bailouts have more frequently occurred in countries with a higher number of administrative tiers. Coordination between the central and subnational governments in budgetary procedures is limited. Less than one-third of countries have formal coordination arrangements.7 Also, in the majority of countries, the budget law only includes fiscal targets for the central government. In only a small proportion of countries, subnational levels are explicitly targeted by the medium-term budgetary frameworks.
7 See European Commission database on medium-term fiscal frameworks.

9
IV. STYLIZED FACTS ON DECENTRALIZATION AND FISCAL PERFORMANCE
In this section, we present some stylized facts regarding the impact of fiscal decentralization on fiscal performance in the EU. In addition, we try to explain what institutional factors—namely the degree of revenue autonomy, transfer dependency, and presence of fiscal rules—affect fiscal performance.8 We use fiscal data from Eurostat covering the years 1995-2008 and look at different indicators (balance and debt) to assess the performance of the general government. 9 The main findings are as follows: Stylized fact 1. Spending decentralization is associated with better fiscal performance at the general government level (Figure 3).
Over the period 1995–2008, cyclically adjusted general government fiscal balances were higher among more decentralized countries such as Denmark, Sweden and Spain, and much lower in less decentralized countries such as Greece, Malta and Slovakia (Figure 4, panel a).10 Moreover, increases in spending decentralization are not associated with increases in debt (Figure 4, panel b). Nevertheless, fiscal performance varies considerably among countries with a medium level of decentralization, in particular, among the NMS. For example, several eastern European economies such as Czech Republic, Hungary and Poland have higher deficits, while Estonia and Bulgaria have much lower deficits. On average, overall fiscal balances in countries with medium and low levels of decentralization are respectively 2 and 2½ percentage points of GDP below those of countries with high decentralization.
The relatively favorable general government fiscal performance for more decentralized countries reflects strong fiscal positions at the center. Subnational governments have a close-to-balance fiscal position irrespective of the degree of decentralization (Figure 3). This low deficit is not surprising as subnational governments are often constrained in their ability to borrow—either due to fiscal rules or market rationing—and are generally reliant on transfers from the center with spending being closely related to the availability of transfers. Given this, fiscal indiscipline at the subnational level would be reflected in higher deficit at the center as a result of gap-filling transfers. However, this is not borne out by the data: on average, central government fiscal performance seems stronger in highly decentralized countries.
8 Revenue autonomy is measured by the share of subnational own revenues (i.e. adjusted for central government transfers) in general government revenues; transfer dependency is measured by the share of transfers received by subnational governments in total subnational revenues.
9 For a description of the data and definitions, see Appendix III.
10 This positive relationship is also evident when measured against overall balance or cyclically adjusted primary balance.

10
Figure 3. Average Fiscal Balances by Level of Decentralization in the European Union,1995–2009 (Percent of GDP)
-8
-7
-6
-5
-4
-3
-2
-1
0
1
2
3
1995 1998 2001 2004 2007
High Decentralization
General government balanceCentral government balanceSubnational government balance
-7
-6
-5
-4
-3
-2
-1
0
1
1995 1998 2001 2004 2007
MediumDecentralization
General government balance
Central government balance
Subnational government balance
-8
-7
-6
-5
-4
-3
-2
-1
0
1
1995 1998 2001 2004 2007
Low Decentralization
General government balance
Central government balance
Subnational government balance
0
10
20
30
40
50
60
70
80
1995 1998 2001 2004 2007
High Decentralization
General government debt
0
10
20
30
40
50
60
70
80
1995 1998 2001 2004 2007
Medium Decentralization
General government debt
0
10
20
30
40
50
60
70
80
1995 1998 2001 2004 2007
Low Decentralization
General government debt
Sources: Eurostat; and authors’ calculations.
Figure 4. Fiscal Performance in the European Union, 1995–2008
AUT
BEL
BUL
CYP
CZE
DEU
DNK
ESP
EST
FIN
FRA
GBR
GRC
HUN
IRL
ITA
LTU
LUX
LVA
MLT
NLD
POL
PRT
ROM
SVK
SVN
SWE
-8
-6
-4
-2
0
2
4
0 20 40 60 80
Gen
eral
Gov
ernm
ent C
yclic
ally
Ad
just
ed B
alan
ce(a
vg, 1
995-
2008
, per
cent
pot
entia
l GD
P)
Subnational Spending Share in General Government Spending , (avg, 1995-2008, Percent)
(Panel a)
AUT
BEL
BUL
CYP CZEDEU
DNK
ESP
EST
FIN
FRA
GBRGRC
HUN
IRL
ITA
LTULUX
LVA
MLT
NLD
POLPRT
ROM
SVK
SVN
SWE
-70
-60
-50
-40
-30
-20
-10
0
10
20
30
40
-20 -10 0 10 20
Ch
ange
in G
ener
al G
over
nmen
t Deb
t, 19
95-2
008
(Per
cen
t of G
DP
)
Change of Subnational Spending Share in General Government Spending, (1995-2008, Percent)
(Panel b)
Sources: Eurostat; European Commission; IMF; and authors’ calculations.

11
How can the central government control overall fiscal performance in the context of decentralization? We explore two potential channels: first, through unfunded mandates whereby more spending responsibilities are assigned to subnational governments but are not matched by commensurate resources (transfers or own revenues) and second, through the use of fiscal rules.
Stylized fact 2. Expenditure decentralization has outpaced the decentralization of resources to subnational governments (own revenue and transfers).
Subnational spending rose by 3¾ percentage points as a share of general government spending between 1995 and 2009, whereas the average increase in subnational own revenues and transfers accounted for only 2½ percentage points (Figure 5). Since rising own revenue sources did not kept up with the increase in subnational spending, vertical imbalances—measured by the gap between spending and revenue decentralization—increased over time. While transfers also generally increased, they fell behind the widening vertical imbalances, resulting in larger subnational deficits. This may suggest unfunded mandates and rationing of resources to subnational governments. That is, subnational governments would have been forced to implement expenditure savings—particularly if borrowing was constrained. In turn, decentralization of spending responsibilities without commensurate transfers and reassignment of tax instruments may have improved the fiscal position of the center and thus, of the general government.
Stylized fact 3. Subnational rules do not appear to have an effect on fiscal performance.
Although the overall fiscal rule index11 has a positive relationship with the general government balance, the subnational fiscal rule index does not show a clear relationship (Figure 6). The absence of a strong correlation between the strength of subnational fiscal rules and fiscal performance could also indicate that the rules are not always effective due to weak implementation and bailouts as mentioned earlier.
11 The overall fiscal rules index includes all rules on the general, central, or subnational governments.

12
Figure 5. Increase in Spending and Revenue Decentralization (In percent of general government spending)
-20
-15
-10
-5
0
5
10
15
20
Changes in Share of Subnational Spending 1995-2009
Average=3.79
-20
-15
-10
-5
0
5
10
15
20
Change in Share of Subnational Revenue, 1995-2009
Average=1.09
-20
-10
0
10
20
Change in Share of Net transfers , 1995-2009
Average=1.4
Sources: Eurostat; and authors’ calculations.
Figure 6. Fiscal Rules Indices and Fiscal Performance, 2008
AUT
BEL
BULCYP
CZE
DEU
DNK
ESP
EST
FIN
FRA
GBRGRC
HUN
IRL
ITA
LTU
LUX
LVA
MLTNLD
POL
PRT
ROM
SVKSVN
SWE
0.0
0.5
1.0
1.5
2.0
2.5
3.0
3.5
4.0
4.5
-15 -10 -5 0 5
Sub
nat
iona
l Fis
cal R
ule
Inde
x
General Government Cyclically Adjusted Balance(Percent of potential GDP)
AUT
BEL
BUL
CYP
CZE DEU
DNK
ESPEST
FINFRA
GBR
GRC
HUN
IRL
ITA
LTU
LUX
LVA
MLT
NLD
POL
PRT
ROM
SVK
SVN
SWE
-1.5
-1.0
-0.5
0.0
0.5
1.0
1.5
2.0
2.5
-15 -10 -5 0 5
Ove
rall
Fis
cal R
ule
Inde
x
General Government Cyclically Adjusted Balance (Percent of potential GDP)
Sources: Eurostat; European Commission; and authors’ calculations.

13
V. ECONOMETRIC EVIDENCE
To assess more formally the effect of decentralization on fiscal performance, we estimate a fiscal reaction function. This specification follows Bohn (1998) and Debrun et al. (2008). In this model, a country’s fiscal policy can be described as the response of the general government primary balance to (1) cyclical fluctuations; (2) general government debt; and (3) institutional and political determinants. The estimated equation is:12
,''1110 itiititititit xDecgapdPBPB it (1)
where the indices i, t denote countries, and years, respectively; PB is the primary balance to GDP; d is the debt to GDP ratio; gap is the output gap;13 Dec is a vector comprising, depending on the specification, spending decentralization (subnational spending as a ratio of general government spending), revenue decentralization (subnational own revenues as a share of general government revenues), transfer dependency (transfers to subnationals as a share of total subnational revenues), and interactions among these variables; x denotes other control variables, including relevant political and fiscal institutions; i represents country-
specific fixed effects; and it is a time- and country-specific error term. In line with Gali and
Perotti (2003), we use the cyclically adjusted primary balance as the dependent variable to capture a country’s discretionary fiscal policy. In this model, we expect to be positive as
long as the government reacts to the existing stock of debt to ensure long-run solvency. A positive (negative) value for would indicate fiscal policy is countercyclical (procyclical).
The impact of fiscal decentralization is, however, ambiguous ex ante (as discussed before). A positive (negative) value for the estimated coefficients in would indicate that decentralization improves (hampers) fiscal performance.
The model is estimated using the bias-corrected Least Square Dummy Variable (LSDVC) estimator proposed by Bruno (2005). With standard estimation methodologies, the inclusion of fixed-effects in dynamic panels creates a bias. In particular, even though the within
transformation eliminates the i , by construction the transformed error term (
T
tt,it,i T 1
1 ) is
still correlated with the lagged dependent variable. The bias (which affects all variables) is a function of T, and only as T tends to infinity will the within estimators be consistent. To correct for this problem, we use the LSDVC estimator which approximates the bias to construct a consistent estimator. This method is superior to Instrumental Variables (IV) and
12 We use EU27 data for 1990-2008 constituting an unbalanced panel (reflecting data availability).
13 The output gap is defined as actual GDP less potential GDP as a percent of the latter. In particular, positive gap values indicate that the economy is operating above potential.
14
Generalized Method of Moments (GMM) in narrow samples (small time dimension relative to the number of units in the panel) as it is the case here.
A. Baseline results
Overall, the estimates suggest that decentralization improves fiscal outcomes. In particular, spending decentralization seems to improve fiscal performance irrespective of the model specification (Table 2), in line with stylized fact 1. As expected, there is significant degree of persistence in the CAPB and our results are consistent with the stabilization response to debt developments. However, in contrast with other studies (see, Debrun et al., 2008; and Gali and Perotti, 2003), there is evidence of a procyclical fiscal policy, as indicated by the negative coefficient of the output gap. Concerning political variables, the results suggest that there is an electoral cycle in Europe, as fiscal performance worsens on election years.14
Nevertheless, not all aspects of decentralization are positive. First, transfer dependency diminishes the positive impact of spending decentralization on fiscal performance (Table 2, column 3). A possible reason for this result is that subnational governments do not fully internalize the costs when an increase in spending is financed through transfers from the center. Second, the fiscal position appears to deteriorate with the degree of revenue decentralization (Table 2, column 2-3). Given our results, it is natural to ask how is it possible that higher spending decentralization improved overall fiscal performance, but own revenue decentralization or transfers did not. The results would be consistent with the idea that, once spending is decentralized, the only lever the center has left to maintain fiscal discipline at the subnational level is controlling the resources available to subnational governments; losing this lever could hurt the fiscal position. While the results do not provide a verdict on this issue, we conjecture (as discussed above) that tight subnational government resource constraints (own revenue and transfers) might have been used as rationing mechanisms by the center, contributing to better overall fiscal performance—and that when they were not used in that manner, overall fiscal performance improved to a lesser extent or deteriorated.15
14 Other political and institutional variables were originally included in the regression (different measures of government and political fragmentation; government stability; ideology; existence of autonomous regions; euro entry; and EU accession). The size of the economy was also included in the regression. However, since none of these variables were significant they were dropped to keep a parsimonious specification.
15 Nevertheless, our results should be interpreted with caution as the measure of revenue decentralization used in this paper (subnational own revenue as a share of general government revenue) may capture other effects apart from revenue autonomy. For example, a decline in the general government revenue, keeping subnational revenue constant, would result in a higher level of decentralization according to this metric. This—other things being equal—would also lead to deterioration in the general government balance. However, that deterioration is not necessarily related to higher revenue decentralization.

15
To assess whether these results vary with the institutional setup, we analyze the role of fiscal rules and the importance of coordination among different levels of government.
First, we include an overall fiscal rule index measuring the stringency of rules-based fiscal governance in our baseline specification. Although our estimates show that the overall fiscal rules improve performance in line with the results of the literature (Table 3, column 1), central and subnational fiscal rules do not matter when considered separately (Table 3, column 2), consistent with stylized fact 3. The positive effect of overall fiscal rules may not be very robust, however, as discussed below. This could potentially reflect that rule implementation is weak, or that rules are introduced where fiscal performance is weaker in the first instance.16 Another possible explanation is that subnational fiscal rules might not be sufficient to ensure good performance when spending mandates of subnational governments are underfunded.
Second, we test whether the effect of spending decentralization depends on the existence of rules constraining borrowing at the subnational level. We do not find any significant impact (Table 3, column 3). One potential explanation is that subnational entities are constrained in their access to market irrespective of rules and, thus, spending decisions (and the corresponding impact on overall fiscal performance) are not determined by the their statutory ability to borrow. Similarly, budget-balance rules at the subnational level do not seem to matter either.
Finally, to assess the importance of vertical coordination, we add an interaction between spending decentralization and a dummy variable that takes value 1 if there is a formal coordination mechanism with the subnational governments in the medium-term budgetary framework. This interaction effect turns out not to be statistically significant.
B. Robustness checks
In this section we discuss several sensitivity analyses which were performed to check the robustness of the key results reported above (Table 4). We begin by estimating the model with the general government balance as the dependent variable, and find a similar message as in our baseline specification. Next, we use changes in general government debt as a measure of performance. This variable may be more accurate in capturing the true fiscal performance, as debt increases in many European countries exceeded their fiscal deficits after the introduction of the Stability and Growth Pact (Buti et al., 2007), possibly indicating the use 16 Our results should be interpreted with caution since we do not take into account explicitly the potential endogeneity of fiscal rules (i.e. governments with stronger preference for fiscal discipline are more likely to adopt stronger fiscal rules). Debrun et al. (2008) finds negligible the potential estimator bias introduced by reverse causality in a similar model.
16
of accounting loopholes to circumvent fiscal rules. The latter would be consistent with a loss of significance of the fiscal rules variable when the change in debt is used as left-hand side variable—since the deficit, rather than the debt, was typically considered the most binding constraint in showing compliance with fiscal rules. Indeed, overall fiscal rules turn out to be no longer significant. Consistent with our previous results, we find that spending decentralization reduces debt accumulation and that this benefit is reduced when transfer dependency is high. Also, revenue decentralization induces higher debt increases (or lower debt reductions).
The panel approach raises the question of whether the results hold for different subsamples. Thus, we explore whether the impact of fiscal decentralization in the countries that joined the EU in 2004 or thereafter (NMS for short) is similar to the remaining 15 countries (EU15). In this case, we find that the decentralization variables lose their significance in the sample of NMS countries although results still hold for the EU15 (Table 4, columns 3-4). As a flip-side, fiscal rules only matter in NMS countries. Nevertheless, these results should be interpreted with caution as the NMS sample is too short and there is not as much variation in the measures of decentralization among those countries (all highly decentralized countries are EU15 members).
To control for the stability of our estimates over time, we split the sample in 1999—the first year of the Stability and Growth Pact (SGP). No major difference emerges between the two sample periods except for the role of fiscal rules that lose significance before the introduction of the SGP. This result is clearly driven by the EU15 countries and could possibly indicate that, in the run up to the euro, fiscal discipline was observed even in the absence of rules. To eliminate the potential effect of the recent crisis we exclude the year 2008 from our sample and find that all results remain unchanged. Finally, excluding one country at a time to control for possible outliers does not significantly alter our estimates except for fiscal rules that are not significant in most cases.17
VI. CONCLUSIONS
This paper provides new evidence on the impact of decentralization on fiscal behavior, focusing on the EU. Our paper contributes to the literature in two main respects. First, we look at different dimensions of fiscal decentralization (expenditure and revenue decentralization, as well as transfer dependency) and their interactions. Second, we take into account whether fiscal institutions geared toward maintaining budgetary discipline among subnational entities can offset the potential fiscal risks of decentralization.
17 Results are not reported here in the interest of brevity.

17
Our results show that fiscal decentralization may improve fiscal performance. First, we find that spending decentralization improves the fiscal position of the general government. This is consistent with the efficiency arguments in favor of spending autonomy. Nevertheless, high transfer dependency reduces the positive effect of spending decentralization. Moreover, revenue autonomy appears to weaken fiscal performance at the general government level. As discussed below, these results could be evidence that resource rationing by the central government has been used to ensure budgetary discipline on subnational governments. Still, further research is needed as one cannot rule out that these results are driven by the use of imperfect measures of decentralization (which reflect data constraints).
Results on subnational fiscal rules suggest that they have not played a material role on fiscal performance. A possible explanation is that fiscal rules in the EU might be relatively weak since the center has considerable discretion in addressing breaches to the rule. To the extent that rules are being breached due to politically sensitive spending that is difficult to control (e.g., health care), the central government may need to compensate the subnational governments—thus rendering the rules nonbinding. Another possible explanation is that subnational fiscal rules only address the problem of fiscal indiscipline. Therefore, they may not be sufficient to ensure good performance if the main problem faced by subnational government is one of unfunded mandates. These findings are, however, subject to caveats as the numerical fiscal institutions’ indicators used in the econometric analysis may not capture well the complexities of interactions between the center and the subnational levels of government.
18
Table 1. Features of Subnational Governments
Sub-national government tiers
CountryNational
GovernmentDecentralization
(2009)BUL Unitary lowCYP Unitary lowLUX Unitary lowMLT Unitary lowSVN Unitary lowEST Unitary mediumLTU Unitary mediumLVA Unitary mediumFIN Unitary high
GRC Unitary lowIRL Unitary lowPRT Unitary lowSVK Unitary lowAUT Federal mediumCZE Unitary mediumHUN Unitary mediumROM Unitary mediumDNK Unitary highNLD Unitary highSWE Unitary highFRA Unitary lowGBR Unitary mediumITA Unitary mediumPOL Unitary mediumBEL Federal highDEU Federal highESP Unitary high
Three
One
Two
Sources: CCRE-CEMR EU subnational governments: 2009 key figures, Dexia February 2011; authors’ calculations.

19
Estimator: LSDVC LSDVC LSDVC FE
(1) (2) (3) (4)
Lagged dependent variable 0.575*** 0.552*** 0.504*** 0.336***
(0.0515) (0.0532) (0.0516) (0.0402)Lagged government debt 0.0455*** 0.0448*** 0.0563*** 0.0083
(0.0134) (0.0134) (0.0136) (0.0105)Lagged output gap -0.263*** -0.270*** -0.304*** -0.282***
(0.0423) (0.0419) (0.0416) (0.0356)Spending decentralization 0.0730** 0.165*** 0.562*** 0.801***
(0.0366) (0.0539) (0.146) (0.115)Revenue decentralization -0.203*** -0.563*** -0.685***
(0.078) (0.152) (0.116)Transfer dependency -0.0337
(0.0206)Spending decentralization x Transfer dependency
-0.00485*** -0.00651***
(0.00154) (0.00119)Parliamentary election -0.479** -0.492** -0.445** -0.445***
(0.193) (0.192) (-0.19) (0.171)
Constant -5.882***(1.008)
Number of observations: 322 322 322 322Number of countries 27 27 27 27Fixed effects (F-test) 8.48***Robust standard errors in parentheses. *** p<0.01, ** p<0.05, * p<0.1
1/ Dependent variable is the general government primary cyclically adjusted balance. LSDVC accounts for the f ixed-effects.
small sample bias in dynamic panels.
Table 2. Fiscal Decentralization and Fiscal Performance 1/

20
(1) (2) (3) (4) (5) (6) (7)
Lagged dependent variable 0.498*** 0.504*** 0.508*** 0.505*** 0.504*** 0.505*** 0.500***
(0.0514) (0.0516) (-0.052) (0.0519) (0.0519) (0.0519) (-0.051)Lagged government debt 0.0585*** 0.0537*** 0.0565*** 0.0559*** 0.0563*** 0.0562*** 0.0580***
(0.0137) (0.0145) (0.0136) (0.0135) (0.0136) (0.0136) (0.0136)Lagged output gap -0.320*** -0.312*** -0.301*** -0.303*** -0.304*** -0.304*** -0.319***
(0.0431) (0.0444) (0.0427) (0.0419) (0.0425) (0.0414) (0.0438)Spending decentralization 0.529*** 0.567*** 0.583*** 0.567*** 0.562*** 0.560*** 0.534***
(0.148) (0.147) (0.152) (0.144) (0.146) (0.147) (0.154)Revenue decentralization -0.555*** -0.556*** -0.559*** -0.566*** -0.564*** -0.561*** -0.558***
(0.152) (0.158) (0.153) (0.149) (0.152) (0.151) (0.156)Spending decentralization x Transfer dependency
-0.00462*** -0.00497*** -0.00504*** -0.00490*** -0.00486*** -0.00484*** -0.00466***
(0.00155) (0.00155) (0.00159) (0.00151) (0.00154) (0.00153) (0.00158)Parliamentary election -0.466** -0.458** -0.446** -0.446** -0.443** -0.445** -0.467**
(0.191) (0.192) (0.192) (-0.19) (-0.19) (0.193) (0.191)Overall fiscal rule index 0.349* 0.345*
(0.195) (0.204)Central fiscal rule index 0.0835
(0.118)Subnational fiscal rule index -0.212
(0.247)
Spending decentralization x Subnational debt rule
-0.00902
(0.0112)
Spending decentralization x Subnational budget balance rule
-0.0162
(0.0555)
Spending decentralization x Central debt rule
-0.00268
(0.013)
Spending decentralization x Central budget balance rule
0.00000211
(0.00749)
Spending decentralization x Coordination dummy
-0.0221
(0.144)
Observations 322 322 322 322 322 322 322Number of countries 27 27 27 27 27 27 27Standard errors in parentheses. *** p<0.01, ** p<0.05, * p<0.1
1/ Dependent variable is the general government primary cyclically adjusted balance.
Table 3. Do Fiscal Institutions Matter ? 1/

21
Dependent variable:General
government balance
Change in debt
CAPB CAPB CAPB CAPB CAPB
EU15 NMS Before 1999 1999-2008 Excl. 2008
(1) (2) (3) (4) (5) (6) (7)
Lagged dependent variable 0.403*** 0.373*** 0.533*** 0.433*** 0.0617 0.549*** 0.485***(0.0462) (0.0598) (0.0588) (0.0808) (-0.105) (0.0661) (0.0463)
Lagged government debt 0.0367*** -0.176*** 0.0415*** 0.0714*** 0.076 0.0606*** 0.0583***(0.0124) (0.0326) (0.0161) (0.0258) (0.0632) (0.0192) (0.0147)
Lagged output gap -0.123*** 0.277*** -0.379*** -0.305*** -0.225 -0.288*** -0.296***(0.0417) (0.0922) (0.0704) (0.0732) (0.177) (0.0419) (0.052)
Spending decentralization 0.948*** -1.086*** 0.699*** 0.392 0.761** 0.844*** 0.489***(0.1380) (0.322) (0.157) (0.306) (0.325) (0.172) (0.148)
Revenue decentralization -0.901*** 0.820*** -0.728*** -0.388 -0.678** -0.881*** -0.502***-0.142 (0.315) (0.169) (0.263) (0.328) (0.174) (0.147)
Spending decentralization x Transfer dependency
-0.00847*** 0.0102*** -0.00684*** -0.00311 -0.00646** -0.00808*** -0.00429***
(0.0014) (0.00348) (0.00161) (-0.0028) (0.00316) (0.00173) (0.00151)
Parliamentary election -0.509*** 0.109 -0.39 -0.536 0.49 -0.671*** -0.421**(0.1840) (0.46) (0.245) (0.38) (0.357) (0.252) (0.185)
Overall fiscal rule index 0.464** -0.0994 -0.164 0.889** 0.583 0.785** 0.351(0.1920) (0.609) (0.269) (0.415) (0.391) (0.312) (0.225)
Observations 322 300 195 127 65 235 295
Number of countries 27 27 15 12 22 27 27
Standard errors in parentheses. *** p<0.01, ** p<0.05, * p<0.1.
Table 4. Robustness Checks

22
Appendix 1. Expenditure Assignments to Subnational Governments in the European Union
BUL EST LTU LUX LVA
ED
UC
AT
ION
●Preschool education●Primary and secondary education●Vocational training
●Preschool education●Primary and secondary education
●Primary and secondary education (except teachers' wages)
●Primary and secondary education●Vocational training●Higher education
●Primary and secondary education (except teachers' wages)
HE
AL
TH
●Hospitals●Public health●Tertiary care and psychiatric hospitals●Polyclinics●Some primary care and drugs
●Public health●Polyclinics●Municipal hospitals●Primary care
● Hospitals ●Primary health care, ambulance services
●Hospitals●Personal health
●Tertiary care●Polyclinics medicine ●Some primary care
WE
LF
AR
E
●Welfare services●Care for the elderly ●Other social assistance
●Temporary social benefits●Day care ●Care for the elderly ●Care for the homeless ●Care for the handicapped
●Welfare homes●Care for the homeless●Care for the disabled ●Care for orphans
AUT CZE DNK HUN IRL NDL PRT ROM SWE
ED
UC
AT
ION ●Preschool education
●Primary and secondary education●Vocational training ●Adult education
●Preschool education●Primary education and (executive function only for) secondary education
●Preschool education●Primary education and secondary education ●Adult education
●Preschool education ●Primary and secondary education
●Making nominations to vocational education committees and harbours ●Processing of higher education grants
●Primary and secondary education●Vocational training ●Higher education●Adult education
●Primary and secondary education
None
●Primary and secondary education●Vocational training ●Higher education●Adult education
HE
AL
TH
●Hospitals●Personal health
●Hospitals●Public health
●Public health●Hospitals●Personal health
●Basic healthcare ●Veterinary services only●Hospitals●Personal health
None●Hospitals●Personal health
WE
LF
AR
E
●Family welfare services●Welfare homes ●Social welfare services
●Social welfare services●Family welfare services●Welfare homes
●Family welfare services●Welfare homes●Care for the elderly●Care for the disabled●Care for the homeless ●Social housing
●Family welfare services●Welfare homes
●Family welfare services●Welfare homes
BEL DEU ESP FRA GBR ITA
ED
UC
AT
ION ●Preschool education
●Primary and secondary education●Vocational training ●Adult education●Higher education
●Preschool education●Primary and secondary education●Adult education●Higher education
●Cooperation increation, building and maintenance of schools
●Preschool education●Primary and secondary education●Vocational training ●Higher education●Adult education
●Preschool education●Primary and secondary education●Vocational training ●Higher education●Adult education
●Preschool education ●Primary and secondary education●Vocational training●Adult education
●Preschool education
HE
AL
TH
●Hospitals●Personal health
●Hospitals●Personal health
●Primary care●Hospitals●Personal health
●Hospitals●Personal health
●Hospitals●Personal health
None
WE
LF
AR
E
●Family welfare services●Welfare homes
●Family welfare services●Welfare homes
●Promotion and social rehabilitation
●Family welfare services●Welfare homes
●Family welfare services●Welfare homes
Sources: WorldBank Database of Qualitative Decentralization Indicators; Monasterio-Escudero and Suarez-Pandiello (2002); McLure and Martinez Vazquez (2000); Vigvari (2008); and OECD (2010).
ON
E T
IER
TW
O T
IER
ST
HR
EE
TIE
RS
POL

23
Appendix 2. Fiscal Rules at the Subnational Level in the European Union
Subnational fiscal rules in the EU are mainly budget balance rules or debt rules (Figure A1). Both of these rules have nearly doubled between 1990 and 2005. Budget balance rules are the most common for both sub-national governments as well as for the general government. But, in contrast to that of central government level, expenditure rules are uncommon at the sub-national level. Subnational government rules appear to be more prevalent in countries with higher decentralization and lower transfer dependency.
Figure A1. Fiscal Rules in the EU Member States by Type of Rule and Level of Government, 2008
0
2
4
6
8
10
12
General Government
Central Government
Social Security Regional Government
Local Government
Budget Balance Rule
Debt Rule
Expenditure Rule
Revenue Rule
Source: European Commission Services.
The proportion of countries imposing sanctions on sub-national governments’ non-compliance with a fiscal rule varies significantly by the type of rule in question. In more than one fifth of the countries there are no predefined sanctions at all. While the infringement of a budget balance requirement is sanctioned by more than three quarters of the countries, barely two thirds of those featuring a borrowing constraint, and only a third of those with expenditure or tax limitations penalize non-compliance. Moreover, a large proportion of the possible sanctions are fairly weak or provide a wide margin for discretion—such as giving the central government the option to “recommend actions.”
Only a few countries have absolutely no “escape clauses” allowing for the sub-national government’s (temporary) infringement of fiscal rules. Escape clauses mainly apply in cases of natural or other disasters, or shocks to the subnational government’s revenues or to the local economy (Table A.2). Less than a third of the countries imposing a budget balance requirement do not allow for its temporary infringement under any circumstances. In contrast, this is the case for only about a quarter of countries when it comes to borrowing constraints. In six other cases, escape clauses are not predefined and decided upon on an ad-hoc basis.

24
Appendix Table 2. Sanctions and Escape Clauses by Type of Fiscal Rule (Percent of total rules in the sample)
Rule type
Impose financial sanctions
Sanction officials
Mandate actionsConstrain actions
Other Not predefined
BBR 0.26 0.04 0.26 0.35 0.26 0.22BC 0.21 0.05 0.37 0.26 0.21 0.26EL 0.27 0.00 0.18 0.27 0.18 0.55TL 0.00 0.00 0.11 0.00 0.22 0.67
Shock to local economy
Shock to local revenues
Natural/other disaster
No escape Other Not predefined
BBR 0.13 0.09 0.30 0.30 0.13 0.35BC 0.05 0.05 0.26 0.26 0.05 0.47EL 0.00 0.00 0.18 0.18 0.00 0.64TL 0.00 0.00 0.00 0.00 0.00 1.00
1 applies to 26 countries2 applies to 24 countries
Escape clauses2
Sanctions1
Note. BBR: Budget Balance Rule; BC: Borrowing Constraint; EL: Expenditure Limit; TL: Tax Limit. Source: European Commission Fiscal Rules Questionnaire.
In recent times, subnational governments had to be bailed out by the higher level of government in at least nine EU countries. When a subnational government is faced with a large deficit, it has to either raise taxes to increase its revenues or drastically cut expenses. Due to the common lack of tax autonomy and the high proportion of expenditures mandated by law, subnational governments often do not have much room for maneuver and often turn to—ultimately unsustainable—debt financing. Subnational bailouts have more frequently occurred in more decentralized countries with a higher number of administrative tiers. While only one quarter of the countries with one level of sub-national government have experienced a subnational bailout, the share rises to 44.4 per cent for countries with two tiers and to about two thirds for countries with three tiers of subnational government. Examples include the German federal government’s bailout of two Länder and the bailout of Swedish municipalities in the 1990s (Appendix 3).

25
Appendix 3. Selected Episodes of Subnational Bailouts in the European Union
Country Bailout details Consequences
DEU
● 1992: German Constitutional Court upheld claims of Bremen and Saarland for financial assistance from federal government● 1993: 5-year contract stipulating annual payment of additional grants to the two states (earmarked for reduction of public debts)● States committed to keep annual expenditure growth below 3% and had to deliver regular reports on progress of fiscal consolidations to federal and other state governments ● The target of reducing debts from DM 16 billion in 1992 to DM 11.5 billion in 1998 was missed (debts remained at 16 billion); 1999 extension of the grants until 2004 (but declining annually); further transfers after 2004 excluded
● No differences in credit risks of German states; Germany cannot rely on market discipline to enforce fiscal prudence on state governments
ESP
● When democracy was restored in Spanish city councils in the late 1970s, initial public finance system largely remained in place; its low tax collection capacity and the rising demands of citizens led to overspending and over-borrowing● 1980: The center assumed 50% of the local authorities' debt burden without solving the systemic problem● 1983: Central government covered by grants the current deficits; granted local governments an absolute freedom for setting tax rates
● Spanish constitutional court declared anti-constitutional the rule granting local government tax autonomy to this extent ● Local governments had to return the tax revenues thusly collected, again, aggravating their financial position● In 1988, wide ranging reform of local finances was enacted
HUN
● 1999: one-third of all localities applied for deficit grants, which are available for local governments who have deficits through no fault of their own or local governments that go bankrupt;● Even though grants are made only to assist governments in covering mandatory tasks, deficit grants provided for a soft budget constraint in the system, as local governments are able to increase their grant revenues through behavioral changes
● Since 1996-1997, the central government has improved transparency and strengthened audit procedures
ITA
● 1977: Increase of transfers from the center by 300%; simultaneous introduction of fiscal rules, e.g. expenditure limitation and borrowing constraints● 1978: center assumed responsibility for debts accumulated by municipal governments before 1977
● Tight control of local expenditures did not solve the soft budget-constraint problem● Public finance reforms in the 1990s reduced the role of transfers and increased revenue and spending autonomy of local governments to induce responsibility
SWE
● 1992 city of Haninge turned to the central government for financial assitance because it was was unable to take care of the debts of the city-owned housing company● 1995 central government assumed responsibility for the debt owed by housing company and extended an extral loan the company● Central government gave an extra grant to the city to pay back the remaining debts of the housing company● The city lost almost all its shares in the company to the center and was mandated to raise its local tax by one percentage point
● Haninge case found numerous imitators: in 1998, 87 of a total 288 municipal governments had applied at least once for financial assistance
Sources: Ter-Minassian (1997b); von Hagen et al. (2000); Monasterio-Escudero and Suarez-Pandiello (2002); Jourmand and Knogsrud (2003); Wetzel and Papp (2003); Pettersson-Lidbom and Dahlberg (2005); Plekhanov and Singh (2007).
26
Appendix 4. Data Sources and Definitions
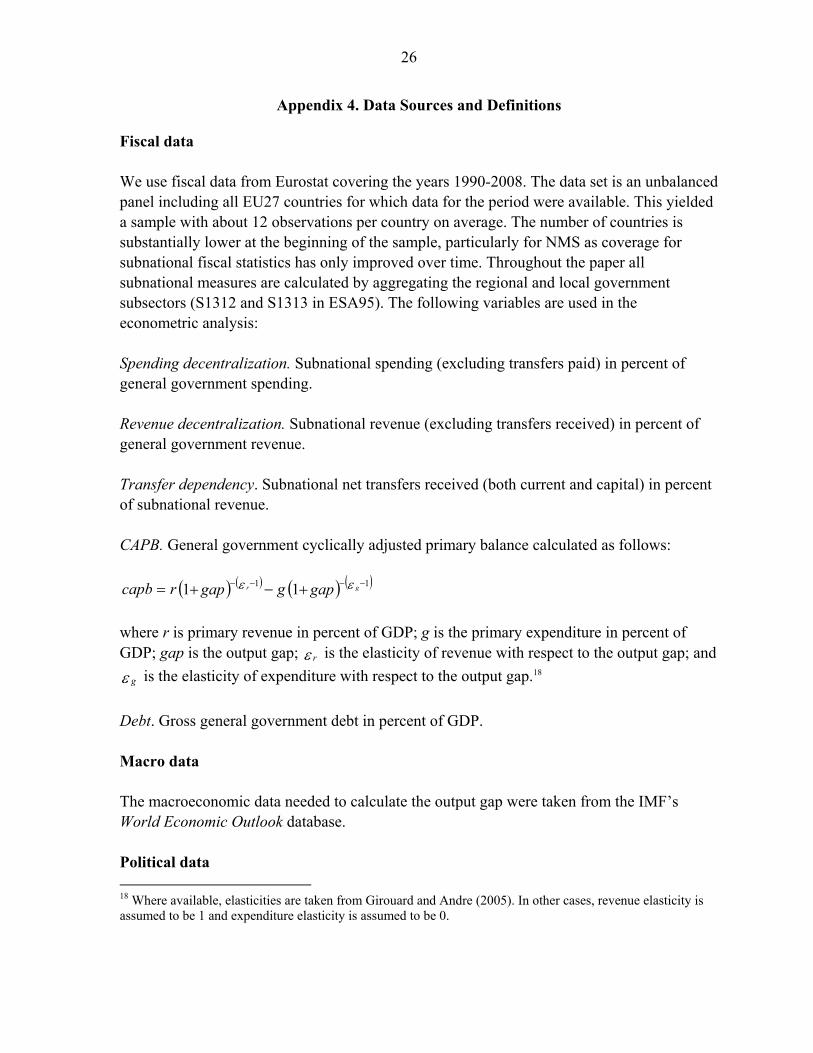
Fiscal data We use fiscal data from Eurostat covering the years 1990-2008. The data set is an unbalanced panel including all EU27 countries for which data for the period were available. This yielded a sample with about 12 observations per country on average. The number of countries is substantially lower at the beginning of the sample, particularly for NMS as coverage for subnational fiscal statistics has only improved over time. Throughout the paper all subnational measures are calculated by aggregating the regional and local government subsectors (S1312 and S1313 in ESA95). The following variables are used in the econometric analysis: Spending decentralization. Subnational spending (excluding transfers paid) in percent of general government spending. Revenue decentralization. Subnational revenue (excluding transfers received) in percent of general government revenue. Transfer dependency. Subnational net transfers received (both current and capital) in percent of subnational revenue. CAPB. General government cyclically adjusted primary balance calculated as follows:
gapggaprcapb gr 11 11
where r is primary revenue in percent of GDP; g is the primary expenditure in percent of GDP; gap is the output gap; r is the elasticity of revenue with respect to the output gap; and
g is the elasticity of expenditure with respect to the output gap.18
Debt. Gross general government debt in percent of GDP. Macro data The macroeconomic data needed to calculate the output gap were taken from the IMF’s World Economic Outlook database. Political data 18 Where available, elasticities are taken from Girouard and Andre (2005). In other cases, revenue elasticity is assumed to be 1 and expenditure elasticity is assumed to be 0.
27
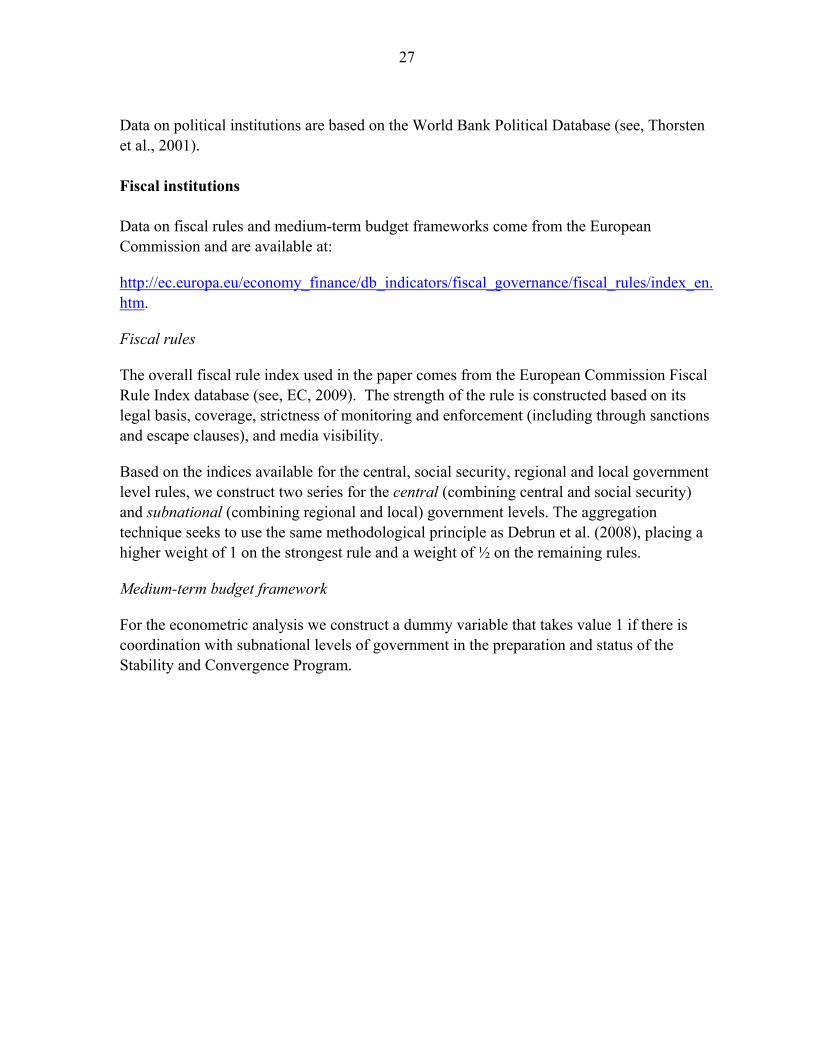
Data on political institutions are based on the World Bank Political Database (see, Thorsten et al., 2001). Fiscal institutions Data on fiscal rules and medium-term budget frameworks come from the European Commission and are available at:
http://ec.europa.eu/economy_finance/db_indicators/fiscal_governance/fiscal_rules/index_en.htm.
Fiscal rules
The overall fiscal rule index used in the paper comes from the European Commission Fiscal Rule Index database (see, EC, 2009). The strength of the rule is constructed based on its legal basis, coverage, strictness of monitoring and enforcement (including through sanctions and escape clauses), and media visibility.
Based on the indices available for the central, social security, regional and local government level rules, we construct two series for the central (combining central and social security) and subnational (combining regional and local) government levels. The aggregation technique seeks to use the same methodological principle as Debrun et al. (2008), placing a higher weight of 1 on the strongest rule and a weight of ½ on the remaining rules.
Medium-term budget framework
For the econometric analysis we construct a dummy variable that takes value 1 if there is coordination with subnational levels of government in the preparation and status of the Stability and Convergence Program.

28
REFERENCES
Afonso, A., and S. Hauptmeier, 2009, “Fiscal Behavior in the European Union. Rules, Fiscal Decentralization and Government Indebtedness,” ECB Working Paper Series No. 1054 (Frankfurt: European Central Bank).
Baskaran T., 2010, “On the Link between Fiscal Decentralization and Public Debt,”
Public Choice, Vol. 145, pp. 351–378. Bohn H., 1998, “The Behavior of US Public Debt and Deficits,” Quarterly Journal of
Economics, Vol. 113, pp. 949–63. Brennan, G. and J. M. Buchanan, 1980, The Power to Tax: Analytical Foundations of a Fiscal
Constitution (Cambridge: Cambridge University Press). Bruno, G., 2005, “Approximating the Bias of the LSDV Estimator for Dynamic Unbalanced
Panel Data Models,” Economics Letters, Vol. 87, pp. 361–66. Buti, M., Nogueira-Martins, J., and A. Turrini, 2007, “From Debt to Deficits and Back:
Political Incentives under Numerical Fiscal Rules,” CESifo Economic Studies, Vol. 53, No. 1, pp. 115–52.
Darby, J., and Muscatelli V.A., and G. Roy, 2005, “Fiscal Consolidation and
Decentralization: A Tale of Two Tiers,” Fiscal Studies, Vol. 26, No. 2, pp. 169–95. Debrun, X., Moulin, L., Turrini, A., Ayuso-i-Casals, J., and M. Kumar, 2008, “Tied to the
Mast? National Fiscal Rules in the European Union,” Economic Policy, Vol. 23, No. 54, pp. 297–362.
De Mello, L., 2007, “Local Government Finances: The Link Between Intergovernmental
Transfers and Net Worth,” OECD Economics Department Working Papers No. 581 (Paris: Organization for Economic Cooperation and Development).
European Commission, 2009, “Public Finances in EMU,” European Economy, No. 4, 2008. Fornasari, F., Webb S. B., and H. Zou 2000, “The Macroeconomic Impact of Decentralized
Spending and Deficits: International Evidence,” Annals of Economics and Finance, Vol. 1, pp. 403–33.
Gali, J., and R. Perotti, 2003, “Fiscal Policy and Monetary Integration in Europe,” Economic
Policy, Vol. 18, No. 37, pp. 533–72.

29
Girouard, G., and C. André, 2005, "Measuring Cyclically-adjusted Budget Balances for OECD Countries," OECD Economics Department Working Papers 434 (Paris: Organization for Economic Cooperation and Development).
International Monetary Fund, 2009, “Macro Policy Lessons for a Sound Design of Fiscal
Decentralization,” IMF Board Paper SM/09/208. (Washington). Jourmaud, First name, and First name Kongsrud, 2003, “Fiscal Relations Across
Government Levels,” OECD Economic Department Working Paper 375 (Paris: Organization for Economic Cooperation and Development).
McLure, C., and J. Martinez-Vazquez, 2000, “The Assignment of Revenues and Expenditures in Intergovernmental Fiscal Relations,” Core course on Intergovernmental Relations and Local Financial Management, World Bank Institute, No. 1995 (Washington: World Bank).
Monasterio-Escudero, C., and & Suarez-Pandiello, 2002, “Local Government Financing and Borrowing: Spain” in Local Public Finance in Europe: Balancing the Budget and Controlling Debt, B. Dafflon (Cheltenham, United Kingdom: Edward Elgar).
Neyapti, B., 2010, “Fiscal Decentralization and Deficits: International Evidence,” European Journal of Political Economy, Vol. 26, pp. 155–66.
Oates, Wallace, 1972, Fiscal Federalism, (New York: Hartcourt Brace Jovanovich). Oates, W. E., 2006, “On Theory and Practice of Fiscal Decentralization,” IFIR Working
Paper Series, 2006–05 (Lexington: Institute for Federalism & Intergovernmental Relations).
OECD, 2010, “The Interface between Subnational and National Levels of Government,”
Better Regulation in Europe: Ireland (Paris: Organization for Economic Cooperation and Development).
Pettersson-Lidbom, P., and first name Dahlberg, M., 2005, “An Empirical Approach for
Estimating the Causal Effect of Soft Budget Constraints on Economic Outcomes,”
Plekhanov, A., and R. Singh, 2007, “How Should Subnational Government Borrowing Be Regulated? Some Cross-Country Empirical Evidence,” IMF Staff Papers, Vol. 53. No. 3.
Rodden, J., 2002, “The Dilemma of Fiscal Federalism: Grants and Fiscal Performance
around the World,” American Journal of Political Science, Vol. 46, No. 3, pp. 670–87.

30
Rodden, J., G. S. Eskeland, and J. Litvack, 2003, “Fiscal Decentralization and the Challenges of Hard Budget Constraint,” The MIT Press.
Rodden, J., and E. Wibbels, 2009, “Fiscal Decentralization and the Business Cycle: An
Empirical Study of Seven Federations,” Economics and Politics, Vol. 22, No. 1. Saltman, R. B., 2008, “Decentralization, Re-centralization and Future European Health
Policy,” European Journal of Public Health, Vol. 18, No. 2, 104–106. Sutherland, D., R. Price, and I. Joumard, 2005, “Fiscal Rules for Sub-Central Governments:
Design and Impact,” OECD Economics Department Working Papers No. 465, ECO/WKP(2005)52.
Tanzi, V., 1995, “Fiscal federalism and decentralization: A review of some efficiency and
macroeconomic aspects,” In: M. Bruno and B. Pleskovic, Editors, Annual World Bank Conference on Development Economics, World Bank, Washington, DC, pp. 295–316.
Tanzi, V., 2000, “On Fiscal Federalism: Issues to Worry About,” Unpublished Manuscript. Ter-Minassian, T., 1997a, “Decentralization and Macroeconomic Management,” IMF
Working Paper No. 155, (Washington: International Monetary Fund). Ter-Minassian, T., and J. Craig, 1997b, “Control of Subnational Borrowing” in Ter-
Minassian (ed) Fiscal Federalism in Theory and Practice (Washington D.C.: International Monetary Fund).
Ter-Minassian, T., 2007, “Fiscal Rules for Subnational Governments: Can they Promote
Fiscal Discipline?,” OECD Journal on Budgeting, Vol. 6-No. 3 (Paris: Organization for Economic Co-operation and Development).
Thornton, J., 2009, “The (non)impact of Revenue Decentralization on Fiscal Deficits: Some
Evidence from OECD Countries,” Applied Economics Letters, Vol. 16, No. 14, pp. 1461–66.
Thorsten B., Clarke, G., Groff, A., Keefer, P., and P. Walsh, 2001. "New Tools in
Comparative Political Economy: The Database of Political Institutions." 15:1, 165-176 (September), World Bank Economic Review.
Vigvari, Andras, 2008, “Facts and Figures of the Hungarian Subnational Government System,” (Budapest: Local and Regional Monitoring Institute).

31
Von Hagen, J., Bordignon, B.S. Grewal, Peterson, P., Seitz, H., and M. Dahlberg, 2000, "Subnational Government Bailouts in OECD Countries: Four Case Studies," IADB Research Network Working Papers, no. No. R-399.
Wetzel, D. and A. Papp, 2003, “Strengthening Hard Budget Constraints in Hungary” in Rodden et al. (2003) challenge of hard budget constraints, Cambridge and London: MIT Press, pp. 393-427.