flexible moorings for tidal current turbines
TRANSCRIPT

Department of Mechanical and Aerospace Engineering
Flexible Moorings for Tidal Current Turbines
Author: Audrey E.D. Bowie
Supervisor: Dr. Andrew D. Grant
A thesis submitted in partial fulfilment for the requirement of the degree
Master of Science
Sustainable Engineering: Renewable Energy Systems and the Environment
2012
ii
Copyright Declaration
This thesis is the result of the author’s original research. It has been composed by the
author and has not been previously submitted for examination which has led to the
award of a degree.
The copyright of this thesis belongs to the author under the terms of the United
Kingdom Copyright Acts as qualified by University of Strathclyde Regulation 3.50.
Due acknowledgement must always be made of the use of any material contained in,
or derived from, this thesis.
Signed: Date: 7th September 2012
iii
Abstract
Government subsidy is increasing the focus on renewable energy, within which tidal
energy has the advantage of being both efficient and predictable. The UK is a world
leader in this field, and has some of the most promising naturally occurring sites. The
challenges of the underwater location and the distance of generation sites from the
transmission network have thus far prevented effective ways of harnessing this energy
source.
There is great variation in the concepts which are being developed and no industry
standard approach has yet emerged. Tidal energy, despite its potential and conceptual
promise has not yet been proved to be economically viable. The cost of tidal energy
needs to be reduced to between 10 percent and 20 precent of its current cost to be fully
competitive with traditional types of generation. Innovative next generation concepts
show the most potential for being able to reach these targets in terms of simplicity,
flexibility and cost.
Flexible moorings for tidal current turbines offer advantages in both installation and
maintenance but require careful consideration in the design phase. Until the tidal energy
sector builds up its own body of experience in flexible moorings, the best information is
likely to come from other marine industries.
Respected international agencies have begun to extend their existing guidelines for
design, maintenance and safety to the marine energy sector. These guidelines have
many common themes but many differences of definition and standards. Reflecting pace
of new technology and trends, the guidelines tend to focus on principles and encourage
a case by case approach.
Elastomeric mooring tendons (widely used in the yachting and navigation buoy
industries) have excellent properties allowing significantly greater compliance than
traditional types of mooring line as well as potentially reduced costs and a maximisation
of energy generation. They are not a panacea and their practicality and economic
feasibility need to be evaluated on a case by case basis according to the particular
circumstances and location.
Intrinsic uncertainties about the performance and lifetime upkeep of the elastomeric
technology means that only experience will tell whether it is the best option for tidal
current turbines.

iv
Acknowledgements
I would like to thank Dr. Andrew Grant for his guidance and support throughout this
project, particularly in getting it off the ground after a difficult start. I would also like
to thank my family for their continuous support in all matters throughout the duration
of the project.

v
Contents
Abstract .................................................................................................................... iii
Acknowledgements .................................................................................................. iv
List of Figures ........................................................................................................ viii
List of Tables ........................................................................................................... ix
Glossary of Abbreviations ......................................................................................... x
1 Introduction ........................................................................................................ 1
1.1 Aims ........................................................................................................... 3
2 Tidal Stream Energy ........................................................................................... 4
2.1 Tides ........................................................................................................... 4
2.2 Challenges facing tidal stream energy ......................................................... 7
3 Tidal stream energy converters using flexible moorings ..................................... 8
3.1 Tidal ........................................................................................................... 9
4 Why flexible moorings? .................................................................................... 10
4.1 Pros ............................................................................................................ 10
4.2 Cons ........................................................................................................... 11
5 The costs of tidal energy conversion .................................................................. 13
5.1 Capital cost ................................................................................................ 13
5.2 Operations costs ......................................................................................... 14
5.3 Maintenance costs ...................................................................................... 14
5.3.1 Planned Maintenance .......................................................................... 15
5.3.2 Unplanned Maintenance ...................................................................... 15
5.3.3 Considerations for maintenance ........................................................... 16
6 Industry experience with mooring maintenance ................................................. 17
6.1 Navigation buoys ....................................................................................... 17
6.2 Wave energy .............................................................................................. 18
7 Mooring guidelines and regulations ................................................................... 19

vi
7.1 Mooring system guidelines ......................................................................... 21
7.2 Mooring maintenance guidelines ................................................................ 23
8 Mooring systems ............................................................................................... 25
8.1 Mooring function ....................................................................................... 25
8.1.1 Station keeping.................................................................................... 25
8.1.2 Compliance ......................................................................................... 25
8.2 Mooring Configurations ............................................................................. 26
8.2.1 Single point mooring ........................................................................... 26
8.2.2 Spread mooring ................................................................................... 26
8.2.3 Catenary mooring ................................................................................ 26
8.2.4 Taut mooring....................................................................................... 27
8.3 Anchor types .............................................................................................. 28
8.3.1 Drag embedment anchors .................................................................... 28
8.3.2 Pile anchor .......................................................................................... 28
8.3.3 Suction pile anchor .............................................................................. 29
8.3.4 Deadweight anchors ............................................................................ 29
8.4 Line Types ................................................................................................. 30
8.4.1 Chain .................................................................................................. 30
8.4.2 Steel wire ropes ................................................................................... 31
8.4.3 Synthetic fibre ropes............................................................................ 32
8.4.4 Elastomeric tension members .............................................................. 34
9 Elastomeric mooring tendons ............................................................................ 39
9.1 Assumptions............................................................................................... 39
9.2 Current velocity ......................................................................................... 40
9.3 Force calculations....................................................................................... 41
9.3.1 Turbine ............................................................................................... 41
9.3.2 Spherical buoy .................................................................................... 42

vii
9.3.3 Hydrofoil ............................................................................................ 44
9.4 Elastic mooring lines .................................................................................. 47
9.4.1 Elastic mooring line – Spherical Buoy ................................................. 47
9.4.2 Elastic mooring line – Hydrofoil ......................................................... 49
9.5 Power Output ............................................................................................. 52
9.6 Behaviour or elastomeric tension members ................................................. 55
10 Economics of flexible moorings ..................................................................... 57
11 Conclusions and Recommendations ............................................................... 60
12 References ..................................................................................................... 62
Appendices ............................................................................................................... 69

viii
List of Figures
Figure 1 - Gravitational forces causing spring and neap tides (Leslie, 2012). ............. 4
Figure 2 - Tidal current velocity profile ..................................................................... 5
Figure 3 - Atlas of UK tidal energy resource (ABPmer, et al., 2004) .......................... 6
Figure 4 - Breakdown of cost centres for first generation tidal energy converter
(Carbon Trust, 2011) ................................................................................................. 8
Figure 5 - Costs and day rates for major components of an installed mooring system
(correct 02/2006) (Orme & Masters, 2006) ............................................................... 14
Figure 6 - Catenary mooring thrash zone .................................................................. 27
Figure 7 - Taut leg mooring construction (Offshore Moorings, 2006) ....................... 28
Figure 8 - Geometry of Modern Studded and Studless Chain (Health and Safety
Executive, 2002) ...................................................................................................... 30
Figure 9 - Typical compositions of fibre ropes (Det Norske Veritas, 2010) ............... 33
Figure 10 - Safety cord on elastic mooring line (IALA, 2010) .................................. 35
Figure 11 - WHOI coil cord elastic mooring design (Irish, et al., 2005) .................... 35
Figure 12 -Termination of rubber mooring cord (Datawell, 2011) ............................ 36
Figure 13 - Hazelett 35 ton mooring rode (Hazelett, 2010) ....................................... 36
Figure 14 - Supflex 30 strand elastic mooring component ......................................... 37
Figure 15 - SEAFLEX® with 8 rubber hawsers (Bengtsson & Ekström, 2012 ) ........ 38
Figure 16 - Velocity profile for 100 meters depth using 1/7th power rule .................. 40
Figure 17 - Height of tidal current turbine with increasing additional buoyancy. ....... 42
Figure 18 - NACA 0012 cross sectional dimensions ................................................. 44
Figure 19 - Turbine height with varying hydrofoil angles of attack for a NACA 0012
shape ........................................................................................................................ 46
Figure 20 - Comparison of the position of turbine with hydrofoil and buoy systems at
3.5m/s current velocity ............................................................................................. 46
Figure 21 - Required elongation of elastomeric tension member – Variable tendon
length 5 meter buoy diameter .................................................................................. 47
Figure 22 - Required elongation of elastomeric tension member – Variable tendon
length 6 meter buoy diameter. ................................................................................. 48
Figure 23 - Required elongation of elastomeric tension member – Variable tendon
length hydrofoil ........................................................................................................ 49

ix
Figure 24 - Comparison of the position of turbine with hydrofoil and buoy systems on
elastic moorings at 3.5m/s current velocity ............................................................... 50
Figure 25 - Required elongation of elastic components - system comparison ............ 50
Figure 26 - Power generation comparison between elastic and inelastic mooring line
for buoy and hydrofoil systems ................................................................................. 53
Figure 27 - The progressive load curve of SEAFLEX® hawser. (Bengtsson &
Ekström, 2012 ) ........................................................................................................ 55
Figure 28 - Buoy system load - elongation curve ...................................................... 56
Figure 29 - Hydrofoil system load - elongation curve ............................................... 56
Figure 30 - Lifetime costs of turbine mooring ........................................................... 57
List of Tables
Table 1 - Marine Current Turbine Technologies Using Flexible Moorings. ................ 9
Table 2 - Standards regarding mooring ..................................................................... 19
Table 3 - Tension limits and safety factors for Quasi-static analysis of mooring lines
(American Petroleum Institute, 2005) ....................................................................... 22
Table 4 - Wire rope constructions and life expectancy (American Petroleum Institute,
2005) ........................................................................................................................ 32
Table 5 - Output of tidal current turbine systems ...................................................... 53
Table 6 – Mooring cost comparison - elastic versus non-elastic mooring line ........... 59

x
Glossary of Abbreviations
ABS - American Bureau of Shipping
API - American Petroleum Institute
DECC - Department for Energy and Climate Change
DNV - Det Norske Veritas
EMEC - European Marine Energy Centre
EU - European Union
FPS - Floating Production Systems
FPSO - Floating Production and Offloading Unit
FPU - Floating Production Unit
g(CO2)- Grams of Carbon Dioxide
HSE - Health and Safety Executive
IACS - International Association of Classification Societies
IALA - International Association of Marine Aids To Navigation and Lighthouse Authorities
MBS - Minimum Break Strength
MOU - Mobile Offshore Unit
NACA - National Advisory Committee for Aeronautics
NLB - Northern Lighthouse Board
NOAA - National Oceanic and Atmospheric Administration
REUK - Renewable energy United Kingdom
ROC - Renewables Obligation Certificate
ROV - Remotely Operated Vehicle
UK - United Kingdom
USA - United States of America

1
1 Introduction
Renewable energy is becoming ever more recognised as an extensive energy resource,
with a global potential for providing sustainable energy to the world’s consumers.
Awareness of climate change and the depletion of fossil fuel reserves, provoking
fluctuations in their costs, are prompting investors to consider renewable energy
generation technologies as an appealing business proposition. The ability to generate
the energy to be consumed domestically can ensure security of supply by reducing the
need for imports of fuels and diversification of generation type.
Governments are pushing for growth in the industry with policies and incentive
schemes to encourage developers and investors alike. The European Union (EU) have
set a target of 20 percent reduction in carbon emissions and 20 percent of final energy
consumption to be from renewable energy sources by 2020 (European Commission,
2012). Compulsory national targets are in place; member states can implement
incentives to ensure that these targets are met.
The UK’s target is to reach 15% energy production from renewable energy sources by
2020. However, the Scottish government have ambitious targets to reach 100% of the
country’s electricity consumption from renewable energy by 2020 (Scottish
Executive, 2011). Whether or not this can be achieved will rely on the technology and
infrastructure being available.
The main support incentive provided by the UK government for renewable
technologies is in the form of Renewables Obligation Certificates, or ROCs. ROCs
are awarded per MWh of electricity produced by renewable sources at present 3
ROCs are provided for each MWh generated from tidal energy and 5 ROCs are
provided per MWh generated from wave energy in Scotland (DECC, 2012).
Compared to onshore wind at 0.9 ROCs per MWH, it is evident from the difference in
ROC value between technologies which areas the UK government are eager to
develop. Electricity suppliers must “pay” 0.158 ROCs per 1MWh of electricity
provided from non renewable sources to UK customers for the period 2012 - 2013. If
the supplier has a shortfall of ROC’s gained from the renewable sources against the
ROCs paid for non renewable sources, they are required to pay a penalty of £40.71
per ROC for 2012 - 2013 (DECC, 2012). These bandings and cost of ROCs are under

2
constant assessment and review to remain in line with developments and the
economic climate.
The marine renewable energy industry has had increasing of attention in recent years
as a result of all these factors. Development of new technologies is being pushed
forward at high speed, in order to meet these targets, and in so doing, address supply
and environmental issues. Wave and tidal energy converters are predicted to have
around 6 g(CO2)/kWh emissions throughout their lifecycle. Compared with the most
efficient type of fossil fuel energy generation, Combined Cycle Gas Turbines which
produce 446 g(CO2)/kWh of emissions throughout their service life (DTI, 2005),
marine energy converters are a significant improvement and can contribute greatly to
proposed targets.
Tidal energy conversion is a great resource in the UK with an estimated “10 to 15% of
the global harvestable tidal resource” (Johnstone, et al., 2012). Many consider the UK
leaders in the development of tidal technology, with such substantial tidal resources,
and the worlds only dedicated test centre for tidal energy converters, European Marine
Energy Centre in Orkney which is a test ground for emerging concepts of tidal energy
capture.
Unlike most other types of renewable energy; tidal energy is an accurately predictable
resource. Wind and wave energy is stochastic and prediction relies on accurate
weather predictions. Despite developments in forecasting techniques, is an art yet to
be perfected, particularly in UK climates. In a future with an energy mix composed of
a high proportion of stochastic generation, the predictable, although variable, energy
supplied by tidal energy conversion will be able to provide a stable base load to the
grid.
3
1.1 Aims
In an unsubsidised world, it is essential that the cost of tidal current energy must be
economically competitive with traditional types of energy generation. For this to
happen, the cost of tidal current energy must be reduced to less than 20 percent of its
current cost. This thesis will set out to establish how the industry should approach the
reduction of the cost of energy by:
• Identification of cost centres which could be reduced significantly.
• Assess existing marine energy experience which can be drawn upon for use in
the development and implementation of tidal energy generation technology.
• Investigation of options for flexible moorings for tidal current turbines as an
option to reduce costs and improve performance.
• Examine the functional and economic feasibility and requirements for the use
of elastomeric mooring tendons in the moorings of tidal current turbines.
There is a lot of development ongoing to improve the performance and reduce the
costs of tidal current turbines themselves. This thesis will look at how flexible
moorings can seek to answer the question: “Can elastomeric mooring lines help
towards the economic viability of tidal current energy generation?”

4
2 Tidal Stream Energy
Tidal current energy generation is a rapidly developing industry and the UK has an
excellent resource which could go a long way to contribute to reaching government
targets and supply a significant proportion of its energy consumption. The nature of
the UK’s resource lends itself well to tidal current energy generation in that it is an
ever present, predictable and importantly sustainable resource. The harvesting of this
energy is not without its challenges, which must be addressed in the development of
generating technologies are to become successful.
2.1 Tides
Tides are a consequence of a complex combination of forces; however the key
constituents affecting the tidal cycle are the gravitational forces of the moon and the
sun acting on the Earth’s oceans. These forces cause significant movement of the
water in the oceans; it is this movement which holds a huge amount of energy.
Figure 1 - Gravitational forces causing spring and neap tides (Leslie, 2012).

5
In any one location, there are two high tides and two low tides during one day; this is
a semidiurnal tidal cycle. The time between two high tides is about 12 hours and 24
minutes (NOAA, 2004). The magnitudes of the affecting forces vary between spring
and neap tides.
Spring tides see the largest tidal ranges throughout the tidal cycle, as illustrated in
Figure 1, this is due to the linear alignment of the moon and the sun causing forces to
be combined and cause greater bulges in the oceans.
Neap tides see the smallest tidal range which is due to opposing forces from the sun
and moon which can be described as perpendicular alignment. The complete tidal
cycle is from spring tide to neap tide and back to spring tide, and lasts about 14 days.
The tidal cycle for any given location can be theoretically approximated by a double
sinusoidal function (Frankel, 2002). The resultant tidal velocity throughout the cycle
is represented in Figure 2. The transition between slack tide (0 m/s velocity) and peak
tidal velocity within the cycle are known as flood and ebb tides. The negative
velocities in Figure 2 represent flood tides and ebb tides which flow at approximately
180° to each other.
Figure 2 - Tidal current velocity profile
The tidal cycle causes a great deal of movement of water. There is significant
variation of tidal fluctuation due to landmasses preventing free flow movement of this
-4
-3
-2
-1
0
1
2
3
4
Current Velocity
Tidal Current Velocity Profile

6
water. Where water is forced through relatively narrow channels, high volumes of
water are forced to pass through the channel, creating high current velocities. The
volume of water passing through the channel varies within each semidiurnal tidal
cycle and similarly throughout the complete tidal cycle.
It is this passing of tidal flows which is where tidal stream energy conversion is most
effective. The map in Figure 3 shows the sites around the UK where the velocity of
tidal current is most concentrated.
Figure 3 - Atlas of UK tidal energy resource (ABPmer, et al., 2004)
It is clear from this illustration that there are areas which have a highly concentrated
flow rate. It is estimated that this could supply up to 30GW of electricity; 12 percent
of the UK’s current electricity consumption (DECC, 2012).

7
2.2 Challenges facing tidal stream energy
At present the industry consists predominantly of emerging technologies, with
development and trials of a wide range of concepts taking place. There is not yet any
specifically accepted design, and with the huge range of devices in development, it is
hard to establish which devices will be implemented on a large scale. Tidal stream
energy conversion is not without its challenges, which will need to be overcome if this
resource is to be successfully exploited. The devices which are successful will need to
be designed to overcome these challenges.
Installation of tidal steam devices is, by the nature of the resource, a difficult
procedure. With only minutes of slack tide in each cycle, installation will have to be
rapid and easy. The device must be able to generate electricity during both flow and
ebb tides In addition access to, and maintenance of the device must be considered in
the design process to maximise output and therefore economic viability. The harsh
operating conditions which devices will encounter below the sea are certainly a
challenge to developers. Devices will be subject to bio-fouling and corrosion, as well
as large forces generated by currents and waves.
Connection of devices to electrical transmission lines and transformers underwater is
no mean feat. In addition the UK will require considerable infrastructure development
and improvement to transmit energy generated in potentially remote costal sites,
which are currently not part of the high voltage transmission network. This
development will likely cause cost and environmental concern from the public.
Capital investment is required to progress in the development of these new
technologies. To ensure that tidal energy generation is economically viable, the costs
must be reduced as far as possible. In addition, the financial crisis of recent years has
certainly made funds available for investment more limited and provides further
motivation for reducing the costs of tidal energy conversion.
The Challenge:
To develop solutions to allow the capture of tidal current energy resources in
spite of the numerous hurdles which lie before it.
8
3 Tidal stream energy converters using flexible moorings
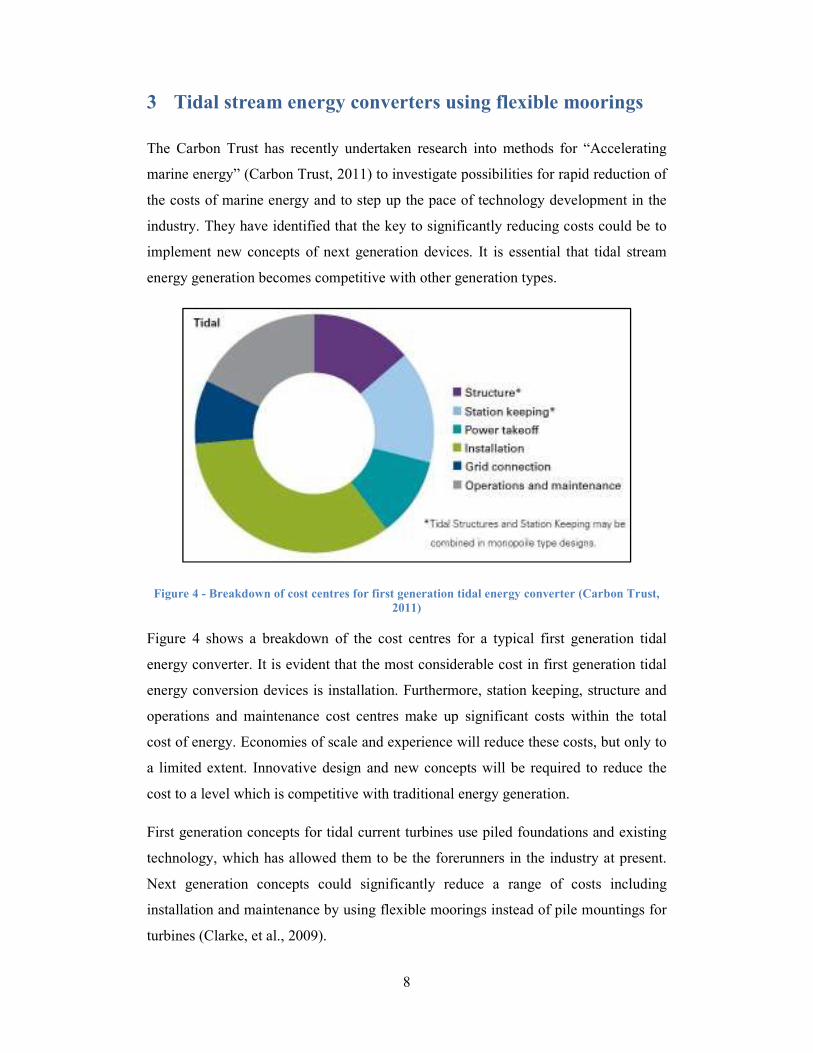
The Carbon Trust has recently undertaken research into methods for “Accelerating
marine energy” (Carbon Trust, 2011) to investigate possibilities for rapid reduction of
the costs of marine energy and to step up the pace of technology development in the
industry. They have identified that the key to significantly reducing costs could be to
implement new concepts of next generation devices. It is essential that tidal stream
energy generation becomes competitive with other generation types.
Figure 4 - Breakdown of cost centres for first generation tidal energy converter (Carbon Trust,
2011)
Figure 4 shows a breakdown of the cost centres for a typical first generation tidal
energy converter. It is evident that the most considerable cost in first generation tidal
energy conversion devices is installation. Furthermore, station keeping, structure and
operations and maintenance cost centres make up significant costs within the total
cost of energy. Economies of scale and experience will reduce these costs, but only to
a limited extent. Innovative design and new concepts will be required to reduce the
cost to a level which is competitive with traditional energy generation.
First generation concepts for tidal current turbines use piled foundations and existing
technology, which has allowed them to be the forerunners in the industry at present.
Next generation concepts could significantly reduce a range of costs including
installation and maintenance by using flexible moorings instead of pile mountings for
turbines (Clarke, et al., 2009).

9
3.1 Tidal
There are about eighty developers of marine current turbines (EMEC, 2012), these
devices are in a range of stages of development from pre-build, design stages to
operational deployment. Of these developers, about 1/8th use flexible moorings rather
than piles or foundations. These developers are listed in Table 1.
Table 1 Marine Current Turbine Technologies Using Flexible Moorings.
Device Developer Development Status
Aquantis “C-plane” Ecomerit
Technologies
Development stages with nothing built
(Ecomerit Technologies , 2011).
Aquascientific
Turbine
Aquascientific 10kW prototype currently deployed
(Aquascientific, 2010).
Bluetech Bluewater Building a prototype at present
(Bluewater, 2011).
Sea Urchin Elemental Energy
Technology Limited
Testing of a small scale prototype is
underway (Elemental Technologies Ltd.,
2012).
DeepGreen
Technology
Minesto Successful sea trials completed and
development of a 3MW array is
underway (Minesto, 2012).
CoRMaT Nautricity Completed sea trials and is producing
commercial scale devices (Nautricity,
2012).
Evopod Ocean Flow Energy Developing a 1/4th scale prototype
following successful trials of their
1/10 scale prototype (Ocean Flow
Energy, 2012).
SR250 Scot Renewables Completed several scaled prototype
testing and are continuing to model
further scale models (Scot Renewables
Tidal Power Ltd., 2012).
TidEL SMD Hydrovision 1MW prototype is being developed
(REUK, 2012).
As yet, none of the technologies are at commercial scale; however the majority of
them have undergone successful trials of scaled prototypes, proving that the concepts
work. Further development and testing of these devices will be required.
10
4 Why flexible moorings?
The number of developers opting for the flexibly moored option is testament to the
benefits which they believe can be gained from this option. There are several aspects
of the lifecycle of a tidal current turbine which can benefit from the use of flexible
moorings. They are however, not without their issues, and a balance must be achieved
between the pros and cons of using flexible mooring systems.
4.1 Pros
The majority of moored tidal current turbine developers agree that by using a flexibly
moored system, the device will be automatically self aligning to the direction of
current flow (Bluewater, 2011) (Minesto, 2012) (Nautricity, 2012) (Ocean Flow
Energy, 2012) (Scotrenewables, 2011) (SMD Hydrovision, 2012). The direction of
tidal flow reverses twice daily; by self-aligning, not only does this ensure that the
device is orientated for maximisation of energy generation, it can eliminate the need
for complex controls for electronic control of the orientation of the device and their
associated cost and maintenance.
The installation of flexible moorings can provide significant cost reductions when
compared with the installation of piles used for many of the first generation designs of
tidal current turbines (Ocean Flow Energy, 2012) (Scotrenewables, 2011). The vessels
required for the installation are relatively much simpler. Moreover, since the nature of
the waters in which the turbines are to be installed have only short periods of slack
tide, the installation of foundations and piles can become a very complex and long
process taking several days, compared to as little as hours for installation of mooring
systems.
Capital costs associated with high volumes of material and its manufacturing costs
required for seabed mounted devices and piled foundation devices can be significantly
reduced (Ocean Flow Energy, 2012) (Scotrenewables, 2011). Additionally, the overall
weigh of the device can be reduced potentially making lifting and transportation of the
device easier (REUK, 2012).
Many of the developers of flexible moored tidal current turbines state that one of the
key features of the device on a moored system is the ease of attachment and removal

11
of the device from the mooring (Minesto, 2012) (Ocean Flow Energy, 2012)
(Scotrenewables, 2011) (REUK, 2012). This ensures that minimal maintenance has to
be done offshore, and that the devices can be removed to land. By removing the
device from its location, the time the vessels are occupied can be reduced. The
maintenance then takes place on land which is logistically much simpler than
offshore, and also provided improved safety of personnel carrying out the
maintenance.
Compliant flexible moorings can provide improved survivability of the device
(Scotrenewables, 2011) (Ocean Flow Energy, 2012) (Aquascientific, 2010). The
devices will be subject to current and wave turbulence in their deployment locations,
and the ability of the mooring system to allow the device to move with these forces
rather than against them can improve the survivability prospects of the device; and
therefore have the potential to reduce the inspection and maintenance requirements.
Tidal currents increase towards the surface of the water. By floating the device, it can
be positioned near or on the surface of the water, increasing the potential energy
available for conversion to electricity, unlike seabed mounted devices (Nautricity,
2012). By maximising the production of the device, its economic viability is
improved.
Enabling deployment in deep water is a possible benefit of the flexibly moored device
(Nautricity, 2012) (SMD Hydrovision, 2012). Installation of designs which require
foundations and piles in deep water is potentially complex and expensive, or even
impossible. Flexible mooring lines and anchors allow deployment in deeper water
zones, where other designs may by impractical.
As well as logistical and functional benefits, the common factor in all of these benefits
is that they have the potential to improve the economic viability of the designs.
4.2 Cons
Whilst the benefits of flexible mooring systems for tidal energy converters are widely
publicised by developers, there is little talk in their documentation of the difficulties
derived from the use of moorings rather than piled or gravity based systems.

12
Tidal energy converters must have an electrical connection to transmit the energy
generated to the grid. Experience from the offshore wind industry can be applied to
solid mountings; however flexible moorings pose this problem in a different light. The
flexible mooring means that the electrical cables must also be able to flex in the same
way as the mooring lines; copper conductors have an elastic elongation of only 0.5%
(Alawa, et al., 2009). Damage to the conductor cables will surely damage the
productivity of the device.
The mooring systems will have to support large loads; the design of the system must
be specifically designed for the environment which it will be installed to ensure the
safety and survivability of the device in the face of significant currents and
turbulence. The reaction of the device and its mooring to fluctuations of velocity and
direction of the tidal currents must also be considered. The device fouling the mooring
is a potential issue with flexible mooring (Clarke, et al., 2008). However if this issue
is considered in the design of the overall system then it may be avoided.
Bio-fouling and corrosion will certainly be factors affecting the device installed in
harsh environments. The mooring system should not affect the function of the device,
and certainly not cause inspection and maintenance requirements at frequencies any
more that that of the device itself. Bio-fouling has the potential to cause increases in
the loads on the mooring system if marine growth is significant, in fact the drag of the
mooring lines, even without any bio-fouling must be considered in the loading of the
system.
The procedure for the deployment of the mooring, its retrieval for inspection and
maintenance, and the method of attachment and retrieval of the device must be
thoroughly considered in the design of the system. Since the one of the principle
benefits of the flexible mooring system over pile and gravity base installation is
reductions in cost, deployment and retrieval of the mooring and device should also be
cost effective and simple procedures.
The mooring should be designed to improve the performance and availability of the
energy conversion device. If this can be achieved considering all the obstacles
described, then flexible moorings provide a potential method of significantly reducing
the cost of energy generated by tidal.

13
5 The costs of tidal energy conversion
There is great pressure on the marine energy industry to progress towards producing
energy at costs which are competitive with traditional methods of electricity
generation. At present the cost of tidal stream energy is between 29-33p/kWh (Carbon
Trust, 2011). To be competitive with traditional generation methods; the cost of tidal
current generation will have to drive towards the cost of the cheapest type of
traditional energy source. This is combined cycle gas turbine generation which is
predicted to cost between 2.5p/kWh and 5p/kWh, considering increases in fuel prices
and cost of emissions (Carbon Trust, 2006). Since future fuel price rises are not
known, there is potential for a large increase in the cost of fossil fuels; allowing cost
competitiveness of renewable methods of electricity generation.
To achieve this cost reduction; the capital cost and operating costs of tidal current
turbines must be reduced as far as possible, and the performance and availability of
the device increased as far as possible. In the long term; the cost will be reduced by
improving economies of scale. Gaining experience with the technologies as they
develop will also help to reduce costs as safety factors can be reduced to the required
level, rather than costly over engineering.
The two main costs during the life of a tidal current turbine can be defined as; capital
cost and operating cost. Within these two areas the cost centres can be divided further
as follows:
5.1 Capital cost
• Device components, manufacturing, and labour.
• Installation
• Station keeping
• Grid connection
Capital costs include all of the upfront costs prior to the device beginning its
productive operation.
14
5.2 Operations costs
• Deployment and retrieval costs
• Overhauls
• Licenses and insurance
• Monitoring of device and performance
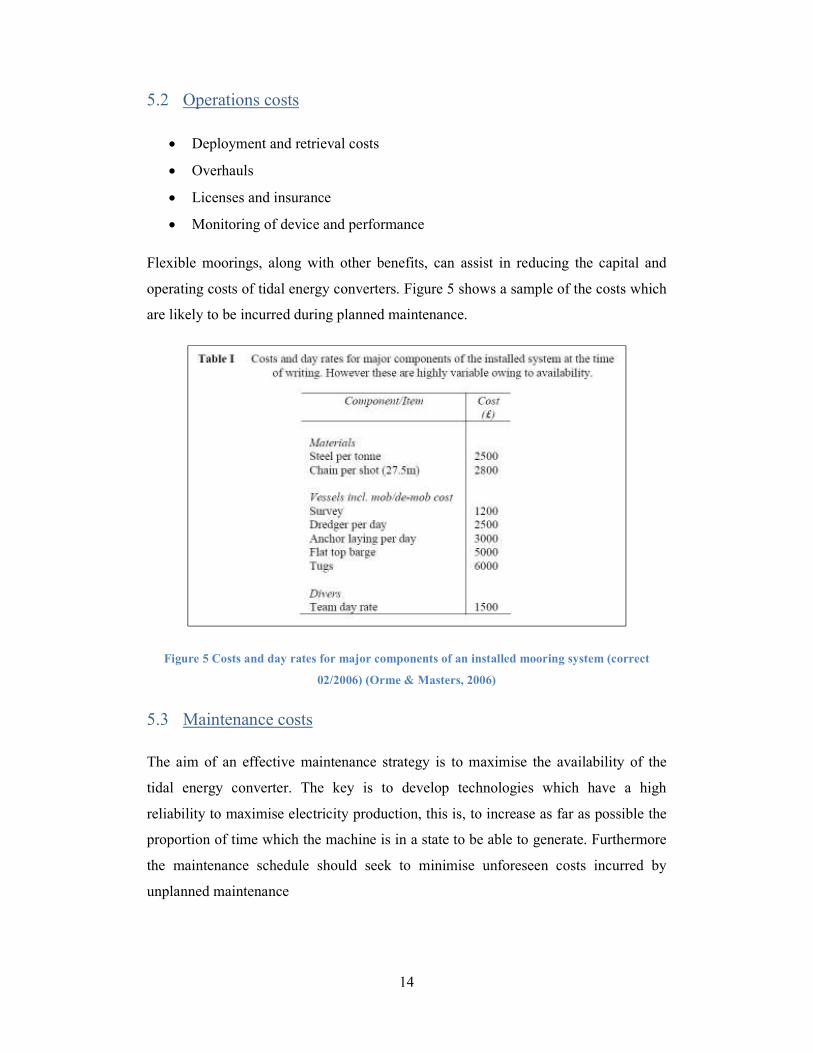
Flexible moorings, along with other benefits, can assist in reducing the capital and
operating costs of tidal energy converters. Figure 5 shows a sample of the costs which
are likely to be incurred during planned maintenance.
Figure 5 Costs and day rates for major components of an installed mooring system (correct
02/2006) (Orme & Masters, 2006)
5.3 Maintenance costs
The aim of an effective maintenance strategy is to maximise the availability of the
tidal energy converter. The key is to develop technologies which have a high
reliability to maximise electricity production, this is, to increase as far as possible the
proportion of time which the machine is in a state to be able to generate. Furthermore
the maintenance schedule should seek to minimise unforeseen costs incurred by
unplanned maintenance

15
Maintenance costs will vary significantly depending on whether it takes place in situ
or onshore. Generally speaking maintenance onshore is much easier due to steady
working conditions, good recourses, reduced requirements for vessels and improved
safety for personnel.
5.3.1 Planned Maintenance
In a planned maintenance schedule, inspection will take place at pre-defined intervals.
Upon each inspection it is decided if repair or replacement of any of the system
components is required. Planned maintenance is defined prior to installation of the
device. There are several methods for selecting inspection and maintenance schedule.
Time based approach: inspection is scheduled at pre-specified intervals. This
approach can be applicable when there is experience of how the structure is affected
by the environment at the location and the resulting degradation is known. For a
system with little or no experience, this is unlikely to be the most suitable program for
inspection.
Condition based approach: The condition of the system is assessed at each inspection.
Depending on the level of wear and degradation, the time until the next inspection is
required will be defined. This interval is likely to be the time until any of the
components needs replacing.
Reliability centred maintenance: A probabilistic approach to maintenance is
calculated according to statistical data on the historical failure rates of each
component. This statistical approach may not consider equipment conditions at
previous inspections. There is a possibility that the maintenance which is carried out
does not match the requirements of the system as each location will have its own
specific requirements. Error from this approach can occur in both excessive and
inadequate maintenance, resulting in excessive costs for replacement, or unavailability
and damages occurring from unpredicted system failure.
5.3.2 Unplanned Maintenance
Unplanned maintenance takes place in emergency situations. The costs of unplanned
maintenance can be significantly higher due to availability of labour and personnel
required for the maintenance; the costs of last minute requirements of resources is

16
subject to premium charges. Unplanned maintenance will occur following a system
failure, and therefore reduce the availability of the device to generate energy, losing
income and incurring a secondary cost.
If, for example, a mooring line breaks it is also possible that damage could occur to
the device, and/ or other devices. The costs incurred by this can also be significant.
Additionally, unplanned maintenance requires that a stock of spare parts is available.
This will incur costs in terms of both purchase and storage of there parts.
Broadly speaking, the aim of the planned maintenance schedule is to ensure that
unplanned maintenance is not required. However it is not always possible to anticipate
component failure and so unforeseen circumstances may occur.
5.3.3 Considerations for maintenance
In the process of planning a maintenance schedule, there are several aspects which
must be considered (Davies, 2009).
The weather conditions which are needed for inspection and maintenance, this is an
important factor for both safety and general accessibility. The sea state in terms of
current flow velocity and wave characteristics must be appropriate to allow safe
access to the system.
The duration of each procedure must be considered, whether it be the time taken to
remove the device and take it ashore, or inspect and repair it in situ. The equipment,
specialist vessels and workers must be considered in terms of availability. The marine
operators will have requirements for inspection intervals and maintenance of devices.
Additionally the procedures to be carried out must be risk assessed.
Each of these considerations are inter-related and the procedure as a whole must be
well thought-out and planned to ensure an effective maintenance system.

17
6 Industry experience with mooring maintenance
With minimal experience in mooring of tidal energy converters, it is essential that the
experience of other industries is drawn upon. The key industries with experience in
mooring systems include; oil and gas, navigation buoys, and more recently floating
offshore wind and wave energy conversion industries, the two later also having
limited long term experience “There are still fewer than ten device-years of
operational experience of tidal current devices at sea” (Mueller & Wallace, 2008).
Deployment of tidal devices for sea testing has to date provided short term
experiences for the behaviour of the devices and their moorings. In a rapidly
expanding industry, experience will accumulate at a high rate. In the mean time
modelling will be used and experience from other industries will perform as a guide;
however there is no substitute for practical experience.
6.1 Navigation buoys
Trinity house (Robinson, 2012) and the Northern Lighthouse Board (NLB) (Owen,
2012) both provided information about the maintenance of the moorings for their
navigation buoys.
Both bodies use 38mm open link U2 150M19 steel chain (Owen, 2012) for their
catenary mooring lines. The market cost of steel will affect the cost but at present
100m of chain will cost around £2500. These moorings are used to moor between 5
and 13 tonne steel spherical buoys.
Maintenance of the buoys is dependent on the environment of the buoy and the
history of chain degradation in the past. NLB maintain their buoys annually or
biennially, and Trinity House maintains their buoys every 1-3 years. The cost of the
inspection for each buoy is nominally £1500 (Robinson, 2012).
The maintenance of the buoys and their moorings entails lifting them onboard the
attending ship to be inspected. The full length of the chain is inspected and measured
for wear down. NLB replace chain at a 25% wear down of the diameter of the chain
links, while Trinity house replace the chain when it is worn, dependant on the
environment 20% in more exposed areas and up to 30% in calmer areas.

18
NLB replace 10 meter sections of chain when they are worn. Trinity house replace the
length of section depending on the wear down, for example the 25m section in the
thrash zone of a 100m length mooring line. Occasionally the whole chain may need to
be replaced where there is a longer length of wear or sections have previously been
replaced. NLB state that the life span of the chain in the thrash zone is around 5 – 6
years. Trinity House also point out that the worst wear occurs in the nips of the chain
links; this is the point where the links grind against each other. Other reasons for
replacement of chain include distortion on degradation of links, however this is less
common.
Whilst this information is useful for catenary moorings, its use for taut moorings is
limited to inspection and maintenance methods, as well as the costs of maintenance.
6.2 Wave energy
The wave energy conversion industry’s leader in terms of experience is Ocean Power
delivery’s Pelamis wave attenuator, with testing of its first full scale device taking
place at EMEC in 2004 and the worlds first wave farm in 2008 in Portugal (Pelamis
Wave Power, 2012). Now with eight years of experience, their experience is the most
the marine energy industry has.
The majority of wave energy converters on flexible moorings use catenary moorings
as a method of shock absorption from the potentially large waves from which it
generates energy. There are a number of concepts in development which use taut
moorings and these will also build experience as they undergo prototyping, testing
and sea trials.

19
7 Mooring guidelines and regulations
Industrial experience can provide substantial resources for the requirements of, and
procedures for mooring tidal current turbines. Table 2 lists the offshore standards and
guidelines for a range of mooring applications which may be used as reference until
the marine energy industry develops their own specific guidelines. Developing
specific guidelines and regulations will require experience; however, some documents
are being released already giving recommendations derived from industry standards
and experience.
Table 2 Standards regarding mooring
Author Title Published Applicable to
(Rawlings,
2010).
Mooring hardware specifications for
marine energy converters
2010 Marine energy
converters
ABS Guidance notes on The Application of
Fibre Rope for Offshore Mooring
March
2012
API API RP 2SK Design and analysis
of station keeping
systems for floating
structures
October
2005
Temporary and
permanent moorings
for floating structures
DNV DNV-OS-E301 Position Mooring October
2010
General, non industry
specific guidelines
DNV DNV-OS-E302 Offshore Mooring
Chain
October
2008
Mooring of MOUs,
FPUs, FPSO’s
DNV DNV-OS-E303 Offshore Mooring
Fibre Ropes
October
2010
Mooring of FPSs,
MOUs. Marine energy
converters.
DNV DNV-OS-E304 Offshore Mooring
Steel Wire Ropes
April 2009 Mooring of MOU,
FPUs, FPSOs.
DNV DNV-OSS-312 Certification of Tidal
and Wave Energy
Converters
October
2008
Wave and tidal energy
converters.
DNV and EMEC
Guidelines on design and operation of
wave energy converters
May 2005
EMEC Guidelines for Marine Energy
Converter Certification Schemes
2009 Marine energy
converters

20
The publication dates of these guidelines and regulations show that these documents
are constantly revised to keep up to date with new technology, methods and trends.
The majority of advice given in these documents is in the form of general principles
rather than specific details. The main sentiment which runs through all of these
documents is that design and maintenance should be decided on a case by case basis
depending on the requirements of the system and its environment.
EMEC Guidelines for Design Basis of Marine
Energy Conversion Systems
2009 Marine energy
converters
EMEC Guidelines for Reliability,
Maintainability and Survivability of
Marine Energy Conversion Systems
2009 Marine energy
converters
G L Noble
Denton
Technical Policy Board - Guidelines for
Moorings
December
2010
HSE Station Keeping 2002
HSE Floating production system – JIP FPS
mooring integrity
2006 Mooring of FPSs.
HSE Design and integrity management of
mobile installation moorings
2004
IACS Guidelines for the Survey of Offshore
Mooring Chain Cable in Use
October
2010
IALA No. 1066 - The Design of Floating Aid
to Navigation Moorings
June 2010 Navigation buoys and
structures
IALA No. 1040 - The Maintenance of Buoys
and Small Aids to Navigation Structures
May 2008 Navigation buoys and
structures
Lloyds
Register
Rules and Regulations for the
Classification of a Floating Offshore
Installation at a Fixed Location
April 2008 Permanent floating
offshore installations.
Lloyds
Register
Guidance on offshore wind farm
certification - Design, build and
operational requirements
April 2012 Offshore wind
Maritime and Coastguard Agency
Mooring, towing or hauling equipment
on all vessels - safe installation and safe
operation
November
2005
Vessels

21
7.1 Mooring system guidelines
The following is a gives a sample of the guidance given in some of the key documents
listed in Table 2.
Det Norske Veritas (DNV) is an independent body who provide technical and
procedural requirements and recommended practice for the offshore industry
including oil and gas and shipping. The aim of the standards provided by DNV is to
“Safeguard life, property and the environment, at sea” (Det Norske Veritas, 2010).
With regards to moorings, their “Recommended practice for position mooring”
provides recommendations for load requirements, system analysis, equipment
selection, monitoring, testing and classification of mooring systems. These
recommendations classify long term mooring as longer than 5 years (Det Norske
Veritas, 2010), applicable to the mooring conditions for tidal current turbines. Fatigue
should also be considered in the design of the system.
Furthermore more specific recommendations on mooring line types DNV have
produced standards for Chain (DNV-OS-E302), Fibre ropes (DNV-OS-E303) and
steel wire ropes (DNV-OS-E304). These specifications do not include
recommendations for the inspection intervals or the expected life cycles of the
mooring lines. They do include criteria for standards which should be maintained
during manufacture. If there is an assurance that there is limited chance of mooring
line defects arising from manufacture, then this reason for the unpredicted breakage of
the mooring system is likely to be reduced, and therefore is necessary, and worth
being adhered to.
In terms of maintenance of chain mooring lines, it is recommended that repair and
replacement is carried out; depending on the corrosion and wear which has taken
place. The resulting reduction in diameter of the chain links should be assessed and
replaced if it has reached the limit of reduction or is deemed to be likely to reach that
point by the time of the next inspection. It is possible that the inspection criteria will
be defined following experience in specific locations and the normal rate of wear is
established. Until this point it is likely that there will be more frequent inspections.

22
These general mooring standards, although general, are more directed towards
floating units such as floating production units and floating drilling units. More
recently DNV have also developed criteria for “Certification of Tidal and Wave
energy Converters”. This documentation demands that annual surveys entailing
general inspection of easily accessible areas should take place, and that at five year
intervals, close inspection of the whole system should take place. It also specifies that
the survey plan should be completed before installation of the device and its mooring
(Det Norske Veritas, 2005). This criterion is designed to allow the continuation of
certification of the device, and is likely to be done in parallel with the maintenance
program of the operator. It is, however, unclear whether this is the expected
inspection interval of the operator and whether or not the operator should be carrying
out additional inspection surveys. DNV work with the operator at the certification
stages to ensure that an adequate inspection and maintenance schedule are planned.
The (American Petroleum Institute, 2005) have produced “Design and Analysis of
station Keeping Systems for Floating Structures” to provide standardised procedures
for design, analysis and evaluation of mooring systems for floating structures. The
recommendations include guidelines on mooring system construction options,
environmental, strength and fatigue considerations, and recommendations for design
considerations including line length and tension, as well as equipment selection.
Permanent moorings are classed in this document as having a design life in excess of
10 years. It suggests that inspection of permanent moorings can be expensive and that
divers or ROV’s should be used for inspection. However since the scales of the
floating structures described in this document are significantly larger than tidal current
turbines are likely to be, then this information may not be correct. For a design life of
over 20 years, a 100 year storm criteria should be used. Design criteria such as those
listed in Table 3 give an indication of the type of guidance provided.
Table 3 - Tension limits and safety factors for Quasi-static analysis of mooring lines (American
Petroleum Institute, 2005)
Tension Limit (% MBS) Equivalent Factor of Safety
Intact 50 2.0
Damaged 70 1.43

23
Further guidelines include that the fatigue life should be 3 times that of the design life
of the mooring system. Chain diameter should be increased by 0.2 – 0.4mm per year
of intended design life for the thrash and splash zone, and 0.1 – 0.2mm in the other
zones. This document gives no indication of the required mooring inspection times.
Lloyds Register provides classification services for all types of marine uses. It is
recognised by several governments including the UK for providing statutory
requirements for classification of offshore equipment, including new technologies and
assessing their compliance with their existing recommended practices, as well as
fitness for purpose (Lloyds Register, 2008). The document states that the interval for
inspection must be agreed by LR in the planning stages. To maintain classification
this pre-planned inspection schedule must be adhered to. The unit must also be
inspected by a LR representative upon completion of inspection to ensure it meets the
standards for initial classification. Re-installation may also require further inspection.
Where possible; LR requires that the mooring system is subject to dry survey,
however they are willing to consider alternative methods if suitable.
From this brief summary of the guidance provided by these documents, it is clear that
each design, its components and capacities should be decided on a case by case basis.
These regulatory bodies will work with the operator to ensure that a safe and adequate
mooring is designed and that the inspection and maintenance procedures and
schedules are established before the installation of the system.
A small number of documents have been produced specifically for the marine energy
industry, but these follow a similar pattern to that of the general marine industry
guidelines. Again a case by case design basis is required.
7.2 Mooring maintenance guidelines
The majority of these documents specify that an adequate maintenance schedule
should be designed in advance of the installation of a device. Most do not give further
detail on intervals. Without experience on specific components in specific
environments, an iterative process could be used whereby the inspection intervals
should be determined by the degradation of mooring components since the last
inspection. For this approach to be reliable, careful documentation of each inspection

24
should be recorded. This type of guidance comes from documents including (Health
and Safety Executive, 2002), (GL Noble Denton, 2010), (IALA, 2008) (IALA, 2010)
Documents which include more specific details on suggested maintenance include the
International Association of Classification Societies (IACS, 2010), who specify
annual inspections. They also specify that every 5 years, there should be a more
detailed, probably dry inspection of the mooring. This information relates directly to
chains. This agrees with the recommendations of the DNV guidance on design and
operation of wave energy converters.
There is a huge amount of information available about chain moorings. This is due to
its extensive and long running use in the marine industry. Technology developments
are providing other options for mooring lines, but as of yet there seems to be little of
this information available in the public domain.
To summarise, it seems most likely that basic inspection of the moorings should be
undertaken annually. Every 5 years a more detailed survey should be carried out
including removal of the mooring system from the sea and dry inspection. Detailed
recordings of the conditions of the system should be taken at each inspection interval.
As such a time comes that experience is gathered, the inspection interval may be able
to be increased.

25
8 Mooring systems
Selection of a suitable mooring system is vital for the survival and station keeping of a
device. There are several components of the system which must be selected to
compose a good mooring system. These include; configuration, anchorage, line type.
There are several criteria which influence the selection of a mooring system including
the forces which the system will have to withstand from currents, waves and wind and
the weight of the structure itself. The depth in which the structure is to be moored
must also be considered along with the duration which the mooring will be in service
for.
8.1 Mooring function
Although mooring systems for marine energy converters may be seen as a secondary
consideration after the actual device; they are in fact integral to the function of the
system. The mooring serves an essential function within the conversion of marine
energy to electricity.
8.1.1 Station keeping
The primary function of the mooring is to provide station keeping of the device. This
mooring must be designed to ensure station keeping in both average and extreme
environmental conditions. Keeping the device in a given location is vital to ensure
that it remains in close proximity to the electrical connection; and does not strain it.
The device must remain in the same position so that it can be located for inspection,
maintenance and retrieval and that its location can be known to other marine users so
that they are not obstructed by it. The device will most likely be situated within an
array of devices; excursion from its intended position should be minimised to avoid
collision with other devices within the array.
8.1.2 Compliance
A requirement of the mooring may be to allow compliance of the device within its
environment. The ability to flex with the environment is important for many of the
designs of tidal devices with flexible moorings since compliant moorings have a
natural response to the flows of tidal currents (Mueller & Wallace, 2008). In a
26
compliant system, the device is allowed the freedom of movement to orientate itself
with respect to the flow of current, waves and wind to minimise damage to the device
from the elements, and therefore improve the survivability of the device. A compliant
mooring system can also aid in maximising the output of the device. Several of the
developers of marine energy converters utilising flexible moorings state that this is
one of the major benefits of the system and can avoid the need for expensive controls
to optimally align the device with the environmental loadings.
8.2 Mooring Configurations
The two key divisions of mooring configurations are single point moorings and spread
moorings. Each option has key functions which determine their suitability for the
application at hand. There are two main line configurations which can be applied to
both the single point and spread mooring configurations. These are catenary and taut
mooring lines.
8.2.1 Single point mooring
In a single point mooring system, the mooring lines meet at a single point which is
connected to the floating object. This set up is required if the object is to be allowed to
weathervane around the point of mooring. This method is often used in order to
minimise environmental loading on the object. There are many configurations of
single point mooring systems which all perform this function.
8.2.2 Spread mooring
A spread mooring has multiple lines which generally meet the floating object at
multiple points. This configuration ensures that the object retains a fixed heading or
orientation. The alignment of the object should be decided according to the most
frequently occurring direction of the environment, for example in line with typical
wind direction or current.
8.2.3 Catenary mooring
There is extensive experience with this type of mooring system. In a catenary
mooring, the line(s) approach the seabed horizontally before they reach the
connection with the anchor; this ensures that the forces on the anchor are horizontal

27
and the weight of the line provides the majority of the restoring force for station
keeping. This mooring system allows a degree of elasticity in the system and so may
improve the survivability of the device (Scotrenewables, 2011). The system can allow
a freedom of movement as the loading on the mooring causes sections of the mooring
line to rise and fall from the seabed (this section is known as the thrash zone). A
diagram of a catenary mooring arrangement can be seen in Figure 6.
Figure 6 - Catenary mooring thrash zone
8.2.4 Taut mooring
The mooring lines arrive at the seabed at an angle, and do not make contact with the
seabed. The loadings on the anchor are therefore both horizontal and vertical. The
restoring forces in this type of system are generally provided by the elasticity of the
lines; where the elasticity is dependant on the line material and type. Taut moorings
can be used to minimise the excursion of the floating object comparatively to a
catenary mooring system. Taut moorings are relatively new to industry, and are used
more for deep water moorings to minimise excursion (Noble Denton Europe Limited,
2006). The avoidance of contact with the seabed of the taut mooring system has
further benefits; the mooring line does not damage the seabed, and the seabed does
not damage the line. This benefits both environmental concerns and maintenance
requirements of the line. A diagram of a taut mooing arrangement can be seen in
Figure 7.

28
Figure 7 - Taut leg mooring construction (Offshore Moorings, 2006)
The considerations for the selection of taut or catenary mooring line depend mainly on
the requirements of the floating structure. Taut moorings are more suited to highly
accurate position keeping and allow only as much compliance as is allowed by the
elongation of the mooring lines. In locations where rough environmental loadings are
an occurrence, catenary mooring configurations allow compliance to reduce damage
to the floating structure.
8.3 Anchor types
The anchor type selected for a mooring configuration will depend on several factors
including; sea bed type and inclination, and loading characteristics. Anchor types vary
greatly on load resisting characteristics as well as installation and retrieval methods
and cost.
8.3.1 Drag embedment anchors
These anchors fix their position by penetrating the seabed by means of dragging.
There are a wide range of shapes, sizes and weights available. They are able to resist
very large loads in the horizontal plane and are therefore unsuitable for use with taut
mooring lines. As with catenary mooring lines, there is a wealth of experience in their
use. They can be deployed and retrieved many times and are often the mooring
equipment provided on vessels.
8.3.2 Pile anchor
Pile anchors are composed of hollow tubes which are drilled or hammered into the
seabed and can be grouted into position. The resistance comes from friction with the

29
seabed material and the horizontal resistance of the seabed. Piles often have to
penetrate deeply into the seabed to obtain the required load capacity, in both
horizontal and vertical loading. “Anchor piles are characterized by being relatively
long and slender and having a length to diameter or width ratio generally greater than
10.” (Davies, 2009)
8.3.3 Suction pile anchor
Similar in form to pile anchors, suction pile anchors are hollow tubes where suction to
reduce the internal pressure of the pipe is used to create a pressure gradient which
sucks the pile into the seabed to achieve the desired depth, and the pressure difference
is maintained for the duration of its deployment. One of the benefits of suction pile
anchors is that they can be removed by simply releasing the seal and returning the
internal pressure to that of outside, releasing the pile. “Suction anchor piles are
characterized by having a large diameter and a length to diameter ratio generally less
than 8” (Davies, 2009)
8.3.4 Deadweight anchors
Also known as gravity anchors, these anchors use their own weight and friction with
the seabed to generate station keeping ability. Deadweight anchors are generally made
form concrete or steel (Vryhof Anchors BV, 2010), and to produce the required load
resistance may have to be very large. They are the simplest type of anchorage;
however load resistance is primarily vertical, with horizontal resistance being less
reliable.
The selection of anchor will depend on the duration in that location. For short term
moorings; drag embedment anchors are more suitable than the other options as they
are easier to deploy and retrieve. The decision will also depend on the seabed type and
incline. The loading on the anchor is a key consideration, the angle and size of the
load will help to determine which anchor type is most suitable. For vertical loads,
drag embedment anchors are less suitable whilst of horizontal loads dead weight
anchors are less suitable due to likelihood of slipping.

30
8.4 Line Types
Mooring line selection is dependent on many factors. The type of line will determine
how the system functions, as the elasticity of the line varies greatly with material
selection.
8.4.1 Chain
There is a long history of the use of chains as mooring lines. This wealth of
experience can help to reduce capital costs be reducing costly safety factors required
for materials with less experience. Chains are most commonly made from steel of
varying grades including those defined by the International Association of
Classification Society for offshore mooring chain; R3, R3S, R4, R4S and R5, which
should be selected depending on the load characteristics which they will be required
to withstand. Chain links can be divided into two general groups of studded and
studless links, which can be seen in Figure 8.
Figure 8 - Geometry of Modern Studded and Studless Chain (Health and Safety Executive, 2002)
Studded link chains are preferable in terms of ease of handling and are considered to
have a higher reliability than studless link chains; however the fatigue life can
decrease significantly with loose or broken links. The links require additional
inspection of stud connection or welding.
Studless links avoid issues relating to loose or missing studs which can reduce
maintenance and inspection costs, and can also reduce the line weight by up about
Studless Link Studded Link

31
10% (Rawlings & Klaptocz, 2010) however the fatigue life can be comparable to half
that of a studded chain.
Technical requirements and guidance for the design, materials, manufacture and
testing of mooring chains are given by DNV-OS-E302, (Det Norske Veritas, 2008)
Steel chain in an ocean environment will be subject to corrosion. In addition the use
of chain in a catenary mooring construction will involve a large amount of scour and
abrasion, particularly in the thrash zone.
The selection of the length of chain is an important decision to ensure that it serves its
function. The chain length and size will depend on the size of the load which it is
mooring, this includes tidal and wave forces and the weight of the floating structure to
be moored and the nature of the seabed. The length of chain will also depend on the
depth of water and the tidal range in the location, the length will typically vary
between 3 and 7 time s the water depth (Robinson, 2012) to ensure that the required
compliance is provided by the mooring system.
8.4.2 Steel wire ropes
Wire ropes come in many different compositions. The general categories are multiple
strands (generally 6 or 8), and spiral strand. In multiple strand wires, the strands are
wound around the core in the same direction, whilst the spiral strands are wound
around the core in different directions. The ropes can be covered with a sheath, to help
prevent corrosion of the strands.
Multiple strand ropes are cheaper than spiral strand and have a greater elasticity
however are more susceptible to corrosion. Spiral strand ropes generally have a higher
strength and fatigue resistance; in addition, one of the benefits of spiral strand ropes is
that they do not generate torsion forces as loads increase, as is the case with multiple
strand ropes, and so are preferable in permanent moorings. Zinc fillers, which are
smaller diameter strands which fit between the steel strands, can be used to further
limit corrosion resistance.

32
Table 4 - Wire rope constructions and life expectancy (American Petroleum Institute, 2005)
Wire rope construction Life expectancy
Galvanised 6- strand. 6-8 years
Galvanised unjacketed spiral
strand. 10-12 years
Galvanised unjacketed spiral
strand with zinc filler wires. 15-17 years
Galvanised jacketed spiral
strand. 20-25 years
- Galvanised jacketed spiral
strand with zinc filler wires. 30-35 years
Both API (American Petroleum Institute, 2005) and DNV (Det Norske Veritas, 2009)
recommend a termination of a wire rope should use resin to pour the sockets, which
can be fitted with bend stiffeners to avoid kinking at the join, particularly during
installation. Wire ropes are unsuitable for catenary mooring lines since they are
subject to kinking which can seriously damage their load capacity.
8.4.3 Synthetic fibre ropes
Synthetic fibre ropes have seen a significant increase since the expansion of deep
water mooring and results of testing on these relatively new applications are
becoming available (Noble Denton Europe Limited, 2006). This is particularly since
lighter weight mooring lines lend themselves to this application.
Fibre ropes should not make contact with the seabed. They are therefore suitable for
taut line applications as well as segments of a combination steel/ fibre rope system.
33
They can offer superior elongation properties for compliance of the mooring system
than that of chain and wire ropes. One of the major differences from chain and wire
rope is that fibre ropes display non-linear stiffness. Fibre rope moorings can provide
elasticity for compliance; however this is limited to 8-10% (Paul & Irish, 1998).
There are several different materials which can be used for mooring lines; each has
properties which should be considered in the selection of the most suitable rope for
the mooring system. The most commonly used materials include:
• Polyester (polyethylene terephthalate)
• Aramid (aromatic polyamide),
• HMPE (high modulus polyethylene)
• Nylon (polyamide)
Some of the most common compositions of ropes are listed in Figure 9.
Parallel-Subrope rope. Six-Strand rope.
Thirty-Six-Strand rope. Parallel-yarn rope.
Figure 9 Typical compositions of fibre ropes (Det Norske Veritas, 2010)
As with steel wire rope, fibre rope can come in a range of compositions. Some of the
rope compositions come with a jacket; this serves the function of protecting the load
bearing inner fibres from marine growth, fish bites and general abrasion.
34
8.4.4 Elastomeric tension members
The key feature of an elastomeric tension member is that its elongation under load is
significantly higher than the elongation of its traditional counterparts; chain, wire rope
and even fibre rope. In the past catenary chain moorings have been used to allow
compliance of the floating object. Elastic moorings can provide can provide
significantly greater compliance, up to 400% elongation (Datawell, 2011), supporting
the survivability of the device against tides, currents and waves.
The lighthouse authority includes fully elastic mooring lines in their guideline
documents for both the design of navigation buoys (IALA, 2010), and guidelines on
synthetic mooring lines (IALA, 2005). These documents suggest that the mooring line
is selected by the appropriate length, diameter of cord and hardness of the rubber
used.
There are a range of further benefits which can be achieved from elastic mooring
lines. In other mooring systems, when the line loses tension due to turbulence in the
water, the joints in the mooring system become relaxed. This allows sand particles
into the spaces, which will then cause additional abrasion on these areas when tension
is returned (Jootsen & Hoekstra, 2003). The elastic properties of the line ensure that
the mooring line maintains a continuous tautness. This ensures that this additional
abrasion cannot take place. Continual tautness also prevents contact with the seabed;
this both prolongs the life of the mooring components by avoidance of abrasion, and
protects the ecosystem around the anchor point from disruption by mooring lines
(Irish, et al., 2005).
Another benefit compared to other compliant moorings is the reduction of excursion
from the intended location of the mooring; this is due to a shorter pre-elongation
length of mooring line can significantly reduce the swing circle of the mooring
(IALA, 2005).
There are considerable variations in the method by which mooring components on the
market achieve an elastic effect. The most simple approaches one or more natural
rubber cords. The properties of natural rubber such as tear and abrasion resistance as
well as its creep properties, high tear strength and excellent elongation properties
make it a suitable candidate for mooring (Joosten, 2006).

Other rubber mooring cords use composition
synthetic rubbers designed to optimise performance.
wire ropes with rubber components can reduce the weight of the mooring line by a
factor of 10 (Joosten, 2006)
system, and reserve buoyancy.
The light weight compared to other mooring lines
deployment much easier. Retrieval of the mooring system is potentially more complex
as hauling the line aboard cou
resolved in several of the available
mooring lines by running a length of
synthetic “safety” rope long enough to
allow the required range of elongation by
the elastic cord, but prevent excessive
over stretching in extreme conditions
This safety cord can also be used to haul
the mooring on board the attending craft
for maintenance.
In the case of a tidal current generation, the energy generated must be transmitted to
Another issue which may arise from the use of elastic moorings are that they are more
susceptible to cutting and breaking than their
mostly due to fishing equipment catching on the lines
context of a tidal current generation farm it would be fair to assume that fishing
35
rubber mooring cords use composition rubber including both natural rubbe
synthetic rubbers designed to optimise performance. Replacement of steel chains and
wire ropes with rubber components can reduce the weight of the mooring line by a
(Joosten, 2006). This can reduce the overall loading on the mooring
, and reserve buoyancy.
The light weight compared to other mooring lines can also make handling during
Retrieval of the mooring system is potentially more complex
as hauling the line aboard could damage the mooring line. Retrieval issues are
resolved in several of the available
by running a length of
synthetic “safety” rope long enough to
allow the required range of elongation by
but prevent excessive
over stretching in extreme conditions.
This safety cord can also be used to haul
the mooring on board the attending craft
Figure 10 - Safety cord on elastic mooring line (IALA, 2010)
n the case of a tidal current generation, the energy generated must be transmitted to
shore. This requires transmission cables
to follow the line of the mooring lines. As
explained in section 4.2, copper
transmission wires have a very small
elongation. One solution to this problem
is being developed by Woods Hole
Oceanographic Institute.
Figure 11 - WHOI coil cord elastic mooring
design (Irish, et al., 2005)
other issue which may arise from the use of elastic moorings are that they are more
o cutting and breaking than their mooring line counterparts. This is
mostly due to fishing equipment catching on the lines (Irish, et al., 2005)
tidal current generation farm it would be fair to assume that fishing
rubber including both natural rubber and
Replacement of steel chains and
wire ropes with rubber components can reduce the weight of the mooring line by a
l loading on the mooring
e handling during
Retrieval of the mooring system is potentially more complex
age the mooring line. Retrieval issues are
(IALA, 2010)
n the case of a tidal current generation, the energy generated must be transmitted to
shore. This requires transmission cables
to follow the line of the mooring lines. As
explained in section 4.2, copper
ion wires have a very small
One solution to this problem
is being developed by Woods Hole
WHOI coil cord elastic mooring
other issue which may arise from the use of elastic moorings are that they are more
mooring line counterparts. This is
t al., 2005). In the
tidal current generation farm it would be fair to assume that fishing

36
vessels would not enter the farm area, although stray equipment could still be an
issue.
There are a small number of companies who produce elastomeric tension members for
moorings. They are currently used for pontoons, marinas and yacht moorings by
companies including Seaflex, Supflex and Halzette, The Dutch lighthouse authority
use Datawell rubber mooring tethers for their navigation buoys. Extensive research
has also been undertaken by the Woods Hole Oceanographic Institute (WHOI) who
are developing and testing elastomeric mooring tethers for their data collection buoys.
Datawell, who provide mooring components for the dutch lighthouse authority, have
40 years of experience in rubber
moorings (Datawell, 2011). The
maximum loading specification is
for a load of 2tons is available at
maximum lengths of 15meters.The
natural rubber cord has a diameter
of 50mm and has a shore hardness
of 70. The maximum elongation of
this specification is 300%. These
mooring tendons have an option of a
safety line. Quotations for the range of Datawell mooring tendons are listed in
Appendix 1 (Scrivens, 2012).
The Hazelett mooring system is used for yacht and pontoon mooring. The mooring
components can support loads of up to 35 tons. It is recommended that a regular
elongation of 30% should not be exceeded to preserve the life of the system (Hazelett,
2010). If 30%
normal elongation
for normal
loading and 100%
elongation for
extreme loadings
are maintained
then, the mooring
Figure 13 - Hazelett 35 ton mooring rode (Hazelett, 2010)
Figure 12 -Termination of rubber mooring cord
(Datawell, 2011)

37
system should have a life of around 20 years (Oldport Marine Services inc., 2008).
This module comes with an inbuilt safety line highlighted in orange in Figure 13.
Communication from the supplier provided the cost for a 10ft. elastic line would cost
$880, at an exchange rate of $1 = £0.62 this is £545.06 for 3.05 meters (Hill, 2012). 6
of these components are required to take a load of 50 tons.
Supflex mooring components, produced by American Marine, are primarily designed
for the mooring of compliant pontoons and marinas. The technology uses composite
rubbers to achieve a high load capacity. The range in load capacity is generated by
variations in rubber cord diameter and the number of cords per mooring component
up to 600 strands; a maximum break load of 1900tons. These components have the
option for a safety line which is contained in the centre of the rubber mooring cords.
Figure 14 - Supflex 30 strand elastic mooring component
Out of the elastic mooring tendons on the market, this is the only one which is
currently designed to support a big enough load for a tidal current turbine, however
Supflex did not respond to requests for information on costs and performance of this
device.
The Seaflex elastic mooring components claim to be able to reducing the lifetime cost
of the system by increasing maintenance intervals and the life of the mooring line
(Bengtsson & Ekström, 2012 ). The life of this component is expected to be 10 years
and is designed to support a load of 10kN. Seaflex did not respond to requests for
further information.

38
Figure 15 - SEAFLEX® with 8 rubber hawsers (Bengtsson & Ekström, 2012 )
Potential benefits of elastomeric mooring lines compared to other line types include
lighter weight than steel chain or wire rope. The life expectancy varies from company
to company but is estimated to be between 10 and 20 years, which could significantly
reduce the cost of maintenance. The compliance it provides could also reduce
maintenance of the device itself since shock loads are prevented by the use of these
lines.
The extensive experience the use of chain in mooring lines gives this option a lot of
credit. Life expectancies and costs can be predicted quite accurately. Synthetic fibre
ropes are lightweight but the lifetime of this sort of line in a marine environment is
not long.
Wire rope can provide significantly longer life expectancy than other line types,
however it is subject to kinking, which reduces the performance of the component
significantly, particularly at joints. It therefore requires careful transport, deployment
and retrieval to avoid this.
Eventually the selection of mooring line type will depend on the design life of the
mooring, environmental conditions and the loading requirements of the device.
Elastomeric mooring tendons certainly have the potential to provide several benefits
and are an option well worth investigation for its use as mooring line for tidal current
turbines.

39
9 Elastomeric mooring tendons
Consider a subsurface horizontal axis tidal current turbine on a single taut mooring
line. The turbine is neutrally buoyant so that in slack tide, the device self maintains a
constant height. The position of this turbine will depend on the overall buoyancy of
the system and the drag forces which will vary depending on the velocity of the
passing current.
9.1 Assumptions
The following assumptions are made for the performance of the turbine:
- Turbine is neutrally buoyant and self stabilising.
- Rotor diameter = 10m
- Turbine coefficient of power = 0.4
- Cut-in speed = 1m/s
- Rated speed = 2.5m/s
- Rated power = 250kW
The assumptions of the performance are considered reasonable estimates for a tidal
current turbine, and the coefficient of performance is comparable with scale testing of
the Nauticity tidal current turbine; CoRMaT (Clarke, et al., 2008).
Assumptions on the environmental conditions for the location of the turbine are:
- Maximum current velocity at spring tide = 3.5 m/s
- Maximum current velocity at neap tide = 1.7 m/s
- Tidal cycle duration = 12 hours 24 minutes
- Spring-neap-spring cycle = 14 days
- Total water depth = 100 meters
- Density of sea water = 1020 kg/m3
These assumptions are based on the current velocities at the EMEC test site; the Fall
of Warness in Orkney, Scotland. The tidal cycle is based on a typical tidal cycle as
described by the National Oceanographic and Atmospheric Administration (NOAA,
2004).

40
9.2 Current velocity
The current velocities given for spring and neap tides are representative of the
velocity on the surface of the body of water. In practice, the velocity decreases with
depth. This is due to the effects of the boundary layer on the seabed where the
velocity is ≅ 0m/s. The velocity profile follows the 1/7th power law (Frankel, 2002).
This law considers the transition between boundary zero velocities and minor pressure
gradients with occur with depth (De Chant, 2005).
The velocity for any given depth ���� can be calculated using the equation:
�� � � ��� �
Where � is the velocity on the surface of the water, � is the height above seabed and � is the total depth of the water. The velocity profile for a total depth of 100meters is
represented in Figure 16.
Figure 16 - Velocity profile for 100 meters depth using 1/7th power rule
Obviously higher velocities are closer to the surface of the water. In fact 75% of the
power available is in the upper 50% of the stream (UK Department of Energy, 1990).
To maximise the output of the tidal current turbine it would seem advantageous to
maintain as much height as possible.
0.00
10.00
20.00
30.00
40.00
50.00
60.00
70.00
80.00
90.00
100.00
0.00 0.50 1.00 1.50 2.00 2.50 3.00 3.50 4.00
Height above seabed (m)
Current velocity (m/s)
Current Velocity Profile
Neap peak velocity
Spring peak velocity
41
In addition to maximising the output of the device, avoiding collision with the seabed
is vital. The drag forces which act on the turbine will be inclined to push the turbine
towards the seabed. The turbine is essentially follows a curve equivalent to an arc
with the radius equal to the length of the mooring line centred around the point of
anchorage.
In order to maintain a reasonable height for the turbine, a buoyant force, or lift force
should be incorporated into the system.
9.3 Force calculations
Two options will be investigated in the following scenarios. The first option will use a
spherical buoy to provide a buoyant force. The second option will use a hydrofoil with
small reserve buoyancy. Both options will be positioned on an additional line
connected on an additional line above the turbine. The drag forces on the turbine will
also be considered in the force calculations.
9.3.1 Turbine
The turbine forces will be consistent throughout these calculations, an will follow the
assumptions stated in section 9.1.
The drag (horizontal) force on the turbine (���� is given by:
��� ���� �. � ρρρρ� �� �����
Where ��� is the coefficient of drag on the turbine, ρρρρ� represents the density of sea water and �� is the swept area of the turbine.
The angle of the mooring line from the seabed (�) can be found using:
� � ���� �� !"#�$%&'(#) *$) *+,-"."#�$%&�
Obviously the buoyancy and lift forces are required to calculate θ. This also allows
the turbine height above the seabed to be calculated using further basic trigonometry.

42
9.3.2 Spherical buoy
The buoyancy force generated by the spherical buoy is defined as:
' � /ρρρρ��ρρρρ 0 12 !
Where ' is the buoyant force of the buoy, ρρρρ is the density of air, 12 is the volume
of the buoy and ! is the gravitational force.
To assess the appropriate buoyant force required, the drag forces acting on the device
must also be considered. This will include both the drag forces on the turbine and the
buoy. The drag force on the spherical buoy (��') is calculated using the equation:
��' � ��' �. � ρρρρ� �' �����
Where FDB is the drag force on the buoy, ��' is the coefficient of drag on the buoy �' is the characteristic area which in this case is the cross sectional area of the buoy normal to the direction of current flow.
Typical mooring configurations use chain or wire ropes, which have a minimal
elongation under load. The turbine described, moored on a non- elastic mooring line is
now considered. The turbine heights for a range of buoy diameters, for a turbine
moored using a non-elastic mooring line are shown in Figure 17.
Figure 17 - Height of tidal current turbine with increasing additional buoyancy.
0
10
20
30
40
50
60
70
80
90
0.0 1.0 2.0 3.0
Turbine height above seabed (m)
Current Velocity (m/s)
Turbine height above seabed
10m buoy
9m buoy
8m buoy
7m buoy
6m buoy
5m buoy
4m buoy
3m buoy
2m buoy
1m buoy
No Buoyancy
43
The graph in Figure 17 represents, undeniably, the requirement for an additional
buoyancy force to maintain a reasonable height for the turbine above the seabed.
Without any buoyancy the turbine is immediately forced to the seabed with even a
slight current. This is obviously not desirable since the turbine would not be able to
function and would cause serious damage to the device. The smaller buoyancy forces
do not maintain a sufficient turbine height to ensure that the contact is not made with
the seabed.
Assuming that the majority or power to be generated is in the upper 50 percent of the
tidal stream, the turbine height should be maintained above 50 meters. To do this the
minimum required buoyancy should be provided by a spherical buoy of 5 meters
diameter. A 6 meter diameter buoy would provide an additional benefit in the higher
velocity currents.
In the case of the larger buoys, from 7 to 10 meters diameter, it can be seen that the
additional buoyancy does ensure that of a height close to the maximum is maintained,
even at height current velocities. The drag on these larger buoys means that the full
height of the turbine cannot be maintained.
There are also other implications of specifying buoys of these sizes. The buoyant
force on the line and anchorage must be considered. The buoyant force provided by
the 5 meter diameter buoy is calculated as 650kN, the buoyant force of the 6 meter
diameter buoy is 1130kN, almost 2 times the force.
Whilst this is beneficial for maintaining the height of the turbine, the vertical loading
on the anchorage and the mooring line are significantly increased. When considered
that the drag force on the turbine at a peak velocity of 3.5m/s is 420kN, only one third
of the vertical force from the buoy. The implications of this are; that the cost of the
mooring equipment will certainly be higher since it will have to be specified to sustain
a significantly higher load.
In addition, the large buoy will mean that the turbine will have to be sited originally
lower down in the water, in order to be below the surface of the water and to avoid
turbulence caused by wave action. This will reduce the benefit of maintaining a
consistent height, as the current velocity will be reduced with depth.

44
Logistically, transport of buoys these sizes will be more complex. In addition, buoys
of this size are likely to be a lot more expensive and not so readily available in the
marketplace.
Considering the reasons stated previously, a 5 meter diameter turbine would seem the
most appropriate size for the system. The logistics of transportation, its position in
relation to the turbine, buoyancy force loading on the mooring line and height keeping
of the turbine indicate the 5 meter diameter buoy as the preference.
9.3.3 Hydrofoil
Another option for supplying lift to the mooring system is to use a hydrofoil instead of
a simple buoy. The hydrofoil has a small amount of buoyancy to support it during
times of slack tide, and generates lift as the current begins to flow.
For the case where the buoyant and lift forces are provided by a hydrofoil, a
symmetrical hydrofoil will be used for simplification of the calculations. The
National Advisory Committee for Aeronautics (NACA) standard 0012 foil profile is
used here. The 12 in the profile title describes the relation of the maximum thickness
of the foil to the cord length; the maximum thickness is 12% of the cord length. This
is a symmetrical foil shape. The angle of attack (α) is the angle between the direction
of current flow and the chord line of the hydrofoil.
Figure 18 - NACA 0012 cross sectional dimensions
The coefficients of drag and lift for the hydrofoil are described in tables which are the
result of experimental and simulation data (Sheldahl & Klimas, 1981). The results
provide coefficients as a function of the Reynolds number and the angle of attack of
the flow relative to the position of the foil.

45
The Reynolds number (3%� is calculated using the following equation:
3% � 4 ∗ � ∗ 67
Where 6 is the characteristic dimension, in this case, the cord length and 7 is the dynamic viscosity of the fluid, for sea water at 10°C is 0.0135 kg/m.s.
Knowing the Reynolds number for the characterised flow, the lift and drag
coefficients for the hydrofoil can then be taken from tables. The tables used for this
case can be found in Appendix 2.
The calculation of drag on the hydrofoil is the same as for the drag on the buoy,
however this time the coefficient of drag varies with current velocity. The lift
generated is calculated by the equation:
�68 � �68 �. � ρρρρ� �8 �����
Given ) , the length of the mooring line, the turbine height can now be calculated by:
� � ) 9:� �
The resulting lift forces for a NACA 0012 foil with a chord length of 8 meters and a
width of 12 meters were calculated. In an array situation the footprint of the system is
to be kept to a minimum. The width of 12 meters is therefore logical; as the width of
the turbine swept area is also 10 meters and having a hydrofoil of much greater width
would have significant implications on the footprint of the system. A hydrofoil of a
width in large excess of this does provide more lift however is unlikely to be suitable
in a tidal current turbine array. This hydrofoil size also allows a comparison with the
6 meter diameter buoy system.
The calculations carried out give the elevation of the turbine as shown in Figure 19.

46
Figure 19 - Turbine height with varying hydrofoil angles of attack for a NACA 0012 shape
From Figure19 it is clear that the optimum angle of attack (α) is 12 degrees, although
an angle of 10 degrees would produce similar results of maintenance of maximum
turbine height. It would be possible to increase the lift and buoyancy forces provided
by the hydrofoil, however, if the foil becomes larger than the turbine itself then
logistical issues are likely, so for the purposes of these calculations are not considered.
Figure 20 - Comparison of the position of turbine with hydrofoil and buoy systems at 3.5m/s
current velocity
40.00
45.00
50.00
55.00
60.00
65.00
70.00
75.00
80.00
85.00
0.0 0.2 0.4 0.6 0.8 1.0 1.2 1.4 1.6 1.8 2.0 2.2 2.4 2.6 2.8 3.0 3.2 3.4
height above seabed (m)
Current Velocity (m/s)
Turbine height with varying hydrofoil angles of attack
2 deg
4 deg
6 deg
8 deg
10 deg
12 deg
14 deg
16 deg

47
9.4 Elastic mooring lines
All of the above calculations assume that the mooring line used is inelastic and that
the line length will remain constant. The drag forces on the system mean that the
turbine will be susceptible to variations in height, and therefore productivity.
Now consider an elastic mooring line. If the turbine is to remain at a constant height;
the mooring line will be required to elongate. The elasticity of the mooring line could
be provided by a section or the full length of the line. It is reasonable to assume that
the elongation could be provided by a section of the mooring line rather than the
whole line, however, a range of component lengths are explored for the spherical
buoy and hydrofoil systems. The elasticity will most likely be provided by rubber
cords as described in section 8.4.4.
9.4.1 Elastic mooring line – Spherical Buoy
Despite the additional buoyancy provided in the system by the buoy, a consistent
height for the turbine cannot be maintained without considering an elastic mooring
line. The resulting horizontal displacements for the range of tidal current velocities
were calculated. The required extensions of the mooring line, for a system using a 5
meter diameter buoy, provided by a range of elastic component lengths were
calculated using trigonometry and are shown in Figure 21.
Figure 21 - Required elongation of elastomeric tension member – Variable tendon length
5 meter buoy diameter
0.00
50.00
100.00
150.00
200.00
250.00
0.0 1.0 2.0 3.0
Elongation of Elastomeric component
(%)
Current Velocity (m/s)
Required elongation of elastomeric tension member
10 meters
15 meters
20 meters
30 meters
40 meters
50 meters
60 meters
70 meters
80 meters

48
This graph shows the optimal elongation of the elastomeric tension member required
to maintain a constant turbine height of 80 meters in a water depth of 100 meters. The
percentage of required extension depends greatly on the length of the elastomeric
tension member. It is clear from the Figure 21 that the elongation required escalates
rapidly at velocities above 2m/s from elongations of less than 30 percent up to almost
230 percent for the shortest elastic components.
The 80 meter component requires an elongation of only 30 percent at a current
velocity of 3m/s. This is outside of the elongations achievable from traditional
mooring lines, including synthetic ropes. To achieve these proportions of elongation;
it will be necessary to use elastic moorings.
The same calculations were carried out for a system using a 6m diameter buoy and the
results for required elongation are shown in Figure 22.
Figure 22 - Required elongation of elastomeric tension member – Variable tendon length
6 meter buoy diameter.
These results show a significant difference for a relatively small increase in buoy
diameter. The maximum elongation required for a 10 meter elastic tendon is 104
percent. For the full mooring length of 80 meters the elongation required is as small as
13 percent.
0.00
20.00
40.00
60.00
80.00
100.00
120.00
0.0 1.0 2.0 3.0
Elongation of Elastomeric component
(%)
Current Velocity (m/s)
Required elongation of elastomeric tension member
10 meters
15 meters
20 meters
30 meters
40 meters
50 meters
60 meters
70 meters
80 meters

49
9.4.2 Elastic mooring line – Hydrofoil
The behaviour of the system with the hydrofoil is quite different from that of the
buoy. The same calculations were done for the hydrofoil system with a range of
elastic component lengths. The results are shown in Figure 23.
Figure 23 - Required elongation of elastomeric tension member – Variable tendon length
hydrofoil
It is clear that the elongation requirements of the hydrofoil vary greatly from the buoy
system. The initial requirement of the 10 meter elastic component is only 94 percent.
Above elastic component lengths of 40 meters the elongation required is less than 20
percent and as small as 12% for the full length elastic mooring line. For the longer
components the elongation is not significantly smaller than that of the buoy system.
0.00
10.00
20.00
30.00
40.00
50.00
60.00
70.00
80.00
90.00
100.00
0.0 1.0 2.0 3.0
Elongation of Elastomeric component (%
)
Current Velocity (m/s)
Required Elongation of Elastomeric tension member
10 meters
15 meters
20 meters
30 meters
40 meters
50 meters
60 meters
70 meters
80 meters

50
Figure 24 - Comparison of the position of turbine with hydrofoil and buoy systems on elastic
moorings at 3.5m/s current velocity
A comparison of each system is shown in Figure 25 for component lengths of 10
meters, 40 meters and 80 meters.
Figure 25 - Required elongation of elastic components - system comparison
0
50
100
150
200
250
0.0 0.5 1.0 1.5 2.0 2.5 3.0 3.5
Percentage Elongation
Current Velocity (m/s)
Required Elongation of Elastic Components
10 meters -hydrofoil
40 meters -hydrofoil
80 meters -hydrofoil
10 meters - 6
meter buoy
40 meters - 6 meter buoy
80 meters - 6 meter buoy
10 meters - 5 meter buoy
40 meters - 5 meter buoy
80 meters - 5
meter buoy

51
From this graph it is clear that the 5 meter buoy requires significantly greater
elongation. The 6 meter buoy and the hydrofoil are comparable with only a few
percent variations in elongation requirements. Comparisons of the shapes of the
elongation curves give different behavioural results. These shapes will have
implications on the compatibility with the performance of the elastic member.
The systems investigated in this section were; a system using a 5 meter diameter
buoy, a system using a 6 meter diameter buoy, and a system using a hydrofoil. Each
of these options was investigated for the resultant turbine height given a non-elastic
mooring line for a range of current velocities. Each system was then considered with
elastomeric mooring tendons. The required elongation of these tendons for a range of
elastic component lengths was calculated. The results of this investigation show that
depending on the length of the tendon, the required elongation varies greatly.
The minimum elongation required (12 percent) was given by the hydrofoil system
with the elastomeric mooring tendon occupying its full length. The data calculated
should provide a basis for establishing the feasibility of using elastomeric mooring
tendons, both functionally and economically. The best option will depend greatly on
the behaviour of available mooring tendons, and the cost benefit of each system.
52
9.5 Power Output
To assess the benefits of each system, the power output must be considered. The
power output will dictate the return on investment which is the key criteria for
deployment of tidal current turbines. The systems must be compared and the best
economic outcome selected.
The power output from the turbine between the cut-in speed and the rated speed is
governed by the equation:
; � �;� �. � ρρρρ� �� ����<
Where �;�is the coefficient of performance of the turbine.
The instantaneous power output from the turbine above the rated speed is given by:
; � �;� �. � ρρρρ� �� ����<
Where �� is the rated speed of the turbine. This equation assumes that there is no cut-
out speed for the turbine.
This comparison only considers the 5 meter buoy since the requirements of the
mooring line and anchorage for the 6 meter buoy are considered excessive, despite the
benefits of the additional buoyancy.
The hydrofoil system with the inelastic line has been calculated to give a total energy
output over one tidal cycle of 14 days of 30.32MWh, and an annual output of
788.42MWh.
The 5 meter diameter buoy system with the inelastic line has been calculated to give a
total energy output over one tidal cycle of 14 days of 30.48MWh, and an annual
output of 792.53MWh.
The total energy output of both the buoy and the hydrofoil systems, with an elastic
mooring line allowing a constant height to be maintained, can generate 30.77MWh
per cycle and 800MWh per year.

53
Table 5 - Output of tidal current turbine systems
System Per cycle (14 days) Per year
Hydrofoil - inelastic 30.32MWh 788.42MWh
5 meter buoy -
inelastic
30.64MWh 792.53MWh
Elastic line 30.77MWh 800MWh
The elastic mooring line allows the hydrofoil system to generate 11.52MWh more
than the same system with an inelastic mooring line. An elastic line also allows the
buoy system with to generate 7.47MWh more than with an inelastic mooring line.
The graphs showing the power outputs for each system over a full tidal cycle of 14
days can be found in Appendix 3.
A close up of the power output over a diurnal tidal cycle is showing in Figure 26.
Figure 26 - Power generation comparison between elastic and inelastic mooring line for buoy and
hydrofoil systems
0
50000
100000
150000
200000
250000
0
Power (W
)
time
System Comparison of Power Output
elastic
5m buoy
hydrofoil

54
This graph shows the difference in power generated amongst the systems over one
diurnal cycle as the output approaches rated power. The difference mostly occurs at
the peaks of output, when the drag force is greatest. It can be seen that there is an
improvement in the power output of the system with an elastic mooring line. This
improvement is even more significant for the hydrofoil system.
If an assumption of a turbine life of 25 years is made, then the difference in energy
generation over the lifetime between the hydrofoil system with a non elastic mooring
line and an elastic mooring line is 288MWh
For the assumption of a 25 year turbine life, the increase in output due to the elastic
mooring line on the 5 meter diameter buoy system is 186.75MWh.
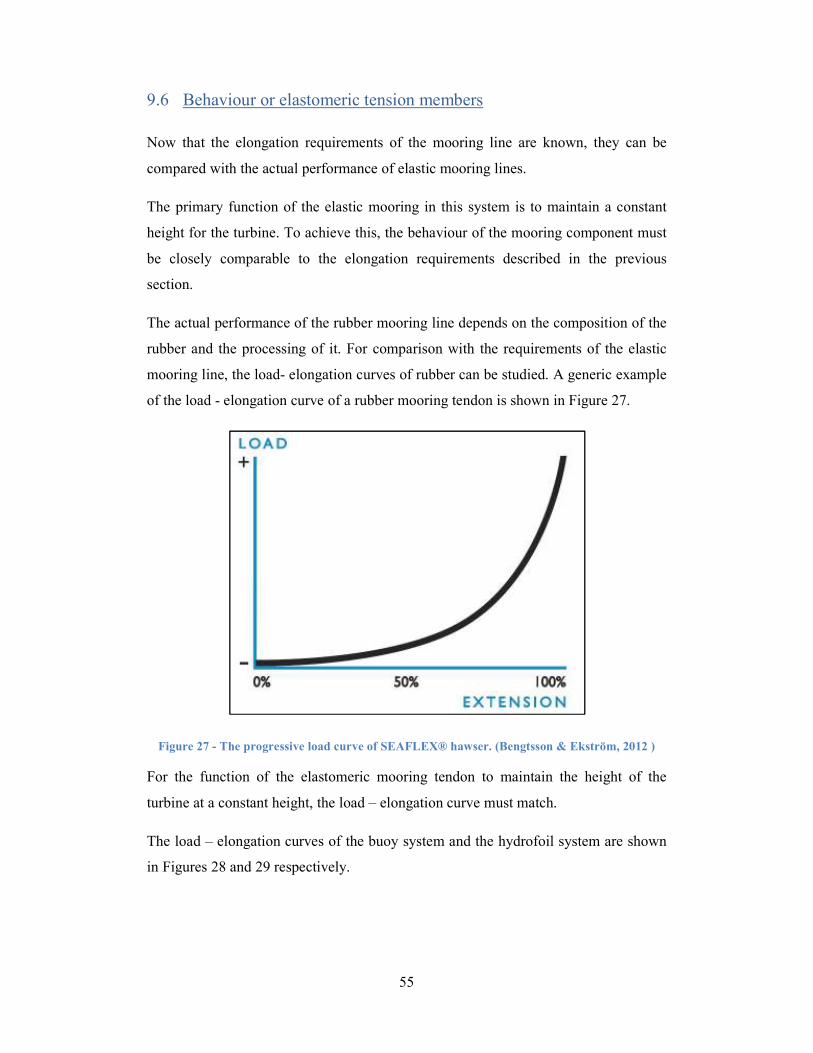
55
9.6 Behaviour or elastomeric tension members
Now that the elongation requirements of the mooring line are known, they can be
compared with the actual performance of elastic mooring lines.
The primary function of the elastic mooring in this system is to maintain a constant
height for the turbine. To achieve this, the behaviour of the mooring component must
be closely comparable to the elongation requirements described in the previous
section.
The actual performance of the rubber mooring line depends on the composition of the
rubber and the processing of it. For comparison with the requirements of the elastic
mooring line, the load- elongation curves of rubber can be studied. A generic example
of the load - elongation curve of a rubber mooring tendon is shown in Figure 27.
Figure 27 - The progressive load curve of SEAFLEX® hawser. (Bengtsson & Ekström, 2012 )
For the function of the elastomeric mooring tendon to maintain the height of the
turbine at a constant height, the load – elongation curve must match.
The load – elongation curves of the buoy system and the hydrofoil system are shown
in Figures 28 and 29 respectively.

56
Figure 28 - Buoy system load - elongation curve
Figure 29 - Hydrofoil system load - elongation curve
It can be seen from these graphs quite clearly that the hydrofoil system has a better
match with the generic load – elongation curve for the relevant elongation percentage.
This comparison is not definitive and further investigation and testing of a range of
rubber compositions to establish the appropriateness of the elastic mooring line to the
system. It is also possible that elastomeric mooring tendons could be produced to
match the requirements of the buoy system.
0.00
100.00
200.00
300.00
400.00
500.00
600.00
0.00 5.00 10.00 15.00 20.00 25.00 30.00
Load (kN)
Elongation %
Buoy system load - elongation curve
0
200
400
600
800
1000
1200
0 2 4 6 8 10 12 14
Load (kN)
Elongation %
Hydrofoil system load - elongation curve

57
10 Economics of flexible moorings
There is a great deal of uncertainty when it comes to putting a price on tidal current
energy. Many of the speculative costs which are out there are estimates from
experience in other industries. With time and experience, the price will become
clearer. There are several costs for a tidal current turbine described in Figure 30.
Labour
Inspection
Downtime Materials Vessels
Repair/
Replace
Planned
Unplanned
Labour Vessels
Downtime Materials
Maintenance
Capital Cost
Mooring
Equipment
Labour
Vessels
Monitoring
ROCs Income Wholesale price
of electricity
Electricity
Generated
Income
Operations
Insurance/
licences
Flowchart representing costs of a tidal current turbine mooring throughout its life.
Grid
Connection
Monitoring
Figure 30 - Lifetime costs of turbine mooring

58
This study will investigate the cost comparison of a tidal current turbine supported by
a 5 meter diameter spherical buoy with a non elastic mooring line and an elastic
mooring line.
From the calculations in the previous section, the theoretical power output of the
250kW tidal current turbine at a constant height, enabled by the elastic mooring, is
800MWh. The equivalent power output from the same turbine on a non-elastic
mooring is 792.53MWh. This is an output difference of 7.47MWh per year.
Assumptions made for this section are as follows:
• The wholesale price of electricity during 2012 so far has been between4.46 –
5.29p/kWh (Bluemark Consultants, 2012). The cautious assumption that the
wholesale market price of electricity is 4.5p/kWh or £45/MWh can be applied,
although this price is highly liable to change throughout the life of the system.
• 3 ROCs will be awarded for tidal energy in Scotland at £40.71/MWh (DECC,
2012) (correct at time of writing). This is also liable to change, or even
removal during the life of the system.
• The design life of the system is 25 years. This is in line with targets from
developers.
• The cost of 100 meters of steel chain costs £2500 (Owen, 2012).
• The life time of steel chain mooring is taken to be 5 years (Owen, 2012).
• The nominal cost of a mooring inspection is £1500 (Robinson, 2012).
• If the remainder of the systems are identical then a cost comparison can be
carried out.
Table 6 shows a breakdown of the mooring costs associated with the mooring of a
tidal current turbine. The data which is filled in the table are estimates of likely costs.
The omitted data is even more unknown and has been omitted for this reason.
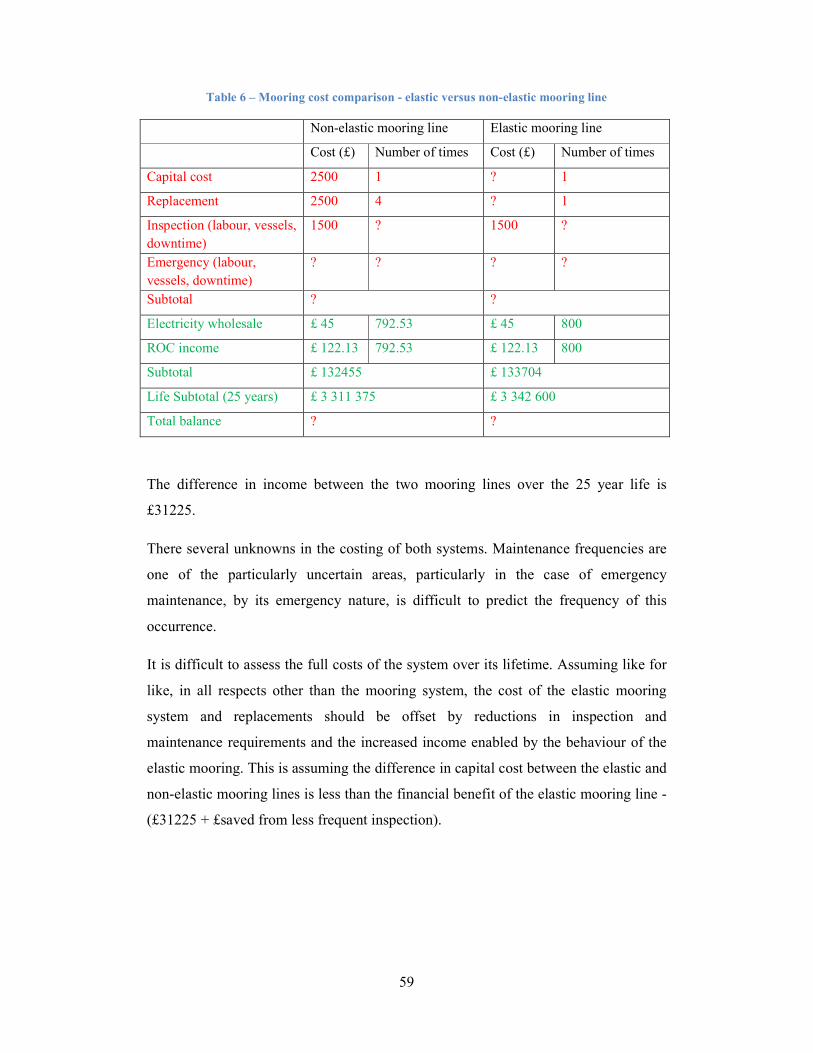
59
Table 6 – Mooring cost comparison - elastic versus non-elastic mooring line
Non-elastic mooring line Elastic mooring line
Cost (£) Number of times Cost (£) Number of times
Capital cost 2500 1 ? 1
Replacement 2500 4 ? 1
Inspection (labour, vessels,
downtime)
1500 ? 1500 ?
Emergency (labour,
vessels, downtime)
? ? ? ?
Subtotal ? ?
Electricity wholesale £ 45 792.53 £ 45 800
ROC income £ 122.13 792.53 £ 122.13 800
Subtotal £ 132455 £ 133704
Life Subtotal (25 years) £ 3 311 375 £ 3 342 600
Total balance ? ?
The difference in income between the two mooring lines over the 25 year life is
£31225.
There several unknowns in the costing of both systems. Maintenance frequencies are
one of the particularly uncertain areas, particularly in the case of emergency
maintenance, by its emergency nature, is difficult to predict the frequency of this
occurrence.
It is difficult to assess the full costs of the system over its lifetime. Assuming like for
like, in all respects other than the mooring system, the cost of the elastic mooring
system and replacements should be offset by reductions in inspection and
maintenance requirements and the increased income enabled by the behaviour of the
elastic mooring. This is assuming the difference in capital cost between the elastic and
non-elastic mooring lines is less than the financial benefit of the elastic mooring line -
(£31225 + £saved from less frequent inspection).

60
11 Conclusions and Recommendations
With the need for new and sustainable sources of energy to ensure security and
diversity of supply in the UK and worldwide, it is vital such a predictable and
immense resource, as tidal currents is utilised. The UK, one of the most naturally
endowed countries, is at the forefront in this technology. Government targets are
promoting and providing incentives for the development of technology to generate
power from this resource. However, if tidal current generation is to become
economically competitive with traditional types of generation, the industry must focus
on reducing the cost of energy to at most 20 percent of its current cost. To do this, the
two main cost centres which must be targeted are installation and maintenance.
One method which could reduce both of these costs is to use flexible moorings for
tidal current turbines. The use of flexible moorings instead of pile structure
foundations can significantly reduce the cost and time involved in installation, reduce
the structural costs of the device and its mounting, utilise natural optimization of
orientation of the device to current flow without the use of any control systems,
reduce maintenance costs by allowing removal of device for onshore maintenance and
also reduce downtimes.
It is unclear as of yet how much the savings are likely to be from using flexible
moorings instead of piled structure foundations, however the opinion of industry
bodies and developers is that the reductions in cost are likely to be substantial.
Since there is minimal experience with moorings for tidal current turbines; the
experience, guidelines and regulations of other marine industries must be drawn upon
until the tidal current energy industry builds experience of its own. Several of the
respected marine industry regulators have begun to develop guidelines for the marine
energy industry, for their own experience. By nature this guidance focuses more on
general principles rather than case specific guidelines. The implication of this is that
each case should be designed individually, taking into consideration the device and its
surroundings.
The options for mooring anchors, lines and constructions were investigated with
several options requiring specific tailoring to the device, its location and
environmental conditions. These options include the use of elastic mooring tendons

61
for the mooring of tidal current turbines. This option was investigated in further detail.
Experience with this type of mooring line comes mostly from yacht, pontoon and
marina mooring as well as mooring of navigation and oceanographic data buoys.
Furthermore, elastic mooring technology has begun to be developed as an option for
mooring marine energy converters. The properties of elastic mooring lines lend
themselves to use in marine energy converters, namely for their ability to provide
compliance for protection against rough seas, as well as their light weight and long
life expectancy compared to its chain counterpart.
Additionally the elastic mooring line has the potential to improve the performance of
a tidal current turbine. This improvement requires elongation of the mooring line to
allow the turbine to remain at a constant height and therefore remain in the maximum
current velocity in any given channel.
It remains to be seen whether or not the behaviour of elastic mooring lines can be
matched with the requirements for elongation to optimise the power output of a tidal
current turbine. In the event that the elastic mooring lines can provide the appropriate
behaviour, the cost of the mooring line could be offset, and more, by the improvement
in power output.
It is difficult to predict exactly how great the benefit would be, if any, since the
wholesale price of energy and subsidies which exist at present are likely to change in
the near future. Furthermore, the maintenance requirements and life expectancy of this
technology are unknown as they there is not any experience using it for the
application of marine energy conversion. Further research and testing with elastic
moorings for marine energy conversion will be required to determine if this option
really is of benefit. It is certainly an option worth pursuing.
62
12 References
ABPmer, office, T. M., Hassan, G. & Laboratory, P. O., 2004. Atlas of UK Marine
Renewable Energy Resources, R. 1106;, s.l.: s.n.
Alawa, A. et al., 2009. Assess the Design/Inspection Criteria/Standards for Wave
and/or Current Energy Generating Devices, s.l.: Free Flow Energy.
American Petroleum Institute, 2005. Design and Analysis of Stationkeeping Systems
for Floating Structures API RP 2SK. Washington: API RP 2SK.
Aquascientific, 2010. Technology. [Online]
Available at: http://aquascientific2.moonfruit.com/#/news/4534195603 [Accessed 10
July 2012].
Bengtsson, N. & Ekström, V., 2012 . SEAFLEX The Buoy Mooring System. [Online]
Available at: http://buoymooring.com/ [Accessed 13 August 2012].
Bluemark Consultants, 2012. Wholesale Electricity Price Trend Chart. [Online]
Available at: http://www.bluemarkconsultants.co.uk/business-electricity-wholesale-
prices.php [Accessed 14 08 2012].
Bluewater, 2011. Bluewater develops cost-effective tidal energy converter
“BLUETEC”. [Online] Available at: http://www.bluewater.com/bluetec/ [Accessed 3
July 2012].
BuoyTech, 2011. Buoy Technology, LLC.. [Online] Available at:
http://www.buoytec.com/index.htm [Accessed 2 08 2012].
Carbon Trust, 2006. The Future of Marine Energy - Results of the Marine Energy
Challenge: Cost competitiveness and growth of wave and tidal stream energy,
London: Carbon Trust.
Carbon Trust, 2011. Accelerating Marine Energy, London: Carbon Trust.
Clarke, J. A. et al., 2009. Contra-rotating Marine Current Turbines: Single Point
Tethered Floating System - Stability and Performance. Upsalla, Sweden, In: 8th
European Wave and Tidal Energy Conference, EWTEC 2009,.

63
Clarke, J. A. et al., 2008. A contra-rotating marine current turbine on a flexible
mooring : development of a scaled prototype.. Brest, France, 2nd International
Conference on Ocean Energy.
Clarke, J. et al., 2008. Development of a Contra-Rotating Tidal Current Turbine and
Analysis of Performance, Glasgow: University of Strathclyde.
Datawell, 2011. Datawell Rubber Cords. [Online]
Available at:
http://download.datawell.nl/documentation/datawell_brochure_rubbercords_b-21-
02.pdf [Accessed 05 July 2012].
Davies, P., 2009. Guidelines for Design Basis of Marine Energy Conversion Systems -
European Marine Energy Centre Ltd., London: BSI.
De Chant, L., 2005. The venerable 1/7th power law turbulent velocity profile: a
classical nonlinear boundary value problem solution and its relationship to stochastic
processes. Applied Mathematics and Computation, Volume 161, pp. 436-474.
DECC, D. o. E. a. C. C., 2012. Funding Support for Wave and Tidal. [Online]
Available at:
http://www.decc.gov.uk/en/content/cms/meeting_energy/wave_tidal/funding/funding.
aspx [Accessed 15 July 2012].
Department of Defence - United States of America, 2005. Unified Facilities Criteria -
Design:Moorings, s.l.: Department of Defence - United States of America.
Det Norske Veritas, 2005. Guidelines On Design And Operation Of Wave Energy
Converters, s.l.: Carbon Trust.
Det Norske Veritas, 2008. Offshore Mooring Chain, Hovik, Norway: s.n.
Det Norske Veritas, 2009. Offshore Mooring Steel Wire Ropes. Høvik, Norway:
DNV-OS-E304.
Det Norske Veritas, 2010. Offshore Mooring Fibre Ropes. Høvik, Norway: DNV-OS-
E303.

64
Det Norske Veritas, 2010. Offshore Standard - DNV-OS-E301 - Position Mooring,
s.l.: s.n.
DTI, 2005. Wave and Tidal-stream Energy Demonstration Scheme. [Online]
Available at:
http://webarchive.nationalarchives.gov.uk/+/http://www.berr.gov.uk/files/file23963.p
df [Accessed 18 July 2012].
Ecomerit Technologies , 2011. Aquantis. [Online]
Available at: http://www.ecomerittech.com/aquantis.php [Accessed 17 July 2012].
Elemental Technologies Ltd., 2012. SeaUrchin Update. [Online]
Available at:
http://eettidal.com/Media/SeaUrchinUpdateMarch2012SeaTrials/tabid/187/Default.as
px [Accessed 3 July 2012].
EMEC, 2012. Tidal developers. [Online]
Available at: http://www.emec.org.uk/marine-energy/tidal-developers/ [Accessed 7
July 2012].
EMEC, E. M. E. C., 2009. Guidelines for Design Basis of Marine Energy Conversion
Systems, London: BSI.
European Commission, 2012. Renewable Energy: a major player in the European
energy market, s.l.: s.n.
Frankel, P., 2002. Power form Marine Currents. Proceeding of the Institution of
Mechanical Engineers, Part A: Journal of Power and Energy, Issue 216: 1.
GL Noble Denton, 2010. Technical Policy Board - Guidelines For Moorings, s.l.: GL
Noble Denton.
Han, S. & Grosenbaugh, M., 2006. On the Design of Single-Point Cable-Linked
Moorings for Ocean Observatories. IEEE Journal of Oceanic Engineering, 31(3), pp.
585 - 598 .
Hazelett, 2010. HM Hazelett Elastic Mooring Systems. [Online]
Available at:

65
http://www.hazelettmarine.com/pdf/HM%20Hazelett%20Elastic%20Mooring%20Sys
tems.pdf [Accessed 29 06 2012].
Health and Safety Executive, 2002. Station Keeping, Maidenhead: HSE Books.
Hill, T., 2012. Hazelett Marine LLC. [Interview] (25 August 2012).
IACS, 2010. Guidelines for the Survey of Offshore Mooring Chain Cable Use, s.l.:
International Association of Classification Societies.
IALA, 2005. Synthetic mooring lines, Saint Germain en Laye: International
Association of Marine Aids to Navigation and Lighthouse Authorities.
IALA, 2008. IALA Guideline No. 1040 On The Maintenance of Buoys and Small Aids
to Navigation Structures, Saint Germain en Laye: International Association of Marine
Aids to Navigation and Lighthouse Authorities.
IALA, 2010. Guideline 1066 – The Design of Floating Aid to Navigation Moorings,
Saint Germain en Laye: International Association of Marine Aids to Navigation and
Lighthouse Authorities.
Irish, J. D., Walter, P. & Wyman, D. M., 2005. The Determination of the Elastic
Modulus of Rubber Mooring Tethers and their use in Coastal Moorings,
Massachusetts: Woods Hole Oceanographic Institution.
Jing, F., Zhang, L. & Yang, Z., 2012. Fatigue Life Prediction of Mooring Chains fora
Floating Tidal Current Power Station. Journal of Applied Marine Science, Volume 11,
pp. 216-221.
Johnstone, C., Pratt, D., Clarke, J. & Grant, A., 2012. A techno-economic analysis of
tidal energy technology. Renewable Energy, Volume
doi:10.1016/j.renene.2012.01.054, pp. 1-6.
Joosten, H. P., 2006. Elastic mooring of navigation buoys. International Ocean
Systems.
Jootsen, H. P. & Hoekstra, S., 2003. Mooring Buoys With Natural Rubber, s.l.:
Rubber Foundation Information Center for Natural Rubber.

66
Leslie, E., 2012. The Tides. [Online]
Available at: http://www.icit.hw.ac.uk/student_project/sweyn3.htm [Accessed 01
August 2012].
Lloyds Register, 2008. Rules and Regulations for the Classification of a Floating
Offshore Installation at a Fixed Location, s.l.: s.n.
Minesto, 2012. Technology Development. [Online]
Available at: http://www.minesto.com/oceanenergy/tidal-energy.html [Accessed 17
July 2012].
Mueller, M. & Wallace, R., 2008. Enabling science and technology for marine
renewable energy. Energy Policy, pp. 4376-4382.
Mueller, M. & Wallace, R., 2008. Enabling science and technology for marine
renewable energy. Energy Policy, pp. 4376-4382.
Nautricity, 2012. Green Energy: Powered by the sea, harnessed by Nautricity.
[Online] Available at: http://www.nautricity.com/ [Accessed 3 July 2012].
Naval Facilities Engineering Command, 1987. Mooring Maintenance Manual,
Virginia: Naval Facilities Engineering Command.
NOAA, N. O. a. A. A., 2004. Frequency of Tides - The Lunar Day. [Online]
Available at: http://oceanservice.noaa.gov/education/kits/tides/tides05_lunarday.html
[Accessed 27 07 2012].
Noble Denton Europe Limited, 2006. Floating production system JIP FPS mooring
integrity, s.l.: Health and Safety Executive (HSE).
Ocean Flow Energy, 2012. Development Status. [Online]
Available at: http://www.oceanflowenergy.com/development-status.html [Accessed 7
July 2012].
Offshore Moorings, 2006. Catenary or Taut?. [Online]
Available at:
http://www.offshoremoorings.org/moorings/2005/overview/Tool%20Ibb.html
[Accessed 15 07 2012].

67
Oldport Marine Services inc., 2008. The Hazlett elastic mooring system. [Online]
Available at: http://www.oldportmarine.com/hazlett.htm
[Accessed 02 07 2012].
Orme, J. & Masters, I., 2006. Analysis and comparison of support structure concepts
for tidal stream turbines. [Online]
Available at: http://www.swanturbines.co.uk/images/supportstructures.pdf
[Accessed 03 August 2012].
Owen, R., 2012. Northern Lighthouse Board, Information regarding maintenance of
navigation buoys [Interview] (12 August 2012).
Paul, W. & Irish, J., 1998. Providing Electrical Power in Conjunction with
Elastomeric Buoy Moorings. Baltimore, Proceedings of the Ocean Community
Conference.
Pelamis Wave Power, 2012. Pelamis Wave POwer Development History. [Online]
Available at: http://www.pelamiswave.com/development-history
[Accessed 01 July 2012].
Previsic, M., 2004. E2I EPRI Assessment - Offshore Wave Energy Conversion
Devices. [Online]
Available at:
http://www.energy.ca.gov/oceanenergy/E2I_EPRI_REPORT_WAVE_ENERGY.PDF
[Accessed 20 June 2012].
Rawlings, B., 2010. Mooring Hardware Specifications for Marine Energy Converters,
Ottowa: CanmetENERGY.
Rawlings, B. & Klaptocz, V., 2010. Mooring hardware specification for marine
energy converters, Ottowa: CanmetENERGY.
REUK, 2012. TidEl Tidal Turbines. [Online]
Available at: http://www.reuk.co.uk/TidEl-Tidal-Turbines.htm
[Accessed 7 July 2012].
Robinson, S., 2012. Trinity House - Information regarding mooring of navigation
buoys [Interview] (3 August 2012).
68
Rourke, F. O., Reynolds, A. & Boyle, F., 2009. Tidal Energy Update 2009. Applied
Energy, pp. 398-408.
Scot Renewables Tidal Power Ltd., 2012. Scale Model Testing. [Online]
Available at: http://www.scotrenewables.com/technology-development/scale-model-
testing [Accessed 7 July 2012].
Scotrenewables, T. P. L., 2011. SR250 Technology. [Online]
Available at: http://www.scotrenewables.com/technology-development/full-scale-
prototype/the-technology [Accessed 13 july 2012].
Scottish Executive, 2011. 2020 Routemap for Renewable Energy in Scotland. [Online]
Available at: http://scotland.gov.uk/ID3/205758
[Accessed 24 July 2012].
Scrivens, L., 2012. Datawell Rubber Cords [Interview] (18 August 2012).
Sheldahl, R. & Klimas, P., 1981. Aerodynamic Characteristics of Seven Airfoil
Sections Through 180 Degrees of Angle of Attack for Use in Aerodynamic Analysis of
Vertical Axis Wind Turbines, Albuquerque: Sandia National Laboratories.
SMD Hydrovision, 2012. SMD Renewables - Design and Development. [Online]
Available at: http://smd.co.uk/products/renewables/design-development.htm
[Accessed 10 August 2012].
UK Department of Energy, 1990. Offshore Installations: Guidance on Design,
Construction and Certification. London: HMSO.
Utne, I. B., 2010. Emerald Article: Maintenance strategies for deep-sea offshore wind
turbines. Journal of Quality in Maintenance Engineering, pp. 367 - 381.
Vryhof Anchors BV, 2010. Anchor Manual. 4th ed. The Netherlands: Vryhof Anchors
BV.
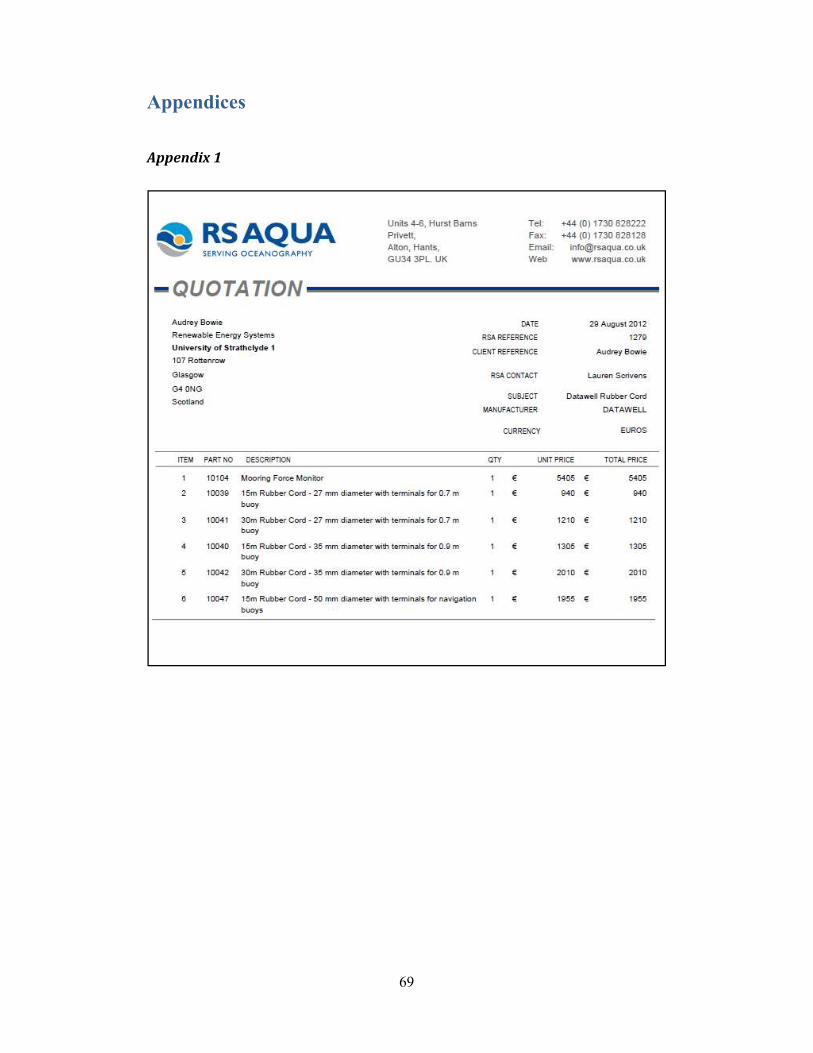
69
Appendices
Appendix 1
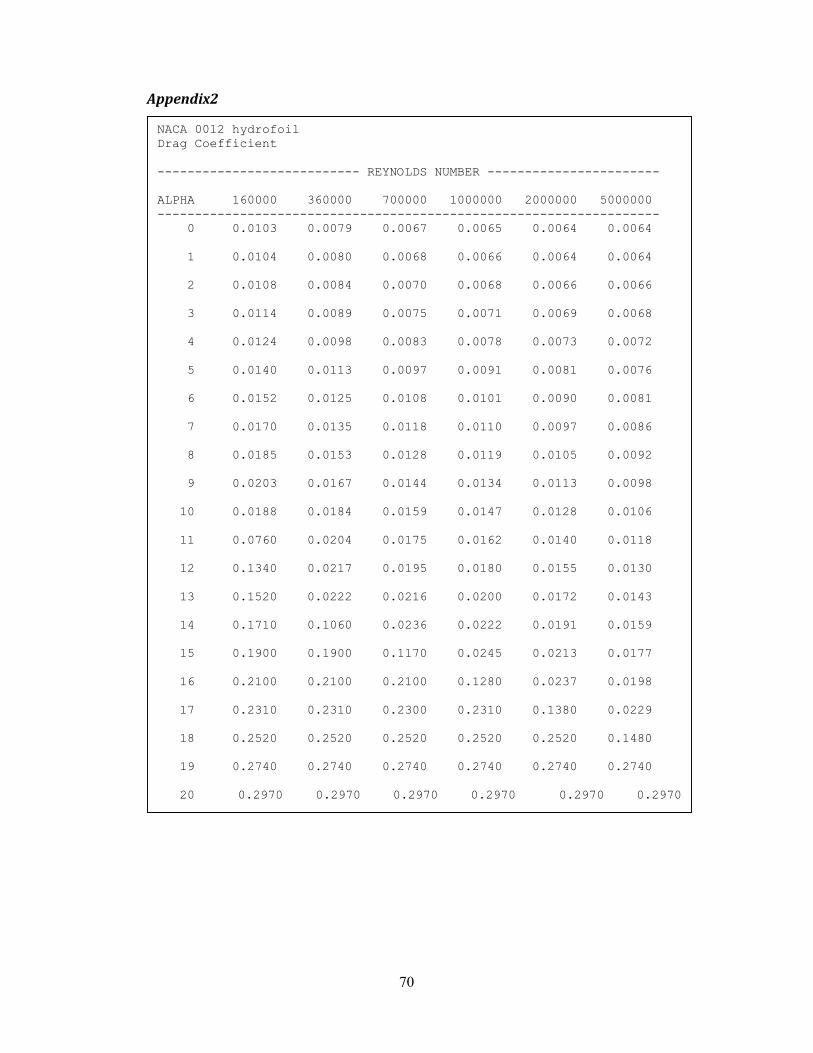
70
Appendix2
NACA 0012 hydrofoil
Drag Coefficient
--------------------------- REYNOLDS NUMBER -----------------------
ALPHA 160000 360000 700000 1000000 2000000 5000000
-------------------------------------------------------------------
0 0.0103 0.0079 0.0067 0.0065 0.0064 0.0064
1 0.0104 0.0080 0.0068 0.0066 0.0064 0.0064
2 0.0108 0.0084 0.0070 0.0068 0.0066 0.0066
3 0.0114 0.0089 0.0075 0.0071 0.0069 0.0068
4 0.0124 0.0098 0.0083 0.0078 0.0073 0.0072
5 0.0140 0.0113 0.0097 0.0091 0.0081 0.0076
6 0.0152 0.0125 0.0108 0.0101 0.0090 0.0081
7 0.0170 0.0135 0.0118 0.0110 0.0097 0.0086
8 0.0185 0.0153 0.0128 0.0119 0.0105 0.0092
9 0.0203 0.0167 0.0144 0.0134 0.0113 0.0098
10 0.0188 0.0184 0.0159 0.0147 0.0128 0.0106
11 0.0760 0.0204 0.0175 0.0162 0.0140 0.0118
12 0.1340 0.0217 0.0195 0.0180 0.0155 0.0130
13 0.1520 0.0222 0.0216 0.0200 0.0172 0.0143
14 0.1710 0.1060 0.0236 0.0222 0.0191 0.0159
15 0.1900 0.1900 0.1170 0.0245 0.0213 0.0177
16 0.2100 0.2100 0.2100 0.1280 0.0237 0.0198
17 0.2310 0.2310 0.2300 0.2310 0.1380 0.0229
18 0.2520 0.2520 0.2520 0.2520 0.2520 0.1480
19 0.2740 0.2740 0.2740 0.2740 0.2740 0.2740
20 0.2970 0.2970 0.2970 0.2970 0.2970 0.2970

71
NACA 0012 hydrofoil
Lift Coefficients
-------------------------- REYNOLDS NUMBER -----------------------
ALPHA 160000 360000 700000 1000000 2000000 5000000
------------------------------------------------------------------
0 0.0000 0.0000 0.0000 0.0000 0.0000 0.0000
1 0.1100 0.1100 0.1100 0.1100 0.1100 0.1100
2 0.2200 0.2200 0.2200 0.2200 0.2200 0.2200
3 0.3300 0.3300 0.3300 0.3300 0.3300 0.3300
4 0.4400 0.4400 0.4400 0.4400 0.4400 0.4400
5 0.5500 0.5500 0.5500 0.5500 0.5500 0.5500
6 0.6600 0.6600 0.6600 0.6600 0.6600 0.6600
7 0.7460 0.7700 0.7700 0.7700 0.7700 0.7700
8 0.8247 0.8542 0.8800 0.8800 0.8800 0.8800
9 0.8527 0.9352 0.9598 0.9661 0.9900 0.9900
10 0.1325 0.9811 1.0343 1.0512 1.0727 1.1000
11 0.1095 0.9132 1.0749 1.1097 1.1539 1.1842
12 0.1533 0.4832 1.0390 1.1212 1.2072 1.2673
13 0.2030 0.2759 0.8737 1.0487 1.2169 1.3242
14 0.2546 0.2893 0.6284 0.8846 1.1614 1.3423
15 0.3082 0.3306 0.4907 0.7108 1.0478 1.3093
16 0.3620 0.3792 0.4696 0.6060 0.9221 1.2195
17 0.4200 0.4455 0.5195 0.5906 0.7826 1.0365
18 0.4768 0.5047 0.5584 0.6030 0.7163 0.9054
19 0.5322 0.5591 0.6032 0.6334 0.7091 0.8412
20 0.5870 0.6120 0.6474 0.6716 0.7269 0.8233

72
Appendix 3
0
50000
100000
150000
200000
250000
0 1 2 3 4 5 6 7 8 9 10 11 12 13
Power (W
h)
Day
Energy generated throughout cycle - hydrofoil elastic and inelastic lines
elastic hydrofoil

73
0
50000
100000
150000
200000
250000
0 1 2 3 4 5 6 7 8 9 10 11 12 13
Power (Wh)
Day
Energy generated throughout cycle - 5 meter buoy elastic and inelastic lines
elastic 5m buoy