flextronics international ltd. - s21.q4cdn.com · flextronics international ... operations 34 item...
TRANSCRIPT
FLEXTRONICS INTERNATIONAL LTD.
FORM 10-K(Annual Report)
Filed 05/29/12 for the Period Ending 03/31/12
Telephone (65) 6890 7188
CIK 0000866374Symbol FLEX
SIC Code 3672 - Printed Circuit BoardsIndustry Semiconductors
Sector TechnologyFiscal Year 03/31
http://www.edgar-online.com© Copyright 2015, EDGAR Online, Inc. All Rights Reserved.
Distribution and use of this document restricted under EDGAR Online, Inc. Terms of Use.
Use these links to rapidly review the document TABLE OF CONTENTS
Table of Contents
UNITED STATES SECURITIES AND EXCHANGE COMMISSION Washington, D.C. 20549
Form 10-K
Commission file number 000-23354
FLEXTRONICS INTERNATIONAL LTD. (Exact name of registrant as specified in its charter)
Registrant's telephone number, including area code (65) 6890 7188
Securities registered pursuant to Section 12(b) of the Act:
Securities registered pursuant to Section 12(g) of the Act—NONE
Indicate by check mark if the registrant is a well-known seasoned issuer, as defined in Rule 405 of the Securities Act. Yes � No �
Indicate by check mark if the registrant is not required to file reports pursuant to Section 13 or Section 15(d) of the Exchange Act. Yes �
No �
Indicate by check mark whether the registrant: (1) has filed all reports required to be filed by Section 13 or 15(d) of the Securities Exchange Act of 1934 during the preceding 12 months (or for such shorter period that the registrant was required to file such reports), and
Singapore (State or other jurisdiction of incorporation or organization)
Not Applicable (I.R.S. Employer
Identification No.)
2 Changi South Lane,
486123
Singapore (Address of registrant's principal executive offices)
(Zip Code)
Title of Each Class Name of Each Exchange on Which Registered
Ordinary Shares, No Par Value The NASDAQ Stock Market LLC (NASDAQ Global Select Market)
(Mark One)
�
ANNUAL REPORT PURSUANT TO SECTION 13 OR 15(d) OF THE SECURITIES EXCHANGE ACT OF 1934
For the fiscal year ended March 31, 2012
Or
�
TRANSITION REPORT PURSUANT TO SECTION 13 OR 15(d) OF THE SECURITIES EXCHANGE ACT OF 1934

(2) has been subject to such filing requirements for the past 90 days. Yes � No �
Indicate by check mark whether the registrant has submitted electronically and posted on its corporate Website, if any, every Interactive Data File required to be submitted and posted pursuant to Rule 405 of Regulation S-T during the preceding 12 months (or for such shorter period that the registrant was required to submit and post such files). Yes � No �
Indicate by check mark if disclosure of delinquent filers pursuant to Item 405 of Regulation S-K is not contained herein, and will not be contained, to the best of the registrant's knowledge, in definitive proxy or information statements incorporated by reference in Part III of this Form 10-K or any amendment to this Form 10-K. �
Indicate by check mark whether the registrant is a large accelerated filer, an accelerated filer, a non-accelerated filer, or a smaller reporting company. See definitions of "large accelerated filer," "accelerated filer" and "smaller reporting company" in Rule 12b-2 of the Exchange Act.
Indicate by check mark whether the registrant is a shell company (as defined in Rule 12b-2 of the Exchange Act). Yes � No �
As of September 30, 2011, the aggregate market value of the Company's ordinary shares held by non-affiliates of the registrant was approximately $4.0 billion based upon the closing sale price as reported on the NASDAQ Stock Market LLC (NASDAQ Global Select Market).
Indicate the number of shares outstanding of each of the registrant's classes of common stock, as of the latest practicable date.
DOCUMENTS INCORPORATED BY REFERENCE
Class Outstanding at May 16, 2012
Ordinary Shares, No Par Value 675,246,882
Large accelerated filer � Accelerated filer � Non-accelerated filer � Smaller reporting company �
Document Parts into Which Incorporated
Proxy Statement to be delivered to shareholders in connection with the Registrant's 2012 Annual General Meeting of Shareholders
Part III

Table of Contents
TABLE OF CONTENTS
2
Page
PART I
Forward-Looking Statements
3 Item 1. Business 4 Item 1A. Risk Factors 15 Item 1B. Unresolved Staff Comments 27 Item 2. Properties 27 Item 3. Legal Proceedings 27 Item 4. Mine Safety Disclosures 27
PART II
Item 5.
Market for Registrant's Common Equity, Related Shareholder Matters and Issuer Purchases of Equity Securities
28 Item 6. Selected Financial Data 32 Item 7. Management's Discussion and Analysis of Financial Condition and Results of
Operations
34 Item 7A. Quantitative and Qualitative Disclosures About Market Risk 51 Item 8. Financial Statements and Supplementary Data 53 Item 9. Changes in and Disagreements with Accountants on Accounting and Financial
Disclosure
99 Item 9A. Controls and Procedures 99 Item 9B. Other Information 102
PART III
Item 10.
Directors, Executive Officers and Corporate Governance
102 Item 11. Executive Compensation 102 Item 12. Security Ownership of Certain Beneficial Owners and Management and Related
Shareholder Matters
102 Item 13. Certain Relationships and Related Transactions, and Director Independence 102 Item 14. Principal Accountant Fees and Services 102
PART IV
Item 15.
Exhibits and Financial Statement Schedules
102
Signatures
106
Table of Contents
PART I
FORWARD-LOOKING STATEMENTS
Unless otherwise specifically stated, references in this report to "Flextronics," "the Company," "we," "us," "our" and similar terms mean Flextronics International Ltd. and its subsidiaries.
Except for historical information contained herein, certain matters included in this annual report on Form 10-K are, or may be deemed to be forward-looking statements within the meaning of Section 21E of the Securities Exchange Act of 1934 and Section 27A of the Securities Act of 1933. The words "will," "may," "designed to," "believe," "should," "anticipate," "plan," "expect," "intend," "estimate" and similar expressions identify forward-looking statements, which speak only as of the date of this annual report. These forward-looking statements are contained principally under Item 1, "Business," and under Item 7, "Management's Discussion and Analysis of Financial Condition and Results of Operations." Because these forward-looking statements are subject to risks and uncertainties, actual results could differ materially from the expectations expressed in the forward-looking statements. Important factors that could cause actual results to differ materially from the expectations reflected in the forward-looking statements include those described in Item 1A, "Risk Factors" and Item 7, "Management's Discussion and Analysis of Financial Condition and Results of Operations." In addition, new risks emerge from time to time and it is not possible for management to predict all such risk factors or to assess the impact of such risk factors on our business. Given these risks and uncertainties, the reader should not place undue reliance on these forward-looking statements. We undertake no obligation to update or revise these forward-looking statements to reflect subsequent events or circumstances.
3

Table of Contents
ITEM 1. BUSINESS
OVERVIEW
We are a leading global provider of vertically-integrated advanced design, manufacturing and services to original equipment manufacturers ("OEMs") in the following markets:
• High Reliability Solutions (HRS), which is comprised of our medical, automotive, defense and aerospace businesses;
• High Velocity Solutions (HVS), which includes our mobile/smart phone business, consumer electronics, including game consoles and printers, enterprise PC business, and our ODM personal computing business which we exited in the third quarter of fiscal 2012;
• Industrial and Emerging Industries (IEI), which is comprised of our industrial, semiconductor capital equipment, and clean technology businesses; and
• Integrated Network Solutions (INS), which includes our telecommunications infrastructure, data networking, connected home, and server and storage businesses.
We are a globally-recognized leading provider of end-to-end, vertically-integrated global supply chain services through which we design, build, ship and service a complete packaged electronic product for our customers worldwide. We provide our services through a network of facilities in over 30 countries across four continents. We have established this extensive network of manufacturing facilities in the world's major electronics markets (Asia, the Americas and Europe) in order to serve the outsourcing needs of both multinational and regional OEMs. Our vertically-integrated services increase customer competitiveness by delivering improved product quality, leading manufacturability, improved performance, faster time-to-market and reduced costs. Our OEM customers leverage our services to meet their requirements throughout their products' entire life cycles. For the fiscal year ended March 31, 2012, we had revenue of $29.4 billion and net income of $488.8 million.
We believe that the combination of our extensive design and engineering services, significant scale and global presence, vertically-integrated end-to-end services, advanced supply chain management, industrial parks in low-cost geographic areas and operational track record provide us with a competitive advantage in the market for designing, manufacturing and servicing electronics products for leading multinational and regional OEMs. Through these services and facilities, we offer our OEM customers the ability to simplify their global product development, their manufacturing process, their after sales services and enable our OEM customers to achieve meaningful reductions to time-to-market and costs.
Our business has been subject to seasonality primarily due to our mobile devices market and our consumer devices market, which historically exhibit particular strength towards the end of the calendar year in connection with the holiday season.
INDUSTRY OVERVIEW
The industry in which we operate has experienced significant change and growth as an increasing number of companies elected to outsource some or all of their design, manufacturing, and distribution requirements. We have seen an increase in penetration of global OEM manufacturing requirements since the 2001 - 2002 technology downturn as more and more OEMs pursued the benefits of outsourcing rather than internal manufacturing. Due to the global economic crisis, which began in late calendar year 2007 and continued through the end of our fiscal year 2010, many of our OEM customers reduced their manufacturing and supply chain outsourcing which negatively impacted our business. Beginning in the second half of our fiscal year 2010, we began seeing some positive signs that demand for our OEM customers' end products was improving, and this trend continued through the end of our 2012 fiscal year. We believe the industry is firmly recovering from the last macroeconomic
4

Table of Contents
downturn and growth of the overall industry for calendar 2011 is estimated to have been greater than 13%.
We believe the total available market for outsourcing electronics manufacturing services continues to offer opportunities for growth with current penetration rates estimated to be less than 25%. The intensely competitive nature of the electronics industry, the continually increasing complexity and sophistication of electronics products, pressure on OEMs to reduce product costs and shorter product life cycles encourage OEMs to utilize broad manufacturing and service providers as part of their business and manufacturing strategies. Utilizing global manufacturing and service providers allows OEMs to take advantage of the global design, manufacturing and supply chain management expertise of such providers, and enables OEMs to concentrate on product research, development, marketing and sales. We believe that OEMs realize the following benefits through their strategic relationships with manufacturing and service providers:
• Reduced production costs;
• Reduced design and development costs and lead time;
• Accelerated time-to-market and time-to-volume production;
• Reduced capital investment requirements and fixed costs;
• Improved inventory management and purchasing power;
• Access to worldwide design, engineering, manufacturing, and after-market service capabilities; and
• Ability to focus on core branding and R&D initiatives.
We believe that growth in the EMS industry will be driven largely by the needs of OEMs to respond to rapidly changing markets and technologies and to reduce product costs. Additionally, we believe that there are significant opportunities for global manufacturing and service providers to win additional business from OEMs in certain markets or industry segments that have yet to substantially utilize such providers.
SERVICE OFFERINGS
We offer a broad range of customer-tailored, vertically-integrated services to OEMs. We believe that Flextronics has the broadest worldwide capabilities in the industry, from design resources to end-to-end, vertically-integrated global supply chain services. We believe a key competitive advantage is our ability to provide more value and innovation to our customers because we offer both global economies of scale in procurement, manufacturing and after-market services, as well as market-focused expertise and capabilities in design and engineering. As a result of our focus on specific markets, we believe we are able to better understand complex market dynamics and anticipate trends that impact our OEM customers' businesses, and can help improve our OEM customers' market positioning by effectively adjusting product plans and roadmaps to deliver low-cost, high quality products and meet their time-to-market requirements. Our vertically-integrated services allow us to design, build, ship and service a complete packaged electronics product to our OEM customers. These services include:
Design and Engineering Services. We offer a comprehensive range of value-added design and engineering services that are tailored to the various markets and needs of our customers. These services can be delivered by three primary business models:
• Contract Design Services, where the customer purchases engineering and development services on a time and materials basis;
5

Table of Contents
• Joint Development Manufacturing services, where Flextronics' engineering and development teams work jointly with our customers' teams to ensure product development integrity, seamless manufacturing handoffs, and faster time to market; and
• Original Design and Manufacturing services, where the customer purchases a product that we design, develop and manufacture. ODM products are then sold by our OEM customers under the OEMs' brand names. We have provided ODM services in various markets including Industrial, Automotive, Medical, and Infrastructure and Power Supplies.
Our design and engineering services are provided by our global, market-based engineering teams and cover a broad range of technical competencies:
• System Architecture, User Interface and Industrial Design . We help our customers design and develop innovative and cost-effective products that address the needs of the user and the market. These services include product definition, analysis and optimization of performance and functional requirements, 2-D sketch level drawings, 3-D mock-ups and proofs of concept, interaction and interface models, detailed hard models and product packaging.
• Mechanical Engineering, Technology, Enclosure Systems, Thermal and Tooling Design . We offer detailed mechanical, structural, and thermal design solutions for enclosures that encompass a wide range of plastic, metal and other material technologies. These capabilities and technologies are increasingly important to our customers' product differentiation goals and are increasingly required to be successful in today's competitive marketplace. Additionally, we provide design and development services for prototype and production tooling equipment used in manufacturing.
• Electronic System Design . We provide complete electrical and hardware design for products ranging in size from small handheld consumer devices to large high-speed, carrier-grade, telecommunications equipment, which includes embedded microprocessor, memory, digital signal processing design, high-speed digital interfaces, analog circuit design, power management solutions, wired and wireless communication protocols, display imaging, audio/video, and radio frequency system and antenna design.
• Reliability and Failure Analysis . We provide comprehensive design for manufacturing, test and reliability services using robust tools and databases that have been developed internally. These services are important in achieving our customers' time to revenue goals and leverage our core manufacturing competencies.
• Component Level Development Engineering . We have developed substantial engineering competencies for product development and lifecycle management in support of various component technologies. These components also form a key part of our vertical integration strategy and currently include power supplies and power solutions, LCD and Touch Interface Modules, Camera Modules, and Printed Circuit Board and Interconnection Technologies, both rigid and flexible.
We are exposed to different or greater potential liabilities from our various design services than those we face in our core assembly and manufacturing services. See "Risk Factors—The success of certain of our activities depends on our ability to protect our intellectual property rights; intellectual property infringement claims against our customers or us could harm our business."
Systems Assembly and Manufacturing. Our assembly and manufacturing operations, which generate the majority of our revenues, include printed circuit board assembly and assembly of systems and subsystems that incorporate printed circuit boards and complex electromechanical components. We often assemble electronics products with our proprietary printed circuit boards and custom electronic enclosures on either a build-to-order or configure-to-order basis. In these operations, we employ just-in-time, ship-to-stock and ship-to-line programs, continuous flow
6
Table of Contents
manufacturing, demand flow processes, and statistical process controls. As OEMs seek to provide greater functionality in smaller products, they increasingly require more sophisticated manufacturing technologies and processes. Our investment in advanced manufacturing equipment and our experience and expertise in innovative miniaturization, packaging and interconnect technologies, enables us to offer a variety of advanced manufacturing solutions. We support a wide range of product demand profiles, from low—volume, high-complexity programs to high-volume production. Continuous focus on lean manufacturing, a systematic approach to identifying and eliminating waste (non-value-added activities) through continuous improvement based on customer demand, allows us to increase our efficiency and flexibility to meet our customers' dynamic requirements. Our systems assembly and manufacturing expertise includes the following:
• Enclosures . We offer a comprehensive set of custom electronics enclosures and related products and services worldwide. Our services include the design, manufacture and integration of electronics packaging systems, including custom enclosure systems, power and thermal subsystems, interconnect subsystems, cabling and cases. In addition to standard sheet metal and plastic fabrication services, we assist in the design of electronics packaging systems that protect sensitive electronics and enhance functionality. Our enclosure design services focus on functionality, manufacturability and testing. These services are integrated with our other assembly and manufacturing services to provide our customers with overall improved supply chain management.
• Testing Services . We also offer computer-aided testing services for assembled printed circuit boards, systems and subsystems. These services significantly improve our ability to deliver high-quality products on a consistent basis. Our test services include management defect analysis, in-circuit testing and functional testing as well as environmental stress tests of board and system assemblies. We offer design for test, design for manufacturing and design for environment services to our customers to jointly improve customer product design and manufacturing.
• Materials Procurement and Inventory Management . Our manufacturing and assembly operations capitalize on our materials inventory management expertise and volume procurement capabilities. As a result, we believe that we are able to achieve highly competitive cost reductions and reduce total manufacturing cycle time for our OEM customers. Materials procurement and management consist of the planning, purchasing, expediting and warehousing of components and materials used in the manufacturing process. In addition, our strategy includes having third-party suppliers of custom components located in our industrial parks to reduce material and transportation costs, simplify logistics and facilitate inventory management. We also use a sophisticated automated manufacturing resource planning system and enhanced electronic data interchange capabilities to ensure inventory control and optimization. Through our manufacturing resources planning system, we have real-time visibility of material availability and are able to track the work in process. We utilize electronic data interchange with our customers and suppliers to implement a variety of supply chain management programs. Electronic data interchange allows customers to share demand and product forecasts and deliver purchase orders and assists suppliers with satisfying just-in-time delivery and supplier-managed inventory requirements. This also enables us to implement vendor managed inventory solutions to increase flexibility and reduce overall capital allocation in the supply chain. We procure a wide assortment of materials, including electronic components, plastics and metals. There are a number of sources for these materials, including from customers for whom we are providing systems assembly and manufacturing services. On some occasions, there have been shortages in certain electronic components, most recently with regard to connectors, capacitors, LCD panels and memory (both DRAM and Flash). However, such shortages have not had a material impact on our operating results for all periods presented. See "Risk Factors—We may be adversely affected by shortages of required electronic components."
7
Table of Contents
Component businesses. The Company offers a variety of component product solutions including:
• Rigid and Flexible Printed Circuit Board ("PCB") Fabrication . Printed circuit boards are platforms composed of laminated materials that provide the interconnection for integrated circuits, passive and other electronic components and thus are at the heart of most every electrical system. They are formed out of multi-layered epoxy resin and glass cloth systems with very fine traces and spaces and plated holes (called vias), which interconnect the different layers to an extreme dense circuitry network that carries the integrated circuits and electrical signals. As semiconductor designs become more and more complex and signal speeds increase, there is an increasing demand on printed circuit board integration density requiring higher layer counts, finer lines and spacings, smaller vias (microvias) and base materials with electrically very low loss characteristics. The manufacturing of these complex multilayer interconnect products often requires the use of sophisticated circuit interconnections between layers, and adherence to strict electrical characteristics to maintain consistent circuit transmission speeds and impedances. The global demand for wireless devices and the complexity of wireless products are driving the demand for more flexible printed circuits. Flexible circuit boards facilitate a reduction in the weight of a finished electronic product and allow the designer to use the third dimension in designing new products or product features. Flexible circuits have become a very attractive design alternative for many new and emerging application spaces such as automotive rear LED lightning, tablet computers, camera modules and miniaturized radio frequency identification tags or smart cards. We are an industry leader in high-density interconnect with the Every Layer Inter Connect (ELIC) technology, which is used in cell phone designs, and multilayer constructions which are used in advanced routers, computers, communication equipment, and flexible printed circuit boards and flexible printed circuit board assemblies. Our PCB business (Multek) manufactures printed circuit boards on a low-volume, quick-turn basis, as well as on a high-volume production basis. We provide quick-turn prototype services that allow us to provide small test quantities to meet the needs of customers' product development groups in as little as 48 hours. Our extensive range of services enables us to respond to our customers' demands for an accelerated transition from prototype to volume production. Multek offers a one stop solution from design to manufacturing of PCB, flexible circuits and rigid flex circuits and sub-assemblies. We have printed circuit board service capabilities in North America, South America, Europe and Asia, and flexible circuit fabrication service capabilities in North America and Asia.
• Display and Touch Solutions . Our Display group is a customer-driven organization focused on designing and manufacturing "Display and Touch-Sensor" products for our OEM customers. Our display platforms are based on two technologies. The first employs liquid crystal material sandwiched between two layers of glass to polarize light and provide a backlight system and color via a filter. The second technology, named bi-stable display technology, is based on E-Ink material. Our touch sensor solutions use projected capacitive technology, on both glass and film substrates to deliver single and multi-touch sensing. Display requirements are becoming more and more complex due to market demands for lighter, thinner products, and higher performance requirements, including brightness, more efficient power consumption, viewing angle, greater density of pixel per area, range of operating temperature, lower cost and smaller width for non-active borders as well as long life time support for specific markets. With our advanced design and manufacturing capabilities, we are a market leader in satisfying these requirements. We can support small and medium size form factors, provide high-end and highly customized displays and have developed strategic partnerships with critical supply chain companies.
• Power Supplies . We have a full service power supply business ("Flex Power") specializing in high efficiency and high density switching power supplies ranging from 1 to 3,000 watts. The product portfolio includes chargers for the mobile phones and the fast-growing tablet markets, adapters for notebook s and printers and boxed power supplies for the desktop markets along with
8

Table of Contents
networking, server and storage markets. We pride ourselves to be able to service the needs of Industry Leaders in these markets through collaborative development and excellent program management execution. The products we produce are fully compliant to environmental and Energy Star industry requirements that drive efficiency specifications in the industry. Customers who engage with Flex Power get the advantage of our technological innovations in such areas as digital control or smart power, while still managing to offer competitive pricing. Our unique platform development approach enables our customers to get to their markets faster.
• Optomechatronics (Camera Modules) . Our Optomechatronics group, Vista Point Technologies, manufactures products that combine optical, mechanical and electrical subsystems such as miniaturized camera modules for mobile phone and other portable imaging applications. On March 2, 2012, the Company entered into a definitive agreement with Tessera Technologies, Inc., and DigitalOptics Corporation (DOC), a wholly-owned subsidiary of Tessera Technologies. Under the terms of the definitive agreement DOC will acquire certain assets of Flextronics' Vista Point Technologies camera module business, including intellectual property and the China-based manufacturing operations.
Logistics. Flextronics Global Services is a provider of aftermarket supply chain logistics services. Our comprehensive suite of services serve customers operating in the computing, consumer digital, infrastructure, industrial, mobile and medical markets. Our expansive global infrastructure consists of 25 sites and more than 12,000 employees strategically located throughout the Americas, Europe and Asia. By leveraging our operational infrastructure, supply chain network, and IT systems, we have the capability of offering globally consistent logistics solutions for our customers' brands. By linking the flow of information from the supply chains, we create supply chain efficiencies delivering value to our customers. We provide multiple logistics solutions including supplier managed inventory, inbound freight management, product postponement, build/configure to order, order fulfillment and distribution, and supply chain network design.
Reverse Logistics and Repair Services. We offer a suite of integrated reverse logistics and repair solutions that are operated on globally consistent processes, which help our customers protect their brand loyalty in the marketplace by improving turnaround times and end-customer satisfaction levels. Our objective is to maintain maximum asset value retention of our customers' products throughout their product life cycle while simultaneously minimizing non-value repair inventory levels and handling in the supply chain. With our suite of end-to-end solutions, we can effectively manage our customers' reverse logistics requirements while also providing critical feedback of data to their supply chain constituents and delivering continuous improvement and efficiencies for both existing and new generation products. Our reverse logistics and repair solutions include returns management, exchange programs, complex repair, asset recovery, recycling and e-waste management. We provide repair expertise to multiple product lines such as consumer and midrange products, printers, PDA's, mobile phones, consumer medical devices, notebooks, PC's, set-top boxes, game consoles and highly complex infrastructure products. With our service parts logistics business, we manage all of the logistics and restocking processes essential to the efficient operation of repair and refurbishment services.
STRATEGY
At our core, we are a world-class global design, manufacturing and services company. Our strategy is to maintain our leadership in these core capabilities and to build on these through extended offerings in high-growth sectors.
Talent. To maintain our competitiveness and world-class capabilities, we are renewing our focus on hiring and retaining the world's best talent. We have taken steps to attract the best functional and operational leaders and accelerated efforts at developing the future leaders of the company.
9
Table of Contents
Customer-Focus. We believe that serving aspiring leaders in dynamic industries pushes the development of our core skills and results in superior growth and profitability. Our customers come first, and we have a relentless focus on delivering distinctive products and services in a cost-effective manner with fast time-to-market.
Market-Focus. We apply a rigorous approach to managing our portfolio of opportunities by focusing on companies and industries that value our superior capabilities in design, manufacturing and service and that are leaders in their industry. We are focusing our energy and efforts on high-growth markets where we have distinctive competence and a compelling value proposition. Examples include our investments in clean-tech, healthcare, infrastructure, automotive, services and investments in a number of enabling components technologies. Our market focused approach to managing our business increases our customers' competitiveness by leveraging our global resources and responsiveness to changes in market dynamics.
Global Operations Capabilities. We continue to invest in maintaining the leadership of our world-class manufacturing and services capabilities. We constantly push the state of the art in manufacturing technology, process development and operations management. We believe these skills represent a significant competitive advantage. We continue to capitalize on our industrial park concept, where we co-locate our manufacturing, design, and service resources in low cost regions, to provide a competitive advantage by minimizing logistics, manufacturing costs and cycle times while increasing flexibility and responsiveness. Our ability to cost effectively manage a massive worldwide system, is itself a major competitive advantage.
Extended Value Propositions. We continue to extend our distinctiveness in manufacturing into new value propositions that leverage our core capabilities. We opportunistically invest in new vertically integrated capabilities and services to provide our customers with a broader value added suite of services and solutions to meet their product and market requirements. We continue to develop manufacturing process technologies that reduce cost and improve product performance.
COMPETITIVE STRENGTHS
We continue to enhance our business through the development and broadening of our product and service offerings. Our focus is to be a flexible organization with repeatable execution that adapts to macroeconomic changes and creates value which increases our customers' competitiveness. We have concentrated our strategy on market-focused expertise, capabilities, services and our vertically-integrated global supply chain services. We believe that the following capabilities differentiate us from our competitors and enable us to better serve our customers' requirements:
Geographic, Customer and End Market Diversification. We believe that we have created a well-diversified and balanced company. We have diversified our business across multiple end markets, significantly expanding our available market. The world is undergoing change and macroeconomic disruptions that has led to demand shifts and realignments. We believe that we are well positioned through our market diversification to grow in excess of the industry average and successfully navigate through difficult economic climates. Our broad geographic footprint and experience with multiple types and complexity levels of products provide us a significant competitive advantage. We continually look for new ways to diversify our offering within each market segment.
Significant Scale and Global Integrated System. We believe that scale is a significant competitive advantage, as our customers' solutions increasingly require cost structures and capabilities that can only be achieved through size and global reach. We are a leader in global procurement, purchasing approximately $25.4 billion of materials during our fiscal year ended March 31, 2012. As a result, we are able to use our worldwide supplier relationships to achieve advantageous pricing and supply chain flexibility for our OEM customers.
10
Table of Contents
We have established an extensive, integrated network of design, manufacturing and logistics facilities in the world's major electronics markets to serve the outsourcing needs of both multinational and regional OEMs. Our extensive global network of facilities in 30 countries with approximately 159,000 employees gives us the ability to increase the competitiveness of our customers by simplifying their global product development processes while also delivering improved product quality with improved performance and accelerated time to market. Operating and executing this complex worldwide solutions system is a competitive advantage.
Extensive Design and Engineering Capabilities. We have an industry leading global design service offering with extensive product design engineering resources that provide global design services, products, and solutions to satisfy a wide array of customer requirements across all of our key markets. We combine our design and manufacturing services to provide end-to-end customized solutions that include services from design layout, through product industrialization and product development, including the manufacture of vertically-integrated components and complete products (such as smart phones), which are then sold by our OEM customers under the OEMs' brand names.
Vertically-Integrated End-to-End Solution. We offer a comprehensive range of worldwide supply chain services that simplify and improve the global product development process and provide meaningful time and cost savings to our OEM customers. Our broad based, vertically-integrated, end-to-end services enable us to cost effectively design, build, ship and service a complete packaged product. We believe that our vertically-integrated capabilities also help our customers improve product quality, manufacturability and performance, and reduce costs. We have expanded and enhanced our vertically-integrated service offering by adding capabilities in machining, flexible printed circuit boards, and power supplies, as well as by introducing new vertically-integrated capabilities in areas such as solar equipment, large format stamping and chargers.
Industrial Parks; Low-Cost Manufacturing Services. We have developed self-contained campuses that co-locate our manufacturing and logistics operations with our suppliers at a single, low-cost location. These industrial parks enhance our total supply chain management, while providing a low-cost, multi-technology solution for our customers. This approach increases the competitiveness of our customers by reducing logistical barriers and costs, improving communications, increasing flexibility, lowering transportation costs and reducing turnaround times. We have strategically established our large industrial parks in Brazil, China, Hungary, Israel, Mexico, Romania and Poland.
In addition, we have other regional manufacturing operations situated in low-cost regions of the world to provide our customers with a wide array of manufacturing solutions and low manufacturing costs. As of March 31, 2012, approximately 73% of our manufacturing capacity was located in low-cost locations, such as Brazil, China, Hungary, India, Indonesia, Malaysia, Mexico, Romania, Singapore, Slovakia and Ukraine. We believe we are a global industry leader in low-cost production capabilities.
Long-Standing Customer Relationships. We believe that maintaining our long-term relationships with key customers is a critical requirement for maintaining our market position, growth and profitability. We believe that our ability to maintain and grow these customer relationships results from our ability to continuously create value that increases our customers' competitiveness. We achieve this through our broad range of vertically-integrated service offerings and solutions, and our market-focused approach, which allows us to provide innovative thinking to all of the manufacturing and related services that we provide to our customers. We continue to receive numerous service and quality awards that further validate the success of these programs.
11

Table of Contents
CUSTOMERS
Our customers include many of the world's leading technology companies. We have focused on establishing long-term relationships with our customers and have been successful in expanding our relationships to incorporate additional product lines and services. In fiscal year 2012, our ten largest customers accounted for approximately 55% of net sales. Our largest customers during fiscal year 2012 were Hewlett-Packard (HP) and Research In Motion (RIM), which each accounted for more than 10% of net sales. No other customer accounted for more than 10% of net sales in fiscal year 2012.
The following table lists in alphabetical order a sample of our largest customers in fiscal year 2012 and the end products of those customers for which we provide design, manufacturing or after-market services:
BACKLOG
Although we obtain firm purchase orders from our customers, OEM customers typically do not make firm orders for delivery of products more than 30 to 90 days in advance. In addition, OEM customers may reschedule or cancel firm orders based upon contractual arrangements. Therefore, we do not believe that the backlog of expected product sales covered by firm purchase orders is a meaningful measure of future sales.
COMPETITION
Our market is extremely competitive and includes many companies, several of which have achieved substantial market share. We compete against numerous domestic and foreign manufacturing service providers, as well as our current and prospective customers, who evaluate our capabilities in light of their own capabilities and cost structures. We face particular competition from Asian based competitors, including Taiwanese ODM suppliers who compete in a variety of our end markets and have a substantial share of global information technology hardware production.
We compete with different companies depending on the type of service we are providing or the geographic area in which an activity takes place. We believe that the principal competitive factors in the
12
Customer End Products
Alcatel-Lucent Business telecommunications systems and core routers and switches Apple Smartphones, notebooks and desktop computing, tablets and
consumer entertainment devices Cisco Core routers and switches, wireless and enterprise
telecommunications infrastructure Ericsson Radio base stations for Long Term Evolution and GSM infrastructure Hewlett-Packard Notebook and netbook computers, inkjet printers and storage devices Huawei Technologies Wireless and enterprise telecommunications infrastructure and
smartphones Lenovo All -in-one desktop, desktop and notebook computers Microsoft Computer peripherals and consumer electronics gaming products Research In Motion Smartphones and other mobile communication devices Xerox Office equipment and components
Table of Contents
manufacturing services market are: quality and range of services; design and technological capabilities; cost; location of facilities; responsiveness and flexibility.
SOCIAL RESPONSIBILITY
Our corporate social responsibility practices focus on global human rights, global environmental conditions, business ethics, and the health and safety of all stakeholders. We do this with controlled business processes, thus ensuring that our business is conducted in a manner that goes beyond compliance alone. We operate programs, including compliance audits and compliance capability building programs, that focus on driving continuous improvements in social, ethical, and environmental compliance throughout all of our global operating units in accordance with our Code of Conduct. As a guide to achieve this end, Flextronics looks at principles, policies, and standards as prescribed by the Electronics Industry Citizenship Coalition ("EICC"), a worldwide association of electronics companies committed to promoting an industry code of conduct for global electronics supply chains to improve working and environmental conditions. Flextronics is a founding member of the EICC coalition.
Being a good corporate citizen does not mean that we should merely conform to the standards. We extend beyond meeting responsibilities by offering a wide range of programs and initiatives that engage our internal and external communities. At the heart of this endeavor lies our pragmatic goal of creating a difference to the people in the community in which we operate. We intend to continue to invest in these global communities through grant-making, financial contributions, volunteer work, support programs and by donating resources.
EMPLOYEES
As of March 31, 2012, our global workforce totaled approximately 159,000 employees. In certain international locations, our employees are represented by labor unions and by work councils. We have never experienced a significant work stoppage or strike, and we believe that our employee relations are good.
Our success depends to a large extent upon the continued services of key managerial and technical employees. The loss of such personnel could seriously harm our business, results of operations and business prospects. To date, we have not experienced significant difficulties in attracting or retaining such personnel.
ENVIRONMENTAL REGULATION
Our operations are regulated under various federal, state, local and international laws governing the environment, including laws governing the discharge of pollutants into the air and water, the management and disposal of hazardous substances and wastes and the cleanup of contaminated sites. We have compliance processes and procedures in place to ensure that our operations are in compliance with all applicable environmental regulations. We do not believe that costs of compliance with these laws and regulations will have a material adverse effect on our capital expenditures, operating results, or competitive position. In addition, we are responsible for cleanup of contamination at some of our current and former manufacturing facilities and at some third-party sites. We engage environmental consulting firms to assist us in the evaluation of environmental liabilities of our ongoing operations, historical disposal activities and closed sites in order to establish appropriate accruals in our financial statements. We determine the amount of our accruals for environmental matters by analyzing and estimating the probability of occurrence and the reasonable possibility of incurring costs in light of information currently available. The imposition of more stringent standards or requirements under environmental laws or regulations, the results of future testing and analysis undertaken by us at our operating facilities, or a determination that we are potentially responsible for the release of hazardous substances at other sites could result in expenditures in excess of amounts currently estimated to be
13

Table of Contents
required for such matters. While no material exposures have been identified to date that we are aware of, there can be no assurance that additional environmental matters will not arise in the future or that costs will not be incurred with respect to sites as to which no problem is currently known.
We are also required to comply with an increasing number of product environmental compliance regulations focused on the restriction of certain hazardous substances. For example, the electronics industry became subject to the European Union's Restrictions on Hazardous Substances ("RoHS"), Waste Electrical and Electronic Equipment ("WEEE") directives, the regulation EC 1907/2006 EU Directive REACH (Registration, Evaluation, Authorization, and restriction of Chemicals), and China RoHS entitled, Management Methods for Controlling Pollution for Electronic Information Products ("EIPs"). Similar legislation has been or may be enacted in other jurisdictions, including in the United States. Our business requires close collaboration with our customers and suppliers to mitigate risk of non-compliance. We have developed rigorous risk mitigating compliance programs designed to meet the needs of our customers as well as the regulations. These programs vary from collecting compliance data from our Flextronics owned suppliers to full laboratory testing, and we require our supply chain to comply. Non-compliance could potentially result in significant costs and/or penalties. RoHS and other similar legislation bans or restricts the use of lead, mercury and certain other specified substances in electronics products and WEEE requires EU importers and/or producers to assume responsibility for the collection, recycling and management of waste electronic products and components. In the case of WEEE, although the compliance responsibility rests primarily with the EU importers and/or producers rather than with EMS companies, OEMs may turn to EMS companies for assistance in meeting their WEEE obligations.
INTELLECTUAL PROPERTY
We own or license various United States and foreign patents relating to a variety of technologies. For certain of our proprietary processes, we rely on trade secret protection. We also have registered our corporate name and several other trademarks and service marks that we use in our business in the United States and other countries throughout the world. As of March 31, 2012 and 2011, the carrying value of our intellectual property was not material.
Although we believe that our intellectual property assets and licenses are sufficient for the operation of our business as we currently conduct it, from time to time third parties do assert patent infringement claims against us or our customers. In addition, we are increasingly providing design and engineering services to our customers and designing and making our own products. As a consequence of these activities, our customers are requiring us to take responsibility for intellectual property to a greater extent than in our manufacturing and assembly businesses. If and when third parties make assertions regarding the ownership or right to use intellectual property, we could be required to either enter into licensing arrangements or to resolve the issue through litigation. Such license rights might not be available to us on commercially acceptable terms, if at all, and any such litigation might not be resolved in our favor. Additionally, litigation could be lengthy and costly and could materially harm our financial condition regardless of the outcome. We also could be required to incur substantial costs to redesign a product or re-perform design services.
FINANCIAL INFORMATION ABOUT GEOGRAPHIC AREAS
Refer to note 17, "Segment Reporting," to our consolidated financial statements included under Item 8, "Financial Statements and Supplementary Data" for financial information about our geographic areas.
ADDITIONAL INFORMATION
Our internet address is http://www.flextronics.com. We make available through our Internet website the Company's annual reports on Form 10-K, quarterly reports on Form 10-Q, current reports on
14

Table of Contents
Form 8-K and amendments to those reports filed or furnished pursuant to Section 13(a) of the Securities Exchange Act of 1934 as soon as reasonably practicable after we electronically file such material with, or furnish it to, the Securities and Exchange Commission.
We were incorporated in the Republic of Singapore in May 1990. Our principal corporate office is located at 2 Changi South Lane, Singapore 486123. Our U.S. corporate headquarters is located at 847 Gibraltar Drive, Milpitas, CA, 95035.
ITEM 1A. RISK FACTORS
We depend on industries that continually produce technologically advanced products with short life cycles and our business would be adversely affected if our customers' products are not successful or if our customers lose market share.
We derive our revenues from customers in the following markets:
• High Reliability Solutions (HRS), which is comprised of our medical, automotive, defense and aerospace businesses;
• High Velocity Solutions (HVS), which includes our mobile/smart phone business, consumer electronics including game consoles and printers, enterprise PC business, and our ODM personal computing business which we exited in the third quarter of fiscal 2012;
• Industrial and Emerging Industries (IEI), which is comprised of our industrial, semiconductor capital equipment and clean technology businesses; and
• Integrated Network Solutions (INS), which includes our telecommunications infrastructure, data networking, connected home, and server and storage businesses.
Factors affecting any of these industries in general or our customers in particular, could adversely impact us. These factors include:
• rapid changes in technology, evolving industry standards and requirements for continuous improvement in products and services result in short product life cycles;
• demand for our customers' products may be seasonal;
• our customers may fail to successfully market their products, and our customers' products may fail to gain widespread commercial acceptance;
• our customers may experience dramatic market share shifts in demand which may cause them to exit the business; and
• there may be recessionary periods in our customers' markets, such as the recent global economic downturn.
Our customers may cancel their orders, change production quantities or locations, or delay production, and the inherent difficulties involved in responding to these demands could harm our business.
Cancellations, reductions or delays by a significant customer or by a group of customers have harmed, and may continue to harm, our results of operations by reducing the volumes of products we manufacture and deliver for these customers, by causing a delay in the repayment of our expenditures for inventory in preparation for customer orders and by lowering our asset utilization resulting in lower gross margins. Additionally, current and prospective customers continuously evaluate our capabilities against other providers as well as against the merits of manufacturing products themselves. Our business would be adversely affected if OEMs decide to perform these functions internally or transfer their business to another provider.
15
Table of Contents
As a provider of electronics design and manufacturing services and components, we must provide increasingly rapid product turnaround time for our customers. We generally do not obtain firm, long-term purchase commitments from our customers, and we often experience reduced lead times in customer orders which may be less than the lead time we require to procure necessary components and materials.
The short-term nature of our customers' commitments and the rapid changes in demand for their products reduces our ability to accurately estimate the future requirements of our customers. This makes it difficult to schedule production and maximize utilization of our manufacturing capacity. In that regard, we must make significant decisions, including determining the levels of business that we will seek and accept, setting production schedules, making component procurement commitments, and allocating personnel and other resources, based on our estimates of our customers' requirements.
On occasion, customers require rapid increases in production or require that manufacturing of their products be transitioned from one facility to another to reduce costs or achieve other objectives. These demands stress our resources and reduce our margins. We may not have sufficient capacity at any given time to meet our customers' demands, and transfers from one facility to another can result in inefficiencies and costs due to excess capacity in one facility and corresponding capacity constraints at another. Due to many of our costs and operating expenses being relatively fixed, customer order fluctuations, deferrals and transfers of demand from one facility to another, as described above, have had a material adverse effect on our operating results in the past and we may experience such effects in the future.
Our industry is extremely competitive; if we are not able to continue to provide competitive services, we may lose business.
We compete with a number of different companies, depending on the type of service we provide or the location of our operations. For example, we compete with major global EMS providers, other smaller EMS companies that have a regional or product-specific focus, and ODMs with respect to some of the services that we provide. We also compete with our current and prospective customers, who evaluate our capabilities in light of their own capabilities and cost structures. Our industry is extremely competitive, many of our competitors have achieved substantial market share, and some may have lower cost structures or greater design, manufacturing, financial or other resources than we do. We face particular competition from Asian-based competitors, including Taiwanese ODM suppliers who compete in a variety of our end markets and have a substantial share of global information technology hardware production. If we are unable to provide comparable manufacturing services and improved products at lower cost than the other companies in our market, our net sales could decline.
The majority of our sales come from a small number of customers and a decline in sales to any of these customers could adversely affect our business.
Sales to our ten largest customers represent a significant percentage of our net sales. Our ten largest customers accounted for approximately 55%, 52% and 47% of net sales in fiscal years 2012, 2011 and 2010, respectively. Our largest customers during fiscal 2012 were Hewlett-Packard (HP) and Research In Motion (RIM), which each accounted for more than 10% of net sales. No other customer accounted for more than 10% of net sales in fiscal year 2012. Our largest customer during fiscal year 2011 was Research In Motion, and our largest customer during fiscal year 2010 was Hewlett-Packard, each of which accounted for more than 10% of net sales in the respective fiscal year. No other customer accounted for more than 10% of net sales in fiscal years 2011 or 2010. Our principal customers have varied from year to year. These customers may experience dramatic declines in their market shares or competitive position, due to economic or other forces, that may cause them to reduce their purchases from us or, in some cases, result in the termination of their relationship with us. Significant reductions in sales to any of these customers, or the loss of major customers, would
16

Table of Contents
materially harm our business. If we are not able to timely replace expired, canceled or reduced contracts with new business, our revenues and profitability could be harmed.
Our components business is dependent on our ability to quickly launch world-class components products, and our investment in the development of our component capabilities, together with the start-up and integration costs necessary to achieve quick launches of world-class components products, may adversely affect our margins and profitability.
Our components business, which includes rigid and flexible printed circuit board fabrication, power supplies and display and touch design manufacturing, is part of our strategy to improve our competitive position and to grow our future margins, profitability and shareholder returns by expanding our vertical-integration capabilities. The success of our components business is dependent on our ability to design and introduce world-class components that have performance characteristics which are suitable for a broad market and that offer significant price and/or performance advantages over competitive products.
To create these world class components offerings, we must continue to make substantial investments in the development of our components capabilities, in resources such as research and development, technology licensing, test and tooling equipment, facility expansions and personnel requirements. We may not be able to achieve or maintain market acceptance for any of our components offerings in any of our current or target markets. The success of our components business will also depend upon the level of market acceptance of our customers' end products, which incorporate our components, and over which we have no control.
In addition, OEMs often require unique configurations or custom designs which must be developed and integrated in the OEM's product well before the product is launched by the OEM. Thus, there is often substantial lead time between the commencement of design efforts for a customized component and the commencement of volume shipments of the component to the OEM. As a result, we may make substantial investments in the development and customization of products for our customers, and no revenue may be generated from these efforts if our customers do not accept the customized component. Even if our customers accept the customized component, if our customers do not purchase anticipated levels of products, we may not realize any profits.
Our achievement of anticipated levels of profitability in our components business is also dependent on our ability to achieve efficiencies in our manufacturing as well as to manufacture components in commercial quantities to the performance specifications demanded by our OEM customers. As a result of these and other risks, we have been, and in the future may be, unable to achieve anticipated levels of profitability in our components business.
Our exposure to financially troubled customers or suppliers may adversely affect our financial results.
We provide manufacturing services to companies and industries that have in the past, and may in the future, experience financial difficulty. If our customers experience financial difficulty, we could have difficulty recovering amounts owed to us from these customers, or demand for our products from these customers could decline. Additionally, if our suppliers experience financial difficulty we could have difficulty sourcing supply necessary to fulfil production requirements and meet scheduled shipments. If one or more of our customers were to become insolvent or otherwise were unable to pay for the services provided by us on a timely basis, or at all, our operating results and financial condition could be adversely affected. Such adverse effects could include one or more of the following: an increase in our provision for doubtful accounts, a charge for inventory write-offs, a reduction in revenue, and an increase in our working capital requirements due to higher inventory levels and increases in days our accounts receivable are outstanding.
17

Table of Contents
We may be adversely affected by shortages of required electronic components.
From time to time, we have experienced shortages of some of the electronic components that we use. These shortages can result from strong demand for those components or from problems experienced by suppliers, such as shortages of raw materials. These unanticipated component shortages could result in curtailed production or delays in production, which may prevent us from making scheduled shipments to customers. Our inability to make scheduled shipments could cause us to experience a reduction in sales, increase in inventory levels and costs, and could adversely affect relationships with existing and prospective customers. Component shortages may also increase our cost of goods sold because we may be required to pay higher prices for components in short supply and redesign or reconfigure products to accommodate substitute components. As a result, component shortages could adversely affect our operating results. Our performance depends, in part, on our ability to incorporate changes in component costs into the selling prices for our products.
Our supply chain may also be impacted by other events outside our control, including macroeconomic events, political crises or natural or environmental occurrences. Component shortages impacted our results during the second half of fiscal year 2010, during the first quarter of fiscal year 2011 and during fiscal 2012. The supply constraints were broad based, but the impact was most evident with respect to connectors, capacitors, LCD panels and memory (both DRAM and Flash). These shortages began to abate during the second quarter of fiscal 2011, and supplies had normalized by the end of the third quarter. In addition, the March 2011 earthquake and tsunami in Japan resulted in disruptions to our supply chain, as a large number of our suppliers of semiconductors and other electronic components are located in Japan. These disruptions had a negative impact on our revenue in the first and second quarters of fiscal 2012. We also continue to evaluate the extent of the disruption to our supply chain and the impact on our business caused by the flooding in Thailand during the second half of 2011, which had a negative impact on our revenue in the third quarter of fiscal 2012, as a number of our suppliers of hard disk drives and other electronic components maintain facilities in Thailand.
Our margins and profitability may be adversely affected due to substantial investments, start-up and production ramping costs in our design services.
As part of our strategy to enhance our vertically-integrated, end-to-end service offerings, we have expanded and continue to expand our design and engineering capabilities. Providing these services can expose us to different or greater potential risks than those we face when providing our manufacturing services.
Although we enter into contracts with our design services customers, we may design and develop products for these customers prior to receiving a purchase order or other firm commitment from them. We are required to make substantial investments in the resources necessary to design and develop these products, and no revenue may be generated from these efforts if our customers do not approve the designs in a timely manner or at all. Even if our customers accept our designs, if they do not then purchase anticipated levels of products, we may not realize any profits. Our design activities often require that we purchase inventory for initial production runs before we have a purchase commitment from a customer. Even after we have a contract with a customer with respect to a product, these contracts may allow the customer to delay or cancel deliveries and may not obligate the customer to any particular volume of purchases. These contracts can generally be terminated on short notice. In addition, some of the products we design and develop must satisfy safety and regulatory standards and some must receive government certifications. If we fail to obtain these approvals or certifications on a timely basis, we would be unable to sell these products, which would harm our sales, profitability and reputation.
18

Table of Contents
Due to the increased risks associated with our design services offerings, we may not be able to achieve a high enough level of sales for this business, and the significant investments in research and development, technology licensing, test and tooling equipment, patent applications, facility expansion and recruitment that it requires, to be profitable. The initial costs of investing in the resources necessary to expand our design and engineering capabilities, and in particular to support our design services offerings, have historically adversely affected our profitability, and may continue to do so as we continue to make investments in these capabilities.
In addition, we agree to certain product price limitations and cost reduction targets in order to achieve anticipated margins and profitable operations. Inflationary and other increases in the costs of the raw materials and labor required to produce the products have occurred and may recur from time to time. Also, the production ramps for these programs are typically significant and negatively impact our margin in early stages as the manufacturing volumes are lower and result in inefficiencies and unabsorbed manufacturing overhead costs. We may not be able to reduce costs, incorporate changes in costs into the selling prices of our products, or increase operating efficiencies as we ramp production of our products, which would adversely affect our margins and our results of operations.
We may not meet regulatory quality standards applicable to our manufacturing and quality processes for medical devices, which could have an adverse effect on our business, financial condition or results of operations.
As a medical device manufacturer, we have additional compliance requirements. We are required to register with the U.S. Food and Drug Administration ("FDA") and are subject to periodic inspection by the FDA for compliance with the FDA's Quality System Regulation ("QSR") requirements, which require manufacturers of medical devices to adhere to certain regulations, including testing, quality control and documentation procedures. Compliance with applicable regulatory requirements is subject to continual review and is rigorously monitored through periodic inspections and product field monitoring by the FDA. If any FDA inspection reveals noncompliance with QSR or other FDA regulations, and the Company does not address the observation adequately to the satisfaction of the FDA, the FDA may take action against us. FDA actions may include issuing a letter of inspectional observations, issuing a warning letter, imposing fines, bringing an action against the Company and its officers, requiring a recall of the products we manufactured for our customers, refusing requests for clearance or approval of new products or withdrawal of clearance or approval previously granted, issuing an import detention on products entering the U.S. from an offshore facility, or shutting down a manufacturing facility. If any of these actions were to occur, it would harm our reputation and cause our business to suffer.
In the European Union ("EU"), we are required to maintain certain standardized certifications in order to sell our products and must undergo periodic inspections to obtain and maintain these certifications. Continued noncompliance to the EU regulations could stop the flow of products into the EU from us or from our customers. In China, the Safe Food and Drug Administration controls and regulates the manufacture and commerce of healthcare products. We must comply with the regulatory laws applicable to medical device manufactures or our ability to manufacture products in China could be impacted. In Japan, the Pharmaceutical Affairs Laws regulate the manufacture and commerce of healthcare products. These regulations also require that subcontractors manufacturing products intended for sale in Japan register with authorities and submit to regulatory audits. Other Asian countries where we operate have similar laws regarding the regulation of medical device manufacturing.
We conduct operations in a number of countries and are subject to risks of international operations.
The distances between the Americas, Asia and Europe create a number of logistical and communications challenges for us. These challenges include managing operations across multiple time zones, directing the manufacture and delivery of products across distances, coordinating procurement of
19

Table of Contents
components and raw materials and their delivery to multiple locations, and coordinating the activities and decisions of the core management team, which is based in a number of different countries. Facilities in several different locations may be involved at different stages of the production of a single product, leading to additional logistical difficulties.
Because our manufacturing operations are located in a number of countries throughout the Americas, Asia and Europe, we are subject to the risks of changes in economic and political conditions in those countries, including:
• fluctuations in the value of local currencies;
• labor unrest, difficulties in staffing and geographic labor shortages;
• longer payment cycles;
• cultural differences;
• increases in duties and taxation levied on our products;
• imposition of restrictions on currency conversion or the transfer of funds;
• limitations on imports or exports of components or assembled products, or other travel restrictions;
• expropriation of private enterprises;
• exposure to infectious disease and epidemics; and
• a potential reversal of current favorable policies encouraging foreign investment or foreign trade by our host countries.
The attractiveness of our services to U.S. customers can be affected by changes in U.S. trade policies, such as most favored nation status and trade preferences for some Asian countries. In addition, some countries in which we operate, such as Brazil, Hungary, India, Mexico, Malaysia and Poland, have experienced periods of slow or negative growth, high inflation, significant currency devaluations or limited availability of foreign exchange. Furthermore, in countries such as China and Mexico, governmental authorities exercise significant influence over many aspects of the economy, and their actions could have a significant effect on us. We could be seriously harmed by inadequate infrastructure, including lack of adequate power and water supplies, transportation, raw materials and parts in countries in which we operate. In addition, we may encounter labor disruptions and rising labor costs, in particular within the lower-cost regions in which we operate. Any increase in labor costs that we are unable to recover in our pricing to our customers could adversely impact our operating results.
Operations in foreign countries also present risks associated with currency exchange and convertibility, inflation and repatriation of earnings. In some countries, economic and monetary conditions and other factors could affect our ability to convert our cash distributions to U.S. dollars or other freely convertible currencies, or to move funds from our accounts in these countries. Furthermore, the central bank of any of these countries may have the authority to suspend, restrict or otherwise impose conditions on foreign exchange transactions or to approve distributions to foreign investors.
Another significant legal risk resulting from our international operations is compliance with the U.S. Foreign Corrupt Practices Act or similar local laws of the countries in which we do business, including the UK Anti-Bribery Act, which prohibits covered companies from making payments to foreign government officials to assist in obtaining or retaining business. Our Code of Business Conduct prohibits corrupt payments on a global basis and precludes us from offering or giving anything of value to a government official for the purpose of obtaining or retaining business, to win a business advantage
20
Table of Contents
or to improperly influence a decision regarding Flextronics. Nevertheless, there can be no assurance that all of our employees and agents will refrain from taking actions in violation of this and our related anti-corruption policies and procedures. Any such violation could have a material adverse effect on our business.
We are subject to the risk of increased income taxes.
We have structured our operations in a manner designed to maximize income in countries where:
• tax incentives have been extended to encourage foreign investment; or
• income tax rates are low.
A number of countries in which we are located allow for tax holidays or provide other tax incentives to attract and retain business. Our taxes could increase if certain tax holidays or incentives are not renewed upon expiration, or if tax rates applicable to us in such jurisdictions are otherwise increased. For example, on March 16, 2007, the Chinese government passed a new unified enterprise income tax law which became effective on January 1, 2008. Among other things, the new law canceled many income tax incentives previously applicable to our subsidiaries in China. Under the new law, the tax rates applicable to the operations of most of our subsidiaries in China have been increased to 25%. The new law provided a transition rule which increased the tax rate to 25% over a 5-year period, which ends in 2012. The new law also increased the standard withholding rate on earnings distributions to between 5% and 10% depending on the residence of the shareholder. The ultimate effect of these and other changes in Chinese tax laws on our overall tax rate will be affected by, among other things, our China income, the manner in which China interprets, implements and applies the new tax provisions, and our ability to qualify for any exceptions or new incentives. Similarly, we recently renewed a Malaysian tax holiday that expired on January 31, 2012 for another ten year period. Our continued ability to qualify for specific tax holiday extensions will depend on, among other things, our anticipated investment and expansion in these countries and the manner in which the local governments interpret the requirements for extensions or new incentives.
In addition, the Company and its subsidiaries are regularly subject to tax return audits and examinations by various taxing jurisdictions around the world. In determining the adequacy of our provision for income taxes, we regularly assess the likelihood of adverse outcomes resulting from tax examinations. While it is often difficult to predict the final outcome or the timing of the resolution of a tax examination, we believe that our reserves for uncertain tax benefits reflect the outcome of tax positions that are more likely than not to occur. However, we cannot assure you that the final determination of any tax examinations will not be materially different than that which is reflected in our income tax provisions and accruals. Should additional taxes be assessed as a result of a current or future examination, there could be a material adverse effect on our tax provision, operating results, financial position and cash flows in the period or periods for which that determination is made.
If our products or components contain defects, demand for our services may decline and we may be exposed to product liability and product warranty liability.
Defects in the products we manufacture or design, whether caused by a design, engineering, manufacturing or component failure or deficiencies in our manufacturing processes, could result in product or component failures, which may damage our business reputation and expose us to product liability or product warranty claims.
Product liability claims may include liability for personal injury or property damage. Product warranty claims may include liability to pay for the recall, repair or replacement of a product or component. Although we generally allocate liability for these claims in our contracts with our customers, increasingly we are unsuccessful in allocating such liability, and even where we have
21

Table of Contents
allocated liability to our customers, our customers may not have the resources to satisfy claims for costs or liabilities arising from a defective product or component for which they have assumed responsibility.
If we design, engineer or manufacture a product or component that is found to cause any personal injury or property damage or is otherwise found to be defective, we could spend a significant amount of money to resolve the claim. In addition, product liability and product recall insurance coverage are expensive and may not be available with respect to all of our services offerings on acceptable terms, in sufficient amounts, or at all. A successful product liability or product warranty claim in excess of our insurance coverage or any material claim for which insurance coverage is denied, limited or is not available could have a material adverse effect on our business, results of operations and financial condition.
If we do not effectively manage changes in our operations, our business may be harmed; we have taken substantial restructuring charges in the past and we may need to take material restructuring charges in the future.
In recent years, we have experienced growth in our business through a combination of internal growth and acquisitions. However, our business also has been negatively impacted by the recent adverse global economic conditions. The expansion of our business, as well as business contractions and other changes in our customers' requirements, have in the past, and may in the future, require that we adjust our business and cost structures, including by incurring restructuring charges. Restructuring activities involve reductions in our workforce at some locations and closure of certain facilities. All of these changes have in the past placed, and may in the future place, considerable strain on our management control systems and resources, including decision support, accounting management, information systems and facilities. If we do not properly manage our financial and management controls, reporting systems and procedures to manage our employees, our business could be harmed.
In recent years, we have undertaken initiatives to restructure our business operations through a series of restructuring activities, which were intended to realign our global capacity and infrastructure with demand by our OEM customers and thereby improve our operational efficiency. These activities included reducing excess workforce and capacity, transitioning manufacturing to lower-cost locations and eliminating redundant facilities, and consolidating and eliminating certain administrative facilities.
While we incur severance, asset impairment charges and other facilities charges as a result of changes in our customer mix on an ongoing basis, such individual actions were not considered material to be separately disclosed as restructuring charges in fiscal 2012 and 2011, and are included in either cost of sales or selling, general and administrative expenses, as appropriate. We recognized restructuring charges of approximately $107.5 million in fiscal 2010. We may be required to take additional charges in the future to align our operations and cost structures with global economic conditions, market demands, cost competitiveness, and our geographic footprint as it relates to our customers' production requirements. We may consolidate certain manufacturing facilities or transfer certain of our operations to lower cost geographies. If we are required to take additional restructuring charges in the future, our operating results, financial condition, and cash flows could be adversely impacted. Additionally, there are other potential risks associated with our restructurings that could adversely affect us, such as delays encountered with the finalization and implementation of the restructuring activities, work stoppages, and the failure to achieve targeted cost savings.
The success of certain of our activities depends on our ability to protect our intellectual property rights; intellectual property infringement claims against our customers or us could harm our business.
We retain certain intellectual property rights to some of the technologies that we develop as part of our engineering, design and manufacturing services and components offerings. The measures we have taken to prevent unauthorized use of our technology may not be successful. If we are unable to
22
Table of Contents
protect our intellectual property rights, this could reduce or eliminate the competitive advantages of our proprietary technology, which would harm our business.
Our engineering, design and manufacturing services and components offerings involve the creation and use of intellectual property rights, which subject us to the risk of claims of intellectual property infringement from third parties, as well as claims arising from the allocation of intellectual property rights among us and our customers. In addition, our customers are increasingly requiring us to indemnify them against the risk of intellectual property infringement. If any claims are brought against us or our customers for such infringement, whether or not these have merit, we could be required to expend significant resources in defense of such claims. In the event of such an infringement claim, we may be required to spend a significant amount of money to develop non-infringing alternatives or obtain licenses. We may not be successful in developing such alternatives or obtaining such licenses on reasonable terms or at all.
Fluctuations in foreign currency exchange rates could increase our operating costs.
Our manufacturing operations and industrial parks are located in lower cost regions of the world, such as Asia, Eastern Europe and Mexico; however, most of our purchase and sale transactions are denominated in United States dollars, Japanese yen or Euros. As a result, we are exposed to fluctuations in the functional currencies of our fixed cost overhead or our supply base relative to the currencies in which we conduct transactions.
Currency exchange rates fluctuate on a daily basis as a result of a number of factors, including changes in a country's political and economic policies. Volatility in the functional and non-functional currencies of our entities and the United States dollar could seriously harm our business, operating results and financial condition. The primary impact of currency exchange fluctuations is on the cash, receivables, and payables of our operating entities. As part of our currency hedging strategy, we use financial instruments, primarily forward purchase and swap contracts, to hedge our United States dollar and other currency commitments in order to reduce the short-term impact of foreign currency fluctuations on current assets and liabilities. If our hedging activities are not successful or if we change or reduce these hedging activities in the future, we may experience significant unexpected expenses from fluctuations in exchange rates.
We are also exposed to risks related to the valuation of the Chinese currency relative to other foreign currencies. The Chinese currency is the renminbi ("RMB"). A significant increase in the value of the RMB could adversely affect our financial results and cash flows by increasing both our manufacturing costs and the costs of our local supply base.
We depend on our executive officers and skilled management personnel.
Our success depends to a large extent upon the continued services of our executive officers. Generally our employees are not bound by employment or non-competition agreements, and we cannot assure you that we will retain our executive officers and other key employees. We could be seriously harmed by the loss of any of our executive officers or other key employees. We will need to recruit and retain skilled management personnel, and if we are not able to do so, our business could be harmed. In addition, in connection with expanding our design services offerings, we must attract and retain experienced design engineers. There is substantial competition in our industry for highly skilled employees. Our failure to recruit and retain experienced design engineers could limit the growth of our design services offerings, which could adversely affect our business.
Our failure to comply with environmental laws could adversely affect our business.
We are subject to various federal, state, local and foreign environmental laws and regulations, including regulations governing the use, storage, discharge and disposal of hazardous substances used in
23

Table of Contents
our manufacturing processes. We are also subject to laws and regulations governing the recyclability of products, the materials that may be included in products, and our obligations to dispose of these products after end users have finished with them. Additionally, we may be exposed to liability to our customers relating to the materials that may be included in the components that we procure for our customers' products. Any violation or alleged violation by us of environmental laws could subject us to significant costs, fines or other penalties.
We are also required to comply with an increasing number of global and local product environmental compliance regulations focused on the restriction of certain hazardous substances. We are subject to the European Union ("EU") directives, including the Restrictions on Hazardous Substances Directive ("RoHS"), the Waste Electrical and Electronic Equipment Directive ("WEEE") as well as the EU's Registration, Evaluation, Authorization, and Restriction of Chemicals ("REACH") regulation. Also of note is China's Management Methods for Controlling Pollution Caused by Electronic Information Products regulation, commonly referred to as "China RoHS", which restricts the importation into and production within China of electrical equipment containing certain hazardous materials. Similar legislation has been or may be enacted in other jurisdictions, including in the United States. RoHS and other similar legislation bans or restricts the use of lead, mercury and certain other specified substances in electronics products and WEEE requires EU importers and/or producers to assume responsibility for the collection, recycling and management of waste electronic products and components. We have developed rigorous risk mitigating compliance programs designed to meet the needs of our customers as well as applicable regulations. These programs may include collecting compliance data from our suppliers, full laboratory testing and public reporting of other environmental metrics such as carbon emissions, electronic waste and water, and we also require our supply chain to comply. Non-compliance could potentially result in significant costs and/or penalties. In the case of WEEE, the compliance responsibility rests primarily with the EU importers and/or producers rather than with EMS companies. However, OEMs may turn to EMS companies for assistance in meeting their obligations under WEEE.
In addition, we are responsible for cleanup of contamination at some of our current and former manufacturing facilities and at some third party sites. If more stringent compliance or cleanup standards under environmental laws or regulations are imposed, or the results of future testing and analyses at our current or former operating facilities indicate that we are responsible for the release of hazardous substances into the air, ground and/or water, we may be subject to additional liability. Additional environmental matters may arise in the future at sites where no problem is currently known or at sites that we may acquire in the future. Our failure to comply with environmental laws and regulations or adequately address contaminated sites could limit our ability to expand our facilities or could require us to incur significant expenses, which would harm our business.
We may encounter difficulties with acquisitions, which could harm our business.
We have completed numerous acquisitions of businesses and we may acquire additional businesses in the future. Any future acquisitions may require additional equity financing, which could be dilutive to our existing shareholders, or additional debt financing, which could increase our leverage and potentially affect our credit ratings. Any downgrades in our credit ratings associated with an acquisition could adversely affect our ability to borrow by resulting in more restrictive borrowing terms. As a result of the foregoing, we also may not be able to complete acquisitions or strategic customer transactions in the future to the same extent as in the past, or at all.
To integrate acquired businesses, we must implement our management information systems, operating systems and internal controls, and assimilate and manage the personnel of the acquired operations. The difficulties of this integration may be further complicated by geographic distances. The integration of acquired businesses may not be successful and could result in disruption to other parts of
24

Table of Contents
our business. In addition, the integration of acquired businesses may require that we incur significant restructuring charges.
In addition, acquisitions involve numerous risks and challenges, including:
• diversion of management's attention from the normal operation of our business;
• potential loss of key employees and customers of the acquired companies;
• difficulties managing and integrating operations in geographically dispersed locations;
• the potential for deficiencies in internal controls at acquired companies;
• increases in our expenses and working capital requirements, which reduce our return on invested capital;
• lack of experience operating in the geographic market or industry sector of the acquired business; and
• exposure to unanticipated liabilities of acquired companies.
These and other factors have harmed, and in the future could harm, our ability to achieve anticipated levels of profitability at acquired operations or realize other anticipated benefits of an acquisition, and could adversely affect our business and operating results.
Our strategic relationships with major customers create risks.
In the past, we have completed numerous strategic transactions with OEM customers. Under these arrangements, we generally acquire inventory, equipment and other assets from the OEM, and lease or acquire their manufacturing facilities, while simultaneously entering into multi-year supply agreements for the production of their products. We may pursue these OEM divestiture transactions in the future. These arrangements entered into with divesting OEMs typically involve many risks, including the following:
• we may need to pay a purchase price to the divesting OEMs that exceed the value we ultimately may realize from the future business of the OEM;
• the integration of the acquired assets and facilities into our business may be time-consuming and costly, including the incurrence of restructuring charges;
• we, rather than the divesting OEM, bear the risk of excess capacity at the facility;
• we may not achieve anticipated cost reductions and efficiencies at the facility;
• we may be unable to meet the expectations of the OEM as to volume, product quality, timeliness and cost reductions;
• our supply agreements with the OEMs generally do not require any minimum volumes of purchase by the OEMs, and the actual volume of purchases may be less than anticipated; and
• if demand for the OEMs' products declines, the OEM may reduce its volume of purchases, and we may not be able to sufficiently reduce the expenses of operating the facility or use the facility to provide services to other OEMs.
As a result of these and other risks, we have been, and in the future may be, unable to achieve anticipated levels of profitability under these arrangements. In addition, these strategic arrangements have not, and in the future may not, result in any material revenues or contribute positively to our earnings per share.
25

Table of Contents
Our business and operations could be adversely impacted by climate change initiatives.
Concern over climate change has led to international legislative and regulatory initiatives directed at limiting carbon dioxide and other greenhouse gas emissions. Proposed and existing efforts to address climate change by reducing greenhouse gas emissions could directly or indirectly affect our costs of energy, materials, manufacturing, distribution, packaging and other operating costs, which could impact our business and financial results.
Our operating results may fluctuate significantly due to seasonal demand.
Two of our significant end markets are the mobile devices market and the consumer devices market. These markets exhibit particular strength toward the end of the calendar year in connection with the holiday season. As a result, we have historically experienced stronger revenues in our third fiscal quarter as compared to our other fiscal quarters. Economic or other factors leading to diminished orders in the end of the calendar year could harm our business.
Our debt level may create limitations
As of March 31, 2012, our total debt was approximately $2.2 billion. This level of indebtedness could limit our flexibility as a result of debt service requirements and restrictive covenants, and may limit our ability to access additional capital or execute our business strategy.
Weak global economic conditions and instability in financial markets may adversely affect our business, results of operations, financial condition and access to capital markets.
Our revenue and gross margin depend significantly on general economic conditions and the demand for products in the markets in which our customers compete. Recent adverse worldwide economic conditions, including the European sovereign debt crisis, have created challenging conditions in the electronics industry. These conditions have resulted in reduced consumer and business confidence and spending in many countries, a tightening in the credit markets, a low level of liquidity in many financial markets and high volatility in credit, fixed income and equity markets. A continuation or worsening of the European sovereign debt crisis will likely have a negative effect on certain of our European customers and suppliers, which could harm our business. In addition, longer term disruptions in the capital and credit markets could adversely affect our access to liquidity needed for our business. If financial institutions that have extended credit commitments to us are adversely affected by the conditions of the U.S. and international capital markets, they may become unable to fund borrowings under their credit commitments to us, which could have an adverse impact on our financial condition and our ability to borrow additional funds, if needed, for working capital, capital expenditures, acquisitions, research and development and other corporate purposes.
The market price of our ordinary shares is volatile.
The stock market in recent years has experienced significant price and volume fluctuations that have affected the market prices of companies, including technology companies. These fluctuations have often been unrelated to or disproportionately impacted by the operating performance of these companies. The market for our ordinary shares has been and may in the future be subject to similar volatility. Factors such as fluctuations in our operating results, announcements of technological innovations or events affecting other companies in the electronics industry, currency fluctuations, general market fluctuations, and macro economic conditions may cause the market price of our ordinary shares to decline.
26

Table of Contents
If our security systems and governance policies are breached, we may incur significant legal and financial exposure.
We have implemented security systems and governance policies with the intent of maintaining the physical security of our facilities and protecting our customers' and our suppliers' confidential information. Despite such efforts, we are subject to breach of these security systems and governance policies which may result in unauthorized access to our facilities and/or unauthorized use of the information we are trying to protect. If unauthorized parties gain physical access to one of our facilities or electronic access to our information systems or such information is used in an unauthorized manner, misdirected, lost or stolen during transmission or transport, any theft or misuse of such information could result in, among other things, unfavorable publicity, governmental inquiry and oversight, difficulty in marketing our services, allegations by our customers that we have not performed our contractual obligations, litigation by affected parties and possible financial obligations for damages related to the theft or misuse of such information, any of which could have a material adverse effect on our profitability and cash flow.
ITEM 1B. UNRESOLVED STAFF COMMENTS
None.
ITEM 2. PROPERTIES
Our facilities consist of a global network of industrial parks, regional manufacturing operations, and design, engineering and product introduction centers, providing over 26.7 million square feet of productive capacity as of March 31, 2012. We own facilities with approximately 9.0 million square feet in Asia, 4.5 million square feet in the Americas and 2.7 million square feet in Europe. We lease facilities with approximately 5.7 million square feet in Asia, 2.8 million square feet in the Americas and 2.0 million square feet in Europe.
Our facilities include large industrial parks, ranging in size from approximately 300,000 to 6.8 million square feet in Brazil, China, Hungary, Israel, Mexico, Romania and Poland. We also have regional manufacturing operations, generally ranging in size from under 100,000 to approximately 1.0 million square feet in Austria, Brazil, Canada, China, Denmark, Germany, Hungary, India, Indonesia, Ireland, Israel, Italy, Japan, Malaysia, Mexico, Poland, Romania, Singapore, Slovakia, Sweden, Ukraine and the United States. We also have smaller design and engineering centers and product introduction centers at a number of locations in the world's major electronics markets.
Our facilities are well maintained and suitable for the operations conducted. The productive capacity of our plants is adequate for current needs.
ITEM 3. LEGAL PROCEEDINGS
From time to time, we are subject to legal proceedings, claims, and litigation arising in the ordinary course of business. We defend ourselves vigorously against any such claims. Although the outcome of these matters is currently not determinable, management expects that any losses that are probable or reasonably possible of being incurred as a result of these matters, which are in excess of amounts already accrued in its consolidated balance sheet would not be material to the financial statements as a whole.
ITEM 4. MINE SAFETY DISCLOSURES
Not applicable
27

Table of Contents
PART II
ITEM 5. MARKET FOR REGISTRANT'S COMMON EQUITY, RELATED SHAREHOLDER MATTERS AND ISSUER PURCHASES OF EQUITY SECURITIES
PRICE RANGE OF ORDINARY SHARES
Our ordinary shares are quoted on the NASDAQ Global Select Market under the symbol "FLEX." The following table sets forth the high and low per share sales prices for our ordinary shares since the beginning of fiscal year 2011 as reported on the NASDAQ Global Select Market.
As of May 16, 2012 there were 3,646 holders of record of our ordinary shares and the closing sales price of our ordinary shares as reported on the NASDAQ Global Select Market was $6.62 per share.
DIVIDENDS
Since inception, we have not declared or paid any cash dividends on our ordinary shares. We presently do not have plans to pay any dividends in the near future.
28
High Low Fiscal Year Ended March 31, 2012
Fourth Quarter $ 7.42 $ 5.75 Third Quarter 6.75 5.42 Second Quarter 7.01 5.10 First Quarter 7.51 6.27
Fiscal Year Ended March 31, 2011 Fourth Quarter $ 8.44 $ 7.17 Third Quarter 7.98 5.97 Second Quarter 6.71 4.93 First Quarter 8.25 5.52

Table of Contents
STOCK PRICE PERFORMANCE GRAPH
The following stock price performance graph and accompanying information is not deemed to be "soliciting material" or to be "filed" with the SEC or subject to Regulation 14A under the Securities Exchange Act of 1934 or to the liabilities of Section 18 of the Securities Exchange Act of 1934, and will not be deemed to be incorporated by reference into any filing under the Securities Act of 1933 or the Securities Exchange Act of 1934, regardless of any general incorporation language in any such filing.
The graph below compares the cumulative total shareholder return on our ordinary shares, the Standard & Poor's 500 Stock Index and a peer group comprised of Benchmark Electronics, Inc., Celestica, Inc., Jabil Circuit, Inc., and Sanmina-SCI Corporation.
The graph below assumes that $100 was invested in our ordinary shares, in the Standard & Poor's 500 Stock Index and in the peer group described above on March 31, 2007 and reflects the annual return through March 31, 2012, assuming dividend reinvestment.
The comparisons in the graph below are based on historical data and are not indicative of, or intended to forecast, the possible future performances of our ordinary shares.
COMPARISON OF 5 YEAR CUMULATIVE TOTAL RETURN*
Among Flextronics International Ltd., the S&P 500 Index and Peer Group
*Five year cumulative total return: $100 invested on March 30, 2007 in stock or S&P 500 index, including re-investment of dividends. Source: Flextronics and Factset Research Systems
29
3/07 3/08 3/09 3/10 3/11 3/12 Flextronics International Ltd. 100.00 85.83 26.42 71.66 68.28 66.00 S&P 500 100.00 94.92 58.77 88.02 101.79 110.48 Peer Group 100.00 60.23 31.63 96.46 101.36 110.10
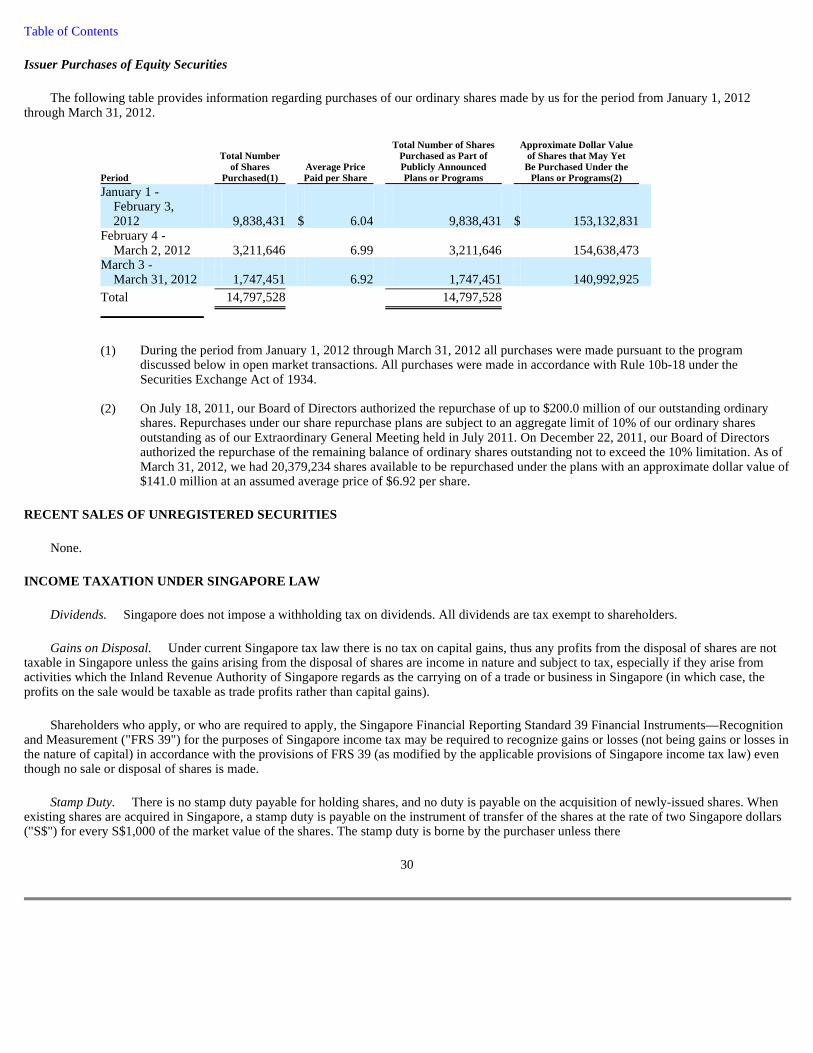
Table of Contents
Issuer Purchases of Equity Securities
The following table provides information regarding purchases of our ordinary shares made by us for the period from January 1, 2012 through March 31, 2012.
RECENT SALES OF UNREGISTERED SECURITIES
None.
INCOME TAXATION UNDER SINGAPORE LAW
Dividends. Singapore does not impose a withholding tax on dividends. All dividends are tax exempt to shareholders.
Gains on Disposal. Under current Singapore tax law there is no tax on capital gains, thus any profits from the disposal of shares are not taxable in Singapore unless the gains arising from the disposal of shares are income in nature and subject to tax, especially if they arise from activities which the Inland Revenue Authority of Singapore regards as the carrying on of a trade or business in Singapore (in which case, the profits on the sale would be taxable as trade profits rather than capital gains).
Shareholders who apply, or who are required to apply, the Singapore Financial Reporting Standard 39 Financial Instruments—Recognition and Measurement ("FRS 39") for the purposes of Singapore income tax may be required to recognize gains or losses (not being gains or losses in the nature of capital) in accordance with the provisions of FRS 39 (as modified by the applicable provisions of Singapore income tax law) even though no sale or disposal of shares is made.
Stamp Duty. There is no stamp duty payable for holding shares, and no duty is payable on the acquisition of newly-issued shares. When existing shares are acquired in Singapore, a stamp duty is payable on the instrument of transfer of the shares at the rate of two Singapore dollars ("S$") for every S$1,000 of the market value of the shares. The stamp duty is borne by the purchaser unless there
30
Period
Total Number of Shares
Purchased(1) Average Price Paid per Share
Total Number of Shares Purchased as Part of Publicly Announced Plans or Programs
Approximate Dollar Value of Shares that May Yet Be Purchased Under the
Plans or Programs(2) January 1 -
February 3, 2012 9,838,431 $ 6.04 9,838,431 $ 153,132,831
February 4 - March 2, 2012 3,211,646 6.99 3,211,646 154,638,473
March 3 - March 31, 2012 1,747,451 6.92 1,747,451 140,992,925
Total 14,797,528 14,797,528
(1) During the period from January 1, 2012 through March 31, 2012 all purchases were made pursuant to the program discussed below in open market transactions. All purchases were made in accordance with Rule 10b-18 under the Securities Exchange Act of 1934.
(2) On July 18, 2011, our Board of Directors authorized the repurchase of up to $200.0 million of our outstanding ordinary shares. Repurchases under our share repurchase plans are subject to an aggregate limit of 10% of our ordinary shares outstanding as of our Extraordinary General Meeting held in July 2011. On December 22, 2011, our Board of Directors authorized the repurchase of the remaining balance of ordinary shares outstanding not to exceed the 10% limitation. As of March 31, 2012, we had 20,379,234 shares available to be repurchased under the plans with an approximate dollar value of $141.0 million at an assumed average price of $6.92 per share.

Table of Contents
is an agreement to the contrary. If the instrument of transfer is executed outside of Singapore, the stamp duty must be paid only if the instrument of transfer is received in Singapore.
Estate Taxation. The estate duty was abolished for deaths occurring on or after February 15, 2008. For deaths prior to February 15, 2008 the following rules apply:
If an individual who is not domiciled in Singapore dies on or after January 1, 2002, no estate tax is payable in Singapore on any of our shares held by the individual.
If property passing upon the death of an individual domiciled in Singapore includes our shares, Singapore estate duty is payable to the extent that the value of the shares aggregated with any other assets subject to Singapore estate duty exceeds S$600,000. Unless other exemptions apply to the other assets, for example, the separate exemption limit for residential properties, any excess beyond S$600,000 will be taxed at 5% on the first S$12,000,000 of the individual's chargeable assets and thereafter at 10%.
An individual shareholder who is a U.S. citizen or resident (for U.S. estate tax purposes) will have the value of the shares included in the individual's gross estate for U.S. estate tax purposes. An individual shareholder generally will be entitled to a tax credit against the shareholder's U.S. estate tax to the extent the individual shareholder actually pays Singapore estate tax on the value of the shares; however, such tax credit is generally limited to the percentage of the U.S. estate tax attributable to the inclusion of the value of the shares included in the shareholder's gross estate for U.S. estate tax purposes, adjusted further by a pro rata apportionment of available exemptions. Individuals who are domiciled in Singapore should consult their own tax advisors regarding the Singapore estate tax consequences of their investment.
Tax Treaties Regarding Withholding. There is no reciprocal income tax treaty between the U.S. and Singapore regarding withholding taxes on dividends and capital gains.
31

Table of Contents
ITEM 6. SELECTED FINANCIAL DATA
These historical results are not necessarily indicative of the results to be expected in the future. The following table is qualified by reference to and should be read in conjunction with Item 7, "Management's Discussion and Analysis of Financial Condition and Results of Operations" and Item 8, "Financial Statements and Supplementary Data."
Fiscal Year Ended March 31, 2012(8)(9) 2011(8) 2010(8) 2009(8) 2008(2) (In thousands, except per share amounts) CONSOLIDATED
STATEMENT OF OPERATIONS DATA(1):
Net sales $ 29,387,656 $ 28,489,018 $ 24,009,784 $ 30,844,316 $ 27,445,187 Cost of sales 27,870,315 26,903,049 22,705,774 29,423,379 25,882,498 Restructuring charges(3) — — 92,458 155,134 405,151
Gross profit 1,517,341 1,585,969 1,211,552 1,265,803 1,157,538 Selling, general and
administrative expenses 880,636 804,890 755,064 953,622 779,402
Intangible amortization(4) 55,896 70,913 89,615 135,872 112,317
Goodwill impairment charge(5) — — — 5,949,977 —
Restructuring charges(3) — — 15,070 24,651 38,743 Other charges (income),
net(6) (19,963 ) 6,267 206,895 88,890 44,365 Interest and other
expense, net 36,011 75,378 155,654 230,410 141,735
Income (loss) from continuing operations before income taxes 564,761 628,521 (10,746 ) (6,117,619 ) 40,976
Provision for (benefit from) income taxes(7) 54,116 22,176 (35,748 ) 5,550 704,778
Income (loss) from continuing operations 510,645 606,345 25,002 (6,123,169 ) (663,802 )
Loss from discontinued operations, net of tax (21,880 ) (10,126 ) (6,408 ) (12,349 ) (17,581 )
Net income (loss) $ 488,765 $ 596,219 $ 18,594 $ (6,135,518 ) $ (681,383 )
Diluted earnings (loss) per share: Continuing operations $ 0.70 $ 0.77 $ 0.03 $ (7.46 ) $ (0.92 )
Discontinued operations $ (0.03 ) $ (0.01 ) $ (0.01 ) $ (0.02 ) $ (0.02 )
Total $ 0.67 $ 0.75 $ 0.02 $ (7.47 ) $ (0.95 )
As of March 31, 2012 2011 2010 2009 2008(2) (In thousands) CONSOLIDATED
BALANCE SHEET DATA(1):
Working capital(9) $ 2,246,365 $ 2,225,268 $ 1,642,790 $ 1,526,235 $ 2,911,922 Total assets(9) 11,033,804 11,633,152 10,642,552 11,316,940 19,523,008 Total long-term debt and
capital lease obligations, excluding current portion 2,157,798 2,199,195 1,990,258 2,733,680 3,310,042

32
Shareholders' equity(9) 2,283,979 2,294,696 1,984,567 1,861,168 8,240,832
(1) On March 2, 2012, the Company entered into a definitive agreement to sell certain assets of its Vista Point Technologies camera module business. This transaction is expected to close in the first quarter of fiscal 2013 subject to certain closing conditions. The camera modules business represents a separate asset group and the divestiture qualifies as discontinued operations, and accordingly, the Company has
Table of Contents
33
reported the results of operations and financial position of this business in discontinued operations within the statements of operations and the balance sheets for all periods presented.
(2) On October 1, 2007, the Company completed its acquisition of 100% of the outstanding common stock of Solectron, a provider of value-added electronics manufacturing and supply chain services to OEMs. The results of Solectron's operations were included in the Company's consolidated financial results beginning on the acquisition date.
(3) Restructuring charges incurred during the 2010 and 2009 fiscal years were primarily intended to rationalize the Company's global manufacturing capacity and infrastructure in response to weakened macroeconomic conditions and decline in demand from our OEM customers. Restructuring charges incurred during the 2008 fiscal year were primarily in connection with the acquisition and integration of Solectron.
(4) The Company recognized a charge of $30.0 million during fiscal year 2008 for the write-off of certain intangible asset licenses due to technological obsolescence.
(5) The Company recognized a charge to impair goodwill as a result of a significant decline in its share value driven by weakened macroeconomic conditions that contributed to a decrease in market multiples and estimated discounted cash flows.
(6) The net other income in the fiscal year 2012, relates to the sale of certain international entities.
During fiscal year 2011, the Company recognized a $13.2 million loss associated with the early redemption of the 6.25% Senior Subordinated Notes and an $11.7 million loss in connection with the divestiture of certain international entities. Additionally, the Company recognized a gain of $18.6 million associated with a sale of an equity investment that was previously fully impaired.
The Company recognized charges of $199.4 million, $111.5 million and $61.1 million in fiscal years 2010, 2009 and 2008, respectively, for the loss on disposition, other-than-temporary impairment and other related charges on its investments in, and notes receivable from, certain non-publicly traded companies. In fiscal year 2009, the Company recognized a net gain of $22.3 million upon the partial extinguishment of debt.
(7) The Company recognized non-cash tax expense of $661.3 million during fiscal year 2008, as we determined the recoverability of certain deferred tax assets was no longer more likely than not.
(8) During the fourth quarter of fiscal 2012, the Company identified certain accounting errors in the statutory-to-U.S. GAAP adjustments at one of its foreign sites that originated in prior annual periods. Management conducted additional procedures and concluded that these errors were isolated to that location. These errors, which primarily understated cost of sales, totaled $10.4 million, $8.0 million and $6.5 million for the fiscal years ended March 31, 2011, 2010 and 2009 respectively, and were corrected by the Company as an out-of-period adjustment in the fourth quarter of fiscal 2012. Management believes the impact of this item, to the fiscal year ended March 31, 2012 and to prior fiscal years presented was not material. As a result of recording these adjustments in the fourth quarter of fiscal 2012, net income for the year ended March 31, 2012 was reduced by $24.9 million ($0.03 per share).
(9) One of the Company's customers in the concentrated solar photovoltaic market is experiencing significant financial and liquidity difficulties and as a result, the Company incurred $32.0 million of charges related to this customer. Of this charge, the Company classified $4.0 million in cost of sales related to the write-down of inventory, and $28.0 million as selling, general and administrative expenses for provisions for doubtful accounts as of March 31, 2012.

Table of Contents
ITEM 7. MANAGEMENT'S DISCUSSION AND ANALYSIS OF FINANCIAL CONDITION AND RESULTS OF OPERATIONS
This report on Form 10-K contains forward-looking statements within the meaning of Section 21E of the Securities Exchange Act of 1934, as amended, and Section 27A of the Securities Act of 1933, as amended. The words "expects," "anticipates," "believes," "intends," "plans" and similar expressions identify forward-looking statements. In addition, any statements which refer to expectations, projections or other characterizations of future events or circumstances are forward-looking statements. We undertake no obligation to publicly disclose any revisions to these forward-looking statements to reflect events or circumstances occurring subsequent to filing this Form 10-K with the Securities and Exchange Commission. These forward-looking statements are subject to risks and uncertainties, including, without limitation, those discussed in this section and in Item 1A, "Risk Factors." In addition, new risks emerge from time to time and it is not possible for management to predict all such risk factors or to assess the impact of such risk factors on our business. Accordingly, our future results may differ materially from historical results or from those discussed or implied by these forward-looking statements. Given these risks and uncertainties, the reader should not place undue reliance on these forward-looking statements.
OVERVIEW
We are a leading global provider of vertically-integrated advanced design, manufacturing and services to original equipment manufacturers ("OEMs") of a broad range of electronics products in the following markets: High Reliability Solutions (HRS), which is comprised of our medical, automotive, and defense and aerospace businesses; High Velocity Solutions (HVS), which includes our mobile/smart phone business, consumer electronics, including game consoles and printers, enterprise PC business and our ODM personal computing business which we exited in the third quarter of fiscal 2012; Industrial and Emerging Industries (IEI), which is comprised of our industrial, semiconductor capital equipment and clean technology businesses; and Integrated Network Solutions (INS), which includes our telecommunications infrastructure, data networking, connected home, and server and storage businesses.
Historically, our industry experienced significant change and growth as an increasing number of companies elected to outsource some or all of their design and manufacturing requirements. We have seen an increase in the penetration of the global OEM manufacturing requirements since the 2001 - 2002 technology downturn as more and more OEMs pursued the benefits of outsourcing rather than internal manufacturing. In the second half of fiscal 2009, we experienced dramatically deteriorating macroeconomic conditions and demand for our customers' products slowed in all of the industries we serve. This global economic crisis, and related decline in demand for our customers' products, put pressure on certain of our OEM customers' cost structures and caused them to reduce their manufacturing and supply chain outsourcing requirements. Beginning in the second half of fiscal year 2010, we began seeing some positive signs that demand for our OEM customers' end products was improving, and this trend continued through the end of our 2012 fiscal year.
We use a portfolio management approach to manage our extensive service offering. As our OEM customers change in the way they go to market, we reorganize and rebalance our business portfolio in order to align with our customers and to optimize our operating results. As part of our portfolio management strategy, we expect to decrease the percentage of our revenue from our HVS businesses, which has lower margins, and increase the percentage of our revenue from our more complex and higher margin non-HVS businesses. Our target is to achieve a mix whereby approximately 70% of our revenue is derived from our non-HVS businesses and 30% of our revenue is derived from our HVS businesses. We believe this is an optimal portfolio position for the Company which will result in expanded margins, though resulting in lower overall revenue in the near term as we rebalance. We continue to experience increased revenue in our non-HVS markets through new business opportunities
34

Table of Contents
and have accelerated the reduction in our HVS market, a trend that we expect to continue in to fiscal 2013. We also expect to fully reposition assets and capacity in the HVS business in our non-HVS businesses. The objective of our operating model is to allow us to redeploy and reposition our assets and resources across all the markets we serve. In May 2011, due to negative operating margins and performance metrics on certain of our larger customer contracts, we announced that we would be phasing out of our ODM personal computing (PC) business. By the end of fiscal year 2012 we ceased all ODM PC manufacturing operations and certain design activities of ODM related businesses. These businesses generated $1.6 billion in sales and sustained operating losses of approximately $113.1 million in fiscal 2012. We have redeployed the majority of the associated manufacturing and design assets into other parts of our business, which will benefit our future cash flows through reduced capital expenditure requirements.
Additionally, as a result of the challenges faced by our camera modules business, this business has been performing at below optimal levels for the past several years. On March 2, 2012, the Company entered into a definitive agreement with Tessera Technologies, Inc., and DigitalOptics Corporation (DOC), a wholly-owned subsidiary of Tessera Technologies, in which DOC will acquire certain assets of Flextronics' Vista Point Technologies camera module business, including intellectual property and the China-based manufacturing operations. This transaction is expected to close in the first quarter of fiscal 2013 subject to certain closing conditions. The results of operations and financial position of the divested camera modules business are reported as discontinued operations for all periods presented, and include a $17.0 million charge in fiscal 2012 for the impairment of fixed assets to be disposed in the transaction based on the expected proceeds from the sale.
With respect to our remaining components businesses, our manufacturing efficiencies and production yields continued to improve and during fiscal year 2012 our component product solution services made progress reducing their aggregate operating losses. We are encouraged by the increased demand for these product solutions and the successful achievement of acceptance in the market, and we remain intensely focused on further improving our manufacturing efficiencies and thus our future margins and profitability.
We are one of the world's largest manufacturing service providers, with revenues of $29.4 billion in fiscal 2012. We design, build, ship, and service electronics products for our customers through a network of facilities in over 30 countries across four continents. We have established an extensive network of manufacturing facilities in the world's major electronics markets (Asia, the Americas and Europe) in order to serve the growing outsourcing needs of both multinational and regional OEMs. As of March 31, 2012, our total manufacturing capacity was approximately 26.7 million square feet. In fiscal 2012, our net sales in Asia, the Americas and Europe represented approximately 52%, 29% and 19%, respectively, of our total net sales, based on the location of the manufacturing site. The following tables set forth net sales and net property and equipment, by country, based on the location of our manufacturing sites:
35
Fiscal Year Ended March 31, Net sales: 2012 2011 2010 (In thousands) China $ 11,148,475 $ 10,744,768 $ 7,868,517 Mexico 4,005,653 4,241,222 3,664,914 U.S 3,006,713 2,949,804 3,187,045 Malaysia 2,868,990 2,595,174 2,561,913 Hungary 2,123,768 2,343,066 1,807,927 Other 6,234,057 5,614,984 4,919,468
$ 29,387,656 $ 28,489,018 $ 24,009,784

Table of Contents
We believe that the combination of our extensive design and engineering services, significant scale and global presence, vertically-integrated end-to-end services, advanced supply chain management, industrial campuses in low-cost geographic areas and operational track record provide us with a competitive advantage in the market for designing, manufacturing and servicing electronics products for leading multinational and regional OEMs. Through these services and facilities, we offer our OEM customers the ability to simplify their global product development, manufacturing process, and after sales services, and enable them to achieve meaningful time to market and cost savings.
Our operating results are affected by a number of factors, including the following:
• changes in the macroeconomic environment and related changes in consumer demand;
• the mix of the manufacturing services we are providing, the number and size of new manufacturing programs, the degree to which we utilize our manufacturing capacity, seasonal demand, shortages of components and other factors;
• the effects on our business when our customers are not successful in marketing their products, or when their products do not gain widespread commercial acceptance;
• our increased components offerings which have required that we make substantial investments in the resources necessary to design and develop these products;
• our ability to achieve commercially viable production yields and to manufacture components in commercial quantities to the performance specifications demanded by our OEM customers;
• the effects on our business due to our customers' products having short product life cycles;
• our customers' ability to cancel or delay orders or change production quantities;
• our customers' decision to choose internal manufacturing instead of outsourcing for their product requirements;
• our exposure to financially troubled customers; and
• integration of acquired businesses and facilities.
We also are subject to other risks as outlined in Item 1A, "Risk Factors."
Net revenues for fiscal 2012 increased 3.2% or $0.9 billion to $29.4 billion as we grew in all the major markets we serve except for HVS, which was impacted by decreased sales of mobile handsets to one of our significant customers as we rebalanced our portfolio and our planned exit of its ODM PC business. However, we believe that we finished the year in a healthy financial and competitive position driven in part by the success in our diversified business model. The overall improvement in the macroeconomic environment during fiscal 2012 and the success in booking new product orders for our array of key customers led to increased demand for our OEM customers' end products. The vast
36
Fiscal Year Ended March 31, Property and equipment, net: 2012 2011 (In thousands) China $ 847,732 $ 835,011 Mexico 309,325 341,719 Malaysia 170,990 144,604 U.S 132,950 136,081 Hungary 130,458 157,643 Other 492,693 468,973
$ 2,084,148 $ 2,084,031
Table of Contents
majority of our sales growth during the year was organic, as the impact from acquisitions was minimal. Our fiscal 2012 gross profit totaled $1.5 billion, representing a decrease of $68.6 million, or 4.3%, compared to fiscal 2011 driven primarily by an increase in sales of low margin products in the ODM personal computing business that we exited in the third quarter of fiscal 2012. Our income from continuing operations of $510.6 million was lower than the $606.3 million realized in fiscal 2011 primarily reflecting the operating losses sustained from the ODM personal computing business and the $32.0 million we recognized for a financially distressed customer as discussed further below.
During the fourth quarter of fiscal 2012, the Company identified certain accounting errors in the statutory to US GAAP adjustments at one of its foreign sites that originated in prior interim and annual periods. Management conducted additional procedures and concluded that these errors were isolated to that location. These errors, which primarily understated cost of sales, totaled $0.8 million in the first nine months of fiscal 2012 and $10.4 million and $8.0 million for the fiscal years ended March 31, 2011 and 2010, and were corrected by the Company as an out-of-period adjustment in the fourth quarter of fiscal 2012. This fourth quarter adjustment was partially offset by the correction of an error identified in the fourth quarter fiscal 2012 amounting to $4.2 million related to the provisions for income taxes in the prior fiscal 2012 interim periods. Management believes the impact of these items, both individually and in the aggregate, to the fiscal year ended March 31, 2012 and to prior fiscal and interim periods presented was not material. As a result of recording these adjustments in the fourth quarter, net income for the quarter and year ended March 31, 2012 were reduced by $21.5 million ($0.03 per share) and $24.9 million ($0.03 per share), respectively.
Subsequent to March 31, 2012, the Company became aware that one of its customers in the concentrated solar photovoltaic market was experiencing significant financial and liquidity difficulties. The Company has been in good faith negotiations with the customer and its primary stakeholders on various out-of-court restructuring alternatives. Based on an evaluation of this customer's specific circumstances through May 25, 2012, including but not limited to, its financing alternatives, business prospects, proposed restructuring alternatives and the possibility of insolvency, the Company determined that its best estimate was that all accounts receivable and inventory related to this customer were unrecoverable and recorded a charge of $32.0 million as of March 31, 2012 related to this customer. Of this charge, the Company classified $4.0 million in cost of sales related to the write-down of inventory and $28.0 million as selling, general and administrative expenses for provisions for doubtful accounts. Based on all information available through March 31, 2012, the Company believed that payment of receivables was reasonably assured at the time of shipment, and accordingly, the Company recorded revenues on sales to the customer.
Cash provided by operations decreased approximately $53.0 million to $804.3 million for fiscal year 2012 compared with $857.3 million for fiscal year 2011. Working capital increased $250.6 million in fiscal 2012 primarily as a result of a decrease in accounts payable and to a lesser extent from an increase in accounts receivable. Our average net working capital, defined as accounts receivable plus the deferred purchase price receivable from our asset-backed securitization programs plus inventory less accounts payable, as a percentage of annual sales was approximately 6.2%, 4.5% and 5.0% for the years ended March 31, 2012, 2011 and 2010, respectively. The increase in the percentage for the year ended March 31, 2012 is primarily attributable to the change in our overall portfolio as our mix of business shifted to a lesser percentage of HVS, which historically carries significantly higher inventory turns and customers with contractually faster payment terms. Our free cash flow, which we define as cash from operating activities less net purchases of property and equipment, was $416.3 million for fiscal 2012 compared to $463.5 million for fiscal 2011, primarily due to lesser cash flows from operations partially off-set by lower capital expenditures as we continue to reposition assets from the ODM personal computing business we exited in the December quarter. Cash used in financing activities amounted to $522.2 million during fiscal 2012 and included repurchases of approximately 81.7 million ordinary shares at an aggregate purchase price of $509.8 million.
37

Table of Contents
Fiscal 2012 was a transformational year and one in which we took further steps to achieve a more diversified portfolio, as evidenced by our exit of the ODM PC business. We continue our focus on diversifying our product portfolio from the high volume low margin HVS market to other markets with a view to improving profitability and we expect these actions to take further effect over the course of fiscal 2013. We believe that this diversified portfolio provides our investors with a more stable and predictable portfolio with longer product lifecycles. We believe that the long-term, future growth prospects for outsourcing of advanced manufacturing capabilities, design and engineering services and after-market services are and will remain strong.
CRITICAL ACCOUNTING POLICIES AND ESTIMATES
The preparation of financial statements in conformity with accounting principles generally accepted in the United States of America ("U.S. GAAP" or "GAAP") requires management to make estimates and assumptions that affect the reported amounts of assets and liabilities, the disclosure of contingent assets and liabilities at the date of the financial statements, and the reported amounts of revenues and expenses during the reporting period. Actual results may differ from those estimates and assumptions.
We believe the following critical accounting policies affect our more significant judgments and estimates used in the preparation of our consolidated financial statements. For further discussion of our significant accounting policies, refer to note 2, "Summary of Accounting Policies," of the notes to consolidated financial statements in Item 8, "Financial Statements and Supplementary Data."
Revenue Recognition
We recognize manufacturing revenue when we ship goods or the goods are received by our customer, title and risk of ownership have passed, the price to the buyer is fixed or determinable and recoverability is reasonably assured. Generally, there are no formal customer acceptance requirements or further obligations related to manufacturing services. If such requirements or obligations exist, then we recognize the related revenues at the time when such requirements are completed and the obligations are fulfilled. We make provisions for estimated sales returns and other adjustments at the time revenue is recognized based upon contractual terms and an analysis of historical returns. These provisions were not material to our consolidated financial statements for the 2012, 2011 and 2010 fiscal years.
We provide a comprehensive suite of services for our customers that range from contract design services to manufacturing and logistics to repair services. We recognize service revenue when the services have been performed, and the related costs are expensed as incurred. Our net sales for services were less than 10% of our total sales during the 2012, 2011 and 2010 fiscal years, and accordingly, are included in net sales in the consolidated statements of operations.
Customer Credit Risk
We have an established customer credit policy through which we manage customer credit exposures through credit evaluations, credit limit setting, monitoring, and enforcement of credit limits for new and existing customers. We perform ongoing credit evaluations of our customers' financial condition and make provisions for doubtful accounts based on the outcome of those credit evaluations. We evaluate the collectability of accounts receivable based on specific customer circumstances, current economic trends, and the age of past due receivables. To the extent we identify exposures as a result of credit or customer evaluations, we also review other customer related exposures, including but not limited to inventory and related contractual obligations.
Subsequent to March 31, 2012, the Company became aware that one of its customers in the concentrated solar photovoltaic market was experiencing significant financial and liquidity difficulties.
38

Table of Contents
The Company recognized a charge of $32 million in relation to write-off of bad debt and write-down of inventory in connection with this distressed customer. Refer to the overview section for further detail.
Restructuring Charges
We recognize restructuring charges related to our plans to close or consolidate duplicate manufacturing and administrative facilities. In connection with these activities, we recognize restructuring charges for employee termination costs, long-lived asset impairment and other restructuring-related costs.
The recognition of these restructuring charges require that we make certain judgments and estimates regarding the nature, timing and amount of costs associated with the planned exit activity. To the extent our actual results in exiting these facilities differ from our estimates and assumptions, we may be required to revise the estimates of future liabilities, requiring the recognition of additional restructuring charges or the reduction of liabilities already recognized. At the end of each reporting period, we evaluate the remaining accrued balances to ensure that no excess accruals are retained and the utilization of the provisions are for their intended purpose in accordance with developed exit plans.
Refer to note 12, "Restructuring Charges," of the notes to consolidated financial statements in Item 8, "Financial Statements and Supplementary Data" for further discussion of our restructuring activities.
Carrying Value of Long-Lived Assets
We review property and equipment and acquired amortizable intangible assets for impairment whenever events or changes in circumstances indicate that the carrying amount of the asset may not be recoverable. An impairment loss is recognized when the carrying amount of these long-lived assets exceeds their fair value. Recoverability of property and equipment and acquired amortizable intangible assets are measured by comparing their carrying amount to the projected cash flows the assets are expected to generate. If such assets are considered to be impaired, the impairment loss recognized, if any, is the amount by which the carrying amount of the property and equipment and acquired amortizable intangible assets exceeds fair value.
Inventory Valuation
Our inventories are stated at the lower of cost (on a first-in, first-out basis) or market value. Our industry is characterized by rapid technological change, short-term customer commitments and rapid changes in demand. We purchase our inventory based on forecasted demand, and we estimate write downs for excess and obsolete inventory based on our regular reviews of inventory quantities on hand, and the latest forecasts of product demand and production requirements from our customers. If actual market conditions or our customers' product demands are less favorable than those projected, additional provisions may be required. In addition, unanticipated changes in the liquidity or financial position of our customers and/or changes in economic conditions may require additional write downs for inventories due to our customers' inability to fulfill their contractual obligations with regard to inventory procured to fulfill customer demand.
Income Taxes
Our deferred income tax assets represent temporary differences between the carrying amount and the tax basis of existing assets and liabilities which will result in deductible amounts in future years, including net operating loss carry forwards. Based on estimates, the carrying value of our net deferred tax assets assumes that it is more likely than not that we will be able to generate sufficient future taxable income in certain tax jurisdictions to realize these deferred income tax assets. Our judgments regarding future profitability may change due to future market conditions, changes in U.S. or
39

Table of Contents
international tax laws and other factors. If these estimates and related assumptions change in the future, we may be required to increase or decrease our valuation allowance against deferred tax assets previously recognized, resulting in additional or lesser income tax expense.
We are regularly subject to tax return audits and examinations by various taxing jurisdictions and around the world, and there can be no assurance that the final determination of any tax examinations will not be materially different than that which is reflected in our income tax provisions and accruals. Should additional taxes be assessed as a result of a current or future examination, there could be a material adverse effect on our tax position, operating results, financial position and cash flows. Refer to note 11 "Income Taxes" of the notes to consolidated financial statements in Item 8, "Financial Statements and Supplementary Data" for further discussion of our tax position.
RESULTS OF OPERATIONS
The following table sets forth, for the periods indicated, certain statements of operations data expressed as a percentage of net sales. The financial information and the discussion below should be read in conjunction with the consolidated financial statements and notes thereto included in Item 8, "Financial Statements and Supplementary Data." The data below, and discussion that follows, represents our results from operations.
On March 2, 2012, the Company entered into a definitive agreement to sell certain assets of its Vista Point Technologies camera module business. This transaction is expected to close in the first quarter of fiscal 2013 subject to certain closing conditions. The camera modules business represents a separate asset group and the divestiture qualifies as discontinued operations, and accordingly, the Company has reported the results of operations and financial position of this business in discontinued operations within the statements of operations and the balance sheets for all periods presented.
Net sales
Net sales during fiscal year 2012 totaled $29.4 billion, representing an increase of $0.9 billion, or 3.2%, from $28.5 billion during fiscal year 2011. Sales during fiscal year 2012 increased across all of the markets we serve except for HVS consisting of increases of: (i) $0.8 billion or 7.7% in the INS market,
40
Fiscal Year Ended March 31, 2012 2011 2010 Net sales 100.0 % 100.0 % 100.0 % Cost of sales 94.8 94.4 94.6 Restructuring charges — — 0.4
Gross profit 5.2 5.6 5.0 Selling, general and administrative expenses 3.0 2.8 3.1 Intangible amortization 0.2 0.2 0.4 Restructuring charges — — 0.1 Other charges (income), net (0.1 ) — 0.9 Interest and other expense, net 0.1 0.3 0.6
Income (loss) from continuing operations before income taxes 2.0 2.3 0.0
Provision for (benefit from) income taxes 0.2 0.1 (0.1 )
Income from continuing operations 1.8 2.2 0.1 Discontinued operations:
Loss from discontinued operations, net of tax (0.1 ) — —
Net income 1.7 % 2.2 % 0.1 %

Table of Contents
(ii) $0.5 billion or 28.5% in the HRS market, and (iii) $0.1 billion or 1.7% in the IEI market. The increase in sales for our INS market were driven by new program wins with existing customers with products in enterprise data networking and telecommunications infrastructure markets, offset by declining demand from certain customer programs in the server market that were reducing due to the end of the product life cycles or which transitioned to another supplier. The increase in sales for our HRS market were driven primarily from new wins and programs with our larger customers in the automotive, medical equipment and drug delivery markets. The increase in sales for our IEI market was due to new customer wins and new programs with existing customers across this business group primarily with customers serving the clean tech markets offset by reduced demand from our customers serving the capital equipment markets. The increase in net sales for these markets were offset by a $0.5 billion or 4.2% decrease in sales in the HVS market due to a decrease in sales of mobile handsets to one of our significant customers as we rebalance our portfolio, partially offset by an increase in sales through the first nine months of fiscal 2012 to another significant customer in the ODM personal computing business which we exited in the third quarter of fiscal 2012. Net sales increased across all of the geographical regions we serve, consisting of increases of $0.8 billion in Asia, $0.1 billion in the Americas and an insignificant increase in Europe.
Net sales during fiscal year 2011 totaled $28.5 billion, representing an increase of $4.5 billion, or 18.7%, from $24.0 billion during fiscal year 2010, primarily due to an improved macroeconomic environment that led to increased demand for our OEM customers ends products. Sales during fiscal year 2011 increased across all of the markets we serve, consisting of increases of: (i) $2.4 billion or 24.3% in the HVS market, (ii) $0.9 billion or 30.1% in the IEI market, (iii) $0.7 billion or 7.2% in the INS market and (iv) $0.5 billion or 34.8% in the HRS market. These increases were driven by increased sales from almost all of our major customers combined with new customer wins and new program wins with existing customers. Net sales increased across all of the geographical regions we serve, consisting of increases of $3.1 billion in Asia, $0.8 billion in Europe and $0.6 billion in the Americas.
The following table sets forth net sales by market:
Our ten largest customers during fiscal years 2012, 2011, and 2010 accounted for approximately 55%, 52% and 47% of net sales, respectively, with Hewlett-Packard (HP) and Research In Motion (RIM) each accounting for greater than 10% of our net sales during fiscal 2012. During fiscal year 2011 RIM accounted for greater than 10% of net sales and during fiscal year 2010 HP accounted for greater than 10% of net sales.
Gross profit
Gross profit is affected by a number of factors, including the number and size of new manufacturing programs, product mix, component costs and availability, product life cycles, unit volumes, pricing, competition, new product introductions, capacity utilization and the expansion and consolidation of manufacturing facilities. The flexible design of our manufacturing processes allows us to build a broad range of products in our facilities, which allows us to better utilize our manufacturing
41
Fiscal Year Ended March 31, Market: 2012 2011 2010 (In thousands) High Velocity Solutions $ 11,645,211 $ 12,156,933 $ 9,777,024 Integrated Network Solutions 11,358,401 10,547,049 9,835,871 Industrial & Emerging Industries 3,989,717 3,921,226 3,014,573 High Reliability Solutions 2,394,327 1,863,810 1,382,316
$ 29,387,656 $ 28,489,018 $ 24,009,784

Table of Contents
capacity. In the cases of new programs, profitability normally lags revenue growth due to product start-up costs, lower manufacturing program volumes in the start-up phase, operational inefficiencies, and under-absorbed overhead. Gross margin often improves over time as manufacturing program volumes increase, as our utilization rates and overhead absorption improves, and as we increase the level of vertically-integrated manufacturing services content. As a result of these various factors, our gross margin varies from period to period.
Gross profit during fiscal year 2012 decreased $68.6 million to $1.5 billion from $1.6 billion during fiscal year 2011. Gross margin decreased to 5.2% of net sales in fiscal year 2012 as compared with 5.6% of net sales in fiscal 2011. The decreases in gross profit and gross margin were primarily attributable to a higher mix of low-margin products principally associated with the increase in sales of products in the ODM personal computing business during the first nine months of fiscal 2012, which are included in the HVS market which we exited in the third quarter of fiscal 2012. These businesses sustained gross losses of approximately $38.2 million in fiscal 2012. Fiscal 2012 cost of sales also includes the impact of adjustments made to correct certain accounting errors identified and recorded as out of period adjustments during the fourth quarter of fiscal 2012 as discussed in the Overview section. These out-of period adjustments amounted to approximately $23.9 million and resulted in increased cost of sales in the fourth quarter of fiscal 2012. In addition, gross margins were negatively impacted by unfavorable manufacturing costs associated with the exit of our ODM related businesses and costs incurred for right-sizing activities at various locations.
Gross profit during fiscal year 2011 increased $374.4 million to $1.6 billion from $1.2 billion during fiscal year 2010. Gross margin increased to 5.6% of net sales in fiscal year 2011 as compared with 5.0% of net sales in fiscal 2010. The 60 basis point year over year increase in gross margin was primarily attributable to increased net sales resulting in better utilization of our capacity and absorption of our fixed costs, and in part, due to cost reduction and operational efficiency benefits related to prior years' restructuring activities. We did not incur restructuring charges during fiscal year 2011 compared to restructuring costs of $92.4 million in fiscal 2010.
Restructuring charges
We have essentially completed all activities associated with previously announced plans and the remaining restructuring accrual as at March 31, 2012 was not significant. Additionally, there were no changes to any of the previously announced plans during fiscal 2012. While we incur severance, asset impairment charges and other facilities charges as a result of changes in our customer mix on an ongoing basis, such individual actions were not considered material to be separately disclosed as restructuring charges, and are included in either cost of sales or selling, general and administrative expenses, as appropriate. The amount of accrued liabilities related to these actions at March 31, 2012 was not significant.
We recognized restructuring charges of approximately $107.5 million during fiscal year 2010 as part of our restructuring plans previously announced in March 2009 in order to rationalize our global manufacturing capacity and infrastructure in response to weakened macroeconomic conditions. The costs associated with these restructuring activities included employee severance, costs related to owned and leased facilities and equipment that is no longer in use and is to be disposed of, and other costs associated with the exit of certain contractual arrangements due to facility closures. We classified approximately $92.4 million of these charges as cost of sales and approximately $15.1 million of these charges as selling, general and administrative expenses during fiscal year 2010. The charges recognized by reportable geographic region amounted to $45.1 million, $37.3 million and $25.1 million for Asia, Europe and the Americas, respectively. Approximately $43.1 million of these restructuring charges were non-cash. As of March 31, 2012, accrued severance and facility closure costs related to restructuring charges incurred during fiscal year 2010 and prior were approximately $12.7 million, of which $9.2 million was classified as current.
42

Table of Contents
Refer to note 12, "Restructuring Charges," of the notes to consolidated financial statements in Item 8, "Financial Statements and Supplementary Data" for further discussion of our restructuring activities.
Selling, general and administrative expenses
Selling, general and administrative expenses, or SG&A, totaled $880.6 million or 3.0% of net sales, during fiscal year 2012, compared to $804.9 million, or 2.8% of net sales, during fiscal year 2011. The increases in SG&A in dollars and as a percentage of net sales were primarily attributable to the $28.0 million in bad debt expense we recognized in connection with the financial distress currently experienced by one of our customers, and severance costs and other asset impairment costs associated with the exit of our ODM related businesses during the December quarter.
Selling, general and administrative expenses, or SG&A, totaled $804.9 million or 2.8% of net sales, during fiscal year 2011, compared to $755.1 million, or 3.1% of net sales, during fiscal year 2010. The increase in absolute dollars was primarily the result of increased compensation expense due to increased headcount in various corporate support activities, such as information technology and supply chain management, necessary to support the growth of our operations. Further, we realized increased costs associated with research, development and engineering activities as we continued to make investments to meet the needs of our customers. The overall decrease in SG&A as a percentage of sales during fiscal year 2011 was primarily due to our significant increase in sales as we were able to leverage our SG&A percentage down.
Intangible amortization
Amortization of intangible assets in fiscal year 2012 decreased by $15.0 million to $55.9 million from $70.9 million in fiscal year 2011. The reduction in expense was primarily due to certain assets becoming fully amortized and the use of the accelerated method of amortization for certain customer related intangibles, which results in decreasing expense over time.
Amortization of intangible assets in fiscal year 2011 decreased by $18.7 million to $70.9 million from $89.6 million in fiscal year 2010. The reduction in expense was primarily due to certain assets becoming fully amortized and the use of the accelerated method of amortization for certain customer related intangibles, which results in decreasing expense over time, and was partially offset by purchase accounting adjustments.
Other charges (income), net
During fiscal 2012, the Company recognized a net gain of $20.0 million, in connection with the sale of certain international entities.
During fiscal 2011, we recognized charges totaling $6.3 million, consisting of a $13.2 million loss associated with the early redemption of our 6.25% Senior Subordinated Notes, and an $11.7 million loss in connection with the divestiture of certain international entities, offset by a gain of $18.6 million associated with the sale of an equity investment that was previously fully impaired.
During fiscal 2010, we sold our entire interest in one of our non-majority owned investments and related note receivable for cash of approximately $252.5 million, and recognized an impairment charge associated with this sale amounting to $107.4 million in the first quarter of fiscal 2010. We also recognized charges totaling approximately $92.0 million during the second quarter of fiscal 2010 associated with the other-than-temporary impairment of our notes receivable from one affiliate and an equity investment in another affiliate. Deterioration in the business prospects, cash flow expectations, and increased liability concerns of the affiliate and the equity investment resulted in the impairment of the carrying value to the estimated recoverable value.
43

Table of Contents
Interest and other expense, net
Interest and other expense, net was $36.0 million during fiscal 2012, compared to $75.4 million during fiscal 2011, a decrease of $39.4 million. The decrease in net expense was primarily due to a $39.2 million reduction in net interest expense principally from the expiration of interest rate swaps in January 2011, which had fixed rates greater than the floating rates underlying our borrowing arrangements and to a lesser extent to the refinancing of $542.1 million of certain subordinated notes during fiscal 2011 with our lower rate revolving credit facility and Asia term loans. Gains on foreign exchange transactions increased $6.5 million during fiscal year 2012 as we continue to benefit from certain cross-border foreign currency transactions and the revaluation of RMB denominated net asset positions for our U.S. functional currency sites based in China. There can be no assurance that further gains from cross-border foreign exchange settlements in China will be available.
Interest and other expense, net was $75.4 million during fiscal 2011, compared to $155.7 million during fiscal 2010, a decrease of $80.3 million. The decrease in expense was the result of reduced debt levels as we redeemed $542.1 million of certain subordinated notes during the fiscal year. Further reduction in interest expense was due to lower interest rates as a result of $847.0 million in fixed rate debt. This decrease in interest expense was partially offset by interest expense on $160.0 million borrowed under our revolving lines of credit and $379.0 million borrowed under our Asia term loans. In addition, we recognized approximately $9.2 million of income during fiscal 2011 from foreign exchange gains.
Income taxes
Certain of our subsidiaries have, at various times, been granted tax relief in their respective countries, resulting in lower income taxes than would otherwise be the case under ordinary tax rates. The consolidated effective tax rates were 9.6%, 3.5% and 332.7% for the fiscal years 2012, 2011 and 2010. The effective rate varies from the Singapore statutory rate of 17.0% as a result of recognition of earnings in different jurisdictions, operating loss carry forwards, income tax credits, previously established valuation allowances for deferred tax assets, liabilities for uncertain tax positions, as well as because of the effect of certain tax holidays and incentives granted to our subsidiaries primarily in China, Malaysia, Israel, and Singapore. We generate most of our revenues and profits from operations outside of Singapore. The effective tax rate for fiscal year 2012 varies from the effective rates for fiscal years 2011 and 2010 primarily as a result of changes in valuation allowances and liabilities for uncertain tax positions which are recorded on a discrete, quarterly basis.
We are regularly subject to tax return audits and examinations by various taxing jurisdictions and around the world, and there can be no assurance that the final determination of any tax examinations will not be materially different than that which is reflected in our income tax provisions and accruals. Should additional taxes be assessed as a result of a current or future examination, there could be a material adverse effect on our tax position, operating results, financial position and cash flows.
See note 11, "Income Taxes," of the notes to consolidated financial statements included in Item 8, "Financial Statements and Supplementary Data" for further discussion.
Discontinued Operations
Consistent with our strategy to evaluate the strategic and financial contributions of each of our operations and to focus on the primary growth objectives in the Company's core vertically-integrated manufacturing business activities, on March 2, 2012, we entered into a definitive agreement with Tessera Technologies, Inc., and DigitalOptics Corporation (DOC), a wholly-owned subsidiary of Tessera Technologies. Under the terms of the definitive agreement, DOC will acquire certain assets of Flextronics' Vista Point Technologies camera module business, including intellectual property and the China-based manufacturing operations for a total estimated consideration of $23.0 million, subject to
44

Table of Contents
certain working capital adjustments. This transaction is expected to close in the first quarter of fiscal 2013 subject to certain closing conditions.
The divestiture of the camera modules business qualifies as a discontinued operation, and accordingly, we have reported the results of operations and financial position of this business in discontinued operations within the statements of operations and the balance sheets for all periods presented.
The results from discontinued operations were as follows:
Net sales in fiscal 2012 decreased as we decelerated operations while evaluating strategic alternatives for the business and due to the end of certain product life cycles. The increase in net loss during fiscal 2012 is primarily attributable to a $17.0 million charge for impairment of fixed assets that will be sold in the transaction based on expected proceeds from the sale. The impairment charge is included in cost of sales.
Net sales in fiscal 2011 increased primarily due to an increase in demand for camera modules sub-assemblies from one of our more significant customers. The sudden and significant increase in volume resulted in manufacturing inefficiencies and poor production yields resulting in a $1.0 million gross loss during fiscal year 2011, which further translated into a $3.7 million increase in net losses primarily due to the fixed nature of certain SG&A expenses that remained consistent with prior year, as compared with fiscal year 2010 after the benefit from income taxes.
LIQUIDITY AND CAPITAL RESOURCES
As of March 31, 2012, the Company had cash and cash equivalents of $1.5 billion and bank and other borrowings of $2.2 billion. The Company has a $1.5 billion revolving credit facility, under which we had $140.0 million in borrowings outstanding as of March 31, 2012, which is included in the $2.2 billion of borrowings above.
Our cash balances are held in numerous locations throughout the world. As of March 31, 2012, substantially all of our cash and cash equivalents were held by foreign subsidiaries outside of Singapore. Although substantially all of the amounts held outside of Singapore could be repatriated, under current laws, a significant amount could be subject to income tax withholdings. We provide for tax liabilities on these amounts for financial statement purposes, except for certain of our foreign earnings that are considered indefinitely reinvested outside of Singapore (approximately $570.0 million as of March 31, 2012). Repatriation could result in an additional income tax payment, however, our intent is to permanently reinvest these funds outside of Singapore and our current plans do not demonstrate a need to repatriate them to fund our operations. Where local restrictions prevent an efficient
45
Fiscal Year Ended March 31, 2012 2011 2010 (In thousands) Net sales $ 82,632 $ 190,907 $ 100,949 Cost of sales 100,167 191,950 94,959 Restructuring charges — — 33
Gross profit (loss) (17,535 ) (1,043 ) 5,957 Selling, general and administrative expenses 5,859 11,459 12,037 Interest and other expense (income), net 32 422 (51 )
Loss before income taxes (23,426 ) (12,924 ) (6,029 ) Provision for (benefit from) income taxes (1,546 ) (2,798 ) 379
Net loss of discontinued operations $ (21,880 ) $ (10,126 ) $ (6,408 )

Table of Contents
intercompany transfer of funds, our intent is that cash balances would remain outside of Singapore and we would meet our liquidity needs through ongoing cash flows, external borrowings, or both.
Fiscal Year 2012
Cash provided by operating activities was $804.3 million during fiscal year 2012, which resulted primarily from $488.8 million of net income for the period and $539.1 million of non-cash earnings adjustment items such as depreciation, amortization, impairment charges and stock-based compensation expense. Offsetting these cash generating activities was $250.7 million of increased working capital. Our working capital accounts increased primarily due to a decrease of $750.2 million in accounts payable and a $97.9 million increase in accounts receivable, which was partially offset by a decrease in inventory of $301.1 million principally due to the deceleration of sales in our HVS market, and an increase in deferred revenues of $260.0 million. The decrease in accounts payable is principally related to the decrease in inventory and timing of supplier payments.
Cash used in investing activities during fiscal year 2012 was $481.4 million. This resulted primarily from $388.0 million in capital expenditures for equipment, net of proceeds on sales, and $92.3 million paid for three acquisitions completed during the year together with contingent consideration and deferred purchase price payments related to prior period acquisitions.
Cash used in financing activities amounted to $522.2 million during fiscal year 2012, which was primarily attributable to the repurchase of approximately 81.7 million shares for an aggregate purchase price of approximately $509.8 million. During fiscal year 2012 we also repaid $20.0 million of debt outstanding on the Company's $2.0 billion revolving credit facility. As discussed further below, on October 19, 2011, the Company entered into a five-year $2.0 billion credit facility, which replaced the Company's $2.0 billion revolving credit facility, and refinanced one tranche of the Company's $1.7 billion Term Loan Agreement dated October 1, 2007. We paid $9.4 million of debt issuance costs associated with this new facility, which are reflected as financing outflows and will be amortized as a component of interest expense through October 2016.
Fiscal Year 2011
Cash provided by operating activities was $857.3 million during fiscal year 2011, which resulted primarily from $596.2 million of net income for the period and $475.7 million of non-cash earnings adjustment items such as depreciation, amortization, impairment charges, and stock-based compensation expense. Offsetting these cash generating activities was $221.5 million of increased working capital. Our working capital accounts increased primarily due to an increase of $664.7 million in inventories as a result of our increased production and anticipated growth, and an increase of $390.4 million in other current assets primarily attributable to $324.6 million in our deferred purchase price receivable associated with our receivables sales, which were partially offset by increases in accounts payable of $609.9 million and other current liabilities of $155.2 million, primarily driven by the timing of purchases and cash payments.
Cash used in investing activities during fiscal year 2011 was $413.2 million. This resulted primarily from $393.9 million in capital expenditures for equipment, net of proceeds on sales, and $17.0 million, net of cash acquired, for contingent consideration and deferred purchase price payments related to four acquisitions, and payments related to two completed acquisitions. Cash used was partially offset by proceeds related to the sale of an equity investment for $18.6 million.
Cash used in financing activities amounted to $641.7 million during fiscal year 2011. On each of May 26, 2010, August 12, 2010 and March 23, 2011, our Board of Directors authorized the repurchase of up to $200.0 million, for a combined total of $600.0 million, of our outstanding shares. During the 2011 fiscal year, we repurchased approximately 65.4 million shares at an aggregate purchase price of $400.4 million, including accrued expenses. In August 2010, we paid $240.0 million to redeem the entire
46

Table of Contents
principal amount of the 1% Convertible Subordinated Notes at par plus accrued interest. In December 2010, we paid approximately $308.5 million to redeem the aggregate principal balance and redemption premium of our 6.25% Senior Subordinated Notes ("6.25% Notes") plus accrued interest. In addition, we made repayments of approximately $217.1 million related to our Global Asset-Backed Securitization program effective with the adoption of new accounting standards on April 1, 2010.
The cash used in financing activities was partially offset by $379.0 million of additional borrowings under new Asia term loan agreements and $160.0 million of borrowings under our revolving line of credit. During September 2010, we entered into two new three-year term loan agreements with certain financial institutions based in Asia and borrowed $180.0 million in the aggregate. During February 2011, we entered into a new three-year term loan agreement with a financial institution based in Asia and borrowed $200.0 million in the aggregate.
Fiscal Year 2010
Cash provided by operating activities was $798.9 million during fiscal year 2010. This resulted primarily from $18.6 million of net income for the period before adjustments to include approximately $736.4 million of non-cash items such as depreciation, amortization, impairment charges, non-cash interest income, and stock-based compensation expense. Our working capital accounts increased $169.5 million on a net basis, primarily as a result of increased business volume as both accounts receivable and accounts payable increased. The reduction in other current and noncurrent liabilities was primarily due to lower continued payout of prior obligations and accrued obligations related to acquisitions, restructuring charges and financing charges.
Cash provided by investing activities during fiscal year 2010 was $7.8 million. This resulted primarily from proceeds related to the sale of an equity investment and note receivable for $259.8 million, net of closing costs, and was partially offset by approximately $176.5 million in capital expenditures for equipment, net of proceeds on sales and $75.9 million of deferred purchase price payments related to certain historical acquisitions and for three acquisitions completed during the fiscal year 2010.
Cash used in financing activities amounted to $713.3 million during fiscal year 2010. During June 2009, we used $203.2 million to repurchase an aggregate principal amount of $99.8 million of our 6.5% Senior Subordinated Notes due 2013 ("6.5% Notes") and an aggregate principal amount of $99.9 million of the 6.25% Notes due 2014 in a cash tender offer. On July 31, 2009, we paid $195.0 million to redeem the 0% Convertible Junior Subordinated Notes upon their maturity. On March 19, 2010, we used $306.3 million to redeem all of the remaining principle balance of $299.8 million of the 6.5% Notes.
Key Liquidity Metrics
Free Cash flow
We believe free cash flow is an important liquidity metric because it measures, during a given period, the amount of cash generated that is available to repay debt obligations, make investments, fund acquisitions, repurchase company shares and for certain other activities. Our free cash flow, which is calculated as cash provided by operations less net purchases of property and equipment, was $416.3 million, $463.5 million and $622.5 million for fiscal years 2012, 2011 and 2010, respectively.
47

Table of Contents
Cash Conversion Cycle
Days in trade accounts receivable was calculated as the average accounts receivable for the current and prior quarter, excluding the reduction in accounts receivable resulting from non-cash accounts receivable sales, divided by annualized sales for the current quarter by day. During the fiscal year ended March 31, 2012, days in trade accounts receivable increased by 3 days to 45 days compared to the fiscal year ended March 31, 2011 primarily as a result of the decline in sales in the HVS market that contained lower payment terms. Non-cash accounts receivable sales or deferred purchase price receivables included in trade receivables were $514.9 million, $460.0 million and $135.4 million for the years ended March 31, 2012, 2011 and 2010, respectively. Deferred purchase price receivables were recorded in other current assets in the consolidated balance sheets.
Days in inventory was calculated as the average inventory for the current and prior quarter divided by annualized cost of sales for the current quarter by day. During the fiscal year ended March 31, 2012, days in inventory increased 2 days compared to the fiscal year ended March 31, 2011 directly due to a decrease in inventory turns. Our inventory turns were negatively impacted by the decline in sales in the HVS market which carry significantly higher inventory turns than our corporate average inventory turns.
Days in accounts payable was calculated as the average accounts payable for the current and prior quarter divided by annualized cost of sales for the current quarter by day. During the fiscal year ended March 31, 2012, days in accounts payable decreased 3 days to 70 days compared to the fiscal year ended March 31, 2011 primarily due to the reduction of inventory in our fourth quarter and timing of supplier payments.
Our cash conversion cycle was calculated as days in trade receivables plus days in inventory, minus days in accounts payable and is a measure of how efficient we are at managing our working capital. For the fiscal year ended March 31, 2012, our cash conversion cycle increased 8 days to 27 days as compared with the fiscal year ended March 31, 2011 due to the factors affecting each of the components in the calculation discussed above.
Liquidity is affected by many factors, some of which are based on normal ongoing operations of the business and some of which arise from fluctuations related to global economics and markets. Cash balances are generated and held in many locations throughout the world. Local government regulations may restrict our ability to move cash balances to meet cash needs under certain circumstances. We do not currently expect such regulations and restrictions to impact our ability to pay vendors and conduct operations throughout the global organization. We believe that our existing cash balances, together with anticipated cash flows from operations and borrowings available under our credit facilities, will be sufficient to fund our operations through at least the next twelve months.
Future liquidity needs will depend on fluctuations in levels of inventory, accounts receivable and accounts payable, the timing of capital expenditures for new equipment, the extent to which we utilize operating leases for new facilities and equipment, and the levels of shipments and changes in the volumes of customer orders.
Historically, we have funded operations from cash and cash equivalents generated from operations, proceeds from public offerings of equity and debt securities, bank debt and lease financings. We also
48
Fiscal Year Ended March 31, 2012 2011 2010
Days in trade accounts receivable 45 days 42 days 40 days Days in inventory 52 days 50 days 46 days Days in accounts payable 70 days 73 days 72 days Cash conversion cycle 27 days 19 days 14 days

Table of Contents
sell designated pools of trade receivables under asset-backed securitization ("ABS") programs and sell certain trade receivables, which are in addition to the trade receivables sold in connection with these securitization agreements. During fiscal years 2012, 2011 and 2010 we received approximately $4.7 billion, $2.4 billion and $2.8 billion, respectively from sales of receivables under our ABS programs, and $2.0 billion, $2.5 billion and $1.2 billion, respectively from other sales of receivables. As of March 31, 2012 and 2011, we sold receivables for cash totaling $667.3 million and $654.7 million, respectively, under all our accounts receivable sales programs, which are not included in our consolidated balance sheets.
We anticipate that we will enter into debt and equity financings, sales of accounts receivable and lease transactions to fund acquisitions and anticipated growth. The sale or issuance of equity or convertible debt securities could result in dilution to current shareholders. Further, we may issue debt securities that have rights and privileges senior to those of holders of ordinary shares, and the terms of this debt could impose restrictions on operations and could increase debt service obligations. This increased indebtedness could limit our flexibility as a result of debt service requirements and restrictive covenants, potentially affect our credit ratings, and may limit our ability to access additional capital or execute our business strategy. Any downgrades in credit ratings could adversely affect our ability to borrow as a result of more restrictive borrowing terms. We continue to asses our capital structure and evaluate the merits of redeploying available cash to reduce existing debt or repurchase ordinary shares.
On July 22, 2011, our shareholders approved the repurchase of up to 10% of our ordinary shares outstanding on the date of our 2011 Extraordinary General Meeting, which repurchases are subject to Board of Directors approval. Our Board of Directors approved share repurchase plans in July 2011 and December 2011, pursuant to which we are authorized to repurchase approximately 73 million shares until our next Extraordinary General Meeting to be held during 2012. During the 2012 fiscal year, the Company repurchased approximately 81.7 million shares for an aggregate purchase price of approximately $509.8 million. Of the 81.7 million shares, approximately 29.0 million shares were repurchased under the prior shareholder purchase mandate. As of March 31, 2012, approximately 20.4 million shares were available to be repurchased under the plans.
CONTRACTUAL OBLIGATIONS AND COMMITMENTS
On October 19, 2011, the Company entered into a five-year $2.0 billion credit facility ("New Credit Facility") consisting of a $1.5 billion revolving credit facility ("New Revolving Credit Facility") and a $500 million term loan ("New Term Loan"), which expires in October 2016. The New Revolving Credit Facility replaced the Company's previous $2.0 billion revolving credit facility, which was due to mature in May 2012. The New Term Loan refinanced one tranche of the Company's $1.7 billion Term Loan dated October 1, 2007.
As of March 31, 2012, there was $140.0 million of borrowings outstanding under the New Revolving Credit Facility. The New Credit Facility requires that we maintain a maximum ratio of total indebtedness to EBITDA (earnings before interest expense, taxes, depreciation and amortization), and a minimum interest coverage ratio, as defined. As of March 31, 2012, we were in compliance with the covenants under the credit facility.
We and certain of our subsidiaries also have various uncommitted revolving credit facilities, lines of credit and other loans in the amount of $290.6 million in the aggregate under which there were approximately $4.6 million of borrowings outstanding as of March 31, 2012.
We have approximately $1.7 billion of borrowings outstanding under our term loan facilities as of March 31, 2012, including the New Term Loan discussed above. Of these amounts, approximately $1.2 billion matures in October 2014, and the remainder matures in October 2016. The portion of the term loan facility that matures in October 2014 amortizes in quarterly installments in an amount equal to 1% per annum. The New Term Loan which matures in October 2016 is repayable in quarterly
49
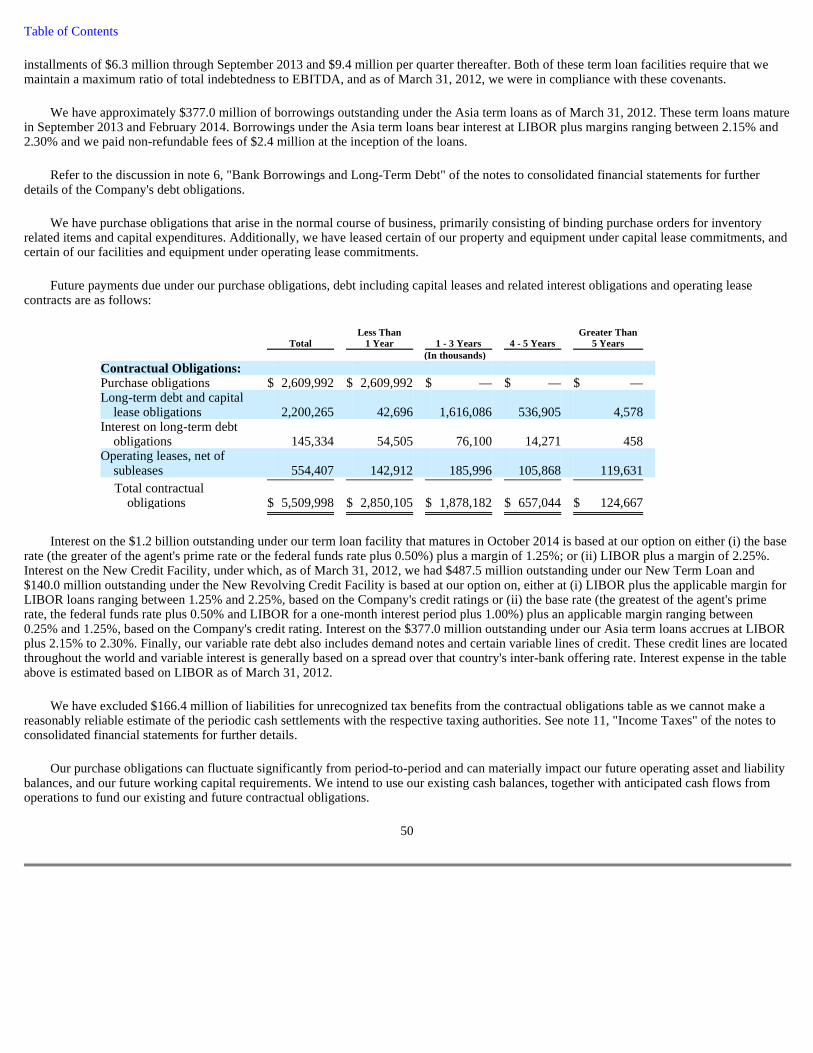
Table of Contents
installments of $6.3 million through September 2013 and $9.4 million per quarter thereafter. Both of these term loan facilities require that we maintain a maximum ratio of total indebtedness to EBITDA, and as of March 31, 2012, we were in compliance with these covenants.
We have approximately $377.0 million of borrowings outstanding under the Asia term loans as of March 31, 2012. These term loans mature in September 2013 and February 2014. Borrowings under the Asia term loans bear interest at LIBOR plus margins ranging between 2.15% and 2.30% and we paid non-refundable fees of $2.4 million at the inception of the loans.
Refer to the discussion in note 6, "Bank Borrowings and Long-Term Debt" of the notes to consolidated financial statements for further details of the Company's debt obligations.
We have purchase obligations that arise in the normal course of business, primarily consisting of binding purchase orders for inventory related items and capital expenditures. Additionally, we have leased certain of our property and equipment under capital lease commitments, and certain of our facilities and equipment under operating lease commitments.
Future payments due under our purchase obligations, debt including capital leases and related interest obligations and operating lease contracts are as follows:
Interest on the $1.2 billion outstanding under our term loan facility that matures in October 2014 is based at our option on either (i) the base rate (the greater of the agent's prime rate or the federal funds rate plus 0.50%) plus a margin of 1.25%; or (ii) LIBOR plus a margin of 2.25%. Interest on the New Credit Facility, under which, as of March 31, 2012, we had $487.5 million outstanding under our New Term Loan and $140.0 million outstanding under the New Revolving Credit Facility is based at our option on, either at (i) LIBOR plus the applicable margin for LIBOR loans ranging between 1.25% and 2.25%, based on the Company's credit ratings or (ii) the base rate (the greatest of the agent's prime rate, the federal funds rate plus 0.50% and LIBOR for a one-month interest period plus 1.00%) plus an applicable margin ranging between 0.25% and 1.25%, based on the Company's credit rating. Interest on the $377.0 million outstanding under our Asia term loans accrues at LIBOR plus 2.15% to 2.30%. Finally, our variable rate debt also includes demand notes and certain variable lines of credit. These credit lines are located throughout the world and variable interest is generally based on a spread over that country's inter-bank offering rate. Interest expense in the table above is estimated based on LIBOR as of March 31, 2012.
We have excluded $166.4 million of liabilities for unrecognized tax benefits from the contractual obligations table as we cannot make a reasonably reliable estimate of the periodic cash settlements with the respective taxing authorities. See note 11, "Income Taxes" of the notes to consolidated financial statements for further details.
Our purchase obligations can fluctuate significantly from period-to-period and can materially impact our future operating asset and liability balances, and our future working capital requirements. We intend to use our existing cash balances, together with anticipated cash flows from operations to fund our existing and future contractual obligations.
50
Total Less Than
1 Year 1 - 3 Years 4 - 5 Years Greater Than
5 Years (In thousands) Contractual Obligations: Purchase obligations $ 2,609,992 $ 2,609,992 $ — $ — $ — Long-term debt and capital
lease obligations 2,200,265 42,696 1,616,086 536,905 4,578 Interest on long-term debt
obligations 145,334 54,505 76,100 14,271 458 Operating leases, net of
subleases 554,407 142,912 185,996 105,868 119,631
Total contractual obligations $ 5,509,998 $ 2,850,105 $ 1,878,182 $ 657,044 $ 124,667

Table of Contents
OFF-BALANCE SHEET ARRANGEMENTS
We sell designated pools of trade receivables to unaffiliated financial institutions under our ABS programs, and in addition to cash, we receive a deferred purchase price receivable for each pool of the receivables sold. Each of these deferred purchase price receivables serves as additional credit support to the financial institutions and is recorded at its estimated fair value. The fair value of our deferred purchase price receivable was approximately $514.9 million as of March 31, 2012. For further information see note 8 of our notes to the consolidated financial statements.
RECENT ACCOUNTING PRONOUNCEMENTS
Refer to note 2, "Summary of Accounting Policies" of the notes to the consolidated financial statements for recent accounting pronouncements.
ITEM 7A. QUANTITATIVE AND QUALITATIVE DISCLOSURES ABOUT MARKET RISK
INTEREST RATE RISK
A portion of our exposure to market risk for changes in interest rates relates to our investment portfolio, which consists of highly liquid investments with maturities of three months or less from original dates of purchase. We do not use derivative financial instruments in our investment portfolio. We place cash and cash equivalents with various major financial institutions and limit the amount of credit exposure to 20% of the issuer's or fund's total assets measured at the time of purchase or $10.0 million, whichever is greater. We protect our invested principal by limiting default risk, market risk and reinvestment risk. We mitigate default risk by investing in investment grade securities and by constantly positioning the portfolio to respond appropriately to a reduction in credit rating of any investment issuer, guarantor or depository to levels below the credit ratings dictated by our investment policy. The portfolio includes only marketable securities with active secondary or resale markets to ensure portfolio liquidity. Maturities of short-term investments are timed, whenever possible, to correspond with debt payments and capital investments. As of March 31, 2012, the outstanding amount in the investment portfolio was $0.3 billion, comprised mainly of money market funds with an average return of 3.13%. A hypothetical 10% change in interest rates would not be expected to have a material effect on our financial position, results of operations and cash flows over the next fiscal year.
We had variable rate debt outstanding of approximately $2.2 billion as of March 31, 2012. Variable rate debt obligations primarily consisted of borrowings under our term loan and revolving credit facilities. Interest on the $1.2 billion outstanding under our term loan facility that matures in October 2014 is based at our option on either (i) the base rate (the greater of the agent's prime rate or the federal funds rate plus 0.50%) plus a margin of 1.25%; or (ii) LIBOR plus a margin of 2.25%. Interest on the New Credit Facility, under which we had as of March 31, 2012 $487.5 million outstanding under our New Term Loan and $140.0 million outstanding under the New Revolving Credit Facility is based at our option on either (i) LIBOR plus the applicable margin for LIBOR loans ranging between 1.25% and 2.25%, based on the Company's credit ratings or (ii) the base rate (the greatest of the agent's prime rate, the federal funds rate plus 0.50% and LIBOR for a one-month interest period plus 1.00%) plus an applicable margin ranging between 0.25% and 1.25%, based on the Company's credit rating. Interest on the $377.0 million outstanding under our Asia term loans accrues at LIBOR plus 2.15% to 2.30%. Finally, our variable rate debt also includes demand notes and certain variable lines of credit. These credit lines are located throughout the world and variable interest is generally based on a spread over that country's inter-bank offering rate.
Our variable rate debt instruments create exposures for us related to interest rate risk. Primarily due to the current low interest rates a hypothetical 10% change in interest rates would not be expected to have a material effect on our financial position, results of operations and cash flows over the next fiscal year.
51
Table of Contents
As of March 31, 2012, the approximate fair value of our debt outstanding under our term loan facility that matures in October 2014 was 99.4%, of the face value of the debt obligation, and the fair value of debt outstanding under our New Term Loan was 99.0% of the face value of the debt obligation, based on broker trading prices. Our Asia term loans are not traded publicly; however, as the pricing, maturity and other pertinent terms of these loans closely approximate those of the term loan facilities described above, we estimate the respective fair values would be approximately the same as the respective term loan facilities.
FOREIGN CURRENCY EXCHANGE RISK
We transact business in various foreign countries and are, therefore, subject to risk of foreign currency exchange rate fluctuations. We have established a foreign currency risk management policy to manage this risk. To the extent possible, we manage our foreign currency exposure by evaluating and using non-financial techniques, such as currency of invoice, leading and lagging payments and receivables management. In addition, we borrow in various foreign currencies and enter into short-term foreign currency forward and swap contracts to hedge only those currency exposures associated with certain assets and liabilities, mainly accounts receivable and accounts payable, and cash flows denominated in non-functional currencies.
We endeavor to maintain a partial or fully hedged position for certain transaction exposures. These exposures are primarily, but not limited to, revenues, customer and vendor payments and inter-company balances in currencies other than the functional currency unit of the operating entity. The credit risk of our foreign currency forward and swap contracts is minimized since all contracts are with large financial institutions and accordingly, fair value adjustments related to the credit risk of the counter-party financial institution were not material. The gains and losses on forward and swap contracts generally offset the losses and gains on the assets, liabilities and transactions hedged. The fair value of currency forward and swap contracts is reported on the balance sheet. The aggregate notional amount of outstanding contracts as of March 31, 2012 amounted to $2.7 billion and the recorded fair values of the associated asset and/or liability were not material. The majority of these foreign exchange contracts expire in less than three months and all expire within one year. They will settle primarily in Brazilian real, British pound, Canadian dollar, China renminbi, Danish kroner, Euro, Hungarian forint, Israeli shekel, Japanese yen, Malaysian ringgit, Mexican peso, Singapore dollar, and U.S. dollar.
Based on our overall currency rate exposures as of March 31, 2012, including the derivative financial instruments intended to hedge the nonfunctional currency-denominated monetary assets, liabilities and cash flows, a near-term 10% appreciation or depreciation of the U.S. dollar from its cross-functional rates would not be expected to have a material effect on our financial position, results of operations and cash flows over the next fiscal year.
52

Table of Contents
ITEM 8. FINANCIAL STATEMENTS AND SUPPLEMENTARY DATA
REPORT OF INDEPENDENT REGISTERED PUBLIC ACCOUNTING FIRM
To the Board of Directors and Stockholders of Flextronics International Ltd. Singapore
We have audited the accompanying consolidated balance sheets of Flextronics International Ltd. and subsidiaries (the "Company") as of March 31, 2012 and 2011, and the related consolidated statements of operations, comprehensive income, shareholders' equity, and cash flows for each of the three years in the period ended March 31, 2012. These financial statements are the responsibility of the Company's management. Our responsibility is to express an opinion on these financial statements based on our audits.
We conducted our audits in accordance with the standards of the Public Company Accounting Oversight Board (United States). Those standards require that we plan and perform the audit to obtain reasonable assurance about whether the financial statements are free of material misstatement. An audit includes examining, on a test basis, evidence supporting the amounts and disclosures in the financial statements. An audit also includes assessing the accounting principles used and significant estimates made by management, as well as evaluating the overall financial statement presentation. We believe that our audits provide a reasonable basis for our opinion.
In our opinion, such consolidated financial statements present fairly, in all material respects, the financial position of Flextronics International Ltd. and subsidiaries as of March 31, 2012 and 2011, and the results of their operations and their cash flows for each of the three years in the period ended March 31, 2012, in conformity with accounting principles generally accepted in the United States of America.
We have also audited, in accordance with the standards of the Public Company Accounting Oversight Board (United States), the Company's internal control over financial reporting as of March 31, 2012, based on the criteria established in Internal Control—Integrated Framework issued by the Committee of Sponsoring Organizations of the Treadway Commission and our report dated May 25, 2012 expressed an unqualified opinion on the Company's internal control over financial reporting.
/s/ DELOITTE & TOUCHE LLP
San Jose, California May 25, 2012
53

Table of Contents
FLEXTRONICS INTERNATIONAL LTD.
CONSOLIDATED BALANCE SHEETS
The accompanying notes are an integral part of these consolidated financial statements.
54
As of March 31, 2012 2011
(In thousands, except share amounts)
ASSETS
Current assets: Cash and cash equivalents $ 1,518,329 $ 1,748,471 Accounts receivable, net of allowance for doubtful accounts of
$39,279 and $13,388 as of March 31, 2012 and 2011, respectively 2,602,159 2,571,912
Inventories 3,308,070 3,517,026 Current assets of discontinued operations 5,086 96,901 Other current assets 1,100,906 1,119,889
Total current assets 8,534,550 9,054,199 Property and equipment, net 2,084,148 2,084,031 Goodwill and other intangible assets, net 170,924 213,083 Long-term assets of discontinued operations 22,671 57,032 Other assets 221,511 224,807
Total assets $ 11,033,804 $ 11,633,152
LIABILITIES AND SHAREHOLDERS' EQUITY Current liabilities:
Bank borrowings, current portion of long-term debt and capital lease obligations $ 42,467 $ 21,179
Accounts payable 4,305,735 5,003,185 Accrued payroll 347,144 376,693 Current liabilities of discontinued operations 8,244 87,279 Other current liabilities 1,584,595 1,340,595
Total current liabilities 6,288,185 6,828,931 Long-term debt and capital lease obligations, net of current portion 2,157,798 2,199,195 Other liabilities 303,842 310,330 Commitments and contingencies (Note 10) Shareholders' equity
Ordinary shares, no par value; 733,979,527 and 830,745,010 issued, and 683,740,173 and 756,993,938 outstanding as of March 31, 2012 and 2011, respectively 8,292,370 8,865,556
Treasury stock, at cost; 50,239,355 and 73,751,072 shares as of March 31, 2012 and 2011, respectively (388,215 ) (523,110 )
Accumulated deficit (5,579,739 ) (6,068,504 ) Accumulated other comprehensive income (loss) (40,437 ) 20,754
Total shareholders' equity 2,283,979 2,294,696
Total liabilities and shareholders' equity $ 11,033,804 $ 11,633,152

Table of Contents
FLEXTRONICS INTERNATIONAL LTD.
CONSOLIDATED STATEMENTS OF OPERATIONS
The accompanying notes are an integral part of these consolidated financial statements.
55
Fiscal Year Ended March 31, 2012 2011 2010 (In thousands, except per share amounts) Net sales $ 29,387,656 $ 28,489,018 $ 24,009,784 Cost of sales 27,870,315 26,903,049 22,705,774 Restructuring charges — — 92,458
Gross profit 1,517,341 1,585,969 1,211,552 Selling, general and administrative expenses 880,636 804,890 755,064 Intangible amortization 55,896 70,913 89,615 Restructuring charges — — 15,070 Other charges (income), net (19,963 ) 6,267 206,895 Interest and other expense, net 36,011 75,378 155,654
Income (loss) from continuing operations before income taxes 564,761 628,521 (10,746 )
Provision for (benefit from) income taxes 54,116 22,176 (35,748 )
Income from continuing operations 510,645 606,345 25,002 Loss from discontinued operations, net of tax (21,880 ) (10,126 ) (6,408 )
Net income $ 488,765 $ 596,219 $ 18,594
Earnings per share: Income from continuing operations:
Basic $ 0.71 $ 0.78 $ 0.03
Diluted $ 0.70 $ 0.77 $ 0.03
Loss from discontinued operations: Basic $ (0.03 ) $ (0.01 ) $ (0.01 )
Diluted $ (0.03 ) $ (0.01 ) $ (0.01 )
Net income: Basic $ 0.68 $ 0.77 $ 0.02
Diluted $ 0.67 $ 0.75 $ 0.02
Weighted-average shares used in computing per share amounts: Basic 716,247 777,315 811,677
Diluted 727,807 790,192 821,112

Table of Contents
FLEXTRONICS INTERNATIONAL LTD.
CONSOLIDATED STATEMENTS OF COMPREHENSIVE INCOME
The accompanying notes are an integral part of these consolidated financial statements.
56
Fiscal Year Ended March 31, 2012 2011 2010 (In thousands) Net income $ 488,765 $ 596,219 $ 18,594 Other comprehensive income (loss):
Foreign currency translation adjustments, net of zero tax (53,616 ) 12,883 16,409 Unrealized gain (loss) on derivative instruments and other,
net of zero tax (7,575 ) 23,276 25,635
Comprehensive income $ 427,574 $ 632,378 $ 60,638
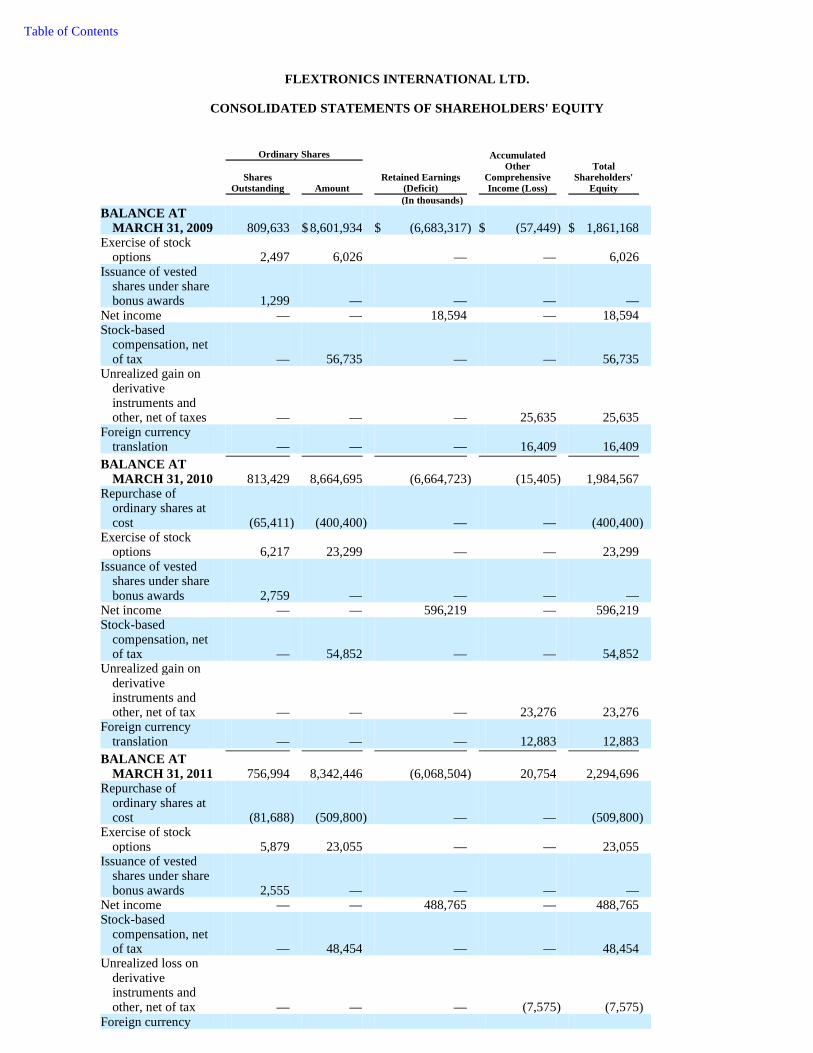
Table of Contents
FLEXTRONICS INTERNATIONAL LTD.
CONSOLIDATED STATEMENTS OF SHAREHOLDERS' EQUITY
Ordinary Shares
Accumulated Other
Comprehensive Income (Loss)
Shares
Outstanding Amount Retained Earnings
(Deficit)
Total Shareholders'
Equity (In thousands) BALANCE AT
MARCH 31, 2009 809,633 $ 8,601,934 $ (6,683,317 ) $ (57,449 ) $ 1,861,168 Exercise of stock
options 2,497 6,026 — — 6,026 Issuance of vested
shares under share bonus awards 1,299 — — — —
Net income — — 18,594 — 18,594 Stock-based
compensation, net of tax — 56,735 — — 56,735
Unrealized gain on derivative instruments and other, net of taxes — — — 25,635 25,635
Foreign currency translation — — — 16,409 16,409
BALANCE AT MARCH 31, 2010 813,429 8,664,695 (6,664,723 ) (15,405 ) 1,984,567
Repurchase of ordinary shares at cost (65,411 ) (400,400 ) — — (400,400 )
Exercise of stock options 6,217 23,299 — — 23,299
Issuance of vested shares under share bonus awards 2,759 — — — —
Net income — — 596,219 — 596,219 Stock-based
compensation, net of tax — 54,852 — — 54,852
Unrealized gain on derivative instruments and other, net of tax — — — 23,276 23,276
Foreign currency translation — — — 12,883 12,883
BALANCE AT MARCH 31, 2011 756,994 8,342,446 (6,068,504 ) 20,754 2,294,696
Repurchase of ordinary shares at cost (81,688 ) (509,800 ) — — (509,800 )
Exercise of stock options 5,879 23,055 — — 23,055
Issuance of vested shares under share bonus awards 2,555 — — — —
Net income — — 488,765 — 488,765 Stock-based
compensation, net of tax — 48,454 — — 48,454
Unrealized loss on derivative instruments and other, net of tax — — — (7,575 ) (7,575 )
Foreign currency

The accompanying notes are an integral part of these consolidated financial statements.
57
translation — — — (53,616 ) (53,616 )
BALANCE AT MARCH 31, 2012 683,740 $ 7,904,155 $ (5,579,739 ) $ (40,437 ) $ 2,283,979

Table of Contents
FLEXTRONICS INTERNATIONAL LTD.
CONSOLIDATED STATEMENTS OF CASH FLOWS
The accompanying notes are an integral part of these consolidated financial statements.
58
Fiscal Year Ended March 31, 2012 2011 2010 (In thousands) Cash flows from operating activities: Net income $ 488,765 $ 596,219 $ 18,594 Adjustments to reconcile net income to net cash
provided by operating activities: Depreciation, amortization and other impairment
charges 521,923 471,668 707,530 Provision for doubtful accounts 30,330 4,043 44,066 Non-cash other income and expenses (33,563 ) 2,831 36,583 Stock-based compensation 48,454 55,237 56,474 Deferred income taxes and other non-cash income
taxes (1,022 ) (51,198 ) (108,272 ) Changes in operating assets and liabilities, net of
acquisitions: Accounts receivable (30,249 ) 26,519 (121,194 ) Inventories 301,053 (664,738 ) 141,754 Other current and noncurrent assets 29,683 (337,057 ) 19,189 Accounts payable (750,169 ) 609,868 413,053 Other current and noncurrent liabilities 199,063 143,952 (408,861 )
Net cash provided by operating activities 804,268 857,344 798,916
Cash flows from investing activities: Purchases of property and equipment (437,191 ) (470,702 ) (234,517 ) Proceeds from the disposition of property and
equipment 49,187 76,833 58,054 Acquisition of businesses, net of cash acquired (92,257 ) (16,966 ) (75,901 ) Proceeds from divestitures of operations, net 1,398 625 — Other investments and notes receivable, net (2,501 ) (3,031 ) 260,188
Net cash provided by (used in) investing activities (481,364 ) (413,241 ) 7,824
Cash flows from financing activities: Proceeds from bank borrowings and long-term debt 2,833,704 3,471,494 792,856 Repayments of bank borrowings and long-term debt (2,389,121 ) (3,420,594 ) (1,002,668 ) Payments for early repurchase of long-term debt (480,000 ) (315,495 ) (509,486 ) Payments for repurchases of ordinary shares (509,800 ) (400,400 ) — Proceeds from exercise of stock options 23,055 23,299 6,026
Net cash used in financing activities (522,162 ) (641,696 ) (713,272 )
Effect of exchange rates on cash (30,884 ) 18,508 12,202
Net change in cash and cash equivalents (230,142 ) (179,085 ) 105,670 Cash and cash equivalents, beginning of year 1,748,471 1,927,556 1,821,886
Cash and cash equivalents, end of year $ 1,518,329 $ 1,748,471 $ 1,927,556

Table of Contents
FLEXTRONICS INTERNATIONAL LTD.
NOTES TO CONSOLIDATED FINANCIAL STATEMENTS
1. ORGANIZATION OF THE COMPANY
Flextronics International Ltd. ("Flextronics" or the "Company") was incorporated in the Republic of Singapore in May 1990. The Company's operations have expanded over the years through a combination of organic growth and acquisitions. The Company is a globally-recognized leading provider of advanced design and manufacturing services to original equipment manufacturers ("OEMs") of a broad range of products in the following businesses: data networking, telecom; mobile communication devices; Electronics Manufacturing computing; consumer electronics; industrial, semiconductor capital equipment, clean technology, aerospace and defense, white goods; automotive, and medical devices. The Company's strategy is to provide customers with a full range of cost competitive, vertically-integrated global supply chain services through which the Company can design, build, ship and service a complete packaged product for its OEM customers. OEM customers leverage the Company's services to meet their product requirements throughout the entire product life cycle.
The Company's service offerings include rigid and flexible printed circuit board fabrication, systems assembly and manufacturing (including enclosures, testing services, materials procurement and inventory management), logistics, after-sales services (including product repair, warranty services, re-manufacturing and maintenance) and multiple component product offerings. Additionally, the Company provides a comprehensive range of value-added design and engineering services that are tailored to the various markets and needs of its customers.
2. SUMMARY OF ACCOUNTING POLICIES
Basis of Presentation and Principles of Consolidation
The Company's third fiscal quarter ends on December 31, and the fourth fiscal quarter and year ends on March 31 of each year. The first fiscal quarter ended on July 1, 2011, July 2, 2010 and July 3, 2009, respectively and the second fiscal quarter ended on September 30, 2011, October 1, 2010 and October 2, 2009, respectively. Amounts included in the consolidated financial statements are expressed in U.S. dollars unless otherwise designated.
The accompanying consolidated financial statements include the accounts of Flextronics and its majority-owned subsidiaries, after elimination of intercompany accounts and transactions. The Company consolidates all majority-owned subsidiaries and investments in entities in which the Company has a controlling interest. For consolidated majority-owned subsidiaries in which the Company owns less than 100%, the Company recognizes a noncontrolling interest for the ownership of the noncontrolling owners. As of March 31, 2012 and 2011, the noncontrolling interest was not material. The associated noncontrolling owners' interest in the income or losses of these companies has not been material to the Company's results of operations for any of the periods presented, and has been classified within interest and other expense, net, in the consolidated statements of operations.
On March 2, 2012, the Company entered into a definitive agreement with Tessera Technologies, Inc., and DigitalOptics Corporation (DOC), a wholly-owned subsidiary of Tessera Technologies. Under the terms of the definitive agreement DOC will acquire certain assets of Flextronics' Vista Point Technologies camera module business, including intellectual property and the China-based manufacturing operations. In accordance with the accounting guidance, the camera modules business represent a separate asset group and the divestiture qualifies as discontinued operations, and accordingly, the Company has reported the results of operations and financial position of this business in discontinued operations within the statements of operations and the balance sheets for all periods presented.
59

Table of Contents
FLEXTRONICS INTERNATIONAL LTD.
NOTES TO CONSOLIDATED FINANCIAL STATEMENTS (Continu ed)
2. SUMMARY OF ACCOUNTING POLICIES (Continued)
Use of Estimates
The preparation of financial statements in conformity with accounting principles generally accepted in the United States of America ("U.S. GAAP" or "GAAP") requires management to make estimates and assumptions that affect the reported amounts of assets and liabilities, the disclosure of contingent assets and liabilities at the date of the financial statements, and the reported amounts of revenues and expenses during the reporting period. Estimates are used in accounting for, among other things: allowances for doubtful accounts; inventory write-downs; valuation allowances for deferred tax assets; uncertain tax positions; valuation and useful lives of long-lived assets including property, equipment, intangible assets and goodwill; asset impairments; fair values of financial instruments including investments, notes receivable and derivative instruments; restructuring charges; contingencies; fair values of assets and liabilities obtained in business combinations and the fair values of stock options and share bonus awards granted under the Company's stock-based compensation plans. Actual results may differ from previously estimated amounts, and such differences may be material to the consolidated financial statements. Estimates and assumptions are reviewed periodically, and the effects of revisions are reflected in the period they occur.
Translation of Foreign Currencies
The financial position and results of operations for certain of the Company's subsidiaries are measured using a currency other than the U.S. dollar as their functional currency. Accordingly, all assets and liabilities for these subsidiaries are translated into U.S. dollars at the current exchange rates as of the respective balance sheet dates. Revenue and expense items are translated at the average exchange rates prevailing during the period. Cumulative gains and losses from the translation of these subsidiaries' financial statements are reported as a separate component of shareholders' equity. Foreign exchange gains and losses arising from transactions denominated in a currency other than the functional currency of the entity involved, and re-measurement adjustments for foreign operations where the U.S. dollar is the functional currency, are included in operating results. Non-functional currency transaction gains and losses, and re-measurement adjustments were not material to the Company's consolidated results of operations for any of the periods presented, and have been classified as a component of interest and other expense, net in the consolidated statements of operations.
Revenue Recognition
The Company recognizes manufacturing revenue when it ships goods or the goods are received by its customer, title and risk of ownership have passed, the price to the buyer is fixed or determinable and recoverability is reasonably assured. Generally, there are no formal substantive customer acceptance requirements or further obligations related to manufacturing services. If such requirements or obligations exist, then the Company recognizes the related revenues at the time when such requirements are completed and the obligations are fulfilled. The Company makes provisions for estimated sales returns and other adjustments at the time revenue is recognized based upon contractual terms and an analysis of historical returns. These provisions were not material to the consolidated financial statements for any of the periods presented.
The Company provides services for its customers that range from contract design to original product design to repair services. For contract design services the customer purchases engineering and development services on a time and materials basis. For original product design services the Company
60
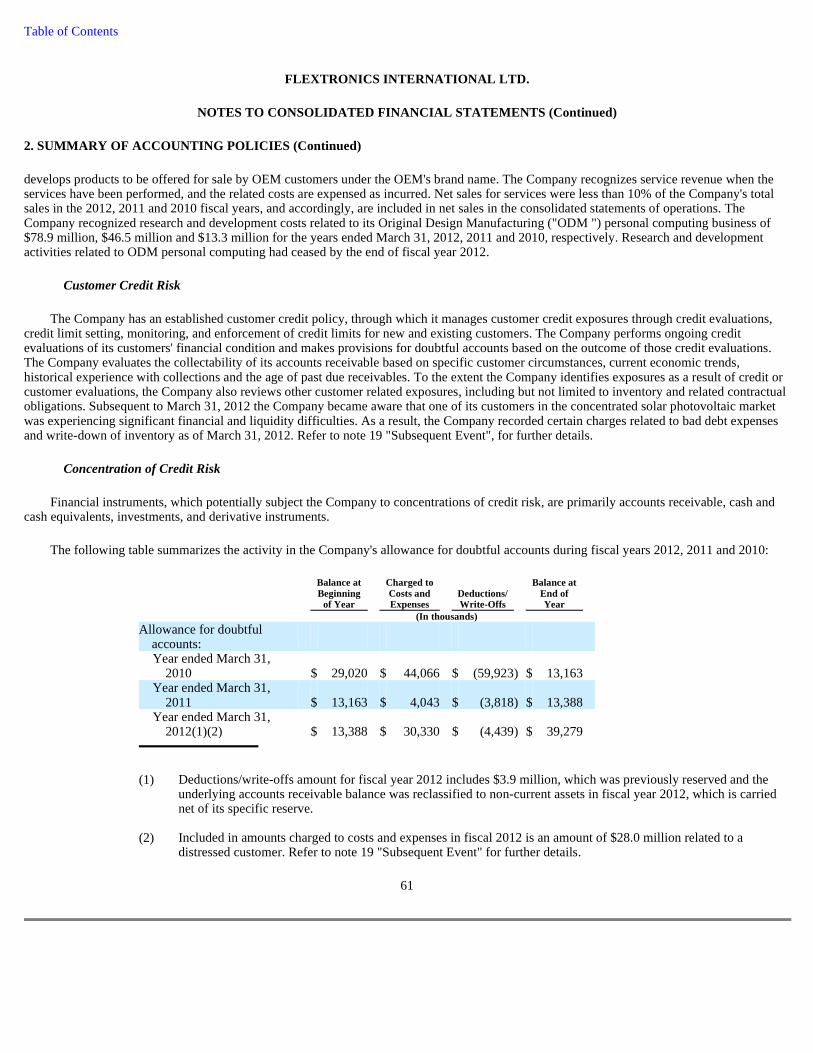
Table of Contents
FLEXTRONICS INTERNATIONAL LTD.
NOTES TO CONSOLIDATED FINANCIAL STATEMENTS (Continu ed)
2. SUMMARY OF ACCOUNTING POLICIES (Continued)
develops products to be offered for sale by OEM customers under the OEM's brand name. The Company recognizes service revenue when the services have been performed, and the related costs are expensed as incurred. Net sales for services were less than 10% of the Company's total sales in the 2012, 2011 and 2010 fiscal years, and accordingly, are included in net sales in the consolidated statements of operations. The Company recognized research and development costs related to its Original Design Manufacturing ("ODM ") personal computing business of $78.9 million, $46.5 million and $13.3 million for the years ended March 31, 2012, 2011 and 2010, respectively. Research and development activities related to ODM personal computing had ceased by the end of fiscal year 2012.
Customer Credit Risk
The Company has an established customer credit policy, through which it manages customer credit exposures through credit evaluations, credit limit setting, monitoring, and enforcement of credit limits for new and existing customers. The Company performs ongoing credit evaluations of its customers' financial condition and makes provisions for doubtful accounts based on the outcome of those credit evaluations. The Company evaluates the collectability of its accounts receivable based on specific customer circumstances, current economic trends, historical experience with collections and the age of past due receivables. To the extent the Company identifies exposures as a result of credit or customer evaluations, the Company also reviews other customer related exposures, including but not limited to inventory and related contractual obligations. Subsequent to March 31, 2012 the Company became aware that one of its customers in the concentrated solar photovoltaic market was experiencing significant financial and liquidity difficulties. As a result, the Company recorded certain charges related to bad debt expenses and write-down of inventory as of March 31, 2012. Refer to note 19 "Subsequent Event", for further details.
Concentration of Credit Risk
Financial instruments, which potentially subject the Company to concentrations of credit risk, are primarily accounts receivable, cash and cash equivalents, investments, and derivative instruments.
The following table summarizes the activity in the Company's allowance for doubtful accounts during fiscal years 2012, 2011 and 2010:
61
Balance at Beginning
of Year
Charged to Costs and Expenses
Deductions/ Write-Offs
Balance at End of Year
(In thousands) Allowance for doubtful
accounts: Year ended March 31,
2010 $ 29,020 $ 44,066 $ (59,923 ) $ 13,163 Year ended March 31,
2011 $ 13,163 $ 4,043 $ (3,818 ) $ 13,388 Year ended March 31,
2012(1)(2) $ 13,388 $ 30,330 $ (4,439 ) $ 39,279
(1) Deductions/write-offs amount for fiscal year 2012 includes $3.9 million, which was previously reserved and the underlying accounts receivable balance was reclassified to non-current assets in fiscal year 2012, which is carried net of its specific reserve.
(2) Included in amounts charged to costs and expenses in fiscal 2012 is an amount of $28.0 million related to a distressed customer. Refer to note 19 "Subsequent Event" for further details.

Table of Contents
FLEXTRONICS INTERNATIONAL LTD.
NOTES TO CONSOLIDATED FINANCIAL STATEMENTS (Continu ed)
2. SUMMARY OF ACCOUNTING POLICIES (Continued)
Two customers accounted for approximately 11% and 10%, respectively of the Company's net sales in fiscal 2012. One of these customers accounted for approximately 11% of the Company's net sales in fiscal years 2011 and the other customer accounted for 10% of net sales of the Company in fiscal year 2010. The Company's ten largest customers accounted for approximately 55%, 52% and 47% of its net sales, in fiscal years 2012, 2011 and 2010, respectively. As of March 31, 2012 and 2011, no single customer accounted for greater than 10% of the Company's total accounts receivable.
The Company maintains cash and cash equivalents with various financial institutions that management believes to be of high credit quality. These financial institutions are located in many different locations throughout the world. The Company's cash equivalents are primarily comprised of cash deposited in checking and money market accounts. The Company's investment policy limits the amount of credit exposure to 20% of the issuer's or the fund's total assets measured at the time of purchase or $10.0 million, whichever is greater.
The amount subject to credit risk related to derivative instruments is generally limited to the amount, if any, by which a counterparty's obligations exceed the obligations of the Company with that counterparty. To manage counterparty risk, the Company limits its derivative transactions to those with recognized financial institutions. See additional discussion of derivatives at note 7 to the consolidated financial statements.
Cash and Cash Equivalents
All highly liquid investments with maturities of three months or less from original dates of purchase are carried at cost, which approximates fair market value, and are considered to be cash equivalents. Cash and cash equivalents consist of cash deposited in checking accounts, money market funds and time deposits.
Cash and cash equivalents consisted of the following:
62
As of March 31, 2012 2011 (In thousands) Cash and bank balances $ 1,174,423 $ 1,372,711 Money market funds and time deposits 343,906 375,760
$ 1,518,329 $ 1,748,471
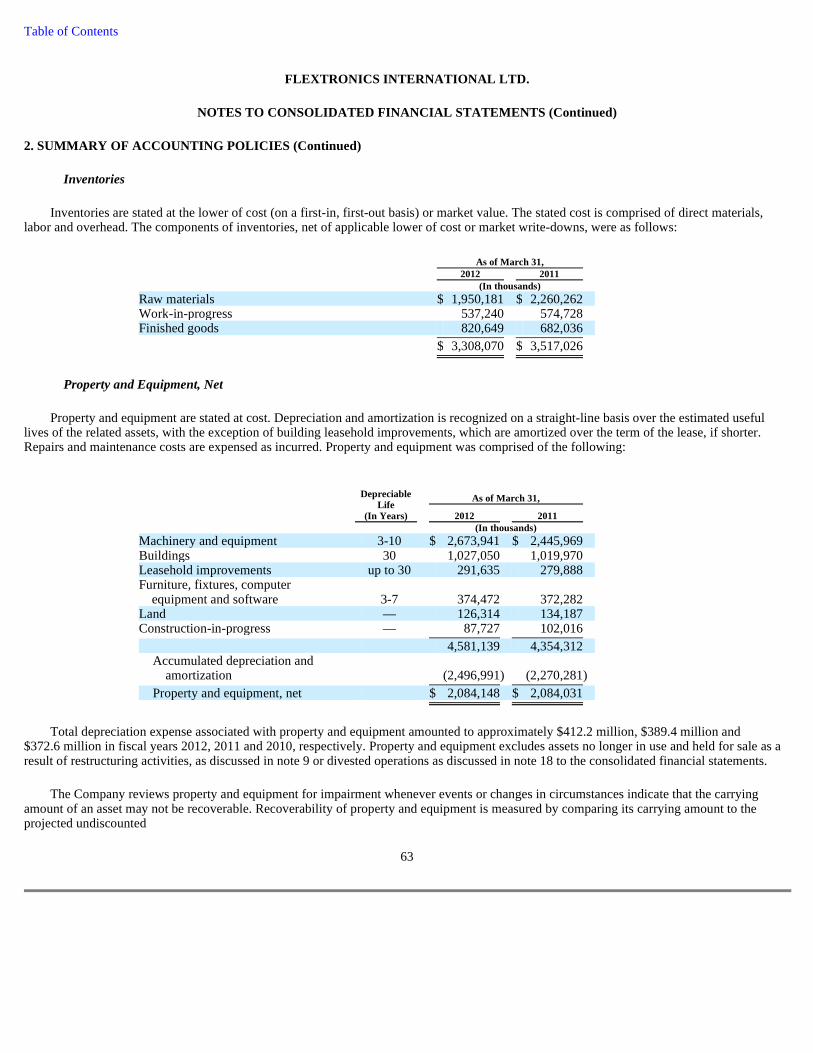
Table of Contents
FLEXTRONICS INTERNATIONAL LTD.
NOTES TO CONSOLIDATED FINANCIAL STATEMENTS (Continu ed)
2. SUMMARY OF ACCOUNTING POLICIES (Continued)
Inventories
Inventories are stated at the lower of cost (on a first-in, first-out basis) or market value. The stated cost is comprised of direct materials, labor and overhead. The components of inventories, net of applicable lower of cost or market write-downs, were as follows:
Property and Equipment, Net
Property and equipment are stated at cost. Depreciation and amortization is recognized on a straight-line basis over the estimated useful lives of the related assets, with the exception of building leasehold improvements, which are amortized over the term of the lease, if shorter. Repairs and maintenance costs are expensed as incurred. Property and equipment was comprised of the following:
Total depreciation expense associated with property and equipment amounted to approximately $412.2 million, $389.4 million and $372.6 million in fiscal years 2012, 2011 and 2010, respectively. Property and equipment excludes assets no longer in use and held for sale as a result of restructuring activities, as discussed in note 9 or divested operations as discussed in note 18 to the consolidated financial statements.
The Company reviews property and equipment for impairment whenever events or changes in circumstances indicate that the carrying amount of an asset may not be recoverable. Recoverability of property and equipment is measured by comparing its carrying amount to the projected undiscounted
63
As of March 31, 2012 2011 (In thousands) Raw materials $ 1,950,181 $ 2,260,262 Work-in-progress 537,240 574,728 Finished goods 820,649 682,036
$ 3,308,070 $ 3,517,026
As of March 31,
Depreciable Life
(In Years)
2012 2011 (In thousands) Machinery and equipment 3-10 $ 2,673,941 $ 2,445,969 Buildings 30 1,027,050 1,019,970 Leasehold improvements up to 30 291,635 279,888 Furniture, fixtures, computer
equipment and software 3-7 374,472 372,282 Land — 126,314 134,187 Construction-in-progress — 87,727 102,016
4,581,139 4,354,312 Accumulated depreciation and
amortization (2,496,991 ) (2,270,281 )
Property and equipment, net $ 2,084,148 $ 2,084,031

Table of Contents
FLEXTRONICS INTERNATIONAL LTD.
NOTES TO CONSOLIDATED FINANCIAL STATEMENTS (Continu ed)
2. SUMMARY OF ACCOUNTING POLICIES (Continued)
cash flows the property and equipment are expected to generate. An impairment loss is recognized when the carrying amount of a long-lived asset exceeds its fair value. Refer to note 12, "Restructuring Charges" for a discussion of impairment charges recorded in fiscal year 2010 and note 18, "Discontinued Operations" for a discussion of impairment charges recorded in fiscal year 2012.
Deferred Income Taxes
The Company provides for income taxes in accordance with the asset and liability method of accounting for income taxes. Under this method, deferred income taxes are recognized for the tax consequences of temporary differences between the carrying amount and the tax basis of existing assets and liabilities by applying the applicable statutory tax rate to such differences.
Accounting for Business and Asset Acquisitions
The Company has actively pursued business and asset acquisitions, which are accounted for using the acquisition method of accounting. The fair value of the net assets acquired and the results of the acquired businesses are included in the Company's consolidated financial statements from the acquisition dates forward. The Company is required to make estimates and assumptions that affect the reported amounts of assets and liabilities and results of operations during the reporting period. Estimates are used in accounting for, among other things, the fair value of acquired net operating assets, property and equipment, intangible assets and related deferred tax liabilities, useful lives of plant and equipment and amortizable lives for acquired intangible assets. Any excess of the purchase consideration over the identified fair value of the assets and liabilities acquired is recognized as goodwill.
The Company estimates the preliminary fair value of acquired assets and liabilities as of the date of acquisition based on information available at that time. Contingent consideration is recorded at fair value as of the date of the acquisition with subsequent adjustments recorded in earnings. Changes to valuation allowances on acquired deferred tax assets are recognized in the provision for, or benefit from, income taxes. The valuation of these tangible and identifiable intangible assets and liabilities is subject to further management review and may change materially between the preliminary allocation and end of the purchase price allocation period. Any changes in these estimates may have a material effect on the Company's consolidated operating results or financial position.
Goodwill and Other Intangible Assets
Goodwill is tested for impairment on an annual basis, and whenever events or changes in circumstances indicate that the carrying amount of goodwill may not be recoverable. Recoverability of goodwill is measured at the reporting unit level by comparing the reporting unit's carrying amount, including goodwill, to the fair value of the reporting unit, which is measured based upon, among other factors, market multiples for comparable companies as well as a discounted cash flow analysis. The Company has one reporting unit: EMS. If the recorded value of the assets, including goodwill, and liabilities ("net book value") of the reporting unit exceeds its fair value, an impairment loss may be required to be recognized. Further, to the extent the net book value of the Company as a whole is greater than its market capitalization, all, or a significant portion of its goodwill may be considered impaired. The Company completed its annual impairment test during its fourth quarter of fiscal year
64

Table of Contents
FLEXTRONICS INTERNATIONAL LTD.
NOTES TO CONSOLIDATED FINANCIAL STATEMENTS (Continu ed)
2. SUMMARY OF ACCOUNTING POLICIES (Continued)
2012 and determined that no impairment existed as of the date of the impairment test. The fair value of the reporting unit exceeded the carrying value.
The following table summarizes the activity in the Company's goodwill account during fiscal years 2012 and 2011:
The Company's acquired intangible assets are subject to amortization over their estimated useful lives and are reviewed for impairment whenever events or changes in circumstances indicate that the carrying amount of an intangible asset may not be recoverable. An impairment loss is recognized when the carrying amount of an intangible asset exceeds its fair value. The Company reviewed the carrying value of its intangible assets as of the year ended March 31, 2012 and concluded that such amounts continued to be recoverable.
Intangible assets are comprised of customer-related intangible assets, which primarily include contractual agreements and customer relationships; and licenses and other intangible assets, which is primarily comprised of licenses and also includes patents and trademarks, and developed technologies. Generally customer-related intangible assets are amortized on an accelerated method based on expected cash flows, generally over a period of up to eight years, and licenses and other intangible assets generally over a period of up to seven years. No residual value is estimated for any intangible assets. During fiscal years 2012 and 2011, the Company did not have any material additions to intangible assets. The fair value of the Company's intangible assets purchased through business
65
As of March 31, 2012 2011 (In thousands) Balance, beginning of the year, net of accumulated
impairment of $5,949,977 $ 93,207 $ 84,360 Additions(1) 8,607 7,119 Purchase accounting adjustments and reclassification to
other intangibles(2) 601 1,170 Foreign currency translation adjustments (745 ) 558
Balance, end of period, net of accumulated impairment of $5,949,977 $ 101,670 $ 93,207
(1) For fiscal years 2012 and 2011, additions were attributable to certain acquisitions that were not individually, nor in the aggregate, significant to the Company. Refer to the discussion of the Company's acquisitions in note 15, "Business and Asset Acquisitions and Divestitures."
(2) Includes adjustments and reclassifications resulting from management's review and finalization of the valuation of assets and liabilities acquired through certain business combinations completed in a period subsequent to the respective acquisition, based on management's estimates and were not individually, nor in the aggregate, significant to the Company.

Table of Contents
FLEXTRONICS INTERNATIONAL LTD.
NOTES TO CONSOLIDATED FINANCIAL STATEMENTS (Continu ed)
2. SUMMARY OF ACCOUNTING POLICIES (Continued)
combinations is principally determined based on management's estimates of cash flow and recoverability. The components of acquired intangible assets are as follows:
The gross carrying amounts of intangible assets are removed when the recorded amounts have been fully amortized, which is the primary reason for the periodic decrease in the gross carrying amount and accumulated amortization of intangible assets. Total intangible asset amortization expense recognized during fiscal years 2012, 2011 and 2010 was $55.9 million, $70.9 million and $89.6 million, respectively. As of March 31, 2012, the weighted-average remaining useful lives of the Company's intangible assets were approximately 1.8 years and 3.0 years for customer-related intangibles, and licenses and other intangible assets, respectively. The estimated future annual amortization expense for acquired intangible assets is as follows:
Derivative Instruments and Hedging Activities
All derivative instruments are recognized on the consolidated balance sheets at fair value. If the derivative instrument is designated as a cash flow hedge, effectiveness is tested monthly using a regression analysis of the change in the spot currency rates and the change in the present value of the spot currency rates. The spot currency rates are discounted to present value using functional currency LIBOR rates over the maximum length of the hedge period. The effective portion of changes in the fair value of the derivative instrument (excluding time value) is recognized in shareholders' equity as a separate component of accumulated other comprehensive income (loss), and recognized in the consolidated statements of operations when the hedged item affects earnings. Ineffective and excluded portions of changes in the fair value of cash flow hedges are recognized in earnings immediately. If the derivative instrument is designated as a fair value hedge, the changes in the fair value of the derivative instrument and of the hedged item attributable to the hedged risk are recognized in earnings in the current period. Additional information is included in note 7 to the consolidated financial statements.
66
As of March 31, 2012 As of March 31, 2011
Gross Carrying Amount
Accumulated Amortization
Net Carrying Amount
Gross Carrying Amount
Accumulated Amortization
Net Carrying Amount
(In thousands) (In thousands) Intangible assets:
Customer-related intangibles $ 276,681 $ (221,238 ) $ 55,443 $ 378,412 $ (283,732 ) $ 94,680
Licenses and other intangibles 22,740 (8,929 ) 13,811 44,915 (19,719 ) 25,196
Total $ 299,421 $ (230,167 ) $ 69,254 $ 423,327 $ (303,451 ) $ 119,876
Fiscal Year Ending March 31, Amount (In thousands) 2013 $ 30,785 2014 20,155 2015 10,144 2016 4,809 2017 1,961 Thereafter 1,400
Total amortization expense $ 69,254

Table of Contents
FLEXTRONICS INTERNATIONAL LTD.
NOTES TO CONSOLIDATED FINANCIAL STATEMENTS (Continu ed)
2. SUMMARY OF ACCOUNTING POLICIES (Continued)
Other Current Assets / Other Assets
Other current assets includes approximately $514.9 million and $460.0 million as of March 31, 2012 and 2011, respectively for the deferred purchase price receivable from our Global and North American Asset-Backed Securitization programs. See note 8 for additional information regarding the Company's participation in its trade receivables securitization programs.
The Company has certain equity investments in, and notes receivable from, non-publicly traded companies and an equity investment in a publicly traded company, which are included within other assets in the Company's consolidated balance sheets. Non-majority-owned investments are accounted for using the equity method when the Company has an ownership percentage equal to or greater than 20% but less than 50%, or has the ability to significantly influence the operating decisions of the issuer; otherwise the cost method is used. The Company monitors these investments for impairment indicators and makes appropriate reductions in carrying values as required. Fair values of these investments, when required, are estimated using unobservable inputs, primarily discounted cash flow projections.
As of March 31, 2012 and 2011, the Company's equity investments in non-majority owned companies totaled $38.6 million and $34.0 million, respectively. The equity in the earnings or losses of the Company's equity method investments were not material to the consolidated results of operations for any period presented in these consolidated financial statements.
During fiscal 2011, the Company recognized a gain of approximately $18.6 million, associated with the sale of an equity investment that was previously fully impaired, which is included in other charges (income), net in the consolidated statements of operations.
During fiscal 2010, the Company recognized impairment charges related to the Company's equity investments and notes receivable amounting to approximately $199.4 million, which are included in other charges (income), net in the consolidated statements of operations.
Other Current Liabilities
Other current liabilities includes deferred revenue amounting to $329.6 million and $110.1 million and customer working capital advances amounting to $326.6 million and $296.3 million as of March 31, 2012 and 2011, respectively.
Restructuring Charges
The Company recognizes restructuring charges related to its plans to close or consolidate excess manufacturing and administrative facilities. In connection with these activities, the Company records restructuring charges for employee termination costs, long-lived asset impairment and other exit-related costs.
The recognition of restructuring charges requires the Company to make certain judgments and estimates regarding the nature, timing and amount of costs associated with the planned exit activity. To the extent the Company's actual results differ from its estimates and assumptions, the Company may be required to revise the estimates of future liabilities, requiring the recognition of additional restructuring charges or the reduction of liabilities already recognized. Such changes to previously estimated amounts may be material to the consolidated financial statements. At the end of each reporting period, the Company evaluates the remaining accrued balances to ensure that no excess accruals are retained and
67

Table of Contents
FLEXTRONICS INTERNATIONAL LTD.
NOTES TO CONSOLIDATED FINANCIAL STATEMENTS (Continu ed)
2. SUMMARY OF ACCOUNTING POLICIES (Continued)
the utilization of the provisions are for their intended purpose in accordance with developed exit plans. See note 12 for additional information regarding restructuring charges.
Recent Accounting Pronouncements
In December 2011, the FASB issued guidance which requires an entity to disclose information about offsetting and related arrangements to enable financial statement users to evaluate the effect or potential effect of netting arrangements, including rights of setoff associated with the entity's recognized financial assets and liabilities, on the entity's financial position. The new disclosures will enable financial statement users to compare balance sheets prepared under U.S. GAAP and International Financial Reporting Standards (IFRS), which are subject to different offsetting models. The disclosures will be limited to financial instruments (and derivatives) subject to enforceable master netting arrangements or similar agreements. Similar agreements include derivative clearing agreements, global master repurchase agreements, and global master securities lending agreements. Financial instruments and transactions that will be subject to the disclosure requirements may include derivatives, repurchase and reverse repurchase agreements, and securities lending and borrowing arrangements. An entity should provide the disclosures required by those amendments retrospectively for all comparative periods presented. The guidance is effective for the Company beginning in fiscal 2014. The Company is currently evaluating the potential impact, if any, of the adoption of this guidance on its consolidated financial statements.
In September 2011, the FASB revised guidance for testing goodwill for impairment. Under the revised guidance, entities testing goodwill for impairment have the option of performing a qualitative assessment before calculating the fair value of a reporting unit in step one of the goodwill impairment test. If entities determine, on the basis of qualitative factors, that the fair value of a reporting unit is more likely than not less than the carrying amount, the two-step impairment test would be required. Otherwise, further testing would not be needed. The guidance is effective for the Company beginning in the first quarter of fiscal 2013.
In June 2011, the FASB issued a new accounting standard which revises the manner in which entities present comprehensive income in their financial statements. The new guidance removes the presentation options in ASC 220 and requires entities to report components of comprehensive income in either (1) a continuous statement of comprehensive income or (2) two separate but consecutive statements. For the Company, this new guidance is effective as of April 1, 2012.
In May 2011, the FASB amended fair value measurement and disclosure guidance to achieve convergence with IFRS. The amended guidance modifies the measurement of fair value, clarifies verbiage, and changes disclosure or other requirements in US GAAP and IFRS. The guidance was effective for the Company as of January 1, 2012 and did not have a material impact on the Company's consolidated balance sheets, statements of operations, cash flows and shareholders' equity.
In October 2009, the FASB issued amendments to the accounting and disclosure requirements for revenue recognition. These amendments modify the criteria for recognizing revenue in multiple element arrangements. The Company adopted the provisions of this guidance prospectively to new or materially modified arrangements beginning April 1, 2011. The adoption of this new guidance did not have a material impact on the Company's consolidated financial statements.
68

Table of Contents
FLEXTRONICS INTERNATIONAL LTD.
NOTES TO CONSOLIDATED FINANCIAL STATEMENTS (Continu ed)
3. SHARE-BASED COMPENSATION
Equity Compensation Plans
During fiscal year 2012, the Company granted equity compensation awards under the 2010 Equity Incentive Plan (the "2010 Plan"). As of March 31, 2012, the Company had approximately 51.7 million shares available for grants under the 2010 Plan. Options issued to employees under the 2010 Plan generally vest over four years and expire seven years from the date of grant. Options granted to non-employee directors expire five years from the date of grant.
The exercise price of options granted to employees is determined by the Company's Board of Directors or the Compensation Committee and may not be less than the closing price of the Company's ordinary shares on the date of grant.
The Company also grants share bonus awards under its equity compensation plan. Share bonus awards are rights to acquire a specified number of ordinary shares for no cash consideration in exchange for continued service with the Company. Share bonus awards generally vest in installments over a three to five year period and unvested share bonus awards are forfeited upon termination of employment. Vesting for certain share bonus awards is contingent upon both service and market conditions.
Share-Based Compensation Expense
The following table summarizes the Company's share-based compensation expense:
As required by the authoritative guidance for stock-based compensation, management made an estimate of expected forfeitures and is recognizing compensation costs only for those equity awards expected to vest. When estimating forfeitures, the Company considers voluntary termination behavior as well as an analysis of actual forfeitures. Total share-based compensation capitalized as part of inventory during the fiscal years ended March 31, 2012 and 2011 was not material.
As of March 31, 2012, the total unrecognized compensation cost related to unvested share options granted to employees under the Company's equity compensation plans was approximately $6.7 million, net of estimated forfeitures. This cost will be amortized on a straight-line basis over a weighted-average period of approximately 0.7 years and will be adjusted for estimated forfeitures. As of March 31, 2012, the total unrecognized compensation cost related to unvested share bonus awards granted to employees was approximately $63.7 million, net of estimated forfeitures. This cost will be amortized generally on a straight-line basis over a weighted-average period of approximately 2.6 years and will be adjusted for estimated forfeitures. Approximately $10.7 million of the unrecognized compensation cost, net of forfeitures, is related to share bonus awards granted to certain key employees whereby vesting is contingent on meeting a certain market condition.
69
Fiscal Year Ended March 31, 2012 2011 2010 (In thousands) Cost of sales $ 7,446 $ 10,249 $ 10,847 Selling, general and administrative expenses 41,008 44,988 45,627
Total share-based compensation expense $ 48,454 $ 55,237 $ 56,474

Table of Contents
FLEXTRONICS INTERNATIONAL LTD.
NOTES TO CONSOLIDATED FINANCIAL STATEMENTS (Continu ed)
3. SHARE-BASED COMPENSATION (Continued)
Cash flows resulting from excess tax benefits (tax benefits related to the excess of proceeds from employee exercises of share options over the share-based compensation cost recognized for those options) are classified as financing cash flows. During fiscal years 2012, 2011 and 2010, the Company did not recognize any excess tax benefits as a financing cash inflow.
Determining Fair Value
Valuation and Amortization Method —The Company estimates the fair value of share options granted using the Black-Scholes valuation method and a single option award approach. This fair value is then amortized on a straight-line basis over the requisite service periods of the awards, which is generally the vesting period. The fair market value of share bonus awards granted, other than those awards with a market condition, is the closing price of the Company's ordinary shares on the date of grant and is generally recognized as compensation expense on a straight-line basis over the respective vesting period. For share bonus awards whereby vesting is contingent on meeting certain market conditions, the fair value is determined using a Monte Carlo simulation.
Expected Term —The Company's expected term used in the Black-Scholes valuation method represents the period that the Company's share options are expected to be outstanding and is determined based on historical experience of similar awards, giving consideration to the contractual terms of the share options, vesting schedules and expectations of future employee behavior as influenced by changes to the terms of its share options.
Expected Volatility —The Company's expected volatility used in the Black-Scholes valuation method is derived from a combination of implied volatility related to publicly traded options to purchase Flextronics ordinary shares and historical variability in the Company's periodic share price.
Expected Dividend —The Company has never paid dividends on its ordinary shares and currently does not intend to do so in the near term, and accordingly, the dividend yield percentage is zero for all periods.
Risk-Free Interest Rate —The Company bases the risk-free interest rate used in the Black-Scholes valuation method on the implied yield currently available on U.S. Treasury constant maturities issued with a term equivalent to the expected term of the option.
The fair value of the Company's share options granted to employees for fiscal years 2012, 2011 and 2010, other than those granted in connection with the option exchange in fiscal year 2010 and those with market criteria discussed below, was estimated using the following weighted-average assumptions:
Options granted during the 2012, 2011 and 2010 fiscal years had contractual lives of seven years.
70
Fiscal Year Ended March 31, 2012 2011 2010 Expected term 4.1 years 4.1 years 4.5 years Expected volatility 46.9 % 46.9 % 53.8 % Expected dividends 0.0 % 0.0 % 0.0 % Risk-free interest rate 1.1 % 1.6 % 1.3 % Weighted-average fair value $2.57 $2.80 $2.75

Table of Contents
FLEXTRONICS INTERNATIONAL LTD.
NOTES TO CONSOLIDATED FINANCIAL STATEMENTS (Continu ed)
3. SHARE-BASED COMPENSATION (Continued)
Share-Based Awards Activity
The following is a summary of option activity for the Company's equity compensation plans, ("Price" reflects the weighted-average exercise price):
On August 11, 2009, the Company granted approximately 16.9 million replacement options with an exercise price of $5.57 and a contractual life of 7 years in exchange for approximately 27.9 million existing share options at an exchange ratio commensurate to the surrendered option's exercise price. The weighted average vesting period of the replacement options was approximately 1.6 years. The exchange was accounted for as a modification of the existing option awards tendered in the exchange. The resulting expense was insignificant and recognized primarily through fiscal year 2011.
The aggregate intrinsic value of options exercised (calculated as the difference between the exercise price of the underlying award and the price of the Company's ordinary shares determined as of the time of option exercise for options exercised in-the-money) under the Company's equity compensation plans was $17.1 million, $22.9 million and $10.3 million during fiscal years 2012, 2011 and 2010, respectively.
Cash received from option exercises was $23.1 million, $23.3 million and $6.0 million for fiscal years 2012, 2011 and 2010, respectively.
71
Fiscal Year Ended March 31, 2012 2011 2010 Options Price Options Price Options Price Outstanding, beginning of fiscal year 53,942,458 $ 7.61 62,868,569 $ 7.16 81,927,879 $ 9.13
Granted 599,800 6.80 2,063,748 7.21 869,600 6.17 Granted under option exchange program — — — — 16,867,452 5.57 Exercised (5,879,405 ) 3.92 (6,215,867 ) 7.44 (2,496,254 ) 6.54 Forfeited (4,729,193 ) 10.45 (4,773,992 ) 6.55 (6,376,879 ) 9.50 Cancelled under option exchange program — — — — (27,923,229 ) 11.85
Outstanding, end of fiscal year 43,933,660 $ 7.78 53,942,458 $ 7.61 62,868,569 $ 7.16
Options exercisable, end of fiscal year 37,021,049 $ 8.44 34,237,404 $ 9.23 24,989,665 $ 10.71

Table of Contents
FLEXTRONICS INTERNATIONAL LTD.
NOTES TO CONSOLIDATED FINANCIAL STATEMENTS (Continu ed)
3. SHARE-BASED COMPENSATION (Continued)
The following table presents the composition of options outstanding and exercisable as of March 31, 2012:
As of March 31, 2012, the aggregate intrinsic value for options outstanding, options vested and expected to vest (which includes adjustments for expected forfeitures), and options exercisable were $70.7 million, $70.2 million and $48.3 million, respectively. The aggregate intrinsic value is calculated as the difference between the exercise price of the underlying awards and the quoted price of the Company's ordinary shares as of March 31, 2012 for the approximately 21.6 million options that were in-the-money at March 31, 2012. As of March 31, 2012, the weighted average remaining contractual life for options exercisable was 3.14 years.
The following table summarizes the Company's share bonus award activity ("Price" reflects the weighted-average grant-date fair value):
Of the 16.0 million unvested share bonus awards outstanding as of the year ended March 31, 2012, approximately 2.3 million represents the target amount of grants made to certain key employees whereby vesting is contingent on meeting a certain market condition. The number of shares that ultimately will vest are based on a measurement of Flextronics' total shareholder return against the
72
Options Outstanding
Weighted Average
Remaining Contractual
Life (In Years)
Options Exercisable
Range of Exercise Prices
Number of Shares
Outstanding
Weighted Average Exercise
Price
Number of Shares
Exercisable
Weighted Average Exercise
Price $ 1.94 - $ 2.26 10,670,434 3.72 $ 2.19 6,645,256 $ 2.18 $ 3.39 - $ 5.75 9,504,083 4.34 5.55 8,454,974 5.56 $ 5.87 - $ 7.07 1,141,567 3.21 6.27 721,828 6.16 $ 7.08 - $10.59 11,701,167 2.64 9.60 10,282,582 9.75 $10.67 - $11.41 1,255,412 3.81 11.20 1,255,412 11.20 $11.53 - $13.98 6,979,385 2.87 12.24 6,979,385 12.24 $14.34 - $23.02 2,681,612 1.94 17.43 2,681,612 17.43
$ 1.94 - $23.02 43,933,660 3.31 $ 7.78 37,021,049 $ 8.44
Options vested and expected to vest 43,668,229 3.30 $ 7.79
Fiscal Year Ended March 31, 2012 2011 2010 Shares Price Shares Price Shares Price Unvested share bonus
awards outstanding, beginning of fiscal year 13,801,942 $ 8.04 8,801,609 $ 10.31 10,456,905 $ 10.31 Granted 9,213,456 6.78 9,739,375 7.01 523,229 7.08 Vested (2,555,165 ) 9.34 (2,758,593 ) 10.37 (1,299,357 ) 8.98 Forfeited (4,494,965 ) 8.60 (1,980,449 ) 9.74 (879,168 ) 10.40
Unvested share bonus awards outstanding, end of fiscal year 15,965,268 $ 6.91 13,801,942 $ 8.04 8,801,609 $ 10.31

Table of Contents
FLEXTRONICS INTERNATIONAL LTD.
NOTES TO CONSOLIDATED FINANCIAL STATEMENTS (Continu ed)
3. SHARE-BASED COMPENSATION (Continued)
Standard and Poor's ("S&P") 500 Composite Index and will vest over a period of four years. Of the 2.3 million awards that were outstanding as of the year ended March 31, 2012, 1.3 million were granted in fiscal 2012 at an estimated average grant-date fair value of $7.78 per share and 1.0 million were granted in fiscal 2011 at an average grant-date fair value of $7.32 per share. The actual number of shares to be issued for the 2012 grants can range from zero to 1.9 million and zero to 1.5 million for the 2011 grants.
The total intrinsic value of share bonus awards vested under the Company's equity compensation plans was $17.7 million, $19.6 million and $7.0 million during fiscal years 2012, 2011and 2010, respectively, based on the closing price of the Company's ordinary shares on the date vested.
4. EARNINGS PER SHARE
Basic earnings per share for both continuing and discontinued operations exclude dilution and are computed by dividing net income by the weighted-average number of ordinary shares outstanding during the applicable periods.
Diluted earnings per share for both continuing and discontinued operations reflect the potential dilution from stock options, share bonus awards and convertible securities. The potential dilution from stock options exercisable into ordinary share equivalents and share bonus awards was computed using the treasury stock method based on the average fair market value of the Company's ordinary shares for the period. The potential dilution from the conversion spread (excess of conversion value over face value) of the Subordinated Notes convertible into ordinary share equivalents was calculated as the quotient of the conversion spread and the average fair market value of the Company's ordinary shares for the period.
73

Table of Contents
FLEXTRONICS INTERNATIONAL LTD.
NOTES TO CONSOLIDATED FINANCIAL STATEMENTS (Continu ed)
4. EARNINGS PER SHARE (Continued)
The following table reflects the basic weighted-average ordinary shares outstanding and diluted weighted-average ordinary share equivalents used to calculate basic and diluted income from continuing and discontinued operations per share:
74
Fiscal Year Ended March 31, 2012 2011 2010 (In thousands, except per share amounts) Basic earnings from continuing and discontinued operations
per share: Income from continuing operations $ 510,645 $ 606,345 $ 25,002 Loss from discontinued operations (21,880 ) (10,126 ) (6,408 ) Shares used in computation:
Weighted-average ordinary shares outstanding 716,247 777,315 811,677
Basic earnings from continuing operations per share $ 0.71 $ 0.78 $ 0.03 Basic loss from discontinued operations per share $ (0.03 ) $ (0.01 ) $ (0.01 )
Diluted earnings from continuing operations per share: Income from continuing operations $ 510,645 $ 606,345 $ 25,002 Loss from discontinued operations (21,880 ) (10,126 ) (6,408 ) Shares used in computation:
Weighted-average ordinary shares outstanding 716,247 777,315 811,677 Weighted-average ordinary share equivalents from stock
options and awards(1) 11,560 12,877 9,435 Weighted-average ordinary shares and ordinary share
equivalents outstanding(2) 727,807 790,192 821,112
Diluted earnings from continuing operations per share $ 0.70 $ 0.77 $ 0.03
Diluted loss from discontinued operations per share $ (0.03 ) $ (0.01 ) $ (0.01 )
(1) Ordinary share equivalents of approximately 24.2 million, 25.5 million and 38.1 million shares to purchase stock options during fiscal years 2012, 2011 and 2010, respectively, were excluded from the computation of diluted earnings per share primarily because the exercise price of these options was greater than the average market price of the Company's ordinary shares during the respective periods.
(2) On August 2, 2010 the Company paid approximately $240.0 million to redeem its 1% Convertible Subordinated Notes upon maturity. The notes carried conversion provisions to issue shares to settle any conversion spread (excess of the conversion value over the conversion price) in stock. The conversion price was $15.525 per share (subject to certain adjustments). On the maturity date, the Company's stock price was less than the conversion spread, and therefore no shares were issued. For the year ended March 31, 2011, the conversion obligation was less than the principal portion of these notes and accordingly, no additional shares were included as ordinary share equivalents.

Table of Contents
FLEXTRONICS INTERNATIONAL LTD.
NOTES TO CONSOLIDATED FINANCIAL STATEMENTS (Continu ed)
5. SUPPLEMENTAL CASH FLOW DISCLOSURES
The following table represents supplemental cash flow disclosures and non-cash investing and financing activities:
For the year ended March 31, 2011, approximately $266.1 million of proceeds from bank borrowings and repayment of bank borrowings, related to certain short-term facilities, were previously reflected on a gross basis in the consolidated statements of cash flows. These amounts should have been reflected on a net basis in "Repayment of bank borrowings and long-term debt" and have been corrected in the accompanying consolidated statement of cash flows. The correction had no net impact on total cash used in financing activities.
6. BANK BORROWINGS AND LONG-TERM DEBT
Bank borrowings and long-term debt are as follows:
75
Fiscal Year Ended March 31, 2012 2011 2010 (In thousands) Net cash paid for:
Interest $ 42,067 $ 83,133 $ 126,327 Income taxes $ 66,013 $ 77,690 $ 89,973
Non-cash investing activity: Accounts payable for fixed assets purchases $ 63,671 $ 73,036 $ 67,876
As of March 31, 2012 2011 (In thousands) Term Loan, including current portion, due in
installments through October 2014 $ 1,179,595 $ 1,674,435 New Term Loan, including current portion, due in
installments through October 2016 487,500 — Asia Term Loans 377,000 379,000 Outstanding under revolving line of credit 140,000 160,000 Other 4,578 6,437
2,188,673 2,219,872 Current portion (39,340 ) (20,930 )
Non-current portion $ 2,149,333 $ 2,198,942

Table of Contents
FLEXTRONICS INTERNATIONAL LTD.
NOTES TO CONSOLIDATED FINANCIAL STATEMENTS (Continu ed)
6. BANK BORROWINGS AND LONG-TERM DEBT (Continued)
Maturities for the Company's long-term debt are as follows:
Capital lease obligations of $11.6 million and $0.5 million, consisting of short-term obligations of $3.1 million and $0.2 million and long term obligations of $8.5 million and $0.3 million are included in current and non-current liabilities on the Company's balance sheets as of March 31, 2012 and 2011, respectively.
Term Loan Agreement
The Company entered into a $1.8 billion term loan facility, dated as of October 1, 2007, and subsequently amended as of December 28, 2007 (the "Term Loan Agreement").
During fiscal year ended March 31, 2008, the Company borrowed $1.7 billion under the Term Loan Agreement. Of this amount, $500.0 million was scheduled to mature in October 2012 and the remainder is scheduled to mature in October 2014. The loan amortizes in quarterly installments in an amount equal to 1% per annum with the balance due at the end of the fifth or seventh year, as applicable. The Company may prepay the loans at any time at 100% of par plus accrued and unpaid interest and reimbursement of the lender's redeployment costs. On October 19, 2011, the Company repaid $480 million which was the outstanding portion of the $500.0 million due to mature in October 2012. Borrowings under the Term Loan Agreement bear interest, at the Company's option, either at (i) the base rate (the greater of the agent's prime rate or the federal funds rate plus 0.50%) plus a margin of 1.25%; or (ii) LIBOR plus a margin of 2.25%.
The Term Loan Agreement is unsecured, and contains customary restrictions on the ability of the Company and its subsidiaries to, among other things, (i) incur certain debt, (ii) make certain investments, (iii) make certain acquisitions of other entities, (iv) incur liens, (v) dispose of assets, (vi) make non-cash distributions to shareholders, and (vii) engage in transactions with affiliates. These covenants are subject to a number of exceptions and limitations. The Term Loan Agreement also requires that the Company maintain a maximum ratio of total indebtedness to EBITDA, during the term of the Term Loan Agreement. Borrowings under the Term Loan Agreement are guaranteed by the Company and certain of its subsidiaries. As of March 31, 2012, the Company was in compliance with the covenants under the Term Loan Agreement.
New Term Loan Agreement and Revolving Line of Credit
On October 19, 2011, the Company entered into a five-year $2.0 billion credit facility ("New Credit Facility") consisting of a $1.5 billion revolving credit facility ("New Revolving Credit Facility") and a $500 million term loan ("New Term Loan"), which expires in October 2016. The New Revolving
76
Fiscal Year Ending March 31, Amount (In thousands) 2013 $ 39,340 2014 418,590 2015 1,192,415 2016 37,500 2017 496,250 Thereafter 4,578
Total $ 2,188,673

Table of Contents
FLEXTRONICS INTERNATIONAL LTD.
NOTES TO CONSOLIDATED FINANCIAL STATEMENTS (Continu ed)
6. BANK BORROWINGS AND LONG-TERM DEBT (Continued)
Credit Facility replaced the Company's previous $2.0 billion revolving credit facility, which was due to mature in May 2012. The New Term Loan refinanced the outstanding amount of the $500.0 million tranche of the Company's $1.7 billion Term Loan. Borrowings under the New Credit Facility bear interest, at the Company's option, either at (i) LIBOR plus the applicable margin for LIBOR loans ranging between 1.25% and 2.25%, based on the Company's credit ratings or (ii) the base rate (the greatest of the agent's prime rate, the federal funds rate plus 0.50% and LIBOR for a one-month interest period plus 1.00%) plus an applicable margin ranging between 0.25% and 1.25%, based on the Company's credit rating. The Company is required to pay a quarterly commitment fee ranging between 0.20% and 0.45% per annum on the daily unused amount of the New Revolving Credit Facility based on the Company's credit rating.
The New Credit Facility is unsecured, and contains customary restrictions on the Company's and its subsidiaries' ability to (i) incur certain debt, (ii) make certain investments, (iii) make certain acquisitions of other entities, (iv) incur liens, (v) dispose of assets, (vi) make non-cash distributions to shareholders, and (vii) engage in transactions with affiliates. These covenants are subject to a number of exceptions and limitations. The New Credit Facility also requires that the Company maintain a maximum ratio of total indebtedness to EBITDA (earnings before interest expense, taxes, depreciation and amortization), and a minimum interest coverage ratio, as defined therein, during its term. As of March 31, 2012, the Company was in compliance with the covenants under the New Credit Facility.
Asia Term Loans
On September 27, 2010, the Company entered into a $50.0 million term loan agreement with a bank based in Asia, which matures on September 27, 2013. Borrowings under the term loan bear interest at LIBOR plus 2.30%. The Company, at its election, may convert the loan (in whole or in part) to bear interest at the higher of the Federal Funds rate plus 0.50% or the prime rate plus, in each case 1.00%. Principal payments of $500,000 are due quarterly with the balance due on the maturity date. The Company has the right to prepay any part of the loan without penalty. Borrowings under the term loan agreement are guaranteed by certain subsidiaries of the Company.
On September 28, 2010, the Company entered into a $130.0 million term loan facility with a bank in Asia, which matures on September 28, 2013. Borrowings under the facility bear interest at LIBOR plus a margin of 2.15%, and the Company paid a non-refundable fee of $1.4 million at the inception of the loan. The Company has the right to prepay any part of the loan without penalty.
On February 17, 2011, the Company entered into a $200.0 million term loan facility with a bank in Asia, which matures on February 17, 2014. Borrowings under the facility bear interest at LIBOR plus a margin of 2.28%, and the Company paid a non-refundable fee of $1.0 million at the inception of the loan. The Company has the right to prepay any part of the loan without penalty.
The Asia Term Loans are unsecured, and contain customary restrictions on the ability of the Company and its subsidiaries to, among other things, (i) incur certain debt, (ii) make certain investments, (iii) make certain acquisitions of other entities, (iv) incur liens, (v) dispose of assets, (vi) make non-cash distributions to shareholders, and (vii) engage in transactions with affiliates. These covenants are subject to a number of exceptions and limitations. The Asia Term Loans also require the Company maintain a maximum ratio of total indebtedness to EBITDA during the terms of the agreements. As of March 31, 2012, the Company was in compliance with the covenants under these facilities.
77

Table of Contents
FLEXTRONICS INTERNATIONAL LTD.
NOTES TO CONSOLIDATED FINANCIAL STATEMENTS (Continu ed)
6. BANK BORROWINGS AND LONG-TERM DEBT (Continued)
Other Credit Lines
The Company and certain of its subsidiaries also have various uncommitted revolving credit facilities, lines of credit and other loans in the amount of $290.6 million in the aggregate. While there were no borrowings outstanding under these facilities as of March 31, 2012 approximately $1.6 million of borrowings were outstanding as of March 31, 2011 under these facilities. These facilities, lines of credit and other loans bear annual interest at the respective country's inter-bank offering rate, plus an applicable margin, and generally have maturities that expired on various dates throughout fiscal year 2012. The credit facilities are unsecured and the lines of credit and other loans are primarily secured by accounts receivable.
Redemption of 1% Convertible Subordinated Notes
During August 2010, the Company paid $240.0 million to redeem its 1% Convertible Subordinated Notes at par upon maturity plus accrued interest. These notes carried conversion provisions to issue shares to settle any conversion spread (excess of conversion value over the conversion price) in stock. On the maturity date, the Company's stock price was less than the conversion price, and therefore no ordinary shares were issued.
Tender and Redemption of 6.5% Senior Subordinated Notes
During June 2009, the Company paid approximately $101.8 million to purchase an aggregate principal amount of $99.8 million of these Notes in a cash tender offer. The cash paid included $2.3 million in consent fees paid to holders of the Notes that were tendered but not purchased as well as to holders that consented but did not tender, which were capitalized and were being recognized as a component of interest expense over the remaining life of the Notes until the redemption noted below. The Company recognized a $2.3 million loss during fiscal year 2010 associated with the partial extinguishment of the Notes, which included approximately $2.6 million for transaction costs and the write-down of related debt issuance costs. In conjunction with the tender offer, the Company obtained consents to certain amendments to the restricted payments covenants and certain related definitions in the indenture under which the Notes were issued. The amendments permitted the Company greater flexibility to purchase or make other payments in respect of its equity securities and debt that was subordinated to the Notes and to make certain other restricted payments under the indenture.
On March 19, 2010, the Company paid approximately $306.3 million to redeem the remaining aggregate principal balance of $299.8 million of these notes at a redemption price of 102.167% of the principal amount. The Company recognized a loss associated with the early redemption of the notes of approximately $10.5 million during the fiscal year ended March 31, 2010, consisting of the redemption price premium of approximately $6.5 million, and approximately $4.0 million for transaction costs and the write-off of unamortized debt costs. The loss is recorded in other charges (income), net in the consolidated statements of operations.
Tender and Redemption of 6.25% Senior Subordinated Notes
During June 2009, the Company paid approximately $101.3 million to purchase an aggregate principal amount of $99.9 million of these Notes in a cash tender offer. The cash paid included $6.5 million in consent fees paid to holders of the Notes that were tendered but not purchased as well as to holders that consented but did not tender, which were capitalized and are being recognized as a
78
Table of Contents
FLEXTRONICS INTERNATIONAL LTD.
NOTES TO CONSOLIDATED FINANCIAL STATEMENTS (Continu ed)
6. BANK BORROWINGS AND LONG-TERM DEBT (Continued)
component of interest expense over the remaining life of the Notes. The Company recognized a $2.3 million gain during fiscal year 2010 associated with the partial extinguishment of the Notes, net of approximately $2.7 million for transaction costs and the write-down of related debt issuance costs.
During December 2010, the Company paid approximately $308.5 million to redeem the remaining aggregate principal balance of $302.2 million of these notes at a redemption price of 102.083% of the principal amount. The Company recognized a loss associated with the early redemption of the notes of approximately $13.2 million during the fiscal year ended March 31, 2011, consisting of the redemption price premium of approximately $6.3 million, and approximately $6.9 million primarily for the write-off of the unamortized debt issuance costs. The loss is recorded in other charges (income), net in the consolidated statement of operations.
7. FINANCIAL INSTRUMENTS
Foreign Currency Contracts
The Company transacts business in various foreign countries and is therefore, exposed to foreign currency exchange rate risk inherent in forecasted sales, cost of sales, and monetary assets and liabilities denominated in non-functional currencies. The Company has established risk management programs to protect against volatility in the value of non-functional currency denominated monetary assets and liabilities, and of future cash flows caused by changes in foreign currency exchange rates. The Company tries to maintain a partial or fully hedged position for certain transaction exposures, which are primarily, but not limited to, revenues, customer and vendor payments and inter-company balances in currencies other than the functional currency unit of the operating entity. The Company enters into short-term foreign currency forward and swap contracts to hedge only those currency exposures associated with certain assets and liabilities, primarily accounts receivable and accounts payable, and cash flows denominated in non-functional currencies. Gains and losses on the Company's forward and swap contracts are designed to offset losses and gains on the assets, liabilities and transactions hedged, and accordingly, generally do not subject the Company to risk of significant accounting losses. The Company hedges committed exposures and does not engage in speculative transactions. The credit risk of these forward and swap contracts is minimized since the contracts are with large financial institutions and accordingly, fair value adjustments related to the credit risk of the counter-party financial institution were not material.
79

Table of Contents
FLEXTRONICS INTERNATIONAL LTD.
NOTES TO CONSOLIDATED FINANCIAL STATEMENTS (Continu ed)
7. FINANCIAL INSTRUMENTS (Continued)
As of March 31, 2012, the aggregate notional amount of the Company's outstanding foreign currency forward and swap contracts was $2.7 billion as summarized below:
As of March 31, 2012 and 2011, the fair value of the Company's short-term foreign currency contracts was not material and included in other current assets or other current liabilities, as applicable, in the consolidated balance sheets. Certain of these contracts are designed to economically hedge the Company's exposure to monetary assets and liabilities denominated in non-functional currencies and are not accounted for as hedges under the accounting standards. Accordingly, changes in fair value of these instruments are recognized in earnings during the period of change as a component of interest and other expense, net in the consolidated statements of operations. As of March 31, 2012 and 2011, the Company also has included net deferred gains and losses, respectively, in other comprehensive income (loss), a component of shareholders' equity in the consolidated balance sheets, relating to changes in fair value of its foreign currency contracts that are accounted for as cash flow hedges. These deferred gains and losses were not material, and the deferred losses as of March 31, 2012 are expected to be recognized as a component of cost of sales in the consolidated statement of operations primarily over the next twelve month period. The gains and losses recognized in earnings due to hedge
80
Foreign Currency Amount Notional Contract Value
in USD Currency Buy Sell Buy Sell (In thousands) Cash Flow Hedges CNY 1,967,800 — $ 312,067 $ — EUR 17,279 14,740 22,923 19,562 HUF 15,333,000 — 69,239 — ILS 158,600 — 42,497 — MXN 1,213,400 — 94,665 — MYR 320,600 — 104,515 — SGD 41,500 — 32,973 — Other N/A N/A 58,002 780
736,881 20,342 Other Forward/Swap Contracts BRL 83,700 132,800 45,863 72,767 CAD 41,726 126,289 42,060 127,291 EUR 278,567 172,574 369,351 228,768 GBP 13,821 36,476 21,859 57,909 HKD 217,372 7,270 27,995 936 HUF 11,828,500 11,063,300 53,414 49,958 JPY 5,616,969 3,665,958 68,302 45,315 MXN 660,665 181,150 51,543 14,133 MYR 180,091 10,740 58,709 3,501 SEK 2,380,931 569,235 357,353 85,283 Other N/A N/A 95,940 55,689
1,192,389 741,550
Total Notional Contract Value in USD $ 1,929,270 $ 761,892

Table of Contents
FLEXTRONICS INTERNATIONAL LTD.
NOTES TO CONSOLIDATED FINANCIAL STATEMENTS (Continu ed)
7. FINANCIAL INSTRUMENTS (Continued)
ineffectiveness were not material for all fiscal years presented and are included as a component of interest and other expense, net in the consolidated statements of operations.
The following table presents the fair value of the Company's derivative instruments located on the consolidated balance sheets utilized for foreign currency risk management purposes at March 31, 2012 and 2011:
8. TRADE RECEIVABLES SECURITIZATION
The Company sells trade receivables under two asset-backed securitization programs and an accounts receivable factoring program.
Asset-Backed Securitization Programs
The Company continuously sells designated pools of trade receivables under its Global Asset-Backed Securitization Agreement (the "Global Program") and its North American Asset-Backed Securitization Agreement (the "North American Program," collectively, the "ABS Programs") to affiliated special purpose entities, each of which in turn sells 100% of the receivables to unaffiliated financial institutions. These programs allow the operating subsidiaries to receive a cash payment and a deferred purchase price receivable for sold receivables. Following the transfer of the receivables to the special purpose entities, the transferred receivables are isolated from the Company and its affiliates, and upon the sale of the receivables from the special purpose entity to the unaffiliated financial institutions effective control of the transferred receivables is passed to the unaffiliated financial institutions, which has the right to pledge or sell the receivables. Although the special purpose entities are consolidated by the Company, they are separate corporate entities and their assets are available first to satisfy the claims of their creditors. The investment limits by the financial institutions are $500.0 million for the Global Program and $300.0 million for the North American Program and require a minimum level of deferred purchase price receivable to be retained by the Company in connection with the sales.
The Company services, administers and collects the receivables on behalf of the special purpose entities and receives a servicing fee of 0.5% to 1.00% of serviced receivables per annum. Servicing fees recognized during the fiscal years ended March 31, 2012, 2011 and 2010 were not material and are
81
Fair Values of Derivative Instruments Asset Derivatives Liability Derivatives Fair Value Fair Value
Balance Sheet
Location March 31,
2012 March 31,
2011 Balance Sheet
Location March 31,
2012 March 31,
2011 (In thousands) Derivatives
designated as hedging instruments
Foreign currency contracts
Other current
assets
$ 10,105 $ 19,579 Other current
liabilities
$ 1,905 $ 778
Derivatives not designated as hedging instruments
Foreign currency contracts
Other current
assets
$ 10,894 $ 4,492 Other current
liabilities
$ 6,200 $ 6,122

Table of Contents
FLEXTRONICS INTERNATIONAL LTD.
NOTES TO CONSOLIDATED FINANCIAL STATEMENTS (Continu ed)
8. TRADE RECEIVABLES SECURITIZATION (Continued)
included in interest and other expense, net within the consolidated statements of operations. As the Company estimates the fee it receives in return for its obligation to service these receivables is at fair value, no servicing assets and liabilities are recognized.
Effective April 1, 2010, the Company adopted two new accounting standards, the first of which removed the concept of a qualifying special purpose entity and created more stringent conditions for reporting the transfer of a financial asset as a sale. The second standard amended the consolidation guidance for determining the primary beneficiary of a variable interest entity. As a result of the adoption of the second standard, the Company was deemed to be the primary beneficiary of the special purpose entity to which the pool of trade receivables was sold under the Global Program and, as such, was required to consolidate the special purpose entity; the Company had previously been consolidating the special purpose entity under the North American Program. The North American Program was amended effective April 1, 2010 and the Global Program was amended effective September 29, 2010 in each case to provide for the sale by the special purpose entities of 100% of the eligible receivables to the unaffiliated financial institutions; previously the special purpose entities had retained a partial interest in the sold receivables. Upon adoption of these standards, the balance of receivables sold for cash under the Global Program as of April 1, 2010, totaling $217.1 million, was recorded as accounts receivable and short-term bank borrowings in the opening balance sheet of fiscal 2011. Upon collection of these receivables the Company recorded cash from operations offset by repayments of bank borrowings from financing activities in the consolidated statements of cash flows during the year ended March 31, 2011. As of March 31, 2012 and 2011, the accounts receivable balances that were sold under the ABS Programs were removed from the consolidated balance sheets and the net cash proceeds received by the Company were included as cash provided by operating activities in the consolidated statements of cash flows.
Although the Company still consolidates the special purpose entities, as a result of the amendments to the North American Program effective April 1, 2010 and the Global Program on September 29, 2010, all of the receivables sold to the unaffiliated financial institutions for cash are removed from the consolidated balance sheet and the cash received is no longer accounted for as a secured borrowing. The portion of the purchase price for the receivables which is not paid by the unaffiliated financial institutions in cash is a deferred purchase price receivable, which is paid to the special purpose entity as payments on the receivables are collected from account debtors. The deferred purchase price receivable represents a beneficial interest in the transferred financial assets and is recognized at fair value as part of the sale transaction.
As of March 31, 2012, approximately $1.1 billion of accounts receivable had been sold to the special purpose entities under the ABS Programs for which the Company had received net cash proceeds of $556.8 million and deferred purchase price receivables of approximately $514.9 million. As of March 31, 2011, approximately $1.0 billion of accounts receivable had been sold to the special purpose entities for which the Company had received net cash proceeds of $545.0 million and deferred purchase price receivables of approximately $460.0 million. The deferred purchase price receivables are included in other current assets as of March 31, 2012 and 2011, and were carried at the expected recovery amount of the related receivables. The difference between the carrying amount of the receivables sold under these programs and the sum of the cash and fair value of the deferred purchase price receivables received at time of transfer is recognized as a loss on sale of the related receivables and recorded in interest and other expense, net in the consolidated statements of operations; such
82

Table of Contents
FLEXTRONICS INTERNATIONAL LTD.
NOTES TO CONSOLIDATED FINANCIAL STATEMENTS (Continu ed)
8. TRADE RECEIVABLES SECURITIZATION (Continued)
amounts were $10.9 million, $8.0 million and $7.8 million for the fiscal years ended March 31, 2012, 2011 and 2010, respectively.
For the fiscal years ended March 31, 2012, 2011 and 2010, cash flows from sales of receivables under the ABS Programs consisted of approximately $4.7 billion, $2.4 billion and $2.8 billion, respectively for transfers of receivables (of which approximately $0.6 billion, $0.6 billion and $1.0 billion, respectively represented new transfers and the remainder proceeds from collections reinvested in revolving-period transfers).
The following table summarizes the activity in the deferred purchase price receivables account during the fiscal years ended March 31, 2012 and 2011:
Trade Accounts Receivable Sale Programs
The Company also sold accounts receivables to certain third-party banking institutions. The outstanding balance of receivables sold and not yet collected was approximately $110.5 million and $109.7 million as of March 31, 2012 and 2011, respectively. For the years ended March 31, 2012, 2011 and 2010, total accounts receivables sold to certain third party banking institutions was approximately $2.0 billion, $2.5 billion and $1.2 billion, respectively. The receivables that were sold were removed from the consolidated balance sheets and were reflected as cash provided by operating activities in the consolidated statements of cash flows.
9. FAIR VALUE MEASUREMENT OF ASSETS AND LIABILITIES
Fair value is defined as the price that would be received from selling an asset or paid to transfer a liability in an orderly transaction between market participants at the measurement date. When determining the fair value measurements for assets and liabilities required or permitted to be recorded at fair value, the Company considers the principal or most advantageous market in which it would transact, and it considers assumptions that market participants would use when pricing the asset or liability. The accounting guidance for fair value establishes a fair value hierarchy based on the level of independent, objective evidence surrounding the inputs used to measure fair value. A financial instrument's categorization within the fair value hierarchy is based upon the lowest level of input that is significant to the fair value measurement. The fair value hierarchy is as follows:
Level 1 —Applies to assets or liabilities for which there are quoted prices in active markets for identical assets or liabilities.
The Company has deferred compensation plans for its officers and certain other employees. Deferred amounts under the plans are invested in hypothetical investments selected by the participant
83
As of March 31, 2012 2011 (In thousands) Beginning balance $ 459,994 $ 135,401
Transfers of receivables 4,922,541 3,107,510 Collections (4,867,640 ) (2,782,917 )
Ending balance $ 514,895 $ 459,994

Table of Contents
FLEXTRONICS INTERNATIONAL LTD.
NOTES TO CONSOLIDATED FINANCIAL STATEMENTS (Continu ed)
9. FAIR VALUE MEASUREMENT OF ASSETS AND LIABILITIES (Continued)
or the participant's investment manager. The Company's deferred compensation plan assets are included in other noncurrent assets on the consolidated balance sheets and include investments in equity securities and mutual funds that are valued using active market prices.
The Company values available for sale investments using level 1 inputs which are active market trading prices.
Level 2 —Applies to assets or liabilities for which there are inputs other than quoted prices included within level 1 that are observable for the asset or liability such as quoted prices for similar assets or liabilities in active markets; quoted prices for identical assets or liabilities in markets with insufficient volume or infrequent transactions (less active markets); or model-derived valuations in which significant inputs are observable or can be derived principally from, or corroborated by, observable market data.
The Company values foreign exchange forward contracts using level 2 observable inputs which primarily consist of an income approach based on the present value of the forward rate less the contract rate multiplied by the notional amount.
The Company's cash equivalents are comprised of bank deposits and money market funds, which are valued using level 2 inputs, such as interest rates and maturity periods. Due to their short-term nature, their carrying amount approximates fair value.
The Company's deferred compensation plan assets also include money market funds, mutual funds, corporate and government bonds and certain convertible securities that are valued using prices obtained from various pricing sources. These sources price these investments using certain market indices and the performance of these investments in relation to these indices. As a result, the Company has classified these investments as level 2 in the fair value hierarchy.
Level 3 —Applies to assets or liabilities for which there are unobservable inputs to the valuation methodology that are significant to the measurement of the fair value of the assets or liabilities.
The Company values deferred purchase price receivables relating to its Asset-Backed Securitization Program based on a discounted cash flow analysis using unobservable inputs (i.e. level 3 inputs), which are primarily risk free interest rates adjusted for the credit quality of the underlying creditor and due to its high credit quality and short term maturity their fair value approximates carrying value. Significant increases in either of the significant unobservable inputs (credit spread, risk free interest rate) in isolation would result in lower fair value estimates but is insignificant. The interrelationship between these inputs is insignificant.
There were no transfers between levels in the fair value hierarchy during the fiscal years 2012 and 2011.
84

Table of Contents
FLEXTRONICS INTERNATIONAL LTD.
NOTES TO CONSOLIDATED FINANCIAL STATEMENTS (Continu ed)
9. FAIR VALUE MEASUREMENT OF ASSETS AND LIABILITIES (Continued)
Financial Instruments Measured at Fair Value on a Recurring Basis
The following table presents the Company's assets and liabilities measured at fair value on a recurring basis as of March 31, 2012 and 2011:
There were no transfers between levels in the fair value hierarchy during the twelve month periods ended March 31, 2012 and 2011. Refer to note 8, "Trade Receivable Securitization", for a reconciliation of the changes in the deferred purchase price receivable.
85
Fair Value Measurements as of March 31, 2012 Level 1 Level 2 Level 3 Total (In thousands) Assets:
Money market funds and time deposits (Note 2) $ — $ 343,906 $ — $ 343,906 Deferred purchase price receivable (Note 8) — — 514,895 514,895 Foreign exchange forward contracts (Note 7) — 20,999 — 20,999 Available for sale investments (Note 2) 5,994 — — 5,994 Deferred compensation plan assets:
Mutual funds, money market accounts and equity securities 3,411 54,241 — 57,652
Liabilities: Foreign exchange forward contracts (Note 7) $ — $ (8,105 ) $ — $ (8,105 )
Fair Value Measurements as of March 31, 2011 Level 1 Level 2 Level 3 Total (In thousands) Assets:
Money market funds and time deposits (Note 2) $ — $ 375,760 $ — $ 375,760 Deferred purchase price receivable (Note 8) — — 459,994 459,994 Foreign exchange forward contracts (Note 7) — 24,071 — 24,071 Deferred compensation plan assets:
Mutual funds, money market accounts and equity securities 2,816 53,847 — 56,663
Liabilities: Foreign exchange forward contracts (Note 7) $ — $ (6,900 ) $ — $ (6,900 )

Table of Contents
FLEXTRONICS INTERNATIONAL LTD.
NOTES TO CONSOLIDATED FINANCIAL STATEMENTS (Continu ed)
9. FAIR VALUE MEASUREMENT OF ASSETS AND LIABILITIES (Continued)
Other financial instruments
The following table presents the Company's liabilities not carried at fair value as at March 31, 2012 and 2011:
Revolving credit facility —The carrying amount approximates fair value due to the short term nature of the interest rates underlying any borrowings under this facility, though the facility itself is available to the Company on a long term basis.
Term loans dated October 1, 2007 and October 19, 2011 —The term loans are valued based on broker trading prices in active markets.
Asia term loans —The Company's Asia Term Loans are not traded publicly; however, as the pricing, maturity and other pertinent terms of these loans closely approximate those of the Term Loan Agreements dated October 1, 2007, and October 19, 2011, management estimates the respective trading prices would be approximately the same.
Assets held for sale
As of March 31, 2012 and 2011, assets that were no longer in use and held for sale totaled approximately $16.7 million and $27.1 million, respectively, excluding assets that have been identified as relating to discontinued operations discussed further in note 18. The assets held for sale primarily represent manufacturing facilities that have been closed as part of the Company's historical facility consolidations. These assets are recorded at the lesser of carrying value or fair value, which is based on comparable sales from prevailing market data (level two inputs). There were no material fair value adjustments during fiscal years 2012 and 2011. There were no transfers between levels in the fair value hierarchy for these assets during the fiscal years 2012 and 2011.
10. COMMITMENTS AND CONTINGENCIES
Commitments
As of March 31, 2012 and 2011, the gross carrying amount and associated accumulated depreciation of the Company's property and equipment financed under capital leases, and the related obligations was not material. The Company also leases certain of its facilities and equipment under
86
As of March 31, 2012 As of March 31, 2011
Carrying Amount
Fair Value
Carrying Amount
Fair Value
Fair Value Hierarchy
(In thousands) (In thousands) Revolving credit facility $ 140,000 $ 140,000 $ 160,000 $ 160,000 Level 2 Term loan dated October 1, 2007 1,179,595 1,171,959 1,674,435 1,662,714 Level 1 Term loan dated October 19,
2011 487,500 482,625 — — Level 1 Asia term loans 377,000 374,394 379,000 376,347 Level 2
Total $ 2,184,095 $ 2,168,978 $ 2,213,435 $ 2,199,061
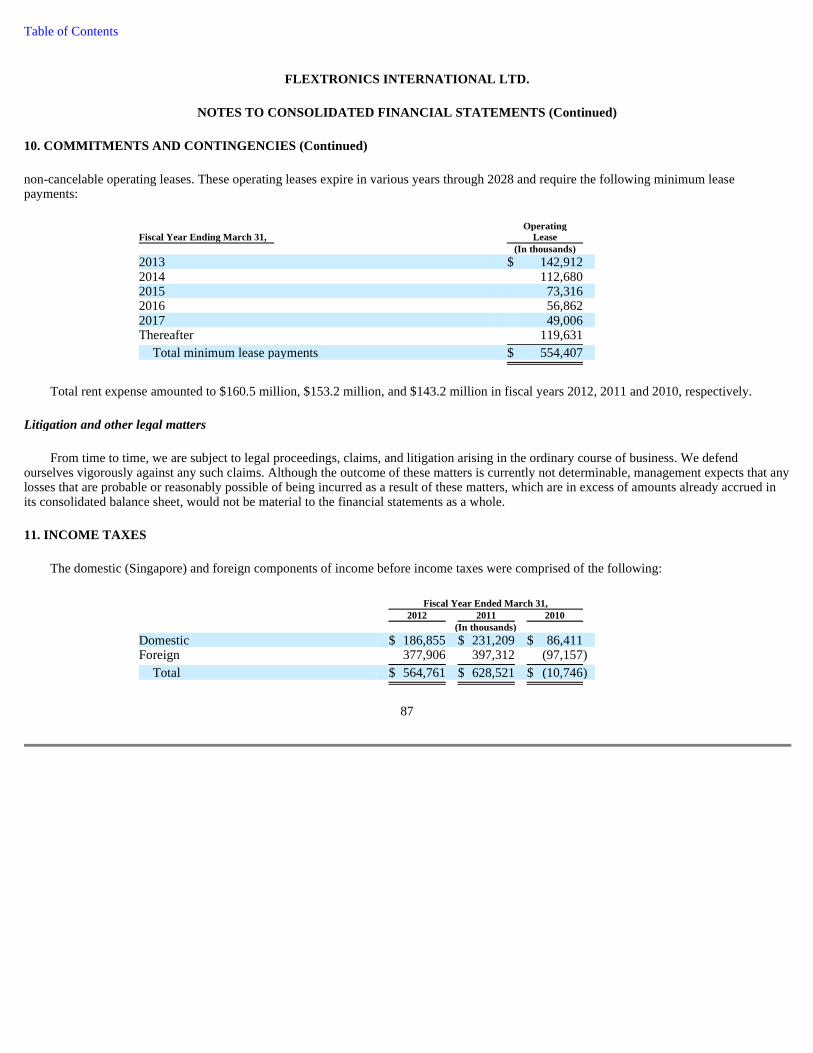
Table of Contents
FLEXTRONICS INTERNATIONAL LTD.
NOTES TO CONSOLIDATED FINANCIAL STATEMENTS (Continu ed)
10. COMMITMENTS AND CONTINGENCIES (Continued)
non-cancelable operating leases. These operating leases expire in various years through 2028 and require the following minimum lease payments:
Total rent expense amounted to $160.5 million, $153.2 million, and $143.2 million in fiscal years 2012, 2011 and 2010, respectively.
Litigation and other legal matters
From time to time, we are subject to legal proceedings, claims, and litigation arising in the ordinary course of business. We defend ourselves vigorously against any such claims. Although the outcome of these matters is currently not determinable, management expects that any losses that are probable or reasonably possible of being incurred as a result of these matters, which are in excess of amounts already accrued in its consolidated balance sheet, would not be material to the financial statements as a whole.
11. INCOME TAXES
The domestic (Singapore) and foreign components of income before income taxes were comprised of the following:
87
Fiscal Year Ending March 31, Operating
Lease (In thousands) 2013 $ 142,912 2014 112,680 2015 73,316 2016 56,862 2017 49,006 Thereafter 119,631
Total minimum lease payments $ 554,407
Fiscal Year Ended March 31, 2012 2011 2010 (In thousands) Domestic $ 186,855 $ 231,209 $ 86,411 Foreign 377,906 397,312 (97,157 )
Total $ 564,761 $ 628,521 $ (10,746 )

Table of Contents
FLEXTRONICS INTERNATIONAL LTD.
NOTES TO CONSOLIDATED FINANCIAL STATEMENTS (Continu ed)
11. INCOME TAXES (Continued)
The provision for (benefit from) income taxes consisted of the following:
The domestic statutory income tax rate was approximately 17.0% in fiscal years 2012, 2011 and 2010. The reconciliation of the income tax expense (benefit) expected based on domestic statutory income tax rates to the expense (benefit) for income taxes included in the consolidated statements of operations is as follows:
A number of countries in which the Company is located allow for tax holidays or provide other tax incentives to attract and retain business. In general, these holidays were secured based on the nature, size and location of the Company's operations. The aggregate dollar effect on the Company's income resulting from tax holidays and tax incentives to attract and retain business for the fiscal years ended March 31, 2012, 2011 and 2010 were $41.8 million, $66.5 million and $65.4 million, respectively. For the fiscal year ended March 31, 2012, the effect on basic and diluted earnings per share was $0.06 and $0.06, respectively, and the effect on basic and diluted earnings per share during fiscal years 2011 and 2010 were $0.09 and $0.08, and $0.08 and $0.08, respectively. Unless extended or otherwise renegotiated, the Company's existing holidays will expire in the fiscal years ending March 31, 2013 through fiscal 2018.
Under its territorial tax system, Singapore generally does not tax foreign sourced income until repatriated to Singapore. The Company has included the effects of Singapore's territorial tax system in the rate differential line above. The tax effect of foreign income not repatriated to Singapore for the
88
Fiscal Year Ended March 31, 2012 2011 2010 (In thousands) Current:
Domestic $ 303 $ (972 ) $ 50 Foreign 56,256 26,798 (18,908 )
56,559 25,826 (18,858 ) Deferred:
Domestic 386 (319 ) 1,077 Foreign (2,829 ) (3,331 ) (17,967 )
(2,443 ) (3,650 ) (16,890 )
Provision for (benefit from) income taxes $ 54,116 $ 22,176 $ (35,748 )
Fiscal Year Ended March 31, 2012 2011 2010 (In thousands) Income taxes based on domestic statutory
rates $ 96,014 $ 106,852 $ (1,852 ) Effect of tax rate differential (177,540 ) 26,459 (42,106 ) Intangible amortization 9,502 12,055 15,279 Change in liability for uncertain tax
positions 34,517 (29,205 ) (80,175 ) Change in valuation allowance 93,336 (90,033 ) 69,076 Other (1,713 ) (3,952 ) 4,030
Provision for income taxes $ 54,116 $ 22,176 $ (35,748 )

Table of Contents
FLEXTRONICS INTERNATIONAL LTD.
NOTES TO CONSOLIDATED FINANCIAL STATEMENTS (Continu ed)
11. INCOME TAXES (Continued)
fiscal years ended March 31, 2012, 2011 and 2010 were $17.7 million, $32.6 million and $20.0 million, respectively.
The components of deferred income taxes are as follows:
The Company has tax loss carryforwards of approximately $8.4 billion, a portion of which started expiring during 2013. Utilization of the tax loss carryforwards and other deferred tax assets is limited by the future earnings of the Company in the tax jurisdictions in which such deferred assets arose. As a result, management is uncertain as to when or whether these operations will generate sufficient profit to realize any benefit from the deferred tax assets. The valuation allowance provides a reserve against deferred tax assets that are not more likely than not to be realized by the Company. However, management has determined that it is more likely than not that the Company will realize certain of these benefits and, accordingly, has recognized a deferred tax asset from these benefits. The change in valuation allowance is net of certain increases and decreases to prior year losses and other carryforwards that have no current impact on the tax provision. Approximately $34.0 million of the valuation allowance relates to income tax benefits arising from the exercise of stock options, which if realized will be credited directly to shareholders' equity and will not be available to benefit the income tax provision in any future period.
89
As of March 31, 2012 2011 (In thousands) Deferred tax liabilities:
Fixed assets $ (30,159 ) $ (28,695 ) Others (30,032 ) (229,891 )
Total deferred tax liabilities (60,191 ) (258,586 )
Deferred tax assets: Fixed assets 73,588 86,055 Intangible assets 178,910 238,254 Deferred compensation 11,088 10,821 Inventory valuation 12,265 17,376 Provision for doubtful accounts 3,340 7,994 Net operating loss and other carryforwards 2,753,940 2,739,795 Others 176,547 201,357
3,209,678 3,301,652 Valuation allowances (3,099,561 ) (2,994,186 )
Deferred tax assets, net of valuation allowance 110,117 307,466
Net deferred tax asset $ 49,926 $ 48,880
The net deferred tax asset is classified as follows: Current asset (classified as other current assets) $ 815 $ 936 Long-term asset 49,111 47,944
Total $ 49,926 $ 48,880

Table of Contents
FLEXTRONICS INTERNATIONAL LTD.
NOTES TO CONSOLIDATED FINANCIAL STATEMENTS (Continu ed)
11. INCOME TAXES (Continued)
The amount of deferred tax assets considered realizable, however, could be reduced or increased in the near-term if facts, including the amount of taxable income or the mix of taxable income between subsidiaries, differ from management's estimates.
The Company does not provide for income taxes on approximately $570.0 million of undistributed earnings of its foreign subsidiaries as of March 31, 2012, as such earnings are not intended by management to be repatriated in the foreseeable future. Determination of the amount of the unrecognized deferred tax liability on these undistributed earnings is not practicable.
A reconciliation of the beginning and ending amount of unrecognized tax benefits is as follows:
The Company's unrecognized tax benefits are subject to change over the next twelve months primarily as a result of the expiration of certain statutes of limitations and as audits are settled. The Company believes it is reasonably possible that the total amount of unrecognized tax benefits could decrease by an estimated range of $26.0 - $32.0 million within the next twelve months primarily due to potential settlements of various audits and the expiration of certain statutes of limitations.
The Company and its subsidiaries file federal, state, and local income tax returns in multiple jurisdictions around the world. With few exceptions, the Company is no longer subject to income tax examinations by tax authorities for years before 2000.
The entire amount of unrecognized tax benefits at March 31, 2012, may affect the annual effective tax rate if the benefits are eventually recognized.
The Company recognizes interest and penalties accrued related to unrecognized tax benefits within the Company's tax expense. During the fiscal years ended March 31, 2012 and 2011, the Company recognized interest of approximately $5.4 million and $5.0 million, respectively, and no penalties. The Company had approximately $10.6 million and $5.5 million accrued for the payment of interest as of the fiscal years ended March 31, 2012 and 2011, respectively. The Company has not accrued for the payment of penalties for the fiscal years ended March 31, 2012 and 2011, respectively.
As of March 31, 2011, approximately $230.1 million of deferred tax liabilities were previously offset against deferred tax assets in the "components of deferred income taxes" disclosure within this footnote, whereas they should have been reflected on a gross basis. These amounts have been
90
Fiscal Year Ended March 31, 2012 2011 (In thousands) Balance, beginning of fiscal year $ 134,627 $ 129,888
Additions based on tax position related to the current year 25,113 12,443
Additions for tax positions of prior years 25,719 25,572 Reductions for tax positions of prior years (18,257 ) (35,090 ) Reductions related to lapse of applicable statute of
limitations (788 ) (2,342 ) Settlements (1,386 ) (1,187 ) Other 1,404 5,343
Balance, end of fiscal year $ 166,432 $ 134,627

Table of Contents
FLEXTRONICS INTERNATIONAL LTD.
NOTES TO CONSOLIDATED FINANCIAL STATEMENTS (Continu ed)
11. INCOME TAXES (Continued)
corrected, resulting in an increase in other deferred tax liabilities of $230.1 million, and increases to the deferred tax assets related to "fixed assets" and "other" of $28.7 million and $201.4 million, respectively. In addition, for the year ended March 31, 2011, approximately $248.3 million of domestic income was previously included as foreign income in the "components of income before income taxes" disclosure within this footnote, due to the nonaccrual of certain intercompany amounts and should have been included as domestic income. These amounts have been corrected, resulting in an increase in domestic income, and a corresponding decrease in foreign income, of approximately $248.3 million from amounts previously reported. The correction of the above items had no impact on net income, the provision for income taxes, net deferred tax assets, or any other amounts in the accompanying consolidated financial statements as of and for the year ended March 31, 2011.
12. RESTRUCTURING CHARGES
The Company incurs severance, asset impairment charges and other facilities charges as a result of changes in its customer mix on an ongoing basis. Such individual actions were not considered material to be separately disclosed as restructuring charges for fiscal years 2012 and 2011 and are included in either cost of sales or selling, general and administrative expenses, as appropriate. Additionally, there were no changes to any of the previously announced plans during the year ended March 31, 2012.
The following table summarizes the provisions, respective payments, and remaining accrued balance as of March 31, 2012 for restructuring charges incurred in fiscal years 2010 and prior:
The Company recognized restructuring charges of approximately $107.5 million during fiscal year 2010 primarily to rationalize the Company's global manufacturing capacity and infrastructure due to the macroeconomic crisis which significantly impacted the Company's customers. The Company's restructuring activities were intended to improve its operational efficiencies by reducing excess workforce and capacity. In addition to the cost reductions, these activities resulted in a further shift of
91
Severance
Long-Lived Asset
Impairment Other
Exit Costs Total (In thousands) Balance as of March 31, 2010 $ 28,216 $ — $ 36,029 $ 64,245 Activities during the fiscal year 2011
Cash payments for charges incurred in fiscal year 2010 (10,574 ) — (1,032 ) (11,606 )
Cash payments for charges incurred in fiscal year 2009 and prior (10,046 ) — (13,271 ) (23,317 )
Balance as of March 31, 2011 7,596 — 21,726 29,322 Activities during the fiscal year 2012:
Cash payments for charges incurred in fiscal year 2010 and prior (2,976 ) — (13,659 ) (16,635 )
Balance as of March 31, 2012 4,620 — 8,067 12,687 Less: Current portion (classified as other current
liabilities) 4,620 — 4,618 9,238
Accrued restructuring costs, net of current portion (classified as other liabilities) $ — $ — $ 3,449 $ 3,449

Table of Contents
FLEXTRONICS INTERNATIONAL LTD.
NOTES TO CONSOLIDATED FINANCIAL STATEMENTS (Continu ed)
12. RESTRUCTURING CHARGES (Continued)
manufacturing capacity to locations with higher efficiencies and, in most instances, lower costs. The costs associated with these restructuring activities included employee severance, costs related to owned and leased facilities and equipment that is no longer in use and is to be disposed of, and other costs associated with the exit of certain contractual arrangements due to facility closures. The Company classified approximately $92.4 million of these charges as cost of sales and approximately $15.1 million of these charges as selling, general and administrative expenses during fiscal year 2010.
The components of the restructuring charges during fiscal year 2010 were as follows:
During fiscal year 2010, the Company recognized approximately $41.2 million of employee termination costs associated with the involuntary terminations of 5,727 identified employees in connection with the charges described above. The identified involuntary employee terminations by reportable geographic region amounted to approximately 2,086, 2,740, and 901 for Asia, the Americas and Europe, respectively. Approximately $35.2 million of these charges were classified as a component of cost of sales.
During fiscal year 2010, the Company recognized approximately $43.1 million of non-cash charges for the write-down of property and equipment to management's estimate of fair value associated with various manufacturing and administrative facility closures. Approximately $33.4 million of this amount was classified as a component of cost of sales. The restructuring charges recognized during fiscal year
92
First
Quarter Second Quarter
Third Quarter
Fourth Quarter Total
(In thousands) Americas: Severance $ 7,234 $ 1,765 $ 2,223 $ 5,214 $ 16,436 Long-lived asset impairment 1,004 2,154 1,326 — 4,484 Other exit costs 1,742 2,687 (240 ) — 4,189
Total restructuring charges 9,980 6,606 3,309 5,214 25,109
Asia: Severance 7,579 801 1,659 1,964 12,003 Long-lived asset impairment 21,482 1,558 1,589 4,694 29,323 Other exit costs 5,519 (947 ) 426 (1,191 ) 3,807
Total restructuring charges 34,580 1,412 3,674 5,467 45,133
Europe: Severance 4,556 4,573 2,733 892 12,754 Long-lived asset impairment 9,305 — — — 9,305 Other exit costs 6,418 — 70 8,739 15,227
Total restructuring charges 20,279 4,573 2,803 9,631 37,286
Total Severance 19,369 7,139 6,615 8,070 41,193 Long-lived asset impairment 31,791 3,712 2,915 4,694 43,112 Other exit costs 13,679 1,740 256 7,548 23,223
Total restructuring charges $ 64,839 $ 12,591 $ 9,786 $ 20,312 $ 107,528
Table of Contents
FLEXTRONICS INTERNATIONAL LTD.
NOTES TO CONSOLIDATED FINANCIAL STATEMENTS (Continu ed)
12. RESTRUCTURING CHARGES (Continued)
2010 also included approximately $23.2 million for other exit costs, all of which were classified as a component of cost of sales. Other exit costs were primarily comprised of contractual obligations associated with facility and equipment lease terminations of $19.8 million, facility abandonment and refurbishment costs of $3.2 million, and approximately $0.2 million of other costs.
13. OTHER CHARGES / INCOME, NET
During fiscal year 2012, the Company recognized a net gain of $20.0 million, in connection with the sale of certain international entities.
During fiscal year 2011, the Company recognized charges totaling $6.3 million, consisting of the $13.2 million loss associated with the early redemption of the 6.25% Senior Subordinated Notes and an $11.7 million loss in connection with the divestiture of certain international entities. Refer to note 6, "Bank Borrowings and Long-Term Debt" and note 15, "Business and Asset Acquisitions and Divestitures," respectively, for further discussion. These charges were partially offset by a gain of $18.6 million associated with the sale of an equity investment that was previously fully impaired. Refer to Note 2, "Summary of Accounting Policies" for further discussion.
During fiscal year 2010, the Company recognized impairment charges totaling approximately $199.4 million related to certain equity investments and notes receivable. Refer to Note 2, "Summary of Accounting Policies" for further discussion.
14. INTEREST AND OTHER EXPENSE, NET
For the fiscal years ended March 31, 2012, 2011 and 2010, the Company recognized interest income of $21.9 million, $14.0 million and $32.2 million.
For the fiscal years ended March 31, 2012, 2011 and 2010, the Company recognized interest expense of $70.6 million, $96.1 million and $158.1 million, respectively, on its debt obligations outstanding during the period.
For the fiscal years ended March 31, 2012 and 2011, the Company recognized gains on foreign exchange transactions of $39.6 million and $33.1 million, respectively. The Company recognized a loss on foreign exchange transactions of $11.9 million for the fiscal year ended March 31, 2010.
15. BUSINESS AND ASSET ACQUISITIONS AND DIVESTITURES
Business Acquisitions
The business and asset acquisitions described below were accounted for using the purchase method of accounting, and accordingly, the fair value of the net assets acquired and the results of the acquired businesses were included in the Company's consolidated financial statements from the acquisition dates forward. The Company has not finalized the allocation of the consideration for certain of its recently completed acquisitions and expects to complete these allocations within one year of the respective acquisition dates.
During the year ended March 31, 2012, the Company completed three acquisitions that were not individually, nor in the aggregate significant to the Company's financial position, results of operations and cash flows. The aggregate cash paid for these acquisitions together with cash paid for contingent consideration related to certain prior period acquisitions during the year ended March 31, 2012 totaled
93

Table of Contents
FLEXTRONICS INTERNATIONAL LTD.
NOTES TO CONSOLIDATED FINANCIAL STATEMENTS (Continu ed)
15. BUSINESS AND ASSET ACQUISITIONS AND DIVESTITURES (Continued)
approximately $92.3 million, net of cash acquired. The acquired businesses expanded the Company's capabilities in the communications market. The Company primarily acquired inventory and certain other manufacturing assets and recorded goodwill of $8.6 million and customer contract intangibles of $3.9 million in connection with the acquisitions. Contingent considerations and provisional fair value adjustments for acquisitions completed in fiscal year 2012 are subject to change as certain information as of the date of the respective acquisition is evaluated during the measurement period, not to exceed one year subsequent to the acquisition date.
During fiscal year 2011, the Company completed four acquisitions that were not individually, nor in the aggregate significant to the Company's financial position, results of operations and cash flows. The aggregate cash paid for these acquisitions together with cash paid for contingent consideration relating to certain prior period acquisitions during the year ended March 31, 2011 totaled approximately $17.0 million, net of cash acquired. The acquired businesses expanded the Company's capabilities in the medical and infrastructure segments.
During fiscal year 2010, the Company completed four acquisitions that were not individually, nor in the aggregate significant to the Company's financial position, results of operations and cash flows. The aggregate cash paid for these acquisitions together with cash paid for contingent consideration relating to certain prior period acquisitions during the year ended March 31, 2010 totaled approximately $75.9 million, net of cash acquired. The acquired businesses expanded the Company's capabilities in the medical and automotive market segments.
Pro forma results for the Company's other acquisitions have not been presented as such results would not be materially different from the Company's actual results on either an individual or an aggregate basis.
Divestitures
During fiscal years 2012 and 2011, the Company recognized a net gain of approximately $20.0 million and a loss of $11.7 million, respectively, in connection with the sale of certain international entities which was recorded in other charges (income), net, in the consolidated statements of operations. The results for these entities were not significant for any period presented.
16. SHARE REPURCHASE PLAN
On July 18, 2011, the Company's Board of Directors authorized the repurchase of $200.0 million of the Company's outstanding ordinary shares, which was approved by the Company's shareholders at the 2011 Extraordinary General Meeting on July 22, 2011. Share repurchases by the Company under the share repurchase plans are subject to an aggregate limit of 10% of its ordinary shares outstanding as of the date of the Extraordinary General Meeting held in July 2011. On December 22, 2011, the Company's Board of Directors authorized the repurchase of the remaining balance of ordinary shares outstanding not to exceed the 10% limitation. During the 2012 fiscal year, the Company repurchased approximately 81.7 million shares for an aggregate purchase price of approximately $509.8 million, and retired all of these shares. During the second quarter of fiscal 2012, the Company retired an additional 23.5 million shares which were repurchased in the prior periods. As of March 31, 2012, approximately 20.4 million shares were available to be repurchased under the plans.
94

Table of Contents
FLEXTRONICS INTERNATIONAL LTD.
NOTES TO CONSOLIDATED FINANCIAL STATEMENTS (Continu ed)
17. SEGMENT REPORTING
Operating segments are defined as components of an enterprise for which separate financial information is available that is evaluated regularly by the chief operating decision maker, or decision making group, in deciding how to allocate resources and in assessing performance. The Company's chief operating decision maker is its Chief Executive Officer. As of March 31, 2012, the Company operates and internally manages a single operating segment, Electronics Manufacturing Services.
Geographic information is as follows:
Revenues are attributable to the country in which the product is manufactured or service is provided.
For purposes of the preceding tables, "Asia" includes China, India, Indonesia, Japan, Labuan, Malaysia, Mauritius, Singapore, and Taiwan; "Americas" includes Brazil, Canada, Mexico, and the United States; "Europe" includes Austria, Bermuda, the Czech Republic, Denmark, Finland, France, Germany, Hungary, Ireland, Israel, Italy, the Netherlands, Norway, Poland, Romania, Slovakia, Sweden, Turkey, Ukraine, and the United Kingdom. During fiscal years 2012 and 2011 there were no revenues attributable to Finland.
During fiscal years 2012, 2011 and 2010, net sales generated from Singapore, the principal country of domicile, were approximately $663.1 million, $578.2 million and $428.0 million, respectively.
As of March 31, 2012 and 2011, long-lived assets held in Singapore were approximately $15.3 million and $17.3 million, respectively.
During fiscal year 2012, China, Mexico, United States and Malaysia accounted for approximately 38%, 14%, 10% and 10% of consolidated net sales, respectively. No other country accounted for more than 10% of net sales in fiscal year 2012. As of March 31, 2012, China and Mexico accounted for approximately 41% and 15%, respectively, of consolidated long-lived assets. No other country accounted for more than 10% of long-lived assets as of March 31, 2012.
95
Fiscal Year Ended March 31, 2012 2011 2010 (In thousands) Net sales:
Asia $ 15,408,872 $ 14,620,097 $ 11,551,372 Americas 8,435,147 8,338,169 7,774,114 Europe 5,543,637 5,530,752 4,684,298
$ 29,387,656 $ 28,489,018 $ 24,009,784
As of March 31, 2012 2011 (In thousands) Long-lived assets:
Asia $ 1,134,252 $ 1,075,344 Americas 554,659 590,931 Europe 395,237 417,756
$ 2,084,148 $ 2,084,031

Table of Contents
FLEXTRONICS INTERNATIONAL LTD.
NOTES TO CONSOLIDATED FINANCIAL STATEMENTS (Continu ed)
17. SEGMENT REPORTING (Continued)
During fiscal year 2011, China, Mexico and the United States accounted for approximately 38%, 15% and 10% of consolidated net sales, respectively. No other country accounted for more than 10% of net sales in fiscal year 2011. As of March 31, 2011, China and Mexico accounted for approximately 41% and 16%, respectively, of consolidated long-lived assets. No other country accounted for more than 10% of long-lived assets as of March 31, 2011.
During fiscal year 2010, China, Mexico, United States, and Malaysia accounted for approximately 33%, 15%, 14%, and 11% of consolidated net sales, respectively. No other country accounted for more than 10% of net sales in fiscal year 2010. As of March 31, 2010, China and Mexico accounted for approximately 42% and 17%, respectively, of consolidated long-lived assets. No other country accounted for more than 10% of long-lived assets as of March 31, 2010.
18. DISCONTINUED OPERATIONS
Consistent with its strategy to evaluate the strategic and financial contributions of each of its operations and to focus on the primary growth objectives in the Company's core vertically-integrated manufacturing business activities, on March 2, 2012, the Company entered into a definitive agreement with Tessera Technologies, Inc., and DigitalOptics Corporation (DOC), a wholly-owned subsidiary of Tessera Technologies. Under the terms of the definitive agreement DOC will acquire certain assets of Flextronics' Vista Point Technologies camera module business, including intellectual property and the China-based manufacturing operations. This transaction is expected to close in the first quarter of fiscal 2013 subject to certain closing conditions.
In accordance with the accounting guidance, the camera modules business represent a separate asset group and the divestiture qualifies as discontinued operations, and accordingly, the Company has reported the results of operations and financial position of this business in discontinued operations within the statements of operations and the balance sheets for all periods presented.
The Company recognized an impairment charge of $17.0 million in relation to the fixed assets of the Vista Point Technologies camera modules business based on expected proceeds from the sale amounting to approximately $23.0 million, which has been included in the loss from discontinued operations on the consolidated statement of operations for the fiscal year 2012.
The results from discontinued operations were as follows:
96
Fiscal Year Ended March 31, 2012 2011 2010 (In thousands) Net sales $ 82,632 $ 190,907 $ 100,949 Cost of sales 100,167 191,950 94,959 Restructuring charges — — 33
Gross profit (loss) (17,535 ) (1,043 ) 5,957 Selling, general and administrative expenses 5,859 11,459 12,037 Interest and other expense (income), net 32 422 (51 )
Loss before income taxes (23,426 ) (12,924 ) (6,029 ) Provision for (benefit from) income taxes (1,546 ) (2,798 ) 379
Net loss of discontinued operations $ (21,880 ) $ (10,126 ) $ (6,408 )

Table of Contents
FLEXTRONICS INTERNATIONAL LTD.
NOTES TO CONSOLIDATED FINANCIAL STATEMENTS (Continu ed)
18. DISCONTINUED OPERATIONS (Continued)
The current and non-current assets and liabilities of discontinued operations were as follows:
19. SUBSEQUENT EVENT
Subsequent to March 31, 2012, the Company became aware that one of its customers in the concentrated solar photovoltaic market was experiencing significant financial and liquidity difficulties. The Company has been in good faith negotiations with the customer and its primary stakeholders on various out-of-court restructuring alternatives. Based on an evaluation of this customer's specific circumstances through May 25, 2012, including but not limited to, its financing alternatives, business prospects, proposed restructuring alternatives and the possibility of insolvency, the Company determined that its best estimate was that all accounts receivable and inventory related to this customer were unrecoverable and recorded a charge of $32.0 million as of March 31, 2012 related to this customer. Of this charge, the Company classified $4.0 million in cost of sales related to the write-down of inventory and $28.0 million as selling, general and administrative expenses for provisions for doubtful accounts. Based on all information available through March 31, 2012, the Company believed that payment of receivables was reasonably assured at the time of shipment, and accordingly, the Company recorded revenues on sales to the customer.
97
As of March 31, 2012 2011 (In thousands) Account receivable, net $ 892 $ 57,720 Inventories 3,723 33,260 Other current assets 471 5,921
Total current assets of discontinued operations $ 5,086 $ 96,901
Property and equipment, net $ 22,671 $ 57,032
Total non-current assets of discontinued operations $ 22,671 $ 57,032
Accounts payable $ 3,593 $ 78,713 Other current liabilities 4,651 8,566
Total current liabilities of discontinued operations $ 8,244 $ 87,279

Table of Contents
FLEXTRONICS INTERNATIONAL LTD.
NOTES TO CONSOLIDATED FINANCIAL STATEMENTS (Continu ed)
20. QUARTERLY FINANCIAL DATA (UNAUDITED)
The following table contains unaudited quarterly financial data for fiscal years 2012 and 2011. Earnings per share are computed independently for each quarter presented; therefore, the sum of the quarterly earnings per share may not equal the total earnings per share amounts for the fiscal year.
During the fourth quarter of fiscal 2012, the Company identified certain accounting errors in the statutory to US GAAP adjustments at one of its foreign sites that originated in prior interim and annual periods. Management conducted additional procedures and concluded that these errors were isolated to that location. These errors, which primarily understated cost of sales, totaled $0.8 million in the first nine months of fiscal 2012 and $10.4 million and $8.0 million for the fiscal years ended March 31, 2011 and 2010, and were corrected by the Company as an out-of-period adjustment in the fourth quarter of fiscal 2012. This fourth quarter adjustment was partially offset by the correction of an error identified in the fourth quarter of fiscal 2012 amounting to $4.2 million related to the provisions for income taxes in the prior fiscal 2012 interim periods. Management believes the impact of these items, both individually and in the aggregate, to the fiscal year ended March 31, 2012 and to prior fiscal and interim periods presented was not material. As a result of recording these adjustments in the fourth quarter, net income for the quarter and year ended March 31, 2012 were reduced by $21.5 million ($0.03 per share) and $24.9 million ($0.03 per share), respectively.
As of March 31, 2012, the Company recognized certain charges in relation to a distressed customer. Refer to note 19 "Subsequent Event" for further details.
98
Fiscal Year Ended March 31, 2012 Fiscal Year Ended March 31, 2011 First Second Third Fourth First Second Third Fourth (In thousands, except per share amounts) Net sales(1) $ 7,506,204 $ 8,019,217 $ 7,479,823 $ 6,382,412 $ 6,546,874 $ 7,382,211 $ 7,771,159 $ 6,788,774 Gross profit(1) 400,778 372,577 385,179 358,807 370,181 401,427 434,880 379,481 Income from
continuing operations net of taxes 135,407 130,069 103,747 141,422 120,066 149,598 201,994 134,687
Income (loss) from discontinued operations, net of taxes (3,432 ) (189 ) (1,570 ) (16,689 ) (1,888 ) (5,182 ) (3,704 ) 648
Net income 131,975 129,880 102,177 124,733 118,178 144,416 198,290 135,335
Earnings (loss) per share: Income
from continuing operations: Basic $ 0.18 $ 0.18 $ 0.15 $ 0.21 $ 0.15 $ 0.19 $ 0.26 $ 0.18
Diluted $ 0.18 $ 0.18 $ 0.14 $ 0.20 $ 0.15 $ 0.19 $ 0.26 $ 0.17
Income (loss) from discontinued operations: Basic $ 0.00 $ 0.00 $ 0.00 $ (0.02 ) $ 0.00 $ (0.01 ) $ 0.00 $ 0.00
Diluted $ 0.00 $ 0.00 $ 0.00 $ (0.02 ) $ 0.00 $ (0.01 ) $ 0.00 $ 0.00
Net income: Basic $ 0.18 $ 0.18 $ 0.14 $ 0.18 $ 0.15 $ 0.19 $ 0.26 $ 0.18
Diluted $ 0.17 $ 0.18 $ 0.14 $ 0.18 $ 0.14 $ 0.18 $ 0.26 $ 0.17
(1) As discussed in note 18 to the financial statements, "Discontinued Operations", the Company is reporting the operating results of its Visa Point Technologies camera module business as discontinued operations. Accordingly net sales and gross profit data above have been adjusted to exclude net revenue and gross profit (loss) pertaining to our camera module business.

Table of Contents
ITEM 9. CHANGES IN AND DISAGREEMENTS WITH ACCOUNTANTS ON ACCOUNTING AND FINANCIAL DISCLOSURE
Not applicable.
ITEM 9A. CONTROLS AND PROCEDURES
(a) Evaluation of Disclosure Controls and Procedures
Under the supervision and with the participation of the Company's management, including the Company's Chief Executive Officer and Chief Financial Officer, the Company has evaluated the effectiveness of the Company's disclosure controls and procedures (as defined in Rule 13a-15(e) under the Exchange Act) as of March 31, 2012. Based on that evaluation, the Company's Chief Executive Officer and Chief Financial Officer concluded that, as of March 31, 2012, such disclosure controls and procedures were effective in ensuring that information required to be disclosed by the Company in reports that it files or submits under the Securities Exchange Act of 1934, as amended, is (i) recorded, processed, summarized and reported within the time periods specified in the Securities and Exchange Commission's rules and forms and (ii) accumulated and communicated to our management, including our principal executive officer and principal financial officer, as appropriate to allow timely decisions regarding required disclosure.
(b) Management's Annual Report on Internal Control over Financial Reporting
Management is responsible for establishing and maintaining adequate internal control over financial reporting, as such term is defined in Rule 13a-15(f) under the Securities Exchange Act of 1934, as amended. As of March 31, 2012, under the supervision and with the participation of management, including the Company's Chief Executive Officer and Chief Financial Officer, an evaluation was conducted of the effectiveness of the Company's internal control over financial reporting based on the framework in Internal Control—Integrated Framework issued by the Committee of Sponsoring Organizations of the Treadway Commission ("COSO"). Based on that evaluation, management concluded that the Company's internal control over financial reporting was adequately designed and operating effectively as of March 31, 2012.
Because of its inherent limitations, a system of internal control over financial reporting can provide only reasonable assurance and may not prevent or detect misstatements or prevent or detect instances of fraud. These inherent limitations include the realities that judgments in decision-making can be faulty, and that breakdowns can occur because of simple error or mistake. Additionally, controls may be circumvented by the individual acts of some persons, by collusion of two or more people, or by management override of the control. The projections of any evaluation of effectiveness to future periods are subject to the risk that controls may become inadequate because of changes in conditions, or that the degree of compliance with the policies or procedures may deteriorate.
(c) Attestation Report of the Registered Public Accounting Firm
The effectiveness of the Company's internal control over financial reporting as of March 31, 2012 has been audited by Deloitte & Touche LLP, an independent registered public accounting firm, as stated in their report which appears in this Item under the heading "Report of Independent Registered Public Accounting Firm."
(d) Changes in Internal Control Over Financial Reporting
There were no changes in the Company's internal controls over financial reporting that occurred during the quarter ended March 31, 2012 that have materially affected, or are reasonably likely to materially affect, its internal controls over financial reporting.
99

Table of Contents
REPORT OF INDEPENDENT REGISTERED PUBLIC ACCOUNTING FIRM
To the Board of Directors and Stockholders of Flextronics International Ltd. Singapore
We have audited the internal control over financial reporting of Flextronics International Ltd. and subsidiaries (the "Company") as of March 31, 2012, based on criteria established in Internal Control—Integrated Framework issued by the Committee of Sponsoring Organizations of the Treadway Commission. The Company's management is responsible for maintaining effective internal control over financial reporting and for its assessment of the effectiveness of internal control over financial reporting, included in the accompanying Management's Annual Report on Internal Control over Financial Reporting. Our responsibility is to express an opinion on the Company's internal control over financial reporting based on our audit.
We conducted our audit in accordance with the standards of the Public Company Accounting Oversight Board (United States). Those standards require that we plan and perform the audit to obtain reasonable assurance about whether effective internal control over financial reporting was maintained in all material respects. Our audit included obtaining an understanding of internal control over financial reporting, assessing the risk that a material weakness exists, testing and evaluating the design and operating effectiveness of internal control based on the assessed risk, and performing such other procedures as we considered necessary in the circumstances. We believe that our audit provides a reasonable basis for our opinion.
A company's internal control over financial reporting is a process designed by, or under the supervision of, the company's principal executive and principal financial officers, or persons performing similar functions, and effected by the company's board of directors, management, and other personnel to provide reasonable assurance regarding the reliability of financial reporting and the preparation of financial statements for external purposes in accordance with generally accepted accounting principles. A company's internal control over financial reporting includes those policies and procedures that (1) pertain to the maintenance of records that, in reasonable detail, accurately and fairly reflect the transactions and dispositions of the assets of the company; (2) provide reasonable assurance that transactions are recorded as necessary to permit preparation of financial statements in accordance with generally accepted accounting principles, and that receipts and expenditures of the company are being made only in accordance with authorizations of management and directors of the company; and (3) provide reasonable assurance regarding prevention or timely detection of unauthorized acquisition, use, or disposition of the company's assets that could have a material effect on the financial statements.
Because of the inherent limitations of internal control over financial reporting, including the possibility of collusion or improper management override of controls, material misstatements due to error or fraud may not be prevented or detected on a timely basis. Also, projections of any evaluation of the effectiveness of the internal control over financial reporting to future periods are subject to the risk that the controls may become inadequate because of changes in conditions, or that the degree of compliance with the policies or procedures may deteriorate.
In our opinion, the Company maintained, in all material respects, effective internal control over financial reporting as of March 31, 2012, based on the criteria established in Internal Control—Integrated Framework issued by the Committee of Sponsoring Organizations of the Treadway Commission.
We have also audited, in accordance with the standards of the Public Company Accounting Oversight Board (United States), the consolidated financial statements as of and for the year ended
100

Table of Contents
March 31, 2012 of the Company and our report dated May 25, 2012 expressed an unqualified opinion on those financial statements.
/s/ DELOITTE & TOUCHE LLP
San Jose, California May 25, 2012
101

Table of Contents
ITEM 9B. OTHER INFORMATION
Not applicable.
PART III
ITEM 10. DIRECTORS, EXECUTIVE OFFICERS AND CORPORATE GOVERNANCE
Information with respect to this item may be found in our definitive proxy statement to be delivered to shareholders in connection with our 2012 Annual General Meeting of Shareholders. Such information is incorporated by reference.
ITEM 11. EXECUTIVE COMPENSATION
Information with respect to this item may be found in our definitive proxy statement to be delivered to shareholders in connection with our 2012 Annual General Meeting of Shareholders. Such information is incorporated by reference.
ITEM 12. SECURITY OWNERSHIP OF CERTAIN BENEFICIAL OWNERS AND MANAGEMENT AND RELATED SHAREHOLDER MATTERS
Information with respect to this item may be found in our definitive proxy statement to be delivered to shareholders in connection with our 2012 Annual General Meeting of Shareholders. Such information is incorporated by reference.
ITEM 13. CERTAIN RELATIONSHIPS AND RELATED TRANSACTIONS, AND DIRECTOR INDEPENDENCE
Information with respect to this item may be found in our definitive proxy statement to be delivered to shareholders in connection with our 2012 Annual General Meeting of Shareholders. Such information is incorporated by reference.
ITEM 14. PRINCIPAL ACCOUNTANT FEES AND SERVICES
Information with respect to this item may be found in our definitive proxy statement to be delivered to shareholders in connection with our 2012 Annual General Meeting of Shareholders. Such information is incorporated by reference.
PART IV
ITEM 15. EXHIBITS AND FINANCIAL STATEMENT SCHEDULES
(a) Documents filed as part of this annual report on Form 10-K:
1. Financial Statements. See Item 8, "Financial Statements and Supplementary Data."
2. Financial Statement Schedules. "Schedule II—Valuation and Qualifying Accounts" is included in the financial statements, see Concentration of Credit Risk in Note 2, "Summary of Accounting Policies" of the Notes to Consolidated Financial Statements in Item 8, "Financial Statements and Supplementary Data."
3. Exhibits. The following exhibits are filed with this annual report on Form 10-K:
102
Incorporated by
Reference Exhibit
No. Exhibit Form File No. Filing Date
Exhibit No.
Filed Herewith
3.01 Memorandum of Association, as amended 10-K 000-23354 05-29-07 3.01

Table of Contents
103
Incorporated by
Reference Exhibit
No. Exhibit Form File No. Filing Date
Exhibit No.
Filed Herewith
3.02 Amended and Restated Articles of Association of Flextronics International Ltd.
8-K 000-23354 10-11-06 3.01
4.01
Credit Agreement, dated as of October 19, 2011, by and among Flextronics International Ltd. and certain of its subsidiaries as borrowers, Bank of America, N.A., as Administrative Agent and Swing Line Lender, and the other Lenders party thereto.
8-K
000-23354
10-24-11
10.01
4.02
Term Loan Agreement, dated as of October 1, 2007, among Flextronics International Ltd., as a Borrower, Flextronics International USA, Inc., as U.S. Borrower, Citicorp North America, Inc., as Administrative Agent, Citigroup Global Markets Inc., as Sole Lead Arranger, Bookrunner and Syndication Agent and the Lenders from time to time party thereto.
8-K
000-23354
10-05-07
10.1
4.03
Amendment No. 1 to Term Loan Agreement, dated as of October 22, 2007, among Flextronics International Ltd., as a Borrower, Flextronics International USA, Inc., as U.S. Borrower, Citicorp North America, Inc., as Administrative Agent, and the Lenders party thereto
10-Q
000-23354
02-07-08
10.01
4.04
Amendment No. 2 to Term Loan Agreement, dated as of October 22, 2007, among Flextronics International Ltd., as a Borrower, Flextronics International USA, Inc., as U.S. Borrower, Citicorp North America, Inc., as Administrative Agent, and the Lenders party thereto
10-Q
000-23354
02-07-08
10.02
10.01
Form of Indemnification Agreement between the Registrant and its Directors and certain officers.†
10-K
000-23354
05-20-09
10.1
10.02
Form of Indemnification Agreement between Flextronics Corporation and Directors and certain officers of the Registrant.†
10-K
000-23354
05-20-09
10.2
10.03
Registrant's 1993 Share Option Plan, as amended.†
8-K
000-23354
07-14-09
10.04
10.04
Registrant's 1998 Interim Stock Plan.†
S-8
333-71049
01-22-99
4.5
10.05
Registrant's 1999 Interim Stock Plan.†
S-8
333-71049
01-22-99
4.6
10.06
Flextronics International Ltd. 2001 Equity Incentive Plan, as amended.†
10-Q
000-23354
11-03-09
10.01
10.07
Registrant's 2002 Interim Incentive Plan, as amended.†
8-K
000-23354
07-14-09
10.02
10.08
Flextronics International USA, Inc. 401(k) Plan.†
S-1
33-74622
01-31-94
10.52
10.09
Registrant's 2004 Award Plan for New Employees, as amended.†
8-K
000-23354
07-14-09
10.09
10.10
Flextronics International Ltd. 2010 Equity Incentive Plan.†
8-K
000-23354
07-28-10
10.01
10.11
Form of Share Option Award Agreement under 2010 Equity Incentive Plan†
10-Q
000-23354
08-05-10
10.02
10.12
Form of Restricted Share Unit Award Agreement under 2010 Equity Incentive Plan†
10-Q
000-23354
08-05-10
10.03
10.13
Form of Share Bonus Award Agreement under 2001 Equity Incentive Plan†
10-Q
000-23354
08-05-10
10.04


Table of Contents
Incorporated by
Reference Exhibit
No. Exhibit Form File No. Filing Date
Exhibit No.
Filed Herewith
10.14 Flextronics International USA, Inc. Third Amended and Restated 2005 Senior Management Deferred Compensation Plan†
10-Q 000-23354 02-05-09 10.02
10.15
Flextronics International USA, Inc. Third Amended and Restated Senior Executive Deferred Compensation Plan†
10-Q
000-23354
02-05-09
10.01
10.16
Summary of Directors' Compensation†
10-Q
000-23354
08-09-11
10.04
10.17
Solectron Corporation 2002 Stock Plan, as amended.†
10-Q
000-23354
11-03-09
10.02
10.18
Description of Non-Executive Chairman's Compensation†
10-Q
000-23354
08-05-10
10.11
10.19
Award Agreement for Paul Read under Senior Management Deferred Compensation Plan, dated June 30, 2005.†
10-Q
000-23354
08-05-08
10.03
10.20
Award Agreement for Paul Read under Senior Executive Deferred Compensation Plan.†
10-Q
000-23354
02-05-09
10.03
10.21
Award Agreement for Michael J. Clarke under Senior Management Deferred Compensation Plan, dated July 31, 2007.†
10-K
000-23354
05-20-09
10.23
10.22
Award Agreement for Francois Barbier under Senior Management Deferred Compensation Plan, dated July 22, 2005.†
10-Q
000-23354
08-05-10
10.08
10.23
Award Agreement for Werner Widmann Deferred Compensation Plan, dated as of July 22, 2005.†
8-K
000-23354
07-07-06
10.01
10.24
Addendum to Award Agreement for Werner Widmann Deferred Compensation Plan, dated as of June 30, 2006.†
8-K
000-23354
07-07-06
10.02
10.25
Description of Annual Incentive Bonus Plan for Fiscal 2012†
10-Q
000-23354
08-09-11
10.02
10.26
Compensation Arrangements of Certain Executive Officers of Flextronics International Ltd.†
10-Q
000-23354
08-09-11
10.03
10.27
Executive Incentive Compensation Recoupment Policy†
10-Q
000-23354
08-05-10
10.06
10.28
Francois Barbier Offer Letter, dated as of July 1, 2010†
8-K
000-23354
09-03-10
10.01
10.29
Francois Barbier Relocation Expenses Addendum, dated as of July 1, 2010†
8-K
000-23354
09-03-10
10.02
10.30
Francois Barbier Confirmation Date Letter, dated as of August 30, 2010†
8-K
000-23354
09-03-10
10.03
10.31
2010 Flextronics International USA, Inc. Deferred Compensation Plan†
10-Q
000-23354
11-03-10
10.04
10.32
Form of Restricted Stock Unit Award Under 2010 Equity Incentive Plan†
10-Q
000-23354
08-09-11
10.01
21.01
Subsidiaries of Registrant.
X
23.01
Consent of Deloitte & Touche LLP.
X
24.01
Power of Attorney (included on the signature page to this Form 10-K)
X

104
31.01 Certification of Chief Executive Officer pursuant to Rule 13a-14(a) of the Exchange Act
X

Table of Contents
105
Incorporated by
Reference Exhibit
No. Exhibit Form File No. Filing Date
Exhibit No.
Filed Herewith
31.02 Certification of Chief Financial Officer pursuant to Rule 13a-14(a) of the Exchange Act
X
32.01*
Certification of the Chief Executive Officer pursuant to Rule 13a-14(b) of the Exchange Act and 18 U.S.C. Section 1350
X
32.02*
Certification of the Chief Financial Officer pursuant to Rule 13a-14(b) of the Exchange Act and 18 U.S.C. Section 1350
X
101.INS
XBRL Instance Document
X
101.SCH
XBRL Taxonomy Extension Scheme Document
X
101.CAL
XBRL Taxonomy Extension Calculation Linkbase Document
X
101.DEF
XBRL Taxonomy Extension Definition Linkbase Document
X
101.LAB
XBRL Taxonomy Extension Label Linkbase Document
X
101.PRE
XBRL Taxonomy Extension Presentation Linkbase Document
X
* This exhibit is furnished with this Annual Report on Form 10-K, is not deemed filed with the Securities and Exchange Commission, and is not incorporated by reference into any filing of Flextronics International Ltd. under the Securities Act of 1933, as amended, or the Securities Exchange Act of 1934, as amended, whether made before or after the date hereof and irrespective of any general incorporation language contained in such filing.
† Management contract, compensatory plan or arrangement.
Table of Contents
SIGNATURES
Pursuant to the requirement of Section 13 or 15(d) of the Securities Exchange Act of 1934, the Registrant has duly caused this Report to be signed on its behalf by the undersigned, thereunto duly authorized.
Date: May 25, 2012
POWER OF ATTORNEY
KNOW ALL PERSONS BY THESE PRESENTS, that each person whose signature appears below constitutes and appoints jointly and severally, Michael M. McNamara and Paul Read and each one of them, his attorneys-in-fact, each with the power of substitution, for him in any and all capacities, to sign any and all amendments to this Report, and to file the same, with exhibits thereto and other documents in connection therewith, with the Securities and Exchange Commission, hereby ratifying and confirming all that each of said attorneys-in-fact, or his substitutes, may do or cause to be done by virtue hereof.
Pursuant to the requirements of the Securities Exchange Act of 1934, this report has been signed below by the following persons on behalf of the Registrant and in the capacities and on the dates indicated.
106
Flextronics International Ltd.
By:
/s/ MICHAEL M. MCNAMARA
Michael M. McNamara Chief Executive Officer
Signature Title Date
/s/ MICHAEL M. MCNAMARA
Michael M. McNamara
Chief Executive Officer and Director (Principal Executive Officer)
May 25, 2012
/s/ PAUL READ
Paul Read
Chief Financial Officer
(Principal Financial Officer)
May 25, 2012
/s/ CHRISTOPHER COLLIER
Christopher Collier
Senior Vice President, Finance (Principal Accounting Officer)
May 25, 2012
/s/ H. RAYMOND BINGHAM
H. Raymond Bingham
Chairman of the Board
May 25, 2012
/s/ JAMES A. DAVIDSON
James A. Davidson
Director
May 25, 2012

Table of Contents
107
Signature Title Date
/s/ ROBERT L. EDWARDS
Robert L. Edwards
Director May 25, 2012
/s/ DANIEL H. SCHULMAN
Daniel H. Schulman
Director
May 25, 2012
/s/ WILLY SHIH, PH.D.
Willy Shih, Ph.D.
Director
May 25, 2012
/s/ LIP-BU TAN
Lip-Bu Tan
Director
May 25, 2012
/s/ WILLIAM D. WATKINS
William D. Watkins
Director
May 25, 2012
/s/ LAY KOON TAN
Lay Koon Tan
Director
May 25, 2012

Table of Contents
EXHIBIT INDEX
108
Incorporated by Reference Exhibit
No. Exhibit Form File No. Filing Date
Exhibit No.
Filed Herewith
3.01 Memorandum of Association, as amended 10-K 000-23354 05-29-07 3.01 3.02
Amended and Restated Articles of Association of Flextronics International Ltd.
8-K
000-23354
10-11-06
3.01
4.01
Credit Agreement, dated as of October 19, 2011, by and among Flextronics International Ltd. and certain of its subsidiaries, as borrowers, Bank of America, N.A., as Administrative Agent and Swing Line Lender, and the other Lenders party thereto.
8-K
000-23354
10-24-11
10.01
4.02
Term Loan Agreement, dated as of October 1, 2007, among Flextronics International Ltd., as a Borrower, Flextronics International USA, Inc., as U.S. Borrower, Citicorp North America, Inc., as Administrative Agent, Citigroup Global Markets Inc., as Sole Lead Arranger, Bookrunner and Syndication Agent and the Lenders from time to time party thereto.
8-K
000-23354
10-05-07
10.1
4.03
Amendment No. 1 to Term Loan Agreement, dated as of October 22, 2007, among Flextronics International Ltd., as a Borrower, Flextronics International USA, Inc., as U.S. Borrower, Citicorp North America, Inc., as Administrative Agent, and the Lenders party thereto
10-Q
000-23354
02-07-08
10.01
4.04
Amendment No. 2 to Term Loan Agreement, dated as of October 22, 2007, among Flextronics International Ltd., as a Borrower, Flextronics International USA, Inc., as U.S. Borrower, Citicorp North America, Inc., as Administrative Agent, and the Lenders party thereto
10-Q
000-23354
02-07-08
10.02
10.01
Form of Indemnification Agreement between the Registrant and its Directors and certain officers.†
10-K
000-23354
05-20-09
10.1
10.02
Form of Indemnification Agreement between Flextronics Corporation and Directors and certain officers of the Registrant.†
10-K
000-23354
05-20-09
10.2
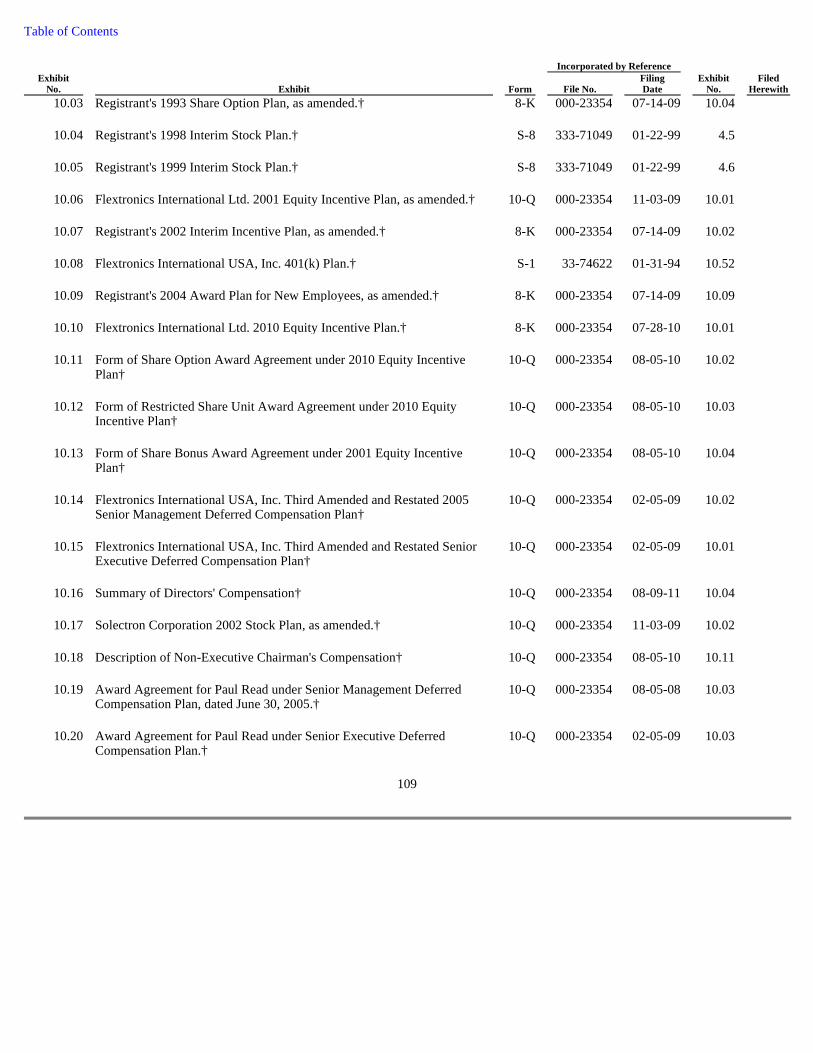
Table of Contents
109
Incorporated by Reference Exhibit
No. Exhibit Form File No. Filing Date
Exhibit No.
Filed Herewith
10.03 Registrant's 1993 Share Option Plan, as amended.† 8-K 000-23354 07-14-09 10.04 10.04
Registrant's 1998 Interim Stock Plan.†
S-8
333-71049
01-22-99
4.5
10.05
Registrant's 1999 Interim Stock Plan.†
S-8
333-71049
01-22-99
4.6
10.06
Flextronics International Ltd. 2001 Equity Incentive Plan, as amended.†
10-Q
000-23354
11-03-09
10.01
10.07
Registrant's 2002 Interim Incentive Plan, as amended.†
8-K
000-23354
07-14-09
10.02
10.08
Flextronics International USA, Inc. 401(k) Plan.†
S-1
33-74622
01-31-94
10.52
10.09
Registrant's 2004 Award Plan for New Employees, as amended.†
8-K
000-23354
07-14-09
10.09
10.10
Flextronics International Ltd. 2010 Equity Incentive Plan.†
8-K
000-23354
07-28-10
10.01
10.11
Form of Share Option Award Agreement under 2010 Equity Incentive Plan†
10-Q
000-23354
08-05-10
10.02
10.12
Form of Restricted Share Unit Award Agreement under 2010 Equity Incentive Plan†
10-Q
000-23354
08-05-10
10.03
10.13
Form of Share Bonus Award Agreement under 2001 Equity Incentive Plan†
10-Q
000-23354
08-05-10
10.04
10.14
Flextronics International USA, Inc. Third Amended and Restated 2005 Senior Management Deferred Compensation Plan†
10-Q
000-23354
02-05-09
10.02
10.15
Flextronics International USA, Inc. Third Amended and Restated Senior Executive Deferred Compensation Plan†
10-Q
000-23354
02-05-09
10.01
10.16
Summary of Directors' Compensation†
10-Q
000-23354
08-09-11
10.04
10.17
Solectron Corporation 2002 Stock Plan, as amended.†
10-Q
000-23354
11-03-09
10.02
10.18
Description of Non-Executive Chairman's Compensation†
10-Q
000-23354
08-05-10
10.11
10.19
Award Agreement for Paul Read under Senior Management Deferred Compensation Plan, dated June 30, 2005.†
10-Q
000-23354
08-05-08
10.03
10.20
Award Agreement for Paul Read under Senior Executive Deferred Compensation Plan.†
10-Q
000-23354
02-05-09
10.03
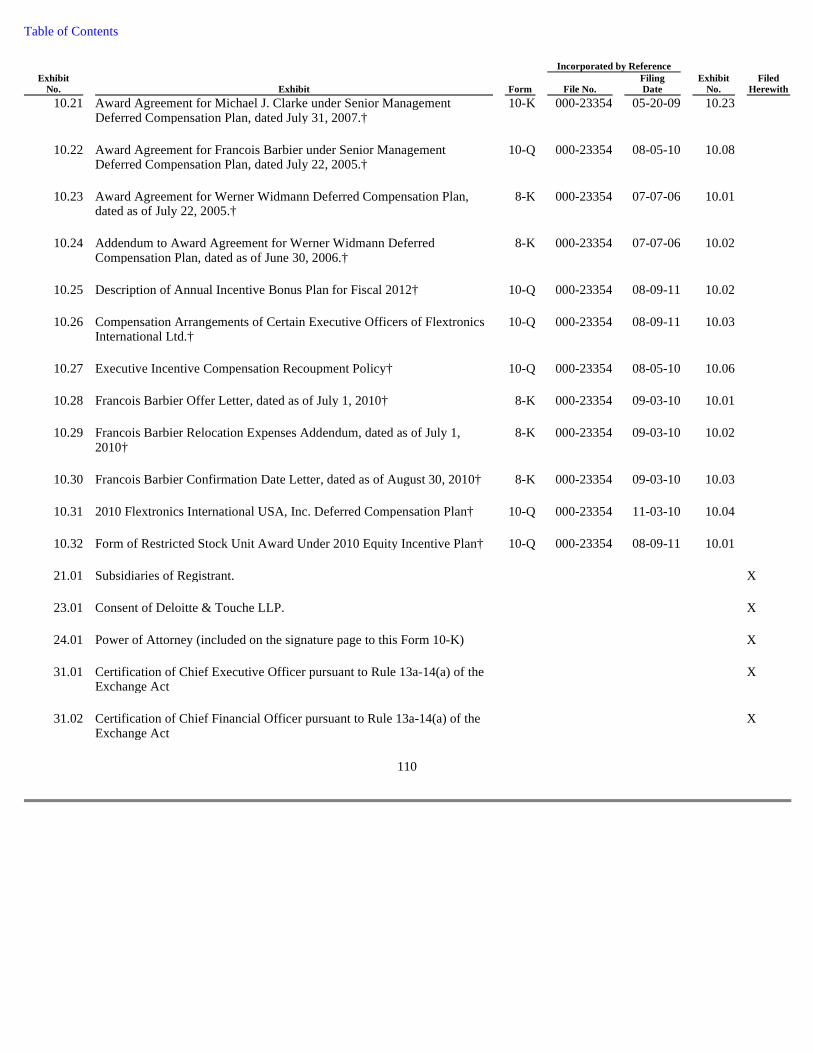
Table of Contents
110
Incorporated by Reference Exhibit
No. Exhibit Form File No. Filing Date
Exhibit No.
Filed Herewith
10.21 Award Agreement for Michael J. Clarke under Senior Management Deferred Compensation Plan, dated July 31, 2007.†
10-K 000-23354 05-20-09 10.23
10.22
Award Agreement for Francois Barbier under Senior Management Deferred Compensation Plan, dated July 22, 2005.†
10-Q
000-23354
08-05-10
10.08
10.23
Award Agreement for Werner Widmann Deferred Compensation Plan, dated as of July 22, 2005.†
8-K
000-23354
07-07-06
10.01
10.24
Addendum to Award Agreement for Werner Widmann Deferred Compensation Plan, dated as of June 30, 2006.†
8-K
000-23354
07-07-06
10.02
10.25
Description of Annual Incentive Bonus Plan for Fiscal 2012†
10-Q
000-23354
08-09-11
10.02
10.26
Compensation Arrangements of Certain Executive Officers of Flextronics International Ltd.†
10-Q
000-23354
08-09-11
10.03
10.27
Executive Incentive Compensation Recoupment Policy†
10-Q
000-23354
08-05-10
10.06
10.28
Francois Barbier Offer Letter, dated as of July 1, 2010†
8-K
000-23354
09-03-10
10.01
10.29
Francois Barbier Relocation Expenses Addendum, dated as of July 1, 2010†
8-K
000-23354
09-03-10
10.02
10.30
Francois Barbier Confirmation Date Letter, dated as of August 30, 2010†
8-K
000-23354
09-03-10
10.03
10.31
2010 Flextronics International USA, Inc. Deferred Compensation Plan†
10-Q
000-23354
11-03-10
10.04
10.32
Form of Restricted Stock Unit Award Under 2010 Equity Incentive Plan†
10-Q
000-23354
08-09-11
10.01
21.01
Subsidiaries of Registrant.
X
23.01
Consent of Deloitte & Touche LLP.
X
24.01
Power of Attorney (included on the signature page to this Form 10-K)
X
31.01
Certification of Chief Executive Officer pursuant to Rule 13a-14(a) of the Exchange Act
X
31.02
Certification of Chief Financial Officer pursuant to Rule 13a-14(a) of the Exchange Act
X
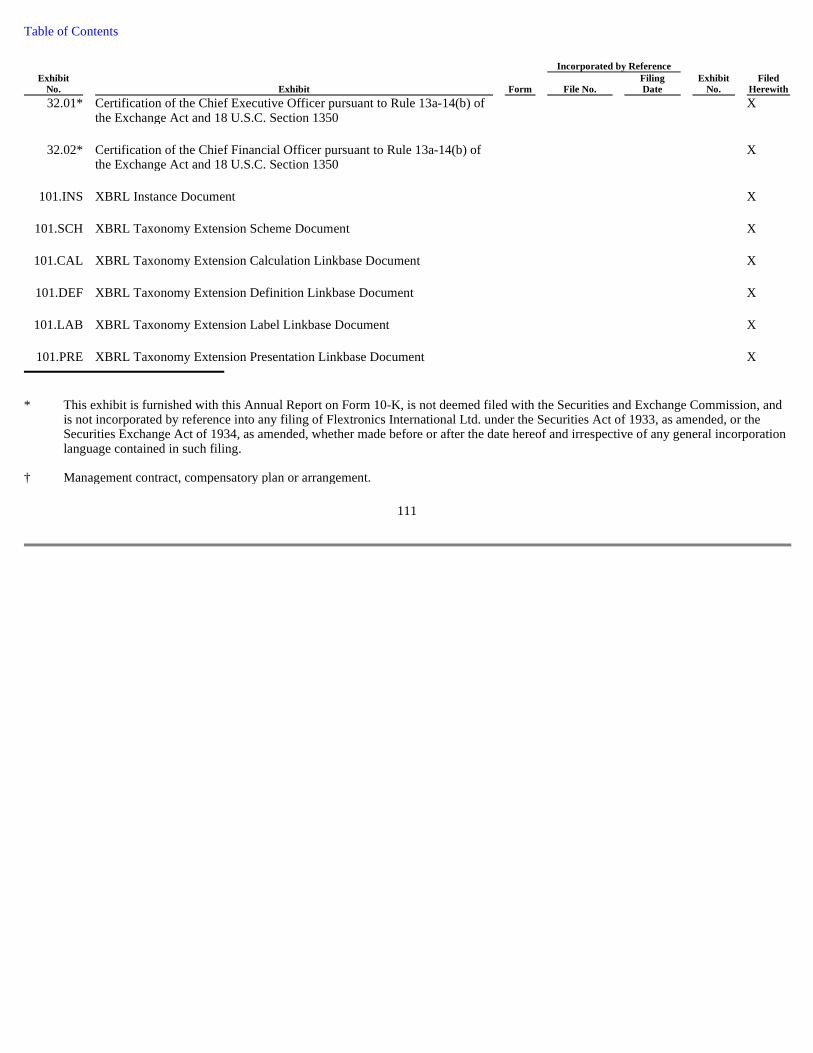
Table of Contents
111
Incorporated by Reference Exhibit
No. Exhibit Form File No. Filing Date
Exhibit No.
Filed Herewith
32.01* Certification of the Chief Executive Officer pursuant to Rule 13a-14(b) of the Exchange Act and 18 U.S.C. Section 1350
X
32.02*
Certification of the Chief Financial Officer pursuant to Rule 13a-14(b) of the Exchange Act and 18 U.S.C. Section 1350
X
101.INS
XBRL Instance Document
X
101.SCH
XBRL Taxonomy Extension Scheme Document
X
101.CAL
XBRL Taxonomy Extension Calculation Linkbase Document
X
101.DEF
XBRL Taxonomy Extension Definition Linkbase Document
X
101.LAB
XBRL Taxonomy Extension Label Linkbase Document
X
101.PRE
XBRL Taxonomy Extension Presentation Linkbase Document
X
* This exhibit is furnished with this Annual Report on Form 10-K, is not deemed filed with the Securities and Exchange Commission, and is not incorporated by reference into any filing of Flextronics International Ltd. under the Securities Act of 1933, as amended, or the Securities Exchange Act of 1934, as amended, whether made before or after the date hereof and irrespective of any general incorporation language contained in such filing.
† Management contract, compensatory plan or arrangement.

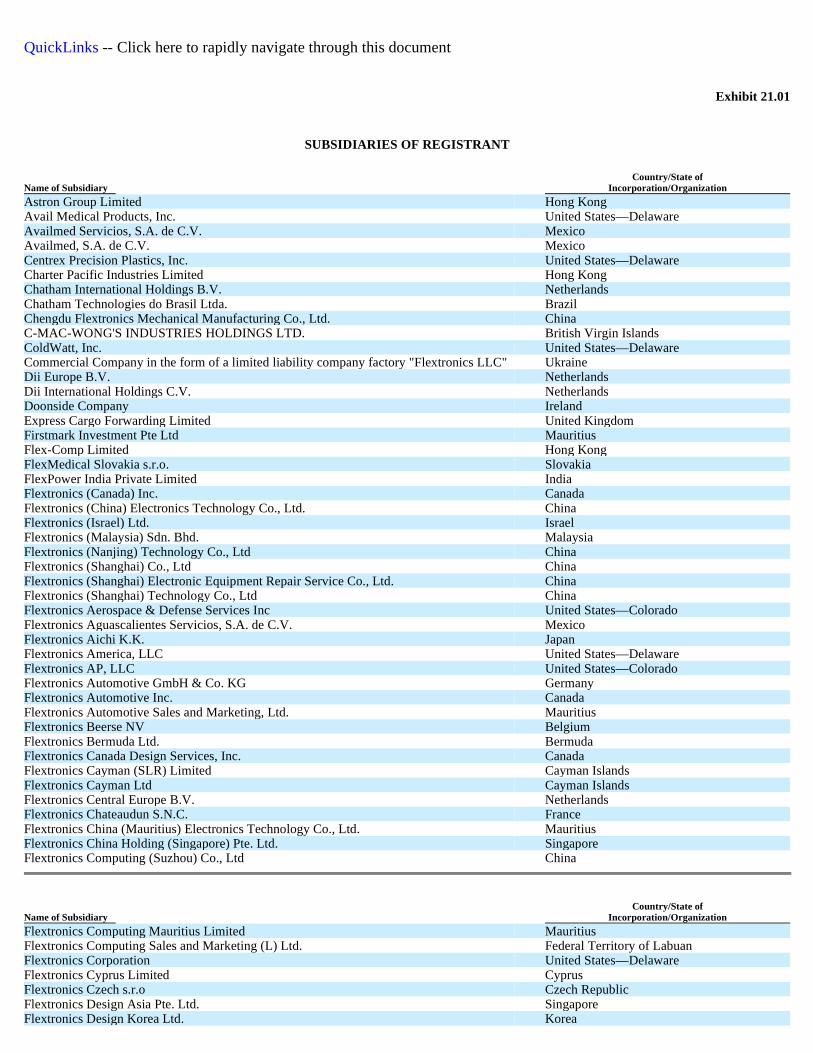
QuickLinks -- Click here to rapidly navigate through this document
Exhibit 21.01
SUBSIDIARIES OF REGISTRANT
Name of Subsidiary Country/State of
Incorporation/Organization
Astron Group Limited Hong Kong Avail Medical Products, Inc. United States—Delaware Availmed Servicios, S.A. de C.V. Mexico Availmed, S.A. de C.V. Mexico Centrex Precision Plastics, Inc. United States—Delaware Charter Pacific Industries Limited Hong Kong Chatham International Holdings B.V. Netherlands Chatham Technologies do Brasil Ltda. Brazil Chengdu Flextronics Mechanical Manufacturing Co., Ltd. China C-MAC-WONG'S INDUSTRIES HOLDINGS LTD. British Virgin Islands ColdWatt, Inc. United States—Delaware Commercial Company in the form of a limited liability company factory "Flextronics LLC" Ukraine Dii Europe B.V. Netherlands Dii International Holdings C.V. Netherlands Doonside Company Ireland Express Cargo Forwarding Limited United Kingdom Firstmark Investment Pte Ltd Mauritius Flex-Comp Limited Hong Kong FlexMedical Slovakia s.r.o. Slovakia FlexPower India Private Limited India Flextronics (Canada) Inc. Canada Flextronics (China) Electronics Technology Co., Ltd. China Flextronics (Israel) Ltd. Israel Flextronics (Malaysia) Sdn. Bhd. Malaysia Flextronics (Nanjing) Technology Co., Ltd China Flextronics (Shanghai) Co., Ltd China Flextronics (Shanghai) Electronic Equipment Repair Service Co., Ltd. China Flextronics (Shanghai) Technology Co., Ltd China Flextronics Aerospace & Defense Services Inc United States—Colorado Flextronics Aguascalientes Servicios, S.A. de C.V. Mexico Flextronics Aichi K.K. Japan Flextronics America, LLC United States—Delaware Flextronics AP, LLC United States—Colorado Flextronics Automotive GmbH & Co. KG Germany Flextronics Automotive Inc. Canada Flextronics Automotive Sales and Marketing, Ltd. Mauritius Flextronics Beerse NV Belgium Flextronics Bermuda Ltd. Bermuda Flextronics Canada Design Services, Inc. Canada Flextronics Cayman (SLR) Limited Cayman Islands Flextronics Cayman Ltd Cayman Islands Flextronics Central Europe B.V. Netherlands Flextronics Chateaudun S.N.C. France Flextronics China (Mauritius) Electronics Technology Co., Ltd. Mauritius Flextronics China Holding (Singapore) Pte. Ltd. Singapore Flextronics Computing (Suzhou) Co., Ltd China
Name of Subsidiary Country/State of
Incorporation/Organization
Flextronics Computing Mauritius Limited Mauritius Flextronics Computing Sales and Marketing (L) Ltd. Federal Territory of Labuan Flextronics Corporation United States—Delaware Flextronics Cyprus Limited Cyprus Flextronics Czech s.r.o Czech Republic Flextronics Design Asia Pte. Ltd. Singapore Flextronics Design Korea Ltd. Korea

Flextronics Design Labuan Ltd. Federal Territory of Labuan Flextronics Design Private Limited India Flextronics Design SRL Italy Flextronics Design, s.r.o. Czech Republic Flextronics Eastern Canada Inc. Canada Flextronics Electronic Manufacturing (Shenzhen) Co. Limited China Flextronics Electronics (H.K.) Limited Hong Kong Flextronics Electronics (Mauritius) Limited Mauritius Flextronics Electronics Technology (Shenzhen) Co., Ltd. China Flextronics Electronics Technology (Suzhou) Co., Ltd. China Flextronics EMS Canada Inc. Canada Flextronics Enclosure (Shenzhen) Ltd. China Flextronics Enclosure (Zhuhai) Co., Ltd. China Flextronics Enclosure Shenzhen (Mauritius) Ltd. Mauritius Flextronics Enclosure Systems (Changzhou) Ltd. China Flextronics Enclosure Systems (Shenzhen) Ltd. China Flextronics Enclosure Systems Shenzhen (Mauritius) Ltd Mauritius Flextronics Enclosure Systems, Inc. United States—Delaware Flextronics Enclosure Zhuhai (Mauritius) Co., Ltd. Mauritius Flextronics Enclosures (Hong Kong) Ltd. Hong Kong Flextronics Europe Holdings C.V. Netherlands Flextronics Europe Holdings LLC United States—Delaware Flextronics Europe Ltd United Kingdom Flextronics Fabricação de Equipamentos do Brasil Ltda. Brazil Flextronics Foundation United States—California Flextronics Funding LLC United States—Delaware Flextronics Germany Holding GmbH Germany Flextronics Global Enclosures (Shanghai) Co., Ltd. China Flextronics Global Enclosures (Singapore) Pte. Ltd. Singapore Flextronics Global Enclosures Shanghai (Mauritius) Co., Ltd Mauritius Flextronics Global Holdings II Ltd. Cayman Islands Flextronics Global Holdings L.P. Cayman Islands Flextronics Global Mexico II, S. de R.L. de C.V. Mexico Flextronics Global Procurement Ltd. Bermuda Flextronics Global Services (Hong Kong) Limited Hong Kong Flextronics Global Services (Manchester) Limited United Kingdom Flextronics Global Services (Singapore) Pte. Ltd. Singapore Flextronics Global Services Canada Inc. Canada Flextronics Global Services Lojistik Hizmetleri Limited Sirketi Turkey Flextronics Global Technology (Singapore) Pte. Ltd. Singapore Flextronics Guadalajara Group, S. de R.L. de C.V. Mexico Flextronics Holding (Singapore) Pte. Ltd. Singapore Flextronics Holding Finland Oy Finland Flextronics Holding France S.A. France Flextronics Holding GmbH Germany
Name of Subsidiary Country/State of
Incorporation/Organization
Flextronics Holding USA, Inc. United States—Delaware Flextronics Holdings (BVI) Limited British Virgin Islands Flextronics Holdings Mexico Dos, S.A. de C.V. Mexico Flextronics Holdings Mexico, S.A. de C.V. Mexico Flextronics Holdings Texas LLC United States—Colorado Flextronics Ind. (Malaysia) Sdn. Bhd. Malaysia Flextronics Industrial (Shenzhen) Co., Ltd. China Flextronics Industrial (Suzhou) Co., Ltd. China Flextronics Industrial (Zhuhai) Co., Ltd. China Flextronics Industrial DongGuan Limited China Flextronics Industrial Ltd. Mauritius Flextronics Industrial Shenzhen (Mauritius) Co Ltd. Mauritius Flextronics Industrial Zhuhai (Mauritius) Co., Ltd. Mauritius Flextronics Industries (H.K.) Limited Hong Kong Flextronics Industries Marketing (L) Ltd. Federal Territory of Labuan Flextronics Industries Singapore Ltd. Singapore Flextronics Information Technology (Shen Zhen) Co., Ltd. China Flextronics Information Technology Shen Zhen (Mauritius) Co., Ltd. Mauritius Flextronics Instituto de Tecnologia Brazil

Flextronics International (Singapore Group) Pte. Ltd. Singapore Flextronics International (UK) Ltd United Kingdom Flextronics International AB Sweden Flextronics International Aguascalientes (L) Ltd. Federal Territory of Labuan Flextronics International Asia-Pacific Ltd Mauritius Flextronics International Cayman LLC United States—Delaware Flextronics International Cork B.V. Netherlands Flextronics International Denmark A/S Denmark Flextronics International Europe B.V. Netherlands Flextronics International Germany GmbH & Co. KG Germany Flextronics International Gesellschaft m.b.H. Austria Flextronics International Holding LLC United States—California Flextronics International Holdings Pte. Ltd. Singapore Flextronics International Ireland Limited Ireland Flextronics International Japan Co., Ltd Japan Flextronics International Kft. Hungary Flextronics International Latin America (L) Ltd. Federal Territory of Labuan Flextronics International Management Services Ltd. Mauritius Flextronics International N.V. Curacao (Netherlands Antilles) Flextronics International Norway Norway Flextronics International Ostersund AB Sweden Flextronics International PA, Inc. United States—California Flextronics International Poland sp. z o.o. Poland Flextronics International s.r.o. Czech Republic Flextronics International Singapore Pte. Ltd. Singapore Flextronics International Sweden AB Sweden Flextronics International Taiwan Ltd. Taiwan Flextronics International Technology LLC United States—Delaware Flextronics International Tecnologia Ltda Brazil Flextronics International USA, Inc. United States—California Flextronics Investment Holding (Singapore) Pte. Ltd. Singapore Flextronics Investment Holding GmbH Germany
Name of Subsidiary Country/State of
Incorporation/Organization
Flextronics Ireland Ireland Flextronics Ireland (Cayman) Limited Cayman Islands Flextronics Ireland Holdings Cayman Islands Flextronics Italy S.p.A. Italy Flextronics Laval S.N.C. France Flextronics Logistics (Hong Kong) Limited Hong Kong Flextronics Logistics (Zhuhai) Co., Limited China Flextronics Logistics B.V. Netherlands Flextronics Logistics Poland sp. z o.o. Poland Flextronics Logistics USA, Inc. United States—California Flextronics Logistics Zhuhai (Mauritius) Co., Limited Mauritius Flextronics Manufacturing (H.K.) Ltd. Hong Kong Flextronics Manufacturing (Shanghai) Co., Ltd. China Flextronics Manufacturing (Singapore) Pte. Ltd. Singapore Flextronics Manufacturing (Zhuhai) Co., Ltd China Flextronics Manufacturing Aguascalientes, S.A. de C.V. Mexico Flextronics Manufacturing Europe B.V. Netherlands Flextronics Manufacturing Juarez, S. de R.L. de C.V. Mexico Flextronics Manufacturing Mex, S.A. de C.V. Mexico Flextronics Manufacturing Shanghai (Mauritius) Co., Ltd. Mauritius Flextronics Manufacturing Texas LLC United States—Colorado Flextronics Manufacturing Zhuhai (Mauritius) Co., Ltd. Mauritius Flextronics Marketing (L) Ltd. Federal Territory of Labuan Flextronics Marplace (Number 382) Limited United Kingdom Flextronics Mauritius (L) Limited Mauritius Flextronics Mauritius Holdings Limited Mauritius Flextronics Mauritius Limited Mauritius Flextronics Mechanicals Marketing (L) Ltd. Federal Territory of Labuan Flextronics Mechanicals Singapore Pte. Ltd. Singapore Flextronics Medical Sales and Marketing, Ltd Mauritius Flextronics Metal Specialties, Inc. United States—Illinois Flextronics Mexico Holdings II LLC United States—Delaware

Flextronics Mexico Holdings LLC United States—Delaware Flextronics Mould Manufacturing Pte. Ltd Singapore Flextronics Network Services GmbH Germany Flextronics Network Services Sweden AB Sweden Flextronics ODM Finland Oy Finland Flextronics ODM Luxembourg SA Luxembourg Flextronics ODM Netherlands N.V. Netherlands Flextronics Ostersund AB Sweden Flextronics OTM Ltd. Israel Flextronics Participacioes Ltda. Brazil Flextronics Photonics PPT, Inc. United States—Oregon Flextronics Plastic (Asia Pacific) Limited Hong Kong Flextronics Plastic (Shanghai) Co., Ltd. China Flextronics Plastic Manufacturing (Shenzhen) Co. Limited China Flextronics Plastic Shanghai (Mauritius) Co., Ltd. Mauritius Flextronics Plastic Technology (ShenZhen) Ltd. China Flextronics Plastic Technology ShenZhen (Mauritius) Ltd. Mauritius Flextronics Plastics (M) Sdn. Bhd. Malaysia Flextronics Plastics (Singapore) Pte. Ltd. Singapore Flextronics Plastics (Zhuhai) Co., Ltd China
Name of Subsidiary Country/State of
Incorporation/Organization
Flextronics Plastics, S.A. de C.V. Mexico Flextronics Plastics Zhuhai (Mauritius) Co., Ltd. Mauritius Flextronics Power Systems (Dongguan) Co., Ltd. China Flextronics Puerto Rico Limited Cayman Islands Flextronics R&D (Shenzhen) Co., Ltd. China Flextronics R&D Shenzhen (Mauritius) Co., Ltd. Mauritius Flextronics Romania S.R.L. Romania Flextronics S.R.L. Italy Flextronics Sales & Marketing (A-P) Ltd. Mauritius Flextronics Sales & Marketing (China) Ltd. Mauritius Flextronics Sales & Marketing North Asia (L) Ltd. Federal Territory of Labuan Flextronics Sales and Marketing Consumer Digital Ltd. Mauritius Flextronics Sárvár Logistics Korlátolt Felelösségü Társaság Hungary Flextronics Scotland Ltd United Kingdom Flextronics Semiconductor, Inc. United States—Delaware Flextronics Services (Singapore) Pte. Ltd. Singapore Flextronics Servicios Guadalajara, S.A. de C.V. Mexico Flextronics Shanghai (Mauritius) Co., Ltd. Mauritius Flextronics Shanghai Electronic Equipment Repair Service (Mauritius) Co., Ltd. Mauritius Flextronics SMI (China) Ltd Mauritius Flextronics Systems Texas Ltd. United States—Texas Flextronics Technologies (India) Pvt Ltd. India Flextronics Technologies Japan K.K. Japan Flextronics Technologies Mexico, S. de R.L. de C.V. Mexico Flextronics Technology (Malaysia) Sdn. Bhd. Malaysia Flextronics Technology (Penang) Sdn. Bhd. Malaysia Flextronics Technology (Shah Alam) Sdn. Bhd. Malaysia Flextronics Technology (Shanghai) Co., Ltd. China Flextronics Technology (ShenZhen) Co., Ltd China Flextronics Technology (Singapore) Pte. Ltd. Singapore Flextronics Technology (Zhuhai) Co. Ltd. China Flextronics Technology Nanjing (Mauritius) Co., Ltd Mauritius Flextronics Technology Shanghai (Mauritius) Co., Ltd. Mauritius Flextronics Technology ShenZhen (Mauritius) Co., Ltd Mauritius Flextronics Technology Wujiang (Mauritius) Ltd Mauritius Flextronics Technology Zhuhai (Mauritius) Co., Ltd Mauritius Flextronics Tecnologia Do Brasil Ltd. Cayman Islands Flextronics Telecom Systems Ltd Mauritius Flextronics UK Limited United Kingdom Flextronics USA, Inc. United States—Delaware Flextronics Vagyonkezelo es Befektetesi Korlotolt Felelossegu Tarsasag Hungary Flextronics Verwaltungs GmbH Germany FLX Cyprus II Limited Cyprus FLX Cyprus Limited Cyprus

Forest Keyboard Manufacturing (ShenZhen) Ltd. China Forest Keyboard Manufacturing ShenZhen (Mauritius) Co., Ltd Mauritius Glouple Ventures 2000-I, LLC United States—Delaware Glouple Ventures 2000-II, LLC United States—Delaware Grupo Flextronics S.A. de C.V. Mexico I E C Holdings Limited Ireland

Name of Subsidiary Country/State of
Incorporation/Organization
Imerj Taiwan Limited Taiwan Imerj USA, Inc. United States—California Irish Express Cargo Limited Ireland Irish Express Logistics Limited Ireland Masa da Amazônia Ltda. Brazil Multek (FTZ) Limited China Multek China Limited China Multek Display (Hong Kong) Limited Hong Kong Multek Display Cayman Ltd. Cayman Islands Multek Display Ltd. China Multek Display US, Inc. United States—Delaware Multek Electronics Limited China Multek Flexible Circuits, Inc. United States—Delaware Multek Hong Kong Limited Hong Kong Multek Industries Limited China Multek Technologies Limited Mauritius Multek Technology (Zhuhai) Co Limited China Multek Zhuhai Limited China Multilayer Technology Geschaeftsfuehrungs-GmbH Germany Multilayer Technology GmbH & Co. KG Germany Nanjing Flextronics Panda Mobile Terminals Co., Ltd China Pacific Device, Inc. United States—Delaware Parque de Tecnologia Electronica, S.A. de C.V. Mexico Power Systems Technologies (Beijing) Company Limited China Power Systems Technologies (Ganzhou) Co., Ltd. China Power Systems Technologies (Shenzhen) Company Limited China Power Systems Technologies Far East Limited Hong Kong Power Systems Technologies GmbH Germany Power Systems Technologies Ltd. Mauritius Power Systems Technologies Services Company Limited Hong Kong PT. Flextronics Technology Indonesia Indonesia Solectron (Beijing) Electronics Equipment Repair Service Co., Ltd. China Solectron Argentina Distribution S.R.L. Argentina Solectron Australia Pty Limited Australia Solectron Belgium NV Belgium Solectron France SAS France Solectron GmbH Germany Solectron Grundbesitz Gmbh Germany Solectron Holding Deutschland Gmbh Germany Solectron Phillipines Inc. Philippines Solectron-Wong's (Huizhou) Industries Co., Ltd. China Swedform Enclosure Systems AB Sweden Swedform Holdings AB Sweden TCT Shareholdings Ltd. Cayman Islands The DII Group (BVI) Co. Limited British Virgin Islands The DII Group Asia Limited Hong Kong Vastbright PCB (Holding) Limited Hong Kong Vista Point Electronic Technologies (Zhuhai) Co., Ltd China Vista Point Technologies (Beijing) Ltd. China Vista Point Technologies (Colorado), LLC United States—Colorado Vista Point Technologies (Hungary) Vagyonkezelö Korlátolt Felelösségü Társaság Hungary

Avail Medical Products, Inc. does business under the following names
Centrex Precision Plastics, Inc. does business under the following names
Flextronics America, LLC. does business under the following names
Flextronics International USA, Inc. does business under the following names
Flextronics Logistics USA, Inc. does business under the following names
Imerj USA, Inc. does business under the following names
Name of Subsidiary Country/State of
Incorporation/Organization
Vista Point Technologies (Lux) S.a.r.l. Luxembourg Vista Point Technologies (Malaysia) Sdn. Bhd. Malaysia Vista Point Technologies (Mauritius) Ltd Mauritius Vista Point Technologies (USA) Inc. United States—Delaware Vista Point Technologies Manufacturing (HK) Limited Hong Kong Z124 Cayman Islands Z124 Canada Ltd. Canada Z124 Limited Hong Kong Z124 LLC United States—Colorado
Subsidiary dba
Avail Medical Products, Inc. Avail Medical Products, Inc. Southwest Division
Avail Medical Products, Inc. FlexMedical Disposables
Subsidiary dba
Centrex Precision Plastics, Inc. FlexMedical Disposables Centrex Precision Plastics, Inc. Avail Medical Products, Inc. Southeast
Division Centrex Precision Plastics, Inc. Avail Medical Products, Inc. Northeast
Division
Subsidiary dba
Flextronics America, LLC Suppliserv, A Flextronics Company Flextronics America, LLC ConFocus, A Flextronics Company Flextronics America, LLC Flextronics Global Enclosures Flextronics America, LLC FlexMedical Disposables
Subsidiary dba
Flextronics International USA, Inc. FinePitch Technology, A Flextronics Company
Subsidiary dba
Flextronics Logistics USA, Inc. Multek Distribution, Inc. Flextronics Logistics USA, Inc. Multek, Inc.
Subsidiary dba
Imerj USA, Inc. Flextronics Innovative Development

Multek Flexible Circuits, Inc. does business under the following names
Pacific Device, Inc. does business under the following names
Subsidiary dba
Multek Flexible Circuits, Inc. Sheldahl
Subsidiary dba
Pacific Device, Inc. Avail Medical Products, Inc. Pacific Device, Inc. FlexMedical Disposables

QuickLinks
Exhibit 21.01
SUBSIDIARIES OF REGISTRANT

QuickLinks -- Click here to rapidly navigate through this document
Exhibit 23.01
CONSENT OF INDEPENDENT REGISTERED PUBLIC ACCOUNTING FIRM
We consent to the incorporation by reference in Registration Statement Nos. 333-130253, 333-121814, 333-120291, 333-118499, 333-70492, 333-68238, 333-60968, 333-56230, 333-55530, 333-46200, and 333-41646 on Form S-3 and Nos. 333-157210, 333-146549, 333-146548, 333-143331, 333-143330, 333-55850, 333-34016, 333-95189, 333-71049, 333-42255, 333-126419, 333-121302, 333-120056, 333-119387, 333-103189, 333-75526, and 333-170710 on Form S-8 of our reports dated May 25, 2012, relating to the consolidated financial statements of Flextronics International Ltd. and subsidiaries ("the Company") and the effectiveness of the Company's internal control over financial reporting, appearing in the Annual Report on Form 10-K of the Company for the year ended March 31, 2012.
/s/ DELOITTE & TOUCHE LLP
San Jose, California May 25, 2012

QuickLinks
Exhibit 23.01
CONSENT OF INDEPENDENT REGISTERED PUBLIC ACCOUNTING FIRM
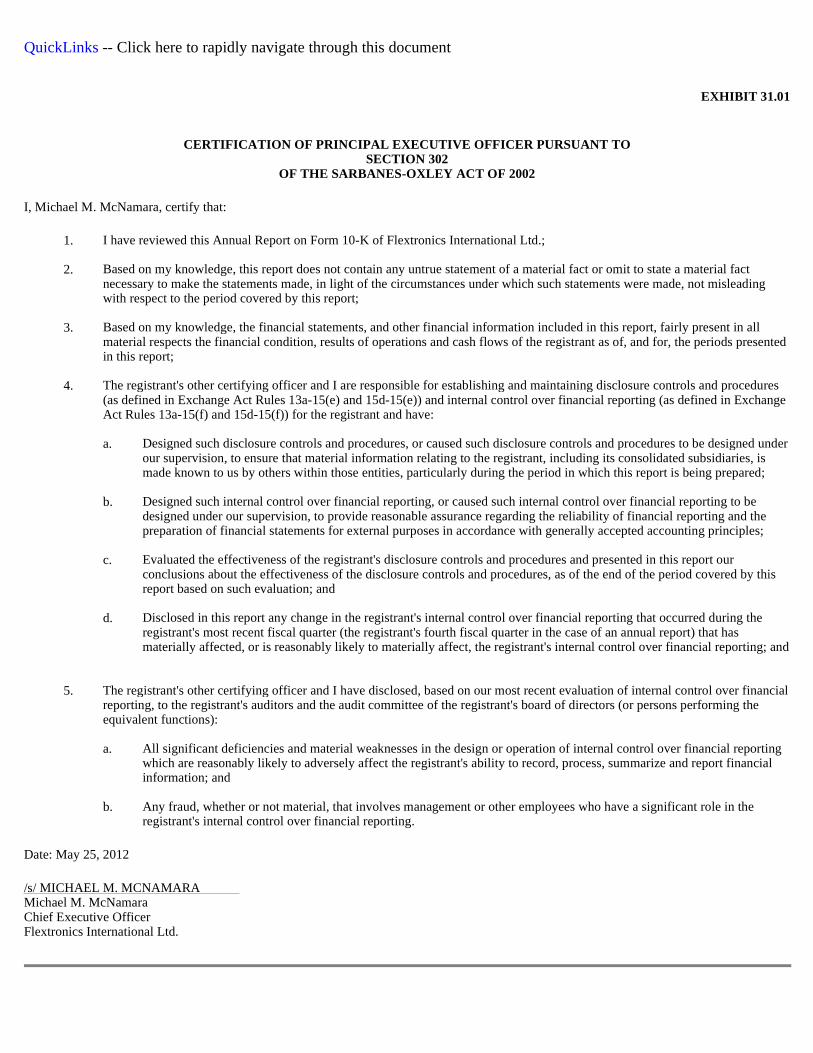
QuickLinks -- Click here to rapidly navigate through this document
EXHIBIT 31.01
CERTIFICATION OF PRINCIPAL EXECUTIVE OFFICER PURSUA NT TO
SECTION 302 OF THE SARBANES-OXLEY ACT OF 2002
I, Michael M. McNamara, certify that:
1. I have reviewed this Annual Report on Form 10-K of Flextronics International Ltd.;
2. Based on my knowledge, this report does not contain any untrue statement of a material fact or omit to state a material fact necessary to make the statements made, in light of the circumstances under which such statements were made, not misleading with respect to the period covered by this report;
3. Based on my knowledge, the financial statements, and other financial information included in this report, fairly present in all material respects the financial condition, results of operations and cash flows of the registrant as of, and for, the periods presented in this report;
4. The registrant's other certifying officer and I are responsible for establishing and maintaining disclosure controls and procedures (as defined in Exchange Act Rules 13a-15(e) and 15d-15(e)) and internal control over financial reporting (as defined in Exchange Act Rules 13a-15(f) and 15d-15(f)) for the registrant and have: a. Designed such disclosure controls and procedures, or caused such disclosure controls and procedures to be designed under
our supervision, to ensure that material information relating to the registrant, including its consolidated subsidiaries, is made known to us by others within those entities, particularly during the period in which this report is being prepared;
b. Designed such internal control over financial reporting, or caused such internal control over financial reporting to be designed under our supervision, to provide reasonable assurance regarding the reliability of financial reporting and the preparation of financial statements for external purposes in accordance with generally accepted accounting principles;
c. Evaluated the effectiveness of the registrant's disclosure controls and procedures and presented in this report our conclusions about the effectiveness of the disclosure controls and procedures, as of the end of the period covered by this report based on such evaluation; and
d. Disclosed in this report any change in the registrant's internal control over financial reporting that occurred during the registrant's most recent fiscal quarter (the registrant's fourth fiscal quarter in the case of an annual report) that has materially affected, or is reasonably likely to materially affect, the registrant's internal control over financial reporting; and
5. The registrant's other certifying officer and I have disclosed, based on our most recent evaluation of internal control over financial reporting, to the registrant's auditors and the audit committee of the registrant's board of directors (or persons performing the equivalent functions): a. All significant deficiencies and material weaknesses in the design or operation of internal control over financial reporting
which are reasonably likely to adversely affect the registrant's ability to record, process, summarize and report financial information; and
b. Any fraud, whether or not material, that involves management or other employees who have a significant role in the registrant's internal control over financial reporting.
Date: May 25, 2012
/s/ MICHAEL M. MCNAMARA Michael M. McNamara Chief Executive Officer Flextronics International Ltd.

QuickLinks
EXHIBIT 31.01
CERTIFICATION OF PRINCIPAL EXECUTIVE OFFICER PURSUANT TO SECTION 302 OF THE SARBANES-OXLEY ACT OF 2002
QuickLinks -- Click here to rapidly navigate through this document
EXHIBIT 31.02
CERTIFICATION OF PRINCIPAL FINANCIAL OFFICER PURSUA NT TO SECTION 302
OF THE SARBANES-OXLEY ACT OF 2002
I, Paul Read, certify that:
1. I have reviewed this Annual Report on Form 10-K of Flextronics International Ltd.;
2. Based on my knowledge, this report does not contain any untrue statement of a material fact or omit to state a material fact necessary to make the statements made, in light of the circumstances under which such statements were made, not misleading with respect to the period covered by this report;
3. Based on my knowledge, the financial statements, and other financial information included in this report, fairly present in all material respects the financial condition, results of operations and cash flows of the registrant as of, and for, the periods presented in this report;
4. The registrant's other certifying officer and I are responsible for establishing and maintaining disclosure controls and procedures (as defined in Exchange Act Rules 13a-15(e) and 15d-15(e)) and internal control over financial reporting (as defined in Exchange Act Rules 13a-15(f) and 15d-15(f)) for the registrant and have: a. Designed such disclosure controls and procedures, or caused such disclosure controls and procedures to be designed under
our supervision, to ensure that material information relating to the registrant, including its consolidated subsidiaries, is made known to us by others within those entities, particularly during the period in which this report is being prepared;
b. Designed such internal control over financial reporting, or caused such internal control over financial reporting to be designed under our supervision, to provide reasonable assurance regarding the reliability of financial reporting and the preparation of financial statements for external purposes in accordance with generally accepted accounting principles;
c. Evaluated the effectiveness of the registrant's disclosure controls and procedures and presented in this report our conclusions about the effectiveness of the disclosure controls and procedures, as of the end of the period covered by this report based on such evaluation; and
d. Disclosed in this report any change in the registrant's internal control over financial reporting that occurred during the registrant's most recent fiscal quarter (the registrant's fourth fiscal quarter in the case of an annual report) that has materially affected, or is reasonably likely to materially affect, the registrant's internal control over financial reporting; and
5. The registrant's other certifying officer and I have disclosed, based on our most recent evaluation of internal control over financial reporting, to the registrant's auditors and the audit committee of the registrant's board of directors (or persons performing the equivalent functions): a. All significant deficiencies and material weaknesses in the design or operation of internal control over financial reporting
which are reasonably likely to adversely affect the registrant's ability to record, process, summarize and report financial information; and
b. Any fraud, whether or not material, that involves management or other employees who have a significant role in the registrant's internal control over financial reporting.
Date: May 25, 2012
/s/ PAUL READ Paul Read Chief Financial Officer

QuickLinks
EXHIBIT 31.02
QuickLinks -- Click here to rapidly navigate through this document
EXHIBIT 32.01
CERTIFICATION OF CHIEF EXECUTIVE OFFICER PURSUANT T O 18 U.S.C. SECTION 1350
AS ADOPTED PURSUANT TO SECTION 906 OF THE SARBANES-OXLEY ACT OF 2002
I, Michael M. McNamara, Chief Executive Officer of Flextronics International Ltd. (the "Company"), hereby certify to the best of my knowledge, pursuant to 18 U.S.C Section 1350, as adopted pursuant to Section 906 of the Sarbanes-Oxley Act of 2002, that:
• the Annual Report on Form 10-K of the Company for the fiscal year ended March 31, 2012, as filed with the Securities and Exchange Commission (the "Report"), fully complies with the requirements of Section 13(a) or 15(d) of the Securities Exchange Act of 1934; and
• the information contained in the Report fairly presents, in all material respects, the financial condition and results of operations of the Company.
Date: May 25, 2012
/s/ MICHAEL M. MCNAMARA Michael M. McNamara Chief Executive Officer (Principal Executive Officer)
A signed original of this written statement required by Section 906 has been provided to Flextronics International Ltd. and will be retained by it and furnished to the Securities and Exchange Commission or its staff upon request.

QuickLinks
EXHIBIT 32.01
QuickLinks -- Click here to rapidly navigate through this document
EXHIBIT 32.02
CERTIFICATION OF CHIEF FINANCIAL OFFICER PURSUANT T O
18 U.S.C. SECTION 1350 AS ADOPTED PURSUANT TO SECTION 906 OF THE SARBANES-OXLEY ACT OF 2002
I, Paul Read, Chief Financial Officer of Flextronics International Ltd. (the "Company"), hereby certify to the best of my knowledge, pursuant to 18 U.S.C Section 1350, as adopted pursuant to Section 906 of the Sarbanes-Oxley Act of 2002, that:
• the Annual Report on Form 10-K of the Company for the fiscal year ended March 31, 2012, as filed with the Securities and Exchange Commission (the "Report"), fully complies with the requirements of Section 13(a) or 15(d) of the Securities Exchange Act of 1934; and
• the information contained in the Report fairly presents, in all material respects, the financial condition and results of operations of the Company.
Date: May 25, 2012
A signed original of this written statement required by Section 906 has been provided to Flextronics International Ltd. and will be retained by it and furnished to the Securities and Exchange Commission or its staff upon request.
/s/ PAUL READ
Paul Read Chief Financial Officer (Principal Financial Officer)

QuickLinks
EXHIBIT 32.02
CERTIFICATION OF CHIEF FINANCIAL OFFICER PURSUANT TO 18 U.S.C. SECTION 1350 AS ADOPTED PURSUANT TO SECTION 906 OF THE SARBANES-OXLEY ACT OF 2002