flmf 2011 10 prsnttn fri agm flmfmeetingthechallenge
DESCRIPTION
http://foothillsri.ca/sites/default/files/null/FLMF_2011_10_Prsnttn_FRI_AGM_FLMFMeetingtheChallenge.pdfTRANSCRIPT
FRI AGM Foothills Landscape
Management Forum (FLMF)
Date: Oct 4, 2011
“MEETING THE CHALLENGE”

Foothills Landscape
Management Forum:
“Berland Smoky Regional
Access Development
(RAD)Plan”
Oct 4, 2011

Foothills Landscape Management Forum
(FLMF)
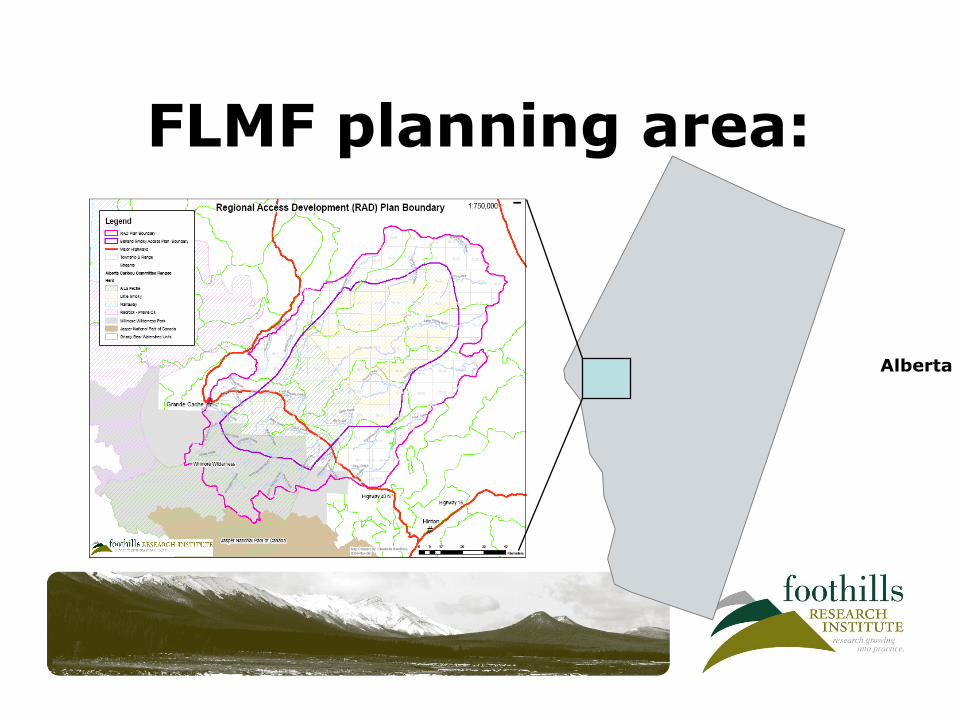
FLMF planning area:

RAD plan • Outline:
• FLMF background and business case for industry
• RAD plan background
• RAD plan process and findings
• Recommendations
• Commitments
• Next steps.

BACKGROUND: CURRENT
APPROACH FOR NATURAL
RESOURCE DEVELOPMENT
• Government allocates or sells the resources to meet economic goals;
• Industry negotiates Post-disposition access to the resource with government departments;
• Government sets conditions and standards on industry for mitigation other values;
• Industry complies with standards

The Challenge: The current approach is uncertain and
unpredictable
• Uncertain access
• Hard to predict costs
• Increasing risk
• Shifting social values
• Market access uncertain/environmental performance has an effect on global market access

“Meeting the Challenge”
• Over the past 6 years the FLMF membership provided has provided leadership to:
Increase certainty
Demonstrate good stewardship
Maintain good data sets
Influence change
Be effective in mitigation
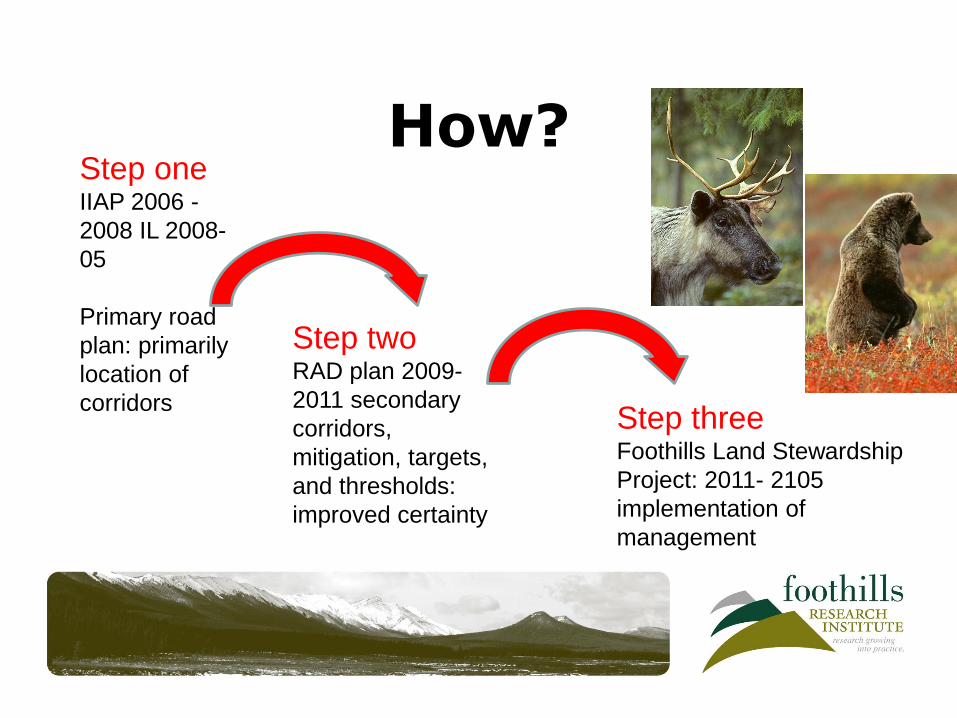
How?
Step one IIAP 2006 -
2008 IL 2008-
05
Primary road
plan: primarily
location of
corridors
Step two RAD plan 2009-
2011 secondary
corridors,
mitigation, targets,
and thresholds:
improved certainty
Step three Foothills Land Stewardship
Project: 2011- 2105
implementation of
management

RAD plan Background • In June, 2009, a Terms of Reference approved
Berland Smoky Regional Access Development (RAD) Plan.
• Identified “Access Corridor Routing” over the next 30 years.
• Identified recommendations to address a range of implementation considerations, plan amendment processes, metrics for reporting, and next steps to address
reclamation/remediation.

RAD plan unique features
• Partnership lead by government
• Independent management/support provided by FRI
• Includes mitigation recommendations
• Independent data management
• Primary and secondary access needs
• Monitoring to targets

Planning steps • Step 1 Initial Planning and Setup (scope)
• Step 2 Data Management
• Step 3 Outreach and Communication (who when)
• Step 4 Design of an Access Plan (forestry, energy projections, integrate)
• Step 5 Plan Assessment (footprint, open route density)
• Step 6 Risk Assessment (impacts, location)
• Step 7 Mitigation (effectiveness, restoration)
• Step 8 Monitoring & reporting (targets)
• Step 9 Funding and Administration

Status
• Planning is complete August 2011 and ASRD is doing an internal review

Results Open Route Density Target:
• maintain the open route density targets for grizzly bear management including within ±10% of current values
“Open routes”: any existing road, trail or right of way (ROW) that permits motorized access for a 4x4 highway vehicle during summer conditions. All EAP Class I-IV roads and some known traveled pipelines and seismic lines were included Circa May 2011.


Open route densities-No mitigation applied
Table 1. Comparison of Baseline Open Route Density to Proposed RAD Corridors by
Core GBWU
Core
GBWU
Open Route Density
(km/km2) % Change
Meets SRD
target
(yes/no)
Meets Grizzly
Bear Recovery
Thresholds
(0.6 km/km2) Baseline Baseline + New
Corridors
G32 0.29 0.41 +41% no yes
G38 0.21 0.42 +100% no yes
G39 0.43 0.40 -7% yes yes
G43 0.02 0.32 +1500% no yes
G44 0.47 0.49 +4% yes yes
G46 0.13 0.16 +23% no yes
Table 2. Comparison of Baseline Open Route Density to Proposed RAD Corridors by
Secondary GBWU
Secondary
GBWU
Open Route Density
(km/km2) % Change
Meets SRD
target
(yes/no)
Meets Grizzly
Bear Recovery
Thresholds
(1.2 km/km2) Baseline Baseline +
New Corridors
G15 0.55 0.61 +11% no yes
G20 0.35 0.51 +46% no yes
G22 0.33 0.41 +24% no yes
G30 0.46 0.53 +15% no yes
G36 0.73 0.77 +5% yes yes

Findings:
• The proposed target is of limited value because the current state of access development in each GBWU is not uniform.
• It is easy to meet the target in GBWUs with high existing access which will have a higher allowance for more access.
• Conversely it takes little new development in GBWU with low
existing access to exceed the target. These are the areas that need the most additional access to support new development.
• Mitigation measures could be used to reduce open route
density to zero. – timing of road construction – reclamation – road deactivation – Legislated public use closures

Grizzly bear draft recovery threshold's
0.6
km/km2
1.2km’s/km2

Anthropogenic Footprint Target
• reduce the percentage of the
area within 250 meters of anthropogenic disturbance by 15% from current values.

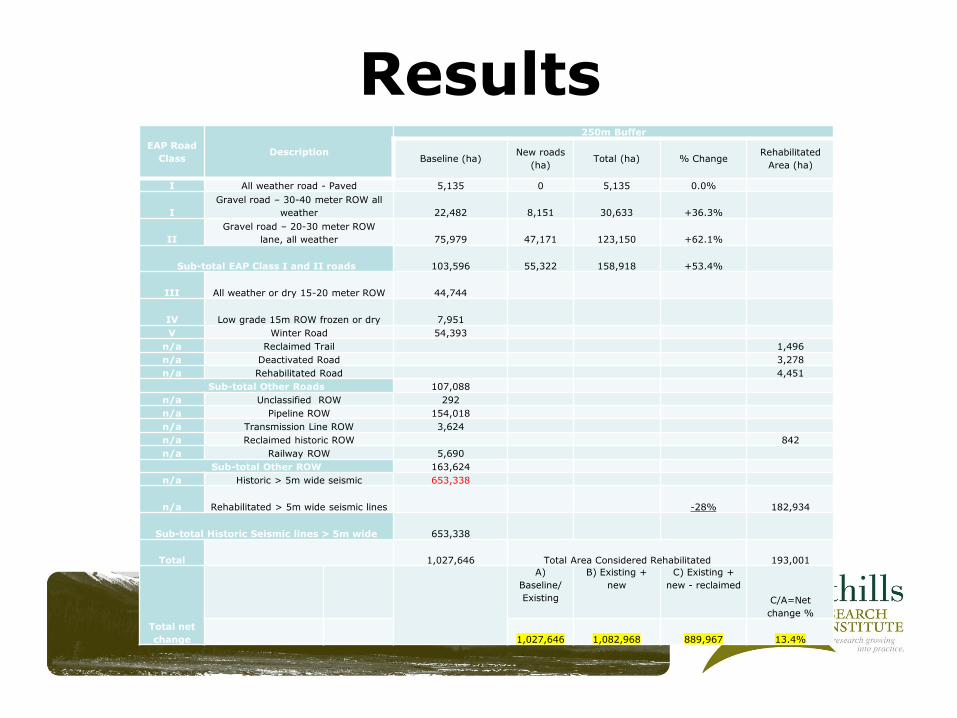
Results
EAP Road
Class Description
250m Buffer
Baseline (ha) New roads
(ha) Total (ha) % Change
Rehabilitated
Area (ha)
I All weather road - Paved 5,135 0 5,135 0.0%
I
Gravel road – 30-40 meter ROW all
weather 22,482 8,151 30,633 +36.3%
II
Gravel road – 20-30 meter ROW
lane, all weather 75,979 47,171 123,150 +62.1%
Sub-total EAP Class I and II roads 103,596 55,322 158,918 +53.4%
III All weather or dry 15-20 meter ROW 44,744
IV Low grade 15m ROW frozen or dry 7,951
V Winter Road 54,393
n/a Reclaimed Trail 1,496
n/a Deactivated Road 3,278
n/a Rehabilitated Road 4,451
Sub-total Other Roads 107,088
n/a Unclassified ROW 292
n/a Pipeline ROW 154,018
n/a Transmission Line ROW 3,624
n/a Reclaimed historic ROW 842
n/a Railway ROW 5,690
Sub-total Other ROW 163,624
n/a Historic > 5m wide seismic 653,338
n/a Rehabilitated > 5m wide seismic lines -28% 182,934
Sub-total Historic Seismic lines > 5m wide 653,338
Total 1,027,646 Total Area Considered Rehabilitated 193,001
Total net
change
A)
Baseline/
Existing
B) Existing +
new
C) Existing +
new - reclaimed
C/A=Net
change %
1,027,646 1,082,968 889,967 13.4%

2010 Seismic line Inventory Results
Index Length % of total
Devoid 6647 km 59%
Inclined 1471km 13%
Reclaimed 3159 km 28% (used in RAD plan)
Total 11,277 km 100%
41%
Reclaimed defined
: prohibits access by ATV’s and 2) discourages any deciduous browse species from growing in the understory. Source Kirby Smith Fish and Wildlife, Edson.

Findings
• Areas of influence (buffering) on differing intensities of disturbance should be different (i.e., an active road versus an old seismic line), but the area of influence is difficult to assess and verify.
• The area of influence is subject to double counting making footprint modelling challenging.
• The area of influence blankets the entire landscape, so additional footprint creates no net increase.
• Need to reduce skewing of “area of influence”.

Next steps
• Approval of the RAD plan
• Apply mitigation if necessary:
e.g. Public access controls (legislation); reclamation plan; monitor and report
• Adopt step 3: Foothills Land Stewardship Project (FLSP)

The RAD is a step towards “Foothills Land Stewardship
Project”
• A formal public-private partnership between FLMF and GOA
• Support LUF through
– FLMF lead: habitat (vegetation) and footprint
– GOA lead: wildlife populations and people
• Working together we can
– Achieve more than either can do alone
– Reallocate resources to be more effective and efficient thereby reducing risk
– Increase certainty

FLMF is an example of FRI “MEETING THE CHALLENGE”
Questions?