floating bridge – when is the technology ready?€¦ · bergsøysund floating bridge • bridge...
TRANSCRIPT

Bruno Villoria
Floating Bridge – When is the technologyready?
Teknologidagene 21.-24. september 201522/09/2015

Teknologidagene 21.-24. september 2015
Table of contents
1. Existing Floating bridges
2. When the technology is challenged - Bjørnafjorden
i. Main conceptsii. Response to environmental Loadsiii. Ship Impactiv. Marine Operations
3. Further investigations
22/09/2015

Teknologidagene 21.-24. september 2015
Table of contents
1. Existing Floating bridges
2. When the technology is challenged - Bjørnafjorden
i. Main conceptsii. Response to environmental Loadsiii. Ship Impactiv. Marine Operations
3. Further investigations
22/09/2015

Floating Bridges - USA
Hood Canal Bridge
• Completion: 1961• Total length: 2398 m • Includes a drawspan• Concrete pontoons• Mooring lines
Teknologidagene 21.-24. september 201522/09/2015

Floating Bridges - USA
Teknologidagene 21.-24. september 2015
Hood Canal Bridge
• Sinking during the February 13, 1979 Wind storm combined with an extremely high tideMaintenance hatches were left open
• Criticized design of the pontoon
• Reopened in 1982
22/09/2015

Floating Bridges - USA
Evergreen Point Floating Bridge
• Completion: 1963• Total length: 2310 m• 33 Pontoons• 58 anchor lines• 70 000 vehicles / day
Teknologidagene 21.-24. september 201522/09/2015

Floating Bridges in Norway
Bergsøysund Floating Bridge
• Completion: 1992• Total length: 933 m • Main span: 106 m• No mooring line• Truss Deck
Teknologidagene 21.-24. september 201522/09/2015

Floating Bridges in Norway
Bergsøysund Floating Bridge
• Bridge girder anchored to the shore
• Wave, current and wind loads transferred to the abutments in the form of axial loads
Teknologidagene 21.-24. september 201522/09/2015

Floating Bridges in Norway
Nordhordland Floating Bridge
• Completion: 1994• Total length: 1246 m • Main span: Cable-stayed Bridge• 10 Concrete pontoons• No mooring line• End Anchoring
Teknologidagene 21.-24. september 201522/09/2015

Floating Bridges in Norway – Lessons learned
Teknologidagene 21.-24. september 2015
• Observations related to theoperation and maintenance ofBergsøysund and Nordhordland Floating bridges
22/09/2015

Teknologidagene 21.-24. september 2015
Table of contents
1. Existing Floating bridges
2. When the technology is challenged - Bjørnafjorden
i. Main conceptsii. Response to environmental Loadsiii. Ship Impactiv. Marine Operations
3. Further investigations
22/09/2015

Teknologidagene 21.-24. september 2015
Table of contents
1. Existing Floating bridges
2. When the technology is challenged - Bjørnafjorden
i. Main conceptsii. Response to environmental Loadsiii. Ship Impactiv. Marine Operations
3. Further investigations
22/09/2015

Teknologidagene 21.-24. september 2015
Constraints:
• Allowed speed: 110 km/h
• 4 traffic lanes
• Navigation channel at the centreof the fjord Vertical clearance : 45 m Horisontal clearance: 400 m
• A total length exceeding 4 km
• Depth of the Fjord: 500 m
• Withstand ship impacts
Main concepts
22/09/2015

Teknologidagene 21.-24. september 2015
Curved Bridge– Straight Bridge–
Main concepts
22/09/2015
Teknologidagene 21.-24. september 2015
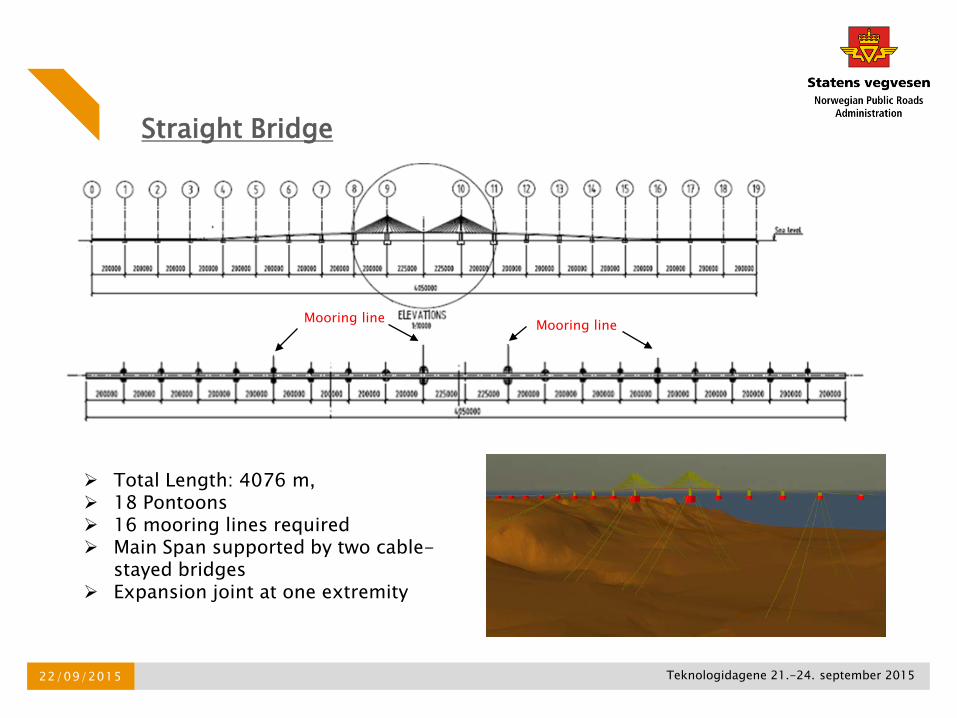
Straight Bridge
Mooring line Mooring line
Total Length: 4076 m, 18 Pontoons 16 mooring lines required Main Span supported by two cable-
stayed bridges Expansion joint at one extremity
22/09/2015

Teknologidagene 21.-24. september 2015
Straight Bridge
• Cross Section - High Bridge (Height 3.5 m)
Pylons
• Cross Section – Side spans (Height 6.5 m)
22/09/2015

Teknologidagene 21.-24. september 2015
Curved Bridge
Total Length: 4198 m 20 pontoons No mooring line required Fixed end connections
22/09/2015

Teknologidagene 21.-24. september 2015
Curved Bridge
• Twin steel box Girders connected with cross beams (Vierendeel beam) every 62 m
• Width of 60 m
Pylons
22/09/2015

Teknologidagene 21.-24. september 2015
Table of contents
1. Existing Floating bridges
2. Floating Bridge for Bjørnafjorden
i. Main conceptsii. Environmental Loadsiii. Ship Impactiv. Marine Operations
3. Further investigations
22/09/2015

Teknologidagene 21.-24. september 2015
Prediction of weather conditions
Weather Buoys were installed in January 2015 and continuously collecting data
Use of existing statistics and simulations to predict design values for wind, waves, current and tide in Bjørnafjorden
22/09/2015

Teknologidagene 21.-24. september 2015
Wave loads
Results from statistical simulations (Sintef)
100 year wind and swell waves
Wind environment Reference velocity of 26 m/s and a roughness length of 0.01 m (coastal area) 10 minutes wind velocity at 10 m height: V10,10 = 30.5 m/s
Return Period [years] Hs[m] Tp[s] gamma100 3 3-6 3.3
Return Period [years] Hs[m] Tp[s] gamma100 0.4 12-14 5
Swell waves
Wind Generated Waves
22/09/2015

Teknologidagene 21.-24. september 2015
Wind loads - Procedure
• Load effect evaluated on the basis of the Eurocodes
• Procedure:– Wind taken as a Gaussian process– Elastic behaviour of the structure– Response expected to be also a Gaussian process– Extreme values Gumbel distributed– Characteristic values taken as expected maximum for the Gumbel
distribution– Calculations performed in the frequency domain
• Wind load coefficients for the Bridge girder are based on CFD analysis
22/09/2015

Teknologidagene 21.-24. september 2015
Wind loads - Findings
• The Dynamic effects of wind are dominated by the two first fundamental modes
• Contribution from higher modes non negligible• Certain modes activate pendulum movements of the pontoons
Curved Bridge Straight Bridge
Mode 1 (51.3 s) Mode 2 (39.5 s) Mode 1 (63.7 s) Mode 2 (55.3 s)
22/09/2015

Teknologidagene 21.-24. september 2015
Wave loads - Procedure
• No guidelines from Eurocodes• Procedure:
o Calculated in OrcaFlex (time domain analysis)o Calculation procedure includes non-linearites in load definitiono Response found to be almost linearo Effect of mooring-lines taken into account
• Characteristic values found byo 10 Simulations of 3 hrs storm conditions on the relevant contour lineo Simulate wind generated waves and swell generated waves simultaneous
(two-peaked spectrums)o Extreme values taken as mean of the 10 maxima found in the simulations
22/09/2015

Teknologidagene 21.-24. september 2015
• Stresses dominated by bending moments about the weak axis
• Observed pendulum motions of the pontoons cause large bending and torsional moments in the Bridge girder
• An accurate environmental design basis can help avoid triggering some pendulum
• A large number of Eigen modes coincide with wave excitation frequencies
• Wave loads transferred to the bridge girder depend on pontoon geometry
Wave loads - Findings
22/09/2015

Teknologidagene 21.-24. september 2015
Combined Wave and Wind loads
• Based on characteristic values for:o Wind aloneo Waves aloneo Marginal load effects from current (only incorporated in static calculations)
• Analysis of combined effects of wind and waveso Extreme values evaluated for different stochastic processes with different
frequency content and different response behaviouro Unlikely that the structure is subjected simultaneously to the extreme loads
from wind and waveso Correlation is to be assessed
22/09/2015

Teknologidagene 21.-24. september 2015
Pontoon Design
• Purpose: o To reduce forces transferred to the bridge
girdero To ensure that displacements and
accelerations remain within allowable limits
• The following criteria have been chosen
• Different pontoon geometries have been considered
Parameter Criterion criteria Type of criteria Limiting parameter
Width1 degree roll angle for 80%
eccentric trafficImposed by
Design GroupMinimum roll stiffness
Area Deflection < Linfluens/350 EurocodesMinimum heave
stiffness
Displacement>20 000 t (side spans) >70 000 t (main span)
Ship impactMinimum
displacement
Pontoon Design
22/09/2015

Teknologidagene 21.-24. september 2015
Table of contents
1. Existing Floating bridges
2. When the technology is challenged - Bjørnafjorden
i. Main conceptsii. Response to environmental Loadsiii. Ship Impactiv. Marine Operations
3. Further investigations
22/09/2015

Teknologidagene 21.-24. september 2015
Ship Impact - Methodology
• Analysis of the existing traffic and prediction of ship traffic in the area(Monte Carlo Simulations)
• Determination of an accepted risk
• Determination of a design ship• A relevant indentation curve has to be
used.Energy transferred to the pontoons can then be evaluated
22/09/2015

Teknologidagene 21.-24. september 2015
Ship Impact - Methodology
The ship impact analysis can be subdivided into two main steps:
1. Impulse loads from the impacting ship estimated from local dynamic analyses of the considered pontoon (USFOS)Centric and eccentric impact scenarios are considered
2. The global response of the bridge is then evaluated in Orcaflex (time domain simulation)
22/09/2015

Teknologidagene 21.-24. september 2015
Ship Impact – Findings
The following elements affect greatly the response of the bridge Mass of the hit pontoon Restoring stiffness Mooring stiffness
Higher utilization of the abutment for the straight bridge solution
Maximum utilization under centric impacts
22/09/2015

Teknologidagene 21.-24. september 2015
Table of contents
1. Existing Floating bridges
2. When the technology is challenged - Bjørnafjorden
i. Main conceptsii. Response to environmental Loadsiii. Ship Impactiv. Marine Operations
3. Further investigations
22/09/2015

Teknologidagene 21.-24. september 2015
Production of the pontoons High competences in Norway: the production of pontoons is expected to
take place in Norway
Productions methods will be the same regardless of the chosen solution
Challenging to find facilities with sufficient capacity
A barge or a floating dock could be built
22/09/2015
Teknologidagene 21.-24. september 2015
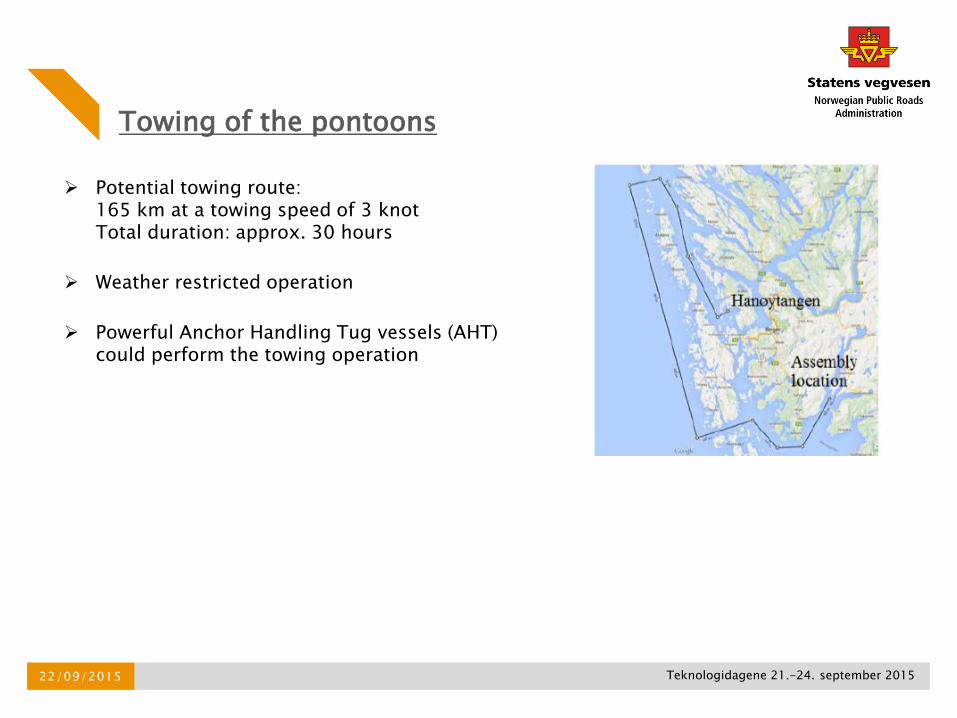
Towing of the pontoons
Potential towing route:165 km at a towing speed of 3 knotTotal duration: approx. 30 hours
Weather restricted operation
Powerful Anchor Handling Tug vessels (AHT) could perform the towing operation
22/09/2015

Teknologidagene 21.-24. september 2015
Production and transportation of the Bridge girder
Production can take place in many countriesWelding robots can help guarantee a certain levelof quality
The girder elements have to be transported to the assembly yard in the vicinity of Bjørnafjorden
The bridge elements would then be weldedtogether and transported to the planned bridgelocation
22/09/2015

Teknologidagene 21.-24. september 2015
Assembly of side spans
Assembly of columns and pontoons
The assembled girder element is then lifted and held in position while the pontoon with columns is positioned under the girder.
Side spans can be towed to the bridge site (3large sections)
Stability has to be investigated at every stage
22/09/2015

Teknologidagene 21.-24. september 2015
Assembly of high bridge
The complete High Bridge segment will consist of four pontoons and the two towers.
Towing to Bjørnafjorden
Supporting barges can be introduced prior to transportation Temporary ballast is considered
22/09/2015

Teknologidagene 21.-24. september 2015
Table of contents
1. Existing Floating bridges
2. When the technology is challenged - Bjørnafjorden
i. Main conceptsii. Response to environmental Loadsiii. Ship Impactiv. Marine Operations
3. Further investigations
22/09/2015

Teknologidagene 21.-24. september 2015
Environmental load calculations :
Dynamic wind response has to be further evaluated (correlation length, coupled fundamental modes)
Assessment of the correlation between wind and wave loads Effect of floating supports on the divergence and flutter stability of the
bridge girder
Model tests and Software development can help address these issues
Ship Impact calculations : New indentation curve for the design ship Finalize the ship collision risk analysis Evaluate the potential for weak links or fenders
Alternative Solution: Navigation channel positioned closer to the shore
Further investigations
22/09/2015

Teknologidagene 21.-24. september 2015
Challenging but feasible
Thank you for your attention
22/09/2015