flow-metabolism coupling pet vs. fmri- debate, …jcohen/ftp/brainmap_lin.pdfflow-metabolism...
TRANSCRIPT
Flow-Metabolism Coupling –PET vs. fMRI-
Debate, Modeling and Application
Ai-Ling Lin, Ph.D.Research Imaging InstituteDepartment of Psychiatry
University of Texas Health Science Center, San Antonio, TX, USA
Outline
Debate (PET vs. fMRI)
Modeling (fMRI)
Validation of the fMRI BOLD Model
Application (PET+ fMRI)
Future Directions
Summary

Debate
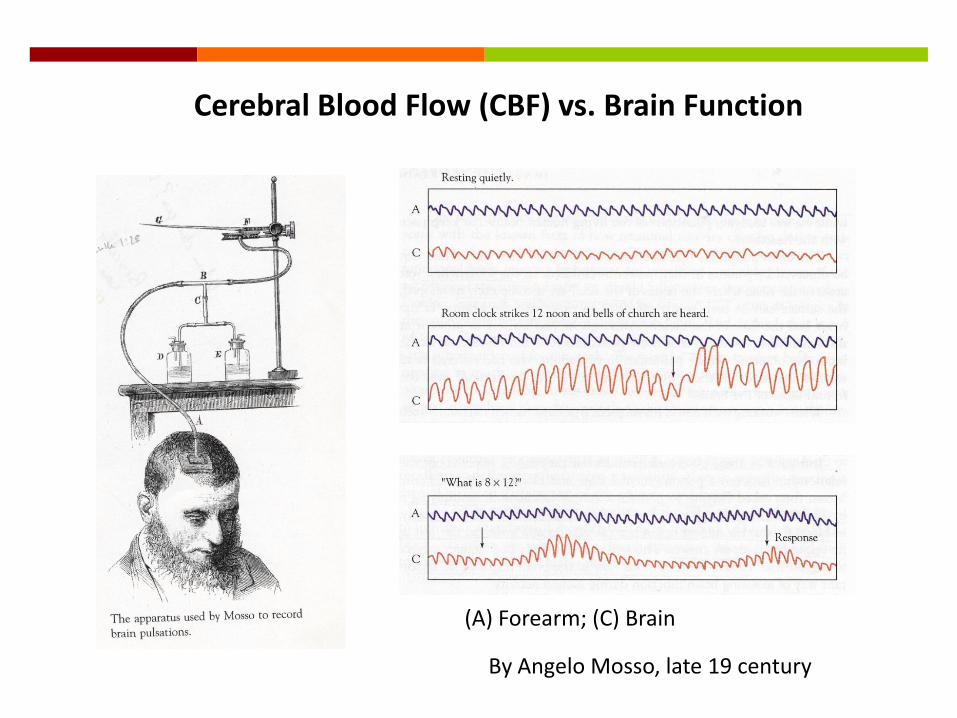
Cerebral Blood Flow (CBF) vs. Brain Function
(A) Forearm; (C) Brain
By Angelo Mosso, late 19 century
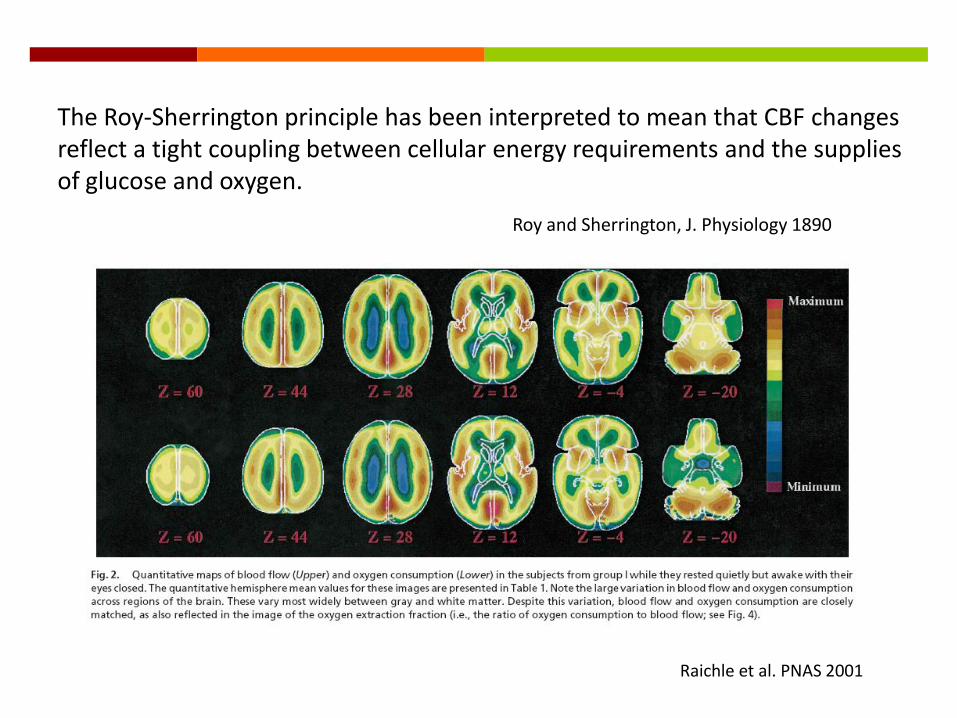
The Roy-Sherrington principle has been interpreted to mean that CBF changes reflect a tight coupling between cellular energy requirements and the supplies of glucose and oxygen.
Roy and Sherrington, J. Physiology 1890
Raichle et al. PNAS 2001
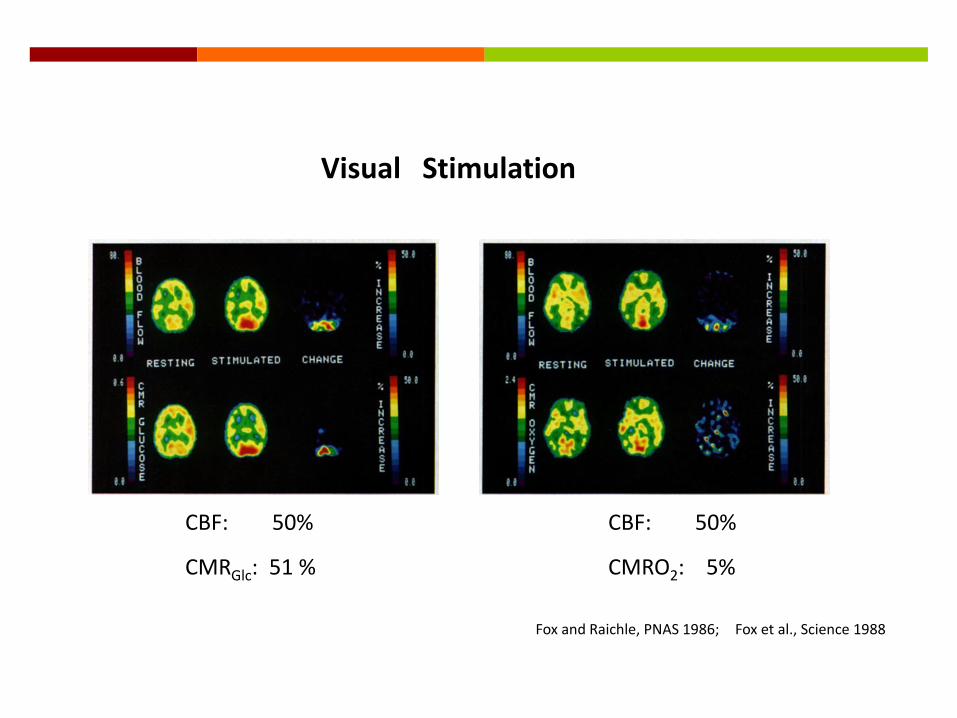
Visual Stimulation
CBF: 50%
CMRGlc: 51 %
Fox et al., Science 1988Fox and Raichle, PNAS 1986;
CBF: 50%
CMRO2: 5%
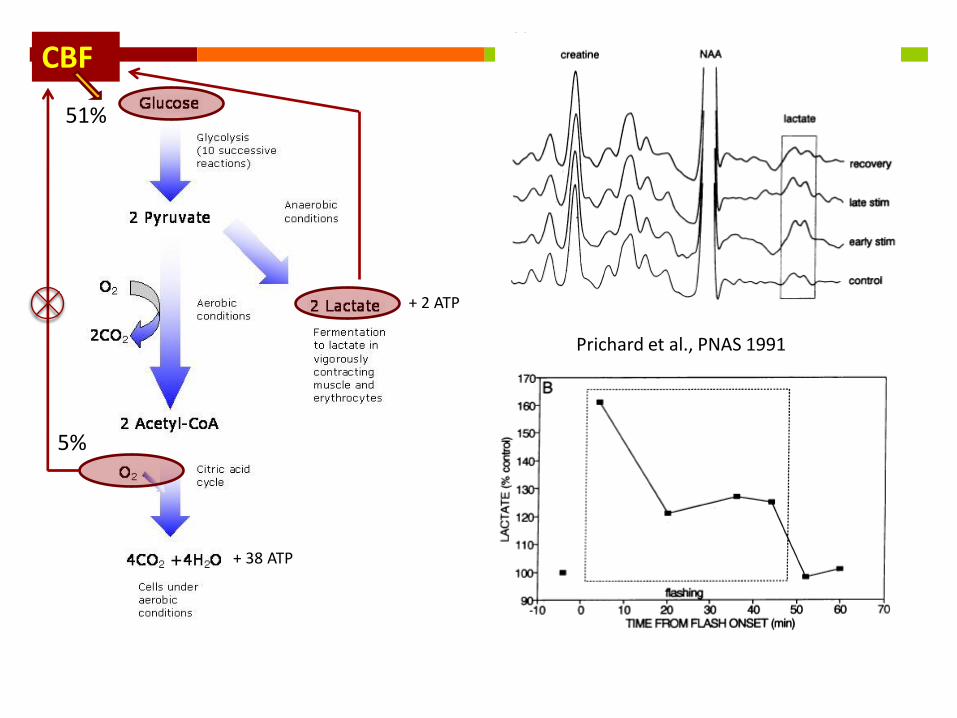
+ 2 ATP
+ 38 ATP
Prichard et al., PNAS 1991
CBF
51%
5%
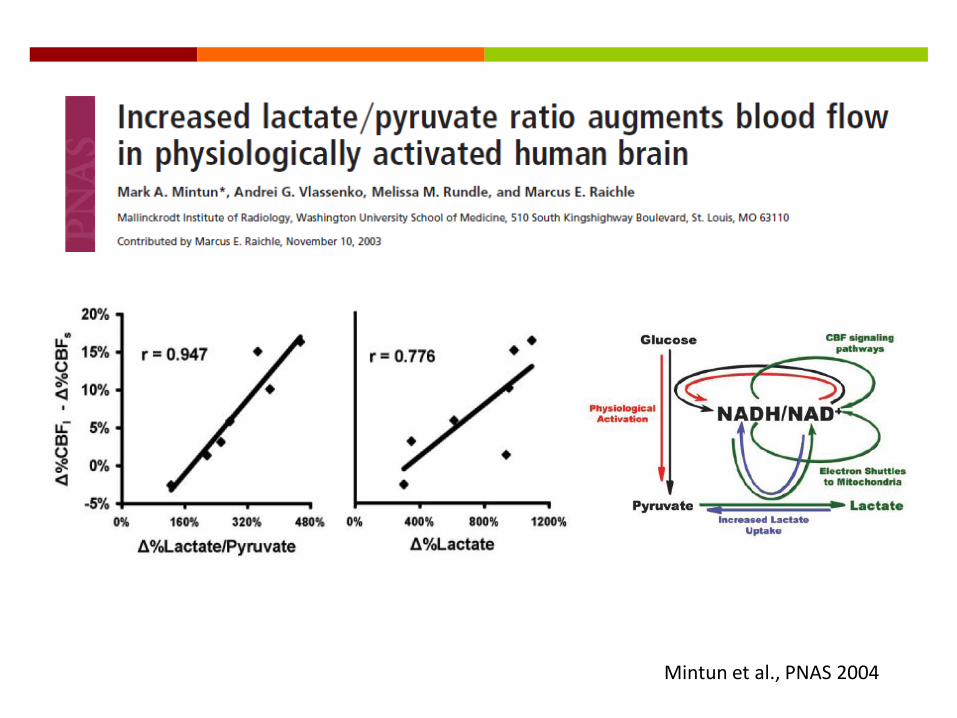
Mintun et al., PNAS 2004
Oxidative or non-oxidative metabolism?
Energy Demand
ATP production (JATP) of task-induced neuronal activation
CBF Increases
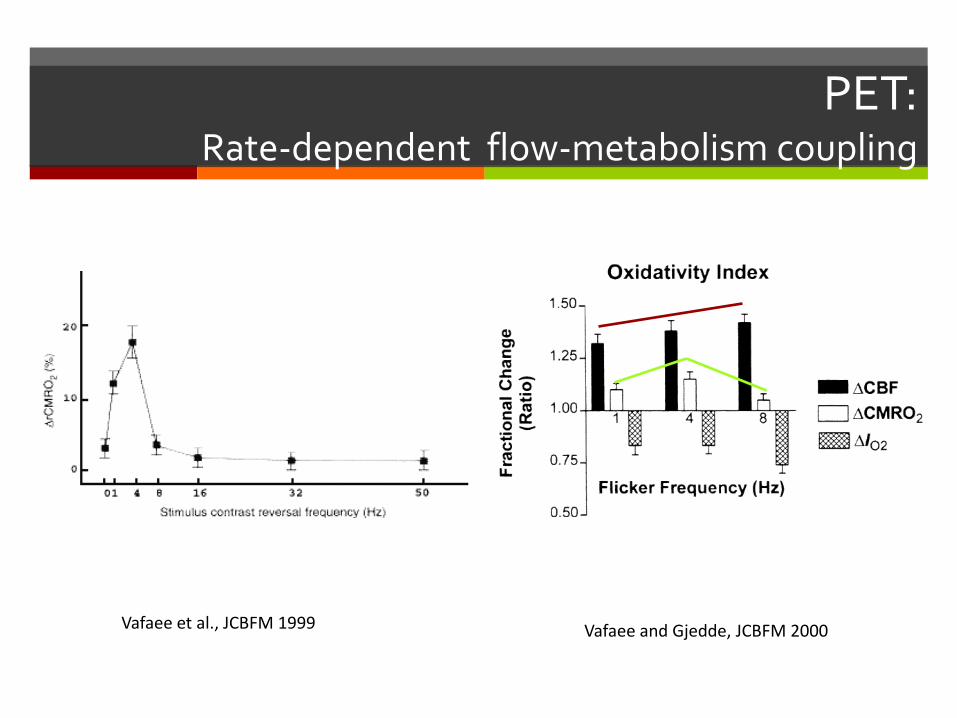
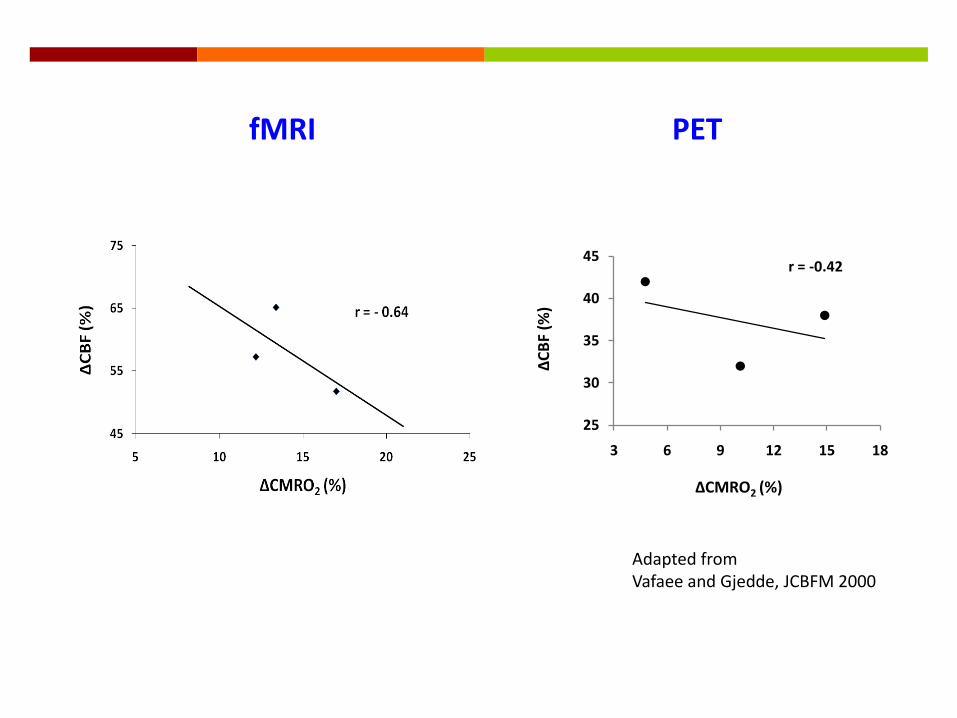
PET:Rate-dependent flow-metabolism coupling
Vafaee et al., JCBFM 1999 Vafaee and Gjedde, JCBFM 2000
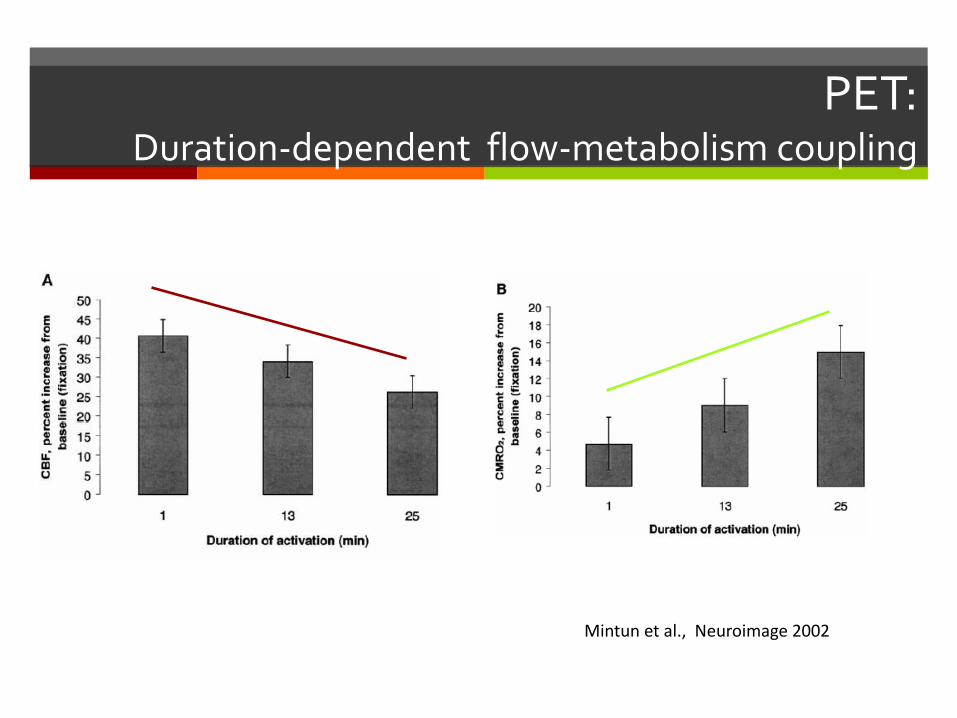
PET:Duration-dependent flow-metabolism coupling
Mintun et al., Neuroimage 2002
Flow-metabolism coupling is non-linear
Rate-dependent
Duration-dependent
The increase in CBF associated with physiological activation is regulated by factors other than local requirements in oxygen (Fox et al., Science 1988; Mintun et al., PNAS 2001).
Energy demand (ATP production) can be met through non-oxidative metabolism (glycolysis)
PET:Conclusion
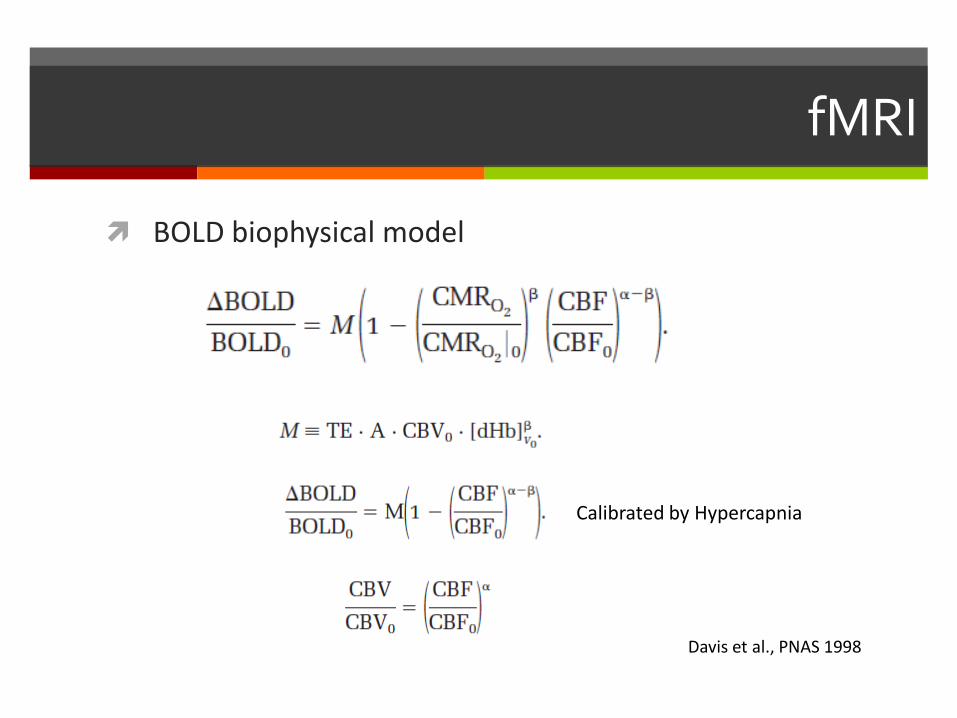
fMRI
BOLD biophysical model
Davis et al., PNAS 1998
Calibrated by Hypercapnia
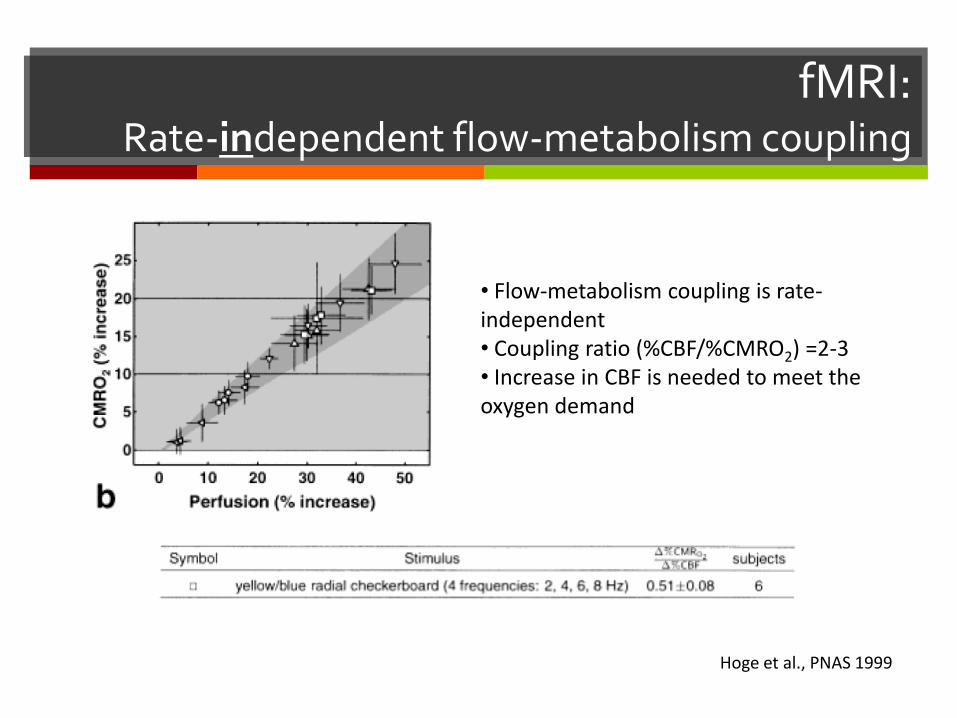
fMRI:Rate-independent flow-metabolism coupling
• Flow-metabolism coupling is rate-independent• Coupling ratio (%CBF/%CMRO2) =2-3• Increase in CBF is needed to meet the oxygen demand
Hoge et al., PNAS 1999
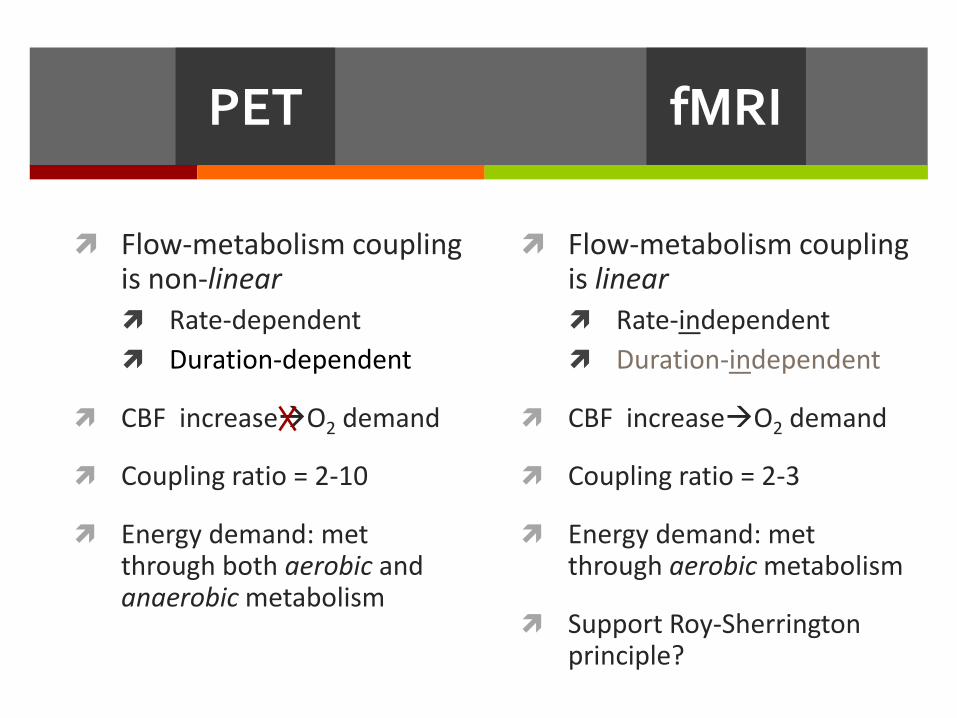
Flow-metabolism coupling is non-linear
Rate-dependent
Duration-dependent
CBF increaseO2 demand
Coupling ratio = 2-10
Energy demand: met through both aerobic and anaerobic metabolism
fMRI
Flow-metabolism coupling is linear
Rate-independent
Duration-independent
CBF increaseO2 demand
Coupling ratio = 2-3
Energy demand: met through aerobic metabolism
Support Roy-Sherringtonprinciple?
PET
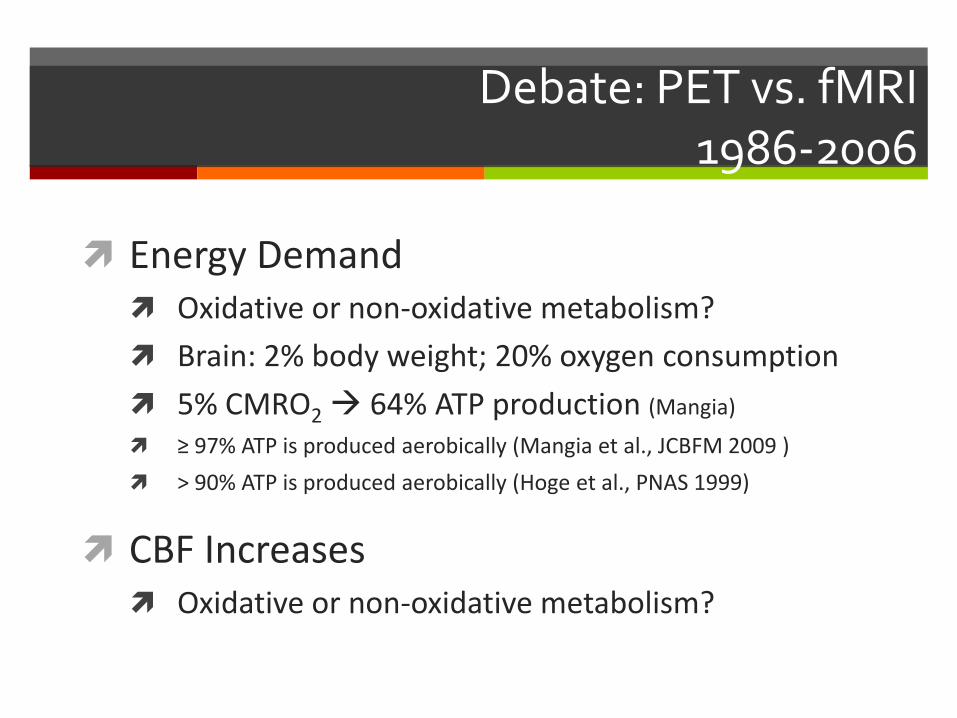
Debate: PET vs. fMRI1986-2006
Energy Demand Oxidative or non-oxidative metabolism?
Brain: 2% body weight; 20% oxygen consumption
5% CMRO2 64% ATP production (Mangia)
≥ 97% ATP is produced aerobically (Mangia et al., JCBFM 2009 )
> 90% ATP is produced aerobically (Hoge et al., PNAS 1999)
CBF Increases Oxidative or non-oxidative metabolism?
Modeling
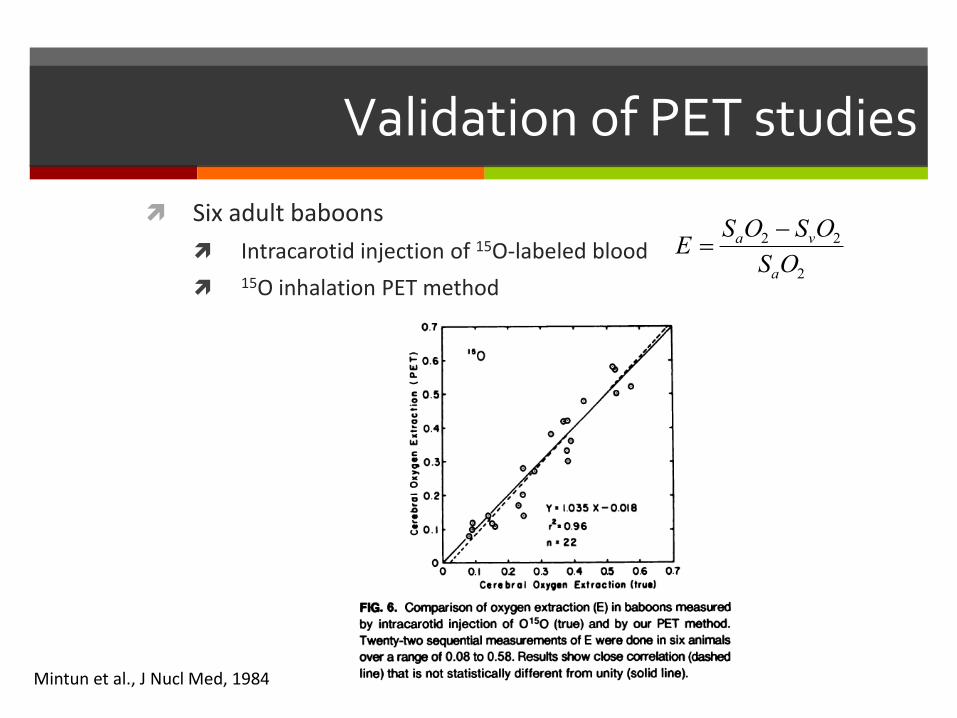
Validation of PET studies
Six adult baboons
Intracarotid injection of 15O-labeled blood
15O inhalation PET method
Mintun et al., J Nucl Med, 1984
E SaO2 SvO2
SaO2
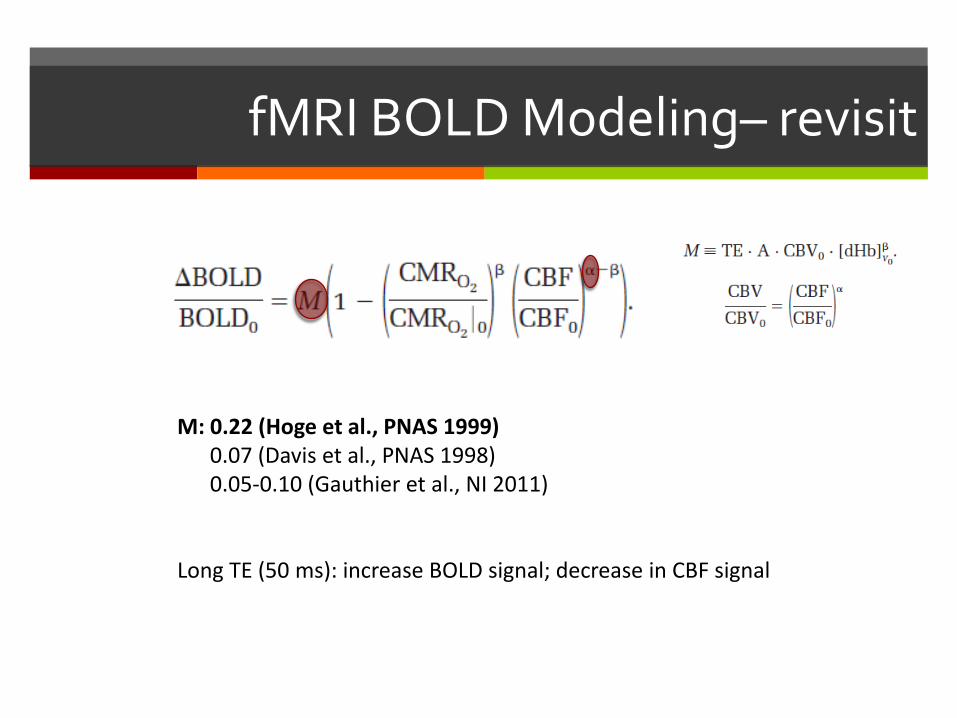
fMRI BOLD Modeling– revisit
M: 0.22 (Hoge et al., PNAS 1999)0.07 (Davis et al., PNAS 1998)0.05-0.10 (Gauthier et al., NI 2011)
Long TE (50 ms): increase BOLD signal; decrease in CBF signal
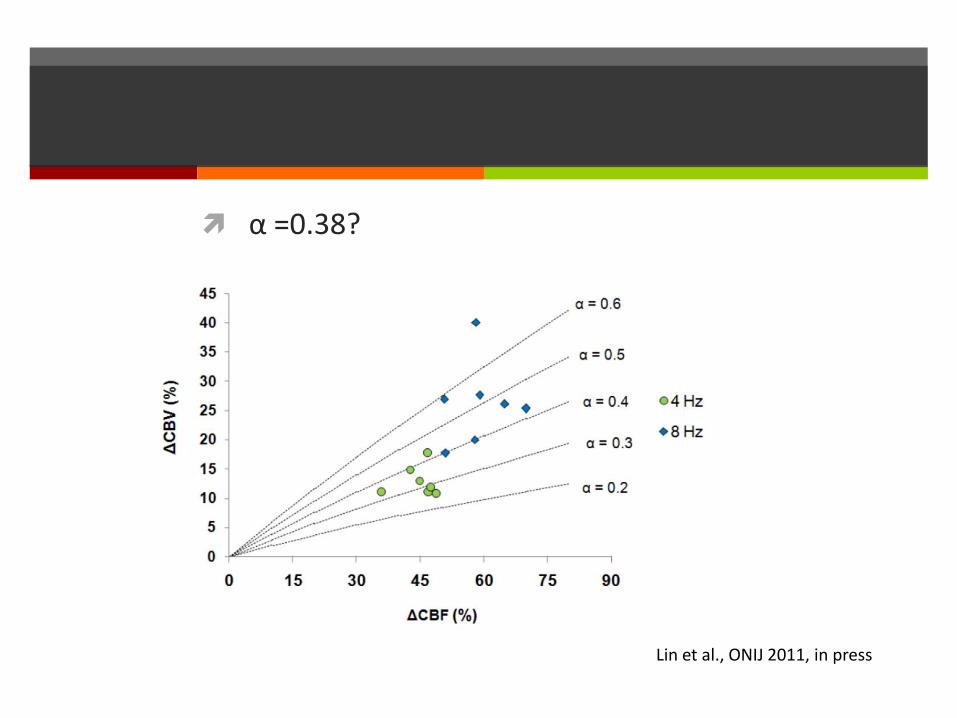
α =0.38?
Lin et al., ONIJ 2011, in press
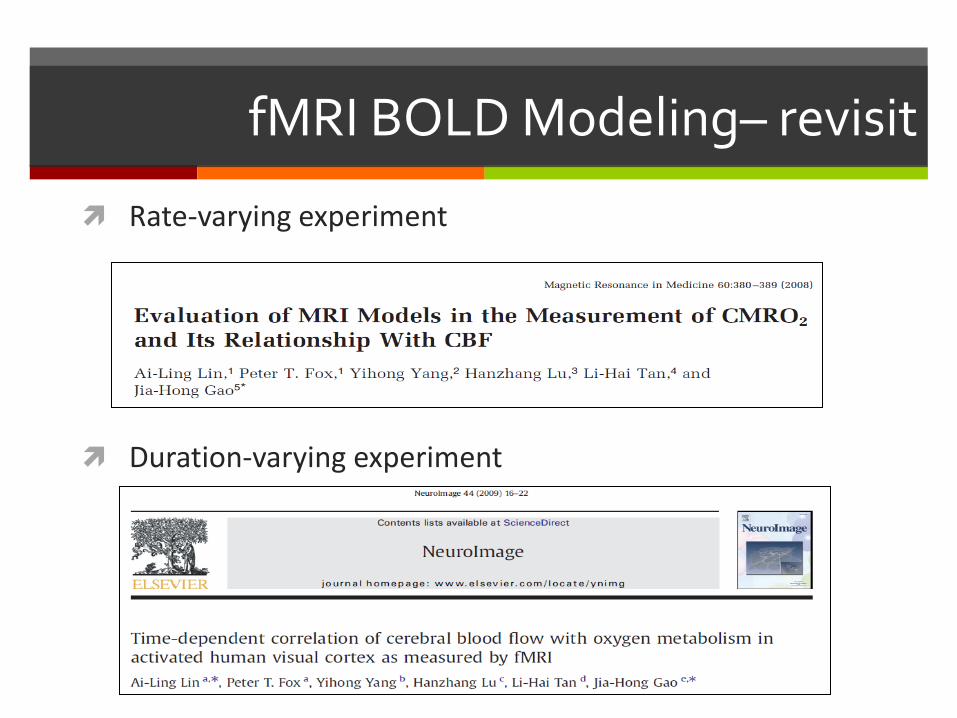
Rate-varying experiment
Duration-varying experiment
fMRI BOLD Modeling– revisit
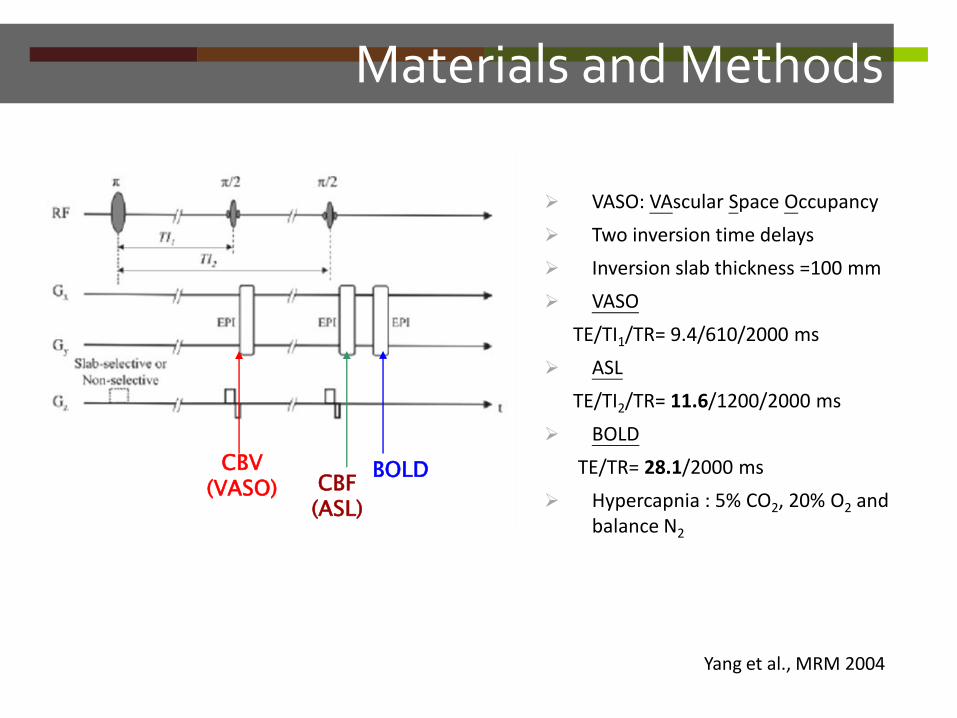
VASO: VAscular Space Occupancy
Two inversion time delays
Inversion slab thickness =100 mm
VASO
TE/TI1/TR= 9.4/610/2000 ms
ASL
TE/TI2/TR= 11.6/1200/2000 ms
BOLD
TE/TR= 28.1/2000 ms
Hypercapnia : 5% CO2, 20% O2 and balance N2
Materials and Methods
CBV(VASO) CBF
(ASL)
BOLD
Yang et al., MRM 2004
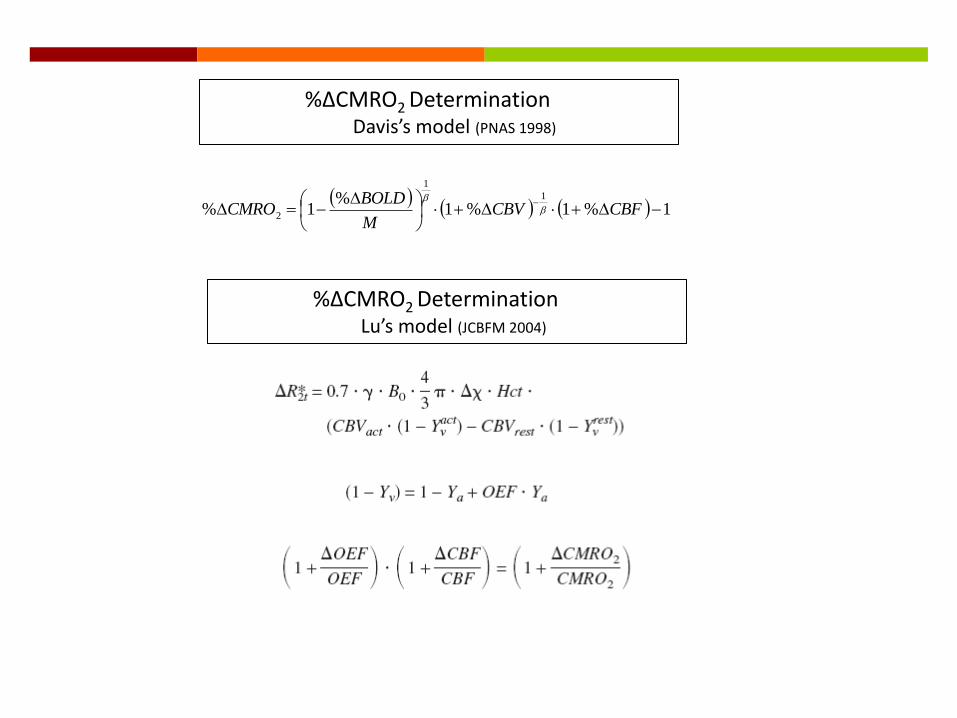
%ΔCMRO2 DeterminationDavis’s model (PNAS 1998)
1%1%1
%1%
1
1
2
CBFCBV
M
BOLDCMRO
%ΔCMRO2 DeterminationLu’s model (JCBFM 2004)
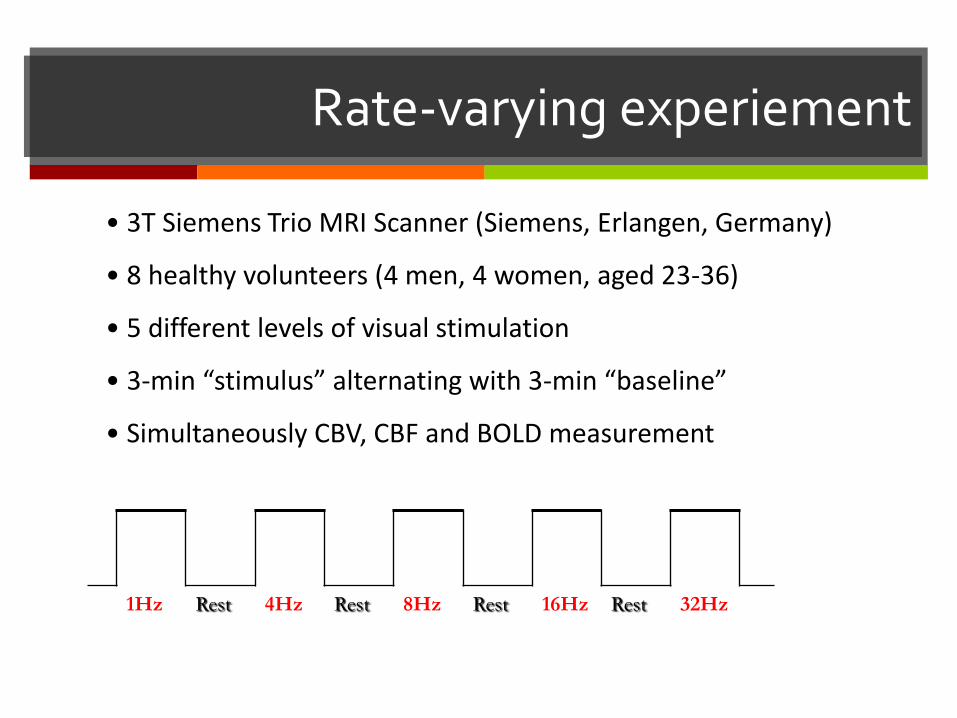
1Hz Rest 4Hz Rest 8Hz Rest 16Hz Rest 32Hz
• 3T Siemens Trio MRI Scanner (Siemens, Erlangen, Germany)
• 8 healthy volunteers (4 men, 4 women, aged 23-36)
• 5 different levels of visual stimulation
• 3-min “stimulus” alternating with 3-min “baseline”
• Simultaneously CBV, CBF and BOLD measurement
Rate-varying experiement
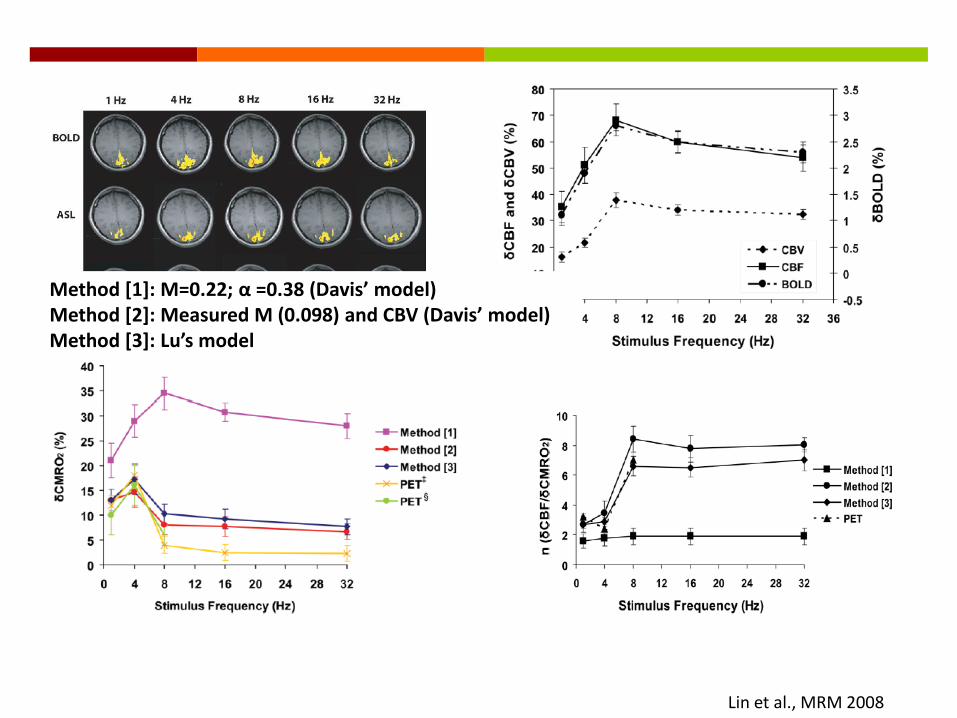
Lin et al., MRM 2008
Method [1]: M=0.22; α =0.38 (Davis’ model)Method *2+: Measured M (0.098) and CBV (Davis’ model)Method *3+: Lu’s model
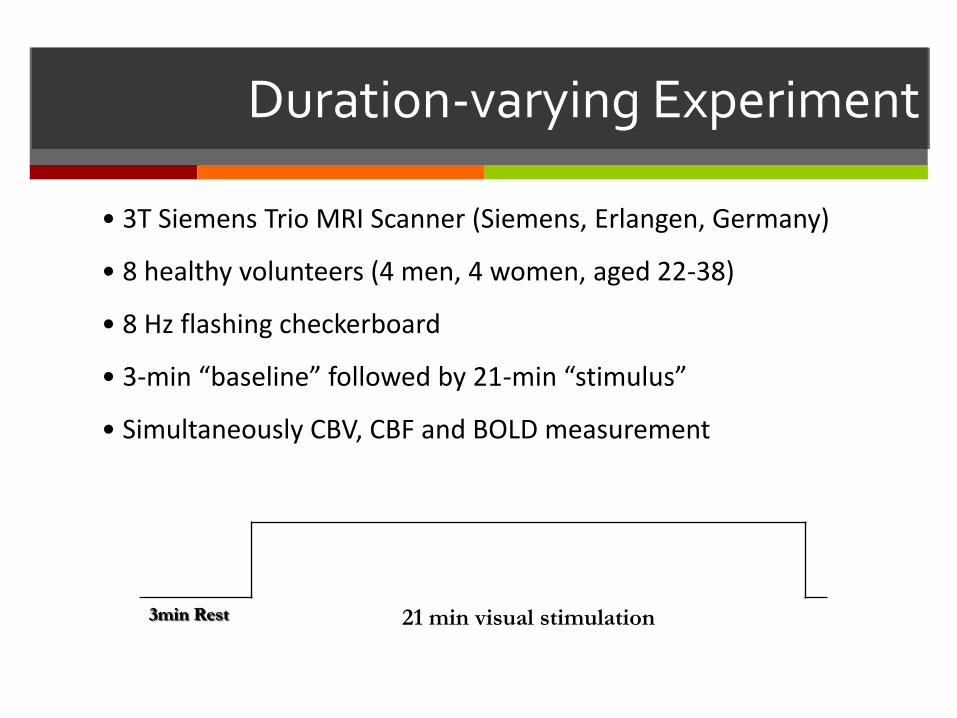
3min Rest 21 min visual stimulation
• 3T Siemens Trio MRI Scanner (Siemens, Erlangen, Germany)
• 8 healthy volunteers (4 men, 4 women, aged 22-38)
• 8 Hz flashing checkerboard
• 3-min “baseline” followed by 21-min “stimulus”
• Simultaneously CBV, CBF and BOLD measurement
Duration-varying Experiment
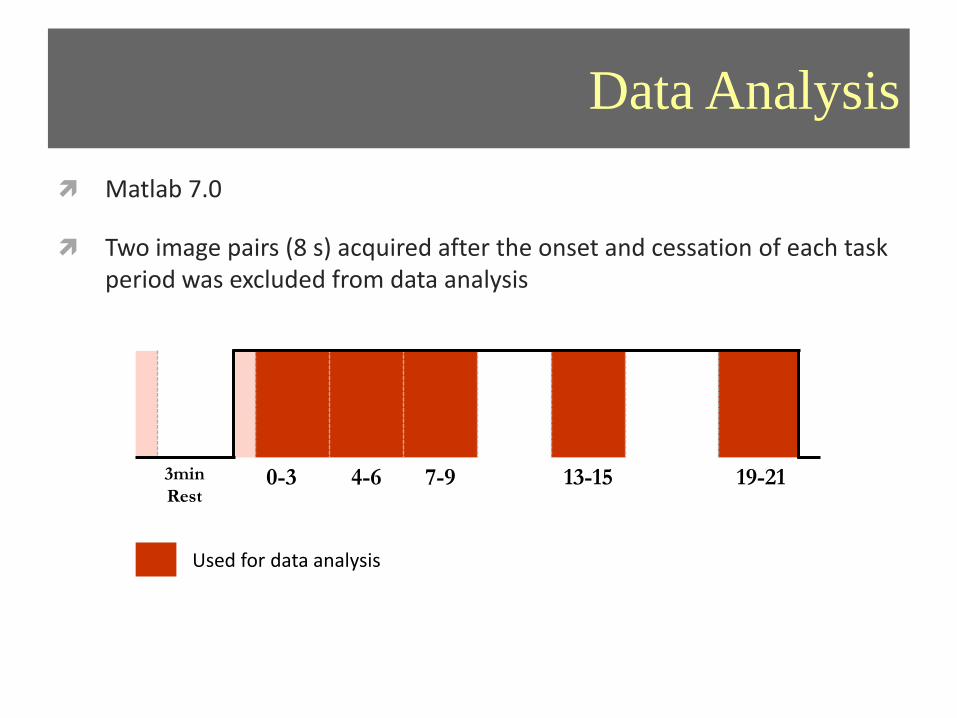
Data Analysis
Matlab 7.0
Two image pairs (8 s) acquired after the onset and cessation of each task period was excluded from data analysis
3min
Rest0-3 4-6 7-9 13-15 19-21
Used for data analysis
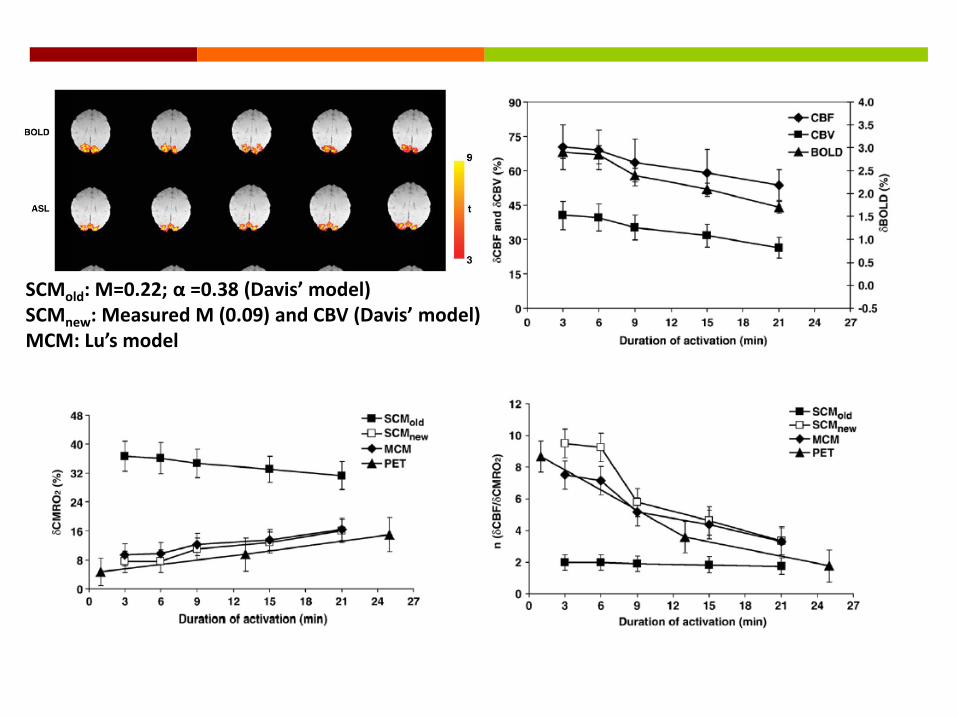
SCMold: M=0.22; α =0.38 (Davis’ model)SCMnew: Measured M (0.09) and CBV (Davis’ model)MCM: Lu’s model
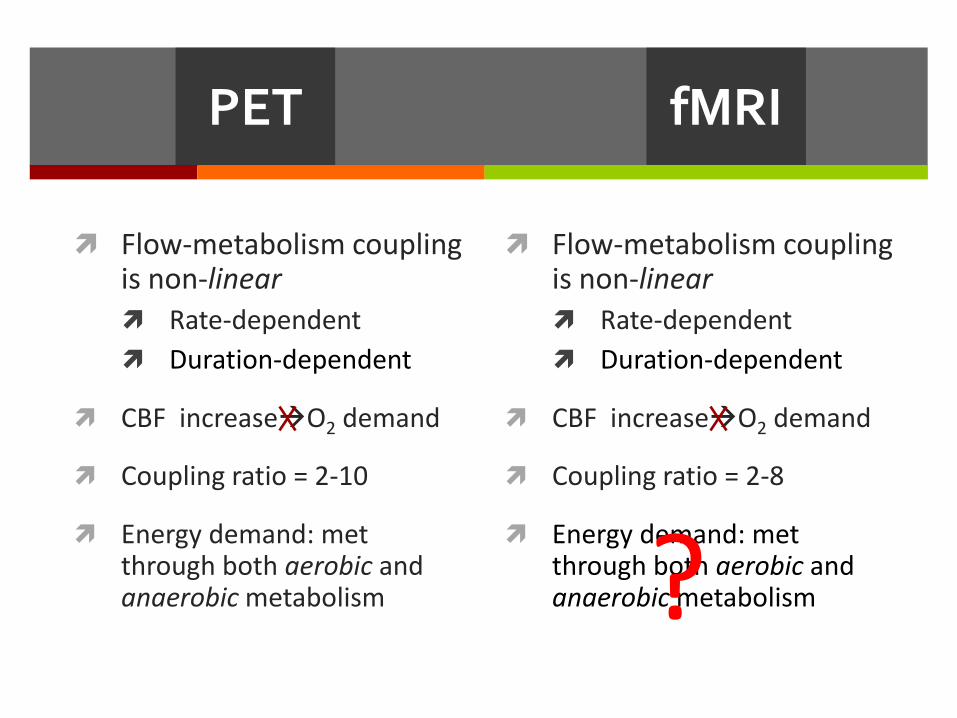
Flow-metabolism coupling is non-linear
Rate-dependent
Duration-dependent
CBF increaseO2 demand
Coupling ratio = 2-10
Energy demand: met through both aerobic and anaerobic metabolism
fMRIPET
Flow-metabolism coupling is non-linear
Rate-dependent
Duration-dependent
CBF increaseO2 demand
Coupling ratio = 2-8
Energy demand: met through both aerobic and anaerobic metabolism?
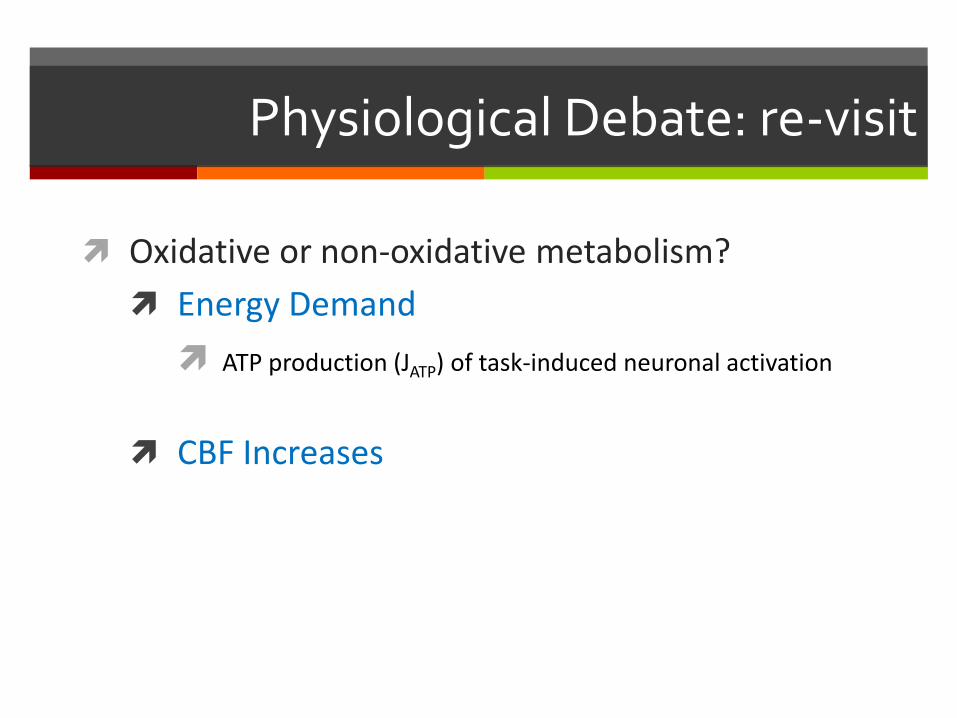
Physiological Debate: re-visit
Oxidative or non-oxidative metabolism?
Energy Demand
ATP production (JATP) of task-induced neuronal activation
CBF Increases
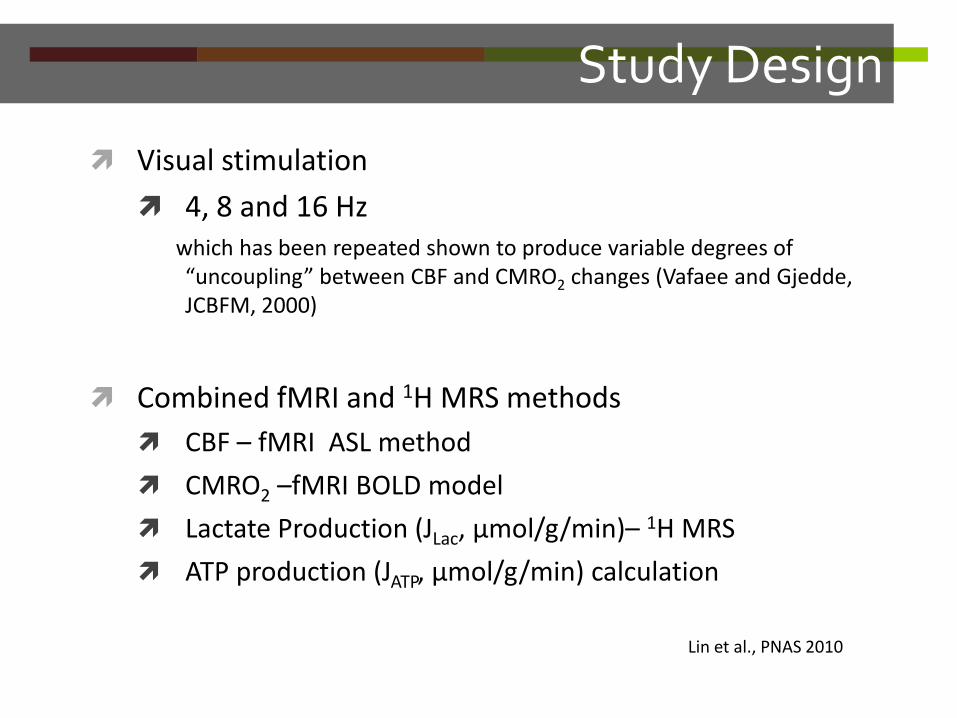
Study Design
Visual stimulation
4, 8 and 16 Hzwhich has been repeated shown to produce variable degrees of “uncoupling” between CBF and CMRO2 changes (Vafaee and Gjedde, JCBFM, 2000)
Combined fMRI and 1H MRS methods
CBF – fMRI ASL method
CMRO2 –fMRI BOLD model
Lactate Production (JLac, μmol/g/min)– 1H MRS
ATP production (JATP, μmol/g/min) calculation
Lin et al., PNAS 2010
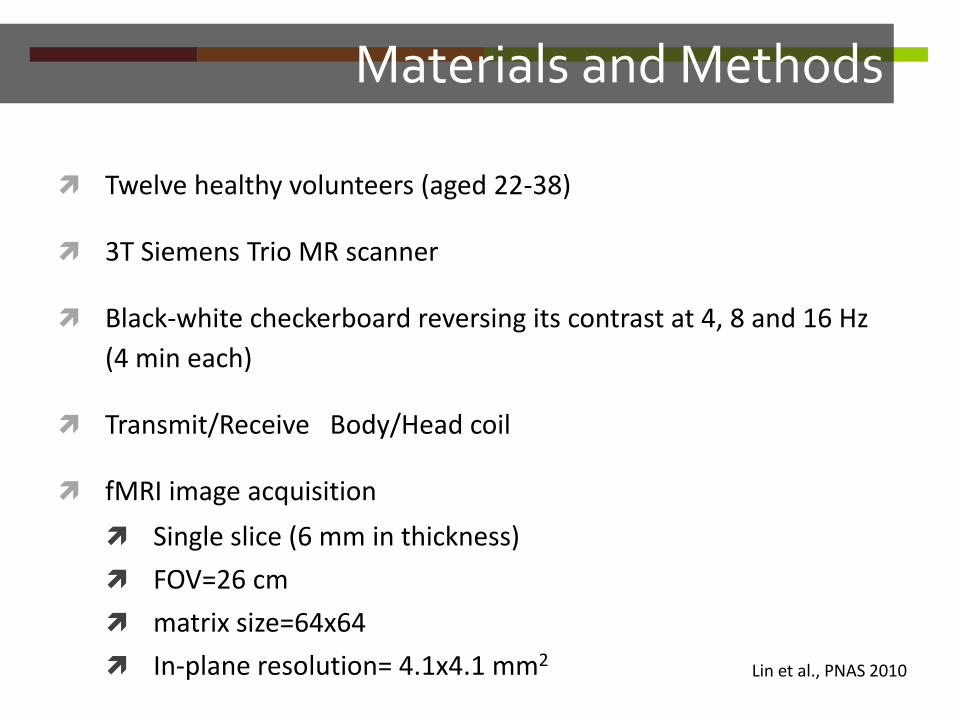
Twelve healthy volunteers (aged 22-38)
3T Siemens Trio MR scanner
Black-white checkerboard reversing its contrast at 4, 8 and 16 Hz
(4 min each)
Transmit/Receive Body/Head coil
fMRI image acquisition
Single slice (6 mm in thickness)
FOV=26 cm
matrix size=64x64
In-plane resolution= 4.1x4.1 mm2
Materials and Methods
Lin et al., PNAS 2010
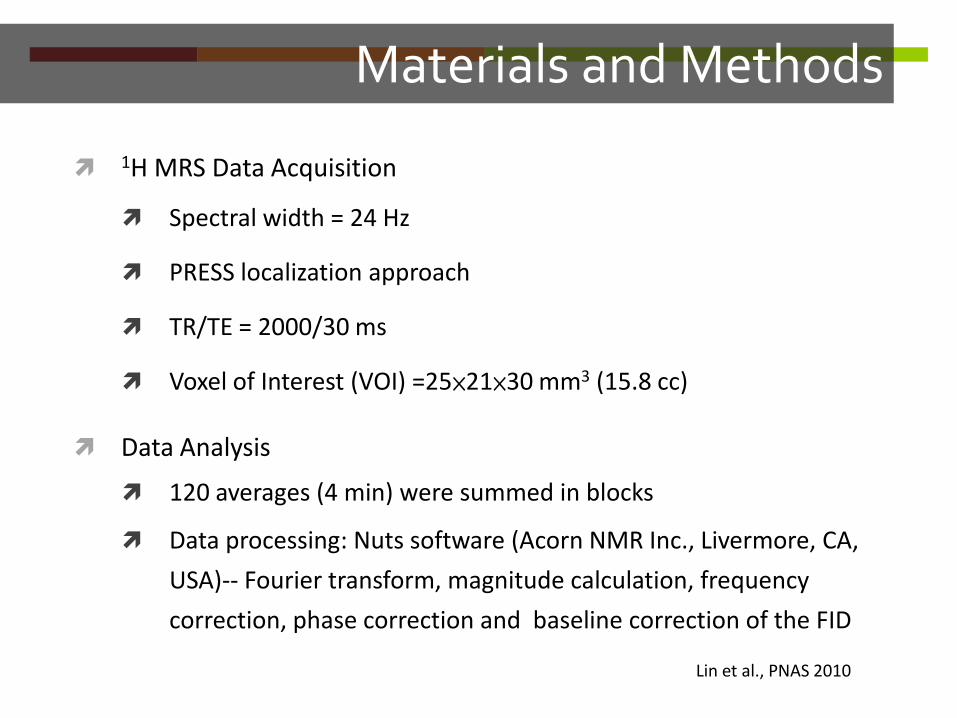
1H MRS Data Acquisition
Spectral width = 24 Hz
PRESS localization approach
TR/TE = 2000/30 ms
Voxel of Interest (VOI) =25×21×30 mm3 (15.8 cc)
Data Analysis
120 averages (4 min) were summed in blocks
Data processing: Nuts software (Acorn NMR Inc., Livermore, CA,
USA)-- Fourier transform, magnitude calculation, frequency
correction, phase correction and baseline correction of the FID
Materials and Methods
Lin et al., PNAS 2010
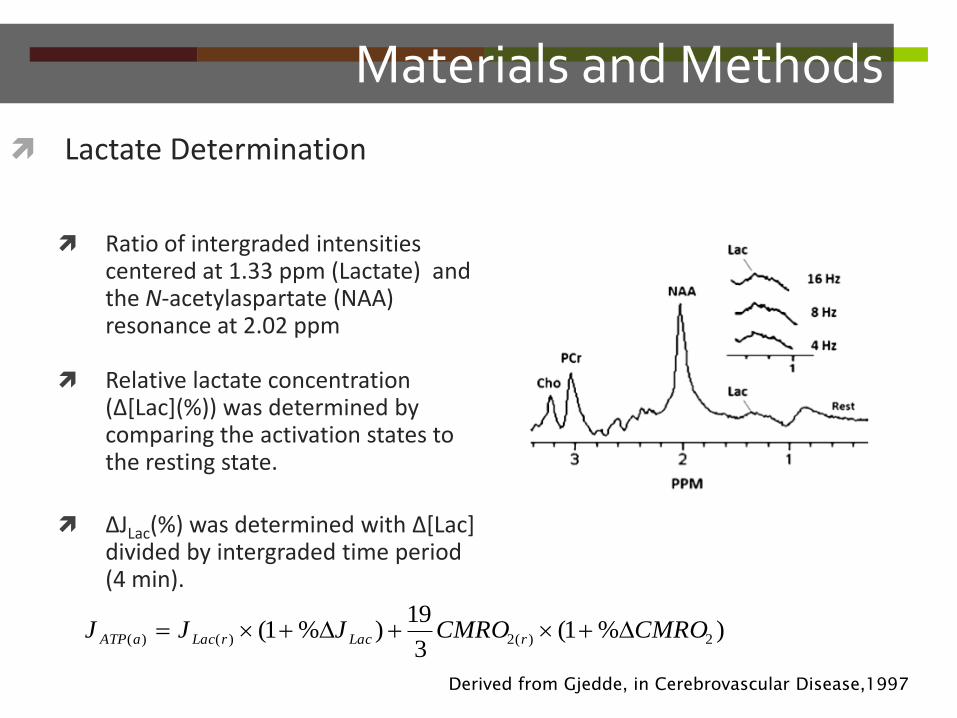
Lactate Determination
Ratio of intergraded intensities centered at 1.33 ppm (Lactate) and the N-acetylaspartate (NAA) resonance at 2.02 ppm
Relative lactate concentration (Δ*Lac+(%)) was determined by comparing the activation states to the resting state.
ΔJLac(%) was determined with Δ*Lac+ divided by intergraded time period (4 min).
Materials and Methods
)%1(3
19)%1( 2)(2)()( CMROCMROJJJ rLacrLacaATP
Derived from Gjedde, in Cerebrovascular Disease,1997
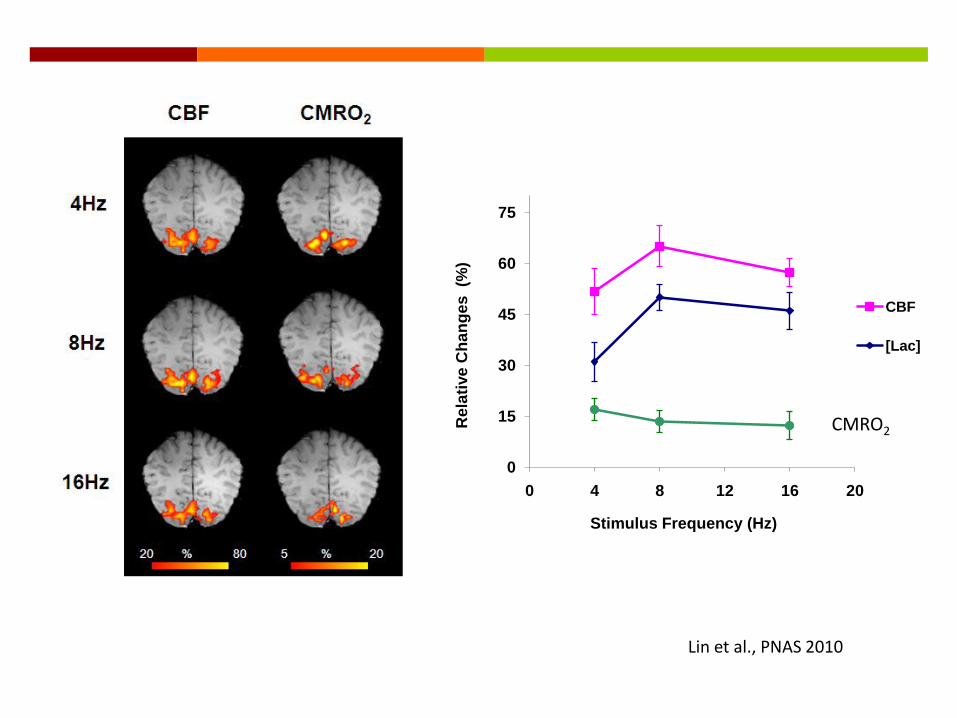
0
15
30
45
60
75
0 4 8 12 16 20
Rela
tive
Ch
an
ge
s (%
)
Stimulus Frequency (Hz)
CBF
[Lac]
CMRO2
Lin et al., PNAS 2010
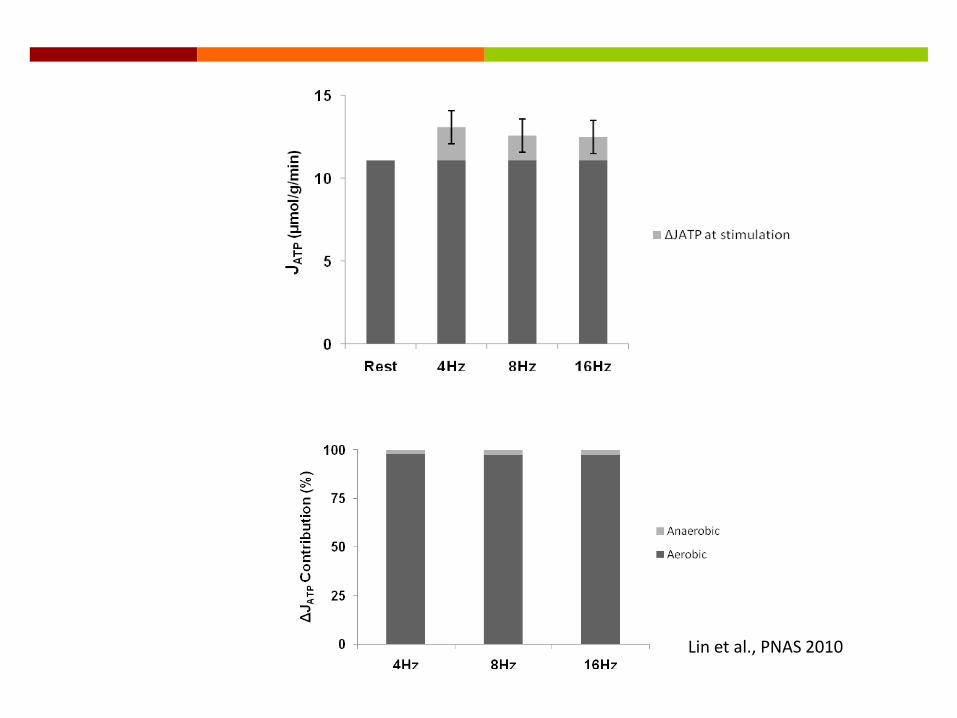
Lin et al., PNAS 2010
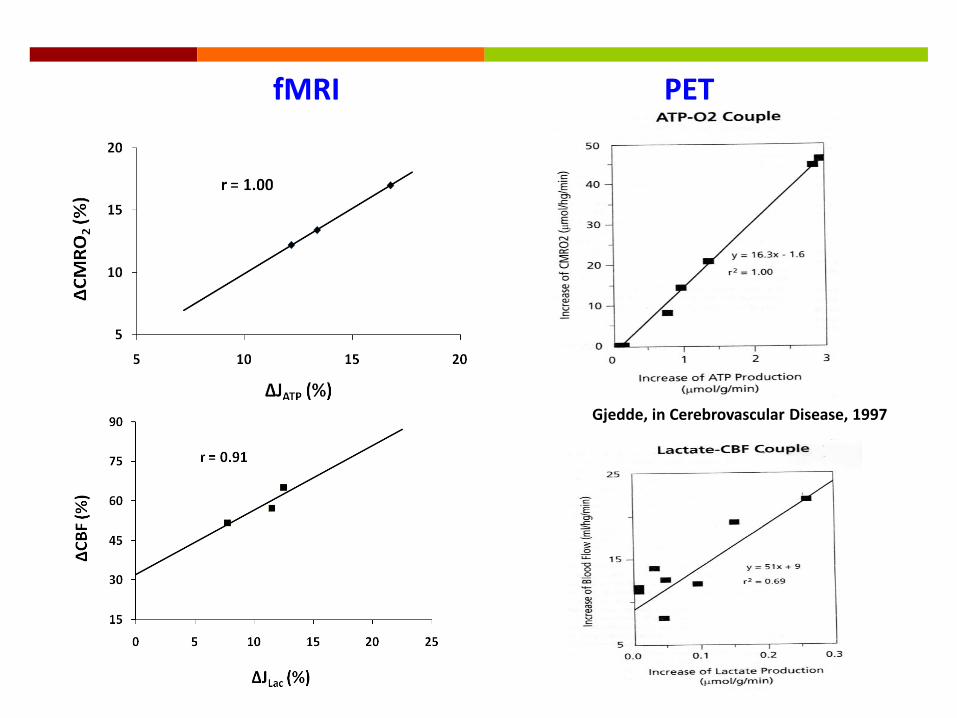
fMRI PET
Gjedde, in Cerebrovascular Disease, 1997
fMRI PET
r = -0.42
25
30
35
40
45
3 6 9 12 15 18
ΔC
BF
(%)
ΔCMRO2 (%)
Adapted from Vafaee and Gjedde, JCBFM 2000
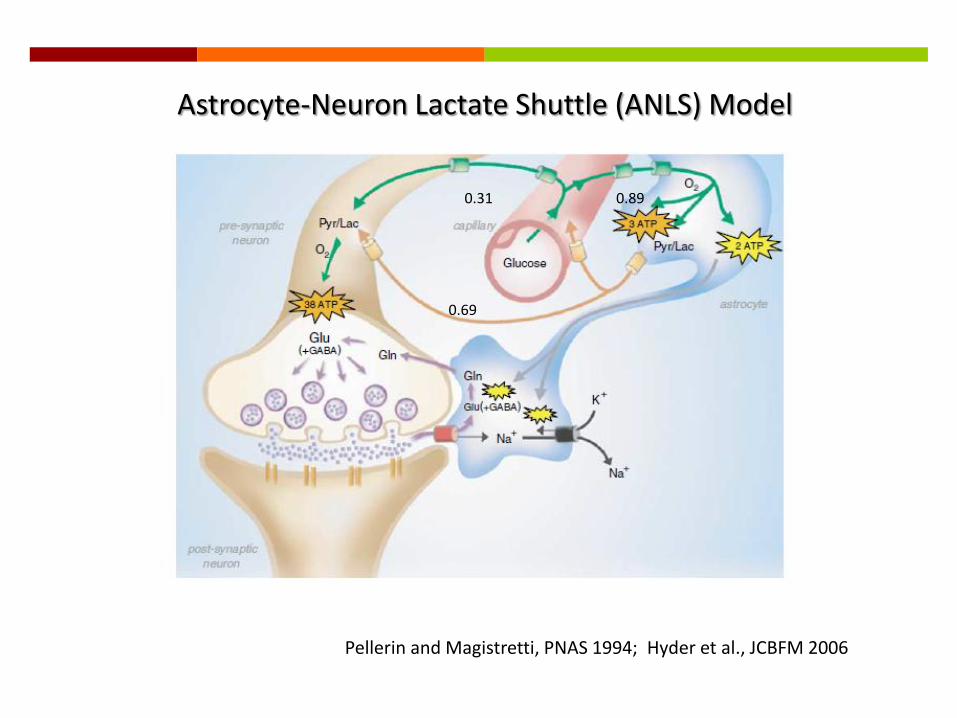
Astrocyte-Neuron Lactate Shuttle (ANLS) Model
Pellerin and Magistretti, PNAS 1994; Hyder et al., JCBFM 2006
0.31 0.89
0.69

The End ?
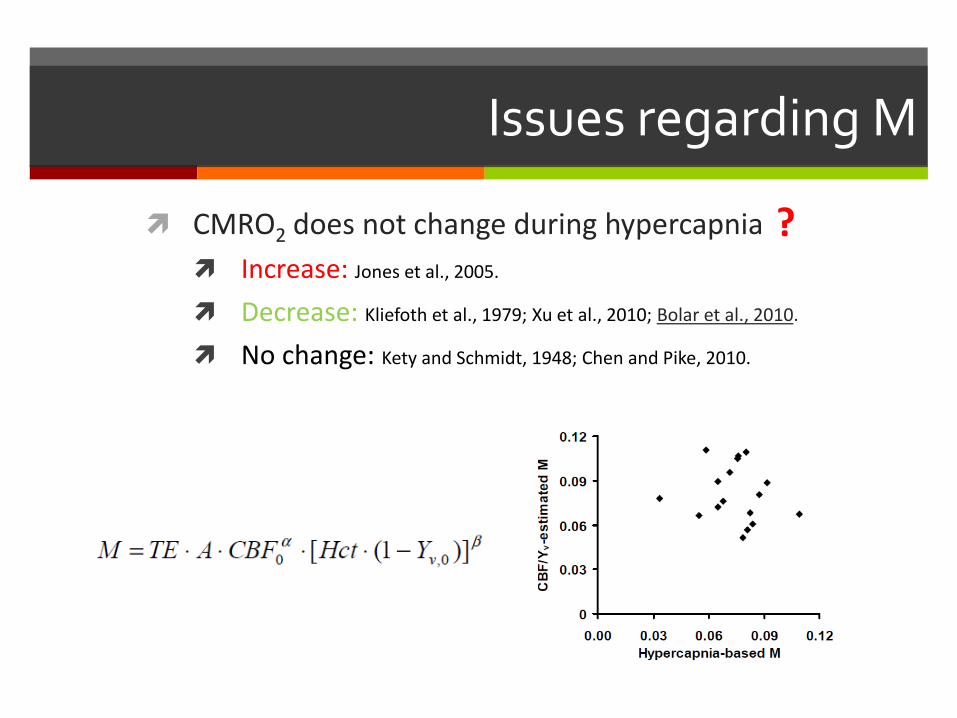
Issues regarding M
CMRO2 does not change during hypercapnia
Increase: Jones et al., 2005.
Decrease: Kliefoth et al., 1979; Xu et al., 2010; Bolar et al., 2010.
No change: Kety and Schmidt, 1948; Chen and Pike, 2010.
?
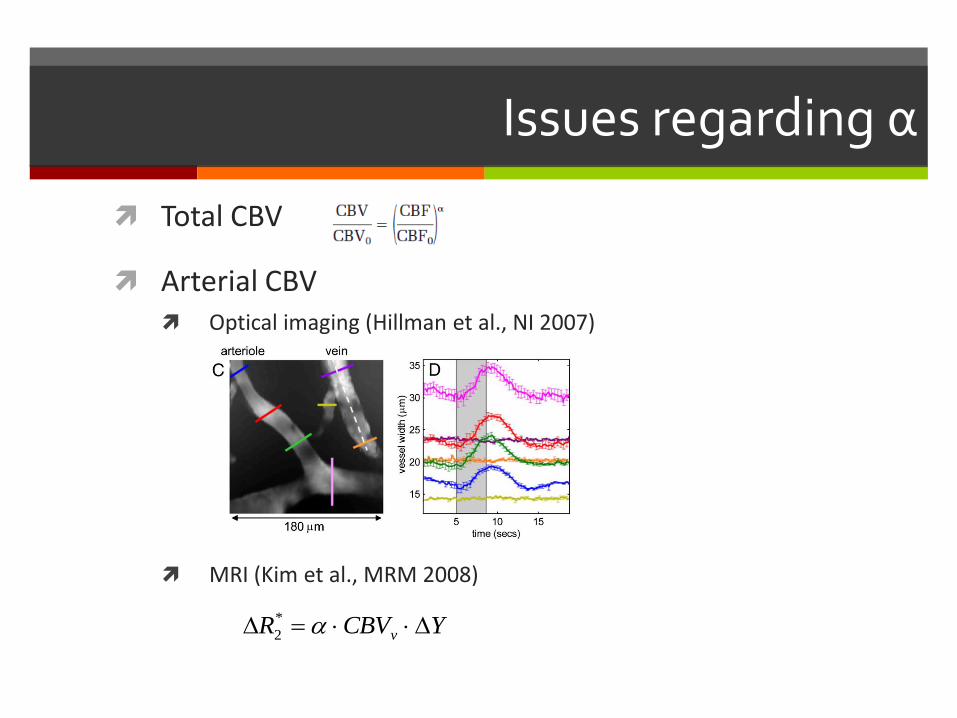
Issues regarding α
Total CBV
Arterial CBV Optical imaging (Hillman et al., NI 2007)
MRI (Kim et al., MRM 2008)
YCBVR v *
2
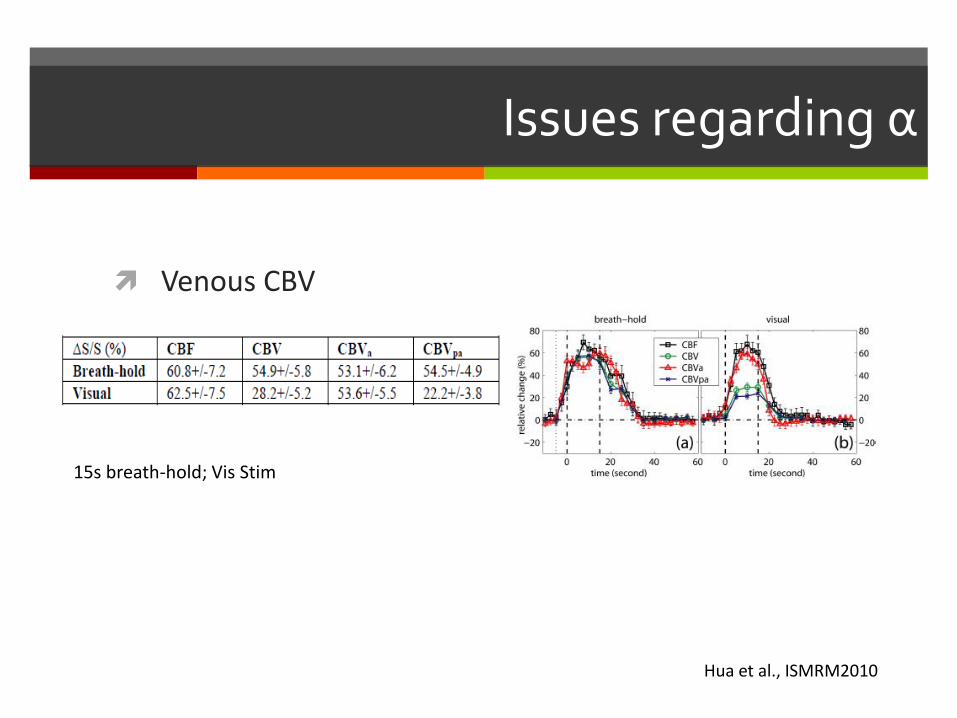
Issues regarding α
Venous CBV
15s breath-hold; Vis Stim
Hua et al., ISMRM2010
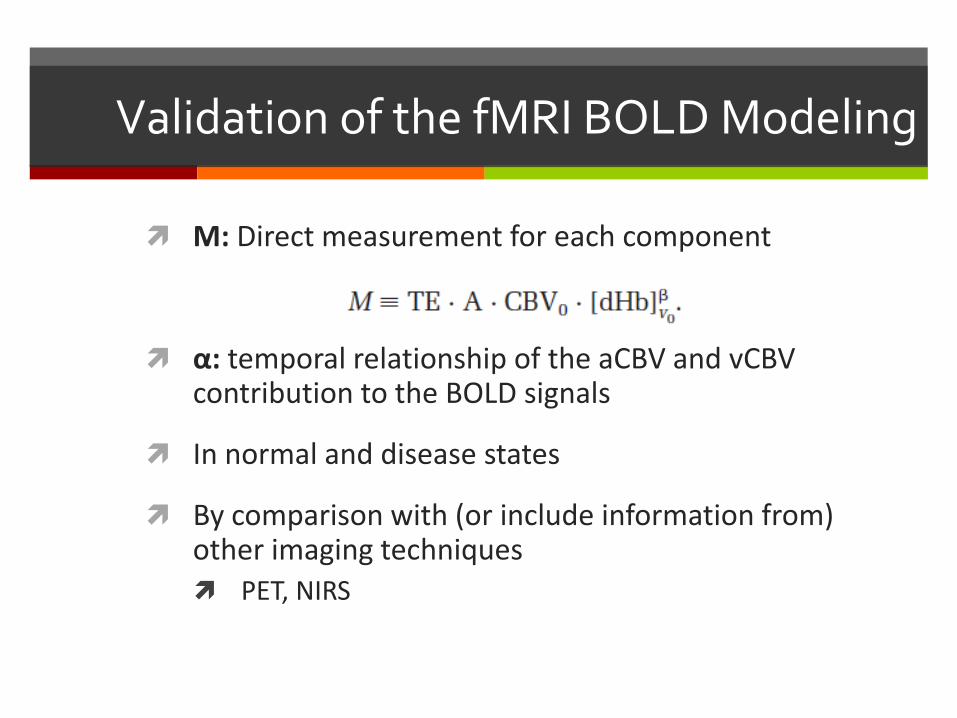
Validation of the fMRI BOLD Modeling
M: Direct measurement for each component
α: temporal relationship of the aCBV and vCBVcontribution to the BOLD signals
In normal and disease states
By comparison with (or include information from) other imaging techniques
PET, NIRS
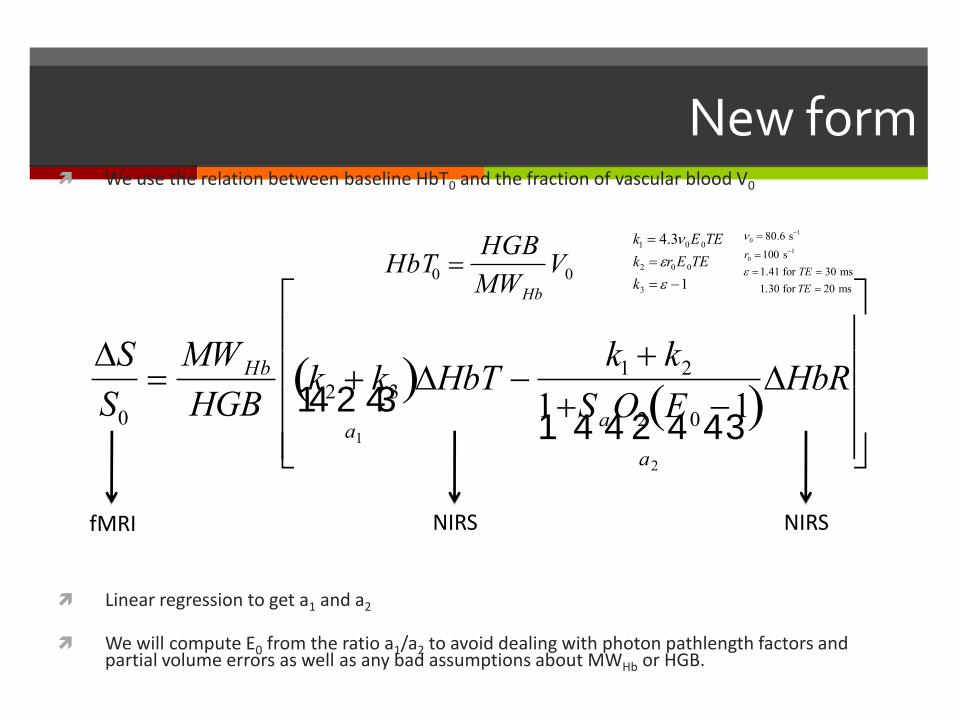
New form We use the relation between baseline HbT0 and the fraction of vascular blood V0
Linear regression to get a1 and a2
We will compute E0 from the ratio a1/a2 to avoid dealing with photon pathlength factors and partial volume errors as well as any bad assumptions about MWHb or HGB.
HbT0 HGB
MWHb
V0
S
S0
MWHb
HGBk2 k3
a1
1 2 4 3 4 HbT
k1 k2
1SaO2 E0 1 a2
1 2 4 4 3 4 4
HbR
fMRI NIRS NIRS
k1 4.30E0TE
k2 r0E0TE
k3 1
0 80.6 s1
r0 100 s1
1.41 for TE 30 ms
1.30 for TE 20 ms
Application
Concurrent of PET-fMRI measurements
• Small Animals
• Patients
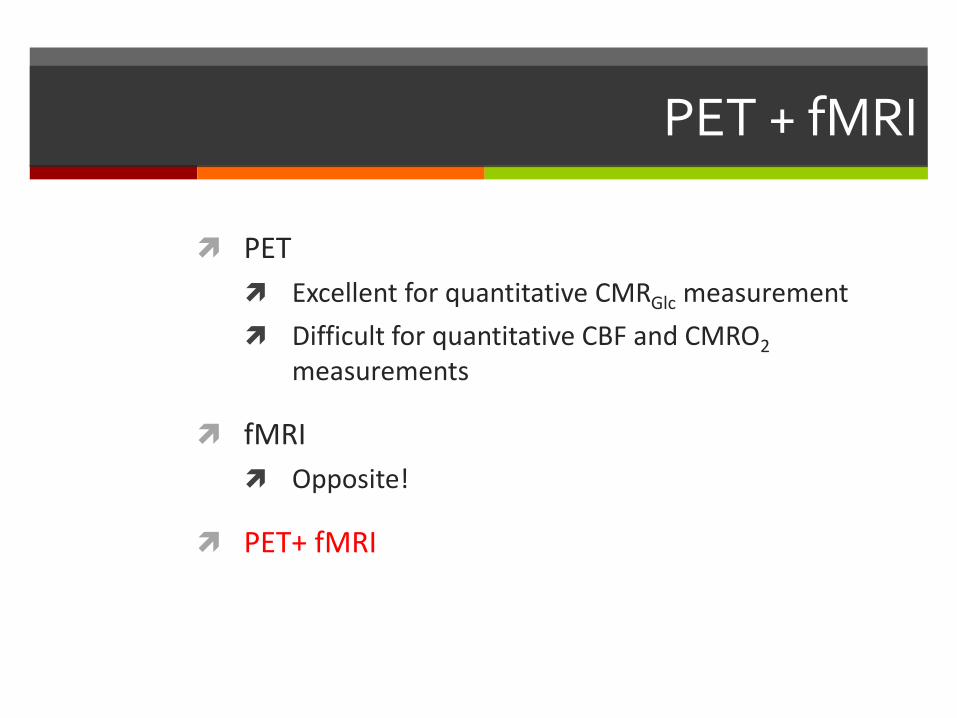
PET + fMRI
PET
Excellent for quantitative CMRGlc measurement
Difficult for quantitative CBF and CMRO2
measurements
fMRI
Opposite!
PET+ fMRI
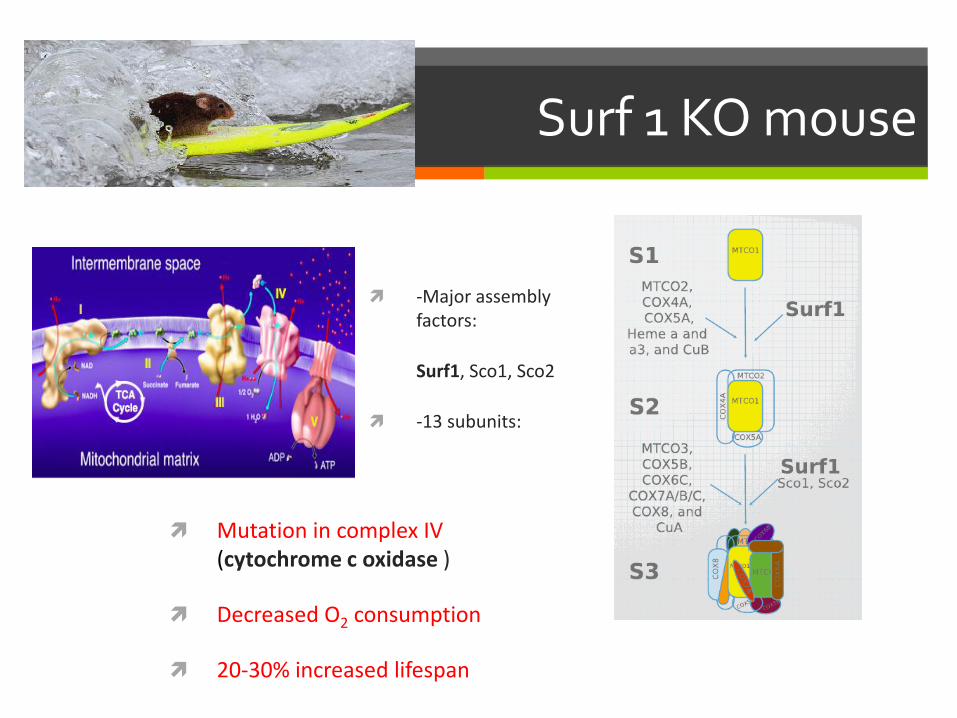
Surf 1 KO mouse
Mutation in complex IV (cytochrome c oxidase )
Decreased O2 consumption
20-30% increased lifespan
-Major assembly factors:
Surf1, Sco1, Sco2
-13 subunits:
Mitochondrial Dysfunction: A means to increasing longevity?
Hypothesis: Metabolic pathway shifts from oxidative to non-oxidative metabolism
Decreased CMRO2 with preserved or increased CMRGlc will be observed in Surf1-/- mice as compared to the age-matched WT mice.
This pathway shift will alter metabolite concentrations, oxygen-glucose index (OGI=CMRO2/CMRGlc), and the flow-metabolism ratio (n=CBF/CMRO2) both in the resting state and during neuronal excitation by forepaw stimulation.
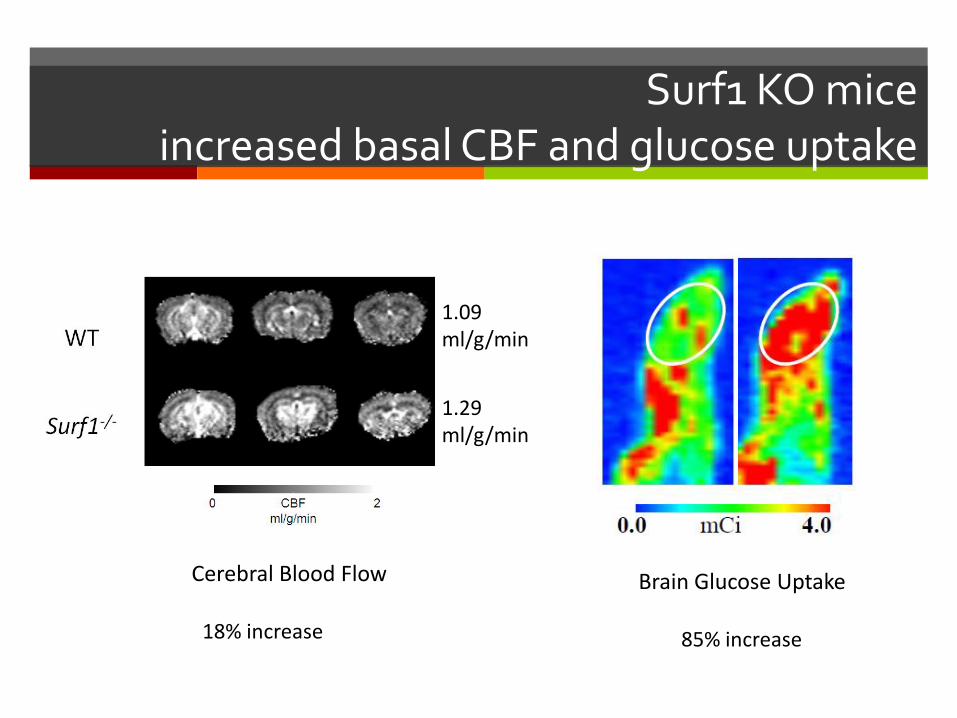
Surf1 KO mice increased basal CBF and glucose uptake
1.09 ml/g/min
1.29 ml/g/min
Cerebral Blood Flow Brain Glucose Uptake
18% increase 85% increase
Task-Induced Changes
Flow-Metabolism uncoupling
%CMRGlc
%CBF
%CMRO2 (importance of fMRI BOLD model validation)
Future Directions
Validation of fMRI BOLD model under various conditions
Quantitative CMRO2 measurements: 15O PET vs. MRI Quantitative BOLD (qBOLD) (An and Lin 2000; He et al., 2008)
17O
PET+ fMRI– animal models Surf mice
Caloric restriction
Rapamycin
Neurodegenerative disorders
PET+ fMRI + NIRS cytochrome c oxidase
Summary
The fMRI CMRO2 measurements are consistent with PET results with proper parameters (M and α).
The fMRI BOLD needs further validation, particularly for disease states.
The multi-metric imaging methods (PET, fMRI, NIRS) will have profound implication in translational research.

Acknowledgements
UTHSCSA
Peter T. Fox, M.D.
UT Southwestern
Medical Center
Hanzhang Lu, Ph.D.
Yale University
Fahmeed Hyder, Ph.D.
NIH and UTHSCSA GCRC grants M01 RR 01346
University of Chicago
Jia-Hong Gao, Ph.D.
NIH/NIDA
Yihong Yang, Ph.D.
University of Minnesota
Silvia Mangia, Ph.D.
Xiao-Hong Zhu, Ph.D.
Davis Boas, Ph.D. for invitation !