fluid management plan for the project shoal area off-sites
TRANSCRIPT


DOE/NV--542
U.S. Department of EnergyNevada Operations Office
E nv ir onm ental R es tor ation D iv is ion
N ev adaE nv ir onm entalR es tor ationPr oject
Flu id M anagem ent Planfor the Pr oject S hoal A r eaOff-S ites Pr oject
Contr olled Copy N o.: R ev is ion N o.: 0
Apr il 1999Approved for public release; further dissemination unlimited.

DOE/NV--542
FLUID MANAGEMENT PLANFOR THE PROJECT SHOAL AREA
OFF-SITES PROJECT
DOE Nevada Operations OfficeLas Vegas, Nevada
Controlled Copy No.:
Revision No.: 0
April 1999
Approved for public release; further dissemination unlimited.

Available to the public from - U.S. Department of CommerceNational Technical Information Services5285 Port Royal RoadSpringfield, VA 22161(703) 487-4650
Available electronically at http://www.doe.gov/bridge. Available toU.S. Department of Energy and its contractors in paper from -
U.S. Department of EnergyOffice of Scientific and Technical InformationP.O. Box 62Oak Ridge, TN 37831-0062(423) 576-8401
FLUID MANAGEMENT PLANFOR THE PROJECT SHOAL AREA
OFF-SITES PROJECT
Approved: Date: Monica L. Sanchez, Project ManagerOff-Sites Project
Approved: Date: Runore C. Wycoff, Division DirectorEnvironmental Restoration Division

FMP for ShoalSection: ContentsRevision: 0Date: 04/30/99Page i of iv
Table of Contents
List of Figures . . . . . . . . . . . . . . . . . . . . . . . . . . . . . . . . . . . . . . . . . . . . . . . . . . . . . . . . . . . . . . ii
List of Tables . . . . . . . . . . . . . . . . . . . . . . . . . . . . . . . . . . . . . . . . . . . . . . . . . . . . . . . . . . . . . . iii
List of Acronyms and Abbreviations . . . . . . . . . . . . . . . . . . . . . . . . . . . . . . . . . . . . . . . . . . . . iv
1.0 Introduction . . . . . . . . . . . . . . . . . . . . . . . . . . . . . . . . . . . . . . . . . . . . . . . . . . . . . . . . . . . . 1
2.0 Proposed Investigation . . . . . . . . . . . . . . . . . . . . . . . . . . . . . . . . . . . . . . . . . . . . . . . . . . . . 2
2.1 Well Construction . . . . . . . . . . . . . . . . . . . . . . . . . . . . . . . . . . . . . . . . . . . . . . . . . . . 2
2.2 Aquifer Tests . . . . . . . . . . . . . . . . . . . . . . . . . . . . . . . . . . . . . . . . . . . . . . . . . . . . . . . 2
2.3 Tracer Experiment . . . . . . . . . . . . . . . . . . . . . . . . . . . . . . . . . . . . . . . . . . . . . . . . . . . 3
3.0 Well Site Operation Strategy . . . . . . . . . . . . . . . . . . . . . . . . . . . . . . . . . . . . . . . . . . . . . . . 5
3.1 Fluid Containment . . . . . . . . . . . . . . . . . . . . . . . . . . . . . . . . . . . . . . . . . . . . . . . . . . . . 6
4.0 Fluid Sampling Program . . . . . . . . . . . . . . . . . . . . . . . . . . . . . . . . . . . . . . . . . . . . . . . . . . . 9
4.1 On-Site Tritium Monitoring . . . . . . . . . . . . . . . . . . . . . . . . . . . . . . . . . . . . . . . . . . . . . 9
4.2 Laboratory Analytical Samples . . . . . . . . . . . . . . . . . . . . . . . . . . . . . . . . . . . . . . . . . 10
5.0 Fluid Management Strategy . . . . . . . . . . . . . . . . . . . . . . . . . . . . . . . . . . . . . . . . . . . . . . . 13
6.0 Fluid Management for Routine Monitoring . . . . . . . . . . . . . . . . . . . . . . . . . . . . . . . . . . . . 16
7.0 Reporting Criteria . . . . . . . . . . . . . . . . . . . . . . . . . . . . . . . . . . . . . . . . . . . . . . . . . . . . . . . 17
8.0 References . . . . . . . . . . . . . . . . . . . . . . . . . . . . . . . . . . . . . . . . . . . . . . . . . . . . . . . . . . . . 20
Appendix A - Tracer Test Capture Zone Analysis (Well Head Protection)
A.1.0 Introduction . . . . . . . . . . . . . . . . . . . . . . . . . . . . . . . . . . . . . . . . . . . . . . . . . . . . . . A-1
A.2.0 References . . . . . . . . . . . . . . . . . . . . . . . . . . . . . . . . . . . . . . . . . . . . . . . . . . . . . . . A-7

FMP for ShoalSection: ContentsRevision: 0Date: 04/30/99Page ii of iv
List of Figures
Number Title Page
2-1 Proposed Infiltration Basin Location . . . . . . . . . . . . . . . . . . . . . . . . . . . . . . . . . . . . 4
3-1 Generic Well Site Layout . . . . . . . . . . . . . . . . . . . . . . . . . . . . . . . . . . . . . . . . . . . . . 8
5-1 Decision Diagram for Fluid Management . . . . . . . . . . . . . . . . . . . . . . . . . . . . . . . . 15
A.1-1 Location of Proposed Tracer Test Wells Relative to the PSA Test . . . . . . . . . . . . A-2
A.1-2 The Capture Zones Associated with the 50 and 95 Percent Confidence
Levels After 120 Days of Pumping . . . . . . . . . . . . . . . . . . . . . . . . . . . . . . . . . . . . A-5
FMP for ShoalSection: ContentsRevision: 0Date: 04/30/99Page iii of iv
List of Tables
Number Title Page
3-1 PSA Well Operation Strategy . . . . . . . . . . . . . . . . . . . . . . . . . . . . . . . . . . . . . . . . . . 7
4-1 Analytical Laboratory Requirements for Fluid Management Samples . . . . . . . . . . . 11
5-1 Fluid Management Decision Criteria Limits . . . . . . . . . . . . . . . . . . . . . . . . . . . . . . 13
A.1-1 Distributions of Uncertain Parameters Used in the RESSQC Simulations . . . . . . . A-3

FMP for ShoalSection: ContentsRevision: 0Date: 04/30/99Page iv of iv
List of Acronyms and Abbreviations
BoFF Bureau of Federal Facilities
CADD Corrective Action Decision Document
CAIP Corrective Action Investigation Plan
DOE U.S. Department of Energy
DOE/NV U.S. Department of Energy, Nevada Operations Office
FFACO Federal Facility Agreement and Consent Order
FMP Fluid Management Plan
ft Foot (feet)
gal Gallon(s)
gpm Gallon(s) per minute
m Meter(s)
m3 Cubic meter(s)
m3/day Cubic meter(s) per day
mL Milliliter(s)
mg/L Milligram(s) per liter
NDEP Nevada Division of Environmental Protection
NDWS Nevada Drinking Water Standards
NTS Nevada Test Site
pCi/L Picocurie(s) per liter
PSA Project Shoal Area
RCRA Resource Conservation and Recovery Act
SGZ Surface Ground Zero
TD Total depth

FMP for ShoalSection: 1.0Revision: 0Date: 04/30/99Page 1 of 20
1.0 Introduction
The U.S. Department of Energy, Nevada Operations Office (DOE/NV) has initiated the Off-Sites
Project to characterize the hazards posed to human health and the environment as a result of
underground nuclear testing activities at facilities other than the Nevada Test Site (NTS). The
Project Shoal Area (PSA) is one of the Off-Sites Project areas located off the NTS, but within the
state of Nevada. The PSA is located approximately 48 kilometers (30 miles) southeast of Fallon,
Nevada. Four wells were drilled at the PSA in 1996 as part of the site investigation administered
through the Federal Facility Agreement and Consent Order (FFACO) (1996). The
hydrogeologic data gathered from these wells was used to support the groundwater flow and
contaminant transport modeling of the PSA. However, the subsequent evaluation of the
groundwater model concluded that further delineation of the subsurface was required to reduce
uncertainties in the model. In accordance with the FFACO, an addendum to the Corrective
Action Investigation Plan (CAIP) for the proposed PSA subsurface investigation, Corrective
Action Unit 447, was developed (DOE/NV, 1999). The addendum proposed the drilling and
construction of four additional wells and the conduct of hydrologic testing at the PSA. This Fluid
Management Plan (FMP) provides guidance for the management of fluids generated from the well
construction and testing activities at the PSA.
FMP for ShoalSection: 2.0Revision: 0Date: 04/30/99Page 2 of 20
2.0 Proposed Investigation
The proposed investigation of the PSA site includes the construction of four wells (HC-5, HC-6,
HC-7, and HC-8) at depths ranging from approximately 457.2 meters (m) (1,500 feet [ft]) to
1,219.2 m (4,000 ft) below the ground surface. The placement and construction of these wells
will facilitate the collection of subsurface data and allow for the conduct of a tracer experiment
involving two of the wells. All data collected during well construction and conduct of the tracer
test will support further refinement of the PSA groundwater flow and transport model.
For the purpose of this FMP, the PSA investigation may be divided into three operative phases:
well construction, aquifer testing, and the tracer experiment. Each of these phases is described in
detail below.
2.1 Well Construction Well construction activities include unsaturated and saturated zone drilling, and initial well
development. Unsaturated zone, or vadose zone, drilling is conducted above the permanent
groundwater table. During vadose zone drilling, primarily rock cuttings are produced with a
limited amount of drilling fluid.
Saturated zone drilling begins once the water table is reached and continues through the saturated
zone to the desired total depth (TD). Groundwater, cuttings, and any necessary drilling fluids are
produced during saturated-zone drilling. Once TD is reached, casing and screening will be
installed. The borehole will then be developed (i.e., purged) to remove residual cuttings and any
drilling fluids which may have invaded the formation during drilling.
A total of approximately 330 cubic meters (m3) (87,000 gallons [gal]) of fluids were produced
during the 1996 well construction effort. It is anticipated that fluids produced during drilling of
the four new wells will produce approximately five times the fluid volume encountered during the
1996 drilling effort.
2.2 Aquifer TestsAn aquifer test will be conducted after each well is initially developed. Aquifer testing is expected
to last approximately seven days for each well. It is estimated that approximately 450 m3
(120,000 gal) of fluid will be produced during the aquifer tests.

FMP for ShoalSection: 2.0Revision: 0Date: 04/30/99Page 3 of 20
2.3 Tracer ExperimentThe tracer experiment objectives and scope are outlined in the CAIP Addendum (DOE/NV,
1999). The tracer test will involve two wells, HC-6 and HC-8, drilled in this investigation
(Figure 2-1). This test will be conducted until adequate tracer breakthrough occurs and thus has
the potential to produce the largest volume of fluids (primarily groundwater) during the
investigation. The maximum estimated fluid production is 1,970 m3 (520,000 gal), though much
smaller volumes will be produced if breakthrough occurs rapidly.


FMP for ShoalSection: 3.0Revision: 0Date: 04/30/99Page 5 of 20
3.0 Well Site Operation Strategy
The well-site operation strategy must be determined prior to commencement of the operation.
Such a strategy is designed with fluid production and expected contamination in mind. The
well-site operation strategy dictates the type of sump(s) required for the operation and the initial
on-site monitoring requirements. In order to determine the well-site operation strategy to be
employed at the PSA during the proposed investigation activities, an assessment of previous site
investigation results and historical data was conducted. It was determined through this
assessment, that the four proposed well sites will be constructed based on a “far-field,” or
uncontaminated, well operation strategy. That is, the site would be constructed and the fluid
management strategy proposed under the assumption that radiological and/or chemical
contamination would not be encountered at the site. Information used in support of the PSA
far-field determination include the following:
• Proximity to the Shoal Underground Test and Hydrogeologic Setting of ProposedWells. As detailed in Appendix A, the proposed wells will be drilled well outside thetritium contamination plume predicted by the current transport and flow groundwatermodeling effort. This predicted plume extends in a radius of 100 m (328 ft) aroundsurface ground zero (SGZ) of the underground test; the proposed well locations are to bedrilled at distances ranging from 426.7 to 579.1 m (1,400 - 1,900 ft) away from SGZ (seeAppendix A). In addition, the four wells drilled in 1996 were located within a range of182.8 to 1,005.9 m (600 - 3,300 ft) from SGZ and did not yield evidence of radioactive orchemical contamination above fluid management parameters (see tritium and leaddiscussions below).
• Potential for Tritium Contamination in Groundwater. During the 1996 drilling effort,tritium was monitored on site on an hourly basis while the borehole was being advanced. As indicated in the 1998 Data Report, the tritium activities detected during on-sitemonitoring were all within background activities for the PSA (DOE/NV,1998). All fluidsduring the 1996 drilling effort were contained in lined sumps during operations. Inaccordance with the FMP, sump samples were collected and sent to an off-site laboratoryfor metals and radiochemical analysis. The sump samples showed tritium levels rangingfrom non-detect to 22 picocuries per liter (pCi/L) (DOE/NV, 1998). The tritium limit fordischarge of fluids to the ground surface under the 1996 drilling FMP was 100,000 pCi/L. Because all tritium results were well below the 100,000 pCi/L limit, all fluids from the1996 drilling effort were discharged from the lined sumps to the ground surface.
• Potential for Lead Contamination in Groundwater. One of the reasons that lead waschosen as the on-site indicator of chemical contamination in groundwater during drillingoperations associated with U.S. Department of Energy (DOE) underground tests, is

FMP for ShoalSection: 3.0Revision: 0Date: 04/30/99Page 6 of 20
because lead-laden "racks" were commonly used in the design and construction of suchtests. These "racks" provided the necessary infrastructure for proper emplacement of thetest device. For the Project Shoal test, however, a different emplacement technique wasutilized. A vertical shaft and horizontal drift were mined in the granite subsurface toprovide access to the emplacement site (Pohll et. al., 1998). The test design did not resultin the use of materials containing large amounts of lead, in contrast to many of theunderground tests conducted on the NTS.
During the 1996 drilling effort, lead was monitored on site every eight hours as eachborehole was advanced. The lead monitoring results indicated no detectable lead in thedrilling fluids and/or groundwater produced. Well sump samples were collected and sentto an off-site laboratory for Resource Conservation and Recovery Act (RCRA) metalsanalyses. Lab analytical results for lead ranged from 0.0013 to 0.0103 milligrams per liter(mg/L) in the sump samples. All RCRA metals, including lead, were detected atconcentrations below the fluid management discharge limits for discharge to the groundsurface.
In conclusion, such operational and analytical data supports the premise that the probability is
remote of encountering radioactive and/or chemical constituents above background levels during
the proposed investigation. Operational contingencies have been identified and included in this
FMP should radiological and/or chemical contamination be detected.
Table 3-1 outlines the major components of the well operations strategy under this Plan.
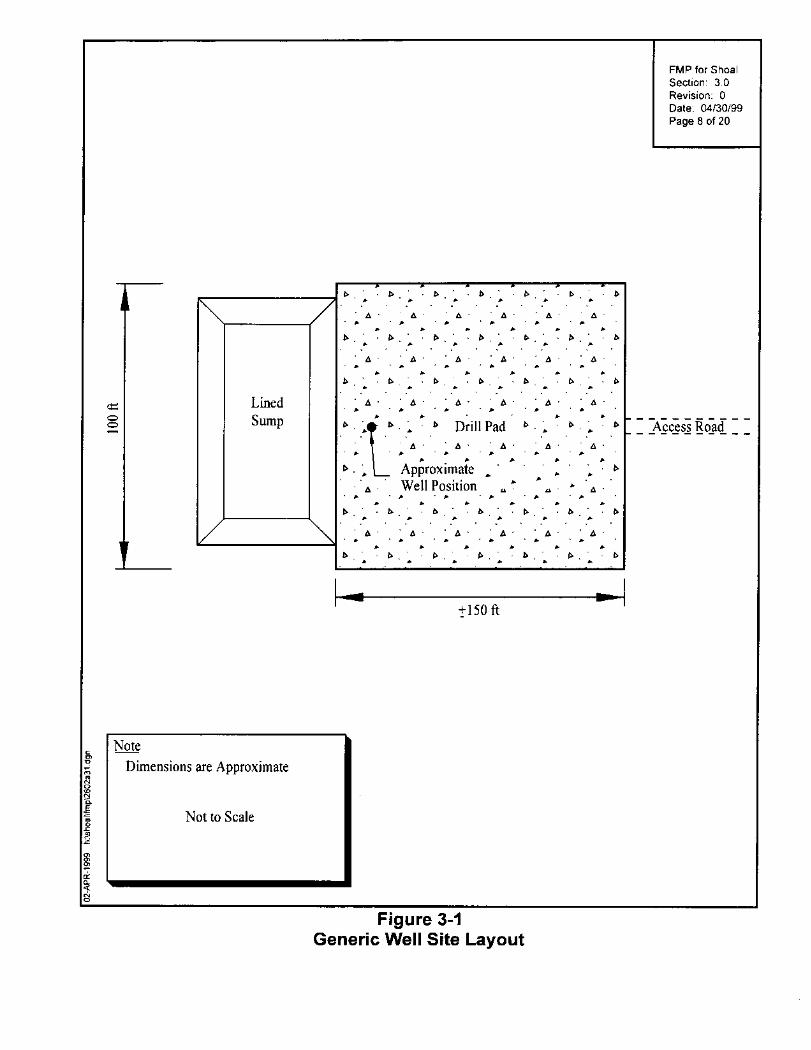
3.1 Fluid ContainmentFigure 3-1 represents a generic layout for well site operations at the PSA. One lined sump will be
constructed for the collection of cuttings and fluids at each well site. A larger excavation
intended for use as an infiltration basin will be constructed in a central location to the four
proposed well sites (Figure 2-1). This infiltration basin will be used only to discharge fluids which
meet the discharge criteria of < 10 x NDWS, as specified in see Section 5.0. Prior to discharge
to this infiltration basin, fluid must be sampled as discussed in Section 4.2 of this FMP.

FMP for ShoalSection: 3.0Revision: 0Date: 04/30/99Page 7 of 20
Table 3-1PSA Well Operation Strategy
On-SiteMonitoring
Action Level Containment Strategy& Contingency
Off-Site FluidAnalysis
Final FluidDisposition
ReportingRequirements
Drilling & WellDevelopment
Tritium Monitoringbegins at ~200 ftabove predictedwater level andcontinues every100 ft or every2 hours,whichever is less
Tritium < 200,000 pCi/L Fluids discharged tolined sump
Required prior todischarge fromsump toinfiltration basinor ground surface
Dependant onanalytical results
On-site tritium resultsincluded in MorningReport
Sump analyticalresults in CorrectiveAction DecisionDocument (CADD) onFFACO schedule
Tritium > 200,000 pCi/L Fluids discharged tolined sump; tritiummonitoring increased tohourly
Aquifer Test Tritium Monitoringevery four hoursa
Tritium < 200,000 pCi/L Fluids discharged tolined sump
Tritium > 200,000 pCi/L Fluids discharged tolined sump; tritiummonitoring increased tohourly
Tracer Test Tritium Samplecollected everyweek (analyzedoff-site with one-day turnaroundtime)
Tritium < 200,000 pCi/L Fluids discharged tolined sump
Weekly tritium sampleresults and fluidvolume dischargedreported once a weekTritium > 200,000 pCi/L Fluids discharged to
lined sump; siteoperations suspended
aWell HC-8 will transition from tritium monitoring every 2 hours (during drilling and development) to tritium monitoring weekly, if tritium results from the other three wells remain below fluidmanagement criteria (i.e., 200,000 pCi/L).
FMP for ShoalSection: 4.0Revision: 0Date: 04/30/99Page 9 of 20
4.0 Fluid Sampling Program
This FMP provides for the verification of process knowledge through on-site monitoring and
off-site laboratory analyses. On-site monitoring provides for the timely detection of
contamination indicators during site operations. Off-site laboratory fluid analyses are conducted
primarily to confirm process knowledge and ensure that fluid discharge criteria are met.
4.1 On-Site Tritium MonitoringBased on its physical and chemical properties, tritium has been chosen as the indicator for
radioactive contamination. The primary purpose for tritium monitoring under this FMP is to
show the relatively “real-time” concentration of tritium in the groundwater being brought to the
surface at a given point in time. This monitoring information is used to determine if the site
becomes radiologically “contaminated” and triggers subsequent fluid management and health and
safety requirements. On-site monitoring results are not used to determine if fluids meet discharge
criteria.
Fluids generated during drilling will be analyzed for tritium while the drill hole is being advanced.
On-site monitoring of tritium will begin at approximately 61 m (200 ft) above the predicted
groundwater level at each well. Samples will be collected and analyzed at every 30 m (100 ft)
drilled or every 2 hours, whichever is sooner. In the event that on-site monitoring at any of the
four wells during drilling or development reveals tritium concentrations that exceed
200,000 pCi/L (see Section 5.0), tritium monitoring shall increase to hourly and the DOE/NV will
be notified immediately. During periods when the hole is not being advanced, during circulation
or while attempting to establish circulation, monitoring is not required. Tritium samples for on-
site monitoring shall be collected from the discharge line. Additional samples for monitoring
purposes may be collected from the discharge line or from the lined sump at DOE/NV’s
discretion.
During the aquifer tests, tritium will be monitored on site every four hours. In the event that
tritium monitoring results from wells HC-5, HC-6, and HC-7 do not indicate an upward trend of
tritium concentrations or yield tritium concentrations above 200,000 pCi/L, Well HC-8 will
transition directly to the monitoring frequency of the tracer experiment (i.e., weekly monitoring)
during its aquifer test. Well HC-8 is the furthest from SGZ of all the investigation well locations
and will be the well from which the majority of water will be pumped during the tracer

FMP for ShoalSection: 4.0Revision: 0Date: 04/30/99Page 10 of 20
experiment. It is anticipated that if tritium does not exceed fluid management criteria during the
aquifer tests on the three prior wells, tritium will not be detected in Well HC-8. In the event that
on-site monitoring at any of the four wells during the aquifer tests reveals tritium concentrations
that exceed 200,000 pCi/L (see Section 5.0), tritium monitoring shall increase to hourly and the
DOE/NV will be notified immediately.
During the tracer experiment, tritium samples will be collected and analyzed for monitoring
purposes once a week. The PSA will not be continuously staffed during the tracer experiment.
Rather, the site will be visited on a weekly basis, or as needed, to ensure that operations are
proceeding as planned. During these visits, or at least weekly, a sample of fluid from the
discharge line will be obtained and analyzed at an off-site laboratory for tritium only. This sample
will have an anticipated one-day turnaround time with regard to the receipt of results from the
time the sample is collected on site.
These reduced requirements for on-site monitoring during the aquifer and tracer tests are
predicated on the well sites maintaining “far-field,” or uncontaminated, conditions. In the event
that on-site monitoring at any of the four wells during the tracer experiment reveals tritium
concentrations that exceed 200,000 pCi/L (see Section 5.0), fluid-producing operations shall be
suspended. If operations are suspended, DOE/NV shall be notified immediately and DOE/NV
will determine any further course of action. Resumption of fluid-producing operations will
proceed only upon direction of the DOE/NV.
Tritium monitoring results will be reported to DOE/NV and Nevada Division of Environmental
Protection (NDEP) according to the schedule outlined in Section 7.0 of this document.
4.2 Laboratory Analytical SamplesUnder this FMP, prior to discharge of any fluid to the unlined infiltration basin, a sample from the
lined sump shall be collected and analyzed by an off-site laboratory. The primary purpose of these
samples is to characterize the fluids for discharge/disposal. That is, the off-site laboratory sample
results should be compared to the fluid management decision criteria limits, as outlined in
Section 5.0, to determine if fluids may be discharged. Each sump sample must be analyzed for
dissolved lead, gross alpha, gross beta, and tritium, in accordance with Table 4-1.

FMP for ShoalSection: 4.0Revision: 0Date: 04/30/99Page 11 of 20
Table 4-1Analytical Laboratory Requirements for Fluid Management Samples
Parameter AnalyticalMethod
Container Type Preservative Maximum HoldingTime
Reporting DetectionLimit
Nevada DrinkingWater Standards
Dissolved Lead SW-8466010Ba
(1) 1-Lb
polyethylene oramber glass
Lab filtration andpreservation, Cool to 4EC
180 Days 0.003 mg/Lc 0.015 mg/L
Gross Alpha
Gross Beta
L-E10.612.PLd
or equivalent(1) 1-L
polyethyleneLab filtration and
preservation180 Days <15 pCi/Le
<15 pCi/L
15 pCi/L
50 pCi/L
Tritium L-E10.614.PLd
or equivalent(1) 500-mLf
polyethylene oramber glass
Lab filtration 180 Days 3,000 pCi/L 20,000 pCi/L
aU.S. Environmental Protection (EPA) Test Methods for Evaluating Solid Waste, 3rd Edition, SW-846 (EPA, 1996)bLitercMilligram(s) per literdBechtel Analytical Services Laboratory Procedure Manual (I), February 1999, Bechtel NevadaePicocurie(s) per literfMilliliter

FMP for ShoalSection: 4.0Revision: 0Date: 04/30/99Page 12 of 20
It is anticipated that aquifer testing will proceed directly after completion of a well (i.e., after TD
is reached at each well) and the tracer test will begin shortly after completion of the last aquifer
test. The lined sump at each well site will be constructed to contain the volume of all fluids
resulting from drilling, aquifer testing, and the tracer test (HC-6 and HC-8 only). However, if an
active sump at any location is nearing capacity at any stage in the investigation, fluids from this
sump may be routed to other empty lined sumps on site. Prior to discharge to the infiltration
basin from any sump, however, a sample shall be collected from the sump as stated in the
preceeding paragraph. Sump samples may be collected for off-site analysis throughout the
investigation at DOE/NV’s discretion.
Upon site demobilization at the end of the investigation, at least one representative sump sample
must be collected or appropriate analytical data available, for each sump which contains fluid at
the PSA site.
FMP for ShoalSection: 5.0Revision: 0Date: 04/30/99Page 13 of 20
5.0 Fluid Management Strategy
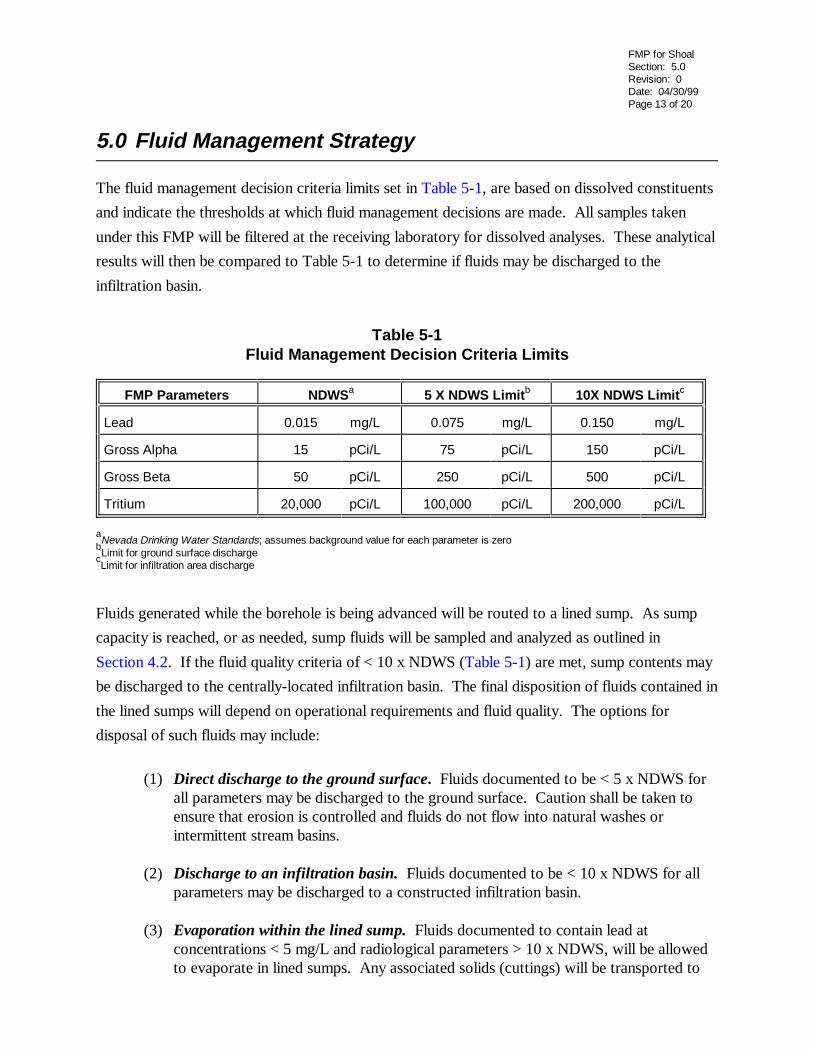
The fluid management decision criteria limits set in Table 5-1, are based on dissolved constituents
and indicate the thresholds at which fluid management decisions are made. All samples taken
under this FMP will be filtered at the receiving laboratory for dissolved analyses. These analytical
results will then be compared to Table 5-1 to determine if fluids may be discharged to the
infiltration basin.
Table 5-1Fluid Management Decision Criteria Limits
FMP Parameters NDWSa 5 X NDWS Limitb 10X NDWS Limitc
Lead 0.015 mg/L 0.075 mg/L 0.150 mg/L
Gross Alpha 15 pCi/L 75 pCi/L 150 pCi/L
Gross Beta 50 pCi/L 250 pCi/L 500 pCi/L
Tritium 20,000 pCi/L 100,000 pCi/L 200,000 pCi/L
aNevada Drinking Water Standards; assumes background value for each parameter is zero
bLimit for ground surface discharge
cLimit for infiltration area discharge
Fluids generated while the borehole is being advanced will be routed to a lined sump. As sump
capacity is reached, or as needed, sump fluids will be sampled and analyzed as outlined in
Section 4.2. If the fluid quality criteria of < 10 x NDWS (Table 5-1) are met, sump contents may
be discharged to the centrally-located infiltration basin. The final disposition of fluids contained in
the lined sumps will depend on operational requirements and fluid quality. The options for
disposal of such fluids may include:
(1) Direct discharge to the ground surface. Fluids documented to be < 5 x NDWS forall parameters may be discharged to the ground surface. Caution shall be taken toensure that erosion is controlled and fluids do not flow into natural washes orintermittent stream basins.
(2) Discharge to an infiltration basin. Fluids documented to be < 10 x NDWS for allparameters may be discharged to a constructed infiltration basin.
(3) Evaporation within the lined sump. Fluids documented to contain lead atconcentrations < 5 mg/L and radiological parameters > 10 x NDWS, will be allowedto evaporate in lined sumps. Any associated solids (cuttings) will be transported to

FMP for ShoalSection: 5.0Revision: 0Date: 04/30/99Page 14 of 20
an appropriate disposal facility, upon characterization. If the level of radioactiveconstituents is great enough that air quality or employee health and safety limits couldbe exceeded, operations will be suspended and the waste managed as low-levelradioactive waste in accordance with applicable DOE Orders and state and federalregulations.
(4) Transportation to the NTS or a treatment, storage, or disposal facility. Fluidsdocumented to contain lead at concentrations > 5 mg/L would result in thesuspension of operations and would be managed as hazardous (or mixed) waste inaccordance with State of Nevada hazardous waste regulations and DOE Orders. TheNDEP will be immediately notified if fluids are documented to be hazardous or mixedwaste. The fluids will be pumped from the lined sumps and transported to anappropriate storage area on the NTS. Alternatively, hazardous waste may betransported directly to a permitted commercial treatment, storage, or disposal facility.
Figure 5-1 illustrates the general decision-flow process for the management of fluids under this
FMP.

FMP for ShoalSection: 5.0Revision: 0Date: 04/30/99Page 15 of 20
B eginO perations
F lu ids D ischarged to
L ined Sum p
FluidD isposition
Drillingand W ell
DevelopmentAqu iferTesting Tracer
Test
O n-S ite T ritium M onitoring
Collect Sum pSample
O ff-S ite Analyses
T ritium<10 x N DW S
?
G ross A lpha and B eta
<10 x N DW S?
Lead<10 x NDW S
?
Tritium< NESHAPa
& DOE/NV H ealth & Safety
Requ irements?
ContinueO perations
Lead<5 m g/L ?
Suspend O perations
Flu id D isposition
Transport toNTS for D isposa l
Transport to O ff-S iteTSDF b
D ischarge toInfiltration
Basin
If >200,000pC i/L ,m onito r every hour
M onitor every 2 hours
M on itor every 4 hours
If >200,000pC i/L,m onito r every hour
If >200,000pC i/L,suspend operations
M onitor once a week
Suspend Opera tions
Yes Yes
No N o No
No
Yes Yes
No
R etain inLined Sum p;A llow Flu idsto Evaporate
Yes
aNation al E missions Sta ndards for Ha zardous A ir P ollu tan tsbTreatm en t, S tora ge, an d D isp osal Facility
Figure 5-1Decision Diagram for Fluid Management

FMP for ShoalSection: 6.0Revision: 0Date: 04/30/99Page 16 of 20
6.0 Fluid Management for Routine Monitoring
Monitoring activities are defined as those routine, scheduled, periodic activities associated with
collection of groundwater monitoring samples. Groundwater monitoring samples may be
collected from the PSA well locations on a periodic basis. Fluid generated from the activities
associated with groundwater sampling (such as from purging the well) will be contained in a lined
sump unless process knowledge is sufficient to allow for direct routing to an infiltration basin or
the ground surface. If fluids are routed to the sump, after the groundwater sampling event has
ceased (i.e., no more fluid will be generated by that sampling event), a composite sump sample
will be collected and analyzed for the parameters listed in Table 4-1. Analytical results shall be
reported to the NDEP in accordance with Section 7.0 of this FMP.

FMP for ShoalSection: 7.0Revision: 0Date: 04/30/99Page 17 of 20
7.0 Reporting Criteria
The reporting criteria proposed for meeting the requirements of this FMP consist of the following:
1. Release ReportingSpills, leaks, and releases shall be reported in accordance with State of Nevadaregulations. All fluids in excess of ten times the NDWS limits, as provided in Section 4.0of this plan, that are conveyed to the infiltration area or beyond the confines of theconstructed fluid management devices, in excess of 1 m3 (264.2 gal), shall be reported tothe NDEP by telephone (702-486-2866) prior to the end of the next business dayfollowing verification of the incident. Oral notification shall be followed by a writtenreport which includes elements described in spill reporting regulations within ten calendardays.
2. Hazardous or Mixed Waste GenerationThe NDEP will be notified immediately if laboratory results indicate that mixed orhazardous waste has been generated within any of the lined sumps. Nonemergencyactions that constitute deviations to this FMP will be reported to the NDEP prior toimplementation of the action. Emergency actions which are taken that constitutedeviations to this FMP will be reported orally to NDEP within 24 hours of implementationof the action and a written report will be provided to NDEP within 10 working days of theaction.
3. Well-Site Activity Reporting (Morning Reports)The synopsis of well-site activities occurring within a 24-hour period (i.e., the morningreport) shall be faxed to the NDEP each day during well drilling and completion activities. In addition, on-site tritium monitoring results will be transmitted to the DOE/NV andNDEP on a daily basis, via the morning report during drilling operations and the aquifertests. Tritium results from the tracer experiment will be transmitted to the DOE/NV andNDEP on a weekly basis.
4. Well Completion ReportThe well completion report may be sent to the NDEP as part of the CADD, in accordancewith milestones established in the FFACO. The fluid management analytical results fromboth on-site monitoring and off-site laboratory work, will also be incorporated into theCADD.
5. Routine Monitoring ReportA report will be sent to the NDEP within nine months of collection of sump samplescollected during routine well monitoring activities (see Section 6.0). The report willcontain the date of sampling and a synopsis of laboratory analytical data.

FMP for ShoalSection: 7.0Revision: 0Date: 04/30/99Page 18 of 20
6. Discharge ConcurrenceThe NDEP will be notified in writing, prior to the discharge of fluids from a lined sump tothe infiltration area. All relevant analytical data shall be included with such notification. The NDEP must concur in writing, with the proposed discharge of fluids within ten-calendar days of receipt of the notification letter.
All correspondence to the NDEP Regulator shall be addressed to:
Bureau ChiefNevada Division of Environmental ProtectionBureau of Federal Facilities333 West Nye LaneCarson, City, NV 89706-0866
with copies forwarded to the Las Vegas Office Bureau of Federal Facilities (BoFF) Supervisor:
BoFF SupervisorBureau of Federal Facilities555 East Washington Avenue, Suite 4300Las Vegas, NV 89101-1049
All field and laboratory data generated in support of PSA well construction activities will be
archived and made available for inspection by the NDEP Regulator. Copies of interim fluid status
reports will be maintained at the well site for on-site field inspection. The following data will be
generated and retained on file. This data may be made available to the NDEP for inspection upon
request:
• Legible copies of daily drilling progress reports and records of daily well-site activities
• Volumetric measurements of fluids generated during each stage of well construction
• Records of make-up water delivery and usage during each stage of well construction
• On-site effluent monitoring data
• Laboratory analytical data with supplemental quality assurance/quality control and chainof custody records
• Records of process materials (cement, grout, casing, screens, packing, drilling fluids) anddrilling additive usage, and equipment decontamination

FMP for ShoalSection: 7.0Revision: 0Date: 04/30/99Page 19 of 20
• Records of geological, geotechnical, and hydrological evaluations
• Photographs illustrating site operations, methods, procedures, and progress (as required).

FMP for ShoalSection: 8.0Revision: 0Date: 04/30/99Page 20 of 20
8.0 References
AEC, see U.S. Atomic Energy Commission.
BN, see Bechtel Nevada.
Bechtel Nevada. 1999. Bechtel Analytical Services Laboratory Procedure Manual. Las Vegas, NV.
DOE/NV, see U.S. Department of Energy, Nevada Operations Office.
Federal Facility Agreement and Consent Order. 1996. Agreed to by the State of Nevada, theU.S. Department of Energy, and the U.S. Department of Defense.
Pohll, G., J. Chapman, A. Hassan, C. Papelis, R. Andricevic, and C. Shirley. 1998. Evaluation ofGroundwater Flow and Transport at the Shoal Underground Nuclear Test: An InterimReport, Water Resources Center Publication 45162, DOE/NV/11508-35. Las Vegas, NV: Desert Research Institute.
U.S. Department of Energy, Nevada Operations Office. 1998. Data Report, Project Shoal Area,Churchill County, Nevada, DOE/NV--505. Las Vegas, NV.
U.S. Department of Energy, Nevada Operations Office. 1999. Addendum to the CorrectiveAction Investigation Plan for Corrective Action Unit 447: Project Shoal Area, NevadaSubsurface Site, Rev. 1, DOE/NV-513-ADD. Las Vegas, NV.
U.S. Environmental Protection Agency. 1996. Test Methods for Evaluating Solid Waste,3rd Edition, SW-846. Washington, DC.
Appendix A
Tracer Test Capture Zone Analysis
(Well Head Protection)
FMP for ShoalSection: Appendix ARevision: 0Date: 04/30/99Page A-1 of A-7
A.1.0 Introduction
An analysis of the potential fluid pathways induced by the proposed tracer test at the PSA was
performed to determine the risk of radionuclide transport from the PSA test to the downgradient
pumping well. The semi-analytic model RESSQC (Blandford and Huyakorn, 1991) was used to
determine the time-dependent capture zone for the proposed tracer test. The input parameters
required by RESSQC are not known with full certainty, so the analysis was performed within a
Monte Carlo framework to assess the uncertainty in the predicted capture zones.
Methodology
The proposed tracer test will consist of continuous injection at HC-6 at approximately 0.27 cubic
meters per day (m3/day) (0.3 gallons per minute [gpm]) while pumping 2.7 m3/day (3 gpm) at
HC-8. These wells will be installed approximately 15 m (49 ft) into the water table. The entire
test should be completed within 120 days. The distance from the PSA test to the pumping well is
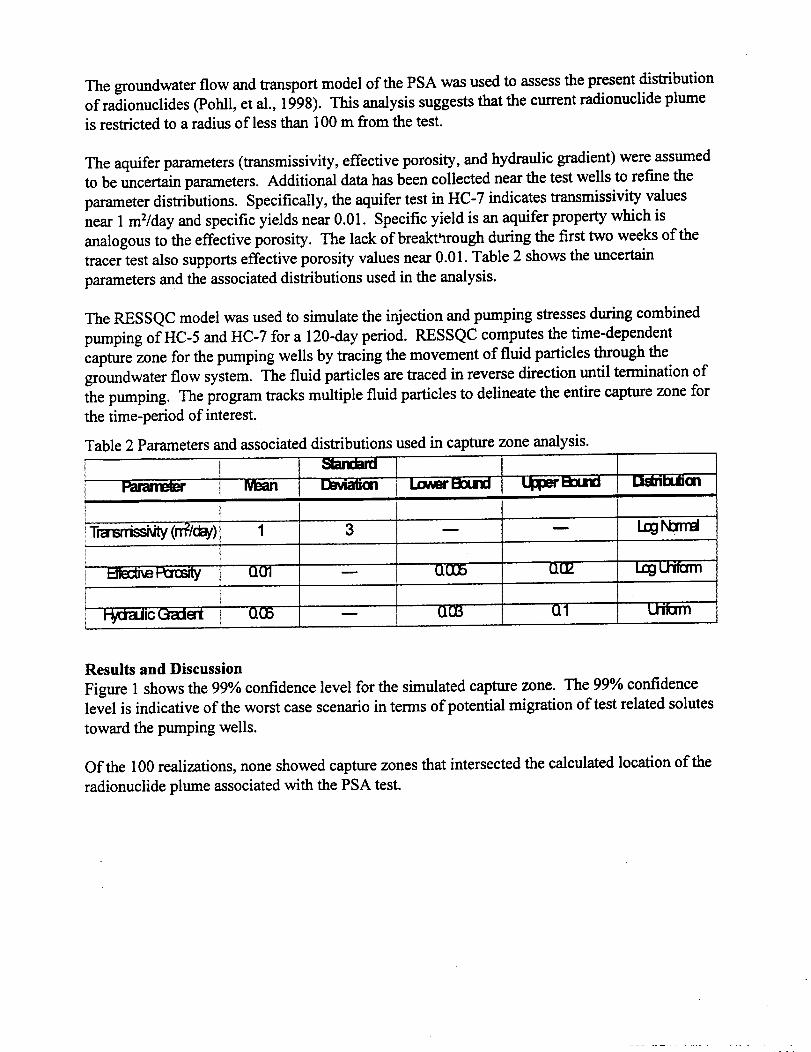
580 meters (m) (1,902 ft). The groundwater flow and transport model of the PSA was used to
assess the present distribution of radionuclides (Pohll et al., 1998). This analysis suggests that the
current radionuclide plume is restricted to a radius of less than 100 m (328 ft) from the test. This
analysis included an analysis of the uncertainty due to the spatial distribution of fractures and the
uncertainty in mean parameters such as effective porosity. Figure A.1-1 shows the location of the
proposed injection (HC-6), pumping (HC-8) and deep monitoring (HC-5) wells that are located
directly downgradient of the PSA test.
The RESSQC model was used to simulate the injection and pumping stresses during the 120-day
tracer test and the associated capture zone for pumping well HC-8. The RESSQC model
computes the time-dependent capture zone for the pumping well by tracing the movement of fluid
particles through the groundwater flow system. The fluid particles are traced in reverse direction
until termination of the pumping. The program tracks multiple fluid particles to delineate the
entire capture zone for the time-period of interest.
The assumptions used in developing the semianalytical solution are:
1. The aquifer is homogeneous, isotropic, and of constant saturated thickness.


FMP for ShoalSection: Appendix ARevision: 0Date: 04/30/99Page A-3 of A-7
Parameter Mean Log10 Standard Range DistributionDeviation Low High
Transmissivity (m2/day) 0.08 0.85 --- --- LogNormal
Effective Porosity (m3/m3) 0.002 --- 0.0005 0.01 Uniform - Log10
Regional Gradient (m/m) 0.07 --- 0.03 0.1 Uniform
2. The flow of ground water in the aquifer is two-dimensional in a horizontal plane andreaches steady-state after the pumping begins.
The fractured granite aquifer at the PSA is not homogeneous at the regional scale, but it is
assumed that at the scale of the tracer test, the flow system can be represented by an equivalent
homogeneous and isotropic porous media. The assumption that the pumping induced stress will
not induce vertical flow (i.e., only two-dimension flow is simulated) is conservative as vertical
flow would only serve to reduce the capture zone radius.
The groundwater flow and transport parameters for the proposed wells are not known, so data
from the PSA were used to identify ranges of expected values. Distributions of the required input
parameters were constructed for use in an uncertainty analysis. Three parameters were deemed
uncertain and included in the uncertainty analysis. These parameters include the effective
porosity, transmissivity, and the regional hydraulic gradient. The distribution of effective porosity
was assumed to be uniform in log10 space, similar to the methodology used in the data decision
analysis (Pohll, et al., 1999). The transmissivity distribution was derived from hydraulic
conductivity measurements obtained from stressed thermal flow measurements. The
transmissivity was assumed to be equal to the hydraulic conductivity multiplied by the screened
interval thickness of 15 m (49 ft). The uncertainty in the nearby HC-3 well led to uncertainty in
the hydraulic gradient. The distribution of the hydraulic gradient was assumed to be uniform and
bounded by the gradient as calculated from HC-2 to HC-4 and HC-1 to HC-3.
Table A.1-1 shows the distributions, mean, and standard deviations for the three uncertain
parameters.
Table A.1-1
Distributions of Uncertain Parameters Used in the RESSQC Simulations

FMP for ShoalSection: Appendix ARevision: 0Date: 04/30/99Page A-4 of A-7
The remaining parameters required to simulate the tracer test were assumed to be deterministic or
known with full certainty. These include the injection and pumping rates, aquifer thickness, and
the direction of the regional gradient. The injection and pumping rates used in the simulations are
0.27 m3/day (0.3 gpm) and 2.7 m3/day (3 gpm), respectively. These rates are the proposed
maximum rates as increased pumping would most likely cause drawdowns greater than the
available saturated thickness (15 m [49 ft]) of the proposed wells. The aquifer thickness is
assumed to be equal to the thickness of the proposed well screened interval of 15 m [49 ft]. The
direction of the hydraulic gradient is assumed to be parallel to the line connecting HC-6 and
HC-8.
The uncertainty in the model predictions was simulated within a Monte Carlo framework.
One-thousand realizations were performed to determine uncertainty in the model predictions. For
each realization a single value of effective porosity, transmissivity, and hydraulic gradient was
chosen from the described distribution. These values were used in the RESSQC model to
determine the capture zone for the proposed pumping well after 120 days of pumping. These
capture zones were ranked based on the distance from the outer edge of the capture zone to the
PSA test. These ranked capture zones were used to quantify the 50 and 95 percent confidence
intervals of expected risk of encountering radionuclides during the tracer experiment in the
pumping well. The capture zones associated with each confidence interval were plotted to
determine the spatial distribution of the capture zone relative to the PSA test.
Results and Discussion
Figure A.1-2 shows the 50 and 95 percent confidence levels for the simulated capture zones. The
capture zone associated with the 50 percent confidence level is associated with median values of
the transmissivity, effective porosity, and hydraulic gradient. The 95 percent confidence interval
capture zone is associated with small values of effective porosity, and large values of
transmissivity and the regional gradient. It should be noted that no correlation amongst input
parameters was specified which provides a conservative estimate of the risk associated with the
tracer test. It could be expected that a larger value of effective porosity would be encountered if
the transmissivity were truly larger than the expected value. If this were the case, then the outer
edge of the capture zone would be further away from the PSA test. Of the 1,000 realizations,
1.4 percent showed capture zones that intersected the calculated location of the radionuclide
plume associated with the PSA test. This suggests that there is a 1.4 percent probability that
radionuclides will be encountered in the pumping well during the tracer test. In these cases, the


FMP for ShoalSection: Appendix ARevision: 0Date: 04/30/99Page A-6 of A-7
capture zone intersected the outer edge of the current plume radius, which suggests that
contamination would occur during the final days of the tracer experiment.
Conclusions
A semianalytical model, RESSQC, was used to determine the risk of encountering radionuclides
in the pumping well associated with the 120-day tracer test. The results indicated that there is a
98.6 percent probability that no contamination will be encountered. Likewise, there is a
1.4 percent probability that contamination will be encountered during the final days of the tracer
experiment. The potential concentrations cannot be determined from this analysis because the
RESSQC model only simulates particle movement, not concentrations.

FMP for ShoalSection: Appendix ARevision: 0Date: 04/30/99Page A-7 of A-7
A.2.0 References
Blandford, T. N., and P. S. Huyakorn. 1991. WHPA 2.0 Code - A Modular Semi-AnalyticalModel for the Delineation of Wellhead Protection Areas. Washington, DC: U.S. EPA Officeof Ground-Water Protection.
Pohll, G., J. Chapman, A. Hassan, C. Papelis, R. Andricevic, and C. Shirley. 1998. Evaluation ofGroundwater Flow and Transport at the Shoal Underground Nuclear Test: An InterimReport, Water Resources Center Publication 45162. Las Vegas, NV: Desert ResearchInstitute.
Pohll, G. J., J. Tracy, and F. Forsgren. 1999. Data Decision Analysis: Project Shoal, WaterResources Center Publication 45166. Las Vegas, NV: Desert Research Institute.

FMP for ShoalDistribution ListRevision: 0Date: 04/30/99Page 1 of 2
Distribution List
Controlled Copies
Monica L. Sanchez 1Environmental Restoration DivisionDOE/Nevada Operations OfficeP.O. Box 98518, M/S 505Las Vegas, NV 89193-8518
Peter A. Sanders 1Environmental Restoration DivisionDOE/Nevada Operations OfficeP.O. Box 98518, M/S 505Las Vegas, NV 89193-8518
Sabrina D. Lawrence 1Environmental Restoration DivisionDOE/Nevada Operations OfficeP.O. Box 98518, M/S 505Las Vegas, NV 89193-8518
Paul J. Liebendorfer 1Department of Conservation and Natural ResourcesDivision of Environmental Protection333 W. Nye Lane, Room 138Carson City, NV 89706-0851
Michael D. McKinnon 1Department of Conservation and Natural ResourcesDivision of Environmental Protection555 East Washington Avenue, Suite 4300Las Vegas, NV 89101-1049
Jenny Chapman 2Desert Research InstituteP.O. Box 19040, M/S 433Las Vegas, NV 89132
Janine Ford 1Office of Public Affairs and InformationDOE/Nevada Operations OfficeP.O. Box 98518, M/S 505Las Vegas, NV 89193-8518
FMP for ShoalDistribution ListRevision: 0Date: 04/30/99Page 2 of 2
Controlled Copies
Paul Gretsky 1IT CorporationP.O. Box 93838, M/S 439Las Vegas, NV 89193-3838
Bryan A. Cherry 1IT CorporationP.O. Box 93838, M/S 439Las Vegas, NV 89193-3838
Patty Gallo 1IT CorporationP.O. Box 93838, M/S 439Las Vegas, NV 89193-3838
DOE/Nevada Operations Office 1Technical Information Resource CenterP.O. Box 98518Las Vegas, NV 89193-8518
DOE/Nevada Operations Office 1Public Reading FacilityP.O. Box 98521Las Vegas, NV 89193-8521
U.S. Department of Energy 1Office of Scientific and Technical InformationP.O. Box 62Oak Ridge, TN 37831-0062