for peaches and nectarines - agric.wa.gov.au
TRANSCRIPT

Market opportunities for peaches and nectarines
Department ofPrimary Industries andRegional Development
1055
/20

Market opportunities for peaches and
nectarines1 from Western Australia
Introduction
Peach and nectarine production extends from Manjimup to Gingin, with Perth Hills
being the major production region. Global demand for this group of fruits is
increasing as evidenced by the rise in imports during the past decade. Green field
developments with the possibility of production expansion and improved market
access protocols arising from free trade agreements place WA in a position to supply
this growing global market.
Export opportunities are analysed based on the current production season and the
capacity to supply during this season. Australian imports occur during the third
quarter2. It is uncertain to what extent the production season in WA could be
extended. According to experts in the field, production in September is a possibility;
however, production any earlier than this is highly improbable. On this basis, there is
likely to be limited opportunity to displace imported product with WA-grown produce.
Export market opportunities
Opportunities identified in this report are based on the analysis of current and
historical import trends in international markets. The analysis considers time trends
on import quantity, value, price, competitive tariffs for Australia, market concentration
of imports, comparative distance advantage, seasonal opportunities, extent of
competition and non-tariff market access barriers.
A snapshot summary of peach and nectarine trade is provided in the table below.
1 HS code 080930 2 The numbers are based on calendar year, not financial year. Hence, the four quarters are Jan-Mar, Apr-Jun, Jul-Sep and Oct-Dec.

Snapshot of peach and nectarine trade (2018)
Global import value $3.37 billion Global import quantity 1,957,655 tons Top five exporters Spain, Italy, Chile, US, Greece Top five importers Germany, France, Russia UK, Italy Share of top five exporters 66% Share of top five importers 43% WA’s production season Nov-Feb Share of Australia in global exports3 1.8% Position of Australia in global exports 12 2 year CAGR of global import value 4.3% 2 year CAGR of global import quantity -1.8% 2 year CAGR of global import unit value 3.9% 5 year CAGR of global import value 3.9% 5 year CAGR of global import quantity 1.0% 5 year CAGR of global import unit value 6.2%
Overview of selected markets Market with highest import value Germany Market with highest import price Japan Market with highest growth in import value (2 years) China Market with highest growth in import quantity (2 years) China Market with highest growth in import price (2 years) Indonesia Market with highest growth in import value (5 years) Indonesia Market with highest growth in import quantity (5years) Indonesia Market with highest growth in import price (5 years) Kuwait
3 Share increased to 2.3% and position is 9th in 2019.

Other features of export markets Global imports of peaches and nectarines are slowly increasing. A few countries are selected from the list of importers based on their import value and price. Some countries (such as Vietnam) are excluded due to lack of reliable information. Import growth shows a gradual shift from the traditional importing countries to new destinations. European countries are traditionally the major importers of peaches and nectarines. Germany is the largest importer followed by France. Import growth is either declining or stagnated in most of these traditional importers. Average prices of imports are not very promising, but there are specific premium segments - though not for large volume. Spain is the major supply competitor in these countries. Australian export of peaches and nectarines grew by 50% between 2017 and 2018 reaching $50m, led by Victoria. WA has just under 1% share in national exports. WA peaches are exported at slightly higher price than the national average, while WA nectarines are sold at a price of almost two thirds of that of the national average. China is the major destination for Australian product, while Singapore is the major importer of WA product. Detailed analysis of the importing markets indicate that Western Australia has a distance as well as tariff disadvantage in most of the European and American countries compared to competitors. Their usual heavy importing period is the third quarter, which is beyond the supply capability from current production locations in Western Australia. However, considering the large volume imported globally, it would be worth exploring the possibility of exporting from WA in the first quarter, specifically targeting the premium segment, if it is cost competitive. Asian and Middle East countries traditionally are not heavy importers of peaches and nectarines. Asian countries are not present among the top ten importers. However, imports are growing very fast in Asian countries and the prices of imports are promising in most cases. Countries such as China, Hong Kong and Taiwan are major Asian importers and Japan and Indonesia pay high price for imports. The major import season for China and Hong Kong is the first quarter, which coincides with the WA supply season. Moreover, Australia has distance and tariff advantage in some of the Asian countries compared to selected competitors. No major market access issues prevail in any major potential markets. Accessibility is unknown in some markets, and import protocols may yet need to be developed. More details on potential importing countries are given in Appendix – I.

Import replacement opportunities Australia imported approximately 2 300 tonnes of peaches and nectarines valued at $15m in 2017/18. Peaches and nectarines are the eighth biggest fruit import category to Australia. Globally, Australia is not a large importer of this category of fruits.
NSW is the major importing state, with about 65% share in import value and 56% share in imported quantity. Western Australia, Victoria and Queensland are the other importing states. Imports occur mainly from June to August.
Details on import analysis
Australian imports of peaches and nectarines are declining, even though this is the
eighth largest fruit import category.
Trends suggest a decline in both value and quantity in all states, prices increased in
New South Wales and Western Australia. Even with a 38% decline in quantity, price
increased by just five percent, leaving a 34% decline in value.
Most of the imports are from June to August, with almost one third of the imports
during June. Imports start in May and end in September. Hence extending the
production season to replace import may be further investigated.
South Australia, Tasmania and Northern Territory are not importing peaches and
nectarines from overseas based on the current trade information. Imports by other
states could be supplied to these states, or there is no out of season consumption in
these states.
More details on the imports by Australia and by different states are given in
Appendix–II.
Replacement of supply from the Eastern states
Very few peaches and nectarines are supplied to WA from the East through Market
City, and did not trigger the threshold criteria for this analysis (minimum $1m worth of
trade). Information on supply direct to supermarkets from the Eastern states was not
available. Data from Perth’s wholesale market reveals that early season product
from Carnarvon received a higher price - in line with that of Eastern state products.
Agents at the wholesale market confirmed this.

Conclusions
Analysis of current domestic and export markets helped in approximating the
potential demand opportunities for peaches and nectarines in both of these markets.
The domestic market may not have the capacity to absorb a large amount of fruit
even if it is an off-season supply. Current import levels are just around $10-$15
million and declining, in terms of both quantity and value. WA would need an
additional production of around 2 000 tonnes from May to September (June to
August is the heavy import period) to replace the imports completely. Extending the
season to produce high quality fruits from May to August is unlikely.
To the contrary, the trends in international import markets are promising in both
quantity and value. Even though there are individual variations, European markets
are the major consuming regions of peaches and nectarines. Consumption growth is
declining in that region, while it is increasing in South East Asia. Improved market
access and reduced tariffs may help in accessing those emerging markets.
Expanding the market to China, which is the biggest destination for the Australian
industry at 43% of the exports, might help WA industry. The attraction of the China,
despite being a protocol market is that it is an expanding premium market.

APPENDIX-I
Export market opportunities- details
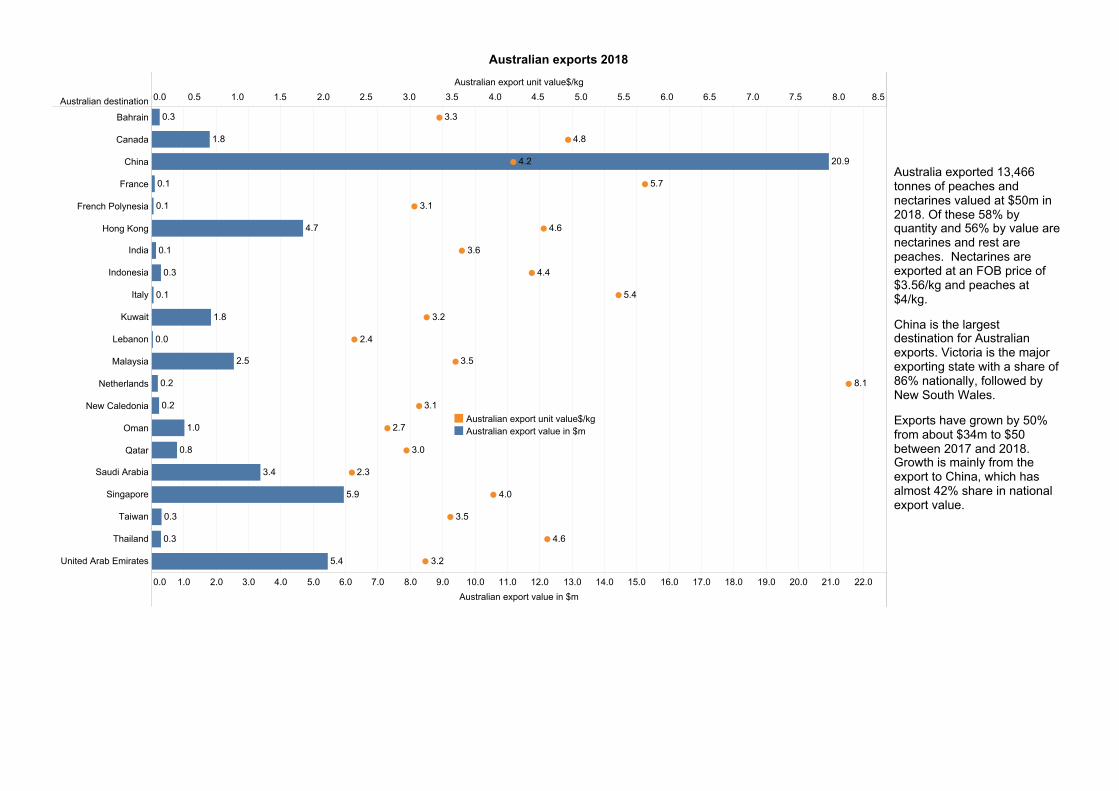
Australian exports 2018
Australian destination0.0 0.5 1.0 1.5 2.0 2.5 3.0 3.5 4.0 4.5 5.0 5.5 6.0 6.5 7.0 7.5 8.0 8.5
Australian export unit value$/kg
0.0 1.0 2.0 3.0 4.0 5.0 6.0 7.0 8.0 9.0 10.0 11.0 12.0 13.0 14.0 15.0 16.0 17.0 18.0 19.0 20.0 21.0 22.0
Australian export value in $m
Bahrain
Canada
China
France
French Polynesia
Hong Kong
India
Indonesia
Italy
Kuwait
Lebanon
Malaysia
Netherlands
New Caledonia
Oman
Qatar
Saudi Arabia
Singapore
Taiwan
Thailand
United Arab Emirates
20.9
0.3
1.8
0.1
0.1
4.7
0.1
0.3
0.1
1.8
0.0
2.5
0.2
0.2
1.0
0.8
3.4
5.9
0.3
0.3
5.4
3.3
4.8
4.2
5.7
3.1
4.6
3.6
4.4
5.4
3.2
2.4
3.5
8.1
3.1
2.7
3.0
2.3
4.0
3.5
4.6
3.2
Australia exported 13,466tonnes of peaches andnectarines valued at $50m in2018. Of these 58% byquantity and 56% by value arenectarines and rest arepeaches. Nectarines areexported at an FOB price of$3.56/kg and peaches at$4/kg.
China is the largestdestination for Australianexports. Victoria is the majorexporting state with a share of86% nationally, followed byNew South Wales.
Exports have grown by 50%from about $34m to $50between 2017 and 2018.Growth is mainly from theexport to China, which hasalmost 42% share in nationalexport value.
Australian export unit value$/kgAustralian export value in $m

WA exports 2018
WA destination0.0 0.2 0.4 0.6 0.8 1.0 1.2 1.4 1.6 1.8 2.0 2.2 2.4 2.6 2.8 3.0 3.2 3.4 3.6 3.8 4.0
WA export unit value$/kg
0.0 0.1 0.2
WA export value in $m
Brunei Darussalam
Hong Kong
Indonesia
Malaysia
Oman
Saudi Arabia
Singapore
United Arab Emirates
0.3
0.0
0.0
0.0
0.0
0.0
0.0
0.0
3.3
2.8
3.7
3.9
3.2
2.8
3.5
2.6
WA exported 123 tonnes of peaches and nectarines at a value of $0.4m in 2018, forming just under 1% of the exports nationally. Of these, 39% by value and 52% by quantity arenectarines and the rest are peaches. Nectarines are exported at an FOB price of $2.42/kg and peaches at $4.15/kg. Prices of nectarines are 32% lower than the Australian average,while that of peaches are 4% higher than the national average.
Singapore is the major export destination wth a share of 64%. UAE, the major destination for WA strawberries, is the second major destination for peaches and nectarines. WA does nothave a presence in China which is the largest export destination nationally.
WA export unit value$/kgWA export value in $m

Global exports 2018
Exporting countries
Spain
Italy
Chile
United States
of America
Greece
China
Turkey
Jordan
France
Uzbekistan
Netherlands
Australia
South Africa
Hong Kong,
China
Germany
Serbia
Lithuania
Japan
Portugal
Egypt
0
100
200
300
400
500
600
700
800
900
1000
1100
1200
1300
Value ($m) of exports of top 20 countries
0
1
2
3
4
5
6
7
8
9
10
11
12
13
Unit value of export ($/kg)
1,250
257
184 180131 121 117
71 66 58 56 53 51 45 38 35 27 21 21 20
1.42
1.91
2.55
12.41
1.69 1.641.91
0.82 0.92
2.57
0.90
2.28
3.82
2.762.35
1.991.48
0.67
1.951.57
Top 20 exporters
Spain is the largest exporter of peaches and nectarines. Japan has the highest export price among the top twenty exporters, which is more than triple the average price received byAustralia. Australia ranks 12th in export value and receives the second highest price after Japan.
20 1,250

Global imports 2018
Importing countries
Germany France Russia UK Italy Poland USA Netherlan..Canada Belarus Belgium HongKong
China Switzerla..Portugal Mexico Taiwan Austria Romania Lithuania0
50
100
150
200
250
300
350
400
450
500
550
Import value ($m)
0.00
0.50
1.00
1.50
2.00
2.50
3.00
3.50
4.00
Unit value of import ($/kg)
532.7
290.9278.0
181.0 176.6
148.0130.3
113.9101.7
88.4 88.0 83.5 78.2 72.2 72.0 63.8 61.4 53.5 50.8 47.4
1.951.85
1.26
2.28
1.53 1.49
3.44
2.04
2.76
1.51
2.14
3.41
3.61
2.53
1.07
2.06
4.14
2.01
1.14
0.95
Top twenty importers
Germany is the largest importer of peaches and nectarines by value. Highest price is paid by Taiwan among the top twenty importers. Australia has a trade surplus as our exports aremore than imports.

Import trends of selected countriesImporters
0 100 200 300 400 500 600
Imported value AUDm
0K 50K 100K 150K 200K 250K 300K
Imported quantity (t)
0 1 2 3 4 5 6 7
Unit value AUD/kg
Australia
Canada
China
France
Germany
Hong Kong
Indonesia
Japan
Kuwait
Malaysia
Mauritius
New Zealand
Singapore
Switzerland
Taiwan
Thailand
UAE
UK
USA
101.7
290.9
532.7
181.0
130.3
13.0
78.2
83.5
12.8
15.1
72.2
61.4
26.3
1.3
2.0
5.7
1.2
1.7
1.1
157,112
272,640
36,791
21,672
24,499
28,504
14,842
11,408
79,236
37,915
2,204
3,898
1,607
3,349
202
282
444
587
276
5.9
2.8
3.6
1.9
2.0
3.4
6.6
7.2
3.3
3.5
2.7
2.9
4.5
2.5
4.1
4.1
2.3
2.3
3.4
A few countries are selected from the list of importers based on their import value and price. Countries listed above import more than $1m worth of peaches and nectarines. Somecountries (such as Viet Nam) are excluded due to lack of reliable information.
Apart from Japan and Australia; Indonesia, Singapore, Taiwan and Thailand are premium importers. Germany and France are the major importing countries. Among South east Asiancountries, quantity of imports are high in Hong Kong, China and Taiwan.

Import trends of selected countries (contd..)Importers
0% 500%
CAGR value 2 years
0% 100% 200%
CAGR value 5 years
0% 500%
CAGR quantity 2 years
-50% 0% 50% 100% 150%
CAGR quantity 5 years
-10% 0% 10% 20% 30% 40%
CAGR price 2 years
-50% 0% 50% 100%
CAGR price 5 years
Australia
Canada
China
France
Germany
Hong Kong
Indonesia
Japan
Kuwait
Malaysia
Mauritius
New Zealand
Singapore
Switzerland
Taiwan
Thailand
UAE
UK
USA
World
546.4%
-21.2%
30.1%
75.6%
64.3%
21.3%
20.2%
13.5%
-3.1%
-0.6%
-2.0%
-0.9%
-3.8%
-9.9%
-1.4%
-5.9%
5.0%
7.9%
4.3%
166.3%
21.6%
15.0%
48.6%
12.7%
13.6%
33.3%
13.6%
-1.8%
2.3%
2.9%
2.4%
8.5%
0.7%
4.2%
2.4%
3.9%
607.5%
-38.3%
-13.3%
-26.0%
-14.2%
-10.1%
-10.4%
36.0%
17.2%
57.3%
23.1%
-8.6%
-4.1%
-3.2%
-1.5%
-4.6%
-1.8%
9.0%
5.8%
102.0%
-11.7%
13.9%
20.5%
10.3%
29.1%
-5.3%
-1.3%
-2.4%
-7.2%
-3.4%
-2.0%
1.1%
7.2%
9.5%
0.5%
1.0%
13.2%
31.8%
30.3%
23.3%
12.3%
13.1%
-1.6%
8.0%
1.8%
2.4%
6.7%
5.1%
3.7%
3.1%
3.3%
1.7%
4.5%
3.9%
21.5%
49.8%
96.6%
11.0%
-8.6%
-4.4%
-2.4%
6.0%
3.7%
8.4%
4.5%
4.2%
4.4%
2.0%
3.9%
6.5%
5.0%
9.7%
5.0%
6.2%
China is a fast growing import market. Import price is growing in Indonesia and Kuwait. However quantity of imports declined in Kuwait. Value growth in the short term is more in Asiancountries (except Taiwan and Thailand) while it is either declining or stagnant in European countries and America.

Global positionImporters Top 5 importers
0.00% 4.00% 8.00% 12.00% 16.00%
Share in world import (%)
0 10 20 30 40 50 60 70 80
Rank
Germany Spain (74%), Italy (201%), Chile (2%), France (2%), Greece (1%)
France Spain (88%), Germany (4%), Morocco (3.5%), Italy (2%), France (0.9%)
UK Spain (57%), South Africa (19%), Germany (9%), Italy (6%), Chile (4%)
USA Chile (99.8%)
Canada US (77%), Chile (17%), Spain (2.7%), Australia (2.4%), Argentina(0.2%)
Hong Kong Chile (49%), Japan (26%), Australia (16%), USA (4%), China (4%)
China Chile (69%), Australia (30%, Spain (1.3%)
Switzerland Spain (66%), Italy (22%), France (9%), Chile (2%), Morocco (1%)
Taiwan US(78%), Chile (15%), Japan (6%), Australia (.4%), New Zealand (.2%)
UAE South Africa (28%), Australia (25%), Tunisia (16%), Spain (9%), Jordan (5%)
Kuwait Lebanon (54%), Australia (17%), Jordan (11%), South Africa (8%), US(3%)
Singapore Australia(42%), USA (21%), Spain (12%), China (10%), Japan (7%)
Malaysia Australia (57%), Spain (12%), US (9%), Korea (5%), Japan (5%)
Japan US (100%)
New Zealand US(100%)
Indonesia Australia (36%), US (33%), China (17%), Korea (8%), Japan (4%)
Mauritius South Africa (69%), Spain (30%), Turkey (1%)
Thailand Japan (51%), Australia (25%), US (12%), China (10%), Korea (2%)
15.80%
8.60%
5.40%
3.90%
3.00%
2.50%
2.30%
2.10%
1.80%
0.80%
0.40%
0.40%
0.20%
0.10%
0.10%
0.00%
1
2
4
7
9
12
13
14
17
28
40
37
50
69
71
72
73
77
No Asian or Middle east countries are within the top ten importers. China and Hong Kong have a combined share of almost 5% in world imports.

CompetitionImporters Suppliers during 1st qtr Suppliers during 2nd quarter Suppliers during 3rd quarter Suppliers during 4th quarter
Canada Chile (93%), Australia (5%) USA (98%) USA (95%), Spain (5%)
China Chile (76%), Australia (23%), Spain (2%) Chile (93%), Australia (7%) Australia (99%)
France Spain (42%), South Africa (25%), Chile (11%).Netherlands (10%) Spain (85%), Morocco (7%), Germany (5%) Spain (92%), Italy (3%), Germany (3%) Spain (81%), South Africa (4%), Italy (4%), France (3%)
Germany Chile (55%), South Africa (23%), Netherlands(13%), Italy (7%), Spain (2%) Spain (83%), Italy (11%), Chile (2%) Spain (72%), Italy (25%) Spain (81%), Italy (15%)
HongKong Chile (75%), Australia (21%) Japan (36%), Chile (32%), Australia (10%), China (6%),
Spain (5%) Japan (74%), US (11%), South Korea (7%) Australia (66%), Japan (16%), US (4%), South Korea(4%)
Indonesia Australia (100%) US (44%), China (43%), Australia (9%) US (58%), South Korea (22%), Japan (12%) Australia (72%), China (17%), South Korea (4%), US (4%)
Japan . US (100%) US (100%)
Kuwait Australia (76%), South Africa (23%) Egypt (59%), Jordan (22%), US (4%), Tunisia (4%) Tunisia (61%), Jordan (18%), Lebanon (13%) Australia (55%), South Africa (18%), Jordan (13%),Lebanon (6%), Iran (4%)
Malaysia Australia (91%), South Africa (6%) Spain (39%), US (25%), Turkey (12%), Australia (7%) Spain (26%), US (23%), South Korea (20%), Japan (17%),China (10%) Australia (86%), China (5%), Chile (3%)
Mauritius South Africa (100%) South Africa (89%), Spain (7%) Spain (92%), Turkey (4%) South Africa (88%), Spain (11%)
NewZealand . US (100%) US (100%)
Singapore Australia (94%), New Zealand (5%) US (42%), Spain (26%), China (10%), Australia (9%) US (34%), Spain (20%), Japan (15%), China (15%), SouthKorea (19%) Australia (73%), China (16%), US (5%)
Switzerla..Chile (90%), Spain (3%), South Africa (3%),Australia (3%) Spain (80%), Italy (13%), France (4%) Spain (57%), Italy (29%), France (13%) Spain (63%), Italy (21%), Australia (10%), South Africa(5%)
Taiwan Chile (95%), Australia (3%) US (80%), Chile (17%), Japan (4%) US (93%), Japan (7%) US (100%)
Thailand Australia (100%) Japan (53%), USA (45%) Japan (74%), China (12%), US (11%) Australia (76%), China (18%), US (4%)
UK South Africa (65%), Chile (26%), Germany (4%),Netherlands (3%)
Spain (64%), germany (17%), Egypt (5%), South Africa(4%) Spain (74%), Germany (13%), Italy (11%) South Africa (50%), Spain (44%)
USA Chile (100%) Chile (64%), Mexico (21%), Canada (14%) Canada (100%) Chile (99%), Spain (1%)
Chile is the major competitor during WA supply period. South Africa is also a major supplier during this period.

Seasonal imports (1st and 2nd quarters)
Importers 0.0 0.5 1.0 1.5 2.0 2.5 3.0 3.5 4.0 4.5 5.0 5.5 6.0 6.5 7.0 7.5 8.0
Unit price during 1st quarter
0.0 0.5 1.0 1.5 2.0 2.5 3.0 3.5 4.0 4.5 5.0 5.5 6.0 6.5 7.0 7.5 8.0
Unit price during 2nd quarter
0 10 20 30 40 50 60 70 80 90 100 110 120 130 140 150 160 170
Import value during 1st quarter
0 10 20 30 40 50 60 70 80 90 100 110 120 130 140 150 160 170
Import value during 2nd quarter
Canada
China
France
Germany
Hong Kong
Indonesia
Japan
Kuwait
Malaysia
Mauritius
New Zealand
Singapore
Switzerland
Taiwan
Thailand
UAE
UK
USA
46.0
61.9
110.4
15.5
12.8
22.8
1.8
0.3
0.0
1.1
2.3
0.0
0.0
4.4
1.0
7.3
0.2
0.0
2.4
3.5
3.3
2.3
3.8
5.9
0.0
3.6
3.4
2.8
0.0
3.5
4.1
2.5
4.6
0.0
3.5
3.3
129.2
155.1
33.8
29.5
12.5
34.8
5.0
8.5
0.3
0.4
4.6
0.7
0.0
0.3
3.0
0.1
0.0
0.4
3.0
3.0
2.4
2.6
3.9
8.0
7.1
2.1
3.9
2.7
3.4
5.4
3.1
4.6
4.0
0.0
2.6
2.6
USA is the largest importer by value during WA supply period followed by china. Imports from USA become close to zero during second quarter.
Import value during 1st quarterImport value during 2nd quarterUnit price during 1st quarterUnit price during 2nd quarter

Seasonal imports (3rd and 4th quarters)
Importers 0.0 1.0 2.0 3.0 4.0 5.0 6.0 7.0 8.0 9.0
Unit price during 3rd quarter
0.0 5.0 10.0 15.0 20.0 25.0 30.0 35.0 40.0 45.0 50.0 55.0
Unit price during 4th quarter
0 50 100 150 200 250 300 350
Import value during 3rd quarter
0 50 100 150 200 250 300 350
Import value during 4th quarter
Canada
China
France
Germany
Hong Kong
Indonesia
Japan
Kuwait
Malaysia
Mauritius
New Zealand
Singapore
Switzerland
Taiwan
Thailand
UAE
UK
USA
78
154
340
44
24
41
43
0
0
2
7
1
0
1
5
1
0
0
1.9
2.4
0.0
1.6
1.8
8.9
7.9
7.3
1.5
4.3
2.4
2.8
5.5
2.2
4.8
4.0
0.0
0.5 14.4
36.0
8.5
30.5
8.3
8.2
3.3
0.2
0.0
1.5
1.2
0.0
0.2
2.5
0.3
1.3
0.1
0.0
1.0
2.9
5.9
1.7
4.9
4.4
0.0
2.1
2.9
3.1
0.0
4.0
2.9
3.9
5.3
0.0
3.0
3.7
UK and Canada import through out the season. UK's highest import is during the 4th quarter. Germany, which is the largest importer in the world, imports majority of the product duringthe third quarter.
Import value during 3rd quarterImport value during 4th quarterUnit price during 3rd quarterUnit price during 4th quarter

Percentage imports during different quartersImporters
0% 20% 40% 60% 80% 100%
% import during 1st quarter
0% 20% 40% 60% 80% 100%
% Import During 2nd Qtr
0% 20% 40% 60% 80% 100%
% Import During 3rd Qtr
0% 20% 40% 60% 80% 100%
% Import During 4th Qtr
Canada
China
France
Germany
Hong Kong
Indonesia
Japan
Kuwait
Malaysia
Mauritius
New Zealand
Singapore
Switzerland
Taiwan
Thailand
UK
USA
World
15.3%
82.4%
56.2%
22.0%
41.3%
27.8%
29.1%
11.4%
15.4%
13.3%
88.0%
11.1%
1.0%
2.4%
8.0%
1.4%
33.2%
44.0%
29.0%
10.4%
26.0%
18.0%
32.8%
12.5%
10.0%
22.0%
20.1%
41.0%
19.6%
11.1%
20.2%
29.9%
6.6%
0.3%
43.1%
53.0%
63.0%
29.4%
37.1%
82.0%
48.8%
25.3%
28.3%
78.0%
34.3%
57.1%
67.0%
61.4%
45.6%
52.2%
0.0%
0.0%
11.0%
14.9%
10.4%
21.0%
33.9%
16.6%
12.1%
20.9%
11.0%
8.4%
3.0%
6.0%
4.0%
0.4%
2.1%
6.8%
More than half of the total world imports are during the third quarter. Third quarter is the major import season of Germany, which is the largest importer in the world. Lowest import isduring the 4th quarter with a share of just under 7%.
Of the major Asian importers, China and Hong Kong import more than half during the first quarter which is WA's major exporting season. However, Taiwan imports mostly during thirdquarter.

Tariff details (2018)Importers Top 5 importers Tariff range Tariff for competitors
0% 2% 4% 6% 8% 10% 12% 14% 16% 18% 20% 22%
Tariff for Australia
Canada US (77%), Chile (17%), Spain (2.7%), Australia (2.4%), Argentina(0.2%) 0-3.8% 0%
China Chile (69%), Australia (30%, Spain (1.3%) 0-70% Chile 0%, Spain 10%
France Spain (88%), Germany (4%), Morocco (3.5%), Italy (2%), France (0.9%) 0-17.6% 0%
Germany Spain (74%), Italy (201%), Chile (2%), France (2%), Greece (1%) 0-17.6% 0%
Hong Kong Chile (49%), Japan (26%), Australia (16%), USA (4%), China (4%) 0% 0%
Indonesia Australia (36%), US (33%), China (17%), Korea (8%), Japan (4%) 0-5% US 5%, others 0%
Japan US (100%) 0-6% 6%
Kuwait Lebanon (54%), Australia (17%), Jordan (11%), South Africa (8%), US(3%) 0% 0%
Malaysia Australia (57%), Spain (12%), US (9%), Korea (5%), Japan (5%) 0-5% Spain, US - 5%, Korea and Japan (5%)
Mauritius South Africa (69%), Spain (30%), Turkey (1%) 0% 0%
New Zealand US(100%) 0% 0%
Singapore Australia(42%), USA (21%), Spain (12%), China (10%), Japan (7%) 0% 0%
Switzerland Spain (66%), Italy (22%), France (9%), Chile (2%), Morocco (1%) 1.90% 1.90%
Taiwan US(78%), Chile (15%), Japan (6%), Australia (.4%), New Zealand (.2%) 0-50% 20%
Thailand Japan (51%), Australia (25%), US (12%), China (10%), Korea (2%) 0-40% US 40%, others 0%
UAE South Africa (28%), Australia (25%), Tunisia (16%), Spain (9%), Jordan (5%) 0% 0%
UK Spain (57%), South Africa (19%), Germany (9%), Italy (6%), Chile (4%) 0-17.6% 0%
USA Chile (99.8%) 0% 0%
0.0%
0.0%
17.6%
17.6%
0.0%
0.0%
0.0%
0.0%
0.0%
0.0%
0.0%
0.0%
1.9%
20.0%
0.0%
0.0%
17.6%
0.0%
Australia has a tariff disadvantage in major European countries such as Germany, France and the UK. Compared to USA, there is a tariff advantage in some of the Asian countries.

Market concentration, distance advantage and market access
Importers
0.100.200.300.400.500.600.700.800.901.001.10Market concentration
-15K -10K -5K 0K 5K 10KDistance advantage
CanadaChinaFrance
GermanyHong KongIndonesiaJapanKuwaitMalaysiaMauritius
New ZealandSingaporeSwitzerlandTaiwanThailandUAEUKUSA
0.63
0.780.58
0.300.27
1.000.340.36
0.561.00
0.250.49
0.640.35
0.180.38
1.00
-12,762
-13,341-12,048
-12,707
-11,434
-5,886
-1,954
-8,812
7,974
5,0725,002
2,270
3,096
7,3294,407
6,247
-824
518
Market concentration and distance advantage
Herfindahl Index is a measure of market concentration. It ranges from 0 to 1. Value closer to 1 indicates less competition and increase in marketpower. Value closer to 0 indicates more number of competitors in the market. Concentration is high in the US, Japan and New Zealand becauseof a single supplier in the market.
Distance advantage is calculated by deducting the average distance of supplying countries to the destination market and distance of thedestination market from Perth.
Western Australia has a distance disadvantage in all of the European, American and Middle east countries.
Importers Status
Canada Available
China Available
France Unknown
Germany Available
Hong Kong Available
Indonesia Available
Japan Unknown
Kuwait Available
Malaysia Available
Mauritius Not known
New Zealand Unknown
Singapore Available
Switzerland Not Known
Taiwan Available
Thailand Available
UAE Available
UK Available
USA Unknown
Market access

APPENDIX-II
Import replacement opportunities - details

Monthly imports of peaches and nectarines to Australia
2015-16 2016-17 2017-18 Average
0
2
4
6
Value ($m)
5.1
6.3
2.9
0.1
0.0
0.0
3.5
5.0
3.2 3.4
1.8
0.3
3.8
3.5 4.1
1.6
0.0
0.1
0.9
4.9
3.9 4.6
2.1
0.1
0.0
0.0
0.1
0.0
1.6
4.6
Value
0
500
1000
Quantity (t) 823
534
4
449
1018
813
586
34
354
649
612
597
101
122
215
712
642
669
223
4122
339
793
689
Quantity
JUL
AUG
SEP
OCT
NOV
DEC
JAN
FEB
MAR
APR
MAY
JUN
JUL
AUG
SEP
OCT
NOV
DEC
JAN
FEB
MAR
APR
MAY
JUN
JUL
AUG
SEP
OCT
NOV
DEC
JAN
FEB
MAR
APR
MAY
JUN
JUL
AUG
SEP
OCT
NOV
DEC
JAN
FEB
MAR
APR
MAY
JUN
0K
5K
10K
Price ($/t)
613366527156
6537
6150
6249
65047752
5012
5247
5255
81988664
83489371
7420
5776
5502 69457690
715683489371
6323
5724
5669
Price

Peaches and nectarine imports to Australia through different states (2017/18)
WA$2.5m16.7%
VIC$2.1m14.0%
NSW$9.8m64.6%
QLD$0.7m4.6%
Value ($15m)
WA350t15.4%
VIC489t21.4%
NSW1,268t55.6%
QLD174t7.6%
Quantity (2280t)
Australia
NSW
QLD VIC WA
$0/t
$500/t
$1000/t
$1500/t
$2000/t
$2500/t
$3000/t
$3500/t
$4000/t
$4500/t
$5000/t
$5500/t
$6000/t
$6500/t
$7000/t
$7500/t
$8000/t
Price ($/t)
Australia$6632/t
QLD$4015/t
VIC$4343/t
WA$7230/t
NSW$7708/t
Price ($6632/t)
Comments
New South Wales is the largest importer ofpeaches and nectaines to Australia, with a shareof 65% by value of the national imports. NSW isfollowed by Western Australia in import value andby Victoria in import quantity.
Highest price of import is paid by New SouthWales at $7708/t which is 16% higher thanaverage import price of Australia. Lowest price ispaid by Queensland, which is 39% lower than theaverage Australian import price.

Monthly peaches and nectarine imports to Australia (2017/18) - source details
China New Zealand US
0
200
400
600
800
Quantity (t)
400 0 0 0 0 0 120 0 0 2 0 0
603
712
215
101
597
0 0
Quantity
China New Zealand US
0
2
4
Value ($m)
0.1
0.0
0.0
0.0
0.0
0.0
0.0
0.0
0.0
0.0
0.0
0.1
0.0
0.0
3.4
4.1
1.6
0.0
0.0
0.9
4.9
Value
China New Zealand US
Jul
Aug
Sep Oct
Nov
Dec Jan
Feb
Mar
Apr
May Jun
Jul
Aug
Sep Oct
Nov
Dec Jan
Feb
Mar
Apr
May Jun
Jul
Aug
Sep Oct
Nov
Dec Jan
Feb
Mar
Apr
May Jun
0K
5K
10K
Price ($/t)
2138
9371
8348
5723
5776
7420 8664
8198
Price
Comments
Australia imported about 2300t of peachesand nectarines valued at $15m at anaverage price of $6632/tonne in 2017-18
New South Wales is the biggest importerwith a share of more than half by bothquantity and value.
The US is almost the sole supplier (99%)with negligible imports from New Zealandand China.
Eighty three percent of the imports are fromJune to August. Import starts in May andfinishes by September.
Value and quantity of imports declined by34% and 38% resepectively during the pastthree years, with a price increase of 5%.
Trends show a declining pattern.

Monthly peaches and nectarine imports to NSW
0
100
200
300
400
500
Quantity (t)
434
316
4
222
397
329
269
21
418
327 352
56
122
152
354
341
351
131
4122
208
390
332
Quantity
2015-16 2016-17 2017-18 Average
0
1
2
3
Value ($m)
2.8
2.2
0.0
1.4
2.5
2.0
2.3
0.2
1.2
2.2
1.8
3.2
0.5
0.1
0.0
1.2
2.4
2.3
2.8
0.9
0.00.1
0.00.1
1.3
2.4
2.0
Value
2015-16 2016-17 2017-18 Average
JUL
AUG
SEP
OCT
NOV
DEC
JAN
FEB
MAR
APR
MAY
JUN
JUL
AUG
SEP
OCT
NOV
DEC
JAN
FEB
MAR
APR
MAY
JUN
JUL
AUG
SEP
OCT
NOV
DEC
JAN
FEB
MAR
APR
MAY
JUN
JUL
AUG
SEP
OCT
NOV
DEC
JAN
FEB
MAR
APR
MAY
JUN
0K
5K
10K
Price ($/t) 63766859
7156
7532
6087
6232
5925
8740
7981
47945282
5485
9022
9162
83489371
8107
6780
6868 8046
8001
715683489371
7532
6329
6098
6093
Price

Monthly peaches and nectarine imports to NSW (2017/18) - supplier's details
0
100
200
300
400
Quantity (t)
20 122
352
56
152
354
321
Quantity
China New Zealand USA
0
1
2
3
Value ($m)
0.1
3.2
0.5
1.2
2.4
2.3
ValueJUL
AUG
SEP
OCT
NOV
DEC
JAN
FEB
MAR
APR
MAY
JUN
JUL
AUG
SEP
OCT
NOV
DEC
JAN
FEB
MAR
APR
MAY
JUN
JUL
AUG
SEP
OCT
NOV
DEC
JAN
FEB
MAR
APR
MAY
JUN
0K
5K
10K
Price ($/t)
2,198
83489371
9022
9162
8107
6780
7157
Price
Comments
NSW imported about 1300 tonnes ofpeaches and nectarines worth about $10mat an average price of $7708/tonne in2017-18
Imports are mainly from June to August,with a share of 80%. Almost one third of theimports are during June.
US is the major supplier with 98% share inimpot value. Negligible imports from NewZealand and China.
Nominal value of imports declined by 10%and quantity by 26% during the past threeyears. Nominal price has increased by 22%during this period.

Monthly peaches and nectarine imports to Western Australia
0
50
100
150
200
Quantity (t) 142
80
178
204
125
13
96
117
82
31
106
82
116
41
127
134
Quantity
2015-16 2016-17 2017-18 Average
0.0
0.5
1.0
Value ($m) 1.0
0.50.7
1.11.3
0.8
0.1
0.3
0.60.7 0.8
0.30.3
0.70.5
0.9
0.3
0.80.8
ValueJUL
AUG
SEP
OCT
NOV
DEC
JAN
FEB
MAR
APR
MAY
JUN
JUL
AUG
SEP
OCT
NOV
DEC
JAN
FEB
MAR
APR
MAY
JUN
JUL
AUG
SEP
OCT
NOV
DEC
JAN
FEB
MAR
APR
MAY
JUN
JUL
AUG
SEP
OCT
NOV
DEC
JAN
FEB
MAR
APR
MAY
JUN
0K
5K
10K
Price ($/t) 6811
6799
6476
6445
6249
66717376
58726408
6253
9472
8394
6069
61746596 7651
7523
6139
6342
6366
Price
Comments
Western Australia imported about 350tonnes of peaches and nectarines worthmore than $2.5m at an average price of$7230/tonne in 2017-18.
The US is the sole source of imports.
June to August, where 80% of the fruits areimported, is the major import period. Almostone third of the import is in June.
Nominal value of imports have declined by45% and quantity by 50% during the pastthree years. Price increased by 11% duringthis period.

Monthly peaches and nectarine imports to Victoria
0
100
200
300
Quantity (t)
140
83
282
157
162
99100 118
6
166185
140
45
182
148
Quantity
2015-16 2016-17 2017-18 Average
0.0
0.5
1.0
1.5
Value ($m)
0.8
0.5
0.5
1.7
1.1
0.6
0.2
0.4
0.5 0.6
0.0
0.1
0.9
0.5 0.7
0.3
1.0
0.7
Value
2015-16 2016-17 2017-18 Average
JUL
AUG
SEP
OCT
NOV
DEC
JAN
FEB
MAR
APR
MAY
JUN
JUL
AUG
SEP
OCT
NOV
DEC
JAN
FEB
MAR
APR
MAY
JUN
JUL
AUG
SEP
OCT
NOV
DEC
JAN
FEB
MAR
APR
MAY
JUN
JUL
AUG
SEP
OCT
NOV
DEC
JAN
FEB
MAR
APR
MAY
JUN
0K
2K
4K
6K
8K
Price ($/t)
5827
6049
5978
7166
3402
5748
4518
4535 5,375
7,388
4,545
5,242
2,763
4764
61446448
5490
4729
Price
Comments
Victoria imported about 490 tonnesof peaches and nectarines worthmore than $2m at an average priceof $4343/tonne in 2017-18. Victoriais the second biggest importer byquantity.
The US is the sole source ofimports.
About 95% of the import is fromJune to August. Negligible importsin May and September.
Nominal value of imports havedeclined by 54% and quantity by33% during the past three years.Price also declined by 31% duringthis period.

Monthly peaches and nectarine imports to Queensland
0
50
100
150
Quantity (t)
107
55
161
122
3035
68
45
8
86
35
61
32
94
75
Quantity
2015-16 2016-17 2017-18 Average
0.0
0.5
1.0
Value ($m)
0.5
0.30.4
1.0
0.7
0.1
0.10.10.2 0.3
0.1
0.2
0.1
0.3
0.2
0.4
0.4
ValueJUL
AUG
SEP
OCT
NOV
DEC
JAN
FEB
MAR
APR
MAY
JUN
JUL
AUG
SEP
OCT
NOV
DEC
JAN
FEB
MAR
APR
MAY
JUN
JUL
AUG
SEP
OCT
NOV
DEC
JAN
FEB
MAR
APR
MAY
JUN
JUL
AUG
SEP
OCT
NOV
DEC
JAN
FEB
MAR
APR
MAY
JUN
0K
2K
4K
6K
8K
Price ($/t) 4644
6165
7705
59205941
2559
380037203495
68157225
2200
41554673
6695
5752
39474530
Price
Comments
Queensland is not a major importer ofpeaches and nectarines, importedabout 175 tonnes of peaches andnectarines worth only $0.7m at anaverage price of $4025/tonne in2017-18.
The US was almost the single source ofimports.
June, July and August are the majorimporting months with a share ofalmost 95%.
Nominal value of imports have declinedby 76% and nominal price by 32%during the past three years. Quantityhas declined by 65% during this period.The trend in import seems to bedeclining, as evidenced by a decline inquantity even with a decline in price.

Trends in the imports by different states (2015/16 to 2017/18)
-80.00%
-60.00%
-40.00%
-20.00%
0.00%
-34.22%
-76.14%
-54.30%
-44.72%
-9.83%
Value
-60.00%
-40.00%
-20.00%
0.00%
-37.56%
-26.09%
-65.08%
-33.46%
-50.25%
Quantity
Australia NSW QLD VIC WA
-20.00%
0.00%
20.00%
-31.66% -31.32%
21.99%
11.12%5.35%
Price
New South WalesHighest value and quantity importer, with 65% of the imports by value. However, both quantity and value of importcame down by 26% and 10% respectively, while the price increased by 22%.
Western AustraliaWA is the second biggest importer by value with a share of 17%. However value and quantity of imports declined by45% and 50% respectively, while the price increased by 11%.
VictoriaVictoria is the third biggest importer by value and second biggest by quantity. Value, quantity and price of importdeclined in Victoria.
QueenslandValue, quantity and price of imports declined in Queensland as well. Queensland expreienced the highest decline inimports.
JUL$3.5m23.4%
SEP$1.6m10.5%
JUN$4.9m32.3%
AUG$4.1m27.2%
MAY$0.9m5.8%
Monthly imports (2017/18)