for personal use only - asxfor the half-year to 31 december 2017, the company returned 12.10%...
TRANSCRIPT

Ellerston Asian Investments Limited
ACN 606 683 729
Level 11, 179 Elizabeth Street
SYDNEY NSW 2000
21 February 2018
Company Announcements Office ASX Limited Level 4, Exchange Centre 20 Bridge St SYDNEY NSW 2000
HALF-YEAR RESULTS Ellerston Asian Investments Limited (ASX: EAI) hereby lodges:
1. Appendix 4D Statement for the half year ended 31 December 2017; and
2. Interim Financial Report for the half year ended 31 December 2017.
Yours sincerely
Ian Kelly Company Secretary Phone: 02 9021 7731
For
per
sona
l use
onl
y

Appendix 4D Half Year Report
Contact Details Ellerston Asian Investment Limited ACN 606 683 729
Address Level 11, 179 Elizabeth Street Sydney 2000 NSW Australia
Website https://ellerstoncapital.com/ Email [email protected]
Investor Telephone 1300 551 627
Ellerston Asian
Investments Limited
ACN 606 683 729
1. Details of the reporting period.
Current Period: 1 July 2017 to 31 December 2017 Previous Corresponding Period: 1 July 2016 to 31 December 2016
2. Results for announcement to the market Current period
AUD ($) % Change from
the corresponding
period
2.1 Revenue from ordinary activities 14,235,697 232.30%
2.2 Profit/(loss) after tax from ordinary activities 9,726,456 404.92%
2.3 Net profit/(loss) after tax for the period attributable to ordinary shareholders
9,726,456 404.92%
Period EAI NTA Return
pre-tax* MSCI AC Asia Ex-Japan Index
(AUD) Return
6 Months 12.10% 11.90%
1 year 23.43% 28.42%
Since Inception (Sept 2015)
21.70% 32.61%
* Calculated based on compounded growth in monthly NTA, net of expenses, before tax and inclusive of the effects of the share buy-
back.
3. Dividend Information The Board aims to deliver a regular stream of fully franked dividends as the company matures. The Company has not declared any dividends to date due to the lack of available franking credits. Given the strong surge in profits during the period and current tax liabilities, the Company is currently on
track to deliver its first franked dividend for the year ended 30 June 2018.
For
per
sona
l use
onl
y

Appendix 4D Half Year Report
Contact Details Ellerston Asian Investment Limited ACN 606 683 729
Address Level 11, 179 Elizabeth Street Sydney 2000 NSW Australia
Website https://ellerstoncapital.com/ Email [email protected]
Investor Telephone 1300 551 627
Ellerston Asian
Investments Limited
ACN 606 683 729
4. Net tangible assets (NTA) per ordinary share
Current period AUD ($)
Previous corresponding period
AUD ($)
NTA before all taxes 1.1809 0.9573
NTA after realised tax (i) 1.1653 0.9573
NTA after tax 1.1363 0.9705
(i) Net Tangible Assets after realised tax includes tax paid and a provision for tax on realised gains from the Company’s Investment Portfolio. It excludes any tax on unrealised gains and deferred tax, which are represented in the Net Tangible Assets after tax line.
5. Control gained or lost over entities during the period N/A 6. Details of associates and joint venture entities
The Company did not have any interest in any associates or joint venture entities during both the current period and the previous corresponding period.
7. Accounting standards used by foreign entities
N/A – The Company is an Australian Entity.
8. Qualification of audit / review
The interim report for the period ended 31 December 2017 is not subject to audit dispute or qualification. Capital Management
On 13 September 2017, the Board resolved to implement an additional 10% on market buy-back over
12 months ending 26 September 2018. The share buy-back has been accretive to the NTA and there is remaining capacity of 8.1 million shares. The Board considers it a prudent capital management strategy.
F
or p
erso
nal u
se o
nly
Appendix 4D Half Year Report
Contact Details Ellerston Asian Investment Limited ACN 606 683 729
Address Level 11, 179 Elizabeth Street Sydney 2000 NSW Australia
Website https://ellerstoncapital.com/ Email [email protected]
Investor Telephone 1300 551 627
Ellerston Asian
Investments Limited
ACN 606 683 729
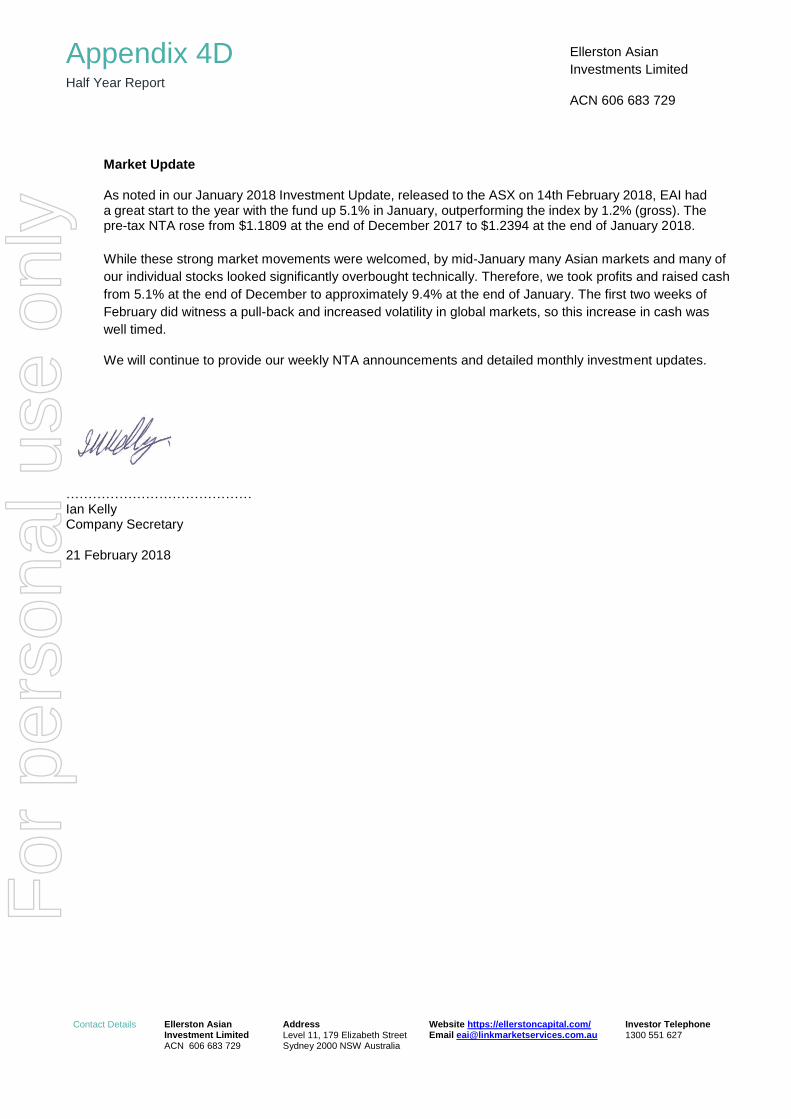
Market Update
As noted in our January 2018 Investment Update, released to the ASX on 14th February 2018, EAI had a great start to the year with the fund up 5.1% in January, outperforming the index by 1.2% (gross). The pre-tax NTA rose from $1.1809 at the end of December 2017 to $1.2394 at the end of January 2018.
While these strong market movements were welcomed, by mid-January many Asian markets and many of
our individual stocks looked significantly overbought technically. Therefore, we took profits and raised cash
from 5.1% at the end of December to approximately 9.4% at the end of January. The first two weeks of
February did witness a pull-back and increased volatility in global markets, so this increase in cash was
well timed.
We will continue to provide our weekly NTA announcements and detailed monthly investment updates.
…………………………………… Ian Kelly Company Secretary 21 February 2018
For
per
sona
l use
onl
y

Ellerston Asian Investments Limited
ASX: EAI ABN 82 606 683 729
For the half-year ended
31 December 2017
Interim ReportFor
per
sona
l use
onl
y

For
per
sona
l use
onl
y
CONTENTS
Directors’ report 2
Auditor’s independence declaration 7
Statement of comprehensive income 9
Statement of financial position 10
Statement of changes in equity 11
Statement of cash flows 12
Notes to the financial statements 14
Directors’ declaration 33
Independent auditors’ review report 34
Corporate directory 36
The interim financial report does not include all the notes of the type normally included in an annual financial report. Accordingly, the report is to be read in conjunction with the annual report for the period ended 30 June 2017 and any public announcements made by Ellerston Asian Investments Limited during the interim reporting period in accordance with the continuous disclosure requirements of the Corporations Act 2001.
For
per
sona
l use
onl
y

1.Directors’ Report
Ellerston Asian Investments Limited2
For
per
sona
l use
onl
y

Interim Report 2017 3
The directors of Ellerston Asian Investments Limited (the “Company”) present their report together with the financial statements of the Company for the half-year ended 31 December 2017.
Directors
The following persons were directors of the Company during the period and up to the date of this report:
NAME DIRECTORSHIP APPOINTED
Ashok Jacob Non-Independent Chairman 27 July 2015
Sam Brougham Independent Non-Executive Director
23 July 2015
Paul Dortkamp Independent Non-Executive Director
25 June 2015
Stuart Roberston Independent Non-Executive Director
25 June 2015
Company Secretary
The following person was Company Secretary during the period and up to the date of this report:
NAME APPOINTED
Ian Kelly 25 June 2015
Principal activities
The principal activity of the Company is to invest into a concentrated portfolio of between 20 to 50 Asian securities.
For
per
sona
l use
onl
y

Ellerston Asian Investments Limited4
Directors’ reportFor the half-year ended 31 December 2017
Review and results of operations
The operating results of the Company for the half-year ended on 31 December 2017 and 31 December 2016 are:
Half-year ended31 December
201731 December
2016$ $
Net profit before income tax 12,827,490 2,797,983
Net profit after income tax 9,726,456 1,926,333
As of31 December
201731 December
2016$ $
Net tangible assets per share (NTA) – before tax 1.1809 0.9573
Net tangible assets per share (NTA) – after realised tax (i) 1.1653 0.9573
Net tangible assets per share (NTA) – after tax 1.1363 0.9705
The Net Tangible Assets as at 31 December 2017 is based on fully paid ordinary shares of 105,596,405 (June 2017: 111,600,739).
(i) Net Tangible Assets after realised tax includes tax paid and a provision for tax on realised gains from the Company’s Investment Portfolio. It excludes any tax on unrealised gains and deferred tax, which are represented in the Net Tangible Assets after tax line.
For the 12 month period to 31 December 2017, the Company returned 23.43% on a pre-tax basis and 17.16% on a post-tax basis, while the return of its benchmark MSCI AC Ex-Japan Index (AUD) was 28.42%.
For the half-year to 31 December 2017, the Company returned 12.10% (December 2016: 2.71%) on a pre-tax basis and 9.37% (December 2016: 1.92%) on a post-tax basis, while the return of its benchmark MSCI AC Asia Ex-Japan (AUD) was 11.89% (December 2016: 5.01%).
For
per
sona
l use
onl
y

Interim Report 2017 5
Review and results of operations (continued)
On 18 September 2017, the Company announced a new on-market buy-back of up to 10% of its shares, commencing 27 September 2017 and continuing for twelve months. Since 27 September 2016 a total of 14,814,262 shares had been bought back. Please refer to Note 10 Issued Capital for further details.
Strategy and future outlook
The Company is predominantly invested in equities, with a focus upon the equities of Asian domiciled companies. The Company will continue to pursue its objective of generating superior returns for shareholders over time, with a focus on risk management and capital preservation.
Dividends
The Company has not declared any dividends for the half-year ended 31 December 2017.
Significant changes in the state of affairs
In the opinion of the directors, other than what is noted in the ‘Review and results of operations,’ there were no other significant changes in the state of affairs of the Company that occurred during the half-year ended 31 December 2017.
Matters subsequent to the end of the interim period
No matter or circumstance has arisen since 31 December 2017 that has significantly affected, or may significantly affect:
(i) the operations of the Company in future financial years, or
(ii) the results of those operations in future financial years, or
(iii) the state of affairs of the Company in future financial years.
For
per
sona
l use
onl
y

Ellerston Asian Investments Limited6
Directors’ reportFor the half-year ended 31 December 2017
Likely developments and expected results of operations
The Company provides quarterly updates and monthly NTA announcements, which can be found in the announcements section of the ASX website and in the Ellerston Asian Investments Limited section of the Ellerston Capital website, https://ellerstoncapital.com/listed-investment-companies/ellerston-asian-investments.”
As markets continue to be subject to fluctuations, it is neither possible to accurately forecast the investment returns of the Company nor to provide a detailed outlook on the Company’s future operations.
Rounding of amounts to the nearest dollar
The Company is an entity of a kind referred to in ASIC Corporations (Rounding in Financial/Directors’ Reports) Instrument 2016/191 issued by the Australian Securities and Investments Commission (ASIC) relating to the “rounding off” of amounts in the Directors’ report. Amounts in the Directors’ report have been rounded to the nearest dollar in accordance with that ASIC Corporations Instrument, unless otherwise indicated.
Auditor’s independence declaration
The auditor’s independence declaration as required under section 307C of the Corporations Act 2001 is included on page 7.
Signed in accordance with a resolution of the directors.
Ashok Jacob
Chairman
19 February 2018For
per
sona
l use
onl
y

Interim Report 2017 7
Auditor’s Independence Declaration
A member firm of Ernst & Young Global LimitedLiability limited by a scheme approved under Professional Standards Legislation
Ernst & Young200 George StreetSydney NSW 2000 AustraliaGPO Box 2646 Sydney NSW 2001
Tel: +61 2 9248 5555Fax: +61 2 9248 5959ey.com/au
Auditor’s Independence Declaration to the Directors of Ellerston AsianInvestments Limited
As lead auditor for the review of Ellerston Asian Investments Limited for the half-year ended31 December 2017, I declare to the best of my knowledge and belief, there have been:
a) no contraventions of the auditor independence requirements of the Corporations Act 2001 inrelation to the review; and
b) no contraventions of any applicable code of professional conduct in relation to the review.
Ernst & Young
Rohit KhannaPartner19 February 2018
For
per
sona
l use
onl
y

2.Financial Statements
Ellerston Asian Investments Limited8
For
per
sona
l use
onl
y

Interim Report 2017 9
Statement of comprehensive incomeFor the half-year ended 31 December 2017
Half-year ended31 December
201731 December
2016Notes $ $
Investment income
Interest income 51,471 287,603
Dividend income 2,054,338 665,458
Net foreign exchange gains 163,620 50,778
Change in fair value of financial instruments held at fair value through profit or loss 11,966,268 3,280,154
Total investment income 14,235,697 4,283,993
Expenses
Directors fees 45,375 45,375
Management and performance fees 13 521,765 504,113
Custody and administration fees 43,306 43,306
Audit and tax fees 27,417 27,418
Registry fees 25,625 25,625
Transaction costs 523,259 693,995
Withholding taxes 146,864 87,590
ASX fees 49,500 49,500
Other expenses 25,096 9,088
Total operating expenses 1,408,207 1,486,010
Net profit before income tax 12,827,490 2,797,983
Income tax expense (3,101,034) (871,650)
Net profit after income tax 9,726,456 1,926,333
Other comprehensive income/(loss) – –
Total comprehensive income 9,726,456 1,926,333
Basic earnings per share (cents per share) 11 9.01 1.61
Diluted earnings per share (cents per share) 11 9.01 1.61
The above statement of comprehensive income should be read in conjunction with the accompanying notes.
For
per
sona
l use
onl
y

Ellerston Asian Investments Limited10
Statement of financial positionAs at 31 December 2017
As at31 December
201730 June
2017Notes $ $
Current assets
Cash and cash equivalents 9 6,643,032 8,832,184
Receivables 75,333 423,889
Due from brokers 33,640 10,927,915
Financial assets held at fair value through profit or loss 6 118,226,705 97,798,896
Total current assets 124,978,710 117,982,884
Total assets 124,978,710 117,982,884
Current liabilities
Payables 138,926 149,088
Management and performance fees payable 13 106,531 80,782
Current tax liability 1,639,219 –
Financial liabilities held at fair value through profit or loss 7 39,197 123,046
Total current liabilities 1,923,873 352,916
Non-current liabilities
Deferred tax liability 3,061,539 1,599,725
Total non-current liabilities 3,061,539 1,599,725
Total liabilities 4,985,412 1,952,641
Net assets 119,993,298 116,030,243
Equity
Issued capital 10 104,464,894 110,228,295
Retained earnings 13,328,404 5,801,948
Dividend profit reserve 8 2,200,000 –
Total equity 119,993,298 116,030,243
The above statement of financial position should be read in conjunction with the accompanying notes.
For
per
sona
l use
onl
y

Interim Report 2017 11
Statement of changes in equityFor the half-year ended 31 December 2017
Issued capital
Retained earnings/
(losses)Dividend
profit reserve TotalNotes $ $ $ $
Balance as at 1 July 2017 110,228,295 5,801,948 – 116,030,243
Total comprehensive income for the period – 9,726,456 – 9,726,456
Shares bought back (6,174,067) – – (6,174,067)
Transfer to dividend profit reserve account – (2,200,000) 2,200,000 –
Shares issued from exercise of options 410,666 – – 410,666
Balance as at 31 December 2017 10 104,464,894 13,328,404 2,200,000 119,993,298
Balance as at 1 July 2016 117,560,983 (3,292,696) – 114,268,287
Total comprehensive income for the period – 1,926,333 – 1,926,333
Shares bought back (1,971,153) – – (1,971,153)
Balance as at 31 December 2016 10 115,589,830 (1,366,363) – 114,223,467
The above statement of changes in equity should be read in conjunction with the accompanying notes.
For
per
sona
l use
onl
y

Ellerston Asian Investments Limited12
Statement of cash flowsFor the half-year ended 31 December 2017
Half-year ended31 December
201731 December
2016Notes $ $
Cash flows from operating activities
Purchase of financial instruments held at fair value through profit or loss (79,469,112) (102,368,324)
Proceeds from sale of financial instruments held at fair value through profit or loss 75,779,286 99,049,386
Amounts transferred from brokers as collateral 7,413,809 6,309,630
Dividend income 1,080,554 805,135
Interest received 52,702 289,664
Other income received 6,631 –
Management and performance fees paid (496,016) (500,717)
Custody and administration fees paid (35,306) (53,932)
Payment of other expenses (758,314) (855,885)
Net cash inflow from operating activities 3,574,234 2,674,957
Cash flows from financing activities
Shares bought back (5,763,401) (1,971,153)
Net cash outflow from financing activities (5,763,401) (1,971,153)
Net (decrease)/increase in cash and cash equivalents (2,189,167) 703,804
Cash and cash equivalents at the beginning of the period 8,832,184 25,918,282
Effect of foreign currency exchange rate changes on cash and cash equivalents 15 3,674
Cash and cash equivalents at the end of the period 9 6,643,032 26,625,760
Non-cash financing activitiesReinvestment of shareholder dividends – –
The above statement of cash flows should be read in conjunction with the accompanying notes.
For
per
sona
l use
onl
y

Interim Report 2017 13
Contents of the notes to the financial statements
Page
1 General information 14
2 Summary of significant accounting policies 14
3 Dividends 17
4 Segment information 18
5 Fair value measurement 18
6 Financial assets held at fair value through profit or loss 23
7 Financial liabilities held at fair value through profit or loss 26
8 Dividend profit reserve 26
9 Cash and cash equivalents 27
10 Issued capital 27
11 Earnings per share 30
12 Net tangible assets per share 31
13 Management and performance fees 31
14 Contingent assets, liabilities and commitments 32
15 Events occurring after the reporting period 32
For
per
sona
l use
onl
y

Ellerston Asian Investments Limited14
Notes to the financial statementsFor the half-year ended 31 December 2017
1 General information
This interim report is for Ellerston Asian Investments Limited (the “Company”) for the half-year ended 31 December 2017.
The Company was incorporated and registered on 25 June 2015 and commenced trading on the Australian Stock Exchange (“ASX”) on 15 September 2015.
The Company is a for-profit entity limited by shares, incorporated and domiciled in Australia. Its shares (ASX code: EAI) and options (ASX code: EAIO) are publicly traded on the ASX.
The interim report was authorised for issue by the directors on 19 February 2018. The directors have the power to amend and reissue the interim report.
2 Summary of significant accounting policies
The principal accounting policies applied in the preparation of these financial statements are set out below. These policies have been consistently applied to the first full period presented, unless otherwise stated in the following text.
(a) Basis of preparation
This half-yearly interim report as at 31 December 2017 is a general purpose financial report and has been prepared in accordance with the Corporations Act 2001, AASB 134: Interim Financial Reporting and other applicable disclosure requirements. Compliance with AASB 134 ensures compliance with International Financial Reporting Standard IAS 34: Interim Financial Reporting.
The interim financial report has also been prepared on a historical cost basis, except for financial assets and financial liabilities held at fair value through profit or loss, that have been measured at fair value. This interim report is presented in Australian dollars, unless otherwise noted.
For
per
sona
l use
onl
y

Interim Report 2017 15
2 Summary of significant accounting policies (continued)
(a) Basis of preparation (continued)
This interim financial report does not include all the notes of the type normally included in an annual financial report. Accordingly, this interim report is to be read in conjunction with the Company’s annual report for the period ended 30 June 2017 and public announcements made in respect of the Company during the half-year ended 31 December 2017 in accordance with the continuous disclosure requirements of the Corporations Act 2001.
The Company is a for-profit entity for the purpose of preparing interim financial statements.
(b) Changes in accounting standards
The significant accounting policies adopted in the preparation of these interim financial statements are consistent with those applied in the preparation of the Company’s financial statements for the year ended 30 June 2017.
(c) Critical accounting estimates and judgements
Estimates and judgments are continually evaluated and are based on historical experience and other factors, including expectation of future events that may have a financial impact on the Company and that are believed to be reasonable under the circumstances, but which are inherently uncertain and unpredictable, the result of which forms the basis of the carrying values of assets and liabilities. As such, actual results could differ from those estimates.
(d) New accounting standards and interpretations
Certain new accounting standards and interpretations have been published that are not mandatory for the 31 December 2017 reporting period and have not been early adopted by the Company. The directors’ assessment of the impact of these
For
per
sona
l use
onl
y

Ellerston Asian Investments Limited16
Notes to the financial statementsFor the half-year ended 31 December 2017
2 Summary of significant accounting policies (continued)
(d) New accounting standards and interpretations (continued)
new standards (to the extent relevant to the Company) and interpretations is set out below:
(i) AASB 9 Financial Instruments (and applicable amendments), (effective from 1 January 2018)
AASB 9 Financial Instruments addresses the classification, measurement and derecognition of financial assets and financial liabilities. It has now also introduced revised rules around hedge accounting and impairment. The standard is not applicable until 1 January 2018 but is available for early adoption.
The directors do not expect this to have a significant impact on the recognition and measurement of the Company’s financial instruments as they are carried at fair value through profit or loss.
The derecognition rules have not been changed from the previous requirements, and the Company does not apply hedge accounting. AASB 9 introduces a new impairment model. However, as the Company’s investments are all held at fair value through profit or loss, the change in impairment rules will not impact the Company.
The Company has not yet decided when to adopt AASB 9.
(ii) AASB 15 Revenue from Contracts with Customers, (effective from 1 January 2018)
The AASB has issued a new standard for the recognition of revenue. This will replace AASB 118 which covers contracts for goods and services and AASB 111 which covers construction contracts.
The new standard is based on the principle that revenue is recognised when control of a good or service transfers to a customer – so the notion of control replaces the existing notion of risks and rewards.
For
per
sona
l use
onl
y

Interim Report 2017 17
2 Summary of significant accounting policies (continued)
(d) New accounting standards and interpretations (continued)
(ii) AASB 15 Revenue from Contracts with Customers, (effective from 1 January 2018) (continued)
The Company’s main sources of income are interest, dividends and gains on financial instruments held at fair value. All of these are outside the scope of the new revenue standard. As a consequence, the directors do not expect the adoption of the new revenue recognition rules to have a significant impact on the Company’s accounting policies or the amounts recognised in the interim statements.
There are no other standards that are not yet effective that are expected to have a material impact on the Company in the current or future reporting periods and on foreseeable future transactions.
3 Dividends
No dividends were declared, paid or payable for the half-year ended 31 December 2017 and half-year ended 31 December 2016.
Dividend profit reserve
To the extent that any current period profits or prior period accumulated profits are not distributed as dividends, the Company may set aside some or all of the undistributed profits to a separate dividend profit reserve, to facilitate the payment of future dividends, rather than maintaining these profits within retained earnings. On 30 August 2017 the directors resolved to transfer approximately $2.2m to the newly created dividend profit reserve to set aside funds for payment of future franked dividends. For further information refer to note 8.
Dividend Reinvestment Plan
The Company has established a Dividend Reinvestment Plan (DRP) under which eligible shareholders may elect to have all or part of their dividend entitlements satisfied by the issue of ordinary shares rather than by being paid in cash.
For
per
sona
l use
onl
y

Ellerston Asian Investments Limited18
Notes to the financial statementsFor the half-year ended 31 December 2017
4 Segment information
A business segment is identified for a group of assets and operations engaged in providing products or services that are subject to risks and returns that are different to those of other business segments. A geographical segment is identified when products or services are provided within a particular economic environment subject to risks and returns that are different from those of segments operating in other economic environments.
The Company operates in one business segment being equity investment, and in one geographic segment, Australia, however the Company has foreign exposures as it invests in companies which operate internationally.
5 Fair value measurement
The Company measures and recognises the following assets and liabilities at fair value on a recurring basis:
• Financial assets designated at fair value through profit or loss (see note 6)
• Financial liabilities held for trading (see note 7)
• Derivative financial instruments
The Company has no assets or liabilities measured at fair value on a non-recurring basis in the current reporting period.
AASB 13 Fair Value Measurement requires disclosure of fair value measurements by level of the following fair value hierarchy;
(a) quoted prices (unadjusted) in active markets for identical assets or liabilities (level 1);
(b) inputs other than quoted prices included within level 1 that are observable for the asset or liability, either directly or indirectly (level 2); and
(c) inputs for the asset or liability that are not based on observable market data (unobservable inputs) (level 3).
For
per
sona
l use
onl
y

Interim Report 2017 19
5 Fair value measurement (continued)
(i) Fair value in an active market (level 1)
The fair value of financial assets and liabilities traded in active markets is based on their quoted market prices at the end of the reporting period without any deduction for estimated future selling costs. Financial assets and liabilities are priced at last traded prices.
The Company values its investments in accordance with the accounting policies set out in note 2 to the financial statements. For the majority of its investments, the Company relies on information provided by independent pricing services for the valuation of its investments.
A financial instrument is regarded as quoted in an active market if quoted prices are readily and regularly available from an exchange, dealer, broker, industry group, pricing service, or regulatory agency, and those prices represent actual and regularly occurring market transactions on an arm’s length basis.
(ii) Fair value in an inactive or unquoted market (level 2 and level 3)
The fair value of financial assets and liabilities that are not traded in an active market is determined using valuation techniques. These include the use of recent arm’s length market transactions, reference to the current fair value of a substantially similar other instrument, discounted cash flow techniques, option pricing models or any other valuation technique that provides a reliable estimate of prices obtained in actual market transactions.
Where discounted cash flow techniques are used, estimated future cash flows are based on management’s best estimates and the discount rate used is a market rate at the end of the reporting period applicable for an instrument with similar terms and conditions.
For
per
sona
l use
onl
y

Ellerston Asian Investments Limited20
Notes to the financial statementsFor the half-year ended 31 December 2017
5 Fair value measurement (continued)
(ii) Fair value in an inactive or unquoted market (level 2 and level 3) (continued)
For other pricing models, inputs are based on market data at the end of the reporting period. Fair values for unquoted equity investments are estimated, if possible, using applicable price/earnings ratios for similar listed companies adjusted to reflect the specific circumstances of the issuer.
The fair value of derivatives that are not exchange traded is estimated at the amount that the Company would receive or pay to terminate the contract at the end of the reporting period taking into account current market conditions (volatility and appropriate yield curve) and the current creditworthiness of the counterparties. The fair value of a forward contract is determined as a net present value of estimated future cash flows, discounted at appropriate market rates as at the valuation date.
Some of the inputs to these models may not be market observable and are therefore estimated based on assumptions.
The output of a model is always an estimate or approximation of a value that cannot be determined with certainty, and valuation techniques employed may not fully reflect all factors relevant to the positions the Company holds. Valuations are therefore adjusted, where appropriate, to allow for additional factors including liquidity risk and counterparty risk.
For
per
sona
l use
onl
y

Interim Report 2017 21
5 Fair value measurement (continued)
(ii) Fair value in an inactive or unquoted market (level 2 and level 3) (continued)
Recognised fair value measurement
The table below sets out the Company’s financial assets and liabilities (by class) measured at fair value according to the fair value hierarchy as at 31 December 2017 and 30 June 2017.
As at 31 December 2017
Level 1 Level 2 Level 3 Total
$ $ $ $
Financial assets
Financial assets designated at fair value:
Equity securities 118,226,705 – – 118,226,705
Financial assets held for trading:
Derivatives – – – –
Total financial assets 118,226,705 – – 118,226,705
Financial liabilities
Financial liabilities held for trading:
Derivatives – 39,197 – 39,197
Total financial liabilities – 39,197 – 39,197
For
per
sona
l use
onl
y

Ellerston Asian Investments Limited22
Notes to the financial statementsFor the half-year ended 31 December 2017
5 Fair value measurement (continued)
(ii) Fair value in an inactive or unquoted market (level 2 and level 3) (continued)
Recognised fair value measurement (continued)
As at 30 June 2017
Level 1 Level 2 Level 3 Total
$ $ $ $
Financial assets
Financial assets designated at fair value:
Equity securities 96,429,635 – – 96,429,635
Financial assets held for trading:
Derivatives – 1,369,261 – 1,369,261
Total financial assets 96,429,635 1,369,261 – 97,798,896
Financial liabilities
Financial liabilities held for trading:
Derivatives – 123,046 – 123,046
Total financial liabilities – 123,046 – 123,046
The Company’s policy is to recognise transfers into and transfers out of fair value hierarchy levels as at the end of the reporting period.
(i) Transfers between levels
There were no transfers between levels in the fair value hierarchy for the half-year ended 31 December 2017 and year ended 30 June 2017.
For
per
sona
l use
onl
y

Interim Report 2017 23
5 Fair value measurement (continued)
(ii) Fair value measurements using significant unobservable inputs (level 3)
There were no investments classified as level 3 within the Company as at 31 December 2017 and 30 June 2017.
(iii) Fair values of other financial instruments
Due to their short-term nature, the carrying amounts of receivables and payables are assumed to approximate fair value.
6 Financial assets held at fair value through profit or loss
As at31 December 2017 30 June 2017
$ $
Designated at fair value through profit or loss
Equity securities 118,226,705 96,429,635
Total designated at fair value through profit or loss 118,226,705 96,429,635
Held for trading
Derivatives – 1,369,261
Total held for trading – 1,369,261
Total financial assets held at fair value through profit or loss 118,226,705 97,798,896
For
per
sona
l use
onl
y

Ellerston Asian Investments Limited24
Notes to the financial statementsFor the half-year ended 31 December 2017
6 Financial assets held at fair value through profit or loss (continued)
Details of the Company’s top 10 investments as at 31 December 2017 and 30 June 2017 are set out on the following table:
As at 31 December 2017Market
exposureFair
valueCompany Name $ $
Tencent Holdings Ltd 8,874,586 8,874,586
Taiwan Semiconductor Manufacturing 7,202,807 7,202,807
Samsung Electronics Co Ltd 5,903,426 5,903,426
Alibaba Group Holding 5,379,136 5,379,136
DBS Group Holdings Limited 5,230,251 5,230,251
Ping An Insurance Group Co 5,162,290 5,162,290
Industrial and Commercial Bank of China 4,137,575 4,137,575
China Construction Bank Corp 3,980,176 3,980,176
Larsen & Toubro Ltd 3,912,917 3,912,917
POSCO 3,732,695 3,732,695
Total – top 10 investments 53,515,859 53,515,859
Other investments excluding foreign currency contracts 64,710,846 64,710,846
Total investments excluding foreign currency contracts 118,226,705 118,226,705
Foreign currency contracts (39,197)
Total fair value of investments (Note 6 and Note 7)* 118,187,508
*Note 6 – Total financial assets held at fair value through profit or loss 118,226,705
*Note 7 – Total financial liablilities held at fair value through profit or loss 39,197
Total fair value of investments (Note 6 and Note 7) 118,187,508
For
per
sona
l use
onl
y

Interim Report 2017 25
6 Financial assets held at fair value through profit or loss (continued)
As at 30 June 2017Market
exposureFair
valueCompany Name $ $
Samsung Electronics Co. Ltd 6,500,306 6,500,306
Tencent Holdings Ltd 5,735,130 5,735,130
Taiwan Semiconductor Manufacturing 5,213,916 5,213,916
Alibaba Group Holding 4,647,376 4,647,376
DBS Group Holdings Limited 4,261,458 4,261,458
Larsen & Toubro Limited 3,522,911 3,522,911
China Petroleum & Chemicals 3,457,952 3,457,952
Indusind Bank Ltd 3,340,899 3,340,899
Baidu Inc 3,238,624 3,238,624
China Communications 3,161,843 3,161,843
Total – top 10 investments 43,080,415 43,080,415
Other investments excluding foreign currency contracts 58,195,695 54,686,673
Total investments excluding foreign currency contracts 101,276,110 97,767,088
Foreign currency contracts (91,238)
Total fair value of investments (Note 6 and Note 7)* 97,675,850
*Note 6 – Total financial assets held at fair value through profit or loss 97,798,896
*Note 7 – Total financial liablilities held at fair value through profit or loss (123,046)
Total fair value of investments (Note 6 and Note 7) 97,675,850F
or p
erso
nal u
se o
nly

Ellerston Asian Investments Limited26
Notes to the financial statementsFor the half-year ended 31 December 2017
7 Financial liabilities held at fair value through profit or loss
As at31 December
201730 June
2017$ $
Held for trading
Derivatives 39,197 123,046
Total held for trading 39,197 123,046
Total financial liabilities held at fair value through profit or loss 39,197 123,046
8 Dividend profit reserve
As at31 December
201730 June
2017Movements in Dividend Profit Reserve $ $
Balance at the beginning of the period – –
Transferred from retained earnings 2,200,000 –
Payment of dividend – –
Closing balance at the end of the period 2,200,000 –
On 30 August 2017, the Directors decided to transfer approximately $2.2m (2016:nil) to the dividend profit reserve, to set aside funds for payment of future franked dividends.
For
per
sona
l use
onl
y

Interim Report 2017 27
9 Cash and cash equivalents
As at31 December
201730 June
2017$ $
Cash at bank 6,643,032 8,832,184
Total cash and cash equivalents 6,643,032 8,832,184
These accounts are earning a floating interest rate of between 0.01% pa (June 2017: 0.01% pa) and 1.50% pa (June 2017: 1.95% pa) during the reporting period.
10 Issued capital
As at 31 December 2017No. of Securities $
Ordinary shares
Opening balance – 1 July 2017 111,600,739 110,228,295
Shares bought back – 3 July 2017 to 22 December 2017 (6,415,000) (6,174,067)
Shares issued from exercise of options 410,666 410,666
Total issued capital - fully paid ordinary shares 105,596,405 104,464,894
Options
Loyalty options
Opening balance – 1 July 2017 65,167,917 –
Option exercised – 28 November 2017 to 22 December 2017 (410,666) –
Total options 64,757,251 –
Total issued capital 104,464,894For
per
sona
l use
onl
y

Ellerston Asian Investments Limited28
Notes to the financial statementsFor the half-year ended 31 December 2017
10 Issued capital (continued)
As at 31 December 2016No. of Securities $
Ordinary shares
Opening balance – 1 July 2016 120,000,001 117,560,983
Shares bought back (2,302,671) (1,971,153)
Total issued capital - fully paid ordinary shares 117,697,330 115,589,830
Options
Loyalty options
Opening balance – 1 July 2016 – vested 65,167,917 –
Total options 65,167,917 –
Total issued capital 115,589,830
(a) Terms and conditions
(i) Ordinary shares
Fully paid ordinary shares entitle the holder to receive dividends as declared and the proceeds on winding up the Company in proportion to the number of and amounts paid up on shares held. Ordinary shares entitle their holder to one vote, either in person, or by proxy, at a meeting of the Company.
The initial share buy back announced by the Company on 13 September 2016 terminated on 26 September 2017. In total, the Company had bought back 11,824,262 shares at that date which is approximately 10.93% of its issued ordinary shares.
On 13 September 2017, the Company announced an on-market share buy-back of up to 10% of its issued ordinary shares, commencing 27 September 2017 until an earlier of 26 September 2018 or when 10% of ordinary shares are bought back. The Company reserves the right to suspend or terminate the on-market share buy-back at any time. During this period, the Company has bought back 2,990,000 shares in total, approximately 2.83% of its issued ordinary shares.
For
per
sona
l use
onl
y

Interim Report 2017 29
10 Issued capital (continued)
(a) Terms and conditions (continued)
(ii) Options
Under the Prospectus dated 21 August 2015, the Company offered shares together with:
(a) one loyalty Option for every two shares issued under the broker firm offer or the general offer; and
(b) two loyalty options for every three shares issued under the priority offer to eligible existing shareholders of Ellerston Global Investments Limited (ASX: EGI).
(c) all loyalty options were issued at no cost and are not entitled to dividends.
On 28 February 2016 the vesting date of the Options, the Company issued 65,167,917 vested loyalty options to option holders who held at least the same amount of shares issued under the Initial Public Offer. The loyalty options lapsed on the same date for option holders who held less amount of shares than what they were allotted in the initial Public Offer.
The vested loyalty options were first quoted on the ASX on 2 March 2016. Holders of the vested loyalty option have the right to acquire one ordinary share in the Company at a price of $1.00 and can exercise the right at any time in the period commencing on the day after the vesting date of 28 February 2016 and ending on the third anniversary of the vesting date being 28 February 2019. The loyalty options are not entitled to dividends.
Ordinary shares issued on exercise of the options rank equally with all other ordinary shares from the date of exercise and entitle the holder to receive dividends on or prior to the applicable record date.
For
per
sona
l use
onl
y
Ellerston Asian Investments Limited30
Notes to the financial statementsFor the half-year ended 31 December 2017
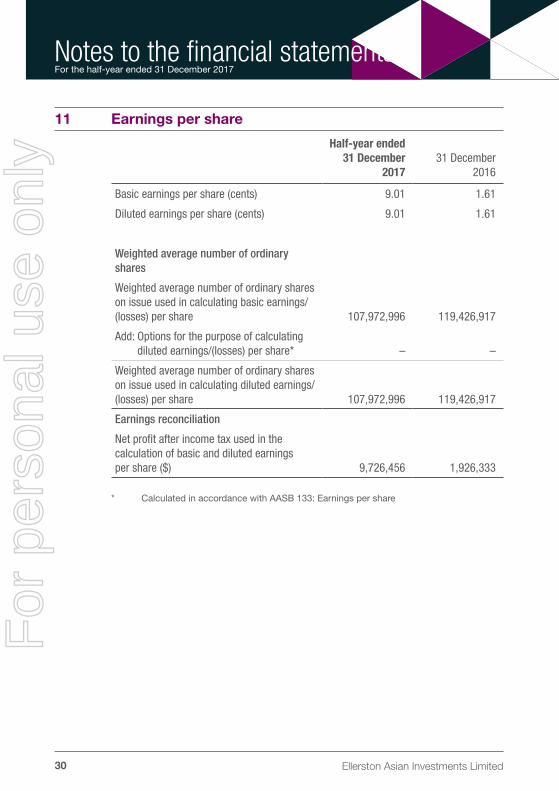
11 Earnings per share
Half-year ended 31 December
201731 December
2016
Basic earnings per share (cents) 9.01 1.61
Diluted earnings per share (cents) 9.01 1.61
Weighted average number of ordinary shares
Weighted average number of ordinary shares on issue used in calculating basic earnings/(losses) per share 107,972,996 119,426,917
Add: Options for the purpose of calculating diluted earnings/(losses) per share* – –
Weighted average number of ordinary shares on issue used in calculating diluted earnings/(losses) per share 107,972,996 119,426,917
Earnings reconciliation
Net profit after income tax used in the calculation of basic and diluted earnings per share ($) 9,726,456 1,926,333
* Calculated in accordance with AASB 133: Earnings per share
For
per
sona
l use
onl
y

Interim Report 2017 31
12 Net tangible assets per share
As at 31 December
201730 June
2017$ $
Net tangible assets per share
Net Tangible Assets before all taxes 1.1809 1.0540
Net Tangible Assets after realised tax (i) 1.1653 1.0540
Net Tangible Assets after tax 1.1363 1.0397
The Net Tangible Assets as at 31 December 2017 is based on fully paid ordinary shares of 105,596,405 (June 2017: 111,600,739).
(i) Net Tangible Assets after realised tax includes tax paid and a provision for tax on realised gains from the Company’s Investment Portfolio. It excludes any tax on unrealised gains and deferred tax, which are represented in the Net Tangible Assets after tax line.
13 Management and performance fees
Under the Management Agreement, dated 27 July 2015, the Company must pay the Investment Manager a Management Fee as determined with respect to the scale set out below based on the pre tax net asset value of the Investment Portfolio.
For the first AUD$50 million of net asset value the Investment Manager is entitled to 0.95% of Management Fees per annum.
Any amount by which the net asset value exceeds AUD$50 million the Investment Manager is entitled to 0.75% of Management Fees per annum.
The Management Fee is calculated exclusive of GST and accrued each month and paid monthly in arrears.
In addition, the Investment Manager will be entitled to receive a Performance Fee from the Company equal to 15% (plus GST) of the amount by which the Investment Portfolio’s pre tax return exceeds the return of the MSCI AC Asia Ex Japan Index ($AUD), calculated and accrued monthly and paid annually in arrears.
For
per
sona
l use
onl
y
Ellerston Asian Investments Limited32
Notes to the financial statementsFor the half-year ended 31 December 2017
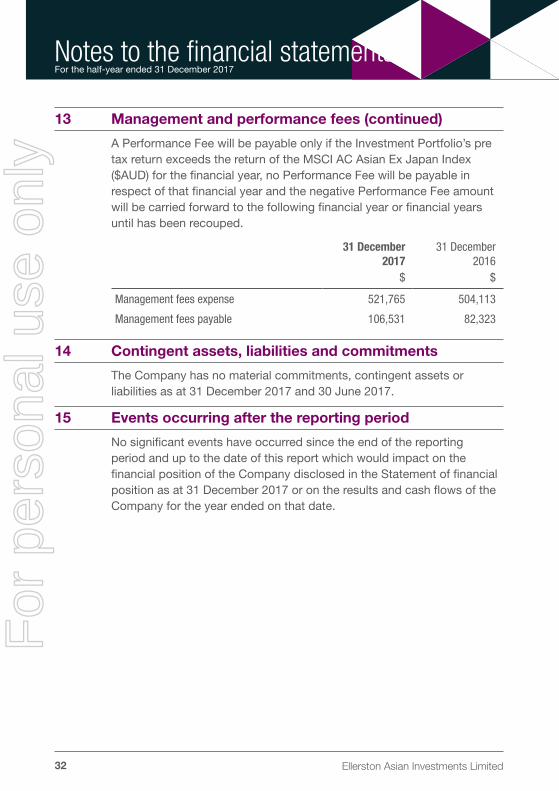
13 Management and performance fees (continued)
A Performance Fee will be payable only if the Investment Portfolio’s pre tax return exceeds the return of the MSCI AC Asian Ex Japan Index ($AUD) for the financial year, no Performance Fee will be payable in respect of that financial year and the negative Performance Fee amount will be carried forward to the following financial year or financial years until has been recouped.
31 December 2017
31 December 2016
$ $
Management fees expense 521,765 504,113
Management fees payable 106,531 82,323
14 Contingent assets, liabilities and commitments
The Company has no material commitments, contingent assets or liabilities as at 31 December 2017 and 30 June 2017.
15 Events occurring after the reporting period
No significant events have occurred since the end of the reporting period and up to the date of this report which would impact on the financial position of the Company disclosed in the Statement of financial position as at 31 December 2017 or on the results and cash flows of the Company for the year ended on that date.
For
per
sona
l use
onl
y
Interim Report 2017 33
Directors’ Declaration31 December 2017
Directors’ declaration
In the directors’ opinion:
(a) the financial statements and notes set out on pages 9 to 32 are in accordance with the Corporations Act 2001, including:
(i) complying with Accounting Standard AASB 134 interim Financial Reporting and, the Corporations Regulations 2001; and
(ii) giving a true and fair view of the Company’s financial position as at 31 December 2017 and of its performance for the financial period ended on that date; and
(b) there are reasonable grounds to believe that the Company will be able to pay its debts as and when they become due and payable.
Signed in accordance with a resolution of the directors.
Ashok Jacob
Chairman
19 February 2018
For
per
sona
l use
onl
y

Ellerston Asian Investments Limited34
Independent Auditors’ Review Report
A member firm of Ernst & Young Global LimitedLiability limited by a scheme approved under Professional Standards Legislation
Independent Auditor's Review Report to the Members of Ellerston AsianInvestments Limited
Report on the Half-Year Financial ReportConclusionWe have reviewed the accompanying half-year financial report of Ellerston Asian Investments Limited (theCompany), which comprises the statement of financial position as at 31 December 2017, the statement ofcomprehensive income, statement of changes in equity and statement of cash flows for the half-year endedon that date, notes comprising a summary of significant accounting policies, and other explanatoryinformation, and the directors’ declaration.
Based on our review, which is not an audit, nothing has come to our attention that causes us to believe thatthe half-year financial report of the Company is not in accordance with the Corporations Act 2001,including:
a) giving a true and fair view of the Company’s financial position as at 31 December 2017 and of itsfinancial performance for the half-year ended on that date; and
b) complying with Accounting Standard AASB 134 Interim Financial Reporting and the CorporationsRegulations 2001.
Directors’ Responsibility for the Half-Year Financial ReportThe directors of the Company are responsible for the preparation of the half-year financial report thatgives a true and fair view in accordance with Australian Accounting Standards and the Corporations Act2001 and for such internal control as the directors determine is necessary to enable the preparation of thehalf-year financial report that is free from material misstatement, whether due to fraud or error.
Auditor’s ResponsibilityOur responsibility is to express a conclusion on the half-year financial report based on our review. Weconducted our review in accordance with Auditing Standard on Review Engagements ASRE 2410 Review ofa Financial Report Performed by the Independent Auditor of the Entity, in order to state whether, on thebasis of the procedures described, anything has come to our attention that causes us to believe that thehalf-year financial report is not in accordance with the Corporations Act 2001 including: giving a true andfair view of the Company’s financial position as at 31 December 2017 and its financial performance for thehalf-year ended on that date; and complying with Accounting Standard AASB 134 Interim FinancialReporting and the Corporations Regulations 2001. As the auditor of the Company, ASRE 2410 requiresthat we comply with the ethical requirements relevant to the audit of the annual financial report.
A review of a half-year financial report consists of making enquiries, primarily of persons responsible forfinancial and accounting matters, and applying analytical and other review procedures. A review issubstantially less in scope than an audit conducted in accordance with Australian Auditing Standards andconsequently does not enable us to obtain assurance that we would become aware of all significant mattersthat might be identified in an audit. Accordingly, we do not express an audit opinion.
Ernst & Young200 George StreetSydney NSW 2000 AustraliaGPO Box 2646 Sydney NSW 2001
Tel: +61 2 9248 5555Fax: +61 2 9248 5959ey.com/au
For
per
sona
l use
onl
y

Interim Report 2016 35
Independent Auditors’ Review Report
A member firm of Ernst & Young Global LimitedLiability limited by a scheme approved under Professional Standards Legislation
IndependenceIn conducting our review, we have complied with the independence requirements of the Corporations Act2001.
Ernst & Young
Rohit KhannaPartnerSydney19 February 2018
For
per
sona
l use
onl
y

Ellerston Asian Investments Limited36
Corporate Directory
DirectorsAshok Jacob
Sam Brougham
Paul Dortkamp
Stuart Robertson
Company SecretaryIan Kelly
Registered Officec/- Ellerston Capital Limited
Level 11, 179 Elizabeth Street
SYDNEY NSW 2000
AuditorErnst and Young
Ernst and Young Centre
200 George Street
SYDNEY NSW 2000
ManagerEllerston Capital Limited
ACN 110 397 674
Level 11, 179 Elizabeth Street
SYDNEY NSW 2000
Share RegistryLink Market Services Limited
Level 12, 680 George Street
SYDNEY NSW 2000
Securities Exchange Listing ASX code (ordinary shares): EAI
ASX code (loyalty options): EAIO
For
per
sona
l use
onl
y