for the purpose of the transparency directive the home member … · commenting on the results, dr....
TRANSCRIPT

1 | ADES International Holding PLC
FY2019 FINAL RESULTS London | 7 April 2020
For the purpose of the Transparency Directive the Home Member state of the issuer is the United Kingdom.
ADES International Holding PLC results for the year ended
31 December 2019
(London & Dubai, 7 April 2020) ADES International Holding PLC (“ADES” or “the Group”), a leading oil &
gas drilling and production services provider in the Middle East and North Africa (MENA), announces its full-
year audited results for the year ended 31 December 2019.
Summary of Financials (US$ ‘000) 2019 2018 % change
Revenues 477,758 205,563 132%
EBITDA 193,367 101,071 91%
EBITDA Margin 41% 49% -8.7 pts
Normalised Net Profit1 72,714 44,712 63%
Normalised Net Profit Margin 15% 22% -7 pts
Net Profit 31,534 73,272 -57%
Net Profit Margin 7% 36% -29 pts
Weighted Average No. of Shares 43,778 43,082 1.7%
Normalised Earnings per Share (US$) 1.66 1.04 60%
Reported Earnings per Share (US$) 0.7 1.7 -58%
Net Debt 606,188 424,393
Key 2019 Financial & Operational Highlights
• Revenue grew by 132% to US$ 477.8 million in 2019 from US$ 205.6 million in 2018, driven by:
o an increased contribution from acquired Weatherford and Nabors rigs which contributed 64% of
revenue against 24% in 2018;
o organic growth of 10%, due to better utilization and the two new onshore rigs deployed in Saudi;
o revenue in H2 grew by 17% sequentially from 1H 2019.
• EBITDA increased by 91% to US$ 193.4 million in 2019 from US$ 101.1 million in 2018. As anticipated,
the EBITDA margin reflects geographical diversification and onshore expansion following the
acquisitions.
• Backlog at year end of c.US$ 1.3 billion, compared to US$ 1.2 billion in 2018 driven by a string of
renewals and contract awards during the year. Our backlog weighted average tenor of 4 years, matches
the Group’s debt re-payment profile.
• Normalised net profit1 increased by 63% to US$ 72.7 million in 2019 from US$ 44.7 million in 2018.
Normalized net profit margin reflects the new business distribution following the acquisitions and higher
finance & depreciation charges during the year.
• Net profit of US$ 31.5 million in 2019 compared to US$ 73.3 million in 2018, affected by significant non-
recurring charges in both years1.
• Significant working capital improvement driving strong net operating cash flow, which increased by
236% to US$ 172 million in 2019, due to shorter working capital cycles in Saudi Arabia and Kuwait.
• Successfully closed a bond offering of US$ 325 million of senior secured notes due in 2024, with a B+
credit rating from S&P and Fitch.
1 Normalised Net Profit is calculated as Net profit before non-controlling interest after excluding non-recurring charges from: a) one off finance charges related to loan fees and written off prepaid transaction costs b) accounting adjustments related to IFRS 3 (Business Combinations) and a one-off bargain purchase gain; c) non-cash, equity-settled share-based payment compensation from the parent company; d) non-cash fair-value adjustments under financial instruments; and e) non-recurring transactions.

2 | ADES International Holding PLC
FY2019 FINAL RESULTS London | 7 April 2020
• Net Debt of US$ 606.2 million at year-end, a decrease from US$ 616.9 million reported at 30 September
2019. Net Debt to EBITDA stood at 3.1x in 2019, well below ADES’ current covenant level of 4.0x.
• Cash and bank balances of c. US$ 120 million as at year-end, providing strong liquidity for the business.
• Utilisation rate growth to 97% from 85% in 2018.
• Treasury Stock worth US$ 3.5 million was bought back by the Group throughout 2019.
• ADES achieved over 13.6 million-man hours in 2019 with a Recordable Injury Frequency Rate (“RIFR”)
of 0.412, below the IADC worldwide standard rate of 0.63.
Current Trading and Outlook
• Amid the rapidly evolving COVID-19 pandemic and market volatility caused by the current oil price, ADES
is in a strong position to maintain its current operations and existing business.
• The COVID-19 pandemic has not significantly impacted the Group’s activities to date; however, given its
rapidly changing nature, ADES is closely monitoring the situation with robust health and safety
protocols and business continuity plans in place to mitigate risks posed by the pandemic.
• With the vast majority of the Group’s rigs staffed locally, the current restrictions on mobility are not
expected to significantly impact ADES’ operations. Moreover, due to the essential role of the oil & gas
industry for the MENA region, management believes it is unlikely that governments across the region
will impose further restrictions on the Group’s operations even under a more stringent lockdown
scenario.
• ADES is also well-positioned despite the lower oil price environment supported by:
• strong liquidity with cash on hand of around US $120 million and available undrawn banking facilities of approximately US$100 million as at 31 December 2019 providing ample headroom and financial flexibility;
• long-dated backlog providing significant visibility and supporting future cash generation;
• ADES’ rigs are contracted at fixed daily rates with the majority already calibrated during a low
point of the oil price cycle;
• diversified portfolio across the MENA region with the lowest cost of extraction / breakeven
points globally;
• substantial portion of the Group’s business in workover drilling which demands continuity to
avoid well depletion;
• client-base dominated by NOCs with long-term planning horizons and less susceptible to short
term oil price-cycle;
• ADES’s low-cost business model with minimised overheads allowing the Group to offer
competitive rates to clients and deliver strong profitability even during tough market conditions.
• Integration Project is progressing to plan, and benefits being realised. Currently, EBITDA margins
for the majority of newly acquired rigs have risen from their acquisition levels and are now in line with the
Group’s average.
• Expected improvement in Net debt position due to resilient earnings and lower capital expenditure.
• Our focus remains on business sustainability based on our diversified regional presence and through
leveraging of our strong asset base in MENA.
Commenting on the results, Dr. Mohamed Farouk, Chief Executive Officer of ADES International said:
“2019 saw the completion of ADES’s transformation with a strong financial performance, an integrated and
strengthened asset base, a substantial order backlog and a long term and liquid balance sheet.
2020 has started as expected and, whilst we are closely monitoring the impact of COVID-19 and the low oil
price environment, our operations to date have not been significantly impacted. We are confident that the
Group is well positioned to weather these tough end market conditions underpinned by the order book cover,
low cost operating model and MENA region focus.”
2 Per 200,000 working hours

3 | ADES International Holding PLC
FY2019 FINAL RESULTS London | 7 April 2020
Conference Call ADES’ management team will present the 2019 Results and will be available for a Q&A session with analysts
and investors today at 14:00 UK. For conference call details, please email [email protected].
Enquiries ADES International Holding
Hussein Badawy
Investor Relations Officer
+2 (0)2527 7111
Instinctif
Mark Garraway [email protected] +44 (0)20 7457 2020
Dinara Shikhametova [email protected]
Sarah Hourahane [email protected]
About ADES International Holding (ADES) ADES International Holding extends oil and gas drilling and production services through its subsidiaries and is a leading
service provider in the Middle East and North Africa, offering onshore and offshore contract drilling as well as workover
and production services. Its c.4,000 employees serve clients including major national oil companies (“NOCs”) such as
Saudi Aramco and Kuwait Oil Company as well as joint ventures of NOCs with global majors including BP and Eni.
While maintaining a superior health, safety and environmental record, the Group currently has a fleet of thirty-six onshore
drilling rigs, thirteen jack-up offshore drilling rigs, a jack-up barge, and a mobile offshore production unit (“MOPU”), which
includes a floating storage and offloading unit. For more information, visit investors.adihgroup.com.
Shareholder Information LSE: ADES INT.HDG
Bloomberg: ADES:LN
Listed: May 2017
Shares Outstanding: 43.8 million
Forward-Looking Statements This communication contains certain forward-looking statements. A forward-looking statement is any statement that
does not relate to historical facts and events, and can be identified by the use of such words and phrases as “according
to estimates”, “aims”, “anticipates”, “assumes”, “believes”, “could”, “estimates”, “expects”, “forecasts”, “intends”, “is of
the opinion”, “may”, “plans”, “potential”, “predicts”, “projects”, “should”, “to the knowledge of”, “will”, “would” or, in each
case their negatives or other similar expressions, which are intended to identify a statement as forward-looking. This
applies, in particular, to statements containing information on future financial results, plans, or expectations regarding
business and management, future growth or profitability and general economic and regulatory conditions and other
matters affecting the Group.
Forward-looking statements reflect the current views of the Group’s management (“Management”) on future events,
which are based on the assumptions of the Management and involve known and unknown risks, uncertainties and other
factors that may cause the Group’s actual results, performance or achievements to be materially different from any
future results, performance or achievements expressed or implied by these forward-looking statements. The occurrence
or non-occurrence of an assumption could cause the Group’s actual financial condition and results of operations to differ
materially from, or fail to meet expectations expressed or implied by, such forward-looking statements.
The Group’s business is subject to a number of risks and uncertainties that could also cause a forward-looking
statement, estimate or prediction to differ materially from those expressed or implied by the forward-looking statements
contained in this prospectus. The information, opinions and forward-looking statements contained in this communication
speak only as at its date and are subject to change without notice. The Group does not undertake any obligation to
review, update, confirm or to release publicly any revisions to any forward-looking statements to reflect events that occur
or circumstances that arise in relation to the content of this communication.

4 | ADES International Holding PLC
FY2019 FINAL RESULTS London | 7 April 2020
Chief Executive Officer’s Report
ADES’ results in 2019 reflect the successful transformation strategy that has seen the Group grow from a local, offshore-focused driller in Egypt, to a regional champion with a significant asset base across both the on- and offshore segments. Our growth was guided by the key strategic pillars of leveraging our financial resources to pursue non-speculative and value accretive acquisitions; commitment to organic growth through increased tendering activity; focusing on operational excellence and safety to build long-lasting client relationships; and most importantly our prudent approach to debt and liquidity which leaves the Group in a resilient position in the face of rising challenges. ADES stands today with an asset base of 51 rigs and a substantial backlog of c.US$ 1.3 billion as of year-end 2019. Our operations cover a diversified footprint across some of the region’s fastest growing and most resilient markets, while our lean cost structure, cultural alignment and adherence to global best practices, provide a solid platform for long-term organic growth. In 2019, ADES saw a significant 132% year-on-year increase in revenue to US$ 477.8 million, with growth being driven primarily by contributions from acquired assets along with a marked improvement in utilisation rates to 97% versus 85% in 2018. More importantly, our revenue base is now more diversified across our geographies, including KSA (51%), Kuwait (22%), Egypt (18%) and Algeria (9%). On a segment basis, onshore drilling today constitutes 53% of our total revenue, up from 15% in 2018, providing for a good balance between on- and off-shore activities. Meanwhile our profitability remained strong, with EBITDA almost doubling to US$ 193.4 million, and with our EBITDA margin standing at a solid 41% for the year. The strong growth largely flowed through to our bottom-line where normalised net profit expanded by 63% year-on-year. In conjunction with our robust financial performance, we sustained our significant backlog. During 2019, despite having delivered more than one third of our existing backlog, as at year-end 2018, we successfully replenished our pipeline to close the year with an outstanding backlog of US$ 1.3 billion. This excludes US$ 140 million in offshore renewals in KSA that were renewed in January 2020. The continued growth is not only a testament to our ability to secure and renew contracts but is also a feature of an acquisition strategy focused on assets with clear backlog visibility. ADES has a client roster of mostly top-tier IOCs and NOCs, in markets characterized by high barriers to entry and long-term investment horizons that provide for sustainable cash flow generation and a long-dated backlog. During 2019, we secured the Group’s first two deepwater drilling contracts in the Egyptian Mediterranean basin in partnership with Vantage Drilling International. These contracts are fully consistent with our asset-light model approach and see us penetrate a new segment of the oil & gas drilling industry. Throughout ADES’s transformation, we remained focused on developing an optimised capital structure that is more aligned with our operational scale and that provides ample liquidity for our growth requirements. In 2019, we completed our first international bond offering of US$ 325 million of senior secured notes due in 2024, proceeds from which were utilised to partially refinance our US$ 450 million syndicated loan secured in 2018. This restructuring of our commitments allowed us to secure access to ample liquidity and diversified our funding across new sources of international investors, top-tier regional banks and international organizations. I am pleased to report that since our debut on debt capital markets, ADES’ bond has delivered an outperformance and maintained a credit rating of B+ from S&P and Fitch. This is testament to the Group’s strong market position, robust fundamentals and investors’ recognition of the Group’s differentiated business model. Integration of Acquisitions On the operational front, our focus in 2019 was on driving forward the integration of our new assets while maintaining operational excellence. Our target was to promptly integrate the 31 new rigs from the Weatherford acquisition and the three new rigs acquired from Nabors. We have made good progress and successfully finalised the first phase of our Integration Programme, ensuring the smooth transfer of assets and businesses with minimal operational and contractual disruptions. As part of our integration strategy, we

5 | ADES International Holding PLC
FY2019 FINAL RESULTS London | 7 April 2020
also strengthened our internal management organisation by retaining key people within our team and adding new, highly experienced managers to oversee the various aspects of our day-to-day operations. Throughout the integration we also worked to identify synergies within our expanded asset base as we look to drive cost savings across our operations to support profitability and allow us to continue offering competitive rates to our clients. We are already witnessing results, where EBITDA margins for the majority of newly acquired rigs have risen from the acquisition levels and are currently in line with the group’s averages. This is despite the positive effects of the integration being partly offset by the Egyptian pound’s appreciation. Health and Safety Across our asset base, we remained committed to complying with the highest occupational HSE standards. We concluded 2019 recording a Recordable Injury Frequency Rate (“RIFR”) of 0.41, well below the 2019 worldwide standard rate of 0.63 by the International Association of Drilling Contractors (“IADC”) and further improving on our rate of 0.57 in 2018. This represents a notable accomplishment considering the growth in number of operating rigs post the recent acquisitions. We are extremely pleased with the work of our HSE who identify, mitigate and control risks for the safety of our staff. In the coming year we will continue to work closely with a leading HSE consultant to review and develop the Group’s safety procedures as our operations grow in size and continue to expand across different geographies. COVID-19 Currently, our business has remained largely unaffected by the COVID-19 pandemic, however, the situation is evolving by the day and ADES is taking all the necessary precautions to minimize the potential impact of, and efficiently react to any future developments. For the time being our top priority is to ensure the well-being and safety of our employees, partners and the communities where we operate. We have put in place the necessary contingencies and protocols to ensure business continuity. Key efforts include the establishment of a Crisis Management Board (CMB) to manage and oversee all efforts related to COVID-19 at ADES’s headquarter and operating countries. The CMB has developed a holistic plan covering situation monitoring, prevention measures and response and recovery efforts, key highlights of which include:
• Extending crew shifts from 14 to 28 days across ADES’ fleet to minimize travel. Prior to shift change,
incoming crews are first quarantined in hotels under ADES’ supervision for screening to reduce risk
of introducing infection.
• Backup crews in each country and detailed step by step disinfection protocol as part of recovery
plans in the event of an infection on our rigs.
• Awareness campaigns for employees, frequent disinfecting and cleaning, travel restrictions,
personnel screening and testing, increased sick-leave flexibility and deploying technology to support
remote working policies, where possible.
• Monitor travel-ban updates and address the impact on business continuity.
• Contingency stocks of food on all rigs in case of quarantine for 14 days after discovery of any
suspected case.
• Maintaining supplies and material inventory to cover three months of operation.
• Communication protocol established internally and with our customers and suppliers.
• Monitoring of all operations in line with updates and guidance from the World Health Organisation,
International SOS and local governments and authorities in countries where the Group operates.
• Systematically monitoring triggers, assessing risk and impact and defining response actions at
various levels from rig to country and HQ level.

6 | ADES International Holding PLC
FY2019 FINAL RESULTS London | 7 April 2020
Outlook Our focus in 2020 will be on business continuity and sustainability. And while the early months of the year have witnessed severe pressure on oil prices and risks posed by the spreading COVID-19 pandemic, ADES has started the year as expected and is well-positioned to weather the challenges the industry faces. Our Group has a strong backlog and contract visibility with an average maturity of four years, and fixed daily rates that were acquired and calibrated in a low oil-price environment. Our position is also bolstered by a lean cost structure that allows us to offer competitive rates in a region with the lowest extraction cost and breakeven points. Most importantly, our strong balance sheet, cash flow generating ability and liquidity provide material headroom and financial flexibility to reinforce our resilient position. The Group expects lower levels of capital expenditure in 2020, after successfully completing the acquisitions and related capital expenditure over the course of 2018 and 2019. Operationally, we have gained a stronger understanding of the synergies existing across our expanded asset base and in the months ahead we will be looking to drive further efficiencies across our operations. A key focus area will be increased digitisation of our processes which will unlock substantial efficiency enhancements. Our Group today stands on solid foundations that we have carefully laid out since our IPO and that we continue to strengthen. Our expanded asset base, diversified backlog, lean cost structure, strong financial position and our culture of prioritising health and safety leave me confident that we have the necessary tools to ensure the well-being of our stakeholders and to generate long-term value. Finally, I am grateful for continued commitment and hard work of ADES’ employees and management who are the driving force behind our success and with whom we will continue to grow as a stronger and more resilient organization. Dr. Mohamed Farouk, Chief Executive Officer

7 | ADES International Holding PLC
FY2019 FINAL RESULTS London | 7 April 2020
Operational & Financial Review
Revenue
Revenue increased 132% year-on-year based on acquisitive and organic growth. Organic growth was 10%
year-on-year with utilisation rates rising to 97% from 85% in 2018. The inorganic growth was driven by the
acquisition of Weatherford’s assets in Kuwait, KSA and Algeria as well as the 2018 acquisition of three rigs
from Nabors.
Over the past twelve months, ADES continued renewing and extending existing contracts, while securing
new awards across several of its countries of operation. Following the completion of the Weatherford
acquisition, ADES successfully secured contract renewals for six of the newly acquired onshore rigs in Saudi
Arabia. The Group also secured two new seven-year onshore drilling contracts in the Kingdom for which it
ordered two new-build onshore rigs that meet the contract specifications (ADES 13 and 14). In Algeria, ADES
secured new contracts for ADES 2 and ADES 3, which started in the second and third quarter of 2019,
respectively. The Group also renewed its contract for RIG 828 in Algeria, which was extended for an
additional year. Finally, in Egypt, ADES extended contracts for multiple offshore rigs.
Revenue by Country
(US$ '000) 2019 2018 % change
KSA 243,902 96,095 153.8%
Egypt 87,125 87,227 -0.1%
Algeria 40,415 11,594 248.6%
Kuwait 106,316 10,647 898.5%
Total 477,758 205,563 132.4%
Revenue Contribution by Country
2019 2018 % change
KSA 51% 47% 4 pts
Egypt 18% 42% -24 pts
Algeria 9% 6% 3 pts
Kuwait 22% 5% 17 pts
Backlog by Country
2019 2018 % change
KSA 45% 50% -5 pts
Egypt 9% 10% -1 pts
Algeria 3% 2% 1 pts
Kuwait 43% 38% 5 pts
In KSA, revenues increased 154% year-on-year to US$ 244 million for 2019. The contribution to the Group’s
revenue subsequently increased 4 percentage points to 51% in 2019. The revenue expansion was due to
the significant growth in the Group’s asset base in the Kingdom. More specifically, the three rigs acquired
from Nabors in June 2018 made full-year contributions in 2019. Additionally, of the 11 onshore rigs acquired
from Weatherford in December 2018, nine were contracted and therefore contributed to revenue during the
entirety of 2019. ADES has also renewed contracts for six rigs in KSA during the first quarter of 2019.

8 | ADES International Holding PLC
FY2019 FINAL RESULTS London | 7 April 2020
Revenue generated by the Group’s Egyptian operations stood at US$ 87 million in 2019, largely unchanged
from the previous year given stable utilization rates in the country. As the revenue generated from the Nabors
and Weatherford acquisitions in KSA, Kuwait and Algeria continue to rise, Egypt’s contribution to total
revenues fell to 18% in 2019, from 42% in 2018. This is in line with the Group’s strategy of diversifying its
revenue base across the MENA region.
Algeria revenue of US$ 40 million in 2019, was up 249% versus US$ 11.6 million recorded in 2018. Revenue
growth was supported by the two new contracts secured for ADES II and ADES III, and the completion of the
acquisition of the Weatherford rigs and the associated operations. Algeria’s total contribution to revenues
stood at 9% in 2019 versus 6% in the previous year. ADES now has a total of eight rigs in Algeria.
ADES entered into the Kuwaiti market after finalising the Kuwait segment of the Weatherford transaction in
November 2018, with 12 onshore rigs added to the Group’s fleet. With eight from the 12 rigs operational
during 2019, Kuwait contributed US$ 106 million in revenue during 2019 versus US$ 10.6 million in the
previous year, an 899% increase year-on-year. Kuwait’s contribution to total revenue stood at 22% for the
year, up 5 percentage points from 2018.
Assets by Country & Type as at 31 December 2019
Onshore Rig Offshore Rig Jack-up Barge MOPU
KSA 15 6 - -
Egypt 1 7 1 1
Algeria 8 - - -
Kuwait 12 - -
Other - - - -
Total Assets 36 13 1 1
Revenue by Segment
(US$ '000) 2019 2018 % change
Offshore Drilling & Workover 171,658 140,010 23%
Onshore Drilling & Workover 252,493 30,998 715%
MOPU & Jack up barge 34,244 32,383 5.7%
Others 19,363 2,172 791%
Total 477,758 205,563 132%
Offshore Drilling & Workover (36% of revenues in 2019)
We currently conduct our offshore drilling and workover services in Egypt and KSA, focusing on shallow/ultra-
shallow water and non-harsh environments.
Offshore Drilling & Workover recorded revenue of US$ 172 million in 2019, up 23% year-on-year and
contributing 36% to revenue compared to 68% in 2018. Revenue growth was driven by the increase in the
number of operational offshore rigs following the acquisition of the three Nabors rigs in June 2018, which
contributed to full-year revenue in 2019.
Onshore Drilling & Workover (53% of revenues in 2019)
During 2019, ADES operated a total of 25 onshore rigs, of which 21 were part of the Weatherford acquisition
and two which were newly built rigs for KSA. Subsequently, revenue generated from Onshore Drilling &
Workover operations stood at US$ 253 million in 2019 compared to US$ 31 million generated in 2018. This

9 | ADES International Holding PLC
FY2019 FINAL RESULTS London | 7 April 2020
represents a 715% year-on-year increase with the contribution to revenue rising to 53% for the year versus
15% in 2018.
MOPU & Jack Up Barge (7% of revenues in 2019)
ADES’ MOPU services were first introduced in February 2016 with Admarine I, a converted and modified
jack-up rig equipped with production and process facilities and a Floating Storage and Offloading (FSO) unit.
Admarine I, located in Egypt, is currently under contract with Petrozenima to process, store and offload crude
oil.
MOPU services generated revenues of US$ 256 million in 2019 flat on 2018. The contribution to revenue
decreased from 13% in 2018 to 5% in 2019, reflecting the higher contribution made by the Group’s Offshore
and Onshore Drilling & Workover segments.
The Group’s jack-up barge generated US$ 8 million in revenues for 2019 compared to US$ 6.7 million in
2018.
Others (4% of revenues in 2019)
Other revenue, which mainly includes catering revenue, mobilization revenue, the rental of essential
operating equipment that the client has not supplied, and site preparation revenue stood at US$ 19 million in
2019 versus US$ 2 million in 2018. Catering and site preparation revenues related to the Group’s recent
acquisitions contributed c.70% of the year-on-year growth of other revenues.
Operating Profit
Operating profit in 2019 stood at US$ 124.4 million in 2019, up 75% year-on-year from US$ 71 million in
2018.
The Group’s EBITDA recorded a 91% year-on-year increase to US$ 193 million in 2019 from US$ 101.1
million in 2018, while EBITDA margin stood at 41% in 2019 versus 49% in the previous year. The EBITDA
margin contraction was due to a growing contribution from the increased onshore drilling and workover
activities in KSA, Algeria and Kuwait and the appreciation of the Egyptian pound experienced during 2019.
Net Finance Charges
Reported ADES’ finance charges reached US$ 88.7 million in 2019, a 184% increase from the US$ 31.2
million recorded in 2018. Higher finance charges during 2019 were related to the below one-off finance
charges and the new banking facilities secured by the Group and the successful issuance of the Group’s five-
year bond which provided additional liquidity, headroom and financial flexibility. Additionally, to support
business growth post acquisition, ADES replaced the Letters of Guarantee associated with the Weatherford
rigs.
The normalised finance charge was US $61.1 million. This excludes one off finance charges related to loan
fees and written off prepaid transaction costs amounting to US$ 27.6 million.
Meanwhile, the Group had finance income of US$ 0.5million in 2019 leading to a net finance charge of US$
88.2 million.
Statutory and Normalised Net Profit
Normalised net profit, before non-controlling interest, was US$ 72.7 million in 2019. This represents an
increase of 63% year-on-year from a normalised net profit of US$ 44.7 million in 2018. The normalised net

10 | ADES International Holding PLC
FY2019 FINAL RESULTS London | 7 April 2020
profit margin stood at 15.2% in 2019 which reflects the new business distribution following the acquisitions,
higher finance & depreciation charges during the year.
ADES' reported net profit after minority interest was US$ 28.6 million in 2019, a decrease of 61% year-on-
year from the US$ 72.9 million in 2018. The decrease was driven by significant non-recurring charges,
including:
• one off finance charges related to loan fees and written off prepaid transaction costs amounting to
US$ 27.6 million;
• accounting adjustments stemming from IFRS 3 (Business Combinations) and a bargain purchase
gain of US$ 11.9 million;
• non-cash, equity-settled share-based payment compensation from the Parent Company of US$ 11.3
million;
• non-cash fair-value adjustment gain under financial instruments of US$ 0.8 million;
• non-recurring transaction costs of US$ 6.4 million;
• non-recurring integration program costs US$ 8.5 million.
Balance Sheet
Assets
Total assets stood at US$ 1.43 billion as of 31 December 2019, representing a US$ 32% million increase
from the US$ 1.08 billion at year-end 2018. Net fixed assets closed at US$ 987 million as of 31 December
2019, an increase of US$ 266 million from the previous year’s close of US$ 721 million. This increase was
largely driven by the consolidation of newly acquired assets under the Weatherford transaction in Algeria and
Iraq, in addition to the capital expenditure related to four rigs in Kuwait and the two newly built rigs for KSA.
Net accounts receivable stood at US$ 130.7 million as of 31 December 2019, up from US$ 100.8 million as
at 31 December 2018. The increase was mainly due to the significant growth in revenues in 2019. However,
it must be noted that, as a whole, the Group witnessed a noticeable improvement in average collection rates
compared to 2018, as result of a better geographical diversification of the business. Egypt’s average
collection days experienced modest improvements but remained relatively high primarily due to one client
that is yet to reach production capacity on its drilling programme.
Liabilities
ADES’ total liabilities stood at US$ 978.8 million as of 31 December 2019, up from US$ 663.2 million as at
year-end 2018. The Group's total interest-bearing loans and borrowings grew by US$ 163.9 million from the
US$ 555.3 million as of 31 December 2018 to the US$ 719.2 million at the end of 2019. This included the
issuance of the Group’s first five-year bond for a total value of US$ 325 million, which was used to refinance
the US$ 450 million syndicated facility secured in March 2018 as ADES worked to optimise its capital
structure.
During the year, ADES also secured a US$ 144 million top-up to its Alinma facility to fund operational growth,
of which US$ 80 million were utilised during 2019. In addition, the Group secured a US$ 80 million long term
loan facility from National Commercial Bank, which was drawdown and available in cash balance as of 31
December 2019.
Net debt increased to US$ 606.2 million (on a pre-IFRS16 basis) as of 31 December 2019, compared to US$
424.4 million as of 31 December 2018, reflecting the increase in interest-bearing loans and borrowings to
finance a period of investment, including the purchase of two new-build land rigs in KSA, capital expenditures
related to upgrade works on several of ADES' rigs and the completion of the Weatherford acquisition in
Algeria and Southern Iraq.

11 | ADES International Holding PLC
FY2019 FINAL RESULTS London | 7 April 2020
Total re-payment of US$ 60 million during 2020, when the grace period for Saudi-based loans expires.
Cash Flow
Cash Flow by Activity
(US$ '000) 2019 2018 % change
Cash Flow from Operating Activities 171,971 51,199 236%
Net Cash Flow Used in Investing Activities (256,228) (379,396) -32%
Net Cash Flows from Financing Activities 72,983 311,307 -77%
Cash Flow from Operating Activities
In 2019 cash flow from operating activities was US$ 171.9 million, compared to US$ 51.2 million as at 31
December 2018, representing a strong 236% increase year-on-year, on the back of the significant increase
in operating rigs in 2019. Additionally, the Group more efficiently managed working capital primarily due to
the expanded presence in Kuwait and KSA who have faster payment terms.
Net Cash Flow Used in Investing Activities
Net cash flow used in investing activities stood at US$ 256 million in 2019, 32% lower year-on-year. The
reduction follows the significant growth capital expenditure deployed in 2018 related to the successful
completion of the Weatherford transaction in KSA and Kuwait, amounting to US$ 215.5 million, as well as
the US$ 83 million related to the acquisition of the three Nabors rigs. In 2019, capital expenditure stood at
US$ 256 million attributed to the acquisition of the Algerian and South Iraqi land rigs from Weatherford;
investment to purchase two new-build land rigs for KSA; and spend to upgrade ADES's rigs of. The Group
expects lower levels of capital expenditure in 2020, after successfully completing the acquisitions and related
capital expenditure over the course of 2018 and 2019.
Net Cash Flow from Financing Activities
Net cash flows from financing activities stood at US$ 73 million in 2019, down 77% compared to US$ 311
million in the year ended 31 December 2018. The cash from financing activities during 2019 represents
utilisation of overdraft facilities of US$ 22.5 million; utilisation of US$ 325 million bond proceeds to refinance
US$ 337.9 million of the Group’s syndicated facility secured in March 2018; and utilisation of US$ 80 million
from the Alinma facility to fund operational growth. Additionally, ADES drew down the US$ 80 million NCB
facility which is available in cash balances as at 31 December 2019. This was partial offset by the principal
re-payment of the syndication facility of US$ 7.5 million.
Interest and finance lease liabilities paid during the period amounted to US$ 63.2 million. Furthermore, the
group bought US$ 3.5 million worth of treasury stock as part of the announced share buyback program.
The Group has a total loan repayment of approximately US$ 60 million in 2020 and targets a net leverage
ratio at 2.5x to 3x.
Principal Risks and Uncertainties
As in any company, ADES is exposed to risks and uncertainties that may adversely affect its performance.
The Board and senior management agree that the principal risks and uncertainties facing the Group include
political and economic situation in Egypt, Algeria, Kuwait and KSA and the rest of the Middle East and North
Africa region, foreign currency supply and associated risks, changes in regulation and regulatory actions,

12 | ADES International Holding PLC
FY2019 FINAL RESULTS London | 7 April 2020
environmental and occupational hazards, failure to maintain the Group's high quality standards and
accreditations, failure to retain or renew contracts with clients, failure to recruit and retain skilled personnel
and senior management, pricing pressures and decreased business activity in the oil and gas industry,
among others.
Additionally, following the current reporting period the spread of the global Covid-19 pandemic has led to
wide economic disruptions, while recent global developments in oil supply starting March 2020 has caused
further uncertainty in commodity markets. This may adversely impact future financial results, earnings and
cash flow for all businesses including ADES. The Group is also exposed to specific risks posed by the Covid-
19 pandemic, including, but not limited to, risk of infection among its employees, operational disruption in the
case of infection on the Group’s rigs, supply-chain related risks and the ability to acquire necessary materials
and failure to mobilise crew due to travel restrictions and lockdowns.
Going Concern The Directors are satisfied that the Group has sufficient resources to continue in operation for the foreseeable
future, a period of not less than 12 months from the date of this report. Accordingly, the Directors continue to
adopt the going concern basis in preparing the condensed financial statements. The Group’s Financial
Statements for the full year ended 31 December 2019 are available on the Group’s website at
investors.adihgroup.com
Statement of Directors' Responsibilities
Each of the Directors confirms that, to the best of their knowledge:
• The preliminary financial information, which has been prepared in accordance with International
Financial Reporting Standards (“IFRS”), give a true and fair view of the assets, liabilities, financial
position and profit or loss of the Group; and
• The preliminary announcement includes a fair summary of the development and performance of the
business and the position of the Group.
After making enquiries, the Directors considered it appropriate to adopt the going concern basis in preparing
the consolidated financial statements.
A list of current directors of the Company is maintained on the Group’s website at investors.adihgroup.com.
On behalf of the Board
Dr. Mohamed Farouk
Chief Executive Officer

13 | ADES International Holding PLC
FY2019 FINAL RESULTS London | 7 April 2020
Terms and Definitions
EBITDA - Operating profit for the year before depreciation and amortisation, employee benefit provision and
other provisions and impairment of assets under construction.
Normalised Net profit– Reported net profit excluding a one-off bargain purchase gain on acquisitions,
transactions expenses and prepaid transaction costs written off due to refinancing and arrangement fees
related to loans utilised to finance the business acquisitions.
Backlog - means the total amount payable to the Group during the remaining term of an existing contract
plus any optional client extension provided for in such contract, assuming the contracted rig will operate (and
thus receive an operating day rate) for all calendar days both in the remaining term and in the optional
extension period.
GCC – Gulf Cooperation Council.
MENA – The Middle East and North Africa.
MOPU – Mobile Operating Production Unit.
Recordable Injury Frequency Rate (RIFR) – The number of fatalities, lost time injuries, cases or substitute
work and other injuries requiring medical treatment by a medical professional per 200,000 working hours.
KSA –The Kingdom of Saudi Arabia.
Utilisation Rate –refers to our measure of the extent to which our assets under contract and available in the
operational area are generating revenue under client contracts. We calculate our utilisation rate for each rig
by dividing Utilisation Days by Potential Utilisation days under a contract. Utilisation rates are principally
dependent on our ability to maintain the relevant equipment in working order and our ability to obtain
replacement and other spare parts. Because our measure of utilisation does not include rigs that are stacked
or being refurbished or mobilised, our reported utilisation rate does not reflect the overall utilisation of our
fleet, only of our operational, contracted rigs.
Gross Debt – Total interest-bearing loans and borrowings.
Net Debt – Total gross debt minus cash and cash equivalents.

14 | ADES International Holding PLC
FY2019 FINAL RESULTS London | 7 April 2020
ADES International Holding PLC
(formerly “ADES International
Holding Ltd”)
and its Subsidiaries
CONSOLIDATED FINANCIAL STATEMENTS 31 December 2019

15 | ADES International Holding PLC
FY2019 FINAL RESULTS London | 7 April 2020
CONSOLIDATED STATEMENT OF COMPREHENSIVE INCOME For the year ended 31 December 2019
USD Notes 2019 2018 Restated*
Revenue from contract with customers 7 477,757,547 205,563,390
Cost of revenue 8 (285,728,112) (107,593,582)
GROSS PROFIT 192,029,435 97,969,808
General and administrative expenses 9 (52,463,669) (23,971,369)
End of service provision 22 (4,899,967) (1,309,036)
Release / (provision) for impairment of trade receivables 15 2,776,252 (1,250,607)
Provision for impairment of inventory 14 (253,329) -
Share-based payments expense 24 (11,341,219) -
Other provisions 22 (1,443,181) (280,017)
OPERATING PROFIT 124,404,322 71,158,779
Finance costs 10 (88,702,079) (31,233,612)
Finance income 13 512,013 2,738,844
Bargain purchase gain 6 11,877,674 46,252,908
Business acquisition transaction costs (6,432,718) (5,617,088)
Other income 1,786,501 912,550
Other taxes (438,716) (295,960)
Other expenses (2,907,204) (2,515,532)
Fair value gain (loss) on derivative financial instrument held for trade 31 771,134 (4,340,180)
PROFIT FOR THE YEAR BEFORE INCOME TAX 40,870,927 77,060,709
Income tax expense 11 (9,337,365) (3,788,784)
PROFIT FOR THE YEAR 31,533,562 73,271,925
Attributable to:
Equity holders of the Parent 28,630,013 72,892,277
Non-controlling interests 2,903,549 379,648
31,533,562 73,271,925
Earnings per share - basic and diluted attributable to equity holders of the Parent (USD per share)
26 0.65 1.69
OTHER COMPREHENSIVE INCOME Other comprehensive income that may be reclassified to
profit or loss in subsequent periods (net of any tax)
Net loss on cash flow hedge 31 (6,147,575) -
OTHER COMPREHENSIVE INCOME FOR THE YEAR, NEXT OF TAX (6,147,575) -
TOTAL COMPREHENSIVE INCOME FOR THE YEAR, NET OF TAX 25,385,987 73,271,925
Attributable to:
Equity holders of the Parent 22,482,438 72,892,277
Non-controlling interests 2,903,549 379,648
25,385,987 73,271,925
*Comparative information has been adjusted to reflect the IFRS 3 Business combination measurement period adjustments, refer to note 4.
The accompanying notes 1 to 33 form an integral part of these consolidated financial statements.

16 | ADES International Holding PLC
FY2019 FINAL RESULTS London | 7 April 2020
CONSOLIDATED STATEMENT OF FINANCIAL POSITION At 31 December 2019
USD Notes 2019 2018 Restated*
ASSETS Non-current assets Property and equipment 17 987,216,314 727,339,267 Right of use assets 2.2 23,422,290 - Intangible assets 18 347,304 456,189 Investment in an associate and a joint venture 12 4,140,576 2,184,382 Trade receivables 15 38,947,290 - Other non-current assets 2,858,310 1,202,586
Total non-current assets 1,056,932,084 731,182,424
Current assets Inventories 14 44,820,164 32,672,320 Trade receivables 15 91,780,792 100,757,512 Contract assets 15 41,541,310 36,369,649 Due from related parties 27 4,740,918 377,345 Prepayments and other receivables 16 72,150,555 52,383,093 Bank balances and cash 13 119,601,159 130,875,239
Total current assets 374,634,898 353,435,158
Total assets 1,431,566,982 1,084,617,582
EQUITY AND LIABILITIES Equity Share capital 23 43,793,882 43,793,882 Share premium 23 178,746,337 178,746,337 Merger reserve 1, 25 (6,520,807) (6,520,807) Legal reserve 25 6,400,000 6,400,000 Share-based payments reserve 24 11,341,219 - Treasury shares 23 (3,501,200) - Cash flow hedge reserve 25 (6,147,575) - Retained earnings 219,225,419 190,595,406
Equity attributable to equity holders of the Parent 443,337,275 413,014,818 Non–controlling interests 9,387,205 8,413,319
Total equity 452,724,480 421,428,137
Liabilities Non-current liabilities Loans and borrowings 20 322,354,493 510,010,564 Bonds payable 21 313,158,968 - Lease liabilities 2.2 13,316,152 5,391,573 Provisions 22 16,375,652 12,959,590 Derivative financial instrument 31 6,584,893 3,123,799 Deferred mobilization revenue 11,751,262 - Other non-current payables 10,988,839 -
Total non-current liabilities 694,530,259 531,485,526
Current liabilities Trade and other payables 19 196,329,456 83,298,424 Loans and borrowings 20 83,692,835 45,258,354 Provisions 22 1,100,000 1,874,654 Due to related parties 27 58,224 56,106 Derivative financial instrument 31 3,131,728 1,216,381
Total current liabilities 284,312,243 131,703,919
Total liabilities 978,842,502 663,189,445
TOTAL EQUITY AND LIABILITIES 1,431,566,982 1,084,617,582
*Comparative information has been adjusted to reflect the IFRS 3 Business combination measurement period
adjustments, refer to note 4.
The accompanying notes 1 to 33 form an integral part of these consolidated financial statements.

FY2019 FINAL RESULTS London | 7 April 2020
CONSOLIDATED STATEMENT OF CHANGES IN EQUITY For the year ended 31 December 2019
USD Share
capital Share
premium Merger reserve
Legal reserve
Share based payment reserve
Cash flow hedge
reserve Treasury
shares Retained earnings Total
Non-controlling
interests Total
Equity
Balance at 1 January 2019 43,793,882 178,746,337 (6,520,807) 6,400,000 - - - 190,595,406 413,014,818 8,413,319 421,428,137
Dividends (Note 32) - - - - - - - - - (1,934,284) (1,934,284)
Profit for the year - - - - - - - 28,630,013 28,630,013 2,903,549 31,533,562
Other comprehensive income for the year
- - - - - (6,147,575) - - (6,147,575) - (6,147,575)
Total comprehensive income for the year
- - - - - (6,147,575) - 28,630,013 22,482,438 2,903,549 25,385,987
Treasury Shares (Note 23) - - - - - - (3,501,200) - (3,501,200) - (3,501,200)
Investment in a subsidiary - - - - - - - - - 4,621 4,621
Share-based payments (Note 24) - - - - 11,341,219 - - - 11,341,219 - 11,341,219
Balance at 31 December 2019 43,793,882 178,746,337 (6,520,807) 6,400,000 11,341,219 (6,147,575) (3,501,200) 219,225,419 443,337,275 9,387,205 452,724,480
Balance at 1 January 2018 42,203,030 158,224,346 (6,520,807) 6,400,000 - - - 117,703,129 318,009,698 - 318,009,698
Profit for the year, restated* - - - - - - - 72,892,277 72,892,277 379,648 73,271,925
Other comprehensive income for the year
- - - - - - - - - - -
Total comprehensive income for the year
- - - - - - - 72,892,277 72,892,277 379,648 73,271,925
Share capital issued (Note 6, 23) 1,590,852 - - - - - - - 1,590,852 - 1,590,852
Share premium (Note 6, 23) - 20,521,991 - - - - - - 20,521,991 - 20,521,991
Acquisition of a subsidiary, restated* (Note 6)
- - - - - - - - - 8,033,671 8,033,671
Balance at 31 December 2018, restated*
43,793,882 178,746,337 (6,520,807) 6,400,000 - - - 190,595,406 413,014,818 8,413,319 421,428,137
*Comparative information has been adjusted to reflect the IFRS 3 Business combination measurement period adjustments, refer to note 4.
The accompanying notes 1 to 33 form an integral part of these consolidated financial statements.

18 | ADES International Holding PLC
FY2019 FINAL RESULTS London | 7 April 2020
CONSOLIDATED STATEMENT OF CASH FLOWS For the year ended 31 December 2019
USD Notes 2019 2018 Restated*
OPERATING ACTIVITIES
Profit for the year before income tax 40,870,927 77,060,709 Adjustments for: Depreciation of property and equipment 17 45,555,024 28,200,128 Amortisation of intangible assets 18 121,861 122,547 Amortisation of right of use assets 2.2 5,348,361 - (Release) / provision for impairment of trade receivables and contract assets
15 (2,776,252) 1,250,607
Provision for impairment of inventory 14 253,329 - End of services provision 22 4,899,967 1,309,036 Share-based payments expense 24 11,341,219 - Other provisions 22 1,443,181 280,017 Interest on loans and borrowings 10 88,702,079 31,233,612 Finance income 13 (512,013) (2,738,844) Other income (527,344) (678,168) Bargain purchase gain 6 (11,877,674) (46,252,908) Share of results of investment in a joint venture and associate
12 (774,898) (234,382)
Fair value loss on derivative financial instrument 31 (771,134) 4,340,180
Cash from operations before working capital changes 181,296,633 93,892,534 Inventories (4,692,539) 1,436,399 Trade receivables (33,371,207) (24,482,911) Contract assets (5,171,661) (36,369,649) Due from related parties (4,363,573) (71,729) Prepayments and other receivables (24,493,097) 13,605,597 Trade and other payables 69,304,116 8,781,106 Due to related parties 2,118 (2,211,238)
Cash flows from operations 178,510,790 54,580,109 Income tax paid 11 (2,837,570) (3,036,313) Provisions paid 22 (3,701,740) (344,160)
Net cash flows from operating activities 171,971,480 51,199,636
INVESTING ACTIVITIES
Purchase of intangible assets 18 - (12,788) Purchase of property and equipment** (179,326,324) (93,682,762) Acquisitions of subsidiaries and new rigs (76,237,278) (277,639,472) Interest received 512,013 2,738,844 Movement in escrow account 13 - (10,800,000) Investment in joint venture (1,181,295) - Proceeds from non-controlling interest share of capital at establishment date
4,621 -
Net cash flows used in investing activities (256,228,263) (379,396,178)
FINANCING ACTIVITIES
Proceeds from loans and borrowings* 179,493,220 602,871,261 Repayment of loans and borrowings (351,018,420) (238,038,447) Proceeds from bond issuance 325,000,000 - Payments of loan/bonds transaction costs* (11,841,033) (33,566,505) Purchase of Treasury shares 23 (3,501,200) - Interest paid (56,269,830) (19,958,945) Payment of lease liabilities 2.2 (6,945,750) - Dividend Payments 23 (1,934,284) -
Net cash flows from financing activities 72,982,703 311,307,364
Net (decrease)/ increase in cash and cash equivalents (11,274,080) (16,889,178) Cash and cash equivalents at the beginning of the year 13 130,875,239 136,964,417
CASH AND CASH EQUIVALENTS AT THE END OF THE YEAR 13 119,601,159 120,075,239
* For the year ended 31 December 2018, net of “proceeds from loans and borrowings” and “payments of loan transaction costs” represent “borrowings drawn during the year” amounting to USD 569,304,756 as disclosed in Note 20. ** Purchase of property and equipment excludes non-cash transactions amounting to USD 59,557,548. The accompanying notes 1 to 33 form an integral part of these consolidated financial statements.

19 | ADES International Holding PLC
FY2019 FINAL RESULTS London | 7 April 2020
1 BACKGROUND 1.1 Corporate information ADES International Holding PLC (the “Company” or the “Parent Company”) was incorporated and registered in the Dubai International Financial Centre (DIFC) on 22 May 2016 with registered number 2175 under the Companies Law – DIFC Law No. 2 of 2009 (and any regulations thereunder) as a private company limited by shares. The Company’s shares are listed on the Main Market of the London Stock Exchange. The Company’s name has changed from ADES International Holding Ltd to ADES International Holding PLC during 2019. The Company’s registered office is at level 5, Index tower, Dubai International Financial Centre, PO Box 507118, Dubai, United Arab Emirates. The principal business activity of the Company is to act as a holding company and managing office. The Company and its subsidiaries (see below) constitute the Group (the “Group”). The Company is owned by ADES Investments Holding Ltd., a company incorporated on 22 May 2016 under the Companies Law, DIFC Law no. 2 of 2009,. which is the majority shareholder and ultimate controlling party. The consolidated financial statements were authorised for issue on 1 April 2020 by the Board of Directors. The Group is a leading oil and gas drilling and production services provider in the Middle East and Africa. The Group services primarily include offshore and onshore contract drilling and production services. The Group currently operates in Egypt, Algeria, Kuwait and the Kingdom of Saudi Arabia. The Group’s offshore services include drilling and workover services and Mobile Offshore Production Unit (MOPU) production services, as well as accommodation, catering and other barge-based support services. The Group’s onshore services primarily encompass drilling and work over services. The Group also provides projects services (outsourcing various operating projects for clients, such as maintenance and repair services). The consolidated financial statements of the Group include activities of the following main subsidiaries:
Name
Principal activities
Country of incorporation
% equity interest
2019 2018
Advanced Energy Systems (ADES) (S.A.E)** Oil and gas drilling and production services Egypt 100% 100% Precision Drilling Company*** Holding company Cyprus 100% - Kuwait Advanced Drilling Services Leasing of rigs Cayman 100% - Prime innovations for Trade S.A.E Trading Egypt 100% - ADES International for Drilling Leasing of rigs Cayman 100% - ADES-GESCO Training Academy Training Egypt 70% - Advanced Transport Services Leasing of transportation equipment Cayman 100% - Advanced Drilling Services Trading Cayman 100% -
** Advanced Energy Systems (ADES) (S.A.E) has branches in the Kingdom of Saudi Arabia and Algeria.
*** Precision Drilling Company holds a 47.5% interest in United Precision Drilling Company W.L.L, a Kuwait entity
which handles the operations of the rigs in Kuwait.
The Company holds investment in Egyptian Chinese Drilling Company (ECDC) (joint venture) and ADVantage for
Drilling Services Company (associate) which are accounted for using the equity method of accounting in these
consolidated financial statements.
In 2016, pursuant to a reorganisation plan (the “Reorganisation”) the ultimate shareholders of the Subsidiary:
(i) established the Company as a new holding company with share capital of USD 1,000,000 and made an
additional capital contribution of USD 30,900,000 for additional shares that were allotted on 23 March 2018. No such
reorganisations took place in 2019 and 2018.
(ii) transferred their shareholdings in Advanced Energy System (ADES), S.A.E., to the Company for a total
consideration of USD 38,520,807 comprising of cash of USD 29,710,961 and the assumption of shareholder obligation
of USD 8,809,846.

20 | ADES International Holding PLC
FY2019 FINAL RESULTS London | 7 April 2020
2 SIGNIFICANT ACCOUNTING POLICIES 2.1 BASIS OF PREPARATION The consolidated financial statements have been prepared under the historical cost basis, except for derivative financial instrument carried at fair value which includes interest rate swap contracts classified as held-for-trading and those designated as hedging instrument. Historical cost is generally based on the fair value of the consideration given in exchange for goods and services. The Group’s financial statements have been prepared in accordance with International Financial Reporting Standards (IFRS) as issued by the International Accounting Standards Board (IASB) and applicable requirements of the Companies Law pursuant to DIFC Law No. 5 of 2019.
The consolidated financial statements are presented in United States Dollars (“USD”), which is the functional currency of the Parent Company and the presentation currency for the Group.
Basis of consolidation The Group’s consolidated financial statements comprise the financial statements of the Parent Company and its subsidiaries as at 31 December 2019. Control is achieved when the Group is exposed, or has rights, to variable returns from its involvement with the investee and has the ability to affect those returns through its power over the investee. Specifically, the Group controls an investee if, and only if, the Group has: (a) Power over the investee (i.e. existing rights that give it the current ability to direct the relevant activities of the
investee) (b) Exposure, or rights, to variable returns from its involvement with the investee, and (c) The ability to use its power over the investee to affect its returns Generally, there is a presumption that a majority of voting rights results in control. To support this presumption and when the Group has less than a majority of the voting or similar rights of an investee, the Group considers all relevant facts and circumstances in assessing whether it has power over an investee, including: (a) The contractual arrangement with the other vote holders of the investee (b) Rights arising from other contractual arrangements (c) The Group’s voting rights and potential voting rights The Group re-assesses whether or not it controls an investee if facts and circumstances indicate that there are changes to one or more of the three elements of control. Consolidation of a subsidiary begins when the Group obtains control over the subsidiary and ceases when the Group loses control of the subsidiary. Assets, liabilities, income and expenses of a subsidiary acquired or disposed of during the year are included in the consolidated financial statements from the date the Group gains control until the date the Group ceases to control the subsidiary. Profit or loss and each component of other comprehensive income (OCI) are attributed to the equity holders of the Parent Company and to the non-controlling interests, even if this results in the non-controlling interests having a deficit balance. When necessary, adjustments are made to the consolidated financial statements of a member in the Group to bring its accounting policies in line with the Group’s accounting policies. All intra-group assets and liabilities, equity, income, expenses and cash flows relating to transactions between members of the Group are eliminated in full on consolidation. Subsidiaries are fully consolidated from the date of acquisition or incorporation, being the date on which the Group obtains control, and continue to be consolidated until the date when such control ceases. The Consolidated financial statements of the subsidiaries are prepared for the same reporting period as the Group, using consistent accounting policies. A change in the ownership interest of a subsidiary, without a loss of control, is accounted for as an equity transaction. If the Group loses control over a subsidiary, it:
- Derecognises the assets (including goodwill) and liabilities of the subsidiary - Derecognises the carrying amount of any non-controlling interests - Derecognises the cumulative translation differences recorded in equity - Recognises the fair value of the consideration received - Recognises the fair value of any investment retained - Recognises any surplus or deficit in profit or loss

21 | ADES International Holding PLC
FY2019 FINAL RESULTS London | 7 April 2020
- Reclassifies the parent’s share of components previously recognised in OCI to profit or loss or retained earnings, as appropriate, as would be required if the Group had directly disposed of the related assets or liabilities
Business combinations and acquisition of non-controlling interests Business combinations are accounted for using the acquisition method. The cost of an acquisition is measured as the aggregate of the consideration transferred, which is measured at acquisition date fair value, and the amount of any non-controlling interests in the acquiree. For each business combination, the Group elects whether to measure the non-controlling interests in the acquiree at fair value or at the proportionate share of the acquiree’s identifiable net assets. Acquisition-related costs are expensed as incurred and included in the ‘administrative expenses’ line-item. When the Group acquires a business, it assesses the financial assets and liabilities assumed for appropriate classification and designation in accordance with the contractual terms, economic circumstances and pertinent conditions as at the acquisition date. This includes the separation of embedded derivatives in host contracts by the acquiree. Contingent consideration, resulting from business combinations, is measured at fair value at the acquisition date. Contingent consideration classified as equity is not remeasured and its subsequent settlement is accounted for within equity. Contingent consideration classified as an asset or liability that is a financial instrument and within the scope of IFRS 9 Financial Instruments, is measured at fair value with the changes in fair value recognised in profit or loss in accordance with IFRS 9. Other contingent consideration that is not within the scope of IFRS 9 is measured at fair value at each reporting date with changes in fair value recognised in profit or loss. Goodwill is initially measured at cost (being the excess of the aggregate of the consideration transferred and the amount recognised for non-controlling interests and any previous interest held over the net identifiable assets acquired and liabilities assumed). If the fair value of the net assets acquired is in excess of the aggregate consideration transferred, the Group re-assesses whether it has correctly identified all of the assets acquired and all of the liabilities assumed and reviews the procedures used to measure the amounts to be recognised at the acquisition date. If the reassessment still results in an excess of the fair value of net assets acquired over the aggregate consideration transferred, then the gain is recognised in profit or loss as a ‘bargain purchase gain’. After initial recognition, goodwill is measured at cost less any accumulated impairment losses. For the purpose of impairment testing, goodwill acquired in a business combination is, from the acquisition date, allocated to each of the Group’s cash-generating units that are expected to benefit from the combination, irrespective of whether other assets or liabilities of the acquiree are assigned to those units. Where goodwill has been allocated to a cash-generating unit (CGU) and part of the operation within that unit is disposed of, the goodwill associated with the disposed operation is included in the carrying amount of the operation when determining the gain or loss on disposal. Goodwill disposed in these circumstances is measured based on the relative values of the disposed operation and the portion of the cash-generating unit retained. A contingent liability recognised in a business combination is initially measured at its fair value. Subsequently, it is measured at the higher of the amount that would be recognised in accordance with the requirements for provisions in IAS 37 Provisions, Contingent Liabilities and Contingent Assets or the amount initially recognised less (when appropriate) cumulative amortisation recognised in accordance with the requirements for revenue recognition. Business combination involving entities under common control Transactions involving entities under common control where the transaction does not have any substance, the Group adopts the pooling of interest method. Under the pooling of interest method, the carrying value of assets and liabilities are used to account for these transactions. No goodwill is recognised as a result of the combination. The only goodwill recognised is any existing goodwill relating to either of the combining entities. Any difference between the consideration paid and the carrying value of net assets acquired is reflected as “Reserve” within equity. A number of factors are considered in evaluating whether the transaction has substance, including the following:
• the purpose of transaction;
• the involvement of outside parties in the transaction, such as non-controlling interests or other third parties;
• whether or not the transactions are conducted at fair values;
• the existing activities of the entities involved in the transaction; and
• whether or not it is bringing entities together into a “reporting entity” that did not exist before. Periods prior to business combination involving entities under common control are not restated.

22 | ADES International Holding PLC
FY2019 FINAL RESULTS London | 7 April 2020
Interest in joint ventures and associates An associate is an entity over which the Group has significant influence. Significant influence is the power to participate in the financial and operating policy decisions of the investee but is not control or joint control over those policies. A joint venture is a type of joint arrangement whereby the parties that have joint control of the arrangement have rights to the net assets of the joint venture. Joint control is the contractually agreed sharing of control of an arrangement, which exists only when decisions about the relevant activities require the unanimous consent of the parties sharing control. The considerations made in determining joint control are similar to those necessary to determine control over subsidiaries. The Group’s investments in the joint venture and associate are both accounted for using the equity method. Under the equity method, the investment is initially recognised at cost. The carrying amount of the investment is adjusted to recognise changes in the Group’s share of net assets of the investee since the acquisition date. Goodwill relating to the joint venture or associate is included in the carrying amount of the investment and is not tested for impairment separately. The consolidated profit or loss reflects the Group’s share of the results of operations of the joint venture and associate. Any change in the other comprehensive income (OCI) of those investees is presented as part of the Group’s OCI. In addition, when there has been a change recognised directly in the equity of the joint venture or associate, the Group recognises its share of any changes, when applicable, directly in the statement of changes in equity. Unrealised gains and losses resulting from transactions between the Group and the joint venture or associate are eliminated to the extent of the interest in the joint venture or associate unrelated to the Group. The aggregate of the Group’s share of profit or loss of a joint venture and associate is included in profit or loss on the face of the consolidated statement of comprehensive income outside operating profit and represents profit or loss after tax and non-controlling interests in the subsidiaries of the joint venture or associate. The financial statements of the joint venture and associate are prepared for the same reporting period as the Group. When necessary, adjustments are made to bring their accounting policies in line with those of the Group. After application of the equity method, the Group determines whether it is necessary to recognise an impairment loss on its investment in joint venture or associate. At each reporting date, the Group determines whether there is objective evidence that the investment in the joint venture or associate is impaired. If there is such evidence, the Group calculates the amount of impairment as the difference between the recoverable amount of the joint venture or associate and its carrying value, and then recognises the loss as ‘Share of profit of an associate and a joint venture’ in the consolidated statement of profit or loss. Upon loss of joint control over a joint venture or significant influence over an associate, the Group measures and recognises any retained investment at its fair value. Any difference between the carrying amount of the joint venture or associate upon loss of joint control or significant influence, and the fair value of the retained investment and proceeds from disposal is recognised in profit or loss. 2.2 CHANGES IN THE ACCOUNTING POLICIES AND DISCLOSURES (a) New and amended standards and interpretations became effective during the year
The Group applied for the first-time certain standards and amendments, which are effective for annual periods beginning on or after 1 January 2019. The Group has not early adopted any other standard, interpretation or amendment that has been issued but is not yet effective. The Group applies, for the first time, IFRS 16 Leases that requires restatement of previous financial statements. As required by IAS 34, the nature and effect of these changes are disclosed below.
IFRS 16 Leases IFRS 16 supersedes IAS 17 Leases, IFRIC 4 Determining whether an Arrangement contains a Lease, SIC-15 Operating Leases-Incentives and SIC-27 Evaluating the Substance of Transactions Involving the Legal Form of a Lease. The standard sets out the principles for the recognition, measurement, presentation and disclosure of leases and requires lessees to account for most leases under a single on-balance sheet model.

23 | ADES International Holding PLC
FY2019 FINAL RESULTS London | 7 April 2020
Lessor accounting under IFRS 16 is substantially unchanged from IAS 17. Lessors will continue to classify leases as either operating or finance leases using similar principles as in IAS 17. Therefore, IFRS 16 did not have an impact for leases where the Group is the lessor. As a lessee, the Group adopted IFRS 16 using the modified retrospective approach. Application of this approach resulted in no difference being recognised in retained earnings on the date of initial application of the standard as the amount at which the right of use assets is initially recognised was the same as that of the lease liability. The Group elected to use the transition practical expedient allowing the standard to be applied only to contracts that were previously identified as leases applying IAS 17 and IFRIC 4 at the date of initial application. The Group also elected to use the recognition exemptions for lease contracts that, at the commencement date, have a lease term of 12 months or less and do not contain a purchase option (‘short-term leases’), and lease contracts for which the underlying asset is of low value (‘low-value assets’). The effect of adoption of IFRS 16 is as follows: Impact on the statement of financial position (increase/(decrease)) as at 1 January 2019:
USD Assets Right-of-use assets 18,604,345 Liabilities Finance lease liabilities 18,809,704 Accruals (205,359)
a.1) Nature of the effect of adoption of IFRS 16 The Group has lease contracts for various items of property and equipment. Before the adoption of IFRS 16, the Group classified each of its leases (as a lessee) at the inception date as either a finance lease or an operating lease. A lease was classified as a finance lease if it transferred substantially all of the risks and rewards incidental to ownership of the leased asset to the Group; otherwise it was classified as an operating lease. Finance leases were capitalised at the commencement of the lease at the inception date fair value of the leased property or, if lower, at the present value of the minimum lease payments. Lease payments were apportioned between interest (recognised as finance costs) and reduction of the lease liability. In an operating lease, the leased property was not capitalised, and the lease payments were recognised as rent expense in profit or loss on a straight-line basis over the lease term. Any prepaid rent and accrued rent were recognised under Prepayments and Trade and other payables, respectively. Upon adoption of IFRS 16, the Group applied a single recognition and measurement approach for all leases in which it is the lessee, except for short-term leases and leases of low-value assets. The Group recognised lease liabilities to make lease payments and right-of-use assets representing the right to use the underlying assets. Leases previously classified as finance leases The Group did not change the initial carrying amounts of recognised assets and liabilities at the date of initial application for leases previously classified as finance leases (i.e., the right-of-use assets and lease liabilities equal the lease assets and liabilities recognised under IAS 17). The requirements of IFRS 16 was applied to these leases from 1 January 2019. Leases previously accounted for as operating leases The Group recognised right-of-use assets and lease liabilities for those leases previously classified as operating leases, except for short-term leases and leases of low-value assets. The right-of-use assets for most leases were recognised based on the carrying amount as if the standard had always been applied, apart from the use of incremental borrowing rate at the date of initial application. In some leases, the right-of-use assets were recognised based on the amount equal to the lease liabilities, adjusted for any related prepaid and accrued lease payments previously recognised. Lease liabilities were recognised based on the present value of the remaining lease payments, discounted using the incremental borrowing rate at the date of initial application. The Group also applied the available practical expedients wherein it:
• Used a single discount rate to a portfolio of leases with reasonably similar characteristics
• Relied on its assessment of whether leases are onerous immediately before the date of initial application
• Applied the short-term leases exemptions to leases with lease term that ends within 12 months at the date of initial application
• Excluded the initial direct costs from the measurement of the right-of-use asset at the date of initial application
• Used hindsight in determining the lease term where the contract contains options to extend or terminate the lease

24 | ADES International Holding PLC
FY2019 FINAL RESULTS London | 7 April 2020
a. 2) Summary of new accounting policies Set out below are the new accounting policies of the Group upon adoption of IFRS 16: Right-of-use assets The Group recognises right-of-use assets at the commencement date of the lease (i.e., the date the underlying asset is available for use). Right-of-use assets are measured at cost, less any accumulated depreciation and impairment losses, and adjusted for any remeasurement of lease liabilities. The cost of right-of-use assets includes the amount of lease liabilities recognised, initial direct costs incurred, and lease payments made at or before the commencement date less any lease incentives received. Unless the Group is reasonably certain to obtain ownership of the leased asset at the end of the lease term, the recognised right-of-use assets are depreciated on a straight-line basis over the shorter of its estimated useful life and the lease term. Right-of-use assets are subject to impairment. Lease liabilities At the commencement date of the lease, the Group recognises lease liabilities measured at the present value of lease payments to be made over the lease term. The lease payments include fixed payments (including in-substance fixed payments) less any lease incentives receivable, variable lease payments that depend on an index or a rate, and amounts expected to be paid under residual value guarantees. The lease payments also include the exercise price of a purchase option reasonably certain to be exercised by the Group and payments of penalties for terminating a lease, if the lease term reflects the Group exercising the option to terminate. The variable lease payments that do not depend on an index or a rate are recognised as expense in the period on which the event or condition that triggers the payment occurs. In calculating the present value of lease payments, the Group uses the incremental borrowing rate at the lease commencement date if the interest rate implicit in the lease is not readily determinable. After the commencement date, the amount of lease liabilities is increased to reflect the accretion of interest and reduced for the lease payments made. In addition, the carrying amount of lease liabilities is remeasured if there is a modification, a change in the lease term, a change in the in-substance fixed lease payments or a change in the assessment to purchase the underlying asset. Short-term leases and leases of low-value assets The Group applies the short-term lease recognition exemption to its short-term leases of machinery and equipment (i.e., those leases that have a lease term of 12 months or less from the commencement date and do not contain a purchase option). It also applies the lease of low-value assets recognition exemption to leases of office equipment that are considered of low value (i.e., below USD 5,000). Lease payments on short-term leases and leases of low-value assets are recognised as expense on a straight-line basis over the lease term. An interest rate of (Egypt 16.5%, KSA 3.35%, Algeria 8%, Kuwait 5.75% and UAE 2.75%) was used in discounting the lease payments and measuring the lease liabilities recognised in the consolidated statement of financial position as of 1 January 2019, as this is the weighted average of the lessee-entity’s incremental borrowing rate at that date (date of initial application of IFRS 16). a.3) Right of use assets and lease liabilities recognised in the statement of financial position and comprehensive income Set out below, are the carrying amounts of the Group’s right-of-use assets and lease liabilities and the movements during the period: Set out below are the carrying amounts of right-of-use assets recognised and the movements during the year:
Yards and Warehouse
Office Premises
Motor Vehicles
Other Equipment Building Total
As at 1 January 2019* 3,251,013 1,105,574 1,915,524 12,332,234 6,622,148 25,226,493
Additions 1,578,114 - - - 1,966,044 3,544,158
Depreciation Exp. (1,224,677) (256,292) (678,170) (3,189,222) - (5,348,361)
As at 31 December 2019 3,604,450 849,282 1,237,354 9,143,012 8,588,192 23,422,290

25 | ADES International Holding PLC
FY2019 FINAL RESULTS London | 7 April 2020
Set out below are the carrying amounts of lease liabilities and the movements during the year:
USD 2019 2018
As at 1 January* 24,769,237 -
Additions** 2,909,853 6,622,148
Accretion of interest 1,376,722 -
Payments (6,945,750) (662,615)
As at 31 December 22,110,062 5,959,533
Current 8,793,910 567,960
Non-Current 13,316,152 5,391,573
*The beginning balances of right-of-use asset and lease liabilities include the office premises of the Group amounting
to USD 6,622,148 and USD 5,959,533, respectively, which were accounted for as a finance lease in the prior year.
**we have capitalized the amount of USD 634,0305 in building leased assets.
The Group had total cash outflows for leases of USD 6,945,750 in 2019 (2018: USD 662,615). The Group also had non-
cash additions to right-of-use assets and lease liabilities of 3,544,158 in 2019 (2018: USD 6,622,148).
The following are the amounts recognised in the statement of comprehensive income:
USD 2019 2018 Depreciation expense of right-of-use assets 5,348,361 - Interest expense on lease liabilities 1,376,722 - Expense relating to short-term leases (included in Cost of revenue) 1,667,506 495,012 Expense relating to short-term lease (included in General and administrative expenses)
1,011,096 1,022,968
Total amount recognised in the statement of comprehensive income 9,403,685 1,517,980
As of December 31, 2018, the Group had non-cancellable operating lease commitments of USD 218,556 as disclosed in note 27. Below is the reconciliation between the discounted value of these operating lease commitments using the incremental borrowing rate and the lease liabilities recognised in the consolidated statement of financial position at the date of initial application:
USD
Operating lease non-cancellable commitments as at 31 December 2018 218,556
Weighted average incremental borrowing rate as at 1 January 2019 7.27%
Discounted operating lease commitments as at 1 January 2019 217,607
Commitments relating to short-term leases (212,742)
Commitments relating to leases of low-value assets (886)
Discounted commitments relating to leases previously classified as finance leases 5,959,533
Discounted commitments relating to cancellable contracts 18,805,725
Lease liabilities as at 1 January 2019 24,769,237
Several other amendments and interpretations became effective as of 1 January 2019 and apply for the first time in 2019, but do not have an impact on the consolidated financial statements of the Group. These amendments and interpretations are summarised below:
• IFRIC Interpretation 23 Uncertainty over Income Tax Treatment
• Amendments to IFRS 9: Prepayment Features with Negative Compensation
• Amendments to IAS 19: Plan Amendment, Curtailment or Settlement
• Amendments to IAS 28: Long-term interests in associates and joint ventures
• Sale or contribution of Assets between an Investor and its Associates or Joint Ventures- Amendments to IFRS 10 and IAS 28
• Annual Improvements 2015-2017 Cycle o IFRS 3 Business Combinations - Previously held Interests in a joint operation o IFRS 11 Joint Arrangements - Previously held Interests in a joint operation

26 | ADES International Holding PLC
FY2019 FINAL RESULTS London | 7 April 2020
o IAS 12 Income Taxes - Income tax consequences of payments on financial instruments classified as equity
o IAS 23 Borrowing Costs - Borrowing costs eligible for capitalisation b) Standards, amendments and interpretations in issue but not effective The standards and interpretations that are issued, but not yet effective are disclosed below. These standards and interpretations will become effective for annual periods beginning on or after the dates as respectively mentioned there against. The Group intends to adopt these standards, if applicable, when they become effective.
• IFRS 17 Insurance Contracts (effective for annual reporting periods beginning on or after 1 January 2023);
• Amendments to IFRS 3 Business Combinations: Definition of a Business (effective for business combinations for which the acquisition date is on or after the beginning of the first annual reporting period beginning on or after 1 January 2020);
• Amendments to IAS 1 Presentation of Financial Statements and IAS 8 Accounting Policies, Changes in Accounting Estimates and Errors: Definition of Material (effective for annual reporting periods beginning on or after 1 January 2020); and
• Amendments to IFRS 10 Consolidated Financial Statements and IAS 28 Investments in Associates and Joint Ventures: Sale or Contribution of Assets between an Investor and its Associate or Joint Venture (effective date has not been decided yet by the IASB)
Management is in the process of carrying out impact-analysis to estimate the potential magnitude arising from the application of these Standards, Interpretations and Amendments on the Group consolidated financial statements at their mandatory initial application dates. Management does not currently anticipate any of the above Standards and Interpretations be early adopted by the Group - to the extent applicable - prior to their mandatory effective dates. 2.3 SUMMARY OF SIGNIFICANT ACCOUNTING POLICIES Current versus non-current classification The Group presents assets and liabilities in the consolidated statement of financial position based on current/non-current classification. An asset is current when it is:
• Expected to be realised or intended to be sold or consumed in the normal operating cycle;
• Held primarily for the purpose of trading;
• Expected to be realised within twelve months after the reporting period; or
• Cash or cash equivalent unless restricted from being exchanged or used to settle a liability for at least twelve months after the reporting period.
All other assets are classified as non-current. A liability is current when:
• It is expected to be settled in the normal operating cycle;
• It is held primarily for the purpose of trading;
• It is due to be settled within twelve months after the reporting period; Or
• There is no unconditional right to defer the settlement of the liability for at least twelve months after the reporting period.
The Group classifies all other liabilities as non-current. Revenue recognition The Group recognises revenue from contracts with customers based on a five-step model as set out in IFRS 15. Step 1. Identify contract(s) with a customer: A contract is defined as an agreement between two or more parties that
creates enforceable rights and obligations and sets out the criteria for every contract that must be met. Step 2. Identify performance obligations in the contract: A performance obligation is a promise in a contract with a
customer to transfer a good or service to the customer. Step 3 Determine the transaction price: The transaction price is the amount of consideration to which the Group expects
to be entitled in exchange for transferring promised goods or services to a customer, excluding amounts collected on behalf of third parties.

27 | ADES International Holding PLC
FY2019 FINAL RESULTS London | 7 April 2020
Step 4. Allocate the transaction price to the performance obligations in the contract: For a contract that has more than one performance obligation, the Group allocates the transaction price to each performance obligation in an amount that depicts the amount of consideration to which the Group expects to be entitled in exchange for satisfying each performance obligation.
Step 5. Recognise revenue when (or as) the Group satisfies a performance obligation. The Group satisfies a performance obligation and recognises revenue over time, if one of the following criteria is met: a) The Group’s performance does not create an asset with an alternate use to the Group and the Group has as an
enforceable right to payment for performance completed to date. b) The Group’s performance creates or enhances an asset that the customer controls as the asset is created or
enhanced. c) The customer simultaneously receives and consumes the benefits provided by the Group’s performance as the
Group performs. For performance obligations where one of the above conditions are not met, revenue is recognised at the point in time at which the performance obligation is satisfied. When the Group satisfies a performance obligation by delivering the promised goods or services it creates a contract-based asset on the amount of consideration earned by the performance. Where the amount of consideration received from a customer exceeds the amount of revenue recognised this gives rise to a contract liability. Revenue is measured at the fair value of the consideration received or receivable, taking into account contractually defined terms of payment and excluding taxes and duty. The Group assesses its revenue arrangements against specific criteria to determine if it is acting as principal or agent. Revenue is recognised to the extent it is probable that the economic benefits will flow to the Group and the revenue and costs, if applicable, can be measured reliably. Based on the assessment of the customer contracts, the Group has identified one performance obligation for each of its contracts and therefore revenue is recognised over time. Some of the customer contracts may include mobilization and demobilisation activities for which revenue, along with the related cost are amortised over the period of contract life from the date of the completion of mobilization activities. Dividends Revenue is recognised when the Group’s right to receive the payment is established, which is generally when shareholders approve the dividend. Interest income Interest income is recognised as the interest accrues using the effective interest rate method, under which the rate used exactly discounts, estimated future cash receipts through the expected life of the financial asset to the net carrying amount of the financial asset. Contract balances Contract assets A contract asset is the right to consideration in exchange of goods or services transferred to the customer. If the Group performs by transferring goods or services to a customer before the customer pays consideration or before payment is due, a contract asset is recognised for earned consideration that is conditional. Trade receivables A receivable represents the Group’s right to an amount of consideration that is unconditional (i.e., only the passage of time is required before the payment of the consideration is due). Refer to the accounting policies of financial assets in section financial instruments – initial recognition and subsequent measurement. Borrowing costs Borrowing costs directly attributable to the acquisition, construction or production of an asset that necessarily takes a substantial period of time to get ready for its intended use or sale are capitalised as part of the cost of the asset. All other borrowing costs are expensed in the period in which they incurred. Borrowing costs consist of interest and other costs that an entity incurs in connection with the borrowing of funds.

28 | ADES International Holding PLC
FY2019 FINAL RESULTS London | 7 April 2020
Cash and cash equivalents Cash and cash equivalents in the statement of financial position comprise cash at banks and on hand and short-term deposits with a maturity of three months or less, which are subject to an insignificant risk of changes in value. For the purpose of the consolidated statement of cash flows, cash and cash equivalents consist of cash and short-term deposits, as defined above. Income tax Current income tax assets and liabilities are measured at the amount expected to be recovered from or paid to the taxation authorities. The tax rates and tax laws used to compute the amount are those that are enacted or substantively enacted, at the reporting date in the countries where the Group operates and generates taxable income. Management periodically evaluates positions taken in the tax returns with respect to situations in which applicable tax regulations are subject to interpretation and establishes provisions where appropriate. The Group is not subject to income tax in accordance with the Egyptian tax law (Egypt) and DIFC law (UAE). The Group’s branches and subsidiaries are subject to income tax and withholding tax in accordance to Kingdom of Saudi Arabia Law, Algeria Law, and Kuwait Law. Deferred tax Deferred tax is provided using the liability method on temporary differences between the tax bases of assets and liabilities and their carrying amounts for financial reporting purposes at the reporting date. Deferred tax liabilities are recognised for all taxable temporary differences, except:
• When the deferred tax liability arises from the initial recognition of goodwill or an asset or liability in a transaction that is not a business combination and, at the time of the transaction, affects neither the accounting profit nor taxable profit or loss
• In respect of taxable temporary differences associated with investments in subsidiaries, associates and interests in joint arrangements, when the timing of the reversal of the temporary differences can be controlled and it is probable that the temporary differences will not reverse in the foreseeable future
Deferred tax assets are recognised for all deductible temporary differences, the carry forward of unused tax credits and any unused tax losses. Deferred tax assets are recognised to the extent that it is probable that taxable profit will be available against which the deductible temporary differences, and the carry forward of unused tax credits and unused tax losses can be utilised, except:
• When the deferred tax asset relating to the deductible temporary difference arises from the initial recognition of an asset or liability in a transaction that is not a business combination and, at the time of the transaction, affects neither the accounting profit nor taxable profit or loss
• In respect of deductible temporary differences associated with investments in subsidiaries, associates and interests in joint arrangements, deferred tax assets are recognised only to the extent that it is probable that the temporary differences will reverse in the foreseeable future and taxable profit will be available against which the temporary differences can be utilized
The carrying amount of deferred tax assets is reviewed at each reporting date and reduced to the extent that it is no longer probable that sufficient taxable profit will be available to allow all or part of the deferred tax asset to be utilised. Unrecognised deferred tax assets are re-assessed at each reporting date and are recognised to the extent that it has become probable that future taxable profits will allow the deferred tax asset to be recovered. Deferred tax assets and liabilities are measured at the tax rates that are expected to apply in the year when the asset is realised or the liability is settled, based on tax rates (and tax laws) that have been enacted or substantively enacted at the reporting date. Foreign currencies The Group’s consolidated financial statements are presented in USD, which is also the Company’s functional currency. For each entity, the Group determines the functional currency and items included in the financial statements of each entity are measured using that functional currency. The Group uses the direct method of consolidation and on disposal of a foreign operation, the gain or loss that is reclassified to profit or loss reflects the amount that arises from using this method. Transactions and balances Transactions in foreign currencies are initially recorded by the Group’s entities at their respective functional currency spot rates at the date the transaction first qualifies for recognition.

29 | ADES International Holding PLC
FY2019 FINAL RESULTS London | 7 April 2020
Monetary assets and liabilities denominated in foreign currencies are translated at the functional currency spot rates of exchange at the reporting date. Differences arising on settlement or translation of monetary items are recognised in profit or loss with the exception of monetary items that are designated as part of the hedge of the Group’s net investment in a foreign operation. These are recognised in OCI until the net investment is disposed of, at which time, the cumulative amount is reclassified to profit or loss. Tax charges and credits attributable to exchange differences on those monetary items are also recorded in OCI. Non-monetary items that are measured in terms of historical cost in a foreign currency are translated using the exchange rates at the dates of the initial transactions. Non-monetary items measured at fair value in a foreign currency are translated using the exchange rates at the date when the fair value is determined. The gain or loss arising on translation of non-monetary items measured at fair value is treated in line with the recognition of the gain or loss on the change in fair value of the item (i.e., translation differences on items whose fair value gain or loss is recognised in OCI or profit or loss are also recognised in OCI or profit or loss, respectively). In determining the spot exchange rate to use on initial recognition of the related asset, expense or income (or part of it) on the derecognition of a non-monetary asset or non-monetary liability relating to advance consideration, the date of the transaction is the date on which the Group initially recognises the non-monetary asset or non-monetary liability arising from the advance consideration. If there are multiple payments or receipts in advance, the Group determines the transaction date for each payment or receipt of advance consideration. Inventories Inventories are initially measured at cost and subsequently at lower of cost using weighted average method or net realisable value. Property and equipment Assets under construction, property and equipment are stated at cost, net of accumulated depreciation and/or accumulated impairment losses, if any. Such cost includes the cost of replacing parts of the property and equipment and borrowing costs for long-term construction projects if the recognition criteria are met. When significant parts of property and equipment are required to be replaced at intervals, the Group recognises such parts as individual assets with specific useful lives and depreciates them accordingly. Likewise, when a major inspection is performed, its cost is recognised in the carrying amount of the plant and equipment as a replacement if the recognition criteria are satisfied. All other repair and maintenance costs are recognised in the profit or loss as incurred. Depreciation is calculated on a straight-line basis over the estimated useful lives of the assets as follows:
Years
Rigs 27 Mobile Offshore Production Unit (MOPU) 5 Furniture and fixtures 10 Drilling pipes 5 Tools 10 Office premises Computers and equipment
20 5
Motor vehicles 5 Leasehold improvements 5
Rigs include overhaul, environment and safety costs that are capitalised and depreciated over 5 years. No depreciation is charged on assets under construction. The useful lives and depreciation method are reviewed annually to ensure that the method and period of depreciation are consistent with the expected pattern of economic benefits from these assets. Any change in estimated useful life is applied prospectively effective from the beginning of year. Expenditure incurred to replace a component of an item of property and equipment that is accounted for separately is capitalised and the carrying amount of the component that is replaced is written off. Other subsequent expenditure is capitalised only when it increases future economic benefits of the related item of property and equipment. All other expenditure is recognised in the consolidated statement of profit or loss as the expense is incurred. Property and equipment are reviewed for impairment whenever events or changes in circumstances indicate that the carrying amount of property and equipment may not be recoverable.

30 | ADES International Holding PLC
FY2019 FINAL RESULTS London | 7 April 2020
Whenever the carrying amount of property and equipment exceeds their recoverable amount, an impairment loss is recognised in the consolidated statement of profit or loss. The recoverable amount is the higher of fair value less costs to sell of property and equipment and the value in use. The fair value is the price that would be received to sell an asset or paid to transfer a liability in an orderly transaction between market participants at the measurement date. While value in use is the present value of estimated future cash flows expected to arise from the continuing use of property and equipment and from its disposal at the end of its useful life. Reversal of impairment losses recognised in the prior years are recorded when there is an indication that the impairment losses recognised for the property and equipment no longer exist or have reduced. An item of property and equipment is derecognised upon disposal or when no further economic benefits are expected from its use or disposal. Any gain or loss arising on de recognition is included in the consolidated statement of profit or loss. Intangible assets Intangible assets acquired separately are measured on initial recognition at cost. After initial recognition, intangible assets are carried at cost less any accumulated amortisation and any accumulated impairment losses. Internally generated intangible assets are not capitalised and expenditure is reflected in the consolidated profit and loss in the year in which the expenditure is incurred. The useful lives of intangible assets are assessed as either finite or indefinite. Intangible assets with finite lives are amortised over the useful economic life and assessed for impairment whenever there is an indication that the intangible asset may be impaired. The amortisation period and the amortisation method for an intangible asset with a finite useful life is reviewed at least at each financial year end. Intangible assets are amortised using the straight-line method over their estimated useful lives (5 years). Financial instruments A financial instrument is any contract that gives rise to a financial asset of one entity and a financial liability or equity instrument of another entity. Financial assets Initial recognition and measurement Financial assets are classified, at initial recognition, as subsequently measured at amortised cost, fair value through other comprehensive income (OCI), and fair value through profit or loss. The classification of financial assets at initial recognition depends on the financial asset’s contractual cash flow characteristics and the Group’s business model for managing them. With the exception of trade receivables and contract assets that do not contain a significant financing component or for which the Group has applied the practical expedient, the Group initially measures a financial asset at its fair value plus, in the case of a financial asset not at fair value through profit or loss, transaction costs. Trade receivables and contract assets that do not contain a significant financing component or for which the Group has applied the practical expedient are measured at the transaction price determined under IFRS 15. In order for a financial asset to be classified and measured at amortised cost or fair value through OCI, it needs to give rise to cash flows that are ‘solely payments of principal and interest (SPPI) on the principal amount outstanding. This assessment is referred to as the SPPI test and is performed at an instrument level. Initial recognition and measurement (continued) The Group’s business model for managing financial assets refers to how it manages its financial assets in order to generate cash flows. The business model determines whether cash flows will result from collecting contractual cash flows, selling the financial assets, or both. Purchases or sales of financial assets that require delivery of assets within a time frame established by regulation or convention in the market place (regular way trades) are recognised on the trade date, i.e., the date that the Group commits to purchase or sell the asset. Subsequent measurement For purposes of subsequent measurement, financial assets are classified in four categories:
• Financial assets at amortised cost (debt instruments)
• Financial assets at fair value through OCI with recycling of cumulative gains and losses (debt instruments)
• Financial assets designated at fair value through OCI with no recycling of cumulative gains and losses upon derecognition (equity instruments)

31 | ADES International Holding PLC
FY2019 FINAL RESULTS London | 7 April 2020
• Financial assets at fair value through profit or loss The Group’s financial assets at amortised cost include trade and other receivables, due from related parties and cash and bank balances. The Group does not have financial assets at fair value through OCI or through profit or loss. Financial assets at amortised cost (debt instruments) This category is the most relevant to the Group. The Group measures financial assets at amortised cost if both of the following conditions are met:
• The financial asset is held within a business model with the objective to hold financial assets in order to collect contractual cash flows; and
• The contractual terms of the financial asset give rise on specified dates to cash flows that are solely payments of principal and interest on the principal amount outstanding.
Financial assets at amortised cost are subsequently measured using the effective interest (EIR) method and are subject to impairment. Gains and losses are recognised in profit or loss when the asset is derecognised, modified or impaired. Derecognition of financial assets A financial asset (or, where applicable, a part of a financial asset or part of a group of similar financial assets) is primarily derecognised (i.e., removed from the Group’s consolidated statement of financial position) when:
• The rights to receive cash flows from the asset have expired; or
• The Group has transferred its rights to receive cash flows from the asset or has assumed an obligation to pay the received cash flows in full without material delay to a third party under a ‘pass-through’ arrangement and either (a) the Group has transferred substantially all the risks and rewards of the asset, or
• The Group has neither transferred nor retained substantially all the risks and rewards of the asset, but has transferred control of the asset.
When the Group has transferred its rights to receive cash flows from an asset or has entered into a pass- through arrangement, it evaluates if, and to what extent, it has retained the risks and rewards of ownership. When it has neither transferred nor retained substantially all of the risks and rewards of the asset, nor transferred control of the asset, the Group continues to recognise the transferred asset to the extent of its continuing involvement. In that case, the Group also recognises an associated liability. The transferred asset and the associated liability are measured on a basis that reflects the rights and obligations that the Group has retained. Continuing involvement that takes the form of a guarantee over the transferred asset is measured at the lower of the original carrying amount of the asset and the maximum amount of consideration that the Group could be required to repay. Impairment of financial assets The Group recognises an allowance for expected credit losses (ECLs) for all debt instruments not held at fair value through profit or loss. ECLs are based on the difference between the contractual cash flows due in accordance with the contract and all the cash flows that the Group expects to receive, discounted at an approximation of the original effective interest rate. The expected cash flows will include cash flows from the sale of collateral held or other credit enhancements that are integral to the contractual terms. ECLs are recognised in two stages. For credit exposures for which there has not been a significant increase in credit risk since initial recognition, ECLs are provided for credit losses that result from default events that are possible within the next 12-months (a 12-month ECL). For those credit exposures for which there has been a significant increase in credit risk since initial recognition, a loss allowance is required for credit losses expected over the remaining life of the exposure, irrespective of the timing of the default (a lifetime ECL). For trade receivables and contract assets, the Group applies a simplified approach in calculating ECLs. Therefore, the Group does not track changes in credit risk, but instead recognises a loss allowance based on lifetime ECLs at each reporting date. The Group has established a provision matrix that is based on its historical credit loss experience, adjusted for forward-looking factors specific to the debtors and the economic environment. The Group considers a financial asset in default when contractual payments are 90 days past due. However, in certain cases, the Group may also consider a financial asset to be in default when internal or external information indicates that the Group is unlikely to receive the outstanding contractual amounts in full before taking into account any credit

32 | ADES International Holding PLC
FY2019 FINAL RESULTS London | 7 April 2020
enhancements held by the Group. A financial asset is written off when there is no reasonable expectation of recovering the contractual cash flows. Financial liabilities Initial recognition and measurement Financial liabilities are classified, at initial recognition, as financial liabilities at fair value through profit or loss, loans and borrowings, payables, or as derivatives designated as hedging instruments in an effective hedge, as appropriate. All financial liabilities are recognised initially at fair value and, in the case of loans and borrowings and payables, net of directly attributable transaction costs. The Group’s financial liabilities include trade and other payables, due to related party balances, loans and borrowings including bank overdrafts and other financial liabilities. Subsequent measurement The measurement of financial liabilities depends on their classification, as described below: (i) Trade and other payables Liabilities are recognised for amounts to be paid in the future for goods or services received, whether billed by the supplier or not. (ii) Loans and borrowings This is the category most relevant to the Group. After initial recognition, loans and borrowings are subsequently measured at amortised cost using the EIR method. Gains and losses are recognised in profit or loss when the liabilities are derecognised as well as through the EIR amortisation process. Amortised cost is calculated by taking into account any discount or premium on acquisition and fees or costs that are an integral part of the EIR. The EIR amortisation is included as finance costs in the consolidated statement of profit or loss. This category generally applies to loans and borrowings. (iii) Other financial liabilities at amortised cost Other financial liabilities are initially measured at fair value, net of transaction costs and are subsequently measured at amortised cost using the effective interest method. The effective interest method is a method of calculating the amortised cost of a financial liability and of allocating interest expense over the relevant period. The effective interest rate is the rate that exactly discounts estimated future cash payments through the expected life of the financial liability, or, where appropriate, a shorter period. Derecognition of financial liabilities A financial liability is derecognised when the obligation under the liability is discharged or cancelled or expires. When an existing financial liability is replaced by another from the same lender on substantially different terms, or the terms of an existing liability are substantially modified, such an exchange or modification is treated as the derecognition of the original liability and the recognition of a new liability. The difference in the respective carrying amounts is recognised in the consolidated statement of profit or loss. Offsetting of financial instruments Financial assets and financial liabilities are offset and the net amount is reported in the consolidated statement of financial position if there is a currently enforceable legal right to offset the recognised amounts and there is an intention to settle on a net basis, to realise the assets and settle the liabilities simultaneously. Derivative financial instrument A derivative is a financial instrument or other contract with all three of the following characteristics:
• Its value changes in response to the change in a specified interest rate, financial instrument price, commodity price, foreign exchange rate, index of prices or rates, credit rating or credit index, or other variable, provided that, in the case of a non-financial variable, it is not specific to a party to the contract (i.e., the 'underlying').
• It requires no initial net investment or an initial net investment that is smaller than would be required for other types of contracts expected to have a similar response to changes in market factors.
• It is settled at a future date.

33 | ADES International Holding PLC
FY2019 FINAL RESULTS London | 7 April 2020
The Group uses derivative financial instruments, such as interest rate swap, to hedge its interest rate risks. These interest rate swaps are initially recognised at fair value on the date on which a derivative contract is entered into and are subsequently remeasured at fair value. Derivatives are carried as financial assets when the fair value is positive and as financial liabilities when the fair value is negative. Hedge accounting For the purpose of hedge accounting, the Group has designated one of its two derivative financial instruments (interest rate swaps) as a cash flow hedge. At the inception of a hedge relationship, the Group formally designates and documents the hedge relationship to which it wishes to apply hedge accounting and the risk management objective and strategy for undertaking the hedge. The documentation includes identification of the hedging instrument, the hedged item, the nature of the risk being hedged and how the Group will assess whether the hedging relationship meets the hedge effectiveness requirements (including the analysis of sources of hedge ineffectiveness and how the hedge ratio is determined). A hedging relationship qualifies for hedge accounting if it meets all of the following effectiveness requirements:
• There is ‘an economic relationship’ between the hedged item and the hedging instrument.
• The effect of credit risk does not ‘dominate the value changes’ that result from that economic relationship.
• The hedge ratio of the hedging relationship is the same as that resulting from the quantity of the hedged item that the Group actually hedges and the quantity of the hedging instrument that the Group actually uses to hedge that quantity of hedged item.
Cash flow hedges The effective portion of the gain or loss on the hedging instrument is recognised in OCI in the cash flow hedge reserve, while any ineffective portion is recognised immediately in the statement of comprehensive income. The cash flow hedge reserve is adjusted to the lower of the cumulative gain or loss on the hedging instrument and the cumulative change in fair value of the hedged item. The amounts accumulated in OCI are accounted for, depending on the nature of the underlying hedged transaction. If the hedged transaction subsequently results in the recognition of a non-financial item, the amount accumulated in equity is removed from the separate component of equity and included in the initial cost or other carrying amount of the hedged asset or liability. This is not a reclassification adjustment and will not be recognised in OCI for the period. This also applies where the hedged forecast transaction of a non-financial asset or non-financial liability subsequently becomes a firm commitment for which fair value hedge accounting is applied. For any other cash flow hedges, the amount accumulated in OCI is reclassified to profit or loss as a reclassification adjustment in the same period or periods during which the hedged cash flows affect profit or loss. If cash flow hedge accounting is discontinued, the amount that has been accumulated in OCI must remain in accumulated OCI if the hedged future cash flows are still expected to occur. Otherwise, the amount will be immediately reclassified to profit or loss as a reclassification adjustment. After discontinuation, once the hedged cash flow occurs, any amount remaining in accumulated OCI must be accounted for depending on the nature of the underlying transaction as described above. Derivative instrument held for trading The Group classifies one of its two interest rate swaps as derivative held for trading and did not apply hedge accounting, which is fair valued at initial recognition and subsequently. Any change in fair value is recorded in the statement of comprehensive income as fair value gain (loss) on derivative financial instrument. Impairment of non-financial assets The Group assesses at each reporting date whether there is an indication that a non-financial asset may be impaired. If any indication exists, or when annual impairment testing for an asset is required, the Group estimates the asset’s recoverable amount. An asset’s recoverable amount is the higher of an asset’s or cash-generating units (CGU) fair value less costs to sell and its value in use and is determined for an individual asset, unless the asset does not generate cash inflows that are largely independent of those from other assets or groups of assets. Where the carrying amount of an asset or CGU exceeds its recoverable amount, the asset is considered impaired and is written down to its recoverable amount. In assessing value in use, the estimated future cash flows are discounted to their present value using a pre-tax discount rate that reflects current market assessments of the time value of money and the risks specific to the asset. In determining fair value less costs to sell, an appropriate valuation model is used. Impairment losses of continuing operations are recognised in the consolidated statement of profit or loss in those expense categories consistent with the function of the impaired asset.

34 | ADES International Holding PLC
FY2019 FINAL RESULTS London | 7 April 2020
An assessment is made at each reporting date as to whether there is any indication that previously recognised impairment losses may no longer exist or may have decreased. If such indication exists, the Group estimates the asset’s or cash-generating unit’s recoverable amount. A previously recognised impairment loss is reversed only if there has been a change in the assumptions used to determine the asset’s recoverable amount since the last impairment loss was recognised. The reversal is limited so that the carrying amount of the asset does not exceed its recoverable amount, nor exceed the carrying amount that would have been determined, net of depreciation, had no impairment loss been recognised for the asset in prior years. Such reversal is recognised in the consolidated statement of profit or loss. Leases- accounting policy for the years ended before 31 December 2018: The determination of whether an arrangement is (or contains) a lease is based on the substance of the arrangement at the inception of the lease. The arrangement is, or contains, a lease if fulfilment of the arrangement is dependent on the use of a specific asset or assets and the arrangement conveys a right to use the asset (or assets), even if that asset (or those assets) is not explicitly specified in an arrangement. Group as a lessee A lease is classified at the inception date as a finance lease or an operating lease. A lease that transfers substantially all the risks and rewards incidental to ownership to the Group is classified as a finance lease. Finance leases are capitalised at the commencement of the lease at the inception date fair value of the leased property or, if lower, at the present value of the minimum lease payments. Lease payments are apportioned between finance charges and reduction of the lease liability so as to achieve a constant rate of interest on the remaining balance of the liability. Finance charges are recognised in finance costs in the consolidated statement of profit or loss. A leased asset is depreciated over the useful life of the asset. However, if there is no reasonable certainty that the Group will obtain ownership by the end of the lease term, the asset is depreciated over the shorter of the estimated useful life of the asset and the lease term. An operating lease is a lease other than a finance lease. Operating lease payments are recognised as an operating expense in the consolidated statement of profit or loss on a straight-line basis over the lease term. Group as a lessor Leases in which the Group does not transfer substantially all the risks and rewards of ownership of an asset are classified as operating leases. Rental income arising is accounted for on a straight-line basis over the lease terms and is included in revenue in the consolidated statement of profit or loss due to its operating nature. Initial direct costs incurred in negotiating and arranging an operating lease are added to the carrying amount of the leased asset and recognised over the lease term on the same basis as rental income. Contingent rents are recognised as revenue in the period in which they are earned. Provisions Provisions are recognised when the Group has a present obligation (legal or constructive) as a result of a past event, it is probable that an outflow of resources embodying economic benefits will be required to settle the obligation, and the amount can be reliably estimated. When the Group expects some or all of a provision to be reimbursed, the reimbursement is recognised as a separate asset but only when the reimbursement is virtually certain. The expense relating to any provision is presented in the consolidated statement of profit or loss net of any reimbursement. Provisions are measured at the present value of the expenditures expected to be required to settle the obligation at the end of the reporting period, using a rate that reflects current market assessments of the time value of money and the risks specific to the obligation. Provisions are reviewed at each statement of financial position date and adjusted to reflect the current best estimate. If it is no longer probable that an outflow of resources embodying economic benefits will be required to settle the obligation, the provision is reversed. Contingencies Contingent liabilities are not recognised in the consolidated financial statements. They are disclosed unless the possibility of an outflow of resources embodying economic benefits is remote. A contingent asset is not recognised in the consolidated financial statements but disclosed when an inflow of economic benefits is probable. Legal reserve According to one of the subsidiaries’ articles of association, 5% of the net profit for the prior year of the Subsidiary is transferred to a legal reserve until this reserve reaches 20% of the issued capital. The reserve is used upon a decision from the general assembly meeting based on the proposal of the Board of Directors of the Subsidiary.

35 | ADES International Holding PLC
FY2019 FINAL RESULTS London | 7 April 2020
Treasury shares Own equity instruments that are reacquired (treasury shares) are recognised at cost and deducted from equity. No gain or loss is recognised in profit or loss on the purchase, sale, issue or cancellation of the Group’s own equity instruments. Any difference between the carrying amount and the consideration, if reissued, is recognised in the share premium. Fair value measurement Fair value is the price that would be received to sell an asset or paid to transfer a liability in an orderly transaction between market participants at the measurement date. The fair value measurement is based on the presumption that the transaction to sell the asset or transfer the liability takes place either in the principal market for the asset or liability or the most advantageous market for the asset or liability. The principal or the most advantageous market must be accessible to the Group. The fair value of an asset or a liability is measured using the assumptions that market participants would use when pricing the asset or liability, assuming that market participants act in their economic best interest. A fair value measurement of a non-financial asset takes into account a market participant’s ability to generate economic benefits by using the asset in its highest and best use or by selling it to another market participant that would use the asset in its highest and best use. For assets traded in an active market, fair value is determined by reference to quoted market bid prices. The fair value of items is estimated based on discounted cash flows using interest rates for items with similar terms and risk characteristics. For unquoted assets, fair value is determined by reference to the market value of a similar asset or is based on the expected discounted cash flows. The Group uses valuation techniques that are appropriate in the circumstances and for which sufficient data are available to measure fair value, maximising the use of relevant observable inputs and minimising the use of unobservable inputs. All assets and liabilities for which fair value is measured or disclosed in the Consolidated financial statements are categorised within the fair value hierarchy, described as follows, based on the lowest level input that is significant to the fair value measurement as a whole:
• Level 1 - Quoted (unadjusted) market prices in active markets for identical assets or liabilities
• Level 2 - Valuation techniques for which the lowest level input that is significant to the fair value measurement is directly or indirectly observable
• Level 3 - Valuation techniques for which the lowest level input that is significant to the fair value measurement is unobservable
Cash dividend and non-cash distribution to equity holders of the Parent The Group recognises a liability to make cash or non-cash distributions to equity holders of the Parent when the distribution is authorised and the distribution is no longer at the discretion of the Group. A distribution is authorised when it is approved by the shareholders. A corresponding amount is recognised directly in equity. Non-cash distributions are measured at the fair value of the assets to be distributed with fair value remeasurement recognised directly in equity. Upon distribution of non-cash assets, any difference between the carrying amount of the liability and the carrying amount of the assets distributed is recognised in the consolidated statement of profit or loss.
3 SIGNIFICANT ACCOUNTING ESTIMATES, JUDGEMENTS AND ASSUMPTIONS Judgements The preparation of the Group’s consolidated financial statements requires management to make judgements, estimates and assumptions that affect the reported amounts of revenues, expenses, assets, liabilities, and the accompanying disclosures, and the disclosure of contingent liabilities. Uncertainty about these assumptions and estimates could result in outcomes that require a material adjustment to the carrying amount of the asset or liability affected in future periods. In the process of applying the Group’s accounting policies, management has made certain Judgements, estimates and assumptions in relation to the accounting for the business acquired, accounts receivable, customer credit periods and doubtful debts provisions, creditors’ payment period, useful lives and impairment of property and equipment, income taxes and various other policy matters. These Judgements have the most significant effects on the amounts recognised in the consolidated financial statements. Consolidation of an entity in which the Group holds less than a majority of voting right The Group considers that it controls United Precision Drilling Company W.L.L (“UPDC”) even though it owns less than 50% of the voting rights. This is mainly because (a) the Group has a substantive right to direct conclusion of revenue contracts, capital expenditures and operational management; (b) the Group has a significantly higher exposure to

36 | ADES International Holding PLC
FY2019 FINAL RESULTS London | 7 April 2020
variability of returns than its voting rights; (c) the Group is the owner of all drilling rigs and equipment and charters the drilling rigs to UPDC on exclusive basis. Management also considered that non-controlling interest in UPDC is not material as compared to the consolidated financial position. The lease term of contracts with renewal options The Group determines the lease term as the non-cancellable term of the lease, together with any periods covered by an option to extend the lease if it is reasonably certain to be exercised, or any periods covered by an option to terminate the lease, if it is reasonably certain not to be exercised. The Group has the option, under some of its leases to lease the assets for additional terms of three to five years. The Group applies judgement in evaluating whether it is reasonably certain to exercise the option to renew. That is, it considers all relevant factors that create an economic incentive for it to exercise the renewal. After the commencement date, the Group reassesses the lease term if there is a significant event or change in circumstances that is within its control and affects its ability to exercise (or not to exercise) the option to renew (e.g., a change in business strategy). The Group included the renewal period as part of the lease term for leases of property and equipment due to the significance of these assets to its operations. These leases have a short non-cancellable period (i.e., three to five years) and there will be a significant negative effect on operation if a replacement is not readily available. Judgement in determining whether assets acquired, and liabilities assumed qualify as a business combination The Group acquired 31 rigs and other assets from Weatherford Drilling International (“the Seller” or “WDI”). The acquisition of the rigs and other assets from WDI is a global deal covering 3 jurisdictions. The rigs are located in various countries as follows: 11 rigs in KSA, 12 rigs in Kuwait, 2 rigs in Iraq and 6 rigs in Algeria. The closing of the KSA and Kuwait Assets transactions took place on 30 November 2018 and 31 October 2018, respectively, whereas closure of the Alegria and Iraq Assets transactions took place in the current year as follows: Algeria Assets: 6 rigs and related equipment, drilling contracts and other contracts, vendor contracts, all other equipment and inventories (including work in progress) related to rigs to the extent used or intended to be used in the drilling business, business intellectual property and records related to the drilling business in Algeria, and certain employees. The closing of the Algeria Assets transaction took place on 28 February 2019 (4 rigs) and 18 March 2019 (2 rigs). Iraq Assets: 2 rigs with related equipment and inventories (purchase of Iraq rigs was explicitly excluded from the scope of Kuwait assets upon the closing of Kuwait transaction through a separate side agreement dated 31 October 2018) and transfer of the Iraq rigs was made through separate transfer agreements. The closing of the Iraq Assets took place on 11 February 2019 (1 rig) and 25 March 2019 (1 rig). We performed an extensive analysis of the terms of the agreements entered into to give effect to the above transactions and applied the ‘inputs, processes and outputs’ approach required by IFRS 3 on each individual transaction. We also consulted our legal advisor about the enforceability of the rights and obligations under each of these agreements. Our evaluation resulted in the Algeria and Iraq transactions each qualifying as a business combination. Key sources of estimation uncertainty Fair value measurements and valuation processes in relation to the acquired assets and liabilities as part of business combination During the year ended 31 December 2019 the Group completed the acquisition accounting for the new businesses acquired during 2019 and 2018 (refer to note 6). For the purposes of fair valuation of the rigs and inventories acquired the Group engaged and independent valuation specialists who utilised income approach (discounted cash flow analysis), cost approach and market approach as per the requirements of IFRS 13- Fair Value Measurement. In accordance with IFRS 13 Fair Value Measurement, in some cases a single valuation will be appropriate, while in other cases, multiple valuation techniques will be appropriate. If multiple valuation techniques are used to measure fair value, the results (i.e. respective indications of fair value) are evaluated considering the reasonableness of the range of values indicated by those results. For example, the following valuation approaches have been applied by management, as appropriate, to measure the acquisition-date fair value of assets acquired by the Group in business combinations: (1) Market approach—based on market transactions involving identical or similar assets or liabilities, (2) Income approach—based on future amounts of cash flows or income and expenses that are discounted to a single present amount and (3) Cost approach—based on the amount required to replace the service capacity of an asset (usually referred to as current replacement cost).

37 | ADES International Holding PLC
FY2019 FINAL RESULTS London | 7 April 2020
IFRS 13 does not prioritise the use of one valuation technique over another or require the use of only one technique except in situations where identical financial instruments exist that trade in active markets in which case the entity’s financial instruments shall be measured at the market price of the identical instruments multiplied by quantity (P x Q). In measuring the fair value of an asset or liability, management use valuation techniques that are appropriate in the circumstances and for which sufficient data is available. Therefore, multiple valuation techniques were used, and judgment is exercised by management in applying them. The market approach uses prices and other relevant information generated by market transactions involving identical or comparable (i.e. similar) assets, liabilities or a group of assets and liabilities, such as a business. Although the market approach is described by IFRS 13 as a widely used valuation technique, its use becomes less favorable and/or relevant in situations for which observable inputs in active markets are limited, and where no exit prices exist for those assets on a stand-alone basis because market information indicates that they are being exchanged together with other elements as part of an entire business. The Group is acquiring a business and not an asset. Hence, operational/contracted assets are a cash generating unit which is the main driver for acquisition from market participants’ perspective (i.e. the amount and consistency of income generated from these CGUs). Accordingly, management believe that using multiple techniques is more appropriate and should be considered when evaluating the reasonable range of values to indicate the fair value of the assets acquired rather than a single approach such as the market approach. The Group does not rely solely on the market approach because of the low volume and level of activity for exchanges in similar rig-assets in the relevant markets and because this approach does not reflect any revenue generated from these units and only reflects price for identical or comparable (similar) assets. The Market Approach depends mainly on Level # 1 inputs which are observable inputs and minimizes the use of unobservable inputs. Thus, the nature of the characteristics of the rigs being measured and the limited observable market prices for similar assets contributed to the suggested use of several valuation techniques under the 3 above approaches. Since the Group is acquiring businesses rather than stand-alone assets, it was appropriate to estimate the fair value of each business by giving consideration to multiple valuation approaches, such as income approach that derives value from the present value of the expected future cash flows specific to the business and a market approach that derives value from the market data (such as EBITDA or revenue multiples). IFRS 13 also permits the use of the cost approach, where appropriate. Application of the market, income and cost valuation techniques each produced a range of possible values (e.g. lower-end and higher-end values). In accordance with the requirements of IFRS 13, management evaluated the reasonableness of the range in order to select the point within the range that is most representative of fair value. A professional expert had been assigned to review the valuation and considered the merits of each valuation technique applied, and the underlying assumptions embedded in each of the techniques. IFRS 13 requires an entity, in case such approaches produce results that are disparate, to perform further analysis. Management, with assistance from the professional expert, sought to understand why the resulting differences exist among the above techniques and what assumptions might have contributed to the variance. The objective was to find the point in the range that most reflects an exit price. From management’s view, the market technique uses assumptions that are somehow inconsistent with how market participants would look at the transaction. Management believe that the acquired rig-assets would provide maximum value to market participants through its use in combination with its complementary assets, contracts and associated liabilities that is, a whole business. Management believe that the sellers’ use of the rig-assets, prior to the Group’s acquisition, is the highest and best use in the context of the drilling business. Thus, the income approach was applied using a present value technique. The cash flows used in that technique reflect the income stream expected to result from the contracted rig-assets over its economic life. In other words, the income stream comprises the contractual cash flows expected to result from the associated backlogs for the remaining term of the associated drilling contracts in addition to the residual/termination value reflecting cash flows for the asset’s remaining economic life. Also, the cost approach was applied, on the relevant group of assets, by estimating the amount that currently would be required to substitute rig-assets with comparable utility with appropriate adjustments for assets condition (used) and location (installed and configured for use or stacked). Based on the above, management concluded that the results of the market approach could not be used in isolation as a representative of fair value. Additionally, the used other two techniques (income and cost) together with the market technique produced indications of fair value that are disparate. Therefore, management considered the possible range of fair value measures and what is most representative of fair value taking into consideration that:

38 | ADES International Holding PLC
FY2019 FINAL RESULTS London | 7 April 2020
o The income valuation technique may be more representative of fair value for contracted rig-asset than other techniques;
o Inputs used in the cost/or market valuation technique may be more readily observable in the marketplace for standard and/or uncontracted assets, stacked rigs or require fewer adjustments.
Impairment of trade receivables and contract assets The Group recognises an allowance for expected credit losses (ECLs). The Group applies a simplified approach in calculating ECLs with respect to trade receivables and contract assets. Therefore, the Group does not track changes in credit risk, but instead recognises a loss allowance based on lifetime ECLs at each reporting date. At the consolidated statement of financial position date, gross trade receivables and contract assets were USD 174,437,513 (2018: USD 142,071,534) and the provision for impairment in trade receivables and contract assets was USD 2,168,121 (2018: USD 4,944,373). Any difference between the amounts actually collected in future periods and the amounts expected will be recognised in the consolidated statement of comprehensive income. Taxes The Group is exposed to income taxes in certain jurisdictions. Significant judgement is required to determine the total tax liability. Uncertainties exist with respect to the interpretation of complex tax regulations, changes in tax laws, and the amount and timing of future taxable income. Given the wide range of international business relationships and the long-term nature and complexity of existing contractual agreements, differences arising between the actual results and the assumptions made, or future changes to such assumptions, could necessitate future adjustments to tax income and expense already recorded. The tax liability is established, based on reasonable estimates, for possible consequences of audits by the tax authorities of the respective counties in which the Group-entities operate. The amount of such liability is based on various factors, such as experience of previous tax audits and differing interpretations of tax regulations by the taxable entity and the responsible tax authority. Such differences in interpretation may arise for a wide variety of issues depending on the conditions prevailing in the respective domicile of the Group companies. At the reporting date, the current income tax payable was USD 9,975,938 (2018: USD 3,040,753). Impairment of non-financial assets The Group assesses whether there are any indicators of impairment for all non-financial assets at each reporting date. The non-financial assets are tested for impairment when there are indicators that the carrying amounts may not be recoverable. When value in use calculations are undertaken, management estimates the expected future cash flows from the asset or cash-generating unit and chooses a suitable discount rate in order to calculate the present value of those cash flows. Useful lives of property, plant and equipment The Group's management determines the estimated useful lives of its property, plant and equipment for calculating depreciation. This estimate is determined after considering the expected usage of the asset or physical wear and tear. Management reviews the residual value and useful lives annually and future depreciation charge would be adjusted where the management believes the useful lives differ from previous estimates. Write-down of inventories to net realizable value (NVR) Inventories are carried at the lower of cost and net realisable value. When inventories become old or obsolete, an estimate is made of their net realisable value. At the reporting date, gross inventories were USD 45,073,493 (2018 as restated: USD 32,672,320). At the reporting date, the cumulative provision for slow moving items stands at USD 253,329 (2018: nil). Any difference between the amounts actually realised in future periods and the amounts expected will be recognised in profit or loss in the consolidated statement of comprehensive income. Impairment of dividends receivable and investment in associates and joint ventures The Group has a dividend receivable from the Egyptian Chinese Drilling Company (ECDC), an investment that is classified by the Group as a joint venture. As at 31 December 2019, the outstanding allowance for impairment in the amount of this dividend receivable is USD 245,000 (2018: USD 245,000). As described in note 12, the Group currently holds 48.75% equity interest in ECDC amounting to USD 2,207,916 (2018: USD 2,184,382). This investment was previously classified as a financial asset. However, on 5 July 2018, ECDC’s shareholders entered into a Shareholders Agreement whereby the Group obtained a joint control over ECDC and, consequently, the Group’s interest in ECDC became an investment in joint venture effectively from that date. The Shareholders’ Agreement dated 5 July 2018 sets out a joint control framework between ADES and the other major shareholder who holds 51%. This resulted in the change of status of this investment from financial asset to investment in a joint venture during 2018 with no purchase price consideration transferred by the Group. In accordance with the
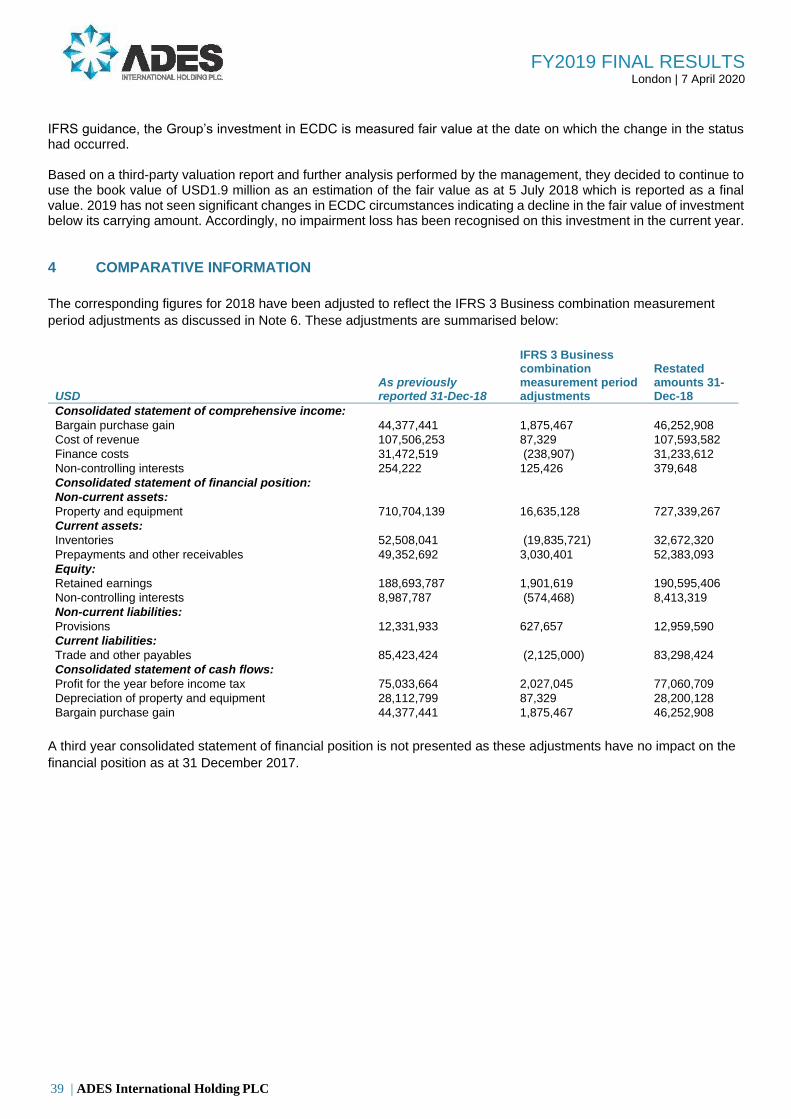
39 | ADES International Holding PLC
FY2019 FINAL RESULTS London | 7 April 2020
IFRS guidance, the Group’s investment in ECDC is measured fair value at the date on which the change in the status had occurred. Based on a third-party valuation report and further analysis performed by the management, they decided to continue to use the book value of USD1.9 million as an estimation of the fair value as at 5 July 2018 which is reported as a final value. 2019 has not seen significant changes in ECDC circumstances indicating a decline in the fair value of investment below its carrying amount. Accordingly, no impairment loss has been recognised on this investment in the current year.
4 COMPARATIVE INFORMATION
The corresponding figures for 2018 have been adjusted to reflect the IFRS 3 Business combination measurement
period adjustments as discussed in Note 6. These adjustments are summarised below:
USD As previously reported 31-Dec-18
IFRS 3 Business combination measurement period adjustments
Restated amounts 31-Dec-18
Consolidated statement of comprehensive income: Bargain purchase gain 44,377,441 1,875,467 46,252,908
Cost of revenue 107,506,253 87,329 107,593,582
Finance costs 31,472,519 (238,907) 31,233,612
Non-controlling interests 254,222 125,426 379,648
Consolidated statement of financial position: Non-current assets: Property and equipment 710,704,139 16,635,128 727,339,267
Current assets: Inventories 52,508,041 (19,835,721) 32,672,320
Prepayments and other receivables 49,352,692 3,030,401 52,383,093
Equity: Retained earnings 188,693,787 1,901,619 190,595,406
Non-controlling interests 8,987,787 (574,468) 8,413,319
Non-current liabilities: Provisions 12,331,933 627,657 12,959,590
Current liabilities: Trade and other payables 85,423,424 (2,125,000) 83,298,424
Consolidated statement of cash flows: Profit for the year before income tax 75,033,664 2,027,045 77,060,709
Depreciation of property and equipment 28,112,799 87,329 28,200,128
Bargain purchase gain 44,377,441 1,875,467 46,252,908
A third year consolidated statement of financial position is not presented as these adjustments have no impact on the
financial position as at 31 December 2017.

FY2019 FINAL RESULTS London | 7 April 2020
5 SEGMENT INFORMATION
Management has determined the operating segments based on the reports reviewed by the Chief Executive Officer (CEO) that are used to make strategic decisions. As operationally, the Group is only in the oil and gas production and drilling services, the CEO considers the business from a geographic perspective and has identified five geographical segments (2018: five geographical segments). Management monitors the operating results of its segments separately for the purpose of making decisions about resource allocation and performance assessment.
Segment (USD) Egypt Algeria Kingdom of
Saudi Arabia Kuwait United Arab
Emirates Total
segment Adjustments & eliminations*** Total
For the year ended 31 December 2019
Revenue
External customers 87,125,252 40,414,802 243,901,977 106,315,516 - 477,757,547 - 477,757,547
Inter-segment 87,190,863 - - - - 87,190,863 (87,190,863) -
Total Revenue 174,316,115 40,414,802 243,901,977 106,315,516 - 564,948,410 (87,190,863) 477,757,547
Income/(expenses)
Cost of revenue* (36,507,892) (23,579,787) (120,675,177) (55,504,546) - (236,267,402) - (236,267,402)
General and administrative expenses (11,782,712) (3,147,114) (22,129,888) (9,504,889) (5,899,066) (52,463,669) - (52,463,669)
Finance costs (net) (11,055,159) (5,128,158) (30,948,262) (13,490,175) (27,568,312) (88,190,066) - (88,190,066)
Depreciation and amortisation (23,529,605) (2,180,135) (14,356,287) (9,248,182) (146,501) (49,460,710) - (49,460,710)
Other expenses (net)** (1,187,327) (507,019) (10,568,079) (4,449,325) (3,130,388) (19,842,138) - (19,842,138)
Profit / Loss- excluding inter-segment revenue 3,062,557 5,872,589 45,224,284 14,118,399 (36,744,267) 31,533,562 - 31,533,562
Total Assets as at 31 December 2019 (i) 863,562,100 98,630,862 108,650,199 346,575,615 14,148,206 1,431,566,982 - 1,431,566,982
Total Liabilities as at 31 December 2019 374,171,422 16,943,110 58,622,288 94,608,532 434,497,150 978,842,502 - 978,842,502
Other Segment information
Capital expenditure (i) 45,215,366 57,085,518 104,558,940 105,207,372 - 312,067,196 - 312,067,196
Intangible assets expenditure 12,976 - - - - 12,976 - 12,976
Total 45,228,342 57,085,518 104,558,940 105,207,372 - 312,080,172 - 312,080,172

FY2019 FINAL RESULTS London | 7 April 2020
Segment (USD) Egypt Algeria Kingdom of
Saudi Arabia Kuwait United Arab
Emirates Total
segment Adjustments & eliminations*** Total
For the year ended 31 December 2018
Revenue
External customers 87,226,591 11,594,020 96,094,909 10,647,870 - 205,563,390 - 205,563,390
Inter-segment 37,296,373 - - - - 37,296,373 (37,296,373) -
Net Revenue 124,522,964 11,594,020 96,094,909 10,647,870 - 242,859,763 (37,296,373) 205,563,390
Income/(expenses)
Cost of revenue* (25,707,577) (4,948,032) (44,161,147) (4,840,115) - (79,656,871) - (79,656,871)
General and administrative expenses (12,039,563) (968,602) (7,320,294) (932,370) (2,710,540) (23,971,369) - (23,971,369)
Finance costs (net) (10,325,735) (1,372,480) (11,375,551) (1,260,477) (4,160,525) (28,494,768) - (28,494,768)
Depreciation and amortisation (21,163,852) (824,442) (5,620,293) (328,124) - (27,936,711) - (27,936,711)
Other expenses (net)** 4,026,629 (513,107) (4,878,728) 10,255,542 18,877,918 27,768,254 - 27,768,254
Profit / Loss- excluding inter-segment revenue 22,016,493 2,967,357 22,738,896 13,542,326 12,006,853 73,271,925 - 73,271,925
Total Assets as at 31 December 2018 (i) 729,132,307 13,686,120 64,217,842 186,542,751 91,038,562 1,084,617,582 - 1,084,617,582
Total Liabilities as at 31 December 2018 173,642,219 2,219,470 19,918,375 27,161,429 440,247,952 663,189,445 - 663,189,445
Other Segment information
Capital expenditure (i) 41,176,696 - 244,918,138 147,023,994 - 433,118,828 - 433,118,828
Intangible assets expenditure 34,196 - - - - 34,196 - 34,196
Total 41,210,892 - 244,918,138 147,023,994 - 433,153,024 - 433,153,024
* excluding depreciation and amortisation. ** Other expenses includes end of service provision, provision for impairment of inventory, provision for impairment of trade receivables, share-based payments expense, business acquisition transaction costs, other taxes, income tax expense and other expenses which are stated net off release of provision for impairment of trade receivables, bargain purchase gain, fair value gain/(loss) on derivative financial instrument and other income. *** Inter-segment revenues and other adjustments are eliminated upon consolidation and reflected in the ‘adjustments and eliminations’ column. **** The corresponding figures for 2018 have been adjusted to reflect the IFRS 3 Business combination measurement period adjustments as discussed in Note 4 and improve presentation.
(i) Management presents the assets in the segment which holds such assets, while the capital expenditure are presented in the segment where such assets are utilised.

42 | ADES International Holding PLC
FY2019 FINAL RESULTS London | 7 April 2020
6 BUSINESS COMBINATIONS
As part of the Group’s strategy to expand its fleet and operations, the Group has acquired the assets and entities which are accounted for as business combinations. These business combinations resulted in bargain purchase transactions because the fair value of assets acquired and liabilities assumed exceeded the total fair value of the consideration paid and the fair value of non- controlling interests. A. Acquisition of three rigs from Nabors Drilling International II Limited – recorded in 2018 On 12 June 2018, the Group acquired three jack-up drilling rigs, located in the Kingdom of Saudi Arabia, in their entirety, including all spare parts, equipment and inventory, from Nabors Drilling International II Limited (Nabors). The Group acquired these rigs to expand its operations in the Kingdom of Saudi Arabia. The acquisition has been accounted for using the acquisition method. Identifiable net assets acquired The fair values of the identifiable net assets of these rigs as at the date of acquisition were:
USD
Fair values recognized on acquisition
Restated*
Property and equipment* 91,328,961
Inventories* 1,657,777
Total identifiable net assets at fair values 92,986,738
Gain from bargain purchase* (8,623,895)
Purchase consideration 84,362,843
Analysis of purchase consideration
Cash paid 62,250,000
Allotment of shares** 22,112,843
84,362,843
Analysis of cash flow on acquisition
Net cash paid (included in cash flows from investing activities) 62,250,000
*During the current year, the Group completed the necessary analysis on the fair values of assets acquired and made the following retrospective adjustments:
• The Group reduced the fair value of the property and equipment by USD 3.1 million, with corresponding reduction to gain from bargain purchase for the same amount.
• The Group allocated USD 4.5 million out of total fair value of the rigs acquired to inventories as part of provisional purchase price. Upon verification of the inventories and their nature, as well as the projects where these items have been used subsequent to the acquisition date, the Group identified that USD 2.9 million of total balance represents critical spare parts which should have been recorded as part of property and equipment account. Accordingly, the Group increased fair value of the rigs and reduced inventories by USD 2.9 million as part of purchase price allocation.
**In accordance with the purchase and sale agreement, the Group issued 1,590,852 fully paid shares to Nabors, valued at the price as quoted on the London Stock Exchange on 12 June 2018. A. Acquisition of three rigs from Nabors Drilling International II Limited – recorded in 2018 (continued) From the date of acquisition till 31 December 2018, the assets contributed USD 27,866,791 of revenue from continuing operations of the Group. It is impracticable to disclose the revenue and profit or loss of the rigs acquired from Nabors for the year ended 31 December 2018 as if the combination had taken place at the beginning of the year, as the acquired assets and entities did not represent a reporting entity and the historical information is not available. The Group acquired the business comprised of the rigs and the related items, rather than the entire entity from Nabors. The amount of profit contributed by these assets from the date of acquisition is also not disclosed, as these rigs do not represent a separate reporting entity and it impracticable to prepare the profit and loss for the rigs.

43 | ADES International Holding PLC
FY2019 FINAL RESULTS London | 7 April 2020
B. Acquisition of the rigs and subsidiaries from Weatherford Drilling International – recorded in 2018 On 31 October 2018 and 30 November 2018, the Group acquired the assets from Weatherford Drilling International in Kuwait and The Kingdom of Saudi Arabia (KSA), respectively. The acquisitions have been accounted for using the acquisition method.
The Group acquired the following in Kuwait: i) Kuwait Assets: 12 onshore rigs and related equipment, drilling contracts, other vendor contracts, certain
employees, inventories to be used in the drilling business, the business intellectual property and records related to the drilling business and rig moving equipment; and
ii) 100% interest in PDC Cyprus Holding ("PDC") (pre-qualified shareholder of UPDC for Kuwait Oil Company tender process) which has a 47.5% interest in UPDC, a Kuwait entity which handles the operations of the rigs in Kuwait including the employees and the drilling contracts.
The Group acquired 11 onshore rigs in KSA and related equipment, drilling contracts, other vendor contracts, certain employees, inventories to be used in the drilling business, the business intellectual property and records related to the drilling business.
Identifiable net assets acquired The fair value of the identifiable assets and liabilities as at the acquisition were:
USD Fair values recognized on
acquisition (KSA) Fair values recognized on
acquisition (Kuwait)
Property and equipment* 108,804,321 133,343,251
Inventories* 6,370,679 5,160,788
Accounts receivable and prepayments* - 36,220,232
Due from related parties - 6,699,193
Bank balances and cash - 110,528
Total assets* 115,175,000 181,533,992
Employees’ end of service benefits* - 11,133,268
Accounts payable and accruals** - 11,335,812
Due to related parties - 6,699,193
Total liabilities* - 29,168,273
Total identifiable net assets at fair value* 115,175,000 152,365,719
Non-controlling interest (52.5% of net assets) ** - (8,033,673)
Bargain purchase gain arising on acquisitions (22,675,000) (14,954,013)
Purchase considerations, restated* 92,500,000 129,378,033
As at the acquisition date, the gross amount of trade receivables is USD 11,537,905 which approximates to its fair value. It is expected that the full contractual amounts can be collected, and management estimated that no allowance for ECL is required. *During the current year, the Group completed the necessary analysis on the fair values of assets and liabilities acquired and made the following retrospective adjustments: KSA acquisition:
• With the help of the independent specialist the Group completed the fair values of inventories and property and equipment which resulted in decrease in the fair value of inventories by USD 13.94 million with the corresponding increase to the acquired fair value of property and equipment. It has no effect on total fair value of the acquired assets and bargain purchase gain recorded during the year ended 31 December 2018.
Kuwait Adjustments:
• With the help of the independent specialist the Group completed the assessment of fair values of inventories and property and equipment acquired, which resulted in decrease in the fair value of inventories by USD 2.98 million with the corresponding increase to the acquired fair value of property and equipment. It has no effect on total fair value of the acquired assets and bargain purchase gain recorded during the year ended 31 December 2018.

44 | ADES International Holding PLC
FY2019 FINAL RESULTS London | 7 April 2020
• The Group also increased the acquired balance of end of service benefits for the amount of USD 628 thousand to reflect the fair value of the liability acquired; and decreased the acquired balance of accounts receivable and prepayments for the amount USD 706 thousand to write off certain assets which do not have future benefits for the Group at the acquisition date. Consequently, the non-controlling interest (52.5% of net assets) is also reduced by the amount of USD 699.9 thousand.
• The Group made retrospective adjustments to the amount of purchase consideration for Kuwait for the total amount of USD 5,621,967 as per the relevant clauses of the Sales and Purchase Agreement signed between WDI and the Group. The outstanding consideration payable for Kuwait assets amounting to USD 12,000,000 was reduced to USD 9,875,000 to reflect the IFRS 3 Business combination measurement period adjustments as discussed in Note 4. The outstanding consideration payable is included as part of trade and other payables (Note 19).
**This represents share of non-controlling interests over the net assets of UPDC as of the acquisition date. From the date of acquisition to 31 December 2018, the acquired assets and entities contributed USD 20,681,056 of revenue from continuing operations of the Group, and PDC reported the profit of USD 484,232. It is impracticable to disclose the revenue and profit or loss of the combined businesses for the year ended 31 December 2018, as if the combination had taken place at the beginning of the year, as the acquired assets and entities did not represent a reporting entity and the historical information is not available. The Group acquired the business comprised of the rigs along with the related items and UPDC rather than all the entities owning these businesses from the seller. C. Acquisitions of the rigs from Weatherford Drilling International – recorded in 2019 On 27 February 2019 and 25 March 2019, the Group acquired certain assets from Weatherford Drilling International in Algeria and Iraq, respectively. The acquisitions have been accounted for using the acquisition method. The Group acquired 6 onshore rigs in Algeria and related equipment, drilling contracts, other vendor contracts, certain employees, spare parts to be used in the drilling business, the business intellectual property and records related to the drilling business. While in Iraq, the Group acquired 2 onshore rigs and related equipment, certain employees, spare parts to be used in the drilling business, the business intellectual property and records related to the drilling business. Identifiable net assets acquired The fair value of the identifiable assets and liabilities as at the acquisition were:
USD Fair values recognized on
acquisition (Algeria) Fair values recognized on
acquisition (Iraq)
Property and equipment 55,983,324 17,200,000
Inventories 8,553,595 -
Total identifiable net assets at fair value 64,536,919 17,200,000
Bargain purchase gain arising on acquisitions (6,677,674) (5,200,000)
Purchase considerations 57,859,245 12,000,000
Analysis of cash flow on acquisition (included in cash flows from investing activities)
Cash paid (60,000,000) (12,000,000)
Cash collected* 2,140,755 -
Net cash out flows on acquisition (57,859,245) (12,000,000)
*The Group claimed and collected USD 2,140,755 from the Seller which represents a backlog deduction at the closing date for Algeria as per the terms of the Sales and Purchase Agreement signed between WDI and the Group. From the date of acquisition to 31 December 2019, the acquired assets and entities contributed USD 27,093,236 of revenue from continuing operations of the Group. It is impracticable to disclose the revenue and profit or loss of the rigs acquired for the year ended 31 December 2019 as if the combination had taken place at the beginning of the year, as the acquired assets and entities did not represent a reporting entity and the historical information is not available. The Group acquired the business comprised of the rigs and the related items, rather than the entire entity from WDI. The amount of profit contributed by these assets from the date of acquisition is also not disclosed, as these rigs do not represent a separate reporting entity and it impracticable to prepare the profit and loss for the rigs.

45 | ADES International Holding PLC
FY2019 FINAL RESULTS London | 7 April 2020
7 REVENUE FROM CONTRACT WITH CUSTOMERS
USD 2019 2018
Units operations 456,563,354 196,286,916
Catering services 8,979,507 3,006,326
Projects income * 3,983,560 4,683,478
Others 8,231,126 1,586,670
477,757,547 205,563,390
*Projects income represents services relating to outsourcing various operating projects for clients such as manpower, well platform installation, maintenance and repair services.
The disaggregation of revenue in accordance with IFRS 15 is in line with the segments disclosed in Note 5 above as the management monitors the revenue geographically and the primary operational revenue stream is drilling services (units operations) and the revenue is recognised over the time of service.
8 COST OF REVENUE
USD 2019 2018
Restated*
Project direct costs 2,158,618 2,596,283
Maintenance costs 45,020,299 14,743,854
Staff costs 102,244,315 35,326,884
Rental equipment 8,201,081 2,288,103
Insurance 6,994,574 4,843,389
Depreciation (Note 17) 49,460,710 27,936,711
Catering costs 20,262,059 6,167,562
Move costs 18,738,061 3,082,553
Crew change costs 7,448,904 1,830,239
Other costs 25,199,491 8,778,004
285,728,112 107,593,582
* The corresponding figures for 2018 have been adjusted to reflect the IFRS 3 Business combination measurement period adjustments as discussed in Note 4 and to improve presentation.
9 GENERAL AND ADMINISTRATIVE EXPENSE
USD 2019 2018
Staff costs* 31,131,732 12,194,853
Depreciation and amortisation (Note 17) 1,563,856 385,964
Professional fees 4,095,097 2,215,480
Business travel expenses 3,385,222 1,816,136
Free zone expenses 3,897,863 2,065,073
Rental expenses 1,011,096 1,022,968
Other expenses 7,378,803 4,270,895
52,463,669 23,971,369
* It includes staff cost of USD 8,487,320 in relation to the integration project carried with help of one of the top tier
consultants.

46 | ADES International Holding PLC
FY2019 FINAL RESULTS London | 7 April 2020
10 FINANCE COSTS
USD 2019 2018
Restated*
Loan interest and profit expense 30,956,580 25,204,082
Loan fees and written of prepaid transaction cost 27,568,312 4,160,525
Bond interest and bond fees amortisation 20,589,926 -
Guarantee related finance charges 3,146,155 -
Interest on lease liabilities 1,376,722 -
IRS related finance charges 1,062,725 -
Interest on overdraft facilities 1,094,760 1,423,310
Initial recognition loss from discounting of a long-term trade receivable 1,195,201 -
Other finance charges 1,711,698 445,695
88,702,079 31,233,612
11 INCOME TAX
USD 2019 2018
Consolidated statement of profit or loss: Current income tax expense* 9,772,755 3,788,784
Deferred tax expense (435,390) -
Charge for the year ended (note 19) 9,337,365 3,788,784
Consolidated statement of financial position: Current liabilities:
Balance at 1 January 3,040,753 2,288,282
Charge for the year 9,777,802 3,840,581
Release during the year (5,047) (51,797)
Paid during the year (2,837,570) (3,036,313)
Balance at 31 December (note 19) 9,975,938 3,040,753
Profit before income tax 40,870,927 75,033,664
Tax calculated at domestic tax rates applicable to profits profit in the primary jurisdiction of 0% (2018:0%) - -
Effect of different tax rates in countries in which the Group operates 15,142,720 1,643,938
Non-deductible expenses 1,611,116 217,148
Non-taxable income (13,853,048) -
Withholding taxes 6,436,577 1,979,495
Other taxes - (51,797)
Income tax expense recognised in the consolidated statement of comprehensive income
9,337,365
3,788,784
*Current income tax expense includes withholding taxes on intercompany rentals in the Kingdom of Saudi Arabia amounting to USD 4,435,809 (2018: USD 1,979,495).
The effective tax rate is 23% (2018: 5%, excluding the credit in respect of prior year adjustments).
The Group operates in jurisdictions which are subject to tax at higher rates than the statutory corporate tax rate of 0%, which is applicable to profits in Algeria and Kingdom of Saudi Arabia where applicable tax rate is 26% and 20% respectively.
Egyptian corporations are normally subject to corporate income tax at a statutory rate of 22.5% however the Company has been registered in a Free Zone in Alexandria under the Investment Law No 8 of 1997 which allows exemption from corporate income tax.

47 | ADES International Holding PLC
FY2019 FINAL RESULTS London | 7 April 2020
12 INVESTMENT IN A JOINT VENTURE AND AN ASSOCIATE
Investment in Egyptian Chinese Drilling Company: The Group holds a 48.75% equity interest in Egyptian Chinese Drilling Company (ECDC) amounting to USD 2,207,916 as at 31 December 2019 (2018: USD 2,184,382). The Group acquired the investment on 30 March 2015 from AMAK Drilling and Petroleum Services Co. (a related party) at par value. ECDC is a Joint Stock Company operating in storing and renting machinery and all needed equipment to the petroleum industry.
As at 31 December 2017, the Group has treated this investment as available for sale since it has no representation on the Board. On 5 July 2018, the Shareholders entered into a Shareholders Agreement whereby the Group obtained a joint control over ECDC. While the legal formalities for the change in the articles of association is in progress as of 31 December 2019, as per the Shareholders Agreement the investment became an investment in a joint venture effective 5 July 2019. The investment in joint venture is accounted for using the equity method of accounting effective from the date of change. The Group recognised dividends of USD 1,225,000 from Egyptian Chinese Drilling Company during the year ended 31 December 2015 which is outstanding as at 31 December 2019 and 2018 (Note 16). Summarised financial information of the joint venture and reconciliation with the carrying amount of the investment in the consolidated financial statements are set out below: Summarised statement of financial position as at 31 December 2019:
USD 2019 2018
Non-current assets 10,127,468
8,831,562
Current assets 12,898,092 15,126,615 Non-current liabilities - (2,057,094) Current liabilities (18,496,502) (16,920,300)
Net assets 4,529,058 4,980,783 The Group’s share in net assets at adjusted fair value equity - 48.75%* 2,207,916 2,184,382 Summarised statement of comprehensive income as of 31 December 2019: Revenues
12,997,816
14,406,829
Cost of revenues (10,547,288)
(11,451,747)
Other income 39,317 36,498 General and administrative expenses (2,295,955) (2,116,591) Provision, net 32,595 (1,150,000)
Operating profit 226,485 (275,011) Finance costs (178,211) (57,150) Foreign exchange gain - 13,581 Non-operating income - 1,434,825
Profit for the year 48,274 1,116,245 Profit for the period from 5 July 2018 to 31 December 2018
-
480,783
Group’s share of profit for the period - 48.75%** 23,533 234,382
In the 2018 consolidated financial statements , the summarised statement of the financial positions was prepared based on the provisional fair values of the assets and liabilities of ECDC on 5 July 2018. During the year ended 31 December 2019, the Group completed additional clarifications and analysis on the fair values which did not result in any adjustments to the fair values of the assets and liabilities of ECDC at the date of the change from financial instrument to the joint venture . ** For the year ended 31 December 2018, the amount represents 48.75% Group’s share in the net profit of the joint venture from 5 July 2018 to 31 December 2018. The joint venture had no other contingent liabilities or commitments as at 31 December 2019 (2018: USD nil). The joint venture cannot distribute its profits without the consent from the two venture partners.

48 | ADES International Holding PLC
FY2019 FINAL RESULTS London | 7 April 2020
Investment in ADVantage Drilling Services S.A.E: The Group holds 49% equity interest in ADVantage Drilling Services S.A.E amounting to USD 1,932,660 as at 31 December 2019 (2018: USD Nil). ADVantage Drilling Services S.A.E is a Joint Stock Company operating drilling deep marine wells, oil-producing wells or natural gas at depths exceeding 350 meters and exploration activities, maintenance of petroleum and gas wells and all the related services, owning, operation, management, renting and leasing of onshore and offshore equipment. ADVantage Drilling Services S.A.E has been established as a Free Zone company in accordance with the provisions of the Investment Law No. 72 of 2017 at 15 January 2019. Summarised financial information of the joint venture and reconciliation with the carrying amount of the investment in the consolidated financial statements are set out below: Summarised statement of financial position as at 31 December 2019:
USD 2019
Non-current assets 54,661
Current assets 18,145,907
Non-current liabilities -
Current liabilities (14,256,364)
Net assets 3,944,204
The Group’s share in net assets at adjusted fair value equity - 49%* 1,932,660
Summarised statement of comprehensive income as of 31 December 2019:
USD 2019
Revenues 23,285,002
Cost of revenues (19,563,731)
General and administrative expenses (2,214,631)
Operating profit 1,506,640
Finance costs (5,486)
Net Foreign exchange gain 32,244
Profit for the year 1,533,398
Profit for the period from 31 December 2019 1,533,398
Group’s share of profit for the period - 49% 751,365
The associate had no other contingent liabilities or commitments as at 31 December 2019 (2018: USD nil). The associate cannot distribute its profits without the consent from the two venture partners.

49 | ADES International Holding PLC
FY2019 FINAL RESULTS London | 7 April 2020
13 BANK BALANCES AND CASH
USD 2019 2018
Cash on hand 21,245 31,399 Bank balances 56,373,290 99,808,981 Time deposits 63,206,624 31,034,859
119,601,159 130,875,239
Escrow account held to acquire new assets -
(10,800,000)
Cash and cash equivalents for the purpose of statement of cash flows 119,601,159 120,075,239
Bank balances and cash comprise of balances in the following currencies: United States Dollar (USD) 33,943,487 90,062,113 Saudi Riyal (SAR) 4,367,958 6,610,718 Egyptian Pound (EGP) 3,879,327 2,417,859 United Arab Emirates Dirham (AED) 38 531 Great British Pound (GBP) 160 6,111 Euro (EUR) 883 247 Algerian Dinar (DZD) 1,377,837 254,620 Kuwaiti Dinar (KWD) 12,824,846 488,181 Time deposits (USD)* 63,206,623 31,034,859
119,601,159 130,875,239
*Time deposits represent short-term investment with a local bank in the United Arab Emirates. Time deposits have original maturities of less than 90 days and earns average interest of 2.8% per annum (2018: 2.05%). The finance income reported in the consolidated statement of comprehensive income for the year 2019 amounted to USD 512,013 (2018: USD 2,738,844).
14 INVENTORIES
USD 2019 2018
Offshore rigs 19,818,133 19,536,583
Onshore rigs 8,295,669 8,077,032
Warehouse and yards 16,706,362 5,058,705
44,820,164 32,672,320
As at 31 December 2019, the inventories are stated net of provision for impairment of inventory of USD 253,329 (2018: Nil). *Comparative information has been adjusted to reflect the IFRS 3 Business combination measurement period adjustments, refer to note 4.
15 TRADE RECEIVABLES AND CONTRACT ASSETS
Trade receivables
USD 2019 2018
Trade receivables 132,896,203 105,701,885
Provision for impairment in trade receivables (2,168,121) (4,944,373)
130,728,082 100,757,512
Maturing within 12 months 91,780,792 100,757,512
Maturing after 12 months 38,947,290 -
Balance as at 31 December 130,728,082 100,757,512

50 | ADES International Holding PLC
FY2019 FINAL RESULTS London | 7 April 2020
Trade receivables are non-interest bearing and are generally on 30 to 90 days terms, except for one customer which is recorded as non-current, after which trade receivables are considered to be past due. Unimpaired trade receivables are expected to be fully recoverable on the past experience. It is not the practice of the Group to obtain collateral over receivables and the vast majority are, therefore, unsecured. Contract assets As at 31 December 2019, the Group has contract assets of USD 41,541,310 (2018: 36,369,649). As at 31 December 2019, there was no impairment of contract assets and hence no ECL has been recorded. The movement in the provision for impairment of trade receivables is as follows:
USD 2019 2018
As at 1 January 4,944,373 3,693,766
Charge for the year - 1,250,607
Release for the year (2,776,252) -
As at 31 December 2,168,121 4,944,373
As at 31 December, the aging analysis of un-impaired trade receivables is as follows:
Past due but not impaired
USD Neither past due
nor impaired
<30 days
30 - 60 days
61 - 90 days
>90 days
Total
2019 99,540,594 10,527,810 2,668,836 1,808,191 16,182,651 130,728,082
2018 36,620,688 7,110,821 3,744,240 6,837,607 46,444,156 100,757,512
As at 31 December 2018, the largest portion of over due balances over 90 days is from one customer of the Group,
which is a partially government owned entity. In 2019 the Group signed a settlement agreement with the customer to
settle all due balance and the management believes that the customer will be able to fulfil its obligations. The
application of forward looking information has no material impact on the ECL provision.
16 PREPAYMENTS AND OTHER RECEIVABLES
USD 2017 2016
Invoice retention 44,361,741 25,933,048
Margin LG (Note 30) 2,379,048 5,635,765
Advances to contractors and suppliers 12,018,430 5,513,390
Insurance with customers 3,979,741 3,890,082
Dividends receivable 1,225,000 1,225,000
Provision for impairment in dividends receivables -245,000 -245,000
Other receivables 8,431,595 10,430,808
72,150,555 52,383,093
*Accrued revenue represents services rendered but not yet billed at the reporting date. As at 31 December 2018, the accrued revenue is presented as contract assets in Note 14.

FY2019 FINAL RESULTS London | 7 April 2020
17 PROPERTY AND EQUIPMENT
*Comparative information has been adjusted to reflect the IFRS 3 Business combination measurement period adjustments, refer to note 4.
USD Rigs * Furniture and
fixtures Drilling pipes Tools Assets under construction
IT equipment
Motor vehicles
Leasehold improvements Total
31 December 2019
Cost:
As at 1 January 2019 645,604,819 1,188,005 13,137,229 30,586,817 124,673,795 777,987 249,765 256,804 816,475,221
Additions 13,231,608 219,577 461,069 6,420,413 218,467,321 47,137 - 36,747 238,883,872
Acquisitions through business combinations (Note 6)
42,378,439 - - - 30,804,885 - - - 73,183,324
Transfers 285,572,016 105,596 2,098,219 5,717,389 (294,018,596) 131,456 - 393,920 -
Transfer to intangible assets - - - - (12,976) - - - (12,976)
As at 31 December 2019 986,786,882 1,513,178 15,696,517 42,724,619 79,914,429 956,580 249,765 687,471 1,128,529,441
Accumulated depreciation and impairment:
As of 1 January 2019 (82,370,839) (476,251) (3,268,635) (8,130,782) (765,291) (443,545) (184,137) (118,623) (95,758,103)
Depreciation for the year (40,202,545) (118,947) (1,761,977) (3,227,333) - (129,484) (36,768) (77,970) (45,555,024)
As of 31 December 2019 (122,573,384) (595,198) (5,030,612) (11,358,115) (765,291) (573,029) (220,905) (196,593) (141,313,127)
Net book value:
At 31 December 2019 864,213,498 917,980 10,665,905 31,366,504 79,149,138 383,551 28,860 490,878 987,216,314

FY2019 FINAL RESULTS London | 7 April 2020
17 PROPERTY AND EQUIPMENT (cont’d)
USD Rigs *
Furniture and
fixtures Drilling
pipes Tools
Assets under
construction Office-
premises
Computers and
equipment Motor
vehicles Leasehold
improvements Total
31-Dec-18
Cost: As at 1 January 2018 316,529,474 1,154,408 8,075,026 21,977,187 41,115,141 - 666,495 249,765 232,453 389,999,949
Additions 647,078 26,727 5,062,203 4,105,794 83,062,191 6,622,148 91,803 - 24,351 99,642,295
Acquisitions through business combinations, restated*
224,337,304 - - 3,914,373 105,224,856 - - - - 333,476,533
Transfers 104,090,963 6,870 - 589,463 (104,706,985) - 19,689 - - -
Transfer to intangible Assets - - - - (21,408) - - - - (21,408)
As at 31 December 2018, restated*
645,604,819 1,188,005 13,137,229 30,586,817 124,673,795 6,622,148 777,987 249,765 256,804 823,097,369
Accumulated depreciation and impairment:
As at 1 January 2018 (58,139,451) (367,329) (1,653,630) (6,071,696) (765,291) - (333,381) (145,520) (81,676) (67,557,974)
Depreciation for the year, restated*
(24,231,388) (108,922) (1,615,005) (2,059,085) - - (110,164) (38,617) (36,947) (28,200,128)
As of 31 Dec 2018, restated* (82,370,839) (476,251) (3,268,635) (8,130,781) (765,291) - (443,545) (184,137) (118,623) (95,758,102)
Net book value:
At 31 December 2018, restated* 563,233,980 711,754 9,868,594 22,456,036 123,908,504 6,622,148 334,442 65,628 138,181 727,339,267
*Comparative information has been adjusted to reflect the IFRS 3 Business combination measurement period adjustments, refer to note 4.
**The building reported as at 31 December 2018 pertains to the office premises of the Group under finance lease arrangement. The Group reclassified the
balance on 1 January 2019 as right of use asset in accordance with the requirement of IFRS 16.
Capitalised borrowing costs
The amount of borrowing costs capitalised during the year ended 31 December 2019 amounted to USD nil-(2018: USD 446,796).
.

53 | ADES International Holding PLC
FY2019 FINAL RESULTS London | 7 April 2020
17 PROPERTY AND EQUIPMENT (cont’d)
Depreciation charge is allocated as follows:
USD 2019 2018
Cost of revenue (Note 8) 49,460,710 27,936,711 General and administrative expenses (Note 9) 1,563,856 385,964
Total depreciation charge* 51,024,566 28,322,675
*Total depreciation charge for the year includes amortisation of intangible assets and right of use assets of USD 121,861 (2018: USD 122,547) and USD 5,348,361(2018: nil), respectively.
Assets under construction Assets under construction represent the amounts that are incurred for the purpose of upgrading and refurbishing property and equipment until it is ready to be used in the operation. Assets under construction will be transferred to ‘Rigs’ or ‘Tools’ of the property and equipment after completion.
*Some of the rigs are pledged to the lenders (banks) against loans and borrowings (Note 20).
18 INTANGIBLE ASSETS
USD 2019 2018
Cost: As at 1 January 776,653 742,457 Additions - 12,788 Transfer from property & equipment 12,976 21,408
As at 31 December 789,629 776,653
Accumulated amortisation: As at 1 January 320,464 197,917 Amortisation charge for the year 121,861 122,547
As at 31 December 442,325 320,464
Net carrying amount As at 31 December 347,304 456,189
Intangible assets represent computer software and the related licenses.
19 TRADE AND OTHER PAYABLES
USD 2019 2018 Restated*
Local trade payables 89,670,226 32,833,885 Foreign trade payables 24,930,548 4,241,609 Notes payable 2,371,597 333,519 Accrued expenses 41,035,747 14,995,275 Accrued interests 9,560,653 7,811,987 Income tax payable (Note 11) 9,975,938 3,040,753 Deferred consideration payable related to business acquisitions (Note 6) - 9,875,000 Finance lease liability (Note 2.2) 8,793,910 567,960 Other payables 9,990,837 9,598,436
196,329,456 83,298,424
*Comparative information has been adjusted to reflect the IFRS 3 Business combination measurement period
adjustments, refer to note 4

54 | ADES International Holding PLC
FY2019 FINAL RESULTS London | 7 April 2020
20 LOANS AND BORROWINGS
USD 2019 2018
Balance as at 1 January 555,268,918 212,489,035
Borrowings drawn during the year 179,493,220 569,304,756
Borrowings repaid during the year (351,018,420) (238,038,216)
Amortised arrangement fees 22,303,610 11,513,343
Balance as at 31 December 406,047,328 555,268,918
Maturing within 12 months 83,692,835 45,258,354
Maturing after 12 months 322,354,493 510,010,564
Balance as at 31 December 406,047,328 555,268,918
Type Interest rate % Latest maturity 2019 USD
2018 USD
Current loans and borrowings
Loan 1 Syndication
Tranche A 5.0% + 6 Month LIBOR 3.5 years 15,050,000 - - Ijara Loan - Tranche A 3.25% + 6 Months SAIBOR 7 years 15,554,000 - Tranche B 3.25% + 6 Months SAIBOR 7 years 15,554,000 - Tranche C 3.25% + 6 Months SAIBOR 7 years 8,888,000
NCB Loan NCB Loan 2.25%+SAIBOR 6 years 6,153,846 Loan 2 Syndication
Tranche A 5.0% + 6 Month LIBOR 5 years - 21,500,000 Tranche C 5.0% + 6 Month LIBOR 5 years - 17,568,851 Murabaha facility 5.0% + 6 Month LIBOR 5 years - 3,189,734 - Credit facility 1 1.25% + Corridor Renewable (177) (186) Credit facility 2 4.50% + 3 Month LIBOR Renewable 3,996,693 - Credit facility 3 6.50% + 3 Month LIBOR Renewable 3,551,531 2,999,955 Credit facility 4 4% + 3 Month LIBOR Renewable 111,609 - Credit facility 5 2% + 6 Month LIBOR Renewable 5,333,333 - RCF 3.5% + 3 Month LIBOR Renewable 9,500,000 - ────────── ──────────
Total current loans and borrowings 83,692,835 45,258,354 ══════════ ══════════
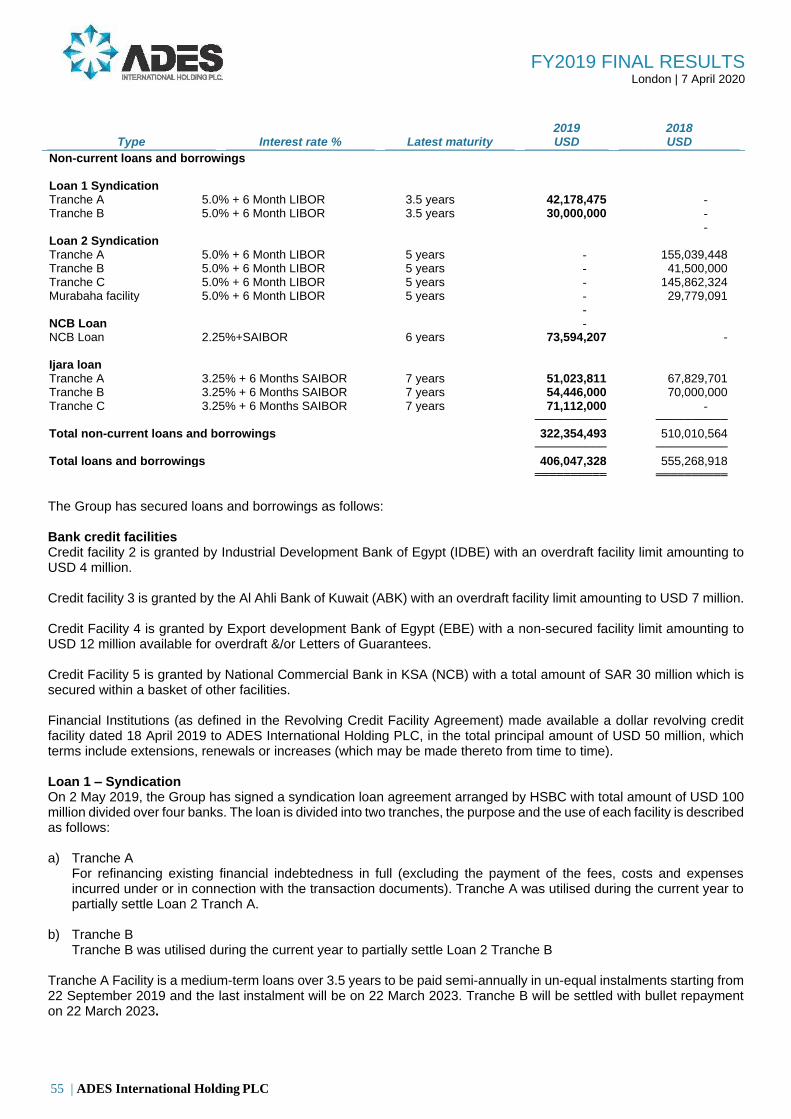
55 | ADES International Holding PLC
FY2019 FINAL RESULTS London | 7 April 2020
Type Interest rate % Latest maturity 2019 USD
2018 USD
Non-current loans and borrowings Loan 1 Syndication
Tranche A 5.0% + 6 Month LIBOR 3.5 years 42,178,475 - Tranche B 5.0% + 6 Month LIBOR 3.5 years 30,000,000 - Loan 2 Syndication
-
Tranche A 5.0% + 6 Month LIBOR 5 years - 155,039,448 Tranche B 5.0% + 6 Month LIBOR 5 years - 41,500,000 Tranche C 5.0% + 6 Month LIBOR 5 years - 145,862,324 Murabaha facility 5.0% + 6 Month LIBOR 5 years - 29,779,091 - NCB Loan - NCB Loan 2.25%+SAIBOR 6 years 73,594,207 - Ijara loan
Tranche A 3.25% + 6 Months SAIBOR 7 years 51,023,811 67,829,701 Tranche B 3.25% + 6 Months SAIBOR 7 years 54,446,000 70,000,000 Tranche C 3.25% + 6 Months SAIBOR 7 years 71,112,000 - ────────── ──────────
Total non-current loans and borrowings 322,354,493 510,010,564 ────────── ──────────
Total loans and borrowings 406,047,328 555,268,918 ══════════ ══════════
The Group has secured loans and borrowings as follows: Bank credit facilities Credit facility 2 is granted by Industrial Development Bank of Egypt (IDBE) with an overdraft facility limit amounting to USD 4 million. Credit facility 3 is granted by the Al Ahli Bank of Kuwait (ABK) with an overdraft facility limit amounting to USD 7 million. Credit Facility 4 is granted by Export development Bank of Egypt (EBE) with a non-secured facility limit amounting to USD 12 million available for overdraft &/or Letters of Guarantees. Credit Facility 5 is granted by National Commercial Bank in KSA (NCB) with a total amount of SAR 30 million which is secured within a basket of other facilities. Financial Institutions (as defined in the Revolving Credit Facility Agreement) made available a dollar revolving credit facility dated 18 April 2019 to ADES International Holding PLC, in the total principal amount of USD 50 million, which terms include extensions, renewals or increases (which may be made thereto from time to time). Loan 1 – Syndication On 2 May 2019, the Group has signed a syndication loan agreement arranged by HSBC with total amount of USD 100 million divided over four banks. The loan is divided into two tranches, the purpose and the use of each facility is described as follows: a) Tranche A
For refinancing existing financial indebtedness in full (excluding the payment of the fees, costs and expenses incurred under or in connection with the transaction documents). Tranche A was utilised during the current year to partially settle Loan 2 Tranch A.
b) Tranche B Tranche B was utilised during the current year to partially settle Loan 2 Tranche B Tranche A Facility is a medium-term loans over 3.5 years to be paid semi-annually in un-equal instalments starting from 22 September 2019 and the last instalment will be on 22 March 2023. Tranche B will be settled with bullet repayment on 22 March 2023.

56 | ADES International Holding PLC
FY2019 FINAL RESULTS London | 7 April 2020
Loan 2 – Syndication On 22 March 2018, the Group has signed a syndication loan agreement arranged by Merrill Lynch International and EBRD with total amount of USD 450 million divided over eleven banks. The loan is divided into four tranches, the purpose and the use of each facility is described as follows: a) Tranche A
For refinancing existing financial indebtedness in full (including the payment of the fees, costs and expenses incurred under or in connection with the transaction documents). Tranche A was utilised in 2018 to settle financial indebtedness. On 2 May 2019, USD 130 million was settled in cash and USD 70 million was refinanced by Loan 1 Tranch A.
b) Tranche B New working capital purposes and to refinance certain existing working capital facilities. Tranche B was utilised in
2018. On 2 May 2019, USD 11.5 million was settled in cash and USD 30 million was refinanced as discussed by Loan 1 Tranch B.
c) Tranche C Capital expenditure for the acquisition of the new rigs and mobile offshore production units. Tranche C was partially
utilised in 2018. On 2 May 2019, Tranche C was fully settled in cash. d) “Murabaha Facility”
Capital expenditure for the acquisition of the new rigs and mobile offshore production units. Murabaha Facility was partially utilised in 2018. On 2 May 2019, Murabaha Facility was fully settled in cash.
Ijara Loan On 22 May 2018, the Group has signed “Musharakah” agreement and “Ijara” agreement with Alinma Bank to finance the acquisition of the new rigs and related capital expenditure with the amount of the equivalent to USD 140 million in SAR. On 25 April 2019 , the Group has signed “Musharakah” agreement and “Ijara” agreement with Alinma Bank to increase the facility to the equivalent to USD 284 million . All loans are medium-term loans over 7 years which includes 2 year grace period and is paid semi-annually in equal instalments starting from 10 June 2020 and the last instalment will be on 10 June 2024. Ijara loan is secured by the rigs purchased from Nabors Drilling International II Limited (Jackup rig Admarine 656, Jackup rig Admarine 656 and Jackup rig Admarine 657) and rigs purchased from Weatherford Drilling International (ADES 40, ADES 158, ADES 174, ADES 799 and ADES 889, Rig 144, Rig 798, Rig 157, Rig 173) (Note 5). NCB Loan On 14 May 2019, the group signed a Long Term Loan Facility agreement with National Commercial Bank ("NCB") for a total limit of SAR 300 million (USD 80 million). As of 31 December 2019, the Group has fully utilized the facility. On 10 December 2019, the group has amended the facility with National Commercial Bank ("NCB") to be Sharia compliant (Islamic Facility) without any change in the original agreed terms.
21 BONDS PAYABLE On 16 April 2019, the Group issued USD 325,000,000 senior secured notes at 8.625% interest due on 24 April 2024. Interest is payable semi-annually on 24 April and 24 October each year commencing on 24 October 2019. The Group paid USD 11,841,032 as transaction costs for the issuance of the bonds. The Group recognised interest expense of USD 20,589,926 for the twelve months period ended 31 December 2019. The bonds payable is recognised at amortised cost using the effective interest method.

57 | ADES International Holding PLC
FY2019 FINAL RESULTS London | 7 April 2020
22 PROVISIONS
USD As at
1 January
*Accrued / acquired during
the year
Paid during
the year
As at
31 December
2019 Provision for end of service benefits * 12,959,590 4,899,967 (1,483,905) 16,375,652
Other tax provisions ** 1,874,654 1,443,181 (2,217,835) 1,100,000
14,834,244 6,343,148 (3,701,740) 17,475,652
2018 Provision for end of service benefits 620,083 12,442,304 (102,797) 12,959,590
Other tax provisions 1,836,000 280,017 (241,363) 1,874,654
2,456,083 12,722,321 (344,160) 14,834,244
* Other provisions mainly represent provision made for employee’s taxes and withholding taxes which are borne by
the Group. The total balance is presented as current in the statement of financial position.
** Comparative information has been adjusted to reflect the IFRS 3 Business combination measurement period
adjustments, refer to note 4.
23 SHARE CAPITAL
Share capital of the Group comprise:
USD 2019 2018
Authorised shares* 1,500,000,000 1,500,000,000 Issued shares 43,793,882 43,793,882 Shares par value 1.00 1.00
Issued and paid up capital** 43,793,882 43,793,882
Share premium*** 178,746,337 178,746,337
*As at 31 December 2019 and 2018, the authorised share capital of the Company was USD 1,500,000,000 comprising of 1,500,000,000 shares.
**In 2018, the Group issued 1,590,852 shares to Nabors as part of the consideration paid for the business acquisition (Note 6).
*** Share premium represents the excess of fair value received over the par value of shares issued as a result of business combinations (Note 6).
Movement in treasury shares as at 31 December 2019 is as follows:
Shares issued
Treasury shares*
Shares outstanding
1 January 2019 Balance at beginning of year 43,793,882 - 43,793,882 Purchase of treasury shares for cash - 300,000 300,000
31 December 2019 Balance at year end 43,793,882 300,000 43,493,882
* On 29 November 2019 the Group announced that pursuant to Shareholders’ authority granted at the Company's
EGM on 30 October 2019, it intends to commence purchases of ordinary shares in the capital of the Company. As at
31 December 2019 the total number of purchased ordinary shares that held as treasury shares is 300,000 amounted
to USD 3,501,200 at the purchase price.

58 | ADES International Holding PLC
FY2019 FINAL RESULTS London | 7 April 2020
The shareholding structure as at 31 December 2019 is: Shareholding % No. of Value
Shareholders shares USD
ADES Investment Holding Ltd 62 27,179,084 27,179,084 Individual shareholders 38 16,614,798 16,614,798
100 43,793,882 43,793,882
The shareholding structure as at 31 December 2018 was: Shareholding % No. of Value
Shareholders shares USD
ADES Investment Holding Ltd 63 27,446,772 27,446,772 Individual shareholders 37 16,347,110 16,347,110
100 43,793,882 43,793,882
24 EQUITY SETTLED SHARE-BASED PAYMENTS Pursuant to the rules of the Long Term Incentive Plan (“LTIP”) adopted by ADES Investments Holding Ltd., the awards over a total number of 1,136,451 ordinary shares of USD 1.00 each in the capital of the Company have been granted to certain employees of the Company by ADES Investments Holding Ltd (the majority shareholder). The LTIP is equity settled and effective from 1 January 2019. According to the LTIP rules, the shares will be vested over a period of three years and not subject to performance conditions. These shares are currently held by ADES Investments Holding Ltd and the awards will not be satisfied by the new issue of any shares in the Company. Awards will normally lapse and cease to vest on termination of employment. The fair value at grant date was determined based on the market price of the shares of the Company at grant date which is USD 13.45 per share. For the year ended 31 December 2019, the Group has recognised USD 11,341,219 of share-based payment expense, which represent 843,211 shares vested during the year, in the consolidated statement of profit or loss (31 December 2018: USD Nil) with a corresponding increase in equity (share-based payment reserve). As at 31 December 2019, the outstanding number of shares are 293,240. There were no forfeited nor expired shares during the year.
25 RESERVES Legal reserve As required by Egyptian Companies’ Law and one of the Subsidiary’s Articles of Association, 5% of the net profit for the year is transferred to legal reserve. Advanced Energy System (ADES) (S.A.E.) has resolved to discontinue further transfers as the reserve totals 20% of issued share capital. As of 31 December 2019, the balance of legal reserve amounted to USD 6,400,000 (2018: USD 6,400,000). Merger reserve As disclosed in Note 1, pursuant to a reorganisation plan, the shareholders reorganised the Group by establishing the Company as a new holding company. Merger reserve represents the difference between the consideration paid to the shareholders under the reorganisation plan and the nominal value of the shares of Advanced Energy System (ADES) (S.A.E.). Prior to the reorganisation, the merger reserve comprise of the share capital and share application money of Advanced Energy System (ADES) (S.A.E.).
Interest rate risk Total
2019 2018 2019 2018
Balance at 1 January - - - - Gain (losses) arising on changes in fair value of hedging instruments during the period (6,748,538) - (6,748,538) - (Gain)/loss reclassified to profit or loss – when hedged item has affected profit or loss 600,963 - 600,963 -

59 | ADES International Holding PLC
FY2019 FINAL RESULTS London | 7 April 2020
Balance at 31 December 6,147,575 - 6,147,575 -
The cash flow hedge reserve represents the cumulative amount of gains and losses on hedging instruments deemed effective in cash flow hedge relationships. The cumulative deferred gain or loss on the hedging instrument is recognised in profit or loss only when the hedged transaction impacts the profit or loss, or is included directly in the initial cost or other carrying amount of the hedged non-financial items (as basis adjustment, where applicable).
26 EARNINGS PER SHARE Basic earnings per share (EPS) amounts are calculated by dividing the profit for the year attributable to the ordinary equity holders of the Parent by the weighted average number of ordinary shares outstanding during the year after adjusting the number of ordinary shares by the treasury shares. Diluted EPS is calculated by adjusting the weighted average number of ordinary shares outstanding assuming conversion of all dilutive potential ordinary shares. As at 31 December 2019, there were no potential dilutive shares and hence the basic and diluted EPS is same. The information necessary to calculate basic and diluted earnings per share is as follows:
USD 2019 2018
Restated*
Profit attributable to the ordinary equity holders of the Parent for basic and diluted EPS 28,630,013
72,892,277
Weighted average number of ordinary shares –
basic and diluted 43,778,181 43,082,201
Earnings per share – basic and diluted (USD per share) 0.65 1.69
*Comparative information has been adjusted to reflect the IFRS 3 Business combination measurement period adjustments, refer to note 4
27 RELATED PARTIES TRANSACTIONS AND BALANCES
Related party transactions During the year, the following were the significant related party transactions recorded in the consolidated statement of comprehensive income or consolidated statement of financial position: During the year, the Group transferred funds to and on behalf of a related party, AMAK for Drilling & Petroleum Services Co. (other related party), amounting to USD 4,676,418 for settlement of payable and fixed assets purchased in 2019. (2018: USD 11,265,899).
Related party balances Significant related party balances included in the consolidated statement of financial position are as follows:
2019 2018
Due from Due to Due from Due to
Ultimate Shareholders Sky Investment Holding Ltd. 60,000 - 60,000 - Intro Investment Holding Ltd. 90,503 - 90,502 - Shareholder ADES Investment Holding Ltd 48,864 - 46,364 - Joint venture Egyptian Chinese Drilling Co. (S.A.E.) 57,192 170,618 - Other related parties TBS Holding 35,387 - 3,027 - Misr El-Mahrousa 14,624 - - - Advantage Drilling Services 425,271 - - - Advansys Project 1,308 - 1,308 - Advansys Holding 5,299 - 5,299 -

60 | ADES International Holding PLC
FY2019 FINAL RESULTS London | 7 April 2020
AMAK for Drilling & Petroleum Services Co. 4,019,924 - - 55,078 ADVANSYS FOR ENG.SERV. & CONS - 1,032 - 1,028 Intro for Trading & Contracting Co. 39,738 - 227 -
4,740,918 58,224 377,345 56,106
Compensation of key management personnel The remuneration of key management personnel during the year was as follows:
USD 2019 2018
Short-term benefits* 3,640,000 3,285,000
* There is no long term benefits for the key management personnel. Terms and conditions of transactions with related parties Outstanding balances at the year-end are unsecured, interest free and settled in cash. There have been no guarantees
provided or received for any related party receivables or payables. For the year ended 31 December 2019, the Group
has not recorded any provision for expected crdit losses relating to receivables and amounts owed by related parties
(2018: USD Nil). This assessment is undertaken each financial year by examining the financial position of the related
party and the market in which the related party operates.
28 FINANCIAL RISK MANAGEMENT OBJECTIVES AND POLICIES
Overview The Group’s principal financial liabilities comprise trade and other payables, due to related parties, loans and borrowings. The main purpose of these financial liabilities is to finance the Group’s operations and to provide support to its operations. The Group’s principal financial assets include cash in hand and at banks, including highly liquid investments with maturity less than 90 days, trade receivables and contract assets, due from related parties and other receivables that arrive directly from its operations. The Group is exposed to market risk, credit risk and liquidity risk. The Board of Directors of the Company oversees the management of these risks. The Board of Directors of the Company are supported by senior management that advises on financial risks and the appropriate financial risk governance framework for the Group. The Group's senior management provides assurance to the Board of Directors of the Group’s financial risk activities are governed by appropriate policies and procedures and that financial risks are identified, measured and managed in accordance with Group policies and Group risk appetite. The Board of Directors reviews and agrees policies for managing each of these risks, which are summarised below. The Group has exposure to the following risks from its use of financial instruments:
a) Credit risk, b) Market risk:
i. Interest rate risk ii. Foreign currency risk
c) Liquidity risk.
This note presents information about the Group's exposure to each of the above risks, the Group's objectives, policies and processes for measuring and managing risk, and the Group's management of capital. The Group's current financial risk management framework is a combination of formally documented risk management policies in certain areas and informal risk management policies in other areas.
Credit risk Credit risk is the risk that counterparty will not meet its obligations under a financial instrument or customer contract, leading to a financial loss. The Group is exposed to credit risk from its operating activities (primarily for trade receivables, contract assets and due from related parties) and from its financing activities, including letter of

61 | ADES International Holding PLC
FY2019 FINAL RESULTS London | 7 April 2020
guarantees with banks foreign exchange transactions and other financial instruments. As at 31 December 2019, the top three debtors of the Group represent 72% (2018: 84%) of trade receivable.
Trade receivables and contract assets Customer credit risk is managed by the Group’s established policy, procedures and controls relating to customer credit risk management. Credit quality of the customer is assessed based on a credit rating policy and individual credit limits are defined in accordance with this assessment. Outstanding customer receivables are regularly monitored.
The requirement for impairment is analysed at each reporting date on an individual basis for major clients. Additionally, a large number of minor receivables are grouped into homogenous groups and assessed for impairment collectively. The maximum exposure to credit risk at the reporting date is the carrying value of each class of financial assets. The Group does not hold collateral as security. The Group evaluates the concentration of risk with respect to trade receivables and contract assets as low, as its wide number of customers operates in highly independent markets. In addition, instalment dues are monitored on an ongoing basis.
Other financial assets and bank balances Credit risk from balances with banks and financial institutions is managed by the Group’s treasury department in accordance with the Group’s policy. Counterparty credit limits are reviewed by the Group’s Board of Directors on an annual basis, and may be updated throughout the year subject to approval of the Group’s senior management. The limits are set to minimise the concentration of risks and therefore mitigate financial loss through potential counterparty’s failure to make payments. The Group’s exposure to credit risk for the components of the consolidated statement of financial position is the carrying amounts of these assets. The Group limits its exposure to credit risk by only placing balances with international banks and reputable local banks. Management does not expect any counterparty in failing to meet its obligations.
Due from related parties Due from related parties relates to transactions arising in the normal course of business with minimal credit risk, with a maximum exposure equal to the carrying amount of these balances. Market risk Market risk is the risk that the fair value or future cash flows of a financial instrument will fluctuate because of changes in market prices, such as interest rate risk and currency risk. Financial instruments affected by market risk include: loans and borrowings. The Group neither designate hedge accounting or issue derivative financial instruments. Refer to note 29 for the interest rate swap classified as a trading derivative. Interest rate risk Interest rate risk is the risk that the fair value or future cash flows of a financial instrument will fluctuate because of changes in market interest rates. The Group’s exposure to the risk of changes in market interest rates relates primarily to the Group’s long-term debt obligations with floating interest rates. Interest rate sensitivity The following table demonstrates the sensitivity to a reasonably possible change in interest rates on loans and borrowings. With all other variables held constant, the Group’s profit is affected through the impact on floating rate borrowings (net of impact of time deposits), as follows:
USD Increase/decrease in
basis points Effect on profit
before income tax
31 December 2018
USD +100 (1,369,287) USD -100 1,369,287 31 December 2018
USD +100 (2,465,056) USD -100 2,465,056

62 | ADES International Holding PLC
FY2019 FINAL RESULTS London | 7 April 2020
Foreign currency risk Foreign currency risk is the risk that the fair value or future cash flows of a financial instrument will fluctuate because of changes in foreign exchange rates. The Group’s exposure to the risk of changes in foreign exchange rates relates primarily to the Group’s operating activities (when revenue or expense is denominated in a different currency from the Group’s functional currency). The following tables demonstrate the sensitivity to a reasonably possible change in USD exchange rates, with all other variables held constant. The impact on the Group’s profit is due to changes in the value of monetary assets and liabilities. The Group’s exposure to foreign currency changes for all other currencies is not material.
USD Change in USD rate
Effect on profit before income tax
USD
31 December 2018
USD +10% 678,829 USD -10% (678,829) 31 December 2018
USD +10% 519,417 USD -10% (519,417)
Liquidity risk The cash flows, funding requirements and liquidity of the Group are monitored by Group management. The Group's objective is to maintain a balance between continuity of funding and flexibility through the use of banks overdraft and bank loans. The Group assessed the concentration of risk with respect to refinancing its debt and concluded it to be low. Access to sources of funding is sufficiently available. The table below summarises the maturity profile of the Group’s financial liabilities based on contractual undiscounted payments.
Financial liabilities
Less than 3 3 to 12 1 to 5 Over
USD months months years 5 years Total
As at 31 December 2019
Loans and borrowings 20,680,991 100,671,911 770,139,912 12,465,041 903,957,855 Trade and other payables 74,541,408 111,812,110 10,988,839 - 197,342,357 Due to related parties - 57,224 - - 57,224 Lease liability 1,350,159 4,050,478 20,805,070 - 26,205,707 Derivative financial instrument 543,164 607,162 2,418,720 - 3,569,046
Total undiscounted financial liabilities 97,115,722 217,198,885 804,352,541 12,465,041 1,131,132,189
As at 31 December 2018
Loans and borrowings - 82,827,165 621,780,202 16,660,874 721,268,241 Trade and other payables 40,883,795 41,498,876 - - 82,382,671 Due to related parties - 56,106 - - 56,106 Finance lease liability 300,000 850,000 4,000,000 3,767,074 8,917,074 Derivative financial instrument 461,759 777,671 3,382,901 - 4,622,331
Total undiscounted financial liabilities 41,645,554 126,009,818 629,163,103 20,427,948 817,246,423

63 | ADES International Holding PLC
FY2019 FINAL RESULTS London | 7 April 2020
Capital management Capital includes share capital, share premium, reserves and retained earnings.
The primary objective of the Group’s capital management is to ensure that it will be able to continue as a going concern while maintaining a strong credit rating and healthy capital ratios in order to support its business and maximise shareholder value. The Group’s strategy remains unchanged since inception. The Group manages its capital structure and makes adjustments to it in light of changes in economic conditions and the requirements of the financial covenants. To maintain or adjust the capital structure, the Group may adjust the dividend payment to shareholders or return capital to shareholders. The Group monitors capital using a gearing ratio, which is net debt divided by total equity plus net debt. The Group’s policy is to keep the gearing ratio between 30% and 80%.
USD 2019
2018
Loans and borrowings (Note 20) 406,047,328
555,268,918
Bank balances and cash (Note 13) (119,601,159)
(130,875,239)
Net debt 286,446,169
424,393,679
Total equity 452,724,480
421,428,137
Total capital 739,170,649
845,821,816
Gearing ratio 39%
50%
29 FAIR VALUE OF FINANCIAL INSTRUMENTS
Financial instruments comprise financial assets and financial liabilities. Financial assets of the Group include bank balances and cash, trade receivables and contract assets, due from related parties and other receivables. Financial liabilities of the Group include trade payables, due to related parties, loans and borrowings, other payables and derivative financial instrument. The fair values of the financial assets and liabilities are not materially different from their carrying value unless stated otherwise.
30 CONTINGENT LIABILITIES AND COMMITMENTS
Contingent liabilities
USD 31 December 2019 31 December 2018
Letter of guarantees 33,572,453 25,708,373
Contingent liabilities represent letters of guarantee issued in favour of General Authority for Investment, Petrobel Group, Egyptian General Petroleum Corporation, Petro Gulf of Suez, Suze Abu Zenima Petroleum Company (Petro Zenima) and Association Sonatrach - First Calgary Petroleum. The cover margin on such guarantees amounted to USD 5,527,168 (31 December 2018: USD 5,635,765). The Group also had the following facilities:
• The Group signed a multicurrency Syndicated Credit facility agreement with Mashreq Bank PSC Dubai on 6 May 2019 and its subsequent amendments for the facility amounting to USD 90,000,000 for the issuance of Letters of Credit and Letters of Guarantees. As of 31 December 2019 the Group utilized letter of guarantees a total amount of USD 78,269,350.
• The Group entered into a bilateral Unfunded Trade Finance Facility Agreement with Arab Petroleum Investments Corporation (APICORP) on 22 July 2019 for total facility amounting to USD 30,000,000 for the issuance of Letters of Credit and Letters of Guarantees. As of 31 December 2019 the Group utilized letter of guarantees for a total amount of USD 2,872,836.

64 | ADES International Holding PLC
FY2019 FINAL RESULTS London | 7 April 2020
• The Group entered into a bilateral agreement with Al Ahli bank of Kuwait Egypt “ABK” dated on 29 May 2019 amounting to USD 3,000,000.00, by means of a Letter of Guarantee agreement. As of 31 December 2019, the Group has not utilized any amounts under the facility.
• The Group entered into specific indemnities with Bank of America on 10 June 2019 for an amount up to USD 4,000,000 for the issuance of certain Letters of Guarantees for some of its affiliates or subsidiaries. As of 31 December 2019, the Group utilized letter of guarantees for a total amount of USD 2,866,644.
• The Group entered into a bilateral agreement with Suez Canal Bank “SCB” dated on 21 October, 2018 amounting to USD 12,000,000.00 available as a revolving overdraft &/or Issuance of Letters of Guarantees. As of 31 December 2019, the Group utilized letter of guarantees for a total amount of USD 9,314,139.
• The Group entered into bilateral agreement with Export development bank of Egypt “EBE” bank dated on 18 July, 2018 amounting to USD 12,000,000.00, available as a revolving overdraft and/or Issuance of Letters of Guarantees As of 31 December 2019 the Group utilized letter of guarantees for a total amount of USD 8,999,880.
31 DERIVATIVE FINANCIAL INSTRUMENTS
USD 2019 2018
Derivative held for trading Interest rate swap 3,569,046 4,340,180
Balance as at 31 December 3,569,046 4,340,180
Total current 1,150,326 1,216,381 Total non-current 2,418,720 3,123,799
The following table shows an analysis of financial instruments recorded at fair value by level of the fair value hierarchy:
USD (000s) Total Level 1 Level 2 Level 3
31-Dec-19 Derivative financial instrument: Interest rate swap (3,569,046) - (3,569,046) -
During the year ended 31 December 2019, there were no transfers between Level 1 and Level 2 fair value measurements, and no transfers into and out of Level 3 at fair value measurements. (31 December 2018: USD 4,340,180). Interest rate swap derivatives relate to contracts taken out by the Group with other counterparties (mainly financial institutions) in which the Group either receives or pays a floating rate of interest, respectively, in return for paying or receiving a fixed rate of interest. The payment flows are usually netted against each other, with the difference being paid by one party to the other. Derivative financial instruments - classified as held for trading financial liabilities - are carried in the consolidated statement of financial position at fair value at the total of USD 3,569,046 as of 31 December 2019. The carrying amount of these derivatives represents the negative mark to market value of the remaining USD 100,000,000 notional amount of the swap contract that was originally entered into by the Group with Goldman Sachs (GS) in 2018, novated in 2019 and is still outstanding at 31 December 2019. The remaining tenor of the GS interest rate swap contract extends from 21 November 2019 until it terminates on 22 March 2023. The total notional amount of the GS interest rate swap before novation was USD 241,500,000 which represented at that time the loans withdrawn as Tranche A and B Loan under Loan 3 Syndication (note 20).
USD
2019
2018
Derivative financial liabilities that are designated and effective as hedging instruments Interest rate swap contracts 6,147,575 -
Balance as at 31 December 6,147,575 -
Total current 1,981,402 - Total non-current 4,166,173 -

65 | ADES International Holding PLC
FY2019 FINAL RESULTS London | 7 April 2020
The following table shows an analysis of financial instruments recorded at fair value by level of the fair value hierarchy: Derivative financial liabilities – that are designated and effective as hedging instruments (in a cash flow hedge relationship) - are carried in the consolidated statement of financial position at fair value at the total of USD 6,147,575 as of 31 December 2019. This carrying amount represents the negative mark to market value for SAR 530,625,000 notional amount (equivalent to USD 141,500,000 at date of novation) of the new swap contract that was entered into by the Group with National Commercial Bank (NCB) in 2019 (part of which was novated from the original swap contract with GS above). The tenor of the new NCB interest rate swap contract extends from 1 August 2019 until it terminates on 10 June 2025. The objective of the cash flow hedge is to protect against cash outflows variability related to floating-rate interest payments on the hedged portion of the Alinma credit facility using the 6-month SAIBOR rate (as shown in the following table). Such cash outflows variability results from changes which may occur on the 6-month SAIBOR market rate (i.e. the designated benchmark interest rate).
Borrowing (hedged item)
Type Notional amount
Hedged interest rate
Effective date
Maturity date
Alinma Credit Facility
Bank loan SAR 530,625,000 Floating (6m-SAIBOR)
1 Aug 2019 10 Jun 2025
The following table shows an analysis of financial instruments recorded at fair value by level of the fair value hierarchy:
USD (000s) Total Level 1 Level 2 Level 3
31-Dec-19 Derivative financial instrument: Interest rate swap (6,147,575) - (6,147,575) -
During the year ended 31 December 2019, there were no transfers between Level 1 and Level 2 fair value measurements, and no transfers into and out of Level 3 at fair value measurements. (31 December 2018: Nil).
32 DIVIDEND DISTRIBUTIONS During 2018 no dividends had been paid by the Group. In the current year, dividends of USD 1,934,284 have been paid by UPDC, one of the Group’s subsidiaries, to its non-controlling shareholders in respect of 2018 profits. The Board of Directors of ADES International Holding Plc does not propose a dividend to the shareholders at the Annual General Meeting.
33 SUBSEQUENT EVENTS Shares buy back On January 23, 2020, ADES International Holding PLC has purchased 70,000 from its own shares with an average price of USD 12.00 per share, in accordance with the shareholder authority granted at the Company's EGM on 30th October 2019 and as part of the buyback program announced on November 29, 2019. As at the close of business on 23rd January 2020, the total number of ordinary shares held as treasury shares became 370,000 and ADES had 43,793,882 ordinary shares (including treasury shares) in issue. Therefore, the total number of voting rights in the Company became 43,423,882 Current events caused by COVID-19 and lower oil prices The outbreak of Novel Coronavirus (COVID-19) continues to progress and evolve. Therefore, it is challenging now, to predict the full extent and duration of its business and economic impact. In January 2020, oil prices fell as a result of the outbreak of COVID-19 and its impact on demand for petroleum products. More recently, oil prices suffered a steep fall following the failure of OPEC and OPEC+ to reach an agreement in respect of production cuts. The extent and duration of such impacts remain uncertain and dependent on future developments that cannot be accurately predicted at this time, such as the transmission rate of the coronavirus and the extent and effectiveness of containment actions taken. Given the ongoing economic uncertainty, a reliable estimate of the impact cannot be made at the date of authorisation of these consolidated financial statements. These developments could impact our future financial results, cash flows and financial condition.