for the spectrum. jeffrey holford, phd, aca equity … network and removing wisdomtree and ingevity,...
TRANSCRIPT

USA | Themes & Tactics
US Insights May 20, 2016
US InsightsJefferies Franchise Picks - 21 Stocks withDifferentiated Analysis
EQU
ITY R
ESEARC
H A
MERIC
AS
Jefferies Equity Research *Jefferies LLC
(888) JEFFERIES [email protected] Denhoy *Equity Analyst
(212) 336-7070 [email protected] Dodge, CFA *
Equity Analyst(615) 963-8340 [email protected]
Brian Fitzgerald *Equity Analyst
(212) 284-2491 [email protected] Hecht *Equity Analyst
415-229-1569 [email protected] Holford, PhD, ACA *
Equity Analyst(212) 336-7409 [email protected]
Akshay Jagdale *Equity Analyst
(212) 444-4300 [email protected] J. Konik *
Equity Analyst(212) 708-2719 [email protected]
Jason Kupferberg *Equity Analyst
(646) 805 5412 [email protected] Lipacis *
Equity Analyst(415) 229-1438 [email protected]
Mike McCormack, CFA *Equity Analyst
(212) 284-2516 [email protected] Ng, CFA *
Equity Analyst(212) 336-7369 [email protected]
Brian Pitz *Equity Analyst
(212) 336-7413 [email protected] A. Rubel *
Equity Analyst(212) 284-2126 [email protected]
Stephen Volkmann, CFA *Equity Analyst
(212) 284-2031 [email protected] D. Wolff, CFA *
Equity Analyst(646) 805-5466 [email protected]
* Jefferies LLC
Key TakeawayThe Jefferies Franchise Picks List was introduced in December 2013 tohighlight Buy-rated US stocks from Jefferies Equity Research where analystshad done differentiated analysis and had high conviction. Today, we're addingDISH Network and removing WisdomTree and Ingevity, a spin off from listconstituent WestRock. The List has returned 28.9% since inception (totalreturn), outperforming the S&P by 910 bps. YTD outperformance relative tothe S&P is 520bps.
Adding DISH to the Franchise Pick List. Mike McCormack believes that investors areincorrectly valuing the DISH spectrum at the ongoing Broadcast auctions. While Broadcastspectrum is best suited for coverage, DISH's spectrum is best suited for capacity, andit's capacity spectrum that's more in demand. Mike believes the highly successful AWS-3auctions are a better comp for DISH's spectrum, believes the DISH spectrum is worth $1.35/Mhz-POP and that the current share price implies only $0.56/MHz-POP. He believes therecould be as much as $27 upside to his $80 price target with a more tax efficient outcomefor the spectrum.
Removing WisdomTree from the Franchise Pick List. Surinder Thind continues tolike WisdomTree's (WETF) strategic positioning and believes the company can gain sharein the fast growing ETF space over the long term, but over the short term, shares remainclosely tied to the performance of Japan and Europe, making it difficult to have near-termconviction. Also removing Ingevity (NGVT), the chemicals business which was spun out ofWRK. We don't currently cover NGVT, it's a small position, and our positive view on WRKis based on the containerboard business.
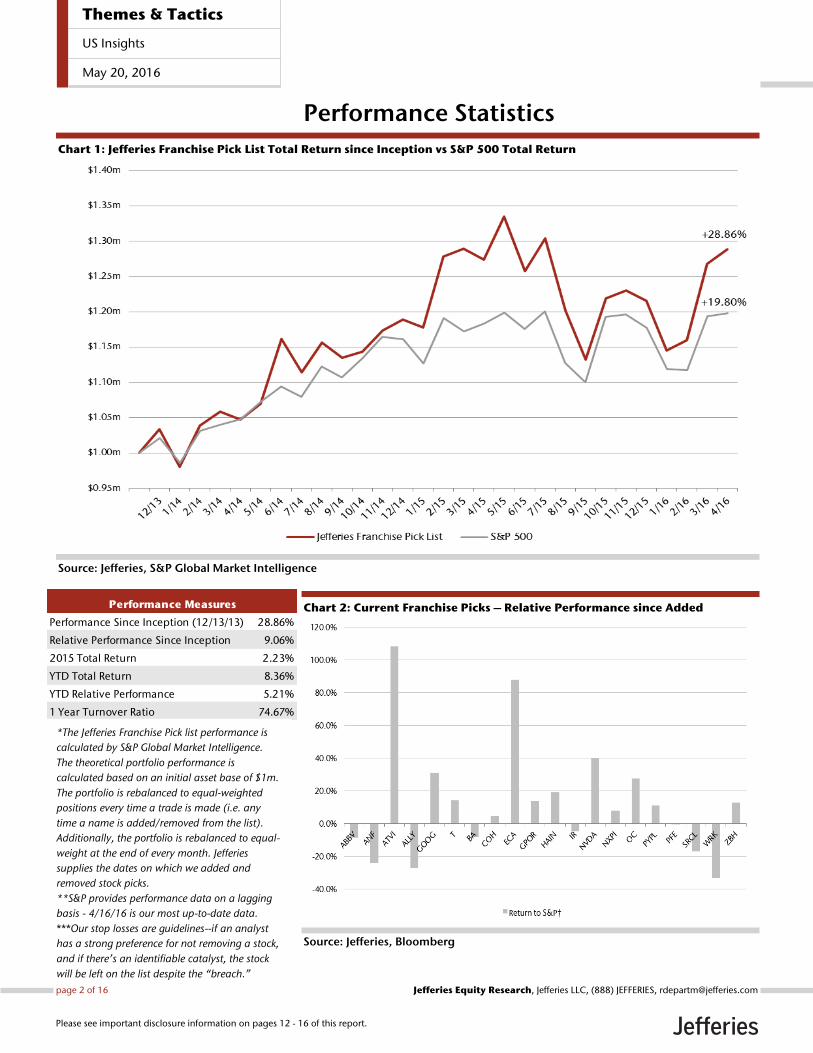
The Franchise Picks List has returned 28.9% since inception, has outperformedthe S&P by 910bps over that period, and has posted +5.2% relativeperformance YTD. We've contracted with S&P Capital IQ for the calculation of theportfolio returns, and the methodology employed assumes that the portfolio is re-weightedboth monthly and when stocks are added or removed from the List. Worth noting that theperformance calculation doesn't consider fees, but our 1 year turnover ratio isn't particularlyhigh at 75%.
As the performance numbers suggest, we've had more successes than failures,but we've had a lot of both. YTD, we have a number of stocks that have outperformedthe S&P by 1000bps or more, including (and in descending order or performance): ECA,NVDA, GPOR, IR, HAIN, ZBH, COH, and T. This year's group of 1000bps+ underperformersis less than half the size and includes SRCL, ANF and ALLY.
Nine different GIC sectors are represented on the list. The median market capis $21B and the median P/E on '17E is 13.6x, which is below the S&P multiple.There are 7 stocks that we'd classify as growth, and 14 stocks that we'd classify as value.The full list of companies is: T, ABBV, ANF, ATVI, ALLY, BA, COH, DISH, ECA, GOOG, GPOR,HAIN, IR, NVDA, NXPI, OC, PYPL, PFE, SRCL, WRK and ZBH. This note offers the investmentthesis for each of these constituents and a more detailed discussion of performance.
Jefferies does and seeks to do business with companies covered in its research reports. As a result, investors should be aware that Jefferies may have a conflictof interest that could affect the objectivity of this report. Investors should consider this report as only a single factor in making their investment decision.Please see analyst certifications, important disclosure information, and information regarding the status of non-US analysts on pages 12 to 16 of this report.
Performance Statistics
Chart 1: Jefferies Franchise Pick List Total Return since Inception vs S&P 500 Total Return
Source: Jefferies, S&P Global Market Intelligence
Chart 2: Current Franchise Picks – Relative Performance since Added
Source: Jefferies, Bloomberg
Performance Since Inception (12/13/13) 28.86%
Relative Performance Since Inception 9.06%
2015 Total Return 2.23%
YTD Total Return 8.36%
YTD Relative Performance 5.21%
1 Year Turnover Ratio 74.67%
Performance Measures
*The Jefferies Franchise Pick list performance is
calculated by S&P Global Market Intelligence.
The theoretical portfolio performance is
calculated based on an initial asset base of $1m.
The portfolio is rebalanced to equal-weighted
positions every time a trade is made (i.e. any
time a name is added/removed from the list).
Additionally, the portfolio is rebalanced to equal-
weight at the end of every month. Jefferies
supplies the dates on which we added and
removed stock picks.
**S&P provides performance data on a lagging
basis - 4/16/16 is our most up-to-date data.
***Our stop losses are guidelines--if an analyst
has a strong preference for not removing a stock,
and if there’s an identifiable catalyst, the stock
will be left on the list despite the “breach.”
Themes & Tactics
US Insights
May 20, 2016
page 2 of 16 , Jefferies LLC, (888) JEFFERIES, [email protected] Equity Research
Please see important disclosure information on pages 12 - 16 of this report.

Current Stocks and Investment Theses
AbbVie (Holford, ABBV, PT $90) Abbvie is Jeff’s Top Global Pick and he believes the market overestimates the risk around
potential Humira biosimilars. Jeff has confidence that US biosimilar launches will be
delayed at least until 2022, something reinforced by recent discussions with legal
consultants, and he continues to have that view after the institution of the IPR this week.
In the meantime, strong cash flow should fund further accretive M&A and the mid to late
stage pipeline looks increasingly de-risked and set to deliver. In the remainder of 2016,
Jeff expects at least one new drug approval (venetoclax for CLL), one major label
expansion (imbruvica for treatment naïve CLL) and several potential new filings (Elagolix,
Duvelisib, pan genotypic HCV, Imruvica [FL, MCL, DLBCL]). Jeff’s 2016E-20E revenue and
EPS estimates are well above consensus - Jeff’s mid-term EPS estimates are up to 27%
ahead of consensus. His $90 PT is supported by DCF, SOTP, PE and PEG-relative
valuations.
Abercrombie (Konik, ANF, PT $50) Randy believes improving industry trends combined with easy comps and trough margins
imply that ANF’s nascent EPS recovery is just beginning. ANF’s company-specific
turnaround story includes streamlined costs, reduced unproductive real estate and
improved supply chain efficiencies. Zooming out, since 2008, the consumer backdrop has
been strong; however, gov’t data and consumer spending components suggest that non-
durable spending could regain lost share; plateauing growth in auto sales and cell phone
sales suggest a slow-down of major secular headwinds. Additionally, consumer apparel
demand was weak in CY15 – poor performance was driven by share loss to durables and
unseasonable weather. 2016 weather trends are setting up much more favorably,
especially going forward, and CY16 is up against four Qs of negative comps. Randy raised
his FY’18 EPS estimate to $2 ($0.50 above the street) and believes 4% op margins can
return to 10%. Randy’s $50 PT is based on ~7x EV/EBITDA off his FY’18 estimates.
Activision Blizzard (Pitz & Fitzgerald, ATVI, PT $45) Brian Pitz and Brian Fitzgerald see multiple tailwinds for ATVI. The transition to digital
games continues to expand the company’s margins and new consoles are selling faster
than previous cycles; Pitz and Fitz believe we are two years into an eight 8 year (est.)
console cycle. Additionally, Activision is the best positioned name in eSports (competitive
video gaming), in their view, with five of the top fifteen most popular games on Twitch.
In the near-term there could be some volatility as ASAC II LP (owns 23% of shares;
controlled by CEO) distributes shares to various LPs like Fidelity and Tencent; these shares
unlock June 8. This will likely be offset by positive news coming out of E3 (June) and the
Overwatch launch, which we view as the most important game launch of 2016 from any
publisher. Over 9.7MM people tried the Overwatch beta, which is larger than the beta
audiences for games like EA’s Star Wars Battlefront (9.5MM beta players), Ubisoft’s The
Division (6.4MM), and ATVI’s Destiny (4.6MM), which Pitz & Fitz argue is the best comp.
Pitz & Fitz are also positive on the King acquisition and see potential for cross-selling and
advertising into King’s massive mobile audience.
Ally Financial (Hecht, ALLY, PT $28) John believes that ALLY stock at current levels overly-discounts a weakening credit
environment (which we did not see evidence of in ALLY’s 1Q16 print) and doesn’t fully
account for what we expect to be imminent capital return. We believe Ally is on the cusp
of implementing a dividend and share repurchase program after submitting its CCAR
application and are awaiting the June results. John believes that ALLY is attractively valued
Themes & Tactics
US Insights
May 20, 2016
page 3 of 16 , Jefferies LLC, (888) JEFFERIES, [email protected] Equity Research
Please see important disclosure information on pages 12 - 16 of this report.

on a P/ adjusted-TBV basis of <0.75x despite the company having successfully ramped to
a double-digit ROTCE. We view ALLY’s prioritization of profitability over growth very
favorably, particularly in the context that the company can now allocate excess
capital/liquidity to shareholders. We believe recent weakness related to funding market
disruption is not warranted given ALLY’s securitization pricing has remained stable, the
company has enough liquidity to continue growing its loan book without accessing the
capital markets for ~3 years, and over the long-term we expect NIM tailwinds as the
company replaces existing secured/unsecured debt with its strong deposit growth (which
should be enhanced by the recent TradeKing acquisition).
Alphabet (Pitz & Fitzgerald, GOOGL, PT $925) Brian Pitz and Brian Fitzgerald’s bullish Alphabet view has a lot to do with their positive
stance on YouTube, as they believe online video is the biggest online ad growth driver
and YouTube is the premier vehicle to play that trend. In fact, the acceleration in paid click
growth is notable because it suggests YouTube is now large enough to move the needle
as TV ad budgets begin to shift online in earnest. Google Sites (including YouTube) paid
clicks increased an impressive +38% Y/Y in Q1 and they believe stock weakness following
Q1 results is an opportunity, especially as results were pressed by FX and a below the line
securities loss. Despite concerns around the increasing amount of time spent in-app,
mobile search was the #1 driver of revenue growth last Q and we see continued
opportunity given the ubiquity of smartphones and the important location and
contextual signals from mobile devices. The Google I/O developer conference highlighted
the importance of voice search and ease of access of information to Google with a variety
of product announcements. Lastly, Google’s new CFO is implementing shareholder-
friendly policies like the new $5.1B buyback plus additional disclosures about the
business.
Chart 3: CPC YoY Growth vs. Paid Click YoY Growth
Source: Google, Jefferies
Themes & Tactics
US Insights
May 20, 2016
page 4 of 16 , Jefferies LLC, (888) JEFFERIES, [email protected] Equity Research
Please see important disclosure information on pages 12 - 16 of this report.

AT&T (McCormack, T, PT $44) The acquisition of DirecTV adds portfolio diversification, cash flow and significant
opportunity for AT&T. Management was enthused by the early progress in the
integration and remains committed to deliver $2.5bn or more of synergies. In our view,
the acquisition provides a strong path to a rich portfolio of in-home and mobile
entertainment. In addition, AT&T’s conservative Wireless posture should provide ARPU
and margin benefits. Mike’s $44 YE16 price target is based on a 5-yr DCF analysis that
assumes a 0.5% terminal growth rate and a 7.1% WACC. AT&T stock offers more than a
5.0% dividend yield.
Boeing (Rubel, BA, PT $165) Howard believes that Boeing has the potential to improve its profitability by timely
achievement of development milestones and completion of projects that improve supply
chain and manufacturing performance. The recent management re-alignment
underscores BA’s operating focus. Despite 1Q16 earnings, Howard continues to estimate
Core EPS of $8.50 for 2016 and $9.65 for 2017, slightly ahead of the consensus. Howard
believes the U.S. market is causing an extension in the cycle, which would provide modest
growth, as rising incomes and expanding employment keep demand healthy. The
company bought back $3.5billion in stock from year-end through the end of March, and
with recent announcements, there is line of sight to a share count of under 600 million by
early 2017, a reduction of over 100 million shares, or 15% of the outstanding stock since
the middle of 2015. Howard’s PT of $165 is based on 17x his 2017 core EPS estimate of
$9.65, which is a 5% market premium.
Coach (Konik, COH, PT $51) Randy is bullish on Coach based on consistently improving sales trends, driven by
remodeled stores and improving product reception thanks partly to Stuart Vevers, who
was appointed creative director in the middle of 2013 and whose product now
constitutes nearly all of Coach’s lines. After 2+ years of negative North American comps,
Randy expects this metric to turn positive by the June Q of 2016, with the company
already seeing positive comps in February and March. This would mark a significant
inflection, as it would be the first positive quarterly comp in three years. Broadly
speaking, Randy sees the handbag category re-accelerating, driven by AUR improvement,
combined with new designs that should reignite the category. Randy sees top-line
improvement as key to the margin re-expansion story, with operating margins set to
inflect positively in FY’17. Randy expects North American Coach store remodels to
contribute ~$0.20-$0.50 in EPS over the next 3-5 years. Additionally, a shift toward larger
bags has potential to benefit COH – Randy believes a 100bp mix shift toward large bags
adds $0.04 to EPS. Randy’s $51 PT is based on 19x EPS and ~11x EV/EBITDA on our CY’17
estimates.
Themes & Tactics
US Insights
May 20, 2016
page 5 of 16 , Jefferies LLC, (888) JEFFERIES, [email protected] Equity Research
Please see important disclosure information on pages 12 - 16 of this report.

Chart 4: Randy estimates COH’s N.A. SSS Comps will turn positive in June ‘16
Source: Jefferies estimates, company data
Dish Network Corp (McCormack, DISH, PT $80) Mike McCormack believes DISH’s spectrum is more valuable than the market is currently
assuming—he sees $32B of after tax value, which is in line with current EV and thus we
believe the market assigns no value to DISH’s TV business, which Mike believes is worth
nearly $15B. Mike believes investors are looking to the ongoing broadcast auction to
understand the value of DISH’s spectrum, but doesn’t believe Broadcast spectrum is a
great comp, especially with Broadcast spectrum best suited for coverage, not capacity,
and instead he believes the AWS-3 auction, which was the most successful auction in FCC
history, is the best proxy for the majority of DISH’s spectrum auctions. There’s debate
about the value of low-band vs. mid- or high-band spectrum for wireless network
architecture, and Mike’s view is that DISH’s mid-band spectrum is particularly well suited
to the urban markets, where capacity issues are often most acute. Mike’s price target of
$80 is based on a $1.35/Mhz-POP blended spectrum valuation, and we believe the
market currently assigns $0.56/MHz-POP. Mike assumes 4.5x EV/EBITDA for the satellite
TV business, but also notes that there’s strategic value to that asset, especially as a
compliment to a mobility platform or for a company which is sub-scale in video. He notes
that a more tax efficient outcome for the spectrum could add as much as $27 to his price
target.
Encana Corp (Wolff, ECA, PT $12) Jon believes ECA has mitigated many of the prevailing bear cases on the stock recently by
1) demonstrating the economic strength and scalability of its Midland Basin ‘crown jewel’
asset, 2) showing the economic resource potential and liquids benefit in the core of its
large Montney acreage position, 3) posting improved capital efficiency with minimal
output declines despite a sharply reduced budget, and 4) meaningfully reducing financial
leverage. ECA’s Midland basin acreage quality has become much more clear with a
potential future drilling inventory of ~5,000 locations. On May 17, Jon hosted
management meetings and came away more confident in the company’s high-graded
portfolio and its ability to fund itself - he raised his PT from $11 to $12 based on his Risk
Adjusted Asset Value. Jon estimates ECA’s net debt to EBITDA at 3.7x at YE16 (at current
strip) which is clearly on the high-side of normal, but is manageable, particularly with an
internally funded budget and improved confidence in the closing of the ~$900 Mm DJ
sale in 2Q.
Themes & Tactics
US Insights
May 20, 2016
page 6 of 16 , Jefferies LLC, (888) JEFFERIES, [email protected] Equity Research
Please see important disclosure information on pages 12 - 16 of this report.
Gulfport Energy (Wolff, GPOR, PT $33) We favor GPOR for its scalable position in the core of the low-cost Utica shale. Expanded
acreage, a strengthened balance sheet and visible infrastructure access lend credibility to
long-term growth. Execution has improved materially. Management indicated 2016
growth is set to be strong as 100 MMcf/d of curtailed gas comes back online with 15
gross (10 net) Utica wells. Jon models 20+% volume growth in 2017 on a ~$600 MM
budget. Jon continues to believe that tightening natural gas supply/demand balances will
drive NYMEX gas prices higher with 2017/2018+ forecasts of $3.50 and $4, well-above
the ~$3/M Street view for 2017/2018.
Hain Celestial (Jagdale, HAIN, PT $55) Following a thorough review of HAIN’s US portfolio, Akshay has higher conviction that: 1)
HAIN’s TAM and EPS can at least double; 2) private label is not a big threat; 3) share losses
are transitory; 4) HAIN’s core brands have leading market share positions; and 5)
conventional brands are not gaining share in HAIN’s categories. Recently, when the
company reported F3Q16 results, U.S. organic sales growth improved by 690 bps
sequentially, which emphasizes Akshay’s view that the market share losses have been
transitory. In regard to valuation, on a P/E basis, HAIN currently trades at 21.4x Akshay’s
NTM EPS estimate (22.1x consensus’ NTM EPS estimate), compared to the 29.6x
consumer growth peer group average. Akshay’s $55 PT implies a P/E multiple of 23.5x his
2017 EPS estimate of $2.34.
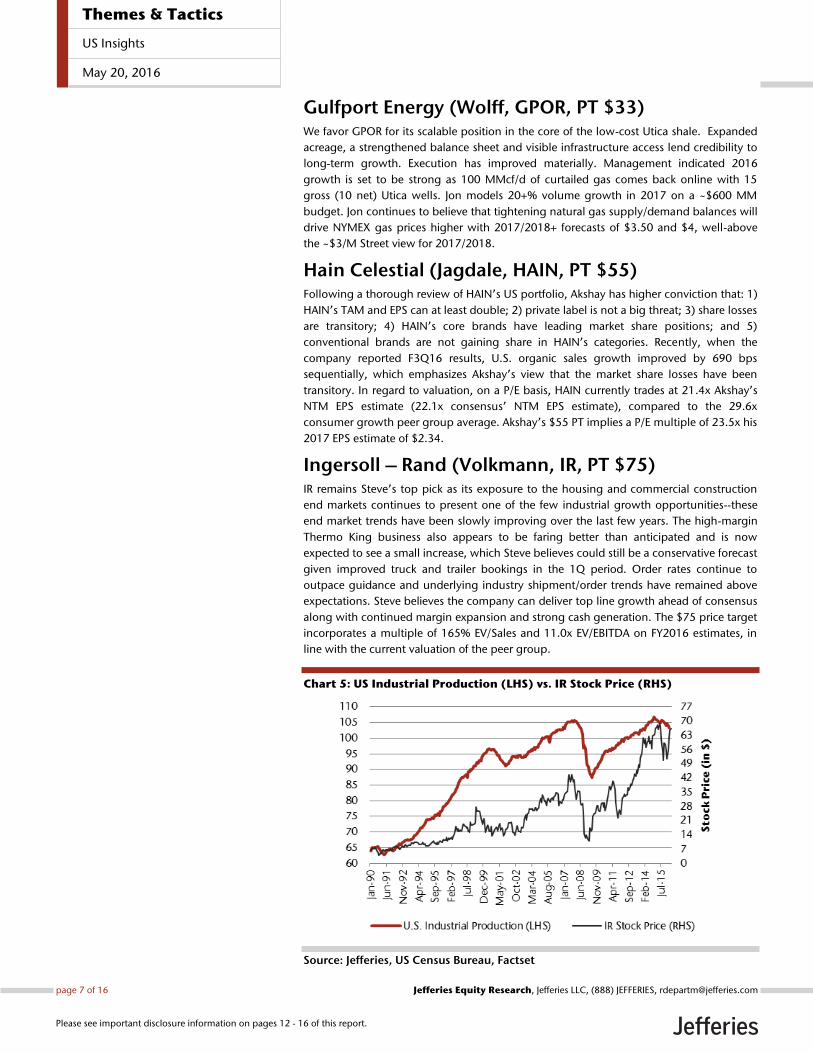
Ingersoll – Rand (Volkmann, IR, PT $75) IR remains Steve’s top pick as its exposure to the housing and commercial construction
end markets continues to present one of the few industrial growth opportunities--these
end market trends have been slowly improving over the last few years. The high-margin
Thermo King business also appears to be faring better than anticipated and is now
expected to see a small increase, which Steve believes could still be a conservative forecast
given improved truck and trailer bookings in the 1Q period. Order rates continue to
outpace guidance and underlying industry shipment/order trends have remained above
expectations. Steve believes the company can deliver top line growth ahead of consensus
along with continued margin expansion and strong cash generation. The $75 price target
incorporates a multiple of 165% EV/Sales and 11.0x EV/EBITDA on FY2016 estimates, in
line with the current valuation of the peer group.
Chart 5: US Industrial Production (LHS) vs. IR Stock Price (RHS)
Source: Jefferies, US Census Bureau, Factset
Themes & Tactics
US Insights
May 20, 2016
page 7 of 16 , Jefferies LLC, (888) JEFFERIES, [email protected] Equity Research
Please see important disclosure information on pages 12 - 16 of this report.

NVIDIA (Lipacis, NVDA, PT $45) NVDA remains one of Mark’s highest conviction calls on the basis that NVDA is uniquely
investing in new platforms and tools that are enabling new markets like Deep Learning,
VR, self-driving cars and PC Gaming. Mark thinks NVDA is poised to be a de facto standard
as these markets develop, and could be the best way to play growth in those markets.
Over the past 5 years NVDA product GMs have expanded by nearly 900 bps and are
approaching 60% from the high 40% range just three years ago. Additionally, NVDA is
about to begin shipping its new Pascal architecture based products, which could
potentially lead to further expansion of the GMs in PC gaming and Cloud. Gross margin
expansion is the main driver for Mark’s F17 EPS estimate of $1.57, ahead of consensus.
Longer term Mark thinks NVDA has $3.50 of EPS power.
Chart 6: NVDA Product Gross Margins 1Q12 – 2Q16E
Source: Jefferies, Company Data
NXP Semiconductor (Lipacis, NXPI, PT $130) Mark recently added NXPI to the Franchise Pick List noting the FCF/share growth outlook,
share gains in the Auto supply chain, and, in his estimation, a likelihood for a
semiconductor supply chain restock following last year’s inventory correction. Mark is
currently looking for 53% FCF/sh growth in 2016, second best in his large cap universe,
following NXPI’s acquisition of FSL. The merger could add an additional 10-20% FCF
growth in 2017 when the bulk of the projected $500m of cost synergies are realized.
Mark believes that the FSL acquisition provides an opportunity for NXPI to gain share in
automotive semiconductors through cross-selling. His analysis also indicates that semis
were undershipped to customers from 4Q14 through 1Q16, setting the stage for a 2016
restock cycle.
Themes & Tactics
US Insights
May 20, 2016
page 8 of 16 , Jefferies LLC, (888) JEFFERIES, [email protected] Equity Research
Please see important disclosure information on pages 12 - 16 of this report.

Chart 7: Projected 2016 FCF/Share Growth, >$5B Mkt Cap
Source: Jefferies, Factset, Company Data
Owens Corning (Ng, OC, PT $61) OC is currently trading at a significant discount to the group (-20% on mid-cycle) despite
a better than expected outlook for Composites and upside to roofing earnings given the
continued benefit from asphalt deflation and the potential improvement in roofing
demand and pricing. Additionally, Phil believes pricing in insulation should begin to
accelerate as industry utilization rates tighten. The stock is currently trading with about a
7.8% FCF yield. Phil anticipates capex dropping below D&A in 2017 and 2018, which, in
combination with the $2b NOL and working capital improvement, should drive even
stronger FCF over the next few years.
PayPal (Kupferberg, PYPL, PT $48) Jason likes PYPL due to its scarcity value, as it combines robust top-line growth, solid and
improving profitability, a strong global brand, secular tailwinds, attractive cash flow and
balance sheet characteristics. In particular, Jason believes that PayPal is not getting
material credit for the potential of “Pay With Venmo,” which should be enabled for all of
PYPL's ~14M merchants by the end of 2016. His scenario analysis suggests a potential
range of 2.1%-5.5% EPS accretion for 2017 and 3.0%-6.7% in 2018. So far, he has not
seen a material competitive impact on PYPL from Apple Pay, and is encouraged that
management expressed increased confidence in achieving its medium-term targets at the
May 18 Analyst Day.
Pfizer (Holford, PFE, PT $41) While Jeff notes that the termination of the proposed merger with Allergan was
disappointing, it was not unanticipated and has been replaced by “Optionality” around
the separation of GEP. Jeff expects the separation of GEP in 2017. From a SOTP
standpoint, he values PFE shares at $42, a combination of the GEP (~$16), GIP (~$8), and
the VOC (~$18) businesses. He also expects PFE to continue to act as an acquirer in the US
biopharmaceutical sector, as well as adding critical mass to the GIP business over the next
3-5 years.
Themes & Tactics
US Insights
May 20, 2016
page 9 of 16 , Jefferies LLC, (888) JEFFERIES, [email protected] Equity Research
Please see important disclosure information on pages 12 - 16 of this report.

Stericycle (Dodge, SRCL, PT $140) We added SRCL to the Franchise Pick list in mid-December, after shares had already
dislocated in the wake of weak 3Q results. Clearly the addition was too early, as shares
have continued to decline, recently falling 21% on the day after the disappointing 1Q16
earnings report. Certain issues, including Brazil, UK patient transport and hazardous
waste may continue to drag on results; however, recent meetings with management
suggest that guidance assumes none of these situations improve. Also, some of the
negatives from the Shred-It acquisition will likely turn to positives, especially as the two
salesforces are better integrated and start to cross-sell. Shares trade at about 17x ’17E EPS
despite normalized organic top line growth of 600-700 bps as well as 400-500 bps of
M&A, resulting in double-digit top line growth that’s largely recession resistant. We note
that the current valuation is well below the mid/high-20s P/E multiples seen historically.
WestRock (Ng, WRK, PT $50) WRK is well-positioned to outperform with containerboard and boxboard pricing
stabilizing as we enter a seasonally stronger period for demand which should drive
industry inventories lower. Aside from that, the recent spin of the spec chems business
(NGVT) removes some noise from the story and was an overhang that we believe had
investors on the sidelines. Furthermore, now that NGVT has spun and mgmt. is looking to
monetize its land assets, the company should be more aggressive with buybacks and is
trading with a 3.8% dividend yield. With WRK trading with a 10% FCF yield (cheapest in
the group) and ahead of schedule on its $1b+ cost takeout/synergies opportunity, we
believe it’s one of the most compelling names in paper & packaging.
Zimmer Biomet (Denhoy, ZBH, PT $135) Raj believes ZBH is positioned attractively due to the potential for the company to return
to market growth rates after integration the Biomet acquisition (~3-4%); the company’s
strong cash flows, including access to overseas cash; and the still depressed valuation.
Following the 2015 acquisition of Biomet, growth slowed substantially but there is
nothing structurally at the company or in the industry that should keep Zimmer from
return to market growth rates in orthopedics. Raj expects to see growth re-accelerate to
3%+ by year end, as the post-merger sales force finally stabilizes, and to push higher in
outer years. Management recently took FY16 revenue guidance up by 50bps to +2-3%
following a 1Q16 beat, reaffirming his thesis. On the access to cash, the company
recently noted it will be returning $4.4b of unremitted foreign earnings at Biomet to the
US. When combined with $4b in intercompany loans and subtracting the $1.5b tax
liability on the unremitted earnings it has already recorded on its balance sheet, ZBH has
$6.9b in OUS cash it can access without paying additional US tax on the P&L. When
combined with US cash flows, and netting out debt repayments, dividends, and already
modeled buybacks, the company will have $4.7bn in cash it can freely access for value
creating activities over the next 5-7 years. Raj’s $135 price target is 15.5x his 2017 EPS
estimate, several turns below the industry’s 17x average, and this does not include
possible uses of cash.
Themes & Tactics
US Insights
May 20, 2016
page 10 of 16 , Jefferies LLC, (888) JEFFERIES, [email protected] Equity Research
Please see important disclosure information on pages 12 - 16 of this report.

Jefferies Franchise Picks
Table 1: Current Franchise Pick List
Name Ticker Sector Analyst Rating Target Price 17E
JEF
EPS
17E
Cons
EPS
EPS
Delta
17E
P/E
Mkt
Cap
(b)
ABBVIE INC ABBV Health Care JEFFREY
HOLFORD
Buy 90.00 60.08 5.67 5.69 -0.3% 10.60 97.2
ABERCROMBIE & FITCH ANF Cons.
Discretionary
RANDAL J KONIK Buy 50.00 24.38 2.00 1.41 41.4% 12.19 1.6
ACTIVISION BLIZZARD ATVI Info
Technology
BRIAN J PITZ Buy 45.00 37.65 2.02 2.11 -4.0% 18.64 27.8
ALLY FINANCIAL INC
ALLY Financials JOHN HECHT Buy 28.00 16.93 2.57 2.59 -0.7% 6.59 8.2
ALPHABET INC-CL C GOOG Info
Technology
BRIAN J PITZ Buy 925.00 704.42 41.91 39.27 6.7% 16.81 488.3
AT&T INC T Telecom MICHAEL L
MCCORMACK
Buy 44.00 37.97 3.02 3.01 0.4% 12.57 233.7
BOEING CO/THE BA Industrials HOWARD A
RUBEL
Buy 165.00 129.77 9.65 9.53 1.3% 13.45 82.7
COACH INC COH Cons.
Discretionary
RANDAL J KONIK Buy 51.00 38.07 2.36 2.20 NA 16.13 10.6
DISH NETWORK CORP-
A
DISH Cons.
Discretionary
MICHAEL L
MCCORMACK
Buy 80.00 44.79 3.13 2.67 NA 14.31 20.8
ENCANA CORP ECA Energy JONATHAN
WOLFF
Buy 12.00 7.33 0.56 0.11 413.8% 13.09 6.2
GULFPORT ENERGY
CORP
GPOR Energy JONATHAN
WOLFF
Buy 33.00 29.58 0.77 0.52 48.4% 38.42 3.7
HAIN CELESTIAL
GROUP INC
HAIN Consumer
Staples
AKSHAY S
JAGDALE
Buy 55.00 47.21 2.34 2.24 4.4% 20.18 4.9
INGERSOLL-RAND PLC IR Industrials STEPHEN
VOLKMANN
Buy 75.00 64.41 4.55 4.48 1.7% 14.16 16.6
NVIDIA CORP NVDA Info
Technology
MARK J LIPACIS Buy 45.00 43.75 2.04 1.93 5.8% 21.45 23.8
NXP
SEMICONDUCTORS
NXPI Info
Technology
MARK J LIPACIS Buy 130.00 87.75 8.06 7.52 7.2% 10.89 30.4
OWENS CORNING
OC Industrials PHILIP NG Buy 61.00 49.93 3.97 3.51 13.1% 12.58 5.8
PAYPAL HOLDINGS INC PYPL Info
Technology
JASON
KUPFERBERG
Buy 48.00 38.54 1.77 1.77 0.3% 21.77 46.7
PFIZER INC PFE Health Care JEFFREY
HOLFORD
Buy 41.00 33.32 2.66 2.64 0.7% 12.53 202.1
STERICYCLE INC
SRCL Industrials SEAN DODGE Buy 140.00 97.78 5.65 5.49 2.9% 17.31 8.3
WESTROCK CO
WRK Materials PHILIP NG Buy 50.00 37.06 2.76 2.79 -1.1% 13.43 9.4
ZIMMER BIOMET
HOLDINGS
ZBH Health Care RAJ S DENHOY Buy 135.00 118.48 8.72 8.76 -0.4% 13.59 23.6
Source: Jefferies, Bloomberg
Themes & Tactics
US Insights
May 20, 2016
page 11 of 16 , Jefferies LLC, (888) JEFFERIES, [email protected] Equity Research
Please see important disclosure information on pages 12 - 16 of this report.

Analyst Certification:I, Jefferies Equity Research, certify that all of the views expressed in this research report accurately reflect my personal views about the subjectsecurity(ies) and subject company(ies). I also certify that no part of my compensation was, is, or will be, directly or indirectly, related to the specificrecommendations or views expressed in this research report.I, Raj Denhoy, certify that all of the views expressed in this research report accurately reflect my personal views about the subject security(ies) andsubject company(ies). I also certify that no part of my compensation was, is, or will be, directly or indirectly, related to the specific recommendationsor views expressed in this research report.I, Sean Dodge, CFA, certify that all of the views expressed in this research report accurately reflect my personal views about the subject security(ies) andsubject company(ies). I also certify that no part of my compensation was, is, or will be, directly or indirectly, related to the specific recommendationsor views expressed in this research report.I, Brian Fitzgerald, certify that all of the views expressed in this research report accurately reflect my personal views about the subject security(ies) andsubject company(ies). I also certify that no part of my compensation was, is, or will be, directly or indirectly, related to the specific recommendationsor views expressed in this research report.I, John Hecht, certify that all of the views expressed in this research report accurately reflect my personal views about the subject security(ies) andsubject company(ies). I also certify that no part of my compensation was, is, or will be, directly or indirectly, related to the specific recommendationsor views expressed in this research report.I, Jeffrey Holford, PhD, ACA, certify that all of the views expressed in this research report accurately reflect my personal views about the subjectsecurity(ies) and subject company(ies). I also certify that no part of my compensation was, is, or will be, directly or indirectly, related to the specificrecommendations or views expressed in this research report.I, Akshay Jagdale, certify that all of the views expressed in this research report accurately reflect my personal views about the subject security(ies) andsubject company(ies). I also certify that no part of my compensation was, is, or will be, directly or indirectly, related to the specific recommendationsor views expressed in this research report.I, Randal J. Konik, certify that all of the views expressed in this research report accurately reflect my personal views about the subject security(ies) andsubject company(ies). I also certify that no part of my compensation was, is, or will be, directly or indirectly, related to the specific recommendationsor views expressed in this research report.I, Jason Kupferberg, certify that all of the views expressed in this research report accurately reflect my personal views about the subject security(ies) andsubject company(ies). I also certify that no part of my compensation was, is, or will be, directly or indirectly, related to the specific recommendationsor views expressed in this research report.I, Mark Lipacis, certify that all of the views expressed in this research report accurately reflect my personal views about the subject security(ies) andsubject company(ies). I also certify that no part of my compensation was, is, or will be, directly or indirectly, related to the specific recommendationsor views expressed in this research report.I, Mike McCormack, CFA, certify that all of the views expressed in this research report accurately reflect my personal views about the subjectsecurity(ies) and subject company(ies). I also certify that no part of my compensation was, is, or will be, directly or indirectly, related to the specificrecommendations or views expressed in this research report.I, Philip Ng, CFA, certify that all of the views expressed in this research report accurately reflect my personal views about the subject security(ies) andsubject company(ies). I also certify that no part of my compensation was, is, or will be, directly or indirectly, related to the specific recommendationsor views expressed in this research report.I, Brian Pitz, certify that all of the views expressed in this research report accurately reflect my personal views about the subject security(ies) and subjectcompany(ies). I also certify that no part of my compensation was, is, or will be, directly or indirectly, related to the specific recommendations or viewsexpressed in this research report.I, Howard A. Rubel, certify that all of the views expressed in this research report accurately reflect my personal views about the subject security(ies) andsubject company(ies). I also certify that no part of my compensation was, is, or will be, directly or indirectly, related to the specific recommendationsor views expressed in this research report.I, Stephen Volkmann, CFA, certify that all of the views expressed in this research report accurately reflect my personal views about the subjectsecurity(ies) and subject company(ies). I also certify that no part of my compensation was, is, or will be, directly or indirectly, related to the specificrecommendations or views expressed in this research report.I, Jonathan D. Wolff, CFA, certify that all of the views expressed in this research report accurately reflect my personal views about the subjectsecurity(ies) and subject company(ies). I also certify that no part of my compensation was, is, or will be, directly or indirectly, related to the specificrecommendations or views expressed in this research report.As is the case with all Jefferies employees, the analyst(s) responsible for the coverage of the financial instruments discussed in this report receivescompensation based in part on the overall performance of the firm, including investment banking income. We seek to update our research asappropriate, but various regulations may prevent us from doing so. Aside from certain industry reports published on a periodic basis, the large majorityof reports are published at irregular intervals as appropriate in the analyst's judgement.
Company Specific DisclosuresFor Important Disclosure information on companies recommended in this report, please visit our website at https://javatar.bluematrix.com/sellside/Disclosures.action or call 212.284.2300.
Explanation of Jefferies RatingsBuy - Describes securities that we expect to provide a total return (price appreciation plus yield) of 15% or more within a 12-month period.Hold - Describes securities that we expect to provide a total return (price appreciation plus yield) of plus 15% or minus 10% within a 12-month period.Underperform - Describes securities that we expect to provide a total return (price appreciation plus yield) of minus 10% or less within a 12-monthperiod.
Themes & Tactics
US Insights
May 20, 2016
page 12 of 16 , Jefferies LLC, (888) JEFFERIES, [email protected] Equity Research
Please see important disclosure information on pages 12 - 16 of this report.

The expected total return (price appreciation plus yield) for Buy rated securities with an average security price consistently below $10 is 20% or morewithin a 12-month period as these companies are typically more volatile than the overall stock market. For Hold rated securities with an averagesecurity price consistently below $10, the expected total return (price appreciation plus yield) is plus or minus 20% within a 12-month period. ForUnderperform rated securities with an average security price consistently below $10, the expected total return (price appreciation plus yield) is minus20% or less within a 12-month period.NR - The investment rating and price target have been temporarily suspended. Such suspensions are in compliance with applicable regulations and/or Jefferies policies.CS - Coverage Suspended. Jefferies has suspended coverage of this company.NC - Not covered. Jefferies does not cover this company.Restricted - Describes issuers where, in conjunction with Jefferies engagement in certain transactions, company policy or applicable securitiesregulations prohibit certain types of communications, including investment recommendations.Monitor - Describes securities whose company fundamentals and financials are being monitored, and for which no financial projections or opinionson the investment merits of the company are provided.
Valuation MethodologyJefferies' methodology for assigning ratings may include the following: market capitalization, maturity, growth/value, volatility and expected totalreturn over the next 12 months. The price targets are based on several methodologies, which may include, but are not restricted to, analyses of marketrisk, growth rate, revenue stream, discounted cash flow (DCF), EBITDA, EPS, cash flow (CF), free cash flow (FCF), EV/EBITDA, P/E, PE/growth, P/CF,P/FCF, premium (discount)/average group EV/EBITDA, premium (discount)/average group P/E, sum of the parts, net asset value, dividend returns,and return on equity (ROE) over the next 12 months.
Jefferies Franchise PicksJefferies Franchise Picks include stock selections from among the best stock ideas from our equity analysts over a 12 month period. Stock selectionis based on fundamental analysis and may take into account other factors such as analyst conviction, differentiated analysis, a favorable risk/rewardratio and investment themes that Jefferies analysts are recommending. Jefferies Franchise Picks will include only Buy rated stocks and the numbercan vary depending on analyst recommendations for inclusion. Stocks will be added as new opportunities arise and removed when the reason forinclusion changes, the stock has met its desired return, if it is no longer rated Buy and/or if it triggers a stop loss. Stocks having 120 day volatility inthe bottom quartile of S&P stocks will continue to have a 15% stop loss, and the remainder will have a 20% stop. Franchise Picks are not intendedto represent a recommended portfolio of stocks and is not sector based, but we may note where we believe a Pick falls within an investment stylesuch as growth or value.
Risks which may impede the achievement of our Price TargetThis report was prepared for general circulation and does not provide investment recommendations specific to individual investors. As such, thefinancial instruments discussed in this report may not be suitable for all investors and investors must make their own investment decisions basedupon their specific investment objectives and financial situation utilizing their own financial advisors as they deem necessary. Past performance ofthe financial instruments recommended in this report should not be taken as an indication or guarantee of future results. The price, value of, andincome from, any of the financial instruments mentioned in this report can rise as well as fall and may be affected by changes in economic, financialand political factors. If a financial instrument is denominated in a currency other than the investor's home currency, a change in exchange rates mayadversely affect the price of, value of, or income derived from the financial instrument described in this report. In addition, investors in securities suchas ADRs, whose values are affected by the currency of the underlying security, effectively assume currency risk.
Other Companies Mentioned in This Report• AbbVie (ABBV: $59.28, BUY)• Abercrombie & Fitch (ANF: $23.88, BUY)• Activision Blizzard, Inc. (ATVI: $37.80, BUY)• Ally Financial, Inc. (ALLY: $16.67, BUY)• Alphabet, Inc. (GOOGL: $715.31, BUY)• AT&T Inc. (T: $38.44, BUY)• Coach, Inc. (COH: $38.10, BUY)• Dish Network Corp. (DISH: $44.39, BUY)• Encana Corp. (ECA: $7.54, BUY)• Gulfport Energy Corp. (GPOR: $29.38, BUY)• Hain Celestial (HAIN: $47.87, BUY)• Ingersoll-Rand Plc (IR: $64.01, BUY)• NVIDIA Corporation (NVDA: $43.55, BUY)• NXP Semiconductors NV (NXPI: $86.43, BUY)• Owens Corning (OC: $50.05, BUY)• PayPal Holdings Inc. (PYPL: $37.65, BUY)• Pfizer, Inc. (PFE: $33.38, BUY)• Stericycle, Inc. (SRCL: $97.30, BUY)• The Boeing Company (BA: $128.08, BUY)• WestRock Company (WRK: $37.00, BUY)• WisdomTree Investments, Inc. (WETF: $10.69, BUY)• Zimmer Holdings (ZBH: $118.19, BUY)
Themes & Tactics
US Insights
May 20, 2016
page 13 of 16 , Jefferies LLC, (888) JEFFERIES, [email protected] Equity Research
Please see important disclosure information on pages 12 - 16 of this report.

Distribution of RatingsIB Serv./Past 12 Mos.
Rating Count Percent Count Percent
BUY 1165 53.71% 322 27.64%HOLD 843 38.87% 163 19.34%UNDERPERFORM 161 7.42% 19 11.80%
Themes & Tactics
US Insights
May 20, 2016
page 14 of 16 , Jefferies LLC, (888) JEFFERIES, [email protected] Equity Research
Please see important disclosure information on pages 12 - 16 of this report.

Other Important DisclosuresJefferies Equity Research refers to research reports produced by analysts employed by one of the following Jefferies Group LLC (“Jefferies”) groupcompanies:United States: Jefferies LLC which is an SEC registered firm and a member of FINRA.United Kingdom: Jefferies International Limited, which is authorized and regulated by the Financial Conduct Authority; registered in England andWales No. 1978621; registered office: Vintners Place, 68 Upper Thames Street, London EC4V 3BJ; telephone +44 (0)20 7029 8000; facsimile +44 (0)207029 8010.Hong Kong: Jefferies Hong Kong Limited, which is licensed by the Securities and Futures Commission of Hong Kong with CE number ATS546; locatedat Suite 2201, 22nd Floor, Cheung Kong Center, 2 Queen’s Road Central, Hong Kong.Singapore: Jefferies Singapore Limited, which is licensed by the Monetary Authority of Singapore; located at 80 Raffles Place #15-20, UOB Plaza 2,Singapore 048624, telephone: +65 6551 3950.Japan: Jefferies (Japan) Limited, Tokyo Branch, which is a securities company registered by the Financial Services Agency of Japan and is a memberof the Japan Securities Dealers Association; located at Hibiya Marine Bldg, 3F, 1-5-1 Yuraku-cho, Chiyoda-ku, Tokyo 100-0006; telephone +813 52516100; facsimile +813 5251 6101.India: Jefferies India Private Limited (CIN - U74140MH2007PTC200509), which is licensed by the Securities and Exchange Board of India as a MerchantBanker (INM000011443), Research Analyst (INH000000701) and a Stock Broker with Bombay Stock Exchange Limited (INB011491033) and NationalStock Exchange of India Limited (INB231491037) in the Capital Market Segment; located at 42/43, 2 North Avenue, Maker Maxity, Bandra-KurlaComplex, Bandra (East) Mumbai 400 051, India; Tel +91 22 4356 6000.This material has been prepared by Jefferies employing appropriate expertise, and in the belief that it is fair and not misleading. The information setforth herein was obtained from sources believed to be reliable, but has not been independently verified by Jefferies. Therefore, except for any obligationunder applicable rules we do not guarantee its accuracy. Additional and supporting information is available upon request. Unless prohibited by theprovisions of Regulation S of the U.S. Securities Act of 1933, this material is distributed in the United States ("US"), by Jefferies LLC, a US-registeredbroker-dealer, which accepts responsibility for its contents in accordance with the provisions of Rule 15a-6, under the US Securities Exchange Act of1934. Transactions by or on behalf of any US person may only be effected through Jefferies LLC. In the United Kingdom and European EconomicArea this report is issued and/or approved for distribution by Jefferies International Limited and is intended for use only by persons who have, or havebeen assessed as having, suitable professional experience and expertise, or by persons to whom it can be otherwise lawfully distributed. JefferiesInternational Limited has adopted a conflicts management policy in connection with the preparation and publication of research, the details of whichare available upon request in writing to the Compliance Officer. Jefferies International Limited may allow its analysts to undertake private consultancywork. Jefferies International Limited’s conflicts management policy sets out the arrangements Jefferies International Limited employs to manage anypotential conflicts of interest that may arise as a result of such consultancy work. For Canadian investors, this material is intended for use only byprofessional or institutional investors. None of the investments or investment services mentioned or described herein is available to other personsor to anyone in Canada who is not a "Designated Institution" as defined by the Securities Act (Ontario). In Singapore, Jefferies Singapore Limited isregulated by the Monetary Authority of Singapore. For investors in the Republic of Singapore, this material is provided by Jefferies Singapore Limitedpursuant to Regulation 32C of the Financial Advisers Regulations. The material contained in this document is intended solely for accredited, expert orinstitutional investors, as defined under the Securities and Futures Act (Cap. 289 of Singapore). If there are any matters arising from, or in connectionwith this material, please contact Jefferies Singapore Limited, located at 80 Raffles Place #15-20, UOB Plaza 2, Singapore 048624, telephone: +656551 3950. In Japan this material is issued and distributed by Jefferies (Japan) Limited to institutional investors only. In Hong Kong, this report isissued and approved by Jefferies Hong Kong Limited and is intended for use only by professional investors as defined in the Hong Kong Securities andFutures Ordinance and its subsidiary legislation. In the Republic of China (Taiwan), this report should not be distributed. The research in relation tothis report is conducted outside the PRC. This report does not constitute an offer to sell or the solicitation of an offer to buy any securities in the PRC.PRC investors shall have the relevant qualifications to invest in such securities and shall be responsible for obtaining all relevant approvals, licenses,verifications and/or registrations from the relevant governmental authorities themselves. In India this report is made available by Jefferies India PrivateLimited. In Australia this information is issued solely by Jefferies International Limited and is directed solely at wholesale clients within the meaning ofthe Corporations Act 2001 of Australia (the "Act") in connection with their consideration of any investment or investment service that is the subject ofthis document. Any offer or issue that is the subject of this document does not require, and this document is not, a disclosure document or productdisclosure statement within the meaning of the Act. Jefferies International Limited is authorised and regulated by the Financial Conduct Authorityunder the laws of the United Kingdom, which differ from Australian laws. Jefferies International Limited has obtained relief under Australian Securitiesand Investments Commission Class Order 03/1099, which conditionally exempts it from holding an Australian financial services licence under theAct in respect of the provision of certain financial services to wholesale clients. Recipients of this document in any other jurisdictions should informthemselves about and observe any applicable legal requirements in relation to the receipt of this document.
This report is not an offer or solicitation of an offer to buy or sell any security or derivative instrument, or to make any investment. Any opinion orestimate constitutes the preparer's best judgment as of the date of preparation, and is subject to change without notice. Jefferies assumes no obligationto maintain or update this report based on subsequent information and events. Jefferies, its associates or affiliates, and its respective officers, directors,and employees may have long or short positions in, or may buy or sell any of the securities, derivative instruments or other investments mentioned ordescribed herein, either as agent or as principal for their own account. Upon request Jefferies may provide specialized research products or servicesto certain customers focusing on the prospects for individual covered stocks as compared to other covered stocks over varying time horizons orunder differing market conditions. While the views expressed in these situations may not always be directionally consistent with the long-term viewsexpressed in the analyst's published research, the analyst has a reasonable basis and any inconsistencies can be reasonably explained. This materialdoes not constitute a personal recommendation or take into account the particular investment objectives, financial situations, or needs of individualclients. Clients should consider whether any advice or recommendation in this report is suitable for their particular circumstances and, if appropriate,seek professional advice, including tax advice. The price and value of the investments referred to herein and the income from them may fluctuate. Pastperformance is not a guide to future performance, future returns are not guaranteed, and a loss of original capital may occur. Fluctuations in exchangerates could have adverse effects on the value or price of, or income derived from, certain investments. This report has been prepared independently ofany issuer of securities mentioned herein and not in connection with any proposed offering of securities or as agent of any issuer of securities. Noneof Jefferies, any of its affiliates or its research analysts has any authority whatsoever to make any representations or warranty on behalf of the issuer(s).Jefferies policy prohibits research personnel from disclosing a recommendation, investment rating, or investment thesis for review by an issuer prior
Themes & Tactics
US Insights
May 20, 2016
page 15 of 16 , Jefferies LLC, (888) JEFFERIES, [email protected] Equity Research
Please see important disclosure information on pages 12 - 16 of this report.

to the publication of a research report containing such rating, recommendation or investment thesis. Any comments or statements made herein arethose of the author(s) and may differ from the views of Jefferies.
This report may contain information obtained from third parties, including ratings from credit ratings agencies such as Standard & Poor’s. Reproductionand distribution of third party content in any form is prohibited except with the prior written permission of the related third party. Third party contentproviders do not guarantee the accuracy, completeness, timeliness or availability of any information, including ratings, and are not responsible forany errors or omissions (negligent or otherwise), regardless of the cause, or for the results obtained from the use of such content. Third party contentproviders give no express or implied warranties, including, but not limited to, any warranties of merchantability or fitness for a particular purpose oruse. Third party content providers shall not be liable for any direct, indirect, incidental, exemplary, compensatory, punitive, special or consequentialdamages, costs, expenses, legal fees, or losses (including lost income or profits and opportunity costs) in connection with any use of their content,including ratings. Credit ratings are statements of opinions and are not statements of fact or recommendations to purchase, hold or sell securities. Theydo not address the suitability of securities or the suitability of securities for investment purposes, and should not be relied on as investment advice.
Jefferies research reports are disseminated and available primarily electronically, and, in some cases, in printed form. Electronic research issimultaneously available to all clients. This report or any portion hereof may not be reprinted, sold or redistributed without the written consent ofJefferies. Neither Jefferies nor any officer nor employee of Jefferies accepts any liability whatsoever for any direct, indirect or consequential damagesor losses arising from any use of this report or its contents.
For Important Disclosure information, please visit our website at https://javatar.bluematrix.com/sellside/Disclosures.action or call 1.888.JEFFERIES
© 2016 Jefferies Group LLC
Themes & Tactics
US Insights
May 20, 2016
page 16 of 16 , Jefferies LLC, (888) JEFFERIES, [email protected] Equity Research
Please see important disclosure information on pages 12 - 16 of this report.