force, motion, friction and energy - bioed online · 2017. 3. 6. · force, motion, friction and...
TRANSCRIPT

FORCE, MOTION, FRICTION AND ENERGY
STEM Activities for Use with the 2016 Hess Toy Truck and Dragster
Written by Gregory L. Vogt, Ed.D.
BioEd Teacher Resourceswww.bioedonline.org
© Baylor College of Medicine.

© Baylor College of Medicine. First edition 2017. All rights reserved.Printed in the United States of America.ISBN: 978-1-944035-17-4
Teacher Resources from the Center for Educational Outreach at Baylor College of Medicine
The mark “BioEd” is a service mark of Baylor College of Medicine. The information contained in this publication is for educational purposes only.
Activities described in this book are intended for school-age children under direct supervision of adults. The author, Baylor College of Medicine, the Hess Corporation, funding and sponsoring agencies cannot be responsible for any accidents or injuries that may result from conduct of the activities, from not specifically following directions, or from ignoring cautions contained in the text or with the product. The opinions, findings and conclusions expressed in this publication are solely those of the author and do not necessarily reflect the views of Baylor, Hess Corporation, image contributors or the sponsoring agencies.
No part of this book may be reproduced by any mechanical, photographic or electronic process, or in the form of an audio recording; nor may it be stored in a retrieval system, transmitted, or otherwise copied for public or private use without prior written permission of the publisher. Black-line masters reproduced for classroom use are excepted. Author: Gregory L. Vogt, Ed.D.Editor: James P. Denk, M.A.Design: Martha S. Young, B.F.A.
Center for Educational OutreachBAYLOR COLLEGE OF MEDICINEOne Baylor Plaza, BCM411 Houston, Texas 77030 713-798-8200 | 800-798-8244 | [email protected]://www.bioedonline.org | http://www.bcm.edu/ceo
HESS CORPORATION1501 McKinney StreetHouston, Texas 77010 [email protected] | www.hesstoytruck.com

iiiFORCE, MOTION, FRICTION AND ENERGY© Baylor College of Medicine.
CONTENTS
BAYLOR COLLEGE OF MEDICINE IV
HESS CORPORATION V
A UNIQUE TOOL FOR TEACHING STEM VI
ACTIVITIES
1. INVESTIGATING FRICTION 1
2. DETERMINING AVERAGE SPEED 5
3. DRAG RACING AND THE CENTER OF MASS 8
4. BUILT TO SCALE 13
5. TOWING IMPOSSIBLE LOADS 17
6. ON THE LEVEL, GOING UP, GOING DOWN 21
7. BREAK THE “WORLD RECORD” CAR JUMP 25
Note: The order of the activities may be changed if it is determined that it will create a more logical progression.
STEM is an acronym used to identify the academic subjects of science, technology, engineering and mathematics. By highlighting the inter-relatedness of these subjects, the STEM acronym encourages schools, districts and educators to integrate STEM content rather than teach each subject separately.
The STEM approach is important for workforce development and economic growth. Many careers are available in STEM-based fields, and forecasts indicate that in the future, there will be more STEM-based jobs than qualified workers to fill them.
For more information, visit http://changetheequation.org.
CONTENTS

FORCE, MOTION, FRICTION AND ENERGY© Baylor College of Medicine.
ivBAYLOR COLLEGE OF MEDICINE
B aylor College of Medicine, one of the country’s top medical schools and research institutions, focuses on furthering its mission of excellence in the areas of education,
research, healthcare and community service, both locally and globally. It is made up of a medical school, the Graduate School of Biomedical Sciences, the School of Allied Health Sciences, and the National School of Tropical Medicine, the first in the Western Hemisphere devoted to neglected tropical disease.
Located in the heart of the Texas Medical Center, the world’s largest health sciences complex, Baylor is surrounded by some of the leading institutions in healthcare. That concentration of expertise has helped support the development of collaborations that enrich every aspect of the College’s mission.
With seven affiliated teaching hospitals, Baylor has a diversity of resources unparalleled at other academic health centers. In addition, the College maintains relationships with major academic partners and institutions such as the University of Houston, Rice University and NASA.
Baylor partners with community leaders to serve Houston, Texas, and the world through educational outreach programs, innovative healthcare delivery models and research focused on specific community needs. Its educational outreach programs reach students at all levels, from middle school through college, creating a pipeline of learners interested in science and medicine.
Baylor ranks first in Texas and 19th in the nation in funding to medical schools from the National Institutes of Health and first in the nation for genetics. It consistently ranks among the top medical schools in the nation for research and primary care by U.S. News & World Report.
T he Center for Educational Outreach at Baylor College of Medicine offers a wide range of educational programs and resources that lead toward careers in medicine and the health sciences. These include teacher professional development
programs and materials that improve the STEM content knowledge and skills of K–12 teachers. Educators earn continuing education credits via the Center’s face-to-face workshops or online courses, some of which are tailored to meet the needs and requirements of individual schools or school districts. Online offerings include BioEd OnlineSM and SuperSTAARSM, dynamic web-based STEM teacher resources that provide coursework, streaming video presentations, teaching slide sets, inquiry-based classroom activities and complete teaching resources spanning preK–12. BioEd teacher resources and materials offer an integrated, hands-on approach to teaching STEM. Each inquiry-based unit is aligned with national and state science education standards.
BAYLOR COLLEGE OF MEDICINE

vFORCE, MOTION, FRICTION AND ENERGY© Baylor College of Medicine.
Hess Corporation is a leading global independent energy company engaged in the exploration and production of crude oil and natural gas. Social Responsibility is integrated into the way we do business, enhancing our ability to be an
effective and trusted energy partner and enabling us to meet the highest standards of corporate citizenship by creating a long-lasting, positive impact on the communities where we do business. Hess is committed to building trusted partnerships with governments, communities, employees, customers and stakeholders to develop programs that can make a measurable and sustainable difference. With over $175 million invested in social programs since 2011 we are helping to create an army of problem solvers that will overcome future complex challenges. Above all, we continue to be a company that cares about its people, its impact on the community, its reputation, and about doing the right thing.
THE HESS TOY TRUCK STORY The Hess company was founded in 1933 when Leon Hess bought a second-hand truck and started a business delivering fuel oil to homes in New Jersey. By the time Mr. Hess passed away in 1999, at the age of 85, Hess Corporation had grown into one of the world’s largest energy companies including oil exploration, production, storage and over 1300 gas stations along the east coast. Not long after opening the first Hess branded gas station in 1960, Leon Hess decided to offer families a fun, high quality and affordable toy for the holidays as a goodwill gesture to customers. With that decision, he created a toy for kids of all ages, the Hess Toy Truck, that has become a hallmark of the holiday season, with a new model released each year. Leon Hess wanted a toy truck made with outstanding craftsmanship and innovative use of electronics. And he wanted to offer it at a price families could afford with batteries included, a concept that endures to this day 52 years later, with the Hess Toy Truck remaining a beloved holiday tradition and among the largest selling toys in the country every year.
HOW IT’S MADE (STEM IN ACTION) It takes a very long time to become a Hess Toy Truck. The process of developing the annual toy starts two to three years before the truck goes on sale. In some cases, a truck has taken as long as six years to go from concept to market. The drawings and feature concepts are reviewed, and the toys begin to evolve. The top two or three designs go to the next round, where they are transformed from drawings to handmade models. The models are evaluated for safety, functionality, playability, durability and value. Eventually, the new Hess Toy Truck is chosen. Each Hess toy is generally comprised of 75 to more than 100 small, hard plastic pieces. A tooling, or mold, for each piece must be cut to precise measurements. Once the toolings are made and tested, the pieces are produced and meticulously assembled. Then, as anyone who has unpacked a Hess Toy Truck knows, the final toy is placed—very carefully—into the toy box.
HESS CORPORATION
HESS CORPORATION

FORCE, MOTION, FRICTION AND ENERGY© Baylor College of Medicine.
viA UNIQUE TOOL FOR TEACHING STEM
Friction (T, D)Inclined plane (T)
Inertia (T, D)
Mass, center of mass (T, D)Momentum (T, D)
Potential and kinetic energy (T, D)
Speed and Velocity (D)Wheels and axles (T, D)
Lights (T, D) Plastic part molding (T, D) Sound generator (T)
Balance (D)Energy transfer mechanism (D)
Safety design (T, D) Shifting weight (D)
Stability (T, D)
Mass (T, D) Measurement of distance (T, D) Measurement of speed (D)
SCIENCE
TECHNOLOGY
ENGINEERING
MATHEMATICS
A UNIQUE TOOL FOR TEACHING STEM
F orce, motion, friction and energy are important physical science concepts that middle grade students encounter in their science, technology, engineering and mathematics (STEM) studies. To be ready for the jobs of tomorrow, students must
not only know these concepts, but also engage in practical experiences that enable them to understand how they apply in the real world. This guide is intended to achieve those objectives.
The 2016 Hess Toy Truck and Dragsters are much more than toys or collectors’ items. They are useful teaching tools that offer a variety of practical and fun possibilities for teaching STEM subjects, such as force, motion and energy.
The set consists of two vehicles: a flatbed carrier truck and a dragster. The truck has lights and sound effects, and includes a concealed ramp for rolling the dragster on and off the truck bed. It is unpowered but rolls very easily. The dragster has lights but no sound effects. It is powered with a friction, or pull-back, motor which has a spring that can be wound by pulling the car backward across the floor a few times. The dragster also has a sliding weight—which sounds like a rattle when the car is shaken—to permit wheelies during acceleration, when tilted back before releasing.
Each activity in this guide explores different aspects of force, motion and energy. The activities can be used sequentially or be inserted into an existing curriculum. While designed for middle grades (4–6), they can easily be adapted for upper and lower grades. The activities support the Three Dimensions of Science Learning in the Next Generation Science Standards (http://www.nextgenscience.org). Some include student pages that can be used for assessment or be placed in science notebooks. This guide and the Hess Toy Truck and Dragster combine to make a powerful STEM learning experience that is stimulating, enriching, and just plain fun.
HESS TOY TRUCK (T) AND DRAGSTER (D) STEM APPLICATIONSThe Hess Toy Truck and Dragster can be used to teach the following STEM concepts, among others.
FEEDBACKHess Corporation invites teachers to share their experiences using the 2016 Hess Toy Truck and Dragster as a STEM tool in the classroom ([email protected]), as well as to post photographs of students’ work on social media (#HessToyTruck).

1FORCE, MOTION, FRICTION AND ENERGY© Baylor College of Medicine.
F riction is an interesting and very useful force that interferes with motion. It occurs when two surfaces slide against each other. Friction can be good or bad, depending upon where it occurs.
In automotive applications, “good” friction, such as that between the tires of a vehicle and the road surface, enables a vehicle to move. Engines transmit force to the wheels, prompting them to turn. Friction causes the tires to push against the road surface, propelling the vehicle in the opposite direction. The result is an application of Sir Isaac Newton’s Third Law of Motion (for
every action there is an opposite and equal reaction). When it is time to stop the vehicle, brake pads press against the wheels (the brake drums) and friction stops the wheels from turning. Friction between the tire and the road surface then stops the vehicle.
“Bad” friction, on the other hand, occurs within a vehicle’s moving parts. As the parts move against each other, friction causes wear and tear. Lubricants, like motor oil, greatly reduce the effects of bad friction.
In this activity, the wheels of the truck work a little differently than described above. The truck is unpowered. Thus, it must be pushed, or rolled down a ramp, to move. In this case, the wheels reduce friction and enable the truck
to roll forward easily. If the truck bottom were simply a flat surface without wheels, friction would make it difficult to move by pushing, and the truck would stop as soon as the push was no longer being applied. Even with wheels, the truck is affected by friction, and it will come to a stop some distance after it is pushed. The surface over which the truck rolls will impact the distance traveled.
THE QUESTIONWhat effects do different road surfaces have on the distance traveled by the Hess Toy Truck?
MATERIALS• Hess Toy Truck• Access to a smooth, uncarpeted floor• Books or boxes to elevate one end of the ramp • Cardstock (to smooth the surface between the ramp and
the surface of the table or floor) • Masking tape• Meterstick or measuring tape• Ramp: Piece of wood or flattened cardboard box to make an inclined plane (see “Management Tips”)• Sheets of foil, wax paper, etc. (different surfaces for the bottom of the ramp)• Copy of student page (one per student)• Optional: Access to actual road surfaces outside of the classroom (see “Extensions”)
MANAGEMENT TIPSIt is unnecessary to have an inclined plane for every team. Set up identical ramps for each test surface so that teams can take
1. INVESTIGATING FRICTION
1. INVESTIGATING FRICTION

FORCE, MOTION, FRICTION AND ENERGY© Baylor College of Medicine.
2
turns using them. Before starting their tests, teams always should confirm the height of the new starting ramp to make sure no slippage has occurred while the previous team was using it. The student data/question sheet asks students to average their test runs. If necessary, discuss what is meant by “average” and explain the steps for averaging data.
PROCEDURE1. Set up an inclined plane by leaning a ramp of cardboard or wood against a pile of books or a box, resting on the floor. The
ramp should be two or three times the length of the truck. Use some masking tape at the lower end of the ramp to keep it in place on the floor. If using a board for a ramp, tape cardstock to the ramp and floor to smooth out the drop caused by the board’s thickness.
2. Have the student teams roll the truck down the ramp and measure how far it rolls before stopping. Each team member should record the measurement on their student pages. Have them repeat the test two more times and calculate the average distance for the three runs. Stress that it is very important that the truck be placed exactly in the same spot on the ramp for each test. A piece of masking tape makes a good starting line to ensure accuracy.
3. Repeat exercise in a new location over a different floor surface, such as carpeting, tile, or wood flooring. Before moving the ramp for the new setup, measure the precise height of the starting line during the first trial. The starting line must be at the exact same height in all tests so that the truck will receive the same amount of kinetic energy in each trial. Without this experimental control, the data collected during different trials will not be comparable.
4. Try repeating using different surface textures, such as wax paper or aluminum foil. Being careful to avoid wrinkles, roll out a long sheet of wax paper or foil, beginning at the base of the ramp. Use tape to secure the sheet. Have teams run the tests again on the new surface and record their data. (Note: Wax paper or aluminum foil work best over a smooth floor.)
1. INVESTIGATING FRICTION
Masking tape
Cardstock
Wood ramp
Use cardstock and masking tape to smooth out the lower end of the ramp.
Experiment with different textures, such as a strip of wax paper, foil or cloth, placed at the end of the ramp.

3FORCE, MOTION, FRICTION AND ENERGY© Baylor College of Medicine.
WRAP IT UPWhen all teams have completed their test runs, recorded their data and answered the questions on the student sheets, discuss their results. One strategy for starting the conversation is to draw a blank table on the board, with a row or column for each road surface. Have teams enter their average times and compare the results. Follow up with the suggested questions below.
• The toy truck doesn’t have an engine. What causes it to move? • Which road surface enabled the truck to roll the furthest? Why? • Why was it important to make sure the starting line height was the same for each test run? What is it called when you
make sure conditions are the same every time? • Would the truck travel farther, less far, or the same distance if it were carrying a load (such as the dragster)? Why do you
think so? (See “Extensions” below.)
EXTENSIONS1. To answer the final question above, run a test of the truck with a load. 2. Conduct tests outside of the school building on actual road surfaces, such as concrete or asphalt. 3. Have students design and construct a graph to display their data.
1. INVESTIGATING FRICTION

FORCE, MOTION, FRICTION AND ENERGY© Baylor College of Medicine.
4
INVESTIGATING FRICTION
1. Record your investigation results in the table below.
2. Explain what friction is in your own words.
3. What force caused the truck to roll across the different “road” surfaces?
4. Over which road surface did the truck roll the farthest?
5. Explain why this surface worked the best. Tip: What does the road surface you picked feel like in comparison to the other road surfaces?
1. INVESTIGATING FRICTION
Test Number Road Surface Material Run 1 Run 2 Run 3 Average
1
2
3
4
5
Name Team number

5FORCE, MOTION, FRICTION AND ENERGY© Baylor College of Medicine.
Speed and velocity are terms students must know to describe movement. Speed is a measure of how fast something is traveling, or distance divided by time (for example, 100 miles per hour). In shorthand, speed is written thus: 100 m/h
or 100 mph. Velocity, on the other hand, includes both speed and direction. The velocity of the same vehicle is 100 m/h east (or north, southwest, etc.).
Acceleration is another useful term for describing motion. Acceleration is defined as any change in velocity. That means that when a car is going faster and faster, it is accelerating, and when the car is going slower and slower, it also is accelerating—but the acceleration is negative. To avoid confusion, we say that the car is decelerating.
Acceleration also occurs in another way. Remember, acceleration is a change in velocity and velocity is a combination of speed and direction. Acceleration also takes place when a vehicle is going at a constant speed but
is changing direction. For example, observe a car on the highway as it goes around a curve. At the end of the curve, the car is traveling in a new direction. Because velocity is a combination of speed and direction, going around a curve causes acceleration. When either speed or direction changes (or both change), acceleration occurs.
In this activity, students use a timer to determine how many seconds the dragster takes to travel from the starting line to the finish line of a measured course. The result will be a measurement of speed: feet or meters per second. Because there may be unexpected variables (differences in release, uneven spots in the floor, etc.), students will measure the speed at least three times and average the results. If teams are very careful in controlling variables, the results of the different runs should be consistent—within a second or two.
Unlike real cars, which can travel at a constant speed, the Hess dragster continually changes its velocity until it comes to a stop. Starting with its friction motor fully wound and the dragster held in place, the speed is zero. Upon release, the motor changes the potential energy, stored by the winding, into kinetic energy. At that point, the dragster’s wheels propel the car forward. The dragster accelerates until the friction motor completely unwinds and no longer imparts energy to the rear wheels. The dragster’s momentum (mass x velocity) keeps it moving until friction with the road surface and surrounding air decelerates it to a complete stop.
THE QUESTIONWhat is the dragster’s average speed over a measured course?
2. DETERMINING AVERAGE SPEED
2. DETERMINING AVERAGE SPEED
HESS
HESS
Motor exhausted:Coasting phase
Kinetic energy from the motor
0Start Distance Finish
Sp
eed
APPROXIMATE ACCELERATION OF THE DRAGSTER

FORCE, MOTION, FRICTION AND ENERGY© Baylor College of Medicine.
6
MATERIALS• Hess Toy Dragster• Access to a flat, uncarpeted floor (preferably a hallway)• Masking tape• Meterstick or tape measure• Timer (smartphone stopwatch app or a stopwatch)• Copy of student page (one per student)
MANAGEMENT TIPSPut a small piece of masking tape on each dragster and number the dragsters from 1 to 10. (Tip: Keep the labels on the cars.) A flat, uncarpeted floor provides the most consistent results. (Carpet may introduce variables that are difficult to control. The car may not run a straight path to the finish line and this would influence its time.) If one trial run has very different results from the others, have the team drop that result and conduct a replacement run. The same kind of thing happens in scientific research when one data point, called an outlier, is far out of line of the others. Scientists will discard the point if it was caused by experimental errors. However, in medical research, scientists will seek to understand the outlier because it may have significance to the overall research. If time permits, repeat the activity and shuffle job responsibilities so more team members have a chance to drive the dragster or to work the timer.
PROCEDURE1. Organize students into teams of 3 or 4. Teams should assign one of the following jobs to each member. One student
will be the “driver,” who will wind up the friction motor and release the car. The driver must be very consistent with the winding, aiming, and releasing of the car. The second team member will be the “judge,” who calls out “start” while pressing the start button on the timer. The judge stops the timer when the track marshal calls “stop” as the car reaches the end line. The third team member—“track marshal”—is located at the finish line. The track marshal calls out “stop” when the car reaches the end of the track, and also returns the car to the starting line for the next run. The fourth team member, the “recorder,” records the time measurement of each run. If a team has only three members, the judge also can be the recorder.
2. Set up a measured track. First, place a strip of masking tape on the floor to mark the starting point. Next, conduct a couple of test runs with the dragster to see how far the dragster will travel (about 30 feet, or 10 meters). Finally, place a strip of masking tape on the floor to mark the finish line. The track is ready.
3. Have teams, in turn, set up their cars and conduct their test runs. Each team should do at least three measured runs. If a dragster does not run in a straight line or misses the finish line, that test is a failure and the run must be repeated.
4. When a team has completed its runs, students should record their results in meters per second or feet per second and answer the questions on the student pages.
WRAP IT UPAsk each team to post the average speed of its three runs on the board. Compare the results and discuss the following.
• Are some dragsters faster than others? Discuss what might cause different results. For example, there may have been driver error, dirty wheels. Or dirt or sticky material on the track, etc.
• Another source of error is the sliding mass within the dragster that permits wheelies. The mass might be in different positions for each run. Discuss the answers students wrote for the last question on the student page.
EXTENSIONHave students try to answer the following questions: Is there a difference between the speed of a dragster that starts the run with all four wheels down and one that starts by doing a wheelie? How can we find out?
2. DETERMINING AVERAGE SPEED

7FORCE, MOTION, FRICTION AND ENERGY© Baylor College of Medicine.
Record the results for three speed trials in the chart. Using the larger box, calculate the average speed of the three trials. Record the result in the “Average Speed” column. Then answer the questions below. Use the back of this sheet if you need additional space.
1. Why is it important to run the dragster speed test three times and average the results? What could happen if you ran the dragster just one time?
2. What could you do to improve the accuracy of your experimental results?
3. How does this activity compare to the experimental work conducted by scientists?
4. If measuring average speed in meters per second, convert your amounts to feet per second. Or convert feet per second to meters per second.
2. DETERMINING AVERAGE SPEED
DETERMINING AVERAGE SPEED
Calculate the average speed.
Trial Speed Average Speed
1
2
3
Name Team number
FORCE, MOTION, FRICTION AND ENERGY© Baylor College of Medicine.
8
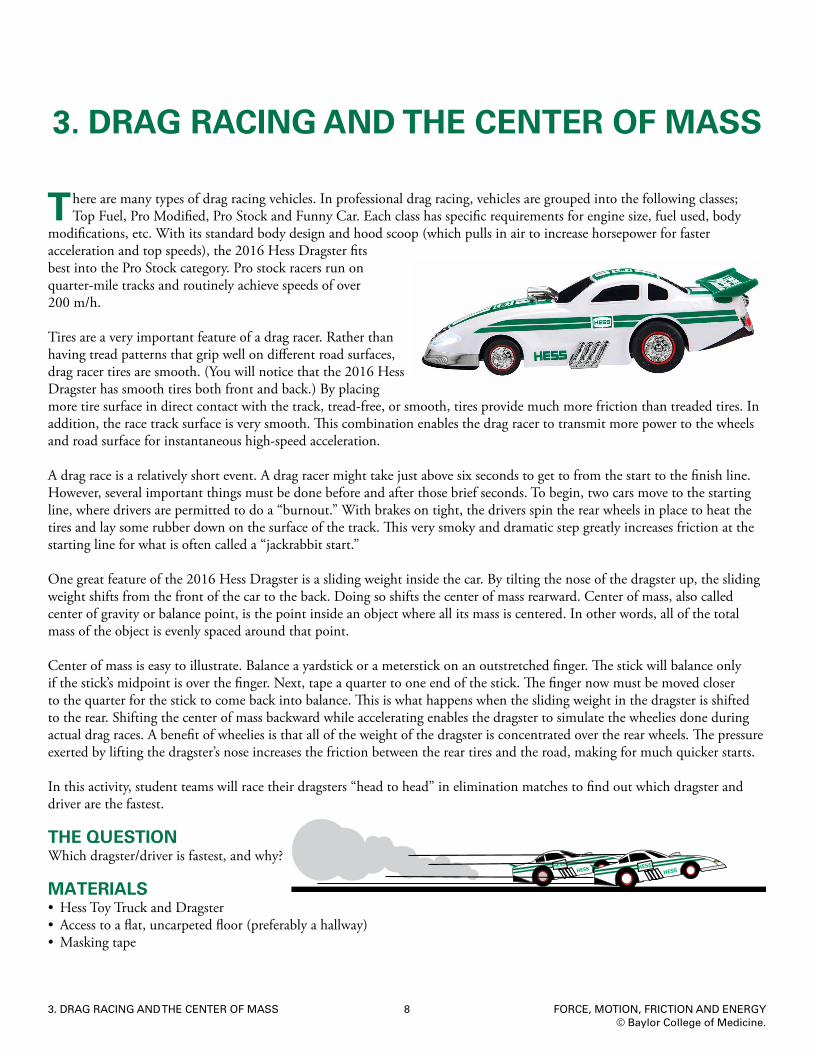
There are many types of drag racing vehicles. In professional drag racing, vehicles are grouped into the following classes; Top Fuel, Pro Modified, Pro Stock and Funny Car. Each class has specific requirements for engine size, fuel used, body
modifications, etc. With its standard body design and hood scoop (which pulls in air to increase horsepower for faster acceleration and top speeds), the 2016 Hess Dragster fits best into the Pro Stock category. Pro stock racers run on quarter-mile tracks and routinely achieve speeds of over 200 m/h.
Tires are a very important feature of a drag racer. Rather than having tread patterns that grip well on different road surfaces, drag racer tires are smooth. (You will notice that the 2016 Hess Dragster has smooth tires both front and back.) By placing more tire surface in direct contact with the track, tread-free, or smooth, tires provide much more friction than treaded tires. In addition, the race track surface is very smooth. This combination enables the drag racer to transmit more power to the wheels and road surface for instantaneous high-speed acceleration.
A drag race is a relatively short event. A drag racer might take just above six seconds to get to from the start to the finish line. However, several important things must be done before and after those brief seconds. To begin, two cars move to the starting line, where drivers are permitted to do a “burnout.” With brakes on tight, the drivers spin the rear wheels in place to heat the tires and lay some rubber down on the surface of the track. This very smoky and dramatic step greatly increases friction at the starting line for what is often called a “jackrabbit start.”
One great feature of the 2016 Hess Dragster is a sliding weight inside the car. By tilting the nose of the dragster up, the sliding weight shifts from the front of the car to the back. Doing so shifts the center of mass rearward. Center of mass, also called center of gravity or balance point, is the point inside an object where all its mass is centered. In other words, all of the total mass of the object is evenly spaced around that point.
Center of mass is easy to illustrate. Balance a yardstick or a meterstick on an outstretched finger. The stick will balance only if the stick’s midpoint is over the finger. Next, tape a quarter to one end of the stick. The finger now must be moved closer to the quarter for the stick to come back into balance. This is what happens when the sliding weight in the dragster is shifted to the rear. Shifting the center of mass backward while accelerating enables the dragster to simulate the wheelies done during actual drag races. A benefit of wheelies is that all of the weight of the dragster is concentrated over the rear wheels. The pressure exerted by lifting the dragster’s nose increases the friction between the rear tires and the road, making for much quicker starts.
In this activity, student teams will race their dragsters “head to head” in elimination matches to find out which dragster and driver are the fastest.
THE QUESTIONWhich dragster/driver is fastest, and why?
MATERIALS• Hess Toy Truck and Dragster • Access to a flat, uncarpeted floor (preferably a hallway)• Masking tape
3. DRAG RACING AND THE CENTER OF MASS
3. DRAG RACING AND THE CENTER OF MASS

9FORCE, MOTION, FRICTION AND ENERGY© Baylor College of Medicine.
3. DRAG RACING AND THE CENTER OF MASS
RACE 1
10 Teams
2 Winners4 Winners
GrandChampion
RACE 2RACE 3
• Meterstick or yardstick• 2 smartphones (one for use with a stopwatch app and one for use with its video camera)• Copy of student pages (one set per student)
MANAGEMENT TIPSMake sure the floor or hallway used for the race has a clean, debris-free surface.
Set up a measured track. First, place a strip of masking tape on the floor to mark the starting point. Next, conduct a couple of test runs with the dragster to see how far the dragster will travel (about 30 feet, or 10 meters). Place a strip of masking tape on the floor to mark the finish line. Use long strips of tape on the floor to serve as track lanes. The track is ready.
During the race, if a car crosses over the lane marker, run the race again. It is a good idea to establish a rule for how many runs are allowed before a car is disqualified.
For racing teams, assign or let students assign themselves as the Driver, Starter, Timer, and Videographer. Suggest that Starters and Drivers practice the countdown and release of cars. Winning the race depends not only on the car, but on the driver’s reaction time. (See Part 2, Item 3 for more details.)
Remind team drivers that they must wait for the starters to press the truck’s countdown button. If one car is released too soon, have both teams reset their cars and run the race again. Serve as the race judge and decide how many faults are too many.
Provide each team with a copy of each student sheet Have the drivers follow the instructions to practice preparing and releasing their cars. One effective technique is to fully wind the motor and place the car behind the starting line. Using a single finger, press down on the rear of the car, and hold the car in place until the driver hears the final countdown sound. Lifting the finger makes for a very smooth release that doesn’t impart any side motion that might occur when gripping with the whole hand.
PROCEDUREPart 1. Center of Mass1. Begin a discussion about mass and finding the center of mass. Using a finger and meterstick, demonstrate how to find the
meterstick’s center of mass.2. Distribute copies of the student sheets (one per student). Allow students enough time so that each has a chance to
experiment with finding the dragster’s center of mass.
Part 2. Using the Center of Mass 1. Create a racing schedule for student
teams. Each team should come up with a team name. Place the schedule on the board. Use an elimination style chart, such as the example below. Start by randomly pairing cars for individual races. The four fastest cars in Race 1 will advance to Race 2, where they will race each other “head to head.” The two winning cars from Race 2 will compete in Race 3 to determine the Grand Champion.
2. Have teams prepare the same dragsters they used for the activity, “Determining Average Speed.” Discuss the background information regarding dragster wheels

FORCE, MOTION, FRICTION AND ENERGY© Baylor College of Medicine.
103. DRAG RACING AND THE CENTER OF MASS
DRAG RACING LIGHTS
Yellow pre-stage and stage lights indicate when cars are in position.
Orange lights come on in 0.5 second intervals as a countdown to go.
Green lights mean GO!
Red lights mean stop because one or both cars started too soon.
PRE-STAGE
STAGE
and how the sliding weight enables wheelies. Have teams check their car’s wheels to make sure they are very clean. If teams come up with a way to increase the friction of the large wheels, let them do so —providing their idea does not damage the wheels in any way. (Adding something sticky to the wheels might be good for a fast acceleration but may impede the car during its coasting phase.)
3. Select two students to determine the winner of each race. Have the Timer use a smartphone stopwatch app or a stopwatch to time the race from beginning to end, and the Videographer use a smartphone to record a video of the cars crossing the finish line. Both students should be positioned at the finish line. Have the Starter stand at the starting line with the Hess Toy truck. He or she should press the right side button on the roof of the truck to initiate the truck’s audio countdown of “5, 4, 3, 2, 1,” immediately followed by a “start” beep. The Timer should start the stopwatch at the sound of the truck’s starting sound and stop timing when the first car crosses the finish line. Have the Videographer focus on the finish line. If the race is too close to call a winner visually, the video can be played to determine which car nosed across the finish line first.
4. Run the first race with all ten cars, two cars at a time. The four cars from Race 1 with the best times will run in Race 2 (two heats with two cars running head-to-head). The two winning cars from Race 2 will run the final competition (Race 3) to determine a Grand Champion.
WRAP IT UPAsk teams to discuss any special strategies they had for running their dragsters in the races. What did they do to increase friction, aim the car, release the car, etc.? Make sure students understand the concept of center of mass and how it made wheelies possible. Discuss the following question.
• When is the dragster moving the fastest? (Just before the nose drops down. The friction motor winds down so that no more energy is added to the rear wheels and the car begins free-wheeling.)
EXTENSIONS1. Many pictures of drag racers and racetracks are available
on the Internet. Collect images into a PowerPoint® or Keynote® presentation to show your students.
2. If time permits, have students design and construct their drag racing track. Professional race tracks have two lanes and a “Christmas tree” countdown pole with lights at the starting line. Light-beam timers measure the moment the dragsters start. Light-beam timers at the finish line determine the time of the dragster’s crossing.
11FORCE, MOTION, FRICTION AND ENERGY© Baylor College of Medicine.
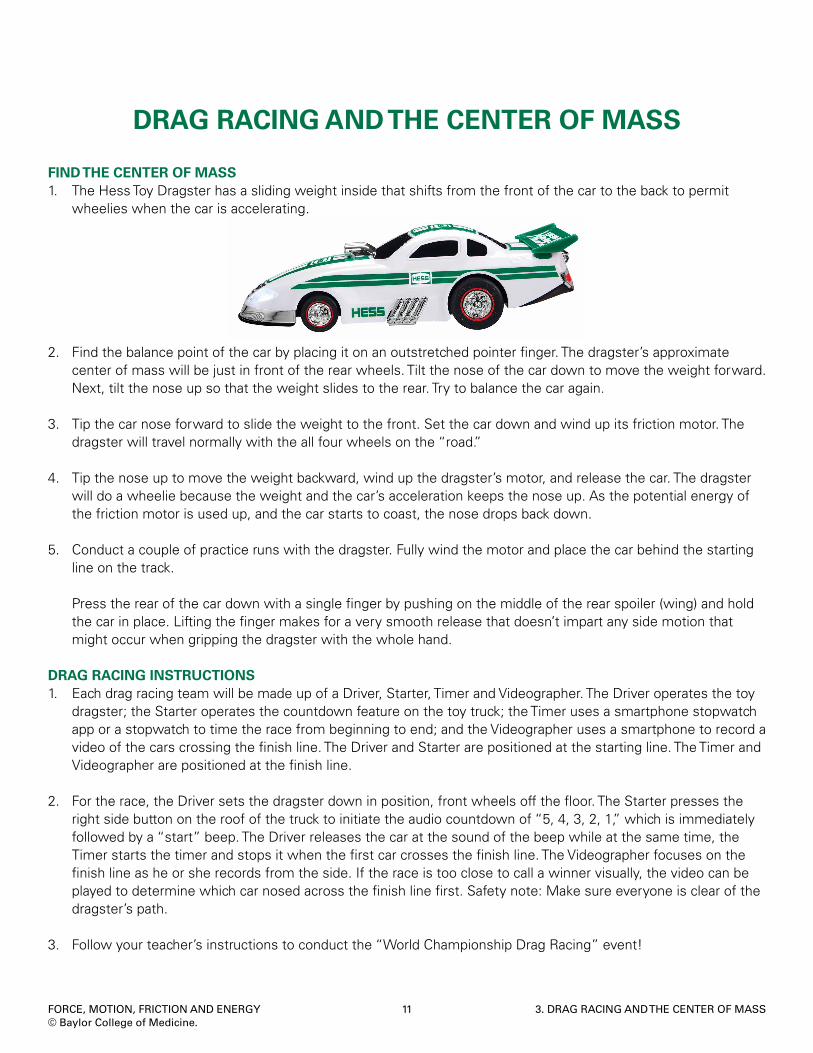
FIND THE CENTER OF MASS1. The Hess Toy Dragster has a sliding weight inside that shifts from the front of the car to the back to permit
wheelies when the car is accelerating.
2. Find the balance point of the car by placing it on an outstretched pointer finger. The dragster’s approximate center of mass will be just in front of the rear wheels. Tilt the nose of the car down to move the weight forward. Next, tilt the nose up so that the weight slides to the rear. Try to balance the car again.
3. Tip the car nose forward to slide the weight to the front. Set the car down and wind up its friction motor. The dragster will travel normally with the all four wheels on the “road.”
4. Tip the nose up to move the weight backward, wind up the dragster’s motor, and release the car. The dragster will do a wheelie because the weight and the car’s acceleration keeps the nose up. As the potential energy of the friction motor is used up, and the car starts to coast, the nose drops back down.
5. Conduct a couple of practice runs with the dragster. Fully wind the motor and place the car behind the starting line on the track. Press the rear of the car down with a single finger by pushing on the middle of the rear spoiler (wing) and hold the car in place. Lifting the finger makes for a very smooth release that doesn’t impart any side motion that might occur when gripping the dragster with the whole hand.
DRAG RACING INSTRUCTIONS1. Each drag racing team will be made up of a Driver, Starter, Timer and Videographer. The Driver operates the toy
dragster; the Starter operates the countdown feature on the toy truck; the Timer uses a smartphone stopwatch app or a stopwatch to time the race from beginning to end; and the Videographer uses a smartphone to record a video of the cars crossing the finish line. The Driver and Starter are positioned at the starting line. The Timer and Videographer are positioned at the finish line.
2. For the race, the Driver sets the dragster down in position, front wheels off the floor. The Starter presses the right side button on the roof of the truck to initiate the audio countdown of “5, 4, 3, 2, 1,” which is immediately followed by a “start” beep. The Driver releases the car at the sound of the beep while at the same time, the Timer starts the timer and stops it when the first car crosses the finish line. The Videographer focuses on the finish line as he or she records from the side. If the race is too close to call a winner visually, the video can be played to determine which car nosed across the finish line first. Safety note: Make sure everyone is clear of the dragster’s path.
3. Follow your teacher’s instructions to conduct the “World Championship Drag Racing” event!
3. DRAG RACING AND THE CENTER OF MASS
DRAG RACING AND THE CENTER OF MASS

FORCE, MOTION, FRICTION AND ENERGY© Baylor College of Medicine.
12
Answer the following questions. Use the back of this sheet if you need additional space.
1. How did your dragster place in the races? Check all that apply.
Made it to the final four (Race 2)
Made it to the final two (Race 3)
Grand Champion
2. Did your team do anything to improve the performance of your dragster? Explain below.
3. If your team did not win Grand Champion, what could you do to improve your chances if the races were conducted again?
4. What is meant by the term center of mass? Explain how shifting the center of mass of the dragster enables the dragster to do wheelies.
5. The dragster starts out with a fully wound friction motor. Upon release, it takes off along the track. How can you tell when the dragster is no longer accelerating and has begun coasting?
DRAG RACING REPORT
3. DRAG RACING AND THE CENTER OF MASS
Name Team name
13FORCE, MOTION, FRICTION AND ENERGY© Baylor College of Medicine.
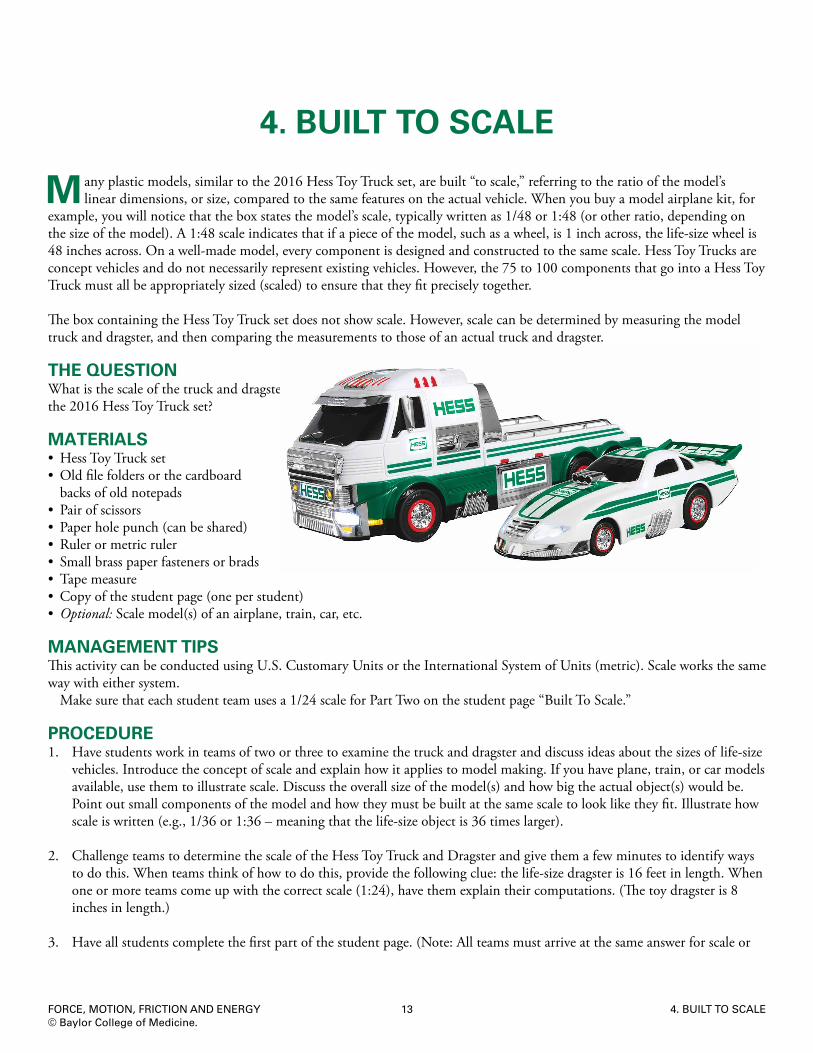
M any plastic models, similar to the 2016 Hess Toy Truck set, are built “to scale,” referring to the ratio of the model’s linear dimensions, or size, compared to the same features on the actual vehicle. When you buy a model airplane kit, for
example, you will notice that the box states the model’s scale, typically written as 1/48 or 1:48 (or other ratio, depending on the size of the model). A 1:48 scale indicates that if a piece of the model, such as a wheel, is 1 inch across, the life-size wheel is 48 inches across. On a well-made model, every component is designed and constructed to the same scale. Hess Toy Trucks are concept vehicles and do not necessarily represent existing vehicles. However, the 75 to 100 components that go into a Hess Toy Truck must all be appropriately sized (scaled) to ensure that they fit precisely together.
The box containing the Hess Toy Truck set does not show scale. However, scale can be determined by measuring the model truck and dragster, and then comparing the measurements to those of an actual truck and dragster.
THE QUESTIONWhat is the scale of the truck and dragster in the 2016 Hess Toy Truck set?
MATERIALS• Hess Toy Truck set• Old file folders or the cardboard backs of old notepads• Pair of scissors• Paper hole punch (can be shared)• Ruler or metric ruler• Small brass paper fasteners or brads• Tape measure• Copy of the student page (one per student)• Optional: Scale model(s) of an airplane, train, car, etc.
MANAGEMENT TIPSThis activity can be conducted using U.S. Customary Units or the International System of Units (metric). Scale works the same way with either system.
Make sure that each student team uses a 1/24 scale for Part Two on the student page “Built To Scale.”
PROCEDURE1. Have students work in teams of two or three to examine the truck and dragster and discuss ideas about the sizes of life-size
vehicles. Introduce the concept of scale and explain how it applies to model making. If you have plane, train, or car models available, use them to illustrate scale. Discuss the overall size of the model(s) and how big the actual object(s) would be. Point out small components of the model and how they must be built at the same scale to look like they fit. Illustrate how scale is written (e.g., 1/36 or 1:36 – meaning that the life-size object is 36 times larger).
2. Challenge teams to determine the scale of the Hess Toy Truck and Dragster and give them a few minutes to identify ways to do this. When teams think of how to do this, provide the following clue: the life-size dragster is 16 feet in length. When one or more teams come up with the correct scale (1:24), have them explain their computations. (The toy dragster is 8 inches in length.)
3. Have all students complete the first part of the student page. (Note: All teams must arrive at the same answer for scale or
4. BUILT TO SCALE
4. BUILT TO SCALE

FORCE, MOTION, FRICTION AND ENERGY© Baylor College of Medicine.
14
else every other calculation they make will be incorrect.)4. Make a demonstration cardboard caliper to show your students. Cut out the two
arms, punch holes, and thread a brass paper fastener through the holes. Spread the tines and apply a bit of tape to hold them tight against the back arm. When assembled, the caliper will look like a large, odd-shaped pair of tweezers. By closing the caliper tips on opposite ends on any part of the truck or dragster will allow an accurate measurement of size. Carefully remove the caliper without adjusting the arms. Place the gap over a ruler and read the measurement.
5. Distribute construction materials and tools, and have students make their own calipers.
6. When the calipers are completed, instruct teams to complete the student page, “Models: Built to Scale.” Remind teams to show their work on the back of the sheet when making calculations.
WRAP IT UPDiscuss the results of the student pages and elaborate on the meaning of scale.
• Scales can be large or small, which can be confusing. A small scale reflects a very large ratio, such as 1/10,000. In this case, the Hess Truck and Dragster set is very small, compared to the life-size object (e.g., one centimeter on the model represents 10,000 centimeters on the life-size object). Small scales are used for models of very large objects, such as naval ships. A large scale means a small ratio, such as 1/10 (e.g., one centimeter on the model represents 10 centimeters on the life-size object).
• If the scale of the truck and dragster was 1/72, how long would life-size truck be? How long would the life-size dragster be? (Truck = 72 feet. Dragster = 48 feet).
EXTENSIONS1. If your students will be studying topographic maps, relate model scale to map scale. Typically, maps provided by the
United States Geological Survey, employ very small scales such as 1/24,000, 1/63,360, or even 1/500,000. A scale of 1/63,360 means that one inch on the map equals 63,360 inches on the surface of Earth. (This scale is not random; there are 63,360 inches in one mile.) For more information on map scales, visit https://pubs.usgs.gov/fs/2002/0015/report.pdf
2. Have students sketch trucks of their own design and indicate the scale of their drawings. Have them start with some general sketches and then make a detailed sketch on graph paper. Graph paper makes it easier to be consistent with scale.
4. BUILT TO SCALE
ANSWER KEY“Models: Built to Scale”
PART 11/24
PART 2 (T = Truck, D = Dragster)1. Length of model vehicles T = 12 in. | D = 8 in.
2. Length life size vehicles LT = 24 ft | LD = 16 ft
3. Width of model vehicles T = 4.25 in. | D = 2.75 in. Width of life-size vehicles LT = 102 in. | LD = 66 in
4. Height of model vehicles T = 4.5 in. | D = 2 in. Height of life size vehicles LT = 108 in. | D = 48 in.
5. Life-sized wheels (diameter) D = 21 in., and 30 in. T = 36 in.

15FORCE, MOTION, FRICTION AND ENERGY© Baylor College of Medicine.
1. Make the long arms of the caliper about 8 inches in length. Punch a hole where the small white dots indicate.
2. Join the long arms together with a brass fastener or brad as shown. The short arms move in together and back out. These are referred to as the “jaws” of the caliper.
3. Touch both sides or ends of the vehicle part you want to measure with the caliper jaws. Remove the caliper without letting the arms slip or move. Hold the jaws over a ruler and read the measurement in the space between the jaws.
4. BUILT TO SCALE
MAKE AND USE CALIPERS
Name Team number
CALIPER PATTERN

FORCE, MOTION, FRICTION AND ENERGY© Baylor College of Medicine.
16
PART 1Use the Hess Toy Truck set as a model to represent a real, life-size vehicle.
1. What is the scale of the model? 1/______
2. How did you figure this out? Show your work on the back of this sheet.
3. Have your answer confirmed by your teacher before proceeding to Part 2.
PART 2Using your ruler and caliper as tools, answer the following questions about the model truck (T) and model dragster (D), and about a life-size truck (LT) and life-size dragster (LD). Record your answers in the boxes.
Don’t forget to use either U.S. or metric units, and show abbreviations of the type of unit you are using with each measurement.
1. What is the length of the model truck and dragster (T and D)?
2. Using the scale for the model from Part 1, calculate and record the length of life-size vehicles (LT and LD).
3. How wide are the model vehicles (T and D)? Use the scale to calculate and record the width of the life-size vehicles (LT and LD).
4. What is the height of each model (T and D)? Use the scale to calculate and record the height of the life-size vehicles (LT and LD).
5. Three different wheel sizes are used in the model vehicles. Measure them, then calculate and record how big the life-size wheels would be.
6. If you were to construct a model of yourself to place near the model truck and dragster, how tall should you make the model of you?
BUILT TO SCALE
LENGTH
T
LT
D
LD
WIDTH
T
LT
D
LD
HEIGHT
T
LT
D
LD
LIFE-SIZE WHEELS
1 MY MODEL HEIGHT
Name Team number
Draw a stick figure inside the box to the left to show about how tall the model of you is in relation to the vehicle models.
LD LDLT
4. BUILT TO SCALE

17FORCE, MOTION, FRICTION AND ENERGY© Baylor College of Medicine.
T ruck pulls are automotive sporting events where “souped-up” pickup trucks try to tow massive loads. Auto company television commercials also sometimes feature truck pulls to show how powerful their trucks are.
The 2016 Hess Truck is unpowered, but the accompanying Dragster is powered. In this activity, the dragster will do the pulling, instead of the truck.
The truck’s smooth-functioning wheels and axles greatly reduce the effects of friction with the “road” surface as the truck rolls. Still, it takes power to start the truck moving. Due to inertia, the truck’s mass resists a change in motion. Isaac Newton’s First Law of Motion, also called the “law of inertia,” states that objects at rest or in motion remain in their state of rest or motion unless acted upon by an unbalanced force. In other words, a force must be exerted to cause a stationary truck to move, or a moving truck to stop.
Inertia impacts every object, large or small. The greater an object’s mass, the greater its inertia. Thus, a heavily loaded truck requires more force to move than does an empty one.
In this activity, student teams will determine how far a fully wound dragster can tow the Hess Trucks under different circumstances. At first, teams will measure how far the dragster can pull an empty truck. Then, extra weight will be added to the truck’s flatbeds, and the test will be conducted again. Finally, teams will be invited to join forces and use more than one dragster to try to pull a truck carrying an “impossible load.”
THE QUESTIONWhat is the relationship between the weight of the truck’s load and how far it is towed?
MATERIALS• Hess Toy Truck set• Access to a flat, uncarpeted floor • Masking tape• Metersticks or yardsticks• Smart phone stopwatch app or stopwatch• Yarn or string• 0.5 liter-size water bottles, filled with water (4 bottles per team)• Copy of the student page (one per student)
MANAGEMENT TIPSA flat, uncarpeted floor is essential for this activity. The dragster’s tires do not have enough friction on carpet to overcome the inertia, even with a lightly loaded truck. Sweeping the floor prior to the activity improves tire friction.
A four-bottle load usually will be enough to prevent a single dragster from towing the truck. If not, add a fifth bottle. Place water bottles at a station in the classroom for student teams to use when needed. If possible, use recycled bottles refilled with tap water.
Do not share the ideas for configuring multiple car tows unless students are unable to come up with a solution themselves.
PROCEDURE1. Explain the activity to student teams and demonstrate how to attach a towline from the dragster to the truck. Use a length
of yarn or string to join the two vehicles. The towline should one loop at each end. The loop attached to the dragster
5. TOWING IMPOSSIBLE LOADS
5. TOWING IMPOSSIBLE LOADS

FORCE, MOTION, FRICTION AND ENERGY© Baylor College of Medicine.
18
should wrap around the rear spoiler (wing). This permits the towline to be removed while the dragster’s friction motor is being wound. Once the motor is wound, the towline is reattached. The loop attached to the truck will circle the cab and run through the front ends of the two “chrome” rails on the walls of the truck bed. This loop won’t be removable for the activity.
2. To set up the towing test area, use a piece of masking tape to mark the starting line on a smooth tile floor and a second piece to mark a finish line two meters (or yards) away.
3. After teams have made their towlines, have them take their trucks/dragsters to the test area and place the nose of their trucks right up to the starting line.
4. Instruct teams to wind up the dragster motors, attach the tow lines to the dragsters, and let their cars start the first tow. Teams should measure how many seconds it takes for the nose of the truck to go from the starting line to the finishing line. Each student should record the time on her or his student page.
5. Repeat the tow two more times and calculate the average time for the three runs of this first round of towing.
6. Have teams repeat the procedure, but with weight added to the truck bed. Start with one full water bottle. Have them record the results on their student pages.
7. Have teams repeat the process with a second bottle, then three, and finally four bottles. If necessary, use masking tape to join the bottles together and keep them from falling off the truck.
8. At some point, the dragsters will not be able to move the truck. If teams do not come up with the idea themselves, suggest that they combine forces by using multiple dragsters to pull the truck. Challenge them to try an “impossible load” of four water bottles!
WRAP IT UPDiscuss results with the class and the following questions.
• How far did their dragsters tow an empty truck, a truck carrying one bottle, two bottles, etc.?
5. TOWING IMPOSSIBLE LOADS

19FORCE, MOTION, FRICTION AND ENERGY© Baylor College of Medicine.
Have teams describe their approaches for pulling an “impossible load.” Ask students if there is a relationship between the mass of the truck (empty, one or more water bottles) and the time it takes to travel a measured distance. Measuring the time it takes for the truck to be pulled from the starting to the finishing line is an indirect way of estimating the force needed to move different masses. The force exerted by the dragsters is the same in each test run. The truck’s mass determines how far it rolls. If the truck didn’t move at all, the force needed to move it exceeded that which the dragster(s) could produce. If the truck rolled a long distance, only a small force was needed to move it.
EXTENSIONHave students experience inertia with a hand exercise weight. Let each student hold a 3- to 5-pound weight at arm’s length, in a resting position. Then, have the student quickly move the weight to the right or left. The student will sense that the weight’s inertia resists the sudden movement, and then resists the sudden stopping of the weight.
5. TOWING IMPOSSIBLE LOADS

FORCE, MOTION, FRICTION AND ENERGY© Baylor College of Medicine.
20
1. Use a piece of yarn to create a towline (see diagram, right). Make a loop around the rear spoiler (wing) of the dragster and tie the loop off a few inches from the back of the car. With the end of remaining yarn, make a loop around the cab of the truck, threading it through the first set of “chrome” rails. Tie off the truck towline a few inches from the front of the truck.
2. Start with an unloaded truck placed with its front bumper just behind the starting tape strip. Remove the loop from the dragster while its friction motor is being wound. Reattach the towline during a countdown and release the dragster. Time how long it takes for the front truck bumper to reach the finish line. Record the result in the column marked “No Bottle” below. Repeat twice and record the results. Average the results and record the final average in the chart.
3. Repeat the process in step 2, but attach one water-filled bottle to the truck. Repeat the process until the chart is completed.
4. Explain inertia.
5. Write a short paragraph on the back of this sheet explaining what you learned from your investigation. How did inertia affect the run times for each load? Use the back of this sheet to record your answer.
Load 0 Bottles 1 Bottle 2 Bottles 3 Bottles 4 Bottles
Run 1: Time
Run 2: Time
Run 3: Time
Average Time
Name Team number
TOWING IMPOSSIBLE LOADS
5. TOWING IMPOSSIBLE LOADS

21FORCE, MOTION, FRICTION AND ENERGY© Baylor College of Medicine.
W hen the 2016 Hess Toy Truck is transporting the Dragster to a race, the truck travels over both level and hilly roads. The road’s contours—flat, uphill, or downhill—have a big impact on the truck’s fuel consumption (energy efficiency).
Going uphill requires more energy (gasoline or diesel fuel) because the truck is fighting the force of gravity as it climbs. When going downhill, gravity helps the truck move forward, so less energy (from gasoline) is needed. On level roads, gravity neither helps nor hurts the truck’s energy efficiency.
A pull-type spring scale can provide an indirect measure of the truck’s efficiency over different road profiles. The spring scale is a common classroom tool for measuring the weight/mass of small objects. An item is attached to the scale, then lifted. The spring, with a sliding scale marker, compresses and the weight (or mass) is read from the scale. Some pull spring scales also have markings to measure force in newtons (N). A newton is the amount of force needed to accelerate a mass of one kilogram one meter per second squared. The scale doesn’t accelerate the object. It just shows how many newtons it would take to accelerate that object one meter per second squared.
In this activity, teams of students will compare the weight or force needed to move the truck—with its dragster loaded in the bed—over level and inclined surfaces. Teams will adjust the inclined surface to different angles to indirectly measure energy efficiency.
An inclined plane can be used to simulate level, downhill and uphill conditions in an exercise that replicates one of Galileo Galilei’s most famous investigations. Since objects fall very rapidly, it was difficult in his time (about 400 years ago) to measure their acceleration. Even with today’s modern timing devices, it is difficult to obtain accurate measurements of falling objects. Galileo’s brilliant idea was to slow the fall of spheres by rolling them down an inclined plane made from a long piece of wood carved with a narrow groove. By changing the angle of a falling object from 90 degrees to 5 or 10 degrees, Galileo greatly slowed the fall. This enabled him to measure how far an object traveled every second while “falling” to the end of the plane. Through this investigation, Galileo proved that all objects, regardless of mass, accelerate at the same rate when falling.
THE QUESTIONWhich road surface (level, uphill, downhill) provides the greatest fuel efficiency for the truck transporting the dragster?
MATERIALS• Hess Toy Truck set• Books or boxes to elevate ramps• Box cutter or serrated kitchen knife (for teacher only – to cut cardboard)• Masking or duct tape• Protractors for each team• Pull-type spring scales (500-gram capacity) for each team (see “Management Tips” for options)• Scrap cardboard or other material for making ramps (approximately 3 ft x 8 in. in length)• Yarn or string• Copies of the student page
6. ON THE LEVEL, GOING UP, GOING DOWN
6. ON THE LEVEL, GOING UP, GOING DOWN

FORCE, MOTION, FRICTION AND ENERGY© Baylor College of Medicine.
22
MANAGEMENT TIPSIf you don’t have spring scales or can’t borrow them from other teachers, you can make your own with lightweight rubber bands. Loop the rubber bands together and observe how much they stretch when pulling the truck. The greater the weight or force, the more the rubber bands will stretch.
The truck with the dragster has a mass of approximately 1 kilogram (2.2 pounds). A spring scale with a range of 500 to 1,000 grams will work in this activity. The 500-gram scale provides a good measurement with the inclined plane but cannot measure the total weight of the truck and dragster in a straight-up lift. High-range spring scales, such as a 3-kilogram model, will work. However, their sensitivity may make it difficult to obtain an accurate measure. The markings on a 500-gram scale are in 10-gm increments; those on a 3,000-gram scale are in 100-gm increments.
Doing nose-up and nose-down inclined plane measurements makes for a complete investigation. Students will soon discover that the force measurements are the same going up or down. The difference is whether or not gravity helps or hinders the truck.
PROCEDURE1. Have teams prepare their trucks by making a towline loop. Thread a piece of yarn or string through the side rails of the
truck bed. The loop should be large enough to flip easily from the front of the truck to the rear for the different tests.
2. Teams should set up inclined planes, made from cardboard or wood. If using cardboard, orient the plane so that the corrugations run the length of the plane. Cardboard is stronger in this direction. Teams can stack books to set the desired elevation of the plane.
3. Instruct students to secure their dragsters to the truck bed with masking tape. This step is particularly important for inclined measurements.
4. Teams should take their first measurements on a level surface. Have them start by pulling the spring scale to make the truck move. The spring will compress and the sliding marker will jump as the truck starts rolling. Direct students to continue pulling the truck and recording the measurement as the truck rolls at a steady rate. This process measures the force needed to overcome friction.
5. For the second test, teams will measure the amount of force needed to overcome gravity during a climb. They should elevate the upper end of the plane to 10 degrees, point the truck nose up the inclined plane, and record the measurement of the scale. In this case, the truck can remain still as the measurement is taken. Teams will be measuring the effect of gravity on the truck as it rests on the incline. Have teams change the angle of the inclined plane two times (20 and 30 degrees) and record the scale measurements for each trial. Students will observe that the steeper the road, the more force is needed to accomplish the climb.
6. Have teams point the truck down and repeat the measurements taken in step 5. This test measures the “helping hand” that the force of gravity provides when the truck is going downhill. Students will observe that the steeper the road, the greater the help (force) gravity provides.
WRAP IT UPWhen teams have completed their measurements, hold a class discussion. Use the following questions as a guide.
• The toy truck doesn’t have an engine. What causes it to move? • Which road profile—level, uphill, or downhill—gives the truck the greatest fuel efficiency? (Downhill) • Why is this so? (The weight of the truck is pulled downward by gravity. This enables the truck driver to let up on the gas
pedal and coast, thereby saving fuel.) • Which road surface causes the truck to use the most fuel? (Uphill)
6. ON THE LEVEL, GOING UP, GOING DOWN

23FORCE, MOTION, FRICTION AND ENERGY© Baylor College of Medicine.
• Why is this so? (The driver must press down on the gas pedal to produce more power to raise the truck against gravity. This increases fuel consumption.)
• Highway builders try to make roads as level as possible. When a road must go over a hill, construction crews often dig away part of the hill, or even dig tunnels through it. Why do they do this? (Steep hills put a lot of strain on vehicles, especially trucks, as they climb. Descent of very steep roads can lead to excessive speeds and accidents.)
EXTENSIONChallenge Question: Imagine that a drag race is being held in Denver, Colorado and that the truck must carry the dragster to the race from New York City. Which part of the trip will use more energy? A) Driving from New York City to Denver. B) Driving home from Denver to New York City. (Going to the race. Denver is the “Mile High City.” New York City is near sea level. Going to Denver requires the truck to raise itself a mile above sea level. Returning to New York City will use less fuel because gravity helps to pull the truck back down to sea level. Think of the road between the two cities as a giant inclined plane.)
6. ON THE LEVEL, GOING UP, GOING DOWN

FORCE, MOTION, FRICTION AND ENERGY© Baylor College of Medicine.
24
Name Team number
ON THE LEVEL, GOING UP, GOING DOWN
1. LEVEL ROAD Attach the scale as shown. Record the force as the truck is rolling at a
constant speed and record your result. Repeat twice. Average the results.
2. UPHILL ROAD Attach the scale as shown. Measure and tilt the “road” to 10 degrees.
Record the force needed to hold the truck in place. Change the road angle to 20 degrees and then 30 degrees. Record the results for both.
3. DOWNHILL ROAD Attach the scale as shown. Measure and tilt the “road” to 10 degrees.
Record the force needed to hold the truck in place. Change the road angle to 20 degrees and then 30 degrees. Record the results for both.
4. Using the back of this page, write one or more paragraphs describing what you learned by these tests. Include the following questions.
• Which road angle requires the greatest force to travel over (level, up, down)? • Which road angle requires the least force to travel over (level, up, down)? • How does uphill road angle affect the amount of force needed to climb the road? • Which road surface will take the least amount of fuel to operate on?
6. ON THE LEVEL, GOING UP, GOING DOWN
Average Force
N
Angle Force
N
N
N
0°
0°
0°
LEVEL ROAD
Angle Force
N
N
N
10°
20°
30°
UPHILL ROAD
Angle Force
N
N
N
10°
20°
30°
DOWNHILL ROAD
0°
10°
10°

25FORCE, MOTION, FRICTION AND ENERGY© Baylor College of Medicine.
7. BREAK THE “ WORLD RECORD” CAR JUMP
C ar jumps are dangerous daredevil stunts performed at car races and in television shows and movies. Generally, car jumps involve an upward-pointing launch ramp and a downward-pointing landing ramp, with a gap between the two. The
stunt driver accelerates the car up the launch ramp, becomes airborne, crosses the gap, and then, hopefully, lands safely on the landing ramp.
Setting up a jump requires science and mathematics. The gap size determines how fast the car must travel to complete the jump safely. If the car goes too fast, it will fly past the landing ramp and smash into the level ground beyond. If the car goes to slowly, it will crash into the landing ramp or into the ground between the ramps.
Essentially, the jump turns the car into a projectile, much like a passed football. Once the car leaves the ramp, all control is lost. Momentum (the car’s mass times velocity) carries the car, while gravity pulls it downward. These forces create an airborne path in the shape of an arc. Wind speed and air friction also must be considered. For example, a headwind can cause the car to come down too soon and a tailwind can cause it to come down too late.
Currently, driver Tanner Foust holds the World Record distance for a car jump: 332 feet (101 meters). Foust employed a gravity assistant—in the form of an additional ramp, something like a ski jump—to achieve the proper speed for his jump. Starting from the top of the extra ramp, Foust stepped on the gas. His car accelerated rapidly as it shot down the ramp. The lower end of the ramp leveled out as Foust continued to accelerate. At the far end, the launch ramp sent the car upward and across the gap to the landing ramp, setting the World Record.
Not all jumps are successful. Guerlain Chicherit attempted a 360-foot (109.7-meter) jump using a long, level track to attain jump speed. Chicherit crash landed and the car tumbled end-to-end before stopping in a pile of scrap metal. Fortunately, restraint systems and other protective gear inside the car enabled Chicherit to walk away with only minor injuries.
In this activity, students will design and test ramps for a “World Record” jump of the 2016 Hess Toy Dragster.
THE QUESTIONHow far can the 2016 Hess Toy Dragster jump?
MATERIALS• Hess Toy Dragster• Books or boxes to elevate ramps• Box cutter or serrated kitchen knife (for teacher only – to cut cardboard)• Large pair of scissors• Masking or duct tape• Meterstick or yardstick• Pillows or foam padding• Scrap cardboard or other material for making ramps• Copy of the student pages (one per student)
7. BREAK THE “WORLD RECORD” CAR JUMP

FORCE, MOTION, FRICTION AND ENERGY© Baylor College of Medicine.
26
MANAGEMENT TIPSStudent teams will discover the importance of the angle of the launch ramp and the speed of the dragster at launch. If the friction motor is still accelerating as it reaches the edge of the launch ramp, the dragster will nose upward during the jump and land on its rear. A longer launch ramp can reduce this tendency. The intricacies of jumping cars is explained in an article, “How to Jump a Car Like a Stunt Pro,” with an accompanying video found on the Popular Mechanics website at http://www.popularmechanics.com/cars/a6017/how-to-jump-a-stunt-car-like-travis-pastrana/.
When constructing the ramps, orient the cardboard so that the corrugations run parallel to the long direction of the ramp. Cardboard is most rigid in this direction. However, when a curved section is necessary, such as where the ramp touches the floor, orient the corrugations across the ramp. Cardboard bends more easily in this direction, making a smooth curve possible. Old science fair trifold boards can be recycled for ramps.
The catch ramp can be made a bit lower than the jump ramp. Supports for the lower ramps can be made from cardboard cut, folded, and taped into triangular-shaped tubes.
Safety Note: Caution observing students not to stand in the direction the Dragster will run to avoid being hit by an airborne car.
PROCEDURE1. Ask students if they have seen car jumps in person or on television. Ask them to describe what they saw or even sketch on
the board how the jump was set up.
2. Challenge student teams to set the class record for longest jump with their Hess Dragsters. Have teams use the student page to design launch and landing ramps. Teams should include general measurements with their diagrams and create a materials list. Point out that a successful jump is one in which the dragster jumps the gap and lands on the landing ramp, not on the floor beyond.
3. Provide scrap cardboard and tape for ramp construction. Single thickness cardboard can be cut with large scissors. If student teams have trouble cutting their cardboard, use a box cutter knife to cut the cardboard for them.
4. Provide boxes or book stacks to elevate ramp ends. Ramps can also be supported by the edges of student tables.
5. After teams achieve their first jumps, challenge them to modify their setups to increase the distance their dragsters jump. As an example, set up a simple gravity assist demonstration. Erect an inclined plane on a demonstration table. Start with the plane at a low angle and show how the dragster accelerates from the high end to the low end. Increase the plane angle and again show how the car accelerates. (Science History Note: When Galileo investigated the acceleration of falling objects in the 17th Century, he slowed the fall by using inclined planes.)
7. BREAK THE “ WORLD RECORD” CAR JUMP
Copy paper
SLOW ACCELERATION

27FORCE, MOTION, FRICTION AND ENERGY© Baylor College of Medicine.
WRAP IT UPDiscuss the teams’ successes and failures. Include in the discussion the following.
• How many tries were required before they made a successful jump? • What did their setup look like? What improvements did they make? • Did they find any helpful strategies? Did teams take advantage of the force of gravity to help their car jump further? • What is the longest jump (gap distance) achieved by each team? Do they have ideas about how they could make an even
longer jump?
EXTENSIONThe following videos show the world record truck jump (full-size vehicle) and the failed car jump described on page 25. The third video shows a record-setting truck jump.
Team Hot Wheels: The Yellow Driver’s World Record Jump (Tanner Foust) https://www.youtube.com/watch?v=7SjX7A_FR6g
SPLOID: Longest car jump record disaster seen from every angle http://sploid.gizmodo.com/worlds-longest-car-jump-record-attempt-ends-in-spectacu-1593229996
ROAD & TRACK: Here’s How You Jump A Truck 379 Feet Over A Ghost Town http://www.roadandtrack.com/motorsports/videos/a30575/bryce-menzies-sets-world-record
Have students create their own jump movies with their smartphones.
7. BREAK THE “ WORLD RECORD” CAR JUMP
FAST ACCELERATION

FORCE, MOTION, FRICTION AND ENERGY© Baylor College of Medicine.
287. BREAK THE “ WORLD RECORD” CAR JUMP
JUMP RULESThe dragster must jump the gap between the ramps and land on the landing ramp. Jumps that land on the on the floor past the landing ramps are considered crashes and do not count.
1. Use the space below to design your ramps for your jump attempts. Show how the ramps should be angled. Include measurements for the length of the ramps and the gap (distance) your car will be jumping.
2. Use the back of this sheet to complete the following.
a. Create a table to record your jumps. Indicate for each attempt whether or not the jump was successful and how far the dragster jumped. Write the distance of your first successful jump on the board. As you break your own record, change your distance number.
b. After your first jumps, modify your ramps to increase how far the dragster jumps. Explain what you did to improve your jump.
Name Team number
BREAK THE “WORLD RECORD” CAR JUMP