forest resources 2013 - minnesota department of natural...
TRANSCRIPT

Minnesota’s
Forest Resources 2013
Department of Natural Resources Resource Assessment
Division of Forestry 413 SE 13th
Street
500 Lafayette Road Grand Rapids, MN 55744
St. Paul, Minnesota 55155
July 2014
http://www.dnr.state.mn.us/forestry/um/index.html

2
Minnesota’s Forest Resources Revised 07/14
Preface This report is compiled annually by Minnesota DNR – Forestry Division, Resource Assessment and
Utilization & Marketing Program staff. Publication began in the mid 1980s by John Krantz, former
Utilization & Marketing Program Coordinator and has recently been overseen by Keith Jacobson. The
report is intended to answer frequently asked questions about Minnesota’s forest resources such as: current
conditions and trends in forest resources, and forest resource industrial use. Foresters, other natural
resource managers, planners, forest industry, and forest policy makers will find items of interest in these
pages.
We thank those who cooperated in providing and updating information for this report. They include many
of Minnesota’s wood product companies, Minnesota DNR staff (particularly Don Deckard and Anna
Dirkswager), and the USDA Forest Service Forest Inventory and Analysis (FIA) unit. All FIA summary
data was obtained from FIADB version 1.5.1.06.
Resource and Industry Highlights:
Mill Changes: Mill shutdowns, slowdowns and curtailments continue to have a large impact on timber
markets in Minnesota. Harvest levels of 2011 are down by nearly 750,000 cords compared to 2005
levels, resulting in opportunities (and need) for additional utilization and management of Minnesota’s
forest resources.
Both timber imports and exports of pulpwood into the state increased in 2011. Imports are on the same
trend while exports are in contrast to the previous year.
Overall net growth for all species continued to outpace harvest levels. According to 2012 FIA figures,
annual net growth of growing stock on timberland was approximately 5.0 million cords, with mortality
of approximately 4.2 million cords. According to Draft 2011 mill and fuelwood survey data, the
volume of wood harvested and utilized by industry and fuelwood users was approximately 3.02 million
cords. Hence, there are significant volumes of wood above current harvest levels potentially available
for additional harvest.
Woody biomass use for energy markets and forest carbon credits are significant emerging issues that
will have an impact on forest management in the future. Updates pertaining to woody biomass use for
energy are included in this report.
The strengthening of the economy, including the housing industry, has allowed several of the primary
mills to make capital investments during 2012-2013 which will provide for improved efficiencies,
expanded product markets and increased production.
Harvest levels: Total wood harvested and utilized from timberland by industry and fuelwood users in
Minnesota was 3.02 million cords in 2011. Based on analysis of mill consumption (actual
survey figures are not yet available), it appears that 2013 harvest levels are within
the 2.4 to 2.7 million cord range.
Contact Information:
Curtis L VanderSchaaf, Forest Modeler
Resource Assessment, Division of Forestry,
Minnesota Dept of Natural Resources
483 Peterson Road, Grand Rapids, MN 55744
Questions or requests for additional information can be directed to Curtis VanderSchaaf,
Email: [email protected], Steve Vongroven, Minnesota DNR Forest Products Utilization &
Marketing Program Coordinator; Email: [email protected], or Kent Jacobson, Minnesota DNR
Timber Sales Business Consultant; Email: [email protected]

3
Table of Contents Page
Preface 2
Resource and Industry Highlights 2
Contact Information 2
Wood-Using Industry Overview 4
Wood Energy and Woody Biomass Utilization 11
Forest Resources Overview 14
Harvest Levels 17
Sustainable Harvest Levels 23
Wood Supply and Demand Information for Important Cover Types and Species 26
Aspen/Balm of Gilead 27
Birch 30
Balsam Fir 33
Spruce 36
Tamarack 40
Northern Hardwoods 43
Maple 44
Basswood 46
Oak 48
Lowland Hardwoods 51
Ash 52
Red Pine 54
Jack Pine 57
White Pine 60
White Cedar 63
Timber Price Information 66
Glossary and Conversion Factors 69

4
Wood-Using
Industry
Overview
A brief overview of Minnesota’s wood-using industry, including mill location and product
information for many of the larger mills, and total industry economic impact.

5
Minnesota’s Forest Industry at a Glance 1
Economic Impact 2012
$16.1 billion total economic output effect with $8.9 billion value of shipments.
$7 billion value added effect with $3 billion direct value added
5th largest manufacturing sector in Minnesota by employment (#1 computers & electronics, #2
food products, #3 fabricated metal products, and #4 machinery).
8.2 percent of all manufacturing shipments.
62,370 jobs total employment effect with 29,700 direct jobs.
$3.2 billion payroll effect with $1.5 billion in direct payroll.
$80 million stumpage revenue received by land owners.
$24 value added by primary manufacturing per $1 stumpage value.
$446 million total state and local tax receipts effect.
Important Industrial Sectors
Pulp, paper, paperboard, converted paper products, window & door components (MN # 2 in U.S.), kitchen
cabinets and cabinet parts, store fixtures, wood office & residential furniture, pallets & crating, millwork,
wood shavings for poultry industry, and woody biomass energy (14 facilities with greater than 10,000 cords
annual consumption).
Non-Traditional Industries Dependent on Minnesota’s Forest Lands
Balsam boughs for wreath industry with annual sales exceeding $20 million, decorative spruce tops, birch
bark, maple and birch syrup, and medicinal plants.
1 CY 2012 data unless otherwise noted; compiled by Don Deckard, Ph.D., Forest Economist, Minnesota DNR.

6
Value Added (Gross State Product) per Capita
In 2010, Minnesota was ranked eighth nationally in forest products manufacturing with $531 value added
(Gross State Product) per capita.
Manufacturing Facilities as of January 2014
4 pulp and paper mills
3 recycled pulp & paper
2 oriented strand board (OSB and sheathing/siding)
2 specialty (e.g. insulation board)
500+ sawmills with 32 sawmills ≥ 1 million board feet annual consumption.
150 associated specialty businesses
Over 800 secondary manufacturers
Volume of Timber Harvested
Annual harvest volume = 3.0 million cords including:
Pulpwood = 2.23 million cords (2011)
Sawlogs & specialty = 247 million board feet (2010) including the following specialty items:
- Veneer (2007) = 4.5 million board feet domestic plus 0.6 million board feet exported
- Shavings (2007) = 11,000 cords (animal bedding)
- Posts & Poles (2007) = 8,000 cords
Residential fuelwood = 196,000 cords live trees from timberland (2007-08)

7
Minnesota Pulp and Paper – 2012
Minnesota Oriented Strand Board and Engineered Wood Products – 2012
Firm Wood Used Product Louisiana-Pacific
Two Harbors
Aspen, Balm, Birch OSB – engineered siding panel
Norbord
Bemidji
Aspen, Balm, Birch, Maple OSB
Minnesota Hardboard and Specialty – 2012
Firm Wood Used Product International Bildrite
International Falls
Aspen, Balm and recycled paper Sheathing
Jarden Home Brands Aspen, Birch Specialty wood products for food
industry, matches, other
For additional information about sawmills, pulp and paper mills, Oriented Strand Board mills, veneer mills,
and dry-kiln facilities in Minnesota go to the following website and click on the Minnesota Primary Forest
Products Producer Directory link:
http://www.dnr.state.mn.us/forestry/um/index.html
Firm Wood Used Product UPM - Blandin Paper Mill
Grand Rapids
Aspen, Balsam Fir, Basswood,
Spruce
Lightweight coated publication
papers
Boise White Paper, LLC
International Falls
Aspen, Balm, Pine, Spruce, Balsam
Fir, Birch, Tamarack, Maple
Office papers, label and release
papers, base sheets, business and
specialty printing grades
NewPage
Duluth
Balsam Fir, Spruce, small amount of
Pine
Uncoated, lightweight
supercalendered magazine and
publication papers
SAPPI North America
Cloquet
Coated freesheet fine printing and
publication paper, market pulp
Aspen, Maple, and minor amounts of
birch and ash
Specialized cellulose
Recycling Mills Rock-Tenn Company
St. Paul
Recycled paper and corrugated Cardboard and corrugated boxes
NewPage
Recycled Fiber Mill
Duluth
High grade office paper and
computer paper
Market pulp
Liberty Paper Company
Becker
Recycled paper and corrugated Cardboard and corrugated boxes
8
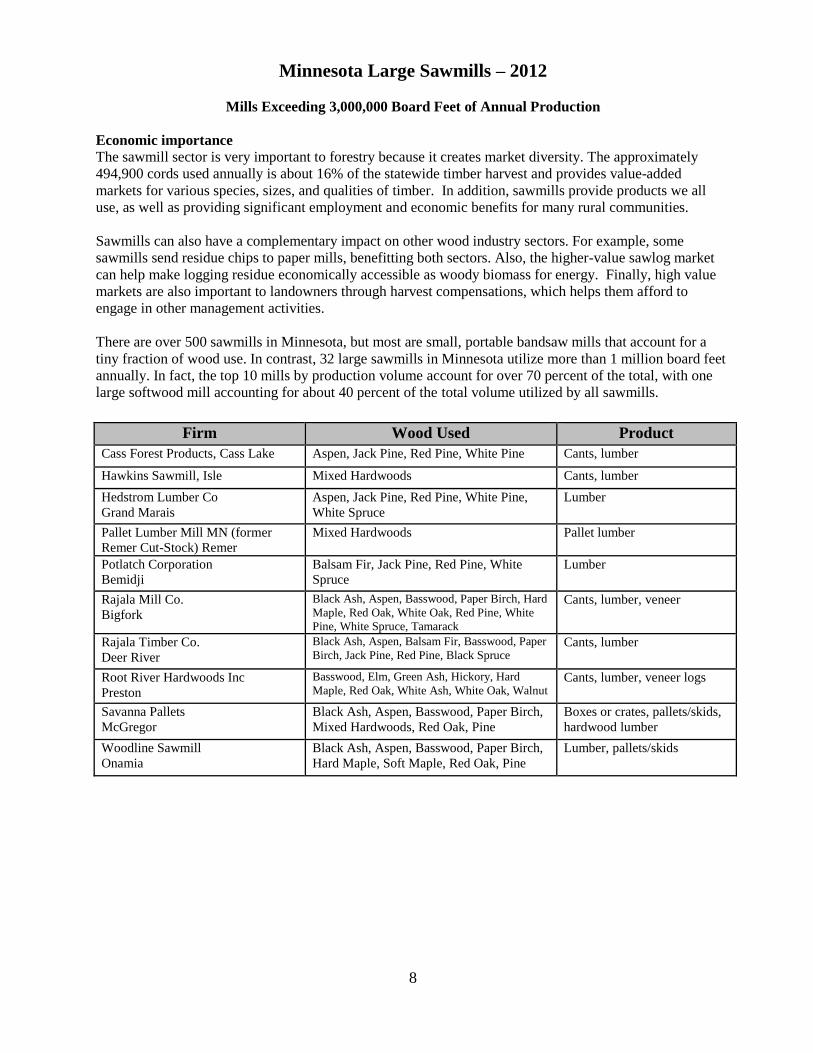
Minnesota Large Sawmills – 2012
Mills Exceeding 3,000,000 Board Feet of Annual Production
Economic importance
The sawmill sector is very important to forestry because it creates market diversity. The approximately
494,900 cords used annually is about 16% of the statewide timber harvest and provides value-added
markets for various species, sizes, and qualities of timber. In addition, sawmills provide products we all
use, as well as providing significant employment and economic benefits for many rural communities.
Sawmills can also have a complementary impact on other wood industry sectors. For example, some
sawmills send residue chips to paper mills, benefitting both sectors. Also, the higher-value sawlog market
can help make logging residue economically accessible as woody biomass for energy. Finally, high value
markets are also important to landowners through harvest compensations, which helps them afford to
engage in other management activities.
There are over 500 sawmills in Minnesota, but most are small, portable bandsaw mills that account for a
tiny fraction of wood use. In contrast, 32 large sawmills in Minnesota utilize more than 1 million board feet
annually. In fact, the top 10 mills by production volume account for over 70 percent of the total, with one
large softwood mill accounting for about 40 percent of the total volume utilized by all sawmills.
Firm Wood Used Product
Cass Forest Products, Cass Lake Aspen, Jack Pine, Red Pine, White Pine Cants, lumber
Hawkins Sawmill, Isle Mixed Hardwoods Cants, lumber
Hedstrom Lumber Co
Grand Marais
Aspen, Jack Pine, Red Pine, White Pine,
White Spruce
Lumber
Pallet Lumber Mill MN (former
Remer Cut-Stock) Remer
Mixed Hardwoods Pallet lumber
Potlatch Corporation
Bemidji
Balsam Fir, Jack Pine, Red Pine, White
Spruce
Lumber
Rajala Mill Co.
Bigfork
Black Ash, Aspen, Basswood, Paper Birch, Hard
Maple, Red Oak, White Oak, Red Pine, White
Pine, White Spruce, Tamarack
Cants, lumber, veneer
Rajala Timber Co.
Deer River
Black Ash, Aspen, Balsam Fir, Basswood, Paper
Birch, Jack Pine, Red Pine, Black Spruce Cants, lumber
Root River Hardwoods Inc
Preston
Basswood, Elm, Green Ash, Hickory, Hard
Maple, Red Oak, White Ash, White Oak, Walnut Cants, lumber, veneer logs
Savanna Pallets
McGregor
Black Ash, Aspen, Basswood, Paper Birch,
Mixed Hardwoods, Red Oak, Pine
Boxes or crates, pallets/skids,
hardwood lumber
Woodline Sawmill
Onamia
Black Ash, Aspen, Basswood, Paper Birch,
Hard Maple, Soft Maple, Red Oak, Pine
Lumber, pallets/skids

9
A comparison of MN sawmill utilization from 2001 to 2007 reveals several key changes. In total, the
sawmill consumption declined during this period by 53,463 mbf. The changes were primarily located in the
hardwood capacity since the softwood consumption is basically unchanged during this period. Of the
changes in the hardwood capacity, the primary decline in species utilization was in the use of aspen; which
has declined by 34,800 mbf.
MN Sawmill Consumption (MBF)
2001 2004 2007
Hardwoods 149,764
111,219
98,373 40%
Softwoods 135,839
145,242
136,570 55%
Misc Species 16,261 15,812 13,458 5%
Total MBF 301,864
272,273
248,401
Changes in softwood species consumption during the 2001 to 2007 period include a 42% decline in the use
of jack pine and a corresponding 49% increase in the use of red pine. Other softwood species showing
changes during this period include a near doubling in the use of spruce and close to a 50% increase in the
use of balsam fir. The spruce and balsam fir species volumes utilized as sawtimber during this period
increased from 7% of the 2001 total softwood volume to 13% of the 2007 total softwood volume.
10
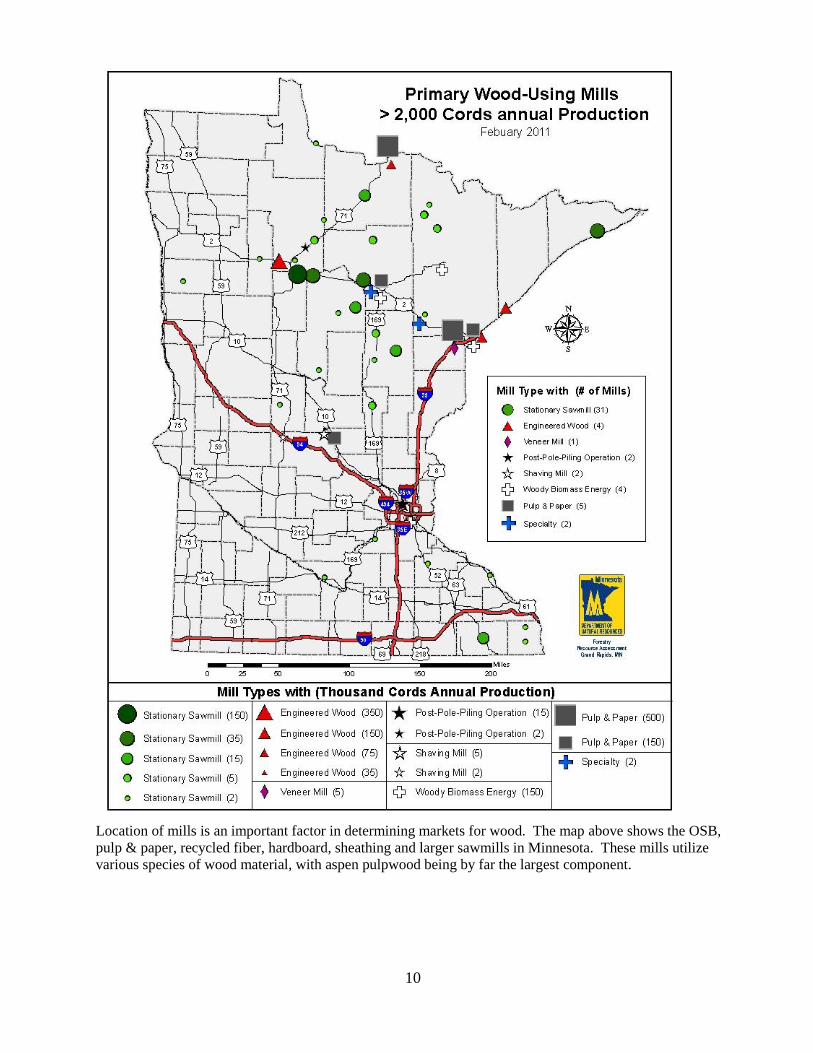
Location of mills is an important factor in determining markets for wood. The map above shows the OSB,
pulp & paper, recycled fiber, hardboard, sheathing and larger sawmills in Minnesota. These mills utilize
various species of wood material, with aspen pulpwood being by far the largest component.

11
Wood Energy and Woody Biomass Utilization
As fossil fuel-based energy prices continue to rise and recognition of the impacts associated with carbon
dioxide emissions increase, the use of renewable energy resources, such as woody biomass, continues to
increase.
Woody biomass includes, but is not limited to: logging residue (non-merchantable tops and limbs left over
from a commercial timber harvest along with non-merchantable small-diameter trees and stems, dead
standing trees, and down logs), primary and secondary mill residue, dedicated energy crops, urban forest
clearing material, land clearing material and brushland material. Within the last couple of years, woody
biomass utilization has also included whole-tree chips due to a decrease in available logging residue
resulting from decreased levels of commercial timber harvest.
Woody biomass continues to be used as a source of renewable energy for both industrial and non-industrial
applications in Minnesota. As propane prices continue to increase, demand for woody biomass for thermal
applications also increases; especially for commercial and residential facilities not connected to a natural
gas line. In the forest products industry, using woody biomass for combined heat and power or for thermal
applications is a practice that has placed a demand on biomass for over thirty years. Despite record low
natural gas prices, concerns associated with climate change, rising fossil fuel prices and energy security
point to an expanded use of woody biomass in years to come.
The prospect of expanded woody biomass harvesting and processing has many potential benefits, including:
reduced dependence on foreign energy sources, improved bottom lines for logging and processing
operations, increased opportunities for forest and wildlife management, and additional value-added product
lines for the forest products industry. In fact, increased utilization of wood for bioenergy can be a tool for
offsetting forest and wildlife management costs.
However, as with almost any opportunity, there are potential pitfalls to be avoided. Some of these include:
impacts to raw material supply for the existing forest products industry, nutrient depletion on sensitive sites,
and potential negative habitat consequences. Mitigating for potential negative effects associated with
biomass harvesting must be done in order to allow woody biomass markets to expand in a sustainable and
environmentally healthy manner. Several environmental safeguards to this extent exist and are effectively
used in MN. These safeguards include: the Biomass Harvesting Guidelines (which Minnesota was the first
state in the nation to develop in 2007), third-party certification and Minnesota Logger Education Program’s
Master Logger Program.
Sources of Woody Biomass
Some sources of woody biomass include:
Logging residue. Tops, limbs and trees below industry utilization standards leftover from
commercial timber harvest operations.
“Primary” mill residue from sawmills, etc. Excepting a couple of sawmills, the majority of
available primary mill residue is utilized for various products; most commonly burned to produce
energy.
“Secondary” mill residue from cabinet manufacturers, etc. The majority of the residue is utilized.
Dedicated energy crops. A very small resource in Minnesota at present.
Land clearing projects. This contributes to the metropolitan wood supply for a major energy
facility.
Brush from brushlands. A significant potential resource, but the economics of harvesting and
procurement technology need to improve before widespread use.
Precommercial thinning, Timber Stand Improvement (TSI), fire hazard reduction, and vegetation
management projects. A potential fiber source from intensified forestry and wildlife management.
12
Urban forests. A fiber source from tree clearing and maintenance and storm cleanup in urban areas.
Largely used in mulch markets in major metropolitan areas as well as for energy in St. Paul.
Roundwood. Given mill shutdowns and curtailments, a meaningful amount of woody biomass in
the form of roundwood has been used over the past few years.
Markets for Woody Biomass
Woody biomass markets normally use portions of the forest resource without traditional forest product
markets such as tops and limbs, small diameter timber, poorly formed trees, under-utilized species, disease
or insect infested trees, some forms of wood manufacturing residue, and potentially brush. Two main
factors keep small-diameter timber, tops and limbs and brush from being used for most traditional forest
products:
1) The high percentage of bark relative to wood fiber; bark fiber is not suitable for many products.
2) The high cost of processing smaller-diameter material. Processing efficiency is greater when using
larger material.
Woody biomass is a good fit for a number of products and markets including:
Engineered wood: The International Bildrite insulite mill in International Falls is an engineered
wood product mill in Minnesota that utilizes bark-on chips.
Special Forest Products (SFP): Markets include log furniture, craftwood, etc. These tend to be small
volume, but high value markets.
Landscape mulch: Markets are limited in rural Minnesota, but are significant near metropolitan
areas.
Animal bedding: Animal bedding markets are limited in some of the highly forested regions of
Minnesota because most of the poultry and dairy industry is located in the central and southern
portions of the state.
Energy: Energy is by far the largest market for woody biomass in Minnesota. The table below
contains a list of some of the larger (greater than 100,000 oven dry tons annually) woody-biomass
energy facilities in the state.
In addition to the list above, there are many small medium and small wood processing companies that burn some or all of their
wood waste for heat and/or process steam.
Guidelines for Woody Biomass Harvesting
Because there are important ecological and environmental reasons for leaving some residue on-site after a
timber harvest, the Minnesota Forest Resources Council and the DNR were the first in the United States to
develop site-level forest management guidelines for harvesting woody biomass. The guidelines are
available online at: http://www.frc.state.mn.us/initiatives_sitelevel_management.html
Forestry Opportunities
Several opportunities exist to use woody biomass in a manner consistent with achieving sound natural
resource management goals. Resource managers can use biomass harvesting as a tool to achieve desired
conservation goals through the following practices:
Some Large Wood-Fired Energy Producers in Minnesota Company Name City Fuel
Minnesota Power Grand Rapids Mill residue, logging residue, roundwood
SAPPI Cloquet Mill residue, logging residue, roundwood
Minnesota Power Duluth Mill residue, logging residue, roundwood
St. Paul District Energy St. Paul Urban wood waste, roundwood, logging residue
Laurentian Energy Authority Hibbing/Virginia Logging residue, mill residue, roundwood
FibroMinn Benson Turkey manure, logging residue, roundwood
Minntac Taconite Kiln Mountain Iron Mill residue

13
Harvesting logging residue. In addition to local economic benefits, use of this material can, on
some sites, improve ease and success of regeneration and reduce fuel loading and fire danger.
Forest health management and invasive species control. Opportunities may include bark beetle
control in small diameter pine thinnings, spruce sanitation harvests to control dwarf mistletoe, and
removal of trees infested with Emerald Ash Borer (EAB).
Harvesting brush from brushlands. There are potential wildlife habitat benefits from brushland
management.
“Precommercial thinning”, Timber Stand Improvement (TSI) and fire hazard reduction. A source
of currently non-economically recoverable woody material is produced during forest management
activities such as very early thinnings and wildfire hazard reduction work. If the economics
become profitable and ecological concerns are addressed, the potential benefits of doing more of
this work could be significant.
What is the Future for Woody Biomass?
Potentially, future policy trends leading toward reduced green house gas emissions and increased
renewable energy development point toward the expansion of woody biomass utilization over the
next decade and beyond.
Technologies to expand the use of biomass for increased value added products like motor fuels and
green chemistry substitutes are edging toward commercial deployment.
Using woody biomass more broadly is an emerging issue that requires time to sort out natural
resource management issues and market development. The extent to which woody biomass is used
as a renewable energy resource depends on a multitude of factors including, but not limited to: the
price and availability of alternate energy sources, procurement and operation costs of biomass
resources, and state and federal renewable policies.
Woody biomass can play an important role in Minnesota’s energy system by contributing to a wide
range of energy markets for which other renewable energy sources are not suitable. For example,
biomass can be used for industrial process heat or to produce liquid fuels where wind and solar
energy cannot.
The DNR is interested in bioenergy for these main reasons: to mitigate climate change, as a
conservation and habitat management tool and as an economic opportunity.
14
Forest
Resources
Overview
A brief overview of Minnesota’s forest resources, including total forestland and timberland acreage,
cover type percentages and an ownership breakdown for timberland.

15
Timberland, 15,989,607,
30%
Other Forestland, 459,698, 1%
Reserved Forestland, 984,097, 2%
Non Forest, 33,282,704,
62%
Minnesota Acres of Land by Major Land Use2012FIA Total Acres: Approximately 54,000,000
Source: USDA Forest Service 2012 FIA database
According to 2012 FIA data, Minnesota currently has about 16.0 million acres of forest land that is
classified as “timberland”. Timberland is forest land that is productive enough to produce a commercial
crop of trees and is not reserved from harvesting by policy or law. Reserved forestland is land reserved
from harvest by policy or law, including designated wilderness areas like the Boundary Waters Canoe Area
(BWCA), old growth reserves, and others. Other forestland is mostly forested land of very low
productivity for tree growth, such that it is incapable of producing a commercial crop of trees.
Ownership of timberland is an important factor in assessing many issues, including timber supply. Industry
includes Real Estate Investment Trusts (e.g. Potlatch Corporation), Timberland Investment Management
Organizations (e.g. Molpus Woodlands Group), and integrated timber companies such as UPM Blandin and
Rajala Timber Company.
The reduction of nearly 750,000 cords of harvest since 2005 has primarily impacted the non-industrial
private landowner (e.g. individuals, families, farmers, etc.). This represents a significant market
opportunity for the surplus timber supply potential from the private forest management needs.

16
Jack pine2%
Red pine4%
White pine1%Balsam fir
2%
White spruce1%Black spruce
9%Tamarack
7%N white-cedar
4%
Oak9%
N hdwds10%
Lowland hdwds9%
Cottonwd Willow1%
Aspen29%
Birch6%
Balsam poplar3%
Non stocked1%
Other3%
Minnesota Forest Type AcreageAll Ownerships
Total Timberland Acreage = 16.0 Million
Source: USDA Forest Service 2012 FIA database
Forest Type: A classification of forest land based on the species forming a plurality of live tree stocking.
It is worth noting that aspen is by far the largest forest or “cover” type in Minnesota.
Area of Timberland in Minnesota by DNR Forest Type – 2012
Forest Type Acres
Aspen 4,687,950
Northern Hardwoods 1,541,472
Oak 1,464,835
Lowland Hardwoods 1,419,416
Black Spruce 1,364,555
Tamarack 1,054,950
Birch 922,368
Red Pine 685,463
White Cedar 603,619
Balsam Poplar (Balm of Gilead) 444,076
Balsam Fir 376,893
Jack Pine 244,004
White Pine 161,055
White Spruce 134,748
Cottonwood/ Willow 102,971
Other Softwoods 30,812
Non-Stocked & Other 750,420
Total All Types 15,989,607* Source: USDA Forest Service 2012 FIA Database
*Totals may not sum due to rounding.

17
Harvest Levels
Information on 2011 timber harvest in Minnesota by product category and estimation of
contribution by timberland ownership.

Total wood harvested and utilized by industry and fuelwood users in Minnesota
(in thousand cords - by species – from timberland) (Pulpwood 2011 (DRAFT); Sawtimber 2010 (DRAFT): Fuelwood 2007-08)
Fuel
Species Pulpwood* Sawlogs
&
Others*
Residential** Commercial* Total
Aspen and Balm 1377.5 64.6 31.9 17.8 1491.8
Paper Birch 104.7 23.9 31.0 11.1 170.6
Ash 19.1 5.4 27.1 14.8 66.3
Oak 1.3 43.5 57.5 1.9 104.2
Basswood 10.4 12.5 6.3 0.0 29.2
Maple 121.2 5.3 31.2 2.4 160.1
Cottonwood 25.2 3.6 0.3 0.0 29.1
Other Hardwood 1.1 40.6 2.3 17.5 61.4
Sub-Total Hardwood 1660.5 199.4 187.6 65.4 2112.9
Pine
Red Pine 53.1 185.8 2.9 4.1 245.9
White Pine 15.5 5.6 0.4 0.1 21.6
Jack Pine 43.4 77.1 1.8 1.9 124.1
Spruce 263.1 7.4 0.3 0.1 270.9
Balsam Fir 161.1 7.2 0.2 0.1 168.6
Tamarack 34.0 7.1 2.0 16.1 59.2
White Cedar 1.0 2.9 0.8 0.0 4.7
Other Softwood 0.0 2.5 0.1 6.3 8.9
Sub-Total Softwood 571.1 295.5 8.5 28.7 903.8
Total 2231.7 494.9 196.1 94.1 3016.7
Source: USFS and MN DNR mill surveys & residential fuelwood survey.
-Figures in chart may not total exactly due to rounding
*Draft **Fuelwood removed from live trees on timberland.
-Figures include cords of pulpwood exported to Wisconsin and Canada: Aspen: 70,920; Spruce: 54,143; Birch: 11,933 (only
WI); Maple: 12,793 (only WI); Red Pine: 15,161 (only WI); Jack Pine:15,003; Tamarack: 3,588; White Pine: 964 (only WI);
Ash: 2,117 (only WI); Balsam Fir: 718; Basswood: 799 (only WI); Elm None reported; Red and White Oak: 1,315 (only WI);
and total cords of sawlogs mainly exported to Wisconsin and Iowa of: 31,200, most of which is Oak and Maple.
Based on analysis of mill consumption (actual survey figures are not yet available), it
appears that 2012 harvest levels are within the 2.6 to 2.9 million cord range. In 2013,
harvest levels may dip to 2.5 million cords or below.

19
3.66 3.82 3.72 3.56 3.68 3.60 3.58 3.73
3.152.83 2.96 2.73 2.81
3.02
0.0
1.0
2.0
3.0
4.0
5.0
98 99 00 01 02 03 04 05 06 07 08 09 10 11
Millio
n C
ord
s
Year
Total Wood Harvest in Minnesota from Timberland1998 - 2011
Source: Pulpwood (USFS, Northern Research Station), sawtimber and fuelwood (MN DNR surveys).
0
0.5
1
1.5
2
2.5
97 98 99 00 01 02 03 04 05 06 07* 08* 09* 10* 11*
Mil
lio
n C
ord
s
Year
Estimated Volume of Timber Sold/Harvested in Minnesota by Ownership
Industry
Private Land
Total Public Land
Source: Public Lands: Public Stumpage Price Review through 2006. Beginning with 2007, annual volume scale reports
(harvested) are used for State and Federal lands rather than volumes sold. Change necessary due to large volumes of re-
offered wood sold by public agencies in 2007. Industry Lands: Minnesota Forest Industries estimate of harvested volume
from 2011. Private Lands = an estimate calculated as follows: Total estimated harvest 2011, minus 2011 public volume
harvested (sold through 2006), minus 2011 estimated industry volume harvested. Forest Capital Partners (formerly Boise)
Timberlands contained in “Industry” totals.

20
Source: State Lands: FY 2011 Harvest, DNR Timber Sales Annual Report. Federal: FY 2011 Harvest, Superior National
Forest Timber Statistics, and Chippewa National Forest Timber Statistics; BIA: Public Stumpage Price Review 2011 sold.
County Lands: Minnesota Forest Industries survey of 2011 harvested volume. Industry Lands: Minnesota Forest Industries
survey of 2011 harvested volume. Forest Capital Partners (formerly Boise) Timberlands included in Industry totals. Private
Lands = an estimated figure as follows: Total estimated harvest 2011, minus state, county, National Forest and BIA volume
harvested, minus estimated industry volume harvested.
Ownership of lands has a large impact on policy regarding forest management and timber harvest.
3151
184140 164
339
525
626
624
664701
582
222
387316 339 390
272
101
201243 278
202 190
131
183 154
13254
47
212
151122
189
0
100
200
300
400
500
600
700
800
74 86 94 98 99 00 01 02 03 04 05 06 07 08 09 10 11
Th
ou
sa
nd
Co
rds
Year
Imports and Exports of Pulpwood Roundwood
Imports
Exports
Source: USFS, Northern Research Station survey of industrial wood using industry.
Minnesota became a net importer of wood starting in 2000, due to a number of mill expansions completed during
the 2000-2001 time period. Near border mill locations and specific species requirements continue to induce
procurement activities outside of Minnesota’s borders in order to meet their 2011 raw material needs, especially
for aspen (115,710 cords), balsam fir (23,666 cords), and maple (233,837 cords). Imports in 2011 were largely
from Wisconsin (296,782 cords), with fair amounts from Michigan (67,316) and Canada (25,190), and a small
amount from North Dakota (667). Exports in 2011 were mainly to Canada and Wisconsin mills.
While Minnesota presently remains a net importer of timber, imports remain substantially less than 2005 levels.
The change has been due to several factors, most notably reduced demand due to mill closures and slowdowns.
21
Pulp & paper56%
OSB/Engineered16%
Lumber & Specialty
18%
Wood Energy10%
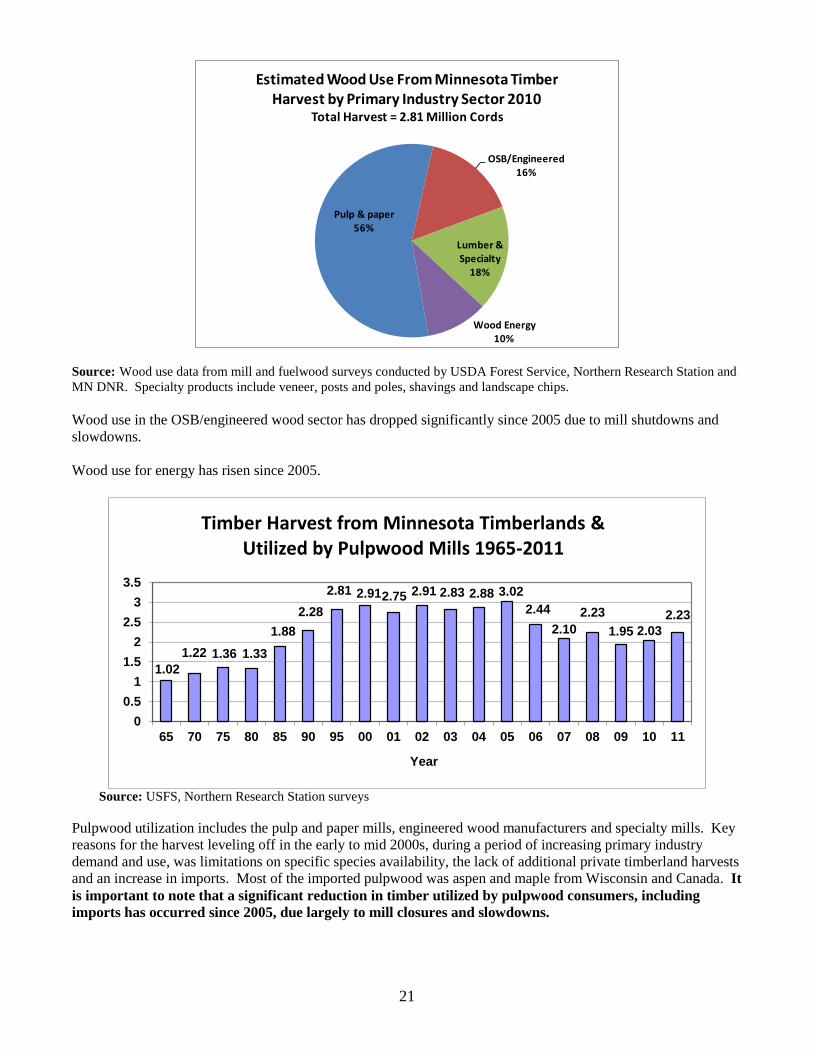
Estimated Wood Use From Minnesota Timber Harvest by Primary Industry Sector 2010
Total Harvest = 2.81 Million Cords
Source: Wood use data from mill and fuelwood surveys conducted by USDA Forest Service, Northern Research Station and
MN DNR. Specialty products include veneer, posts and poles, shavings and landscape chips.
Wood use in the OSB/engineered wood sector has dropped significantly since 2005 due to mill shutdowns and
slowdowns.
Wood use for energy has risen since 2005.
1.02
1.22 1.36 1.33
1.88
2.28
2.81 2.912.75 2.91 2.83 2.88 3.02
2.44
2.10
2.23
1.95 2.03
2.23
0
0.5
1
1.5
2
2.5
3
3.5
65 70 75 80 85 90 95 00 01 02 03 04 05 06 07 08 09 10 11
Year
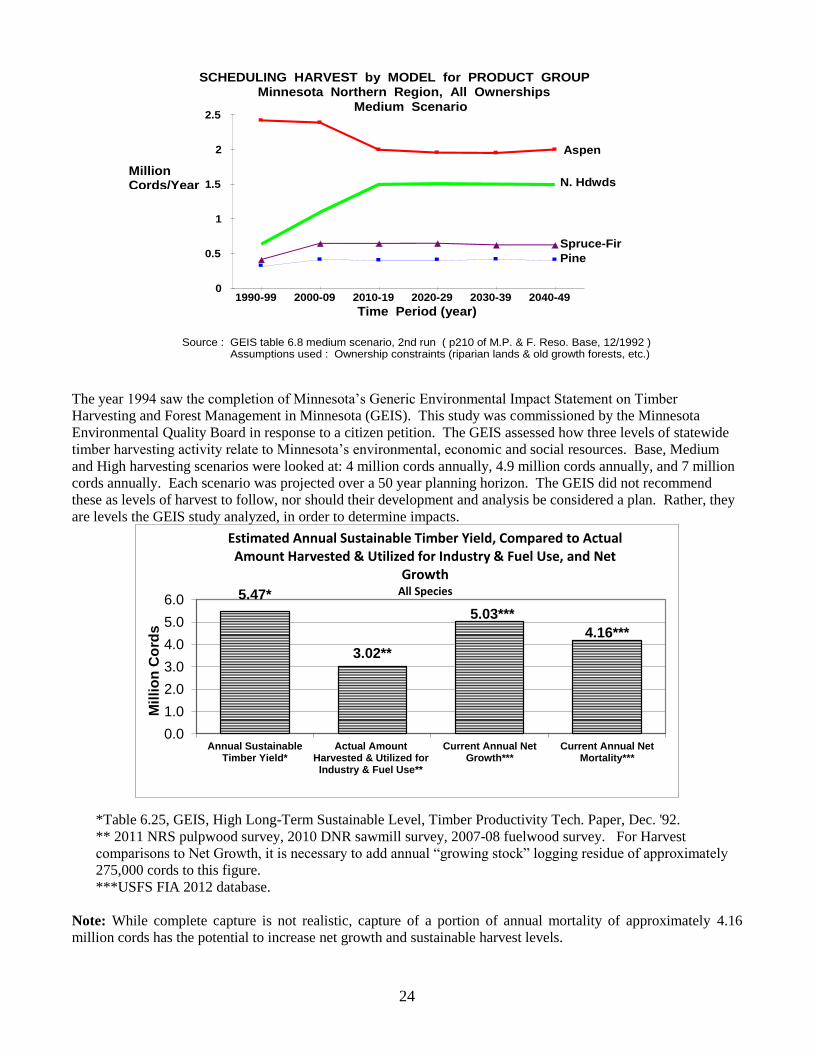
Timber Harvest from Minnesota Timberlands & Utilized by Pulpwood Mills 1965-2011
Source: USFS, Northern Research Station surveys
Pulpwood utilization includes the pulp and paper mills, engineered wood manufacturers and specialty mills. Key
reasons for the harvest leveling off in the early to mid 2000s, during a period of increasing primary industry
demand and use, was limitations on specific species availability, the lack of additional private timberland harvests
and an increase in imports. Most of the imported pulpwood was aspen and maple from Wisconsin and Canada. It
is important to note that a significant reduction in timber utilized by pulpwood consumers, including
imports has occurred since 2005, due largely to mill closures and slowdowns.

22
0
10,000
20,000
30,000
40,000
50,000
60,000
70,000
80,000
90,000
100,000
Red
Pin
e
Jack
Pin
e
Aspe
n
Red
Oak
Pape
r Birc
h
Whi
te O
ak
Bass
woo
d
Har
d M
aple
Soft
Map
le
Blac
k As
h
Bals
am F
ir
Spru
ce
Cot
tonw
ood
Ced
ar
All O
ther
s
MB
F
Species
Volume Harvested From Minnesota Timberlands & Utilized by Sawmills & Specialty Mills 2001, 2004, 2007 and 2010 DRAFT
Total Volume 2001: 302 MMBF; 2004: 272 MMBF; 2007: 248 MMBF; 2010: 247 MMBF
2001
2004
2007
2010 Draft
Source: MN DNR sawmill and specialty mill survey
Sawtimber is often the highest value product for wood that meets merchantability requirements. Generally
speaking, a log needs to be at least 8 feet in length and 8 inches minimum diameter inside bark at the small end in
order to be of merchantable sawlog size. However, there are an increasing number of sawmills that can utilize
smaller diameter material profitably. Sawmill capacity dropped from 2001 through 2010, leveling off between
2007 and 2010. Jack pine, aspen and oak use dropped off most significantly in the sawmill sector; while red pine
actually showed a significant increase in use by sawmills.
Source: MN DNR fuelwood surveys
Residential fuelwood is a relatively small portion of total timber harvest.
*It is important to note that only a portion of the nearly million cords of total residential fuelwood demand
comes from live trees on timberland. About 196,000 cords of residential fuelwood came from live trees on
timberland in 2008. The remainder is from sawmill residue, urban tree waste, land and power line clearing,
and dead trees.
Fuelwood Demand* in Minnesota
1960-2008
0
500
1000
1500
2000
1960
1970
1978
1981
1985
1988
1996
2002
2008
Year
Th
ou
san
d C
ord
s
Used

23
Sustainable Harvest
Levels
This section contains information on estimated sustainable harvest levels* for many of
Minnesota’s most significant tree species.
* A note to readers: there is no direct correlation between current harvest levels and long term sustained harvest
levels because there are many options for moving towards a targeted forest age class structure. Normally,
transitions from the current structure to a target age class structure require several rotations. The choice of
amount and timing of harvest can vary considerably by decade. Harvest plans are typically assessed periodically
as changes to the resource, markets and other conditions dictate.
There is no one best way or time period to reach a target age class structure. Transition harvests may at some
time be either lower or higher than long-term sustained yield estimates. Additionally, it is important to note that it
is possible to raise future timber availability through intensified forest management resulting in fewer losses to
mortality and improved timber productivity. Sustainable harvest estimates can also vary significantly because of
differing assumptions used in deriving the estimates, such as rotation age, harvest restrictions, growth and yield,
etc. An active forest management and harvesting program is also key to sustaining habitat for diverse wildlife.
For the above reasons, it is important to view the levels as helpful benchmarks that are only one part of the picture
in determining long-term sustainability of our forest resources. They should not be viewed as absolute targets.
DNR sustainable harvest estimates use the full, five-year panel of 2005 FIA inventory data. Estimates are
adjusted downward (as appropriate by ownership) for potential timber supply restrictions that can apply to
timberlands such as riparian, old growth, leave tree and extended rotation. Rotation ages used to determine the
estimates are based on average rotation ages used in the DNR’s Subsection Forest Resource Management Plans.
It is important to note that DNR sustainable harvest level estimates are averages over an entire rotation. Generally
therefore, for cover types with age-class imbalances resulting from large acreages in older classes, current timber
availability may be above long-term sustainable estimates. This is due to a need to manage many old stands on
timberlands before their health, habitat value and available timber volume deteriorates. For cover types with
young age-class imbalances such as red pine, current timber availability may be below long-term sustainable
estimates. Finally, as more of the forest area is managed, productivity is likely to increase…as it has for a number
of decades.
DNR is committed to providing excellent analysis, and will therefore periodically review sustainable harvest
estimation procedures and assumptions. Future changes to procedure may be made as new information and
procedures become available. The UPM Thunderhawk Environmental Impact Statement analysis figures are used
for aspen and spruce-fir product groups, as the EIS focused on these product groups. The Thunderhawk EIS
analysis was led by Drs. Howard Hoganson and Tom Burk of the University of Minnesota’s Department of Forest
Resources.
For a document explaining the DNR procedure used to estimate sustainable harvest levels, contact Curtis
VanderSchaaf at: [email protected].
24
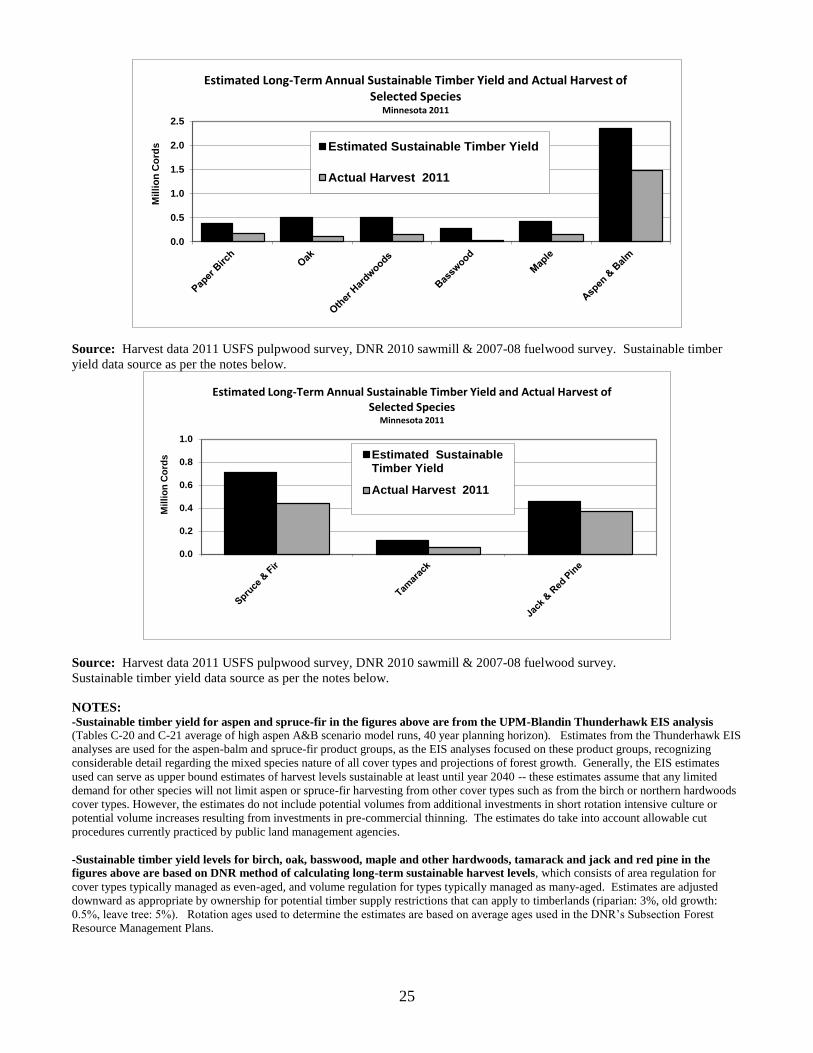
The year 1994 saw the completion of Minnesota’s Generic Environmental Impact Statement on Timber
Harvesting and Forest Management in Minnesota (GEIS). This study was commissioned by the Minnesota
Environmental Quality Board in response to a citizen petition. The GEIS assessed how three levels of statewide
timber harvesting activity relate to Minnesota’s environmental, economic and social resources. Base, Medium
and High harvesting scenarios were looked at: 4 million cords annually, 4.9 million cords annually, and 7 million
cords annually. Each scenario was projected over a 50 year planning horizon. The GEIS did not recommend
these as levels of harvest to follow, nor should their development and analysis be considered a plan. Rather, they
are levels the GEIS study analyzed, in order to determine impacts.
5.47*
3.02**
5.03***
4.16***
0.0
1.0
2.0
3.0
4.0
5.0
6.0
Annual SustainableTimber Yield*
Actual AmountHarvested & Utilized forIndustry & Fuel Use**
Current Annual NetGrowth***
Current Annual NetMortality***
Mil
lio
n C
ord
s
Estimated Annual Sustainable Timber Yield, Compared to Actual Amount Harvested & Utilized for Industry & Fuel Use, and Net
GrowthAll Species
*Table 6.25, GEIS, High Long-Term Sustainable Level, Timber Productivity Tech. Paper, Dec. '92.
** 2011 NRS pulpwood survey, 2010 DNR sawmill survey, 2007-08 fuelwood survey. For Harvest
comparisons to Net Growth, it is necessary to add annual “growing stock” logging residue of approximately
275,000 cords to this figure.
***USFS FIA 2012 database.
Note: While complete capture is not realistic, capture of a portion of annual mortality of approximately 4.16
million cords has the potential to increase net growth and sustainable harvest levels.
1990-99 2000-09 2010-19 2020-29 2030-39 2040-49 0
0.5
1
1.5
2
2.5
Million Cords/Year
Time Period (year)
Minnesota Northern Region, All Ownerships
Aspen
N. Hdwds
Spruce-Fir
Pine
Source : GEIS table 6.8 medium scenario, 2nd run ( p210 of M.P. & F. Reso. Base, 12/1992 ) Assumptions used : Ownership constraints (riparian lands & old growth forests, etc.)
SCHEDULING HARVEST by MODEL for PRODUCT GROUP
Medium Scenario
25
0.0
0.5
1.0
1.5
2.0
2.5
Mil
lio
n C
ord
s
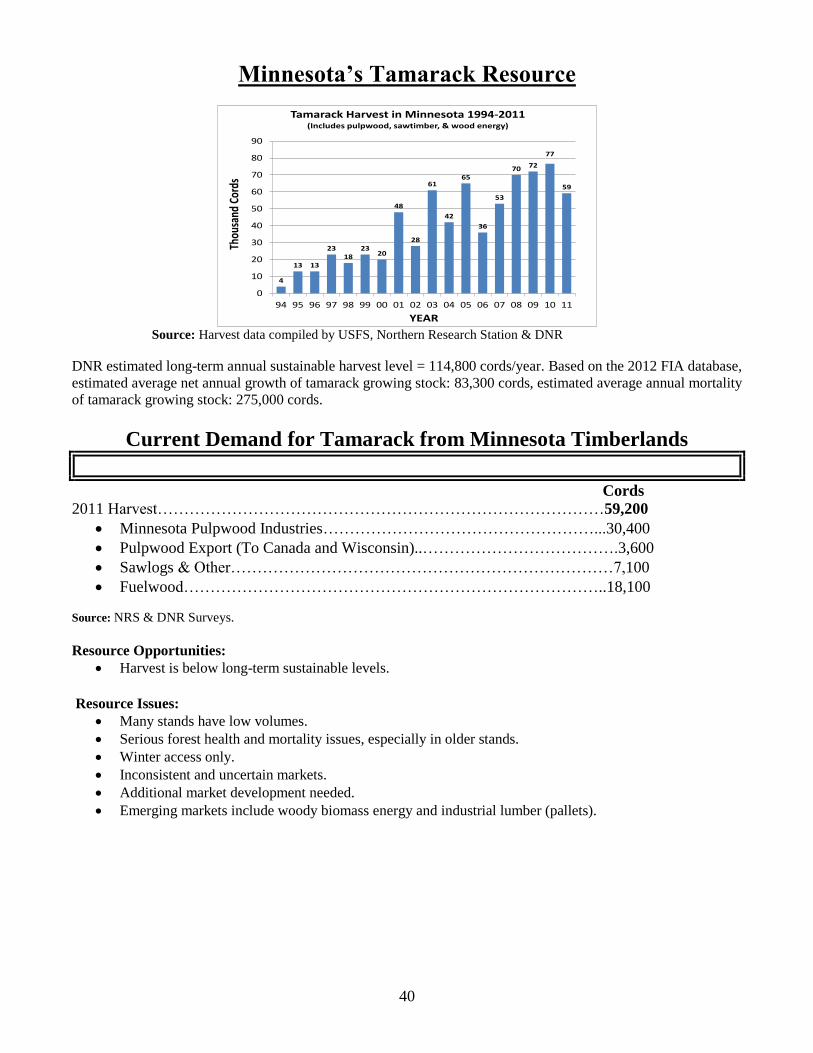
Estimated Long-Term Annual Sustainable Timber Yield and Actual Harvest of Selected Species
Minnesota 2011
Estimated Sustainable Timber Yield
Actual Harvest 2011
Source: Harvest data 2011 USFS pulpwood survey, DNR 2010 sawmill & 2007-08 fuelwood survey. Sustainable timber
yield data source as per the notes below.
0.0
0.2
0.4
0.6
0.8
1.0
Mil
lio
n C
ord
s
Estimated Long-Term Annual Sustainable Timber Yield and Actual Harvest of Selected Species
Minnesota 2011
Estimated SustainableTimber Yield
Actual Harvest 2011
Source: Harvest data 2011 USFS pulpwood survey, DNR 2010 sawmill & 2007-08 fuelwood survey.
Sustainable timber yield data source as per the notes below.
NOTES: -Sustainable timber yield for aspen and spruce-fir in the figures above are from the UPM-Blandin Thunderhawk EIS analysis (Tables C-20 and C-21 average of high aspen A&B scenario model runs, 40 year planning horizon). Estimates from the Thunderhawk EIS
analyses are used for the aspen-balm and spruce-fir product groups, as the EIS analyses focused on these product groups, recognizing
considerable detail regarding the mixed species nature of all cover types and projections of forest growth. Generally, the EIS estimates
used can serve as upper bound estimates of harvest levels sustainable at least until year 2040 -- these estimates assume that any limited
demand for other species will not limit aspen or spruce-fir harvesting from other cover types such as from the birch or northern hardwoods
cover types. However, the estimates do not include potential volumes from additional investments in short rotation intensive culture or
potential volume increases resulting from investments in pre-commercial thinning. The estimates do take into account allowable cut
procedures currently practiced by public land management agencies.
-Sustainable timber yield levels for birch, oak, basswood, maple and other hardwoods, tamarack and jack and red pine in the
figures above are based on DNR method of calculating long-term sustainable harvest levels, which consists of area regulation for
cover types typically managed as even-aged, and volume regulation for types typically managed as many-aged. Estimates are adjusted
downward as appropriate by ownership for potential timber supply restrictions that can apply to timberlands (riparian: 3%, old growth:
0.5%, leave tree: 5%). Rotation ages used to determine the estimates are based on average ages used in the DNR’s Subsection Forest
Resource Management Plans.

26
Wood Supply and
Demand Information
for Important Cover
Types and Species
Forest resource and harvest level information for Minnesota’s most significant cover types and
tree species.

27
Minnesota’s Aspen/Balm of Gilead Resource
Aspen is a relatively short-lived, fast growing tree species that requires nearly full sunlight in order to regenerate.
Aspen is by far the predominant cover type and species in Minnesota’s forests. It is also the species of greatest
industrial use by a wide margin. The aspen resource is why the engineered wood manufacturers are located here,
and it is also an extremely important resource to the pulp and paper sector, and the solid wood industrial segment.
Many of Minnesota’s largest mills have specifically designed themselves to utilize aspen – it fits the products they
make and their manufacturing processes ideally.
The aspen cover type is made up of a wide mixture of species. Predominant secondary species include balsam fir,
paper birch and oak. Aspen is also a significant component in many other upland cover types.
Balsam Fir6% Tamarack
1%Spruce
3% Jack Pine1%
Red Pine1%
White pine1%
Other Softwoods & Hardwoods
0 %
Maple4%
Birch5%
Ash4%
Balm6%
Aspen 62%
Oak4%
Basswood2%
Elm1%
Aspen/Balsam Poplar Forest Types Volume All Live on Timberland by Species
2012 FIA
Source: 2012 FIA database provided by USFS, Northern Research Station
0
200,000
400,000
600,000
800,000
1,000,000
0 to 10
11 to 20
21 to 30
31 to 40
41 to 50
51 to 60
61 to 70
71 to 80
81 to 90
91 to
100
100 plus
A
c
r
e
s
Age Class
Aspen & Balm Forest Types Timberland Acres by Owner & Age Class FIA 2012
Total Acres in Forest Type: 5,130,000
Private
County & Municipal
State
All Federal
Source: 2012 FIA database provided by USFS, Northern Research Station

28
The 2012 FIA inventory indicates a much more even age-class distribution than the 1990 inventory.
0
2,000,000
4,000,000
6,000,000
8,000,000
10,000,000
12,000,000
14,000,000
16,000,000
5.0-6.9
7.0-8.9
9.0-10.9
11.0-12.9
13.0-14.9
15.0-16.9
17.0-18.9
19.0-20.9
21.0-28.9
29.0+
Cord
s
Diameter Class
Aspen and Balm SpeciesVolume All Live by Diameter Class 1990 and 2012 FIA
Total Volume All Live (Cords): 1990: 66,295,600 2012: 49,439,700
1990
2012
Source: FIA database provided by USFS, Northern Research Station
Total FIA aspen and balm of gilead (balm) volume has gone down since 1990 as significant acreages have been
harvested and managed. For at least the next 10 years, more of the available aspen is likely to be found in stands
that average less volume than past harvests, which is difficult on efficiency of loggers and mills. However, it is
important to note that beginning in 10 years or so and then accelerating over time, more high-volume aspen stands
will begin to reach harvest age.
2.532.42 2.412.40 2.36
2.52
2.362.142.21
2.052.00 2.01
1.68
1.471.451.30
1.391.49
0
0.5
1
1.5
2
2.5
3
94 95 96 97 98 99 00 01 02 03 04 05 06 07 08 09 10 11
Mill
ion
Cord
s
YEAR
Aspen and Balm Harvest in Minnesota 1994-2011(Includes pulpwood, sawtimber, & wood energy)
Source: Harvest data compiled by USFS, Northern Research Station & DNR
Annual long-term allowable harvest= 2.358 million cords based on Table C-20 UPM-Thunderhawk DEIS,
average of high aspen A&B scenarios, 40 year planning horizon.
Based on the 2012 USFS FIA database, estimated average net annual growth of aspen & balm growing stock:
1,087,500 cords, estimated average annual mortality of aspen & balm growing stock: 1,685,900 cords.
Several factors caused the reduction in aspen and balm harvest from its peak in 1999, including:
Substitution of alternative species by most large mills.
Reductions in harvests from private timberlands.
Closure of several large mills.

29
Current Demand for Aspen/Balm of Gilead from Minnesota Timberlands
Cords
2011 Harvest……………………... ………………………………………1,491,800
Minnesota Pulpwood Industries ………………...…………..……1,306,600
Pulpwood Export (To Canada and Wisconsin)………………..……..70,920
Sawlogs & Other…………………………………………………..…64,600
Fuelwood (from live trees on timberland)…..………………….……49,700 Source: NRS & DNR Surveys
Resource Opportunities:
The recent reduction in aspen harvest levels has resulted in a situation where current harvest levels are
well below long-term sustainable levels.
Resource Issues:
Readers should note that a great deal of the resource is in private hands, so managing it will require
greater efforts in private landowner incentives and assistance.
The table below shows AVERAGE percent species compositions by merchantable volume (5 inch dbh and greater
to a 4 inch top DOB) by percent of basal area per acre that is “Aspen” (quaking, bigtooth, and balm) ON FIA
PLOTS. This table shows that Aspen and Balm forest types can differ significantly and provides some idea of
what other species can be harvested within these forest types. This is FIA Aspen and Balm Forest Types. Acres
Statewide provides some idea of the relative nature of different percent species compositions within a particular
forest type. Only FIA plots age 20 and older were included.
Percent
of BAA
Acres
Statewide
Balsam
Fir Tamarack
White
Spruce
Black
Spruce
Jack
Pine Red Pine
Eastern
White
Pine
White
Cedar Aspen
Paper
Birch Balm Basswood
American
Elm Maple Ash Oak
< 25% 112,992 21.9 3.5 5.4 3.0 8.8 1.7 0.0 0.7 13.7 10.9 1.0 0.5 3.5 4.7 7.0 6.9
25-50% 846,930 14.0 1.6 4.0 2.9 1.7 0.9 1.3 1.5 38.6 8.8 4.8 1.7 1.2 6.0 5.7 4.3
50-75% 1,134,810 6.5 0.5 2.2 1.0 1.3 0.9 0.5 0.6 59.4 5.8 5.6 1.2 1.4 4.7 3.5 4.3
>75% 1,571,297 1.7 0.1 0.6 0.2 0.5 0.1 0.1 0.1 77.4 1.2 12.5 0.2 0.8 0.9 1.7 1.5
Predicted spatial distribution of aspen and balm CUBIC FOOT volume of trees with a diameter of 5 inches and
greater. Maps are constructed using interpolative procedures among FIA plots. These maps don’t necessarily
indicate where individual trees of a species are found, but rather where individual trees of a certain species are
dense enough to represent a large enough volume warranting depiction.
Source: 2010 FIA database provided by USFS, Northern Research Station
Largetooth aspen Balsam poplar (Balm) Trembling aspen

30
Minnesota’s Birch Resource
Paper birch is a relatively short-lived species that requires nearly full sunlight for regeneration. It can grow in
nearly pure stands, or as a component in mixed stands. It comprises the large majority of the volume in the birch
cover type, but it is also a significant component of several other upland cover types, including aspen.
0
20,000
40,000
60,000
80,000
100,000
120,000
140,000
160,000
180,000
200,000
0 to 10
11 to 20
21 to 30
31 to 40
41 to 50
51 to 60
61 to 70
71 to 80
81 to 90
91 to
100
100 plus
A
c
r
e
s
Age Class
Paper Birch Forest Type Timberland Acres by Owner & Age Class FIA 2012
Total Acres in Forest Type: 922,000
Private
County & Municipal
State
All Federal
Source: 2012 FIA database provided by USFS, Northern Research Station
0
1,000,000
2,000,000
3,000,000
4,000,000
5,000,000
6,000,000
7,000,000
5.0-6.9
7.0-8.9
9.0-10.9
11.0-12.9
13.0-14.9
15.0-16.9
17.0-18.9
19.0-20.9
21.0-28.9
29.0+
Cord
s
Diameter Class
Paper Birch SpeciesVolume All Live by Diameter Class 1990 and 2012 FIA
Total Volume All Live (Cords): 1990: 20,221,900 2012: 12,879,600
1990
2012
Source: FIA database provided by USFS, Northern Research Station
Total volume of paper birch has declined since 1990, due largely to serious mortality trends associated with an
aging resource and stress caused by periodic drought.

31
208
243
207 214226 231 233 227
246
299315
332
236
178 182 177 171 171
0
50
100
150
200
250
300
350
94 95 96 97 98 99 00 01 02 03 04 05 06 07 08 09 10 11
Thou
sand
Cor
ds
YEAR
Birch Harvest in Minnesota 1994-2011(Includes pulpwood, sawtimber, wood energy & specialty products)
Source: Harvest data compiled by USFS, Northern Research Station & DNR
DNR estimated long-term annual sustainable harvest level: 371,500 cords/year. Estimated average net annual
growth of paper birch growing stock: -36,000 cords, and estimated average annual mortality of birch growing
stock: 416,900 cords, based on 2012 FIA data.
Current Demand for Birch from Minnesota Timberlands
Cords
2011 Harvest…………………………………………………………………………170,600
Minnesota Pulpwood Industries………………………………………………..93,400
Pulpwood Export (To Wisconsin)...……………..……………………………..11,200
Sawlogs & Other………………………………………………………………23,900
Fuelwood (from growing stock)….……………………………………………42,100
Source: NRS & DNR Surveys
Resource Opportunities:
Birch harvest is well below long-term sustainable levels.
Birch in northeastern Minnesota is “fleck-free” (fleck is a common appearance defect in birch), so larger,
high-quality stems are a fit for veneer markets.
Resource Issues:
There is a need to improve ability to consistently regenerate birch stands.
Wood quality. There is significant rot in older birch.
A major age class imbalance, with significant volumes of older birch.
Birch volume is declining. In part due to drought but also the birch bark borer and Armillaria root rot.

32
The table below shows AVERAGE percent species compositions by merchantable volume (5 inch dbh and greater
to a 4 inch top DOB) by percent of basal area per acre that is paper birch ON FIA PLOTS. This table shows that
a Birch forest type can differ significantly and provides some idea of what other species can be harvested within
these forest types. This is FIA Birch Forest Type. Acres Statewide provides some idea of the relative nature of
different percent species compositions within a particular forest type. Only FIA plots age 20 and older were
included.
Percent
of BAA
Acres
Statewide
Balsam
Fir Tamarack
White
Spruce
Black
Spruce
Jack
Pine Red Pine
Eastern
White
Pine
White
Cedar Aspen
Paper
Birch Balm Basswood
American
Elm Maple Ash Oak
< 25% 148,737 11.7 10.7 4.6 6.0 2.7 1.7 1.3 6.0 16.2 16.0 2.3 0.9 2.0 5.3 7.1 3.2
25-50% 415,660 12.0 3.1 4.5 4.2 1.5 1.1 1.6 3.0 16.0 35.7 0.8 0.6 0.8 5.9 5.2 2.4
50-75% 186,733 8.3 1.9 3.7 1.9 0.9 0.7 0.4 0.4 8.0 60.8 0.7 0.6 0.8 4.1 3.5 2.7
>75% 44,695 7.8 3.2 2.1 0.0 0.0 0.0 0.0 0.0 5.2 73.9 0.9 1.2 2.3 0.2 2.1 1.1
Predicted spatial distribution of paper birch CUBIC FOOT volume of trees with a diameter of 5 inches and
greater. Maps are constructed using interpolative procedures among FIA plots. This map doesn’t necessarily
indicate where individual trees of a species are found, but rather where individual trees of a certain species are
dense enough to represent a large enough volume warranting depiction.
Paper birch
Source: 2010 FIA database provided by USFS, Northern Research Station

33
Minnesota’s Balsam Fir Resource
Based on 2012 FIA data, estimated average net annual growth of balsam fir growing stock: 239,500 cords;
estimated average annual mortality of balsam fir growing stock: 323,500 cords.
Balsam fir industrial use is similar to that of spruce. It is used largely for making high quality paper, where it is
prized for its excellent fiber qualities. Some is also used by the sawmill industry, mostly in making studs but also
in small quantities for other types of lumber. Some fir is also used in making OSB.
Spruce-fir estimated annual sustainable harvest level 705,500 cords/year based on Table C-20 UPM-
Thunderhawk DEIS, average of high aspen A&B scenarios, 40 year planning horizon.
196206
260
205 198 197 192178 177 176 174
199
168 166 162
143152
169
0
50
100
150
200
250
300
94 95 96 97 98 99 00 01 02 03 04 05 06 07 08 09 10 11
Thou
sand
Cor
ds
YEAR
Balsam Fir Harvest in Minnesota 1994-2011(Includes pulpwood, sawtimber, & wood energy)
Source: Harvest data compiled by USFS, Northern Research Station & DNR.
Current Demand for Balsam Fir from Minnesota Timberlands
Cords
2011 Harvest……………………………………………………………………….168,600
Minnesota Pulpwood Industries……………………………..……....……..160,400
Pulpwood Export (To Canada and Wisconsin)…………..………………......…718
Sawlogs & Other…………………………………………………………..….7,500 Source: NRS & DNR Surveys
Resource Opportunities
High-quality balsam fir has excellent qualities for pulp & paper and stud manufacture.
Resource Issues:
Balsam availability dependent on harvest of aspen (38% of balsam fir in aspen type).
Older stands are susceptible to spruce budworm impact. When there are concentrations of balsam fir over
45 to 50 years of age, spruce budworm will increase to take advantage of their preferred food source. If
management favoring more conifers in stands, more extended rotation ages, more reserve trees and more
mixed stands result in more balsam fir of older ages, then budworm populations will periodically build up
to outbreak levels.
Age class imbalance.
Rot in older stands. High rot levels have a major impact on stand merchantability, and therefore ability to
manage these stands. Rot is undesirable for higher-value wood products.

34
0
20,000
40,000
60,000
80,000
100,000
0 to 10
11 to 20
21 to 30
31 to 40
41 to 50
51 to 60
61 to 70
71 to 80
81 to 90
91 to
100
100 plus
Acr
es
Age Class
Balsam Fir Forest Type Timberland Acres by Ownership & Age Class 2012 FIA
Total Acres in Forest Type: 377,000
Private
County & Municipal
State
All Federal
Source: 2012 FIA database provided by USFS, Northern Research Station
The cover type is dominated by stands at and above 40 years, making this a relatively old resource for such a
short-lived species. Recommended rotation ages can vary with stand productivity and site condition, with 50
years a common average (stands managed as extended rotations are carried beyond this age).
0
500,000
1,000,000
1,500,000
2,000,000
2,500,000
3,000,000
3,500,000
4,000,000
5.0-6.9
7.0-8.9
9.0-10.9
11.0-12.9
13.0-14.9
15.0-16.9
17.0-18.9
19.0-20.9
21.0-28.9
29.0+
Cord
s
Diameter Class
Balsam Fir SpeciesVolume All Live by Diameter Class 1990 and 2012 FIA
Total Volume All Live (Cords): 1990: 12,485,100 2012: 8,321,400
1990
2012
Source: FIA database provided by USFS, Northern Research Station
Much of the balsam fir volume in Minnesota (roughly 50%) is found mixed in with the aspen and birch cover
types, and is therefore tied to aspen and birch harvest. Total balsam fir volume has dropped significantly since
1990.

35
The table below shows AVERAGE percent species compositions by merchantable volume (5 inch dbh and greater
to a 4 inch top DOB) by percent of basal area per acre that is balsam fir ON FIA PLOTS. This table shows that a
Balsam fir forest type can differ significantly and provides some idea of what other species can be harvested
within these forest types. This is FIA Balsam fir Forest Type. Acres Statewide provides some idea of the relative
nature of different percent species compositions within a particular forest type. Only FIA plots age 20 and older
were included.
Percent
of BAA
Acres
Statewide
Balsam
Fir Tamarack
White
Spruce
Black
Spruce
Jack
Pine Red Pine
Eastern
White
Pine
White
Cedar Aspen
Paper
Birch Balm Basswood
American
Elm Maple Ash Oak
< 25% 41,389 3.6 23.0 8.7 23.2 3.0 0.0 5.7 10.9 12.5 5.2 2.2 0.0 0.2 0.9 0.2 0.0
25-50% 134,317 18.0 8.2 7.2 18.1 1.3 3.6 4.5 8.9 12.8 8.3 2.2 0.0 0.0 0.6 2.5 1.1
50-75% 130,688 41.5 5.8 6.2 10.5 0.2 2.3 1.1 6.0 9.8 9.5 1.9 0.0 0.2 2.7 1.1 0.2
>75% 24,169 77.5 0.0 4.3 0.0 0.0 0.0 0.0 0.0 7.0 4.3 1.0 0.0 0.0 5.1 0.9 0.0
Predicted spatial distribution of balsam fir CUBIC FOOT volume of trees with a diameter of 5 inches and
greater. Maps are constructed using interpolative procedures among FIA plots. This map doesn’t necessarily
indicate where individual trees of a species are found, but rather where individual trees of a certain species are
dense enough to represent a large enough volume warranting depiction.
Balsam fir
Source: 2010 FIA database provided by USFS, Northern Research Station

36
Minnesota’s Spruce Resource
182165
220
179166 166
195212
228 231
183
203213 215
243 236
215
271
0
50
100
150
200
250
300
94 95 96 97 98 99 00 01 02 03 04 05 06 07 08 09 10 11
Thou
sand
Cor
ds
YEAR
Spruce Harvest in Minnesota 1994-2011(Includes black and white spruce pulpwood, sawtimber, & wood energy)
Source: Harvest data compiled by USFS, Northern Research Station & DNR
Spruce-fir estimated annual sustainable harvest level 705,500 cords/year based on Table C-20 UPM-
Thunderhawk DEIS, average of high aspen A&B scenarios, 40 year planning horizon. Based on the 2012 FIA
database, estimated average net annual growth of spruce growing stock: 442,100 cords, estimated average annual
mortality of spruce growing stock: 181,500 cords.
Current Demand for Spruce from Minnesota Timberlands
Cords
2011 Harvest…………………………………………………………………………270,900
Minnesota Pulpwood Industries……………………………………………...208,900
Pulpwood Export (To Canada and Wisconsin)…..……………………………54,100
Sawlogs & Other…………………………………..…………………………..7,800
Source: NRS & DNR Surveys
Resource Opportunities
High-quality spruce has excellent properties for pulp & paper and stud manufacture. Along with our
balsam fir resource, it is the major reason several pulp and paper mills are located in Minnesota.
Increasing opportunities for thinning white spruce plantations, as stands move into merchantable size
classes. Thinning normally yields excellent quality pulp with little or no loss to rot or decay. It can be
lower volume productivity work for loggers, however.
Resource Issues:
Many stands have very low volume/acre of spruce. This increases logging costs, which not only affects
logger profitability, but can also impact production costs all the way to finished product. It can also
impact the ability to manage some stands.
Since black spruce is normally found on lowland sites only accessible during frozen conditions,
accessibility of the resource is a major issue. Very little summer access.
Spruce budworm has caused top kill and mortality on white spruce, including plantations. This impact
can be lessened by management activities such as thinning to maintain stand vigor and by discriminating
against balsam fir in some mixed stands.

37
Black Spruce
0
50,000
100,000
150,000
200,000
250,000
0 to 10
11 to 20
21 to 30
31 to 40
41 to 50
51 to 60
61 to 70
71 to 80
81 to 90
91 to
100
100 plus
Acr
es
Age Class
Black Spruce Forest Type Timberland Acres by Owner & Age Class 2012 FIA
1,365,000 Total Acres in Forest Type
Private
County & Municipal
State
All Federal
Source: 2012 FIA database provided by USFS, Northern Research Station
Black spruce cover type acreage is heavily weighted to ages 40 through 80, with a fair amount of acreage also
above age 100. Recommended harvest or “rotation” ages can vary with site productivity and site condition from
50 to 120 years of age, with 80 to 100 years on average. Stands managed as “extended rotation” are carried
beyond these ages. Black spruce exists largely on lowlands, often in nearly pure stands, or mixed with tamarack
and/or white cedar and a variety of minor associated species.
The State of Minnesota is by far the largest owner of black spruce cover type acres, but counties, private owners
and our two national forests all have significant acreage.
The vast majority of black and white spruce in Minnesota (over 97%) is used in the making of high quality paper,
where it is prized for its excellent fiber qualities. Some is also used by the sawmill industry, mostly in making
studs but also in small quantities for other types of lumber. A very small amount of spruce is also used in making
OSB.
0
1,000,000
2,000,000
3,000,000
4,000,000
5,000,000
6,000,000
5.0-6.9
7.0-8.9
9.0-10.9
11.0-12.9
13.0-14.9
15.0-16.9
17.0-18.9
19.0-20.9
21.0-28.9
29.0+
Cord
s
Diameter Class
Black Spruce SpeciesVolume All Live by Diameter Class 1990 and 2012 FIA
Total Volume All Live (Cords): 1990: 9,603,500 2012: 10,100,700
1990
2012
Source: FIA database provided by USFS, Northern Research Station

38
White Spruce
0
10,000
20,000
30,000
40,000
0 to 10
11 to 20
21 to 30
31 to 40
41 to 50
51 to 60
61 to 70
71 to 80
81 to 90
91 to
100
100 plus
Acr
es
Age Class
White Spruce Forest Type Timberland Acres by Owner & Age Class 2012 FIA
Total Acres in Forest Type: 135,000
Private
County & Municipal
State
All Federal
Source: 2012 FIA database provided by USFS, Northern Research Station
White spruce is a relatively young resource. The cover type is dominated by stands below the age of 50, many of
which are in the form of plantations. Recommended rotation ages can range from 40 to 90 years, depending on
site productivity and condition (again, some stands managed as extended rotation are held beyond these ages).
White spruce is located most often on upland sites, where in natural stands it is commonly found mixed in as a
component in aspen, birch, balsam fir & pretty much all upland cover types. A great deal of white spruce volume
exists as a component in mixed stands of other upland cover types.
0
200,000
400,000
600,000
800,000
1,000,000
5.0-6.9
7.0-8.9
9.0-10.9
11.0-12.9
13.0-14.9
15.0-16.9
17.0-18.9
19.0-20.9
21.0-28.9
29.0+
Cord
s
Diameter Class
White Spruce SpeciesVolume All Live by Diameter Class 1990 and 2012 FIA
Total Volume All Live (Cords): 1990: 3,777,000 2012: 4,869,000
1990
2012
Source: FIA database provided by USFS, Northern Research Station

39
The tables below show AVERAGE percent species compositions by merchantable volume (5 inch dbh and greater
to a 4 inch top DOB) by percent of basal area per acre that is black spruce and white spruce ON FIA PLOTS.
These tables show that these forest types can differ significantly and provides some idea of what other species can
be harvested within these forest types. This is FIA Black Spruce, White Spruce Natural, and White Spruce
Planted Forest Types. Acres Statewide provides some idea of the relative nature of different percent species
compositions within a particular forest type.
Black Spruce - Only FIA plots age 35 and older were included.
Percent
of BAA
Acres
Statewide
Balsam
Fir Tamarack
White
Spruce
Black
Spruce
Jack
Pine Red Pine
Eastern
White
Pine
White
Cedar Aspen
Paper
Birch Balm Basswood
American
Elm Maple Ash Oak
< 25% 38,727 18.6 36.8 0.9 6.5 14.1 5.5 2.2 2.7 4.2 7.5 0.5 0.0 0.0 0.5 0.0 0.0
25-50% 103,866 9.3 30.1 0.3 36.7 3.0 0.1 2.5 7.7 6.9 3.2 0.1 0.0 0.0 0.1 0.0 0.0
50-75% 281,516 2.2 29.4 0.7 58.2 2.1 0.0 0.5 2.4 1.6 2.2 0.1 0.0 0.0 0.4 0.3 0.0
>75% 805,985 0.8 13.8 0.3 82.8 0.4 0.2 0.4 0.4 0.5 0.3 0.0 0.0 0.0 0.0 0.0 0.0 White Spruce Natural - Only FIA plots age 20 and older were included.
Percent
of BAA
Acres
Statewide
Balsam
Fir Tamarack
White
Spruce
Black
Spruce
Jack
Pine Red Pine
Eastern
White
Pine
White
Cedar Aspen
Paper
Birch Balm Basswood
American
Elm Maple Ash Oak
< 25% 5,286 45.4 0.0 14.7 0.0 0.0 0.0 0.0 8.4 24.8 1.9 2.0 0.0 2.7 0.0 0.0 0.0
25-50% 15,571 13.8 1.8 39.9 4.8 3.5 4.7 0.0 6.4 7.7 10.9 0.0 0.0 4.7 0.0 0.4 0.0
50-75% 10,758 9.9 0.0 72.3 0.4 0.0 3.6 0.0 0.0 3.6 4.0 0.0 0.1 1.5 1.2 2.7 0.0
>75% 20,806 2.1 0.0 92.5 1.2 0.0 0.0 0.0 0.0 2.7 0.5 0.1 0.0 1.0 0.0 0.0 0.0 White Spruce Planted - Only FIA plots age 20 and older were included.
Percent
of BAA
Acres
Statewide
Balsam
Fir Tamarack
White
Spruce
Black
Spruce
Jack
Pine Red Pine
Eastern
White
Pine
White
Cedar Aspen
Paper
Birch Balm Basswood
American
Elm Maple Ash Oak
< 25% 587 12.9 0.0 22.0 21.4 0.0 0.0 0.0 0.0 26.1 17.6 0.0 0.0 0.0 0.0 0.0 0.0
25-50% 8,576 14.3 0.0 53.0 1.3 0.0 3.6 2.7 7.1 12.3 4.0 0.0 0.0 0.0 1.9 0.0 0.0
50-75% 27,418 8.8 1.5 72.5 0.5 0.0 0.0 0.0 0.0 4.5 2.0 0.9 1.3 0.2 1.6 0.9 4.3
>75% 28,177 2.0 0.0 93.2 0.1 0.0 0.0 0.7 0.0 3.1 0.7 0.0 0.0 0.0 0.0 0.0 0.0
Predicted spatial distribution of black spruce and white spruce CUBIC FOOT volume of trees with a diameter of
5 inches and greater. Maps are constructed using interpolative procedures among FIA plots. This map doesn’t
necessarily indicate where individual trees of a species are found, but rather where individual trees of a certain
species are dense enough to represent a large enough volume warranting depiction.
Black spruce White spruce
Source: 2010 FIA database provided by USFS, Northern Research Station
40
Minnesota’s Tamarack Resource
4
13 13
2318
2320
48
28
61
42
65
36
53
70 72
77
59
0
10
20
30
40
50
60
70
80
90
94 95 96 97 98 99 00 01 02 03 04 05 06 07 08 09 10 11
Thou
sand
Cor
ds
YEAR
Tamarack Harvest in Minnesota 1994-2011(Includes pulpwood, sawtimber, & wood energy)
Source: Harvest data compiled by USFS, Northern Research Station & DNR
DNR estimated long-term annual sustainable harvest level = 114,800 cords/year. Based on the 2012 FIA database,
estimated average net annual growth of tamarack growing stock: 83,300 cords, estimated average annual mortality
of tamarack growing stock: 275,000 cords.
Current Demand for Tamarack from Minnesota Timberlands
Cords
2011 Harvest…………………………………………………………………………59,200
Minnesota Pulpwood Industries……………………………………………...30,400
Pulpwood Export (To Canada and Wisconsin)..……………………………….3,600
Sawlogs & Other………………………………………………………………7,100
Fuelwood……………………………………………………………………..18,100
Source: NRS & DNR Surveys.
Resource Opportunities:
Harvest is below long-term sustainable levels.
Resource Issues:
Many stands have low volumes.
Serious forest health and mortality issues, especially in older stands.
Winter access only.
Inconsistent and uncertain markets.
Additional market development needed.
Emerging markets include woody biomass energy and industrial lumber (pallets).

41
020,00040,00060,00080,000
100,000120,000140,000160,000180,000
0 to 10
11 to 20
21 to 30
31 to 40
41 to 50
51 to 60
61 to 70
71 to 80
81 to 90
91 to
100
100 plus
Acr
es
Age Class
Tamarack Forest Type Timberland Acres by Owner & Age Class 2012 FIA
Total Acres in Forest Type: 1,055,000
Private
County & Municipal
State
All Federal
Source: 2012 FIA database provided by USFS, Northern Research Station
Tamarack is dominated by “middle-aged” stands, but there is a fair amount of very old tamarack (average rotation
age= 90). The state of Minnesota owns close to 52% of the tamarack cover type acreage.
Tamarack is used primarily in the manufacture of Kraft pulp, and to a limited extent, engineered wood products.
Recently, biomass energy facilities have begun to use more tamarack. Markets for tamarack have therefore
improved somewhat since the 1990s, and stumpage prices still remain quite low.
0
500,000
1,000,000
1,500,000
2,000,000
2,500,000
3,000,000
5.0-6.9
7.0-8.9
9.0-10.9
11.0-12.9
13.0-14.9
15.0-16.9
17.0-18.9
19.0-20.9
21.0-28.9
29.0+
Cord
s
Diameter Class
Tamarack SpeciesVolume All Live by Diameter Class 1990 and 2012 FIA
Total Volume All Live (Cords): 1990: 6,368,900 2012: 8,781,700
1990
2012
Source: FIA database provided by USFS, Northern Research Station
Total volume of tamarack has risen substantially since 1990.

42
The table below shows AVERAGE percent species compositions by merchantable volume (5 inch dbh and greater
to a 4 inch top DOB) by percent of basal area per acre that is tamarack ON FIA PLOTS. This table shows that a
Tamarack forest type can differ significantly and provides some idea of what other species can be harvested
within these forest types. This is FIA Tamarack Forest Type. Acres Statewide provides some idea of the relative
nature of different percent species compositions within a particular forest type. Only FIA plots age 35 and older
were included.
Percent
of BAA
Acres
Statewide
Balsam
Fir Tamarack
White
Spruce
Black
Spruce
Jack
Pine Red Pine
Eastern
White
Pine
White
Cedar Aspen
Paper
Birch Balm Basswood
American
Elm Maple Ash Oak
< 25% 31,462 10.3 11.8 0.0 26.1 0.0 0.0 5.4 20.1 0.9 14.1 2.0 0.0 0.0 0.0 9.2 0.0
25-50% 156,723 2.9 52.7 1.0 24.8 0.7 2.1 1.0 11.3 0.8 1.8 0.2 0.0 0.0 0.0 0.5 0.0
50-75% 222,331 0.2 70.7 0.0 21.6 0.3 0.0 0.2 4.5 0.3 0.7 0.1 0.0 0.0 0.4 0.5 0.3
>75% 483,596 0.0 95.1 0.0 3.7 0.0 0.0 0.0 0.5 0.2 0.2 0.0 0.0 0.0 0.0 0.1 0.0
Predicted spatial distribution of tamarack CUBIC FOOT volume of trees with a diameter of 5 inches and greater.
Maps are constructed using interpolative procedures among FIA plots. This map doesn’t necessarily indicate
where individual trees of a species are found, but rather where individual trees of a certain species are dense
enough to represent a large enough volume warranting depiction.
Tamarack
Source: 2010 FIA database provided by USFS, Northern Research Station

43
Minnesota’s Northern Hardwoods Resource
The northern hardwoods cover type is an assortment of a wide group of species. The dominant species are the
shade tolerant sugar maple and basswood. There are also significant oak, red maple, aspen, and birch volumes.
Balsam Fir2%
Other Softwoods1%
Spruce1% Pine
2%
Yellow birch1%
Red Maple9%
Other Hardwoods3%
Sugar Maple24%
Paper birch5%
Ash5%
Red Oak8%
Aspen & Balm9%
White & Bur Oak8%
Basswood19%
Elm3%
Boxelder1%
Northern Hardwoods Forest Type Volume All Live on Timberland by Species
2012 FIA
Source: 2012 FIA database provided by USFS, Northern Research Station
0
50,000
100,000
150,000
200,000
250,000
300,000
350,000
0 to 10
11 to 20
21 to 30
31 to 40
41 to 50
51 to 60
61 to 70
71 to 80
81 to 90
91 to 100
100 plus
Acr
es
Age Class
Northern Hardwoods Forest Type Timberland Acres by Owner & Age Class 2012 FIA
Total Acres in Forest Type: 1,541,000
Private
County & Municipal
State
All Federal
Source: 2012 FIA database provided by USFS, Northern Research Station
The northern hardwoods cover type is dominated by late “middle aged” stands (average rotation age = 80), many
of which are in need of thinning in order to promote optimal growth and forest health. Northern hardwoods are
often managed through periodic “thinning” harvests (or partial cuts), although clearcutting can be an appropriate
tool in some situations. The northern hardwoods cover type is owned largely by private landowners. Continuing
and improved availability and use of forest management technical assistance to private landowners is therefore a
critical issue for this type. Our northern hardwoods cover type has been something of a “neglected” resource for
many years. This has largely been due to a history of poor markets for many hardwood species and sizes in much
of the state. The market situation for most hardwoods has changed drastically in recent years, however. Several
Minnesota pulp and paper and engineered wood product manufacturers have increased the use of maple and other
hardwoods.
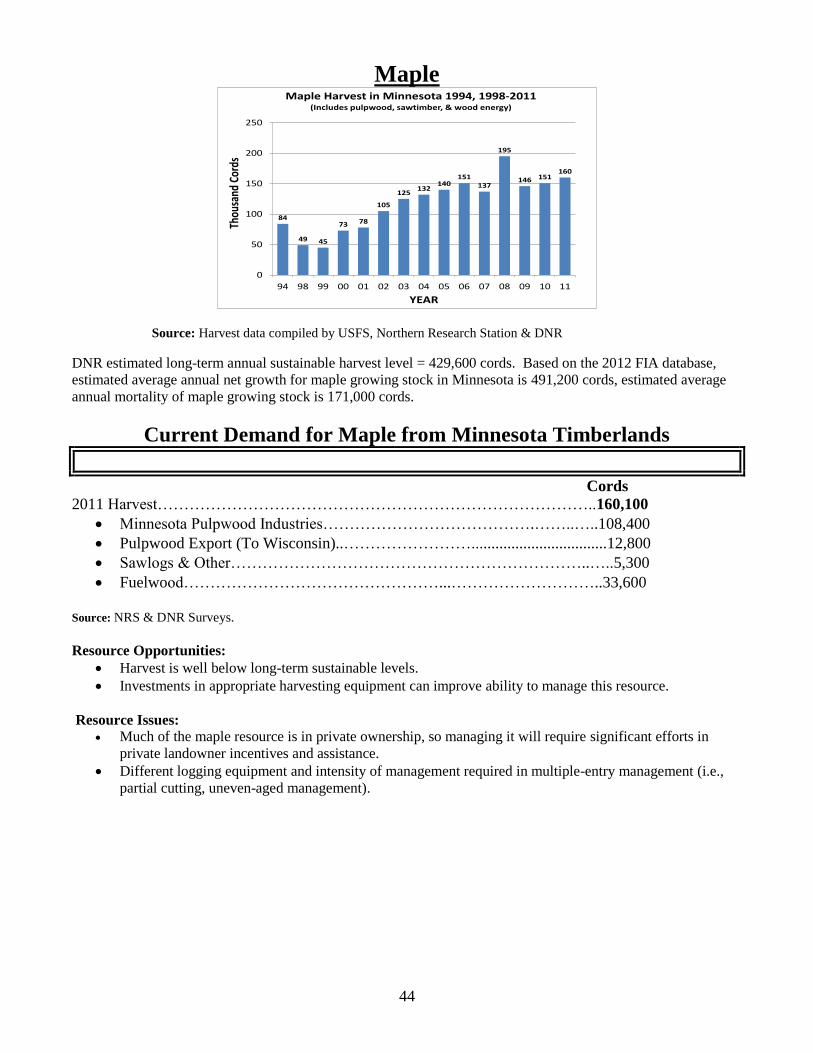
44
Maple
84
49 45
73 78
105
125132
140151
137
195
146 151160
0
50
100
150
200
250
94 98 99 00 01 02 03 04 05 06 07 08 09 10 11
Thou
sand
Cor
ds
YEAR
Maple Harvest in Minnesota 1994, 1998-2011(Includes pulpwood, sawtimber, & wood energy)
Source: Harvest data compiled by USFS, Northern Research Station & DNR
DNR estimated long-term annual sustainable harvest level = 429,600 cords. Based on the 2012 FIA database,
estimated average annual net growth for maple growing stock in Minnesota is 491,200 cords, estimated average
annual mortality of maple growing stock is 171,000 cords.
Current Demand for Maple from Minnesota Timberlands
Cords
2011 Harvest………………………………………………………………………..160,100
Minnesota Pulpwood Industries………………………………….……..…..108,400
Pulpwood Export (To Wisconsin)..……………………..................................12,800
Sawlogs & Other…………………………………………………………..…..5,300
Fuelwood…………………………………………...………………………..33,600
Source: NRS & DNR Surveys.
Resource Opportunities:
Harvest is well below long-term sustainable levels.
Investments in appropriate harvesting equipment can improve ability to manage this resource.
Resource Issues:
Much of the maple resource is in private ownership, so managing it will require significant efforts in
private landowner incentives and assistance.
Different logging equipment and intensity of management required in multiple-entry management (i.e.,
partial cutting, uneven-aged management).

45
0
200,000
400,000
600,000
800,000
1,000,000
1,200,000
1,400,000
5.0
-6.9
7.0
-8.9
9.0
-10
.9
11
.0-1
2.9
13
.0-1
4.9
15
.0-1
6.9
17
.0-1
8.9
19
.0-2
0.9
21
.0-2
8.9
29
.0+
Co
rds
Diameter
Sugar MapleVolume of Growing Stock on Timberland
by Diameter and Tree Grade 2012 FIA
Not collected
Tree too small to grade
Graded but does not contain gradeable log
Gradeable log but does not meet grade 3 standards
Tree grade 3
Tree grade 2
Tree grade 1
Source: 2012 FIA database provided by USFS, Northern Research Station
Note: Tree grade 1 = highest quality in the USFS tree grading system
Minnesota’s maple resource is made up of 4 species: sugar maple, red maple, silver maple and black maple.
Sugar maple in much of Minnesota tends to be of fairly low sawlog quality, due to relatively small size and poor
form. We are on the western edge of its natural growing range. However, some higher quality sugar maple is
grown in southeastern Minnesota.
Predicted spatial distribution of red maple, sugar maple, and basswood CUBIC FOOT volume of trees with a
diameter of 5 inches and greater. Maps are constructed using interpolative procedures among FIA plots. This
map doesn’t necessarily indicate where individual trees of a species are found, but rather where individual trees
of a certain species are dense enough to represent a large enough volume warranting depiction.
Sugar maple BasswoodRed maple
Source: 2010 FIA database provided by USFS, Northern Research Station

46
Basswood
3634 34
38 39 4038 37
47
41
48
55
35 35
39
2729 29
0
10
20
30
40
50
60
94 95 96 97 98 99 00 01 02 03 04 05 06 07 08 09 10 11
Thou
sand
Cor
ds
YEAR
Basswood Harvest in Minnesota 1994-2011(Includes pulpwood, sawtimber, & wood energy)
Source: Harvest data compiled by USFS, Northern Research Station & DNR
DNR estimated long-term annual sustainable harvest level = 280,300 cords. Based on the 2012 FIA database,
estimated net annual basswood growth: 233,800 cords, estimated annual mortality: 112,100 cords.
Current Demand for Basswood from Minnesota Timberlands
Cords
2011 Harvest…………………………………………………………………………29,200
Minnesota Pulpwood Industries………………………………………….……9,600
Pulpwood Export (To Wisconsin)..………………………….………….….……800
Sawlogs & Other……………………………………………………………..12,500
Fuelwood………………………………………………………………………6,300
Source: NRS & DNR Surveys.
Resource Opportunities
Harvest is well below long-term sustainable levels.
There are opportunities to improve future basswood volume and quality through investments in
intermediate stand treatments on private and public lands.
Minnesota grows some of the highest quality basswood in the world. It can be a great fit for “craft”
woods and other niche markets.
Resource Issues
Much of the basswood resource is in private ownership, so managing it will require significant efforts in
private landowner incentives and assistance.
Potential for harvest of high-quality stems as “pulpwood” on productive sites prior to their reaching
sawlog size on private lands. Important to get quality material to higher-value markets.
Different logging equipment and intensity of management required in multiple-entry management (i.e.,
partial cutting, uneven-aged management).

47
0
200,000
400,000
600,000
800,000
1,000,000
1,200,000
1,400,000
1,600,000
1,800,000
2,000,000
5.0
-6.9
7.0
-8.9
9.0
-10
.9
11
.0-1
2.9
13
.0-1
4.9
15
.0-1
6.9
17
.0-1
8.9
19
.0-2
0.9
21
.0-2
8.9
29
.0+
Co
rds
Diameter
BasswoodVolume of Growing Stock on Timberland
by Diameter and Tree Grade 2012 FIA
Not collected
Tree too small to grade
Graded but does not contain gradeable log
Gradeable log but does not meet grade 3 standards
Tree grade 3
Tree grade 2
Tree grade 1
Source: 2012 FIA database provided by USFS, Northern Research Station.
Note: Tree grade 1 = highest quality in the USFS tree grading system
Basswood is capable of producing a large percentage of high-quality sawlog and veneer material on good
sites in Minnesota.

48
Minnesota’s Oak Resource
298
184 192 192 188173 173
141 141
120 120 120132 132
103 103 104
0
50
100
150
200
250
300
350
95 96 97 98 99 00 01 02 03 04 05 06 07 08 09 10 11
Thou
sand
Cor
ds
YEAR
Oak Harvest in Minnesota 1995-2011(Includes pulpwood, sawtimber, & wood energy)
Source: Harvest data compiled by USFS, Northern Research Station & DNR
The oak cover type is dominated by late “middle aged” stands (average rotation age = 80 to 100). The oak
resource is largely owned by private landowners.
Current Demand for Oak from Minnesota Timberlands
Cords
2011 Harvest………………………………………………………………….……104,200
Minnesota Pulpwood Industries…………………………………………..……….0
Pulpwood Export (To Wisconsin)..……………………..…………….....……1,300
Sawlogs & Other……………………………………………………….…….43,500
Fuelwood…………………………………………………………………….59,400
Source: NRS & DNR Surveys.
Resource Opportunities:
Some high quality sawlog and veneer red oak is grown on good sites in Minnesota.
There are opportunities to improve future oak volume and quality through investments in intermediate
stand treatments on private and public lands.
Resource Issues:
High quality red oak sawlog resource continues to decline.
Gypsy moth invasion making its way into Minnesota will have a negative impact on oak resource.

49
0
50,000
100,000
150,000
200,000
250,000
300,000
0 to 10
11 to 20
21 to 30
31 to 40
41 to 50
51 to 60
61 to 70
71 to 80
81 to 90
91 to
100
100 plus
Acr
es
Age Class
Oak Forest Type Timberland Acres by Owner & Age Class 2012 FIA
Total Acres in Forest Type: 1,465,000
Private
County & Municipal
State
All Federal
Source: 2012 FIA database provided by USFS, Northern Research Station
Oak is a tremendously important cover type and species in a large portion of Minnesota. Many wildlife species
commonly use acorns as part of their diet, and oaks also can provide excellent den opportunities. Additionally, it
is the largest volume species produced by many sawmills, especially those in the southern 2/3 of the state.
DNR estimated long-term annual sustainable harvest level for oak = 499,300 cords. Based on 2012 FIA data,
estimated net annual oak growth: 577,200 cords; estimated annual oak mortality: 246,800 cords.
0
200,000
400,000
600,000
800,000
1,000,000
1,200,000
1,400,000
1,600,000
1,800,000
2,000,000
5.0
-6.9
7.0
-8.9
9.0
-10
.9
11
.0-1
2.9
13
.0-1
4.9
15
.0-1
6.9
17
.0-1
8.9
19
.0-2
0.9
21
.0-2
8.9
29
.0+
Co
rds
Diameter
Red OakVolume of Growing Stock on Timberland
by Diameter and Tree Grade 2012 FIA
Not collected
Tree too small to grade
Graded but does not contain gradeable log
Gradeable log but does not meet grade 3 standards
Tree grade 3
Tree grade 2
Tree grade 1
Source: 2012 FIA database provided by USFS, Northern Research Station (includes black oak, northern
pin oak, and northern red oak).
Note: Tree grade 1 = highest quality in the USFS tree grading system
Some high quality sawlog and veneer red oak is grown on good sites in Minnesota.
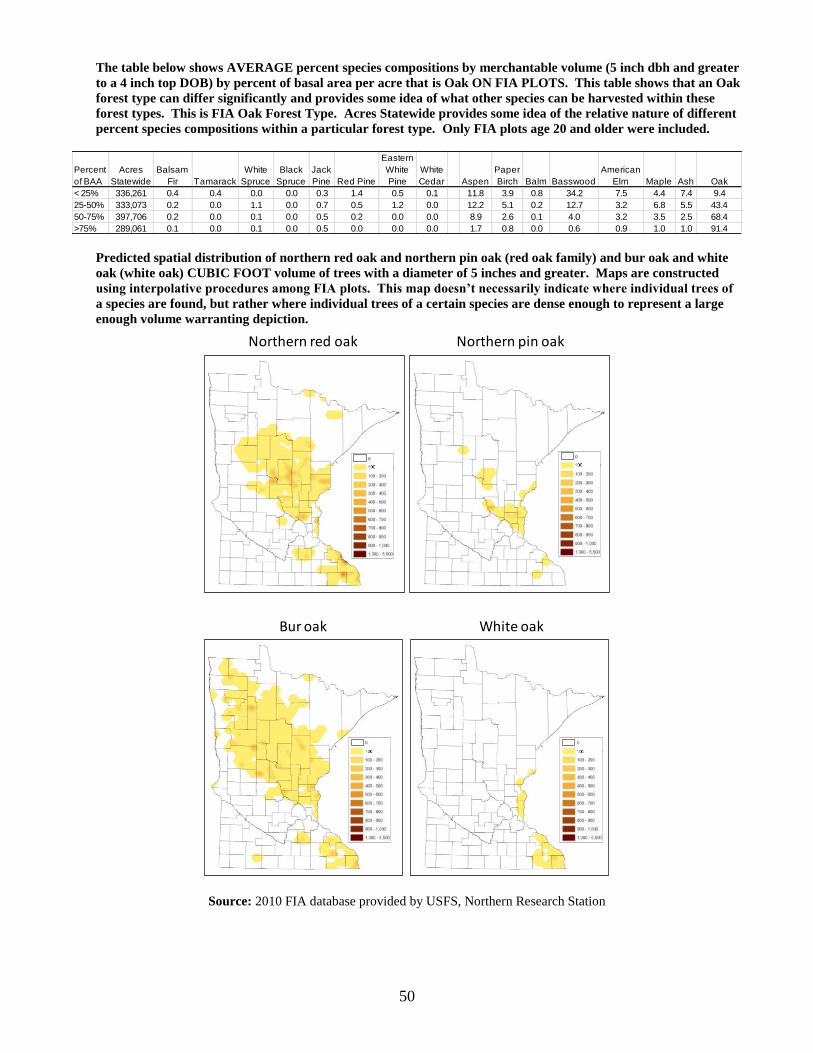
50
The table below shows AVERAGE percent species compositions by merchantable volume (5 inch dbh and greater
to a 4 inch top DOB) by percent of basal area per acre that is Oak ON FIA PLOTS. This table shows that an Oak
forest type can differ significantly and provides some idea of what other species can be harvested within these
forest types. This is FIA Oak Forest Type. Acres Statewide provides some idea of the relative nature of different
percent species compositions within a particular forest type. Only FIA plots age 20 and older were included.
Percent
of BAA
Acres
Statewide
Balsam
Fir Tamarack
White
Spruce
Black
Spruce
Jack
Pine Red Pine
Eastern
White
Pine
White
Cedar Aspen
Paper
Birch Balm Basswood
American
Elm Maple Ash Oak
< 25% 336,261 0.4 0.4 0.0 0.0 0.3 1.4 0.5 0.1 11.8 3.9 0.8 34.2 7.5 4.4 7.4 9.4
25-50% 333,073 0.2 0.0 1.1 0.0 0.7 0.5 1.2 0.0 12.2 5.1 0.2 12.7 3.2 6.8 5.5 43.4
50-75% 397,706 0.2 0.0 0.1 0.0 0.5 0.2 0.0 0.0 8.9 2.6 0.1 4.0 3.2 3.5 2.5 68.4
>75% 289,061 0.1 0.0 0.1 0.0 0.5 0.0 0.0 0.0 1.7 0.8 0.0 0.6 0.9 1.0 1.0 91.4
Predicted spatial distribution of northern red oak and northern pin oak (red oak family) and bur oak and white
oak (white oak) CUBIC FOOT volume of trees with a diameter of 5 inches and greater. Maps are constructed
using interpolative procedures among FIA plots. This map doesn’t necessarily indicate where individual trees of
a species are found, but rather where individual trees of a certain species are dense enough to represent a large
enough volume warranting depiction.
Northern red oak Northern pin oak
White oakBur oak
Source: 2010 FIA database provided by USFS, Northern Research Station

51
Minnesota’s Lowland Hardwoods Resource
Balsam Fir2%
Other Softwoods3%
White-cedar4%
Aspen & Balm5%
Ash49%
Red maple2%
Silver maple12%
Boxelder7%
Elm4%
Basswood3%
Paper birch2%
Oak3%
Other hardwoods4%
Lowland Hardwoods Forest Type Volume All Live on Timberland by Species
2012 FIA
Source: 2012 FIA database provided by USFS, Northern Research Station
The lowland hardwoods cover type is made up of a variety of species. Most prevalent are black ash, green ash,
silver maple, and boxelder.
0
50,000
100,000
150,000
200,000
250,000
300,000
0 to 10
11 to 20
21 to 30
31 to 40
41 to 50
51 to 60
61 to 70
71 to 80
81 to 90
91 to
100
100 plus
Acr
es
Age Class
Lowland Hardwood Forest TypeTimberland Acres by Ownership & Age Class 2012 FIA
Total Acres in Forest Type: 1,419,000
Private
County & Municipal
State
All Federal
Source: 2012 FIA database provided by USFS, Northern Research Station
The lowland hardwood cover type is dominated by late “middle age” stands. A common rotation age for black
ash is 90 years.
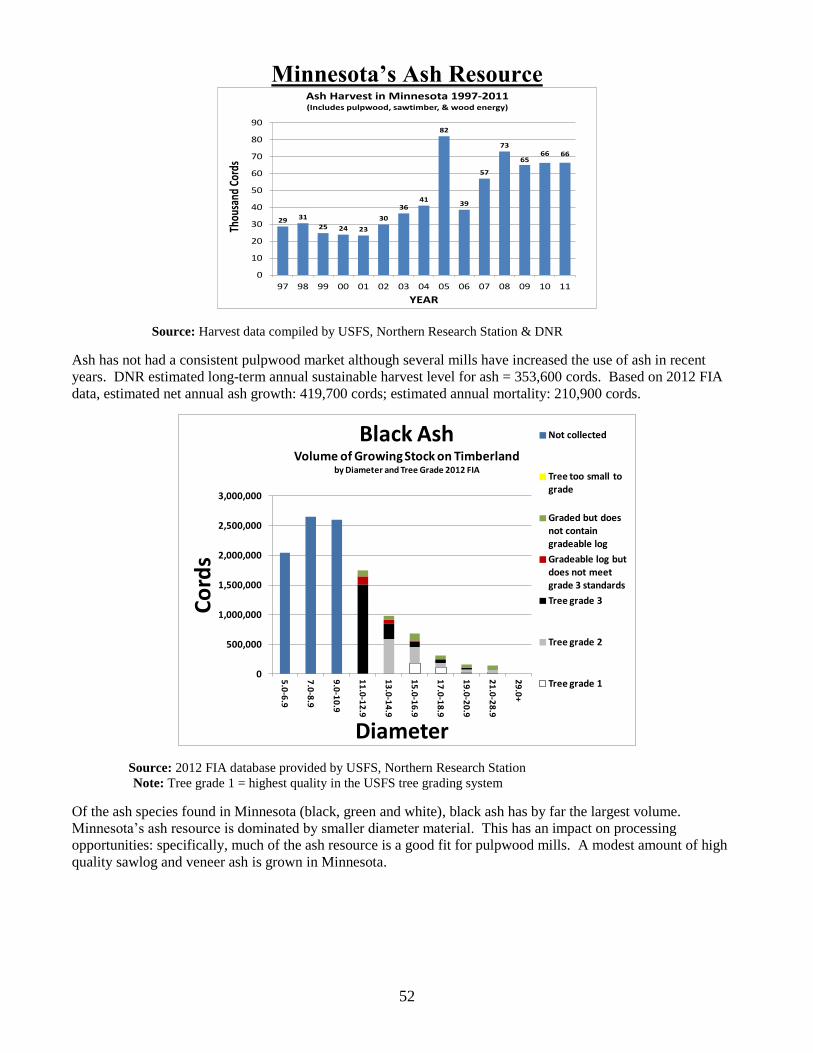
52
Minnesota’s Ash Resource
29 31
25 24 23
30
3641
82
39
57
73
6566 66
0
10
20
30
40
50
60
70
80
90
97 98 99 00 01 02 03 04 05 06 07 08 09 10 11
Thou
sand
Cor
ds
YEAR
Ash Harvest in Minnesota 1997-2011(Includes pulpwood, sawtimber, & wood energy)
Source: Harvest data compiled by USFS, Northern Research Station & DNR
Ash has not had a consistent pulpwood market although several mills have increased the use of ash in recent
years. DNR estimated long-term annual sustainable harvest level for ash = 353,600 cords. Based on 2012 FIA
data, estimated net annual ash growth: 419,700 cords; estimated annual mortality: 210,900 cords.
0
500,000
1,000,000
1,500,000
2,000,000
2,500,000
3,000,000
5.0
-6.9
7.0
-8.9
9.0
-10
.9
11
.0-1
2.9
13
.0-1
4.9
15
.0-1
6.9
17
.0-1
8.9
19
.0-2
0.9
21
.0-2
8.9
29
.0+
Co
rds
Diameter
Black AshVolume of Growing Stock on Timberland
by Diameter and Tree Grade 2012 FIA
Not collected
Tree too small to grade
Graded but does not contain gradeable log
Gradeable log but does not meet grade 3 standards
Tree grade 3
Tree grade 2
Tree grade 1
Source: 2012 FIA database provided by USFS, Northern Research Station
Note: Tree grade 1 = highest quality in the USFS tree grading system
Of the ash species found in Minnesota (black, green and white), black ash has by far the largest volume.
Minnesota’s ash resource is dominated by smaller diameter material. This has an impact on processing
opportunities: specifically, much of the ash resource is a good fit for pulpwood mills. A modest amount of high
quality sawlog and veneer ash is grown in Minnesota.

53
Current Demand for Ash from Minnesota Timberlands
Cords
2011 Harvest………………………………………………………………………...66,300
Minnesota Pulpwood Industries……………………………………………..17,000
Pulpwood Export (To Wisconsin)…...………………………………....……..2,100
Sawlogs & Other (including fuel)………………………………….………..47,300
Source: NRS & DNR Surveys.
Resource Opportunities
Harvest is well below long-term sustainable levels.
Winter harvest season predominately.
Resource Issues
Serious health concerns in black ash.
Sorting high quality ash for highest value markets.
Invasive Emerald Ash Borer found in Minnesota.
Predicted spatial distribution of black ash, green ash, and white ash CUBIC FOOT volume of trees with a diameter of
5 inches and greater. Maps are constructed using interpolative procedures among FIA plots. This map doesn’t
necessarily indicate where individual trees of a species are found, but rather where individual trees of a certain
species are dense enough to represent a large enough volume warranting depiction. Black ash Green ash White ash
Source: 2010 FIA database provided by USFS, Northern Research Station

54
Minnesota’s Pine Resource
Red Pine
0
20,000
40,000
60,000
80,000
100,000
120,000
0 to 10
11 to
20
21 to
30
31 to
40
41 to
50
51 to
60
61 to
70
71 to
80
81 to
90
91 to
100
100 plus
Acr
es
Age Class
Red Pine Forest Type Timberland Acres by Age Class & Owner 2012 FIA
Total Acres in Forest Type: 685,000
Private
County & Municipal
State
All Federal
Source: 2012 FIA database provided by USFS, Northern Research Station
Red pine is a type dominated by young age classes, much of which is in the form of plantations in need of
periodic thinning. Much of the resource is owned by the federal government and private landowners.
0
500,000
1,000,000
1,500,000
2,000,000
2,500,000
3,000,000
5.0-6.9
7.0-8.9
9.0-10.9
11.0-12.9
13.0-14.9
15.0-16.9
17.0-18.9
19.0-20.9
21.0-28.9
29.0+
Cord
s
Diameter Class
Red Pine SpeciesVolume All Live by Diameter Class 1990 and 2012 FIA
Total Volume All Live (Cords): 1990: 7,479,800 2012: 14,361,000
1990
2012
Source: FIA database provided by USFS, Northern Research Station
Volume of red pine has increased greatly since 1990 as many plantations have reached merchantable sizes.
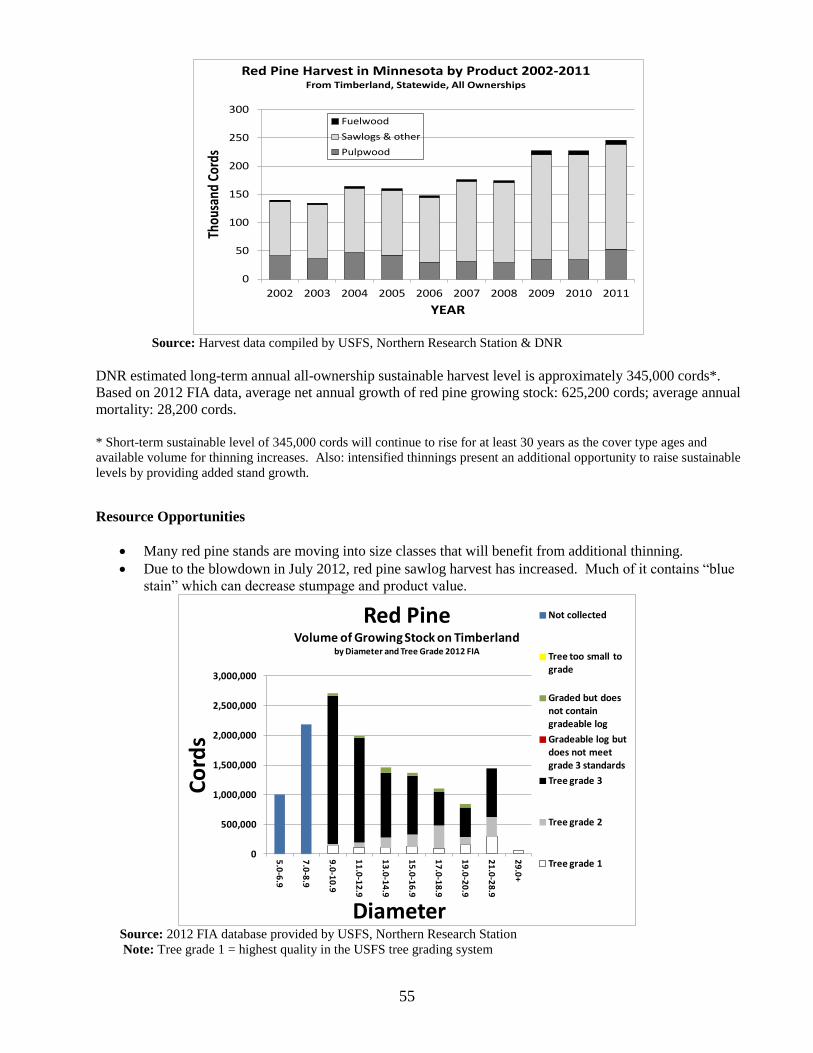
55
0
50
100
150
200
250
300
2002 2003 2004 2005 2006 2007 2008 2009 2010 2011
Thou
sand
Cor
ds
YEAR
Red Pine Harvest in Minnesota by Product 2002-2011From Timberland, Statewide, All Ownerships
Fuelwood
Sawlogs & other
Pulpwood
Source: Harvest data compiled by USFS, Northern Research Station & DNR
DNR estimated long-term annual all-ownership sustainable harvest level is approximately 345,000 cords*.
Based on 2012 FIA data, average net annual growth of red pine growing stock: 625,200 cords; average annual
mortality: 28,200 cords.
* Short-term sustainable level of 345,000 cords will continue to rise for at least 30 years as the cover type ages and
available volume for thinning increases. Also: intensified thinnings present an additional opportunity to raise sustainable
levels by providing added stand growth.
Resource Opportunities
Many red pine stands are moving into size classes that will benefit from additional thinning. Due to the blowdown in July 2012, red pine sawlog harvest has increased. Much of it contains “blue
stain” which can decrease stumpage and product value.
0
500,000
1,000,000
1,500,000
2,000,000
2,500,000
3,000,000
5.0
-6.9
7.0
-8.9
9.0
-10
.9
11
.0-1
2.9
13
.0-1
4.9
15
.0-1
6.9
17
.0-1
8.9
19
.0-2
0.9
21
.0-2
8.9
29
.0+
Co
rds
Diameter
Red PineVolume of Growing Stock on Timberland
by Diameter and Tree Grade 2012 FIA
Not collected
Tree too small to grade
Graded but does not contain gradeable log
Gradeable log but does not meet grade 3 standards
Tree grade 3
Tree grade 2
Tree grade 1
Source: 2012 FIA database provided by USFS, Northern Research Station
Note: Tree grade 1 = highest quality in the USFS tree grading system

56
The tables below show AVERAGE percent species compositions by merchantable volume (5 inch dbh and greater
to a 4 inch top DOB) by percent of basal area per acre that is Red Pine ON FIA PLOTS. These tables show that
these forest types can differ significantly and provides some idea of what other species can be harvested within
these forest types. This is FIA Red Pine Forest Type. Acres Statewide provides some idea of the relative nature
of different percent species compositions within a particular forest type. Only FIA plots age 20 and older were
included.
Red Pine Natural
Percent
of BAA
Acres
Statewide
Balsam
Fir Tamarack
White
Spruce
Black
Spruce
Jack
Pine Red Pine
Eastern
White
Pine
White
Cedar Aspen
Paper
Birch Balm Basswood
American
Elm Maple Ash Oak
< 25% 85,045 0.9 0.0 2.7 0.9 40.1 8.0 3.5 0.4 23.7 6.7 0.0 0.0 0.3 3.0 0.3 9.1
25-50% 75,373 1.8 0.0 3.2 0.8 5.1 49.9 9.7 0.0 15.5 7.7 0.0 0.3 0.0 2.0 0.0 3.9
50-75% 66,204 4.0 0.0 0.9 0.4 6.1 70.0 6.8 0.0 4.7 3.4 0.0 0.0 0.0 1.4 0.0 1.5
>75% 44,638 0.9 0.0 0.5 0.1 0.9 93.8 1.7 0.0 0.7 0.8 0.2 0.0 0.0 0.2 0.0 0.2
Red Pine Planted
Percent
of BAA
Acres
Statewide
Balsam
Fir Tamarack
White
Spruce
Black
Spruce
Jack
Pine Red Pine
Eastern
White
Pine
White
Cedar Aspen
Paper
Birch Balm Basswood
American
Elm Maple Ash Oak
< 25% 4,283 26.8 0.0 0.0 0.0 45.8 4.4 0.0 0.0 23.0 0.0 0.0 0.0 0.0 0.0 0.0 0.0
25-50% 22,563 2.6 0.0 0.4 1.0 1.1 52.3 7.4 0.0 14.2 7.3 0.0 0.6 0.2 8.6 0.1 1.8
50-75% 98,344 2.0 0.0 3.9 1.1 5.6 70.4 4.9 0.3 6.3 2.4 0.9 0.0 0.0 0.5 0.0 1.5
>75% 167,633 0.7 0.0 0.5 0.1 1.7 94.4 0.1 0.0 1.7 0.3 0.1 0.0 0.1 0.0 0.0 0.1
Predicted spatial distribution of red pine CUBIC FOOT volume of trees with a diameter of 5 inches and greater.
Maps are constructed using interpolative procedures among FIA plots. This map doesn’t necessarily indicate where
individual trees of a species are found, but rather where individual trees of a certain species are dense enough to
represent a large enough volume warranting depiction. Red pine
Source: 2010 FIA database provided by USFS, Northern Research Station
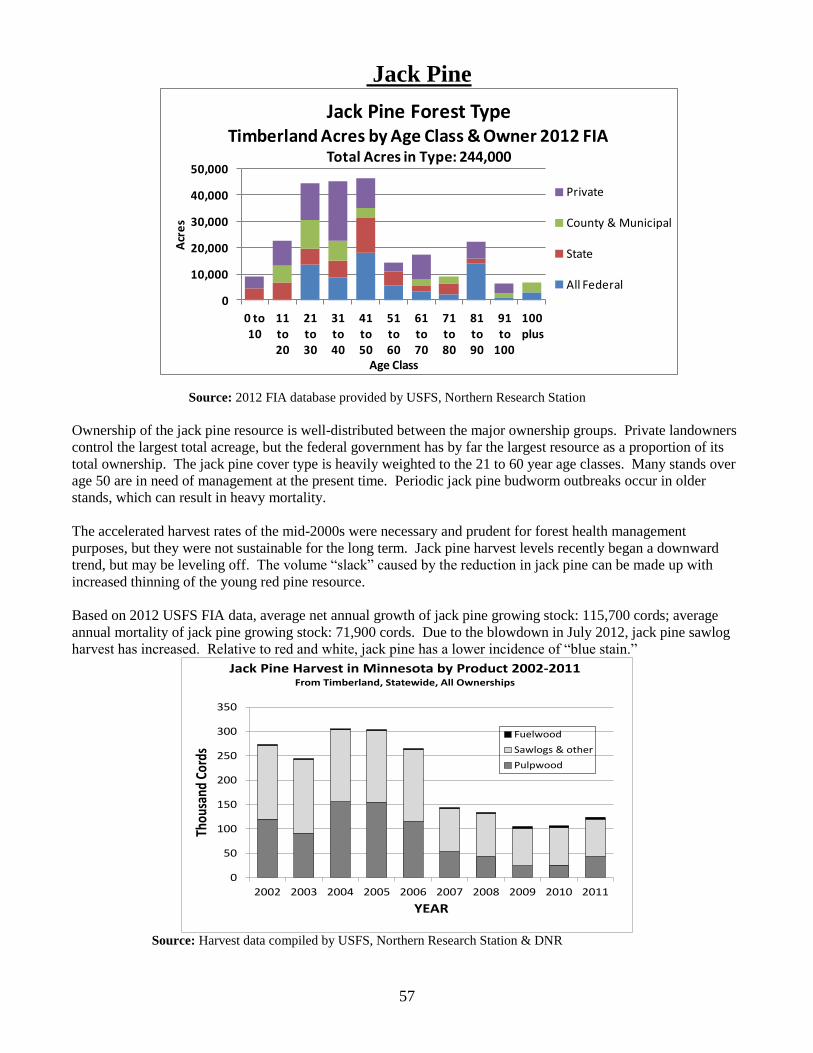
57
Jack Pine
0
10,000
20,000
30,000
40,000
50,000
0 to 10
11 to 20
21 to 30
31 to 40
41 to 50
51 to 60
61 to 70
71 to 80
81 to 90
91 to
100
100 plus
Acr
es
Age Class
Jack Pine Forest Type Timberland Acres by Age Class & Owner 2012 FIA
Total Acres in Type: 244,000
Private
County & Municipal
State
All Federal
Source: 2012 FIA database provided by USFS, Northern Research Station
Ownership of the jack pine resource is well-distributed between the major ownership groups. Private landowners
control the largest total acreage, but the federal government has by far the largest resource as a proportion of its
total ownership. The jack pine cover type is heavily weighted to the 21 to 60 year age classes. Many stands over
age 50 are in need of management at the present time. Periodic jack pine budworm outbreaks occur in older
stands, which can result in heavy mortality.
The accelerated harvest rates of the mid-2000s were necessary and prudent for forest health management
purposes, but they were not sustainable for the long term. Jack pine harvest levels recently began a downward
trend, but may be leveling off. The volume “slack” caused by the reduction in jack pine can be made up with
increased thinning of the young red pine resource.
Based on 2012 USFS FIA data, average net annual growth of jack pine growing stock: 115,700 cords; average
annual mortality of jack pine growing stock: 71,900 cords. Due to the blowdown in July 2012, jack pine sawlog
harvest has increased. Relative to red and white, jack pine has a lower incidence of “blue stain.”
0
50
100
150
200
250
300
350
2002 2003 2004 2005 2006 2007 2008 2009 2010 2011
Thou
sand
Cor
ds
YEAR
Jack Pine Harvest in Minnesota by Product 2002-2011From Timberland, Statewide, All Ownerships
Fuelwood
Sawlogs & other
Pulpwood
Source: Harvest data compiled by USFS, Northern Research Station & DNR

58
0
500,000
1,000,000
1,500,000
2,000,000
5.0-6.9
7.0-8.9
9.0-10.9
11.0-12.9
13.0-14.9
15.0-16.9
17.0-18.9
19.0-20.9
21.0-28.9
29.0+
Cord
s
Diameter Class
Jack Pine SpeciesVolume All Live by Diameter Class 1990 and 2012 FIA
Total Volume All Live (Cords): 1990: 7,266,000 2012: 3,922,500
1990
2012
Source: FIA database provided by USFS, Northern Research Station
Jack pine total volume of all live has declined from 7,266,000 cords in 1990 to 3,922,500 cords in 2012 – a 46%
decrease.
The vast majority of jack pine volume is found in trees with diameters smaller than 15 inches.
The table below shows AVERAGE percent species compositions by merchantable volume (5 inch dbh and greater
to a 4 inch top DOB) by percent of basal area per acre that is Jack Pine ON FIA PLOTS. This table shows that a
Jack pine forest type can differ significantly and provides some idea of what other species can be harvested within
these forest types. This is FIA Jack Pine Forest Type. Acres Statewide provides some idea of the relative nature
of different percent species compositions within a particular forest type. Only FIA plots age 20 and older were
included.
Percent
of BAA
Acres
Statewide
Balsam
Fir Tamarack
White
Spruce
Black
Spruce
Jack
Pine Red Pine
Eastern
White
Pine
White
Cedar Aspen
Paper
Birch Balm Basswood
American
Elm Maple Ash Oak
< 25% 12,046 8.0 0.0 0.0 0.0 8.2 24.9 6.6 0.0 24.8 2.2 0.1 0.0 0.0 0.0 0.0 24.5
25-50% 65,913 9.1 0.0 3.5 12.6 43.3 11.8 3.2 0.5 8.9 5.2 0.8 0.0 0.0 0.6 0.1 0.2
50-75% 67,021 4.5 1.3 1.5 3.8 68.5 5.2 3.2 0.0 6.7 3.9 0.0 0.0 0.5 0.1 0.6 0.1
>75% 70,995 2.7 0.1 0.4 1.9 89.2 1.8 0.0 0.0 3.4 0.2 0.0 0.0 0.0 0.0 0.0 0.3
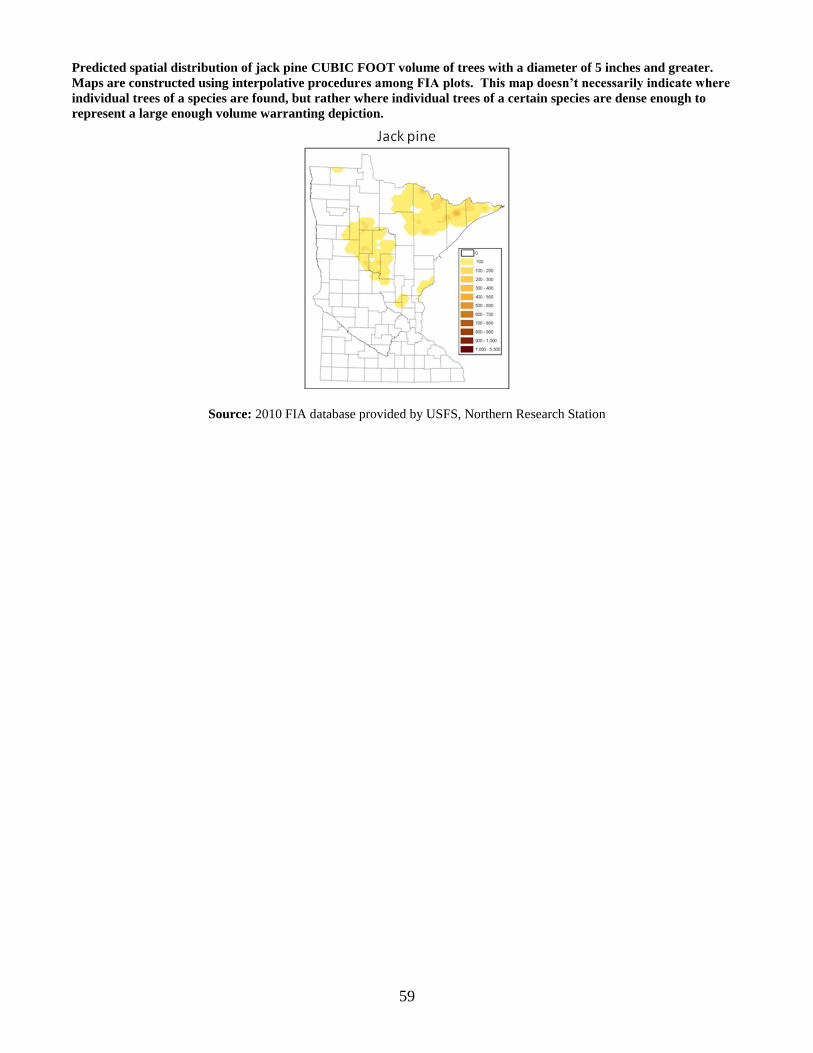
59
Predicted spatial distribution of jack pine CUBIC FOOT volume of trees with a diameter of 5 inches and greater.
Maps are constructed using interpolative procedures among FIA plots. This map doesn’t necessarily indicate where
individual trees of a species are found, but rather where individual trees of a certain species are dense enough to
represent a large enough volume warranting depiction.
Source: 2010 FIA database provided by USFS, Northern Research Station

60
White Pine
05,000
10,00015,00020,00025,00030,00035,00040,000
0 to 10
11 to 20
21 to 30
31 to 40
41 to 50
51 to 60
61 to 70
71 to 80
81 to 90
91 to
100
100 plus
Acr
es
Age Class
White Pine Forest Type Timberland Acres by Owner & Age Class 2012 FIA
Total Acres in Forest Type: 161,000
Private
County & Municipal
State
All Federal
Source: 2012 FIA database provided by USFS, Northern Research Station
The cover type is heavily weighted to age classes of 60 years plus. National forests and private landowners are
by far the predominant ownership groups for the white pine cover type.
0
2,000,000
4,000,000
6,000,000
8,000,000
10,000,000
12,000,000
14,000,000
16,000,000
1987 1990 1993 1997 2001 2004 2007 2010
Boa
rd F
eet
Year
White Pine Sawtimber Harvest in Minnesota1987 to 2010
Source: MN DNR sawmill surveys
Most white pine volume occurs in the white pine, red pine, aspen and northern hardwoods cover types. The vast
majority of white pine volume is in trees with diameters greater than 15 inches. Volume has increased
substantially since the 1990 inventory. Based on 2012 FIA data, average net annual growth of white pine
growing stock: 187,000 cords; average annual mortality: 43,600 cords.
Due to the blowdown in July 2012, white pine sawlog harvest has increased. Much of it contains “blue stain”
which can decrease stumpage and product value.
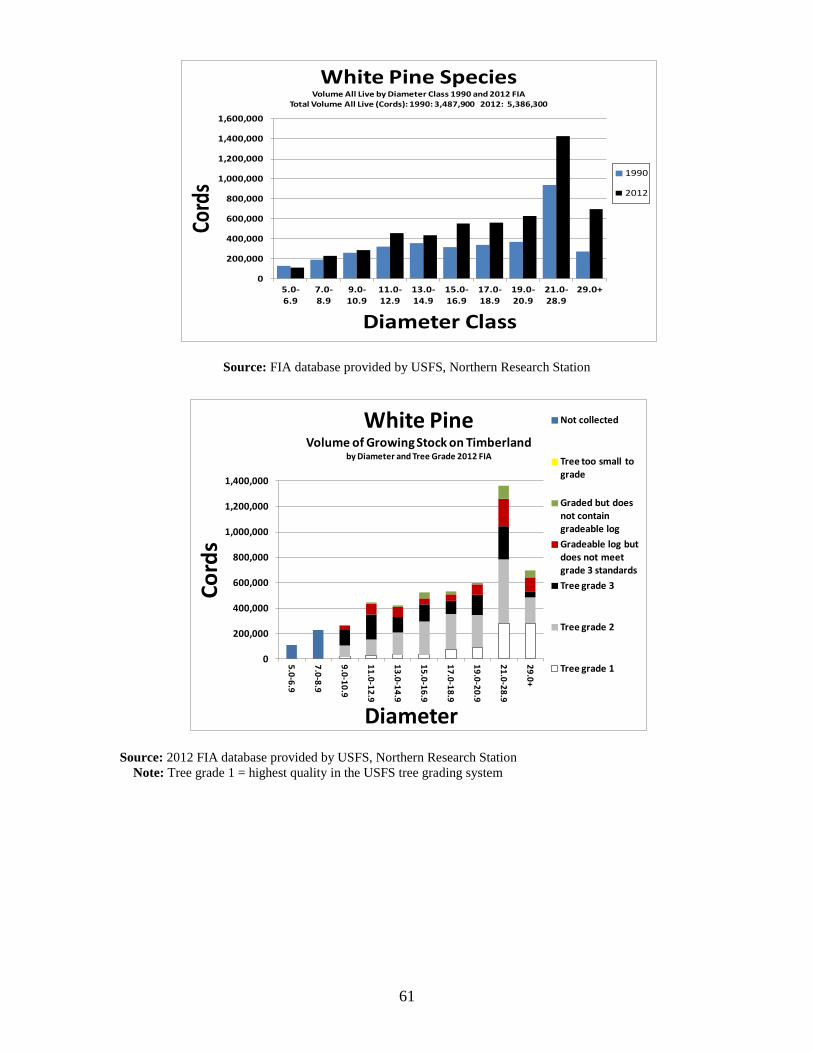
61
0
200,000
400,000
600,000
800,000
1,000,000
1,200,000
1,400,000
1,600,000
5.0-6.9
7.0-8.9
9.0-10.9
11.0-12.9
13.0-14.9
15.0-16.9
17.0-18.9
19.0-20.9
21.0-28.9
29.0+
Cord
s
Diameter Class
White Pine SpeciesVolume All Live by Diameter Class 1990 and 2012 FIA
Total Volume All Live (Cords): 1990: 3,487,900 2012: 5,386,300
1990
2012
Source: FIA database provided by USFS, Northern Research Station
0
200,000
400,000
600,000
800,000
1,000,000
1,200,000
1,400,000
5.0
-6.9
7.0
-8.9
9.0
-10
.9
11
.0-1
2.9
13
.0-1
4.9
15
.0-1
6.9
17
.0-1
8.9
19
.0-2
0.9
21
.0-2
8.9
29
.0+
Co
rds
Diameter
White PineVolume of Growing Stock on Timberland
by Diameter and Tree Grade 2012 FIA
Not collected
Tree too small to grade
Graded but does not contain gradeable log
Gradeable log but does not meet grade 3 standards
Tree grade 3
Tree grade 2
Tree grade 1
Source: 2012 FIA database provided by USFS, Northern Research Station
Note: Tree grade 1 = highest quality in the USFS tree grading system
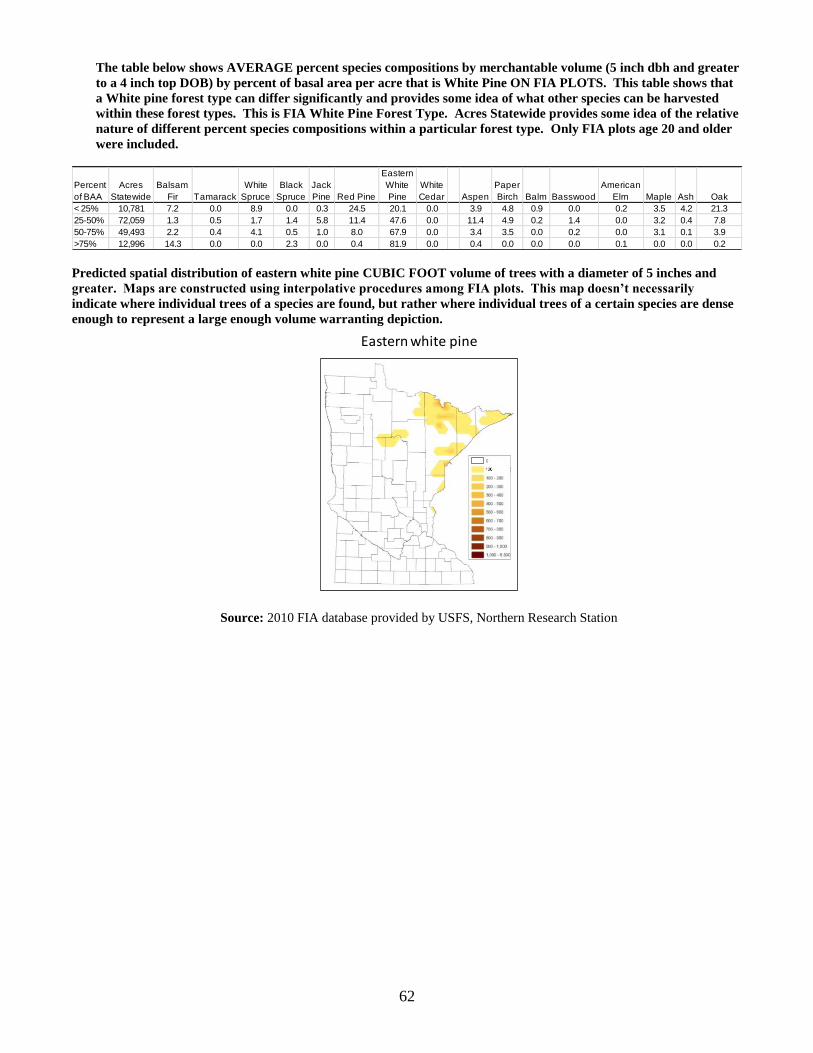
62
The table below shows AVERAGE percent species compositions by merchantable volume (5 inch dbh and greater
to a 4 inch top DOB) by percent of basal area per acre that is White Pine ON FIA PLOTS. This table shows that
a White pine forest type can differ significantly and provides some idea of what other species can be harvested
within these forest types. This is FIA White Pine Forest Type. Acres Statewide provides some idea of the relative
nature of different percent species compositions within a particular forest type. Only FIA plots age 20 and older
were included.
Percent
of BAA
Acres
Statewide
Balsam
Fir Tamarack
White
Spruce
Black
Spruce
Jack
Pine Red Pine
Eastern
White
Pine
White
Cedar Aspen
Paper
Birch Balm Basswood
American
Elm Maple Ash Oak
< 25% 10,781 7.2 0.0 8.9 0.0 0.3 24.5 20.1 0.0 3.9 4.8 0.9 0.0 0.2 3.5 4.2 21.3
25-50% 72,059 1.3 0.5 1.7 1.4 5.8 11.4 47.6 0.0 11.4 4.9 0.2 1.4 0.0 3.2 0.4 7.8
50-75% 49,493 2.2 0.4 4.1 0.5 1.0 8.0 67.9 0.0 3.4 3.5 0.0 0.2 0.0 3.1 0.1 3.9
>75% 12,996 14.3 0.0 0.0 2.3 0.0 0.4 81.9 0.0 0.4 0.0 0.0 0.0 0.1 0.0 0.0 0.2
Predicted spatial distribution of eastern white pine CUBIC FOOT volume of trees with a diameter of 5 inches and
greater. Maps are constructed using interpolative procedures among FIA plots. This map doesn’t necessarily
indicate where individual trees of a species are found, but rather where individual trees of a certain species are dense
enough to represent a large enough volume warranting depiction. Eastern white pine
Source: 2010 FIA database provided by USFS, Northern Research Station

63
Minnesota’s White Cedar Resource
Northern white cedar is a slow-growing, long-lived conifer. The white cedar cover type in Minnesota is located
largely in the northeastern 1/3 of the state and is made up of a variety of species. Cover type volume is dominated
by white cedar, but includes spruce, tamarack, balsam fir, birch, ash and several other minor species. Significant
volumes of cedar can also be found mixed with other lowland cover types and it also exists as a minor component
of some upland cover types. Cedar is significant because it provides critical habitat for white-tailed deer and for
many rare plant species including the threatened ram’s head orchid, and because it is a potentially valuable timber
resource.
050,000
100,000150,000200,000250,000300,000350,000
0 to 10
11 to 20
21 to 30
31 to 40
41 to 50
51 to 60
61 to 70
71 to 80
81 to 90
91 to
100
100 plus
Acr
es
Age Class
White Cedar Forest Type Timberland Acres by Owner & Age Class 2012 FIA
Total Acres in Forest Type: 604,000
Private
County & Municipal
State
All Federal
Source: 2012 FIA database provided by USFS, Northern Research Station
White cedar is generally an old resource, and it is getting older: around 293,000 cover type acres exist in stands
over age 100, with less than 8,800 cover type acres below age 30. Much of the white cedar resource exists on
very wet sites, many of which have low productivity and slow growth. High amounts of heart rot are common in
older stands on wet sites. Much of the volume of white cedar is contained in material below 13 inches in
diameter.
8.2
5.5
7.28.8
4.6
0
2
4
6
8
10
1997 2001 2004 2007 2010
Tho
usa
nd
Co
rds
Year
White Cedar Harvest in Minnesota1997 - 2010
Source: Harvest data compiled by USFS, Northern Research Station & DNR
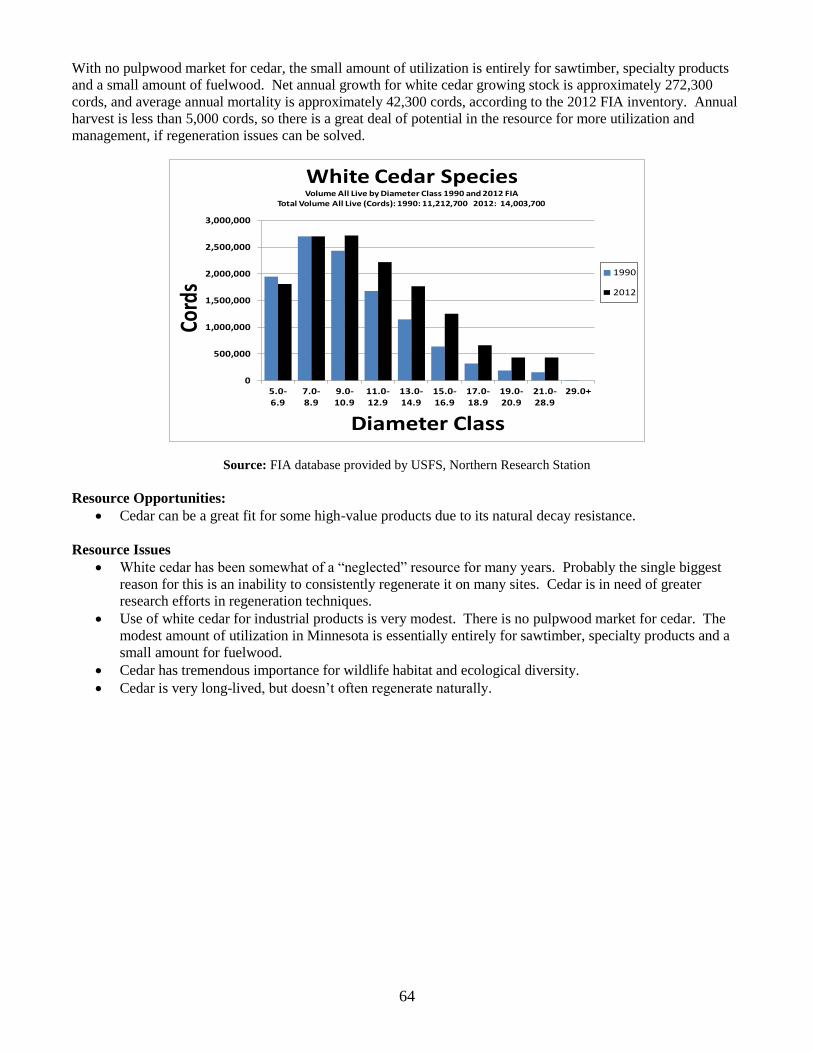
64
With no pulpwood market for cedar, the small amount of utilization is entirely for sawtimber, specialty products
and a small amount of fuelwood. Net annual growth for white cedar growing stock is approximately 272,300
cords, and average annual mortality is approximately 42,300 cords, according to the 2012 FIA inventory. Annual
harvest is less than 5,000 cords, so there is a great deal of potential in the resource for more utilization and
management, if regeneration issues can be solved.
0
500,000
1,000,000
1,500,000
2,000,000
2,500,000
3,000,000
5.0-6.9
7.0-8.9
9.0-10.9
11.0-12.9
13.0-14.9
15.0-16.9
17.0-18.9
19.0-20.9
21.0-28.9
29.0+
Cord
s
Diameter Class
White Cedar SpeciesVolume All Live by Diameter Class 1990 and 2012 FIA
Total Volume All Live (Cords): 1990: 11,212,700 2012: 14,003,700
1990
2012
Source: FIA database provided by USFS, Northern Research Station
Resource Opportunities:
Cedar can be a great fit for some high-value products due to its natural decay resistance.
Resource Issues
White cedar has been somewhat of a “neglected” resource for many years. Probably the single biggest
reason for this is an inability to consistently regenerate it on many sites. Cedar is in need of greater
research efforts in regeneration techniques.
Use of white cedar for industrial products is very modest. There is no pulpwood market for cedar. The
modest amount of utilization in Minnesota is essentially entirely for sawtimber, specialty products and a
small amount for fuelwood.
Cedar has tremendous importance for wildlife habitat and ecological diversity.
Cedar is very long-lived, but doesn’t often regenerate naturally.

65
The table below shows AVERAGE percent species compositions by merchantable volume (5 inch dbh and greater
to a 4 inch top DOB) by percent of basal area per acre that is Northern White Cedar ON FIA PLOTS. This table
shows that a NWC forest type can differ significantly and provides some idea of what other species can be
harvested within these forest types. This is FIA NWC Forest Type. Acres Statewide provides some idea of the
relative nature of different percent species compositions within a particular forest type. Only FIA plots age 35
and older were included.
Percent
of BAA
Acres
Statewide
Balsam
Fir Tamarack
White
Spruce
Black
Spruce
Jack
Pine Red Pine
Eastern
White
Pine
White
Cedar Aspen
Paper
Birch Balm Basswood
American
Elm Maple Ash Oak
< 25% 3,361 7.0 0.0 0.0 0.0 0.0 0.0 0.0 11.9 42.2 0.0 7.8 0.0 25.3 0.0 5.8 0.0
25-50% 82,759 6.6 10.3 1.9 11.2 0.0 0.0 1.9 46.2 4.6 10.1 1.7 0.0 0.0 1.2 2.7 0.0
50-75% 253,045 5.3 8.1 1.5 5.5 0.0 0.2 0.6 67.6 2.0 4.5 0.9 0.0 0.1 0.1 3.0 0.0
>75% 253,418 2.1 3.4 0.2 2.6 0.0 0.0 0.0 87.4 0.2 1.9 0.4 0.0 0.0 0.0 1.2 0.0
Predicted spatial distribution of northern white cedar CUBIC FOOT volume of trees with a diameter of 5 inches
and greater. Maps are constructed using interpolative procedures among FIA plots. This map doesn’t
necessarily indicate where individual trees of a species are found, but rather where individual trees of a certain
species are dense enough to represent a large enough volume warranting depiction.
Northern white cedar
Source: 2010 FIA database provided by USFS, Northern Research Station
66
Timber Price
Information
Average Prices Received by Product for Stumpage Sold by Public Land Agencies in Minnesota:
2000-2012

67
Average Prices Received for Stumpage Sold
by Public Land Agencies in Minnesota: 2000-2012
Notes:
Average prices based on those reported by Minnesota Counties (Aitkin, Becker, Beltrami, Carlton, Cass,
Clearwater, Crow Wing, Hubbard, Itasca, Koochiching, Lake, Pine, and St. Louis), USDA Chippewa and
Superior National Forests, USDI Bureau of Indian Affairs, and Minnesota DNR- Division of Forestry.
Agency specific prices are available on the DNR website, in the annual “Minnesota Public Stumpage Price
Review” at http://www.dnr.state.mn.us/forestry/timbersales/stumpage.html
Reporting agencies have different fiscal years and different product specifications. Some agencies report their
data based on appraised volume estimates, others report based on actual scale receipts. All prices presented as
reported.
The reported sales data includes numerous different products and units of measure. Conversion factors used:
500 BF/ Cd for hardwoods, 400 BF/ Cd for softwoods.
Use caution when comparing prices shown in these tables with actual prices received or expected on any
specific timber sale. For recent timber stumpage prices, readers can go to the DNR website and view recent
auction results at http://www.dnr.state.mn.us/forestry/timbersales/index.html.
Species 2000 2001 2002 2003 2004 2005 2006 2007 2008 2009 2010 2011 2012
Aspen 25.28 28.76 27.36 28.95 37.20 59.70 47.52 27.50 26.14 23.07 25.16 25.55 25.58
Balm 25.27 32.06 27.53 25.12 31.71 45.25 38.85 17.00 21.18 20.83 21.22 20.01 22.77
Birch 7.69 8.31 8.16 9.04 12.21 20.57 14.76 9.68 9.06 9.17 8.48 9.41 9.31
Ash 4.09 3.91 5.86 3.62 5.51 5.43 8.22 6.21 6.86 8.73 6.97 7.41 6.26
Oak 9.27 7.74 5.77 4.35 8.28 16.28 18.27 16.23 8.39 15.32 13.41 11.29 11.69
Basswood 5.68 5.48 6.51 6.05 6.58 10.64 8.06 10.35 7.41 8.10 7.50 7.58 6.61
Balsam Fir 14.84 14.61 13.99 13.46 21.12 33.54 30.56 18.36 15.98 14.67 16.10 17.91 14.19
W. Spruce 32.63 29.90 30.51 21.87 31.80 43.39 35.06* 21.49 18.69* 17.91 15.12
B. Spruce 22.23 29.17 27.05 31.96 31.50 43.39 35.06* 21.49 20.05 23.14 17.77
Tamarack 5.67 6.40 4.11 4.56 6.42 9.84 5.96 3.18 4.61 5.01 5.03 5.51 6.20
W. Cedar 8.46 6.74 7.06 4.68 4.60 5.50 9.26 6.39 4.10 5.44 6.19 8.21 5.12
J. Pine 21.94 21.63 22.18 21.37 29.46 30.66 37.62 28.50 9.87 13.02 17.21 8.06 16.03
R&W Pine 18.61 20.79 20.99 19.55 19.18 29.06 36.59 27.15 11.99 16.22 9.08 18.06 10.33
Maple --- --- --- --- --- 13.30 7.98 7.91 8.86 8.06 9.21 8.99 8.18
17.44*
Pulpwood ($ per cord)
---Insufficient data.
21.58*
* Spruce Species
In 2012, across all species and as reported on public lands, a total of 73,524 tons of biomass was sold for
bioenergy consumption with an average price of $0.88 per ton.

68
Species 2000 2001 2002 2003 2004 2005 2006 2007 2008 2009 2010 2011 2012
Aspen 28.66 34.33 30.80 34.52 40.94 65.14 45.58 28.44 37.63 36.79 --- --- ---
Balm 25.41 32.57 28.35 28.21 34.15 47.09 34.73 23.70 --- --- --- --- ---
Birch 9.45 10.40 10.18 12.61 16.28 24.99 17.70 10.99 16.30 13.01 14.48 15.54 14.24
Ash 10.01 11.52 10.01 9.84 13.42 21.76 12.98 7.65 20.96 10.10 17.41 18.23 18.39
Oak 25.35 24.33 32.32 34.50 26.26 42.24 25.47 20.85 22.12 21.25 21.49 19.95 20.45
Basswood 17.00 18.87 16.94 18.34 19.46 23.89 18.21 10.98 16.87 11.62 13.15 10.70 11.58
Balsam Fir 19.87 24.01 20.53 23.04 26.76 41.38 30.57 21.47 22.77 21.91 23.44 20.39 20.78
W. Spruce 34.25 33.84 34.88 35.86 41.67 48.03 31.38 30.29 28.82 24.99 24.00
B. Spruce 23.04 30.01 27.65 31.96 32.88 48.03 31.38 30.29 --- --- 26.91
Tamarack 6.60 7.37 4.55 5.21 6.96 10.07 9.31 5.40 --- --- --- --- 16.57
W. Cedar 8.32 8.68 7.91 6.16 5.98 7.47 13.48 9.35 13.98 11.65 --- --- ---
J. Pine 30.39 37.95 36.76 38.20 41.75 50.81 49.49 32.07 30.28 25.41 28.34 28.03 29.84
R&W Pine 53.35 43.89 40.01 39.13 39.76 55.17 45.98 33.52 27.51 29.32 31.04 36.36 31.87
Maple --- --- --- --- --- 16.30 12.36 8.30 17.59 16.59 17.41 13.86 12.94
** Spruce Species
---Insufficient data.
Pulp & Bolts in Combination*
($ per cord)
23.37** 26.54**
*A bolt is defined as a short log, usually 100” length, with a specific minimum top diameter, generally sawn for lumber.
Species 2000 2001 2002 2003 2004 2005 2006 2007 2008 2009 2010 2011 2012
Aspen 102.28 114.11 103.19 109.91 128.77 190.44 --- --- 43.64 51.11 33.67 52.11 53.48
Birch 43.17 50.48 55.87 72.34 94.41 128.30 52.06 27.24 32.04 19.82 38.92 42.15 35.70
Ash 71.39 81.97 66.85 76.60 99.56 144.62 --- 38.21 42.41 51.89 56.27 58.09 36.12
Elm --- 44.10 69.00 62.08 53.82 86.52 --- 85.22 60.08 53.99 45.08 60.43 42.45
Oak** 109.53 118.72 151.77 150.04 145.57 185.90 378.03 182.83 271.04 193.61 243.09 232.20 225.36
Basswood 70.25 81.24 80.43 94.47 112.30 133.10 124.73 97.73 97.33 66.24 63.47 66.11 55.87
Balsam Fir 120.65 144.20 136.32 145.47 167.74 244.43 --- 76.47 72.75 58.34 --- --- ---
Spruce 90.00 91.27 94.95 101.81 131.34 204.73 113.02 96.41 81.57 87.05 102.15 64.23 83.12
W. Cedar 19.96 30.46 29.43 24.73 27.34 26.38 153.14 --- --- --- --- --- ---
J. Pine 114.86 154.35 155.76 135.43 168.66 184.79 124.11 115.21 109.95 106.19 --- 145.76 138.95
R&W Pine 176.01 170.13 153.78 153.10 139.41 181.21 143.45 114.04 119.51 107.40 123.36 140.45 121.15
Maple --- --- --- --- --- 131.53 206.45 137.17 150.62 81.48 219.83 160.78 292.13
($ per Thousand Board Feet)*
Sawtimber
*Includes veneer for certain hardwood species.
**Primarily from public lands in Southeastern Minnesota.
---Insufficient data.

69
Glossary
BIA – Bureau of Indian Affairs Cover Type – A classification of forest land, typically an individual stand, based on the species forming a plurality of live tree stocking. CSA – Cooperative Stand Assessment. This is the inventory system used on state-owned land. Different
vegetative stands are mapped using aerial photography and ground checks. Variable radius sample plots are
distributed throughout each cover type and measured on the ground. A variety of information on stand condition
is collected. Variables such as timber volumes, species mixes and insect and disease damage for the state forest
and wildlife management areas can be determined using CSA data.
Cull – Portions of a tree that are unusable for industrial wood products because of rot, form, missing or dead
material, or other defect. FIA – Forest Inventory & Analysis. In this inventory, permanent plots are remeasured. Under an older system,
where all existing FIA plots were measured during the same year, field remeasurements were last completed in
1977 and 1990. A new system is now used. Rather than measuring all plots during one year, basically 20% of all
plots are remeasured annually, referred to as a panel. Hence, all existing plots are remeasured during a five-year
period, referred to as a cycle. Three complete cycles have been completed, Cycle 12 (panels of 1999, 2000, 2001,
2002, and 2003), Cycle 13 (panels of 2004, 2005, 2006, 2007, and 2008), and Cycle 14 (panels of 2009, 2010,
2011, 2012, and 2013). FIA is a cooperative effort between the USDA Forest Service and Minnesota DNR.
FIA provides extremely important information on the condition of the forest resource. Variables such as timber
volumes, species mixes, and changes to the forest resource over time can all be determined using FIA data. It is
the only way to track condition and changes over time for non-industrial private woodlands and is the only way to
get comprehensive data across all ownerships. Growing Stock Trees – Live trees of commercial species excluding cull trees.
MAI – Mean Annual Increment. The average annual increase in volume of a stand at a specified point in time.
MAI changes with different growth phases in a tree’s life, generally being highest in the middle ages &
decreasing with age. The point at which MAI peaks is sometimes used as a guide to identify biological maturity
and a stand’s readiness for harvesting.
NRS – Northern Research Station. This is where the FIA unit of the USFS is located. These are the folks that, in
cooperation with state DNR, accomplish the FIA inventory and Timber Product Output surveys. Without them,
very little of the information in this document would be available.
NIPF – Non-Industrial Private Forest Land. Forest land owned privately by people or groups not involved in
forest industry. More recently referred to by some as Family Forest Owners. Primary Forest Industry Manufacturers – Refers to initial processors of trees, including producers of 1. Solid
wood products (lumber, veneer), 2. Engineered wood products, 3. Pulp and paper, 4. Specialty products, and 5.
Wood energy. These primary products are often inputs into “secondary” or “value-added” products.

70
Glossary (continued)
Pulpwood – Wood that is harvested and used by primary mills that make products from reconstituted wood fiber.
In addition to wood pulp, this includes particleboard and engineered lumber products made from chips, shavings,
wafers, flakes, strands and sawdust.
Real Estate Investment Trust (REIT) – an organization that acquires and manages income producing real estate
such as timberlands. Several criteria must be met to qualify as a REIT, one important requirement is that at least
90% of its taxable income must be distributed to shareholders in the form of dividends. A REIT structure is
advantageous for many reasons, a large one is that earnings are considered capital gains which are taxed at a
maximum rate of 15%, as opposed to corporate income tax rates such as 35%.
Rotation Age – Age at which a stand is generally considered mature and ready for harvest. This age can vary
depending upon ownership objectives, e.g., desired products, previous treatments (such as thinning), economic
and market conditions, and other considerations such as the forest age class distribution and wildlife habitat
values. In reality, stands may be harvested earlier, at or beyond the specified rotation age.
Sawtimber – Wood that is harvested and used by sawmills. Secondary Forest Industry Manufacturers – Are those that use inputs from primary industry such as lumber to
further process or manufacture “value-added” products such as cabinets, pallets and many others.
Stumpage – The amount paid to the landowner for the right to cut and remove specified standing timber.
Timberland – Forest land that is producing, or is capable of producing, more than 20 cubic feet per acre per year
of industrial wood crops, that is not withdrawn from timber utilization by policy or law.
Timberland Investment Management Organization (TIMO) – an organization that acquires and manages
timberland investments on behalf of others. Although these organizations generally possess large amounts of
acreage, they differ from REITs and vertically-integrated timberland-owning companies in that they hold
timberlands for the financial value of the land and timber rather than as a source of raw material for company-
owned mills.
USDA – United States Department of Agriculture.
USFS – United States Department of Agriculture - Forest Service.
Conversion Factors
Conversion factors used in the preparation of this report:
1 cord = 500 board feet
1 cord = 79 cubic feet