forest resources - fsifsi.nic.in/inventory_report/dadarhaveli/forest resources of dadra... ·...
TRANSCRIPT
\'rl-D M U'
FOREST RESOURCES
OF
DADRA &. NAGAR HA VELI
(UNION TERRITORY)
FOREST SURVEY OF INDIA
CENTRAL ZONE
NAGPUR
1991
FeR GFf1ClAL USE .NIX M-..D M IJ-'
FOREST RESOURCES
OF
DAl)RA & NAGAR HAVELI
(UNION TERRITORY)
FOREST SURVEY OF INDIA
CENTRAL ZONE
NAGPUR
1991
£B.E~A.c.E
This report contains the results of inventory
carried out by the Central Zone of Forest Survey of India in
the Union Terri tory of Dadra and Nagar Ha.vel i.
The field work was carried out in two stages,
firstly in the month of October.rI98S/and ~hen in January
Februa.ry t198~1__,A total of 62 plots were inventoried in the
entire t;;ritory spread overl19935 . 42 ha\ forest area. The
inventory was followed by the wood consumption studies.
The inventory results reveal that the union
territory has an aver~e growing stock of 52.995 '3 m per
hectare. The crop composition is mainly of teak and mixed
speoies. The regeneration of important forest speoies is
absent in about 8~ of the area. The grazing inoidenoe too
is quite hi~h. Same is the case with fire incidenoe. The
stook at bamboo is almost insignificant. I hope this report
will prove useful to the Forest Department of the Union
Territory.
The report haG been compiled by Shri Anil Bials,
Junior Technical Assistant under the guidance of Shri S.C.
Gupte, IFS., Joint Director,Forest Survey of India,
Zone. Nagpur.
DIRECTOR. FOREST SURVEY OF INDIA
DEHRADUN
Central '
. .
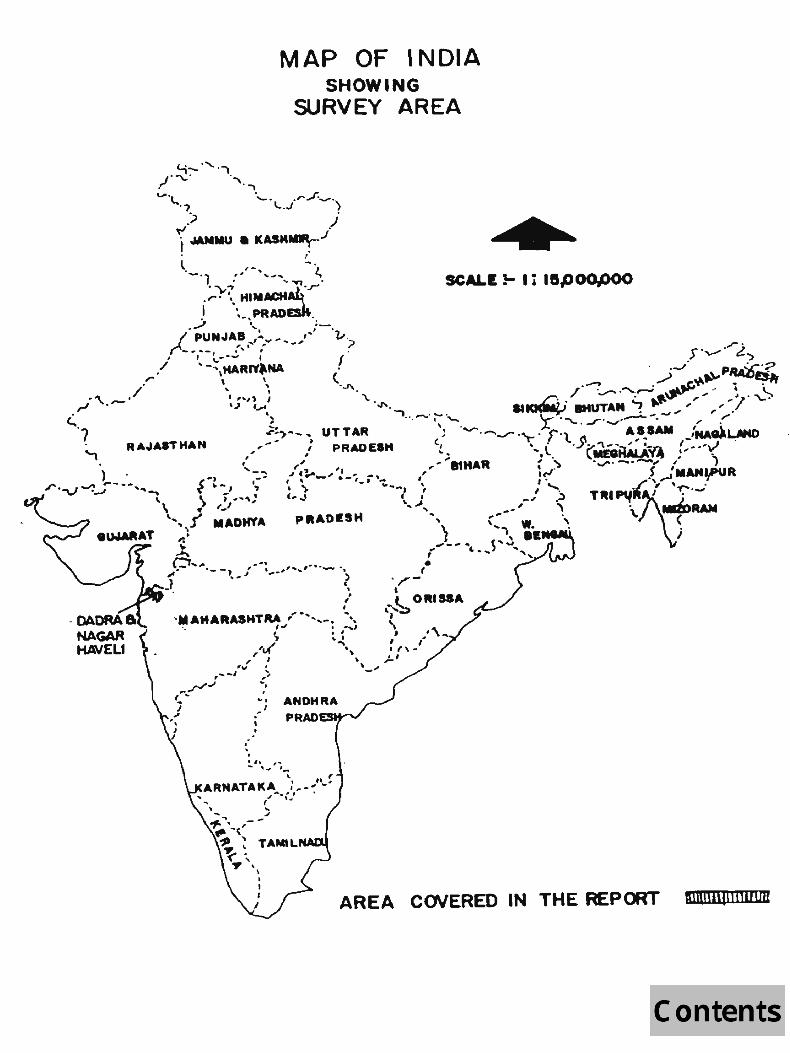
MAP OF I NOlA SHOWING
SURVEY AREA
SCALE !- I. ISPOOPOO
:"'\.., '~-
AREA COVERED IN THE REPORT ttlQmW!llUUU
15
46-HD~-
16
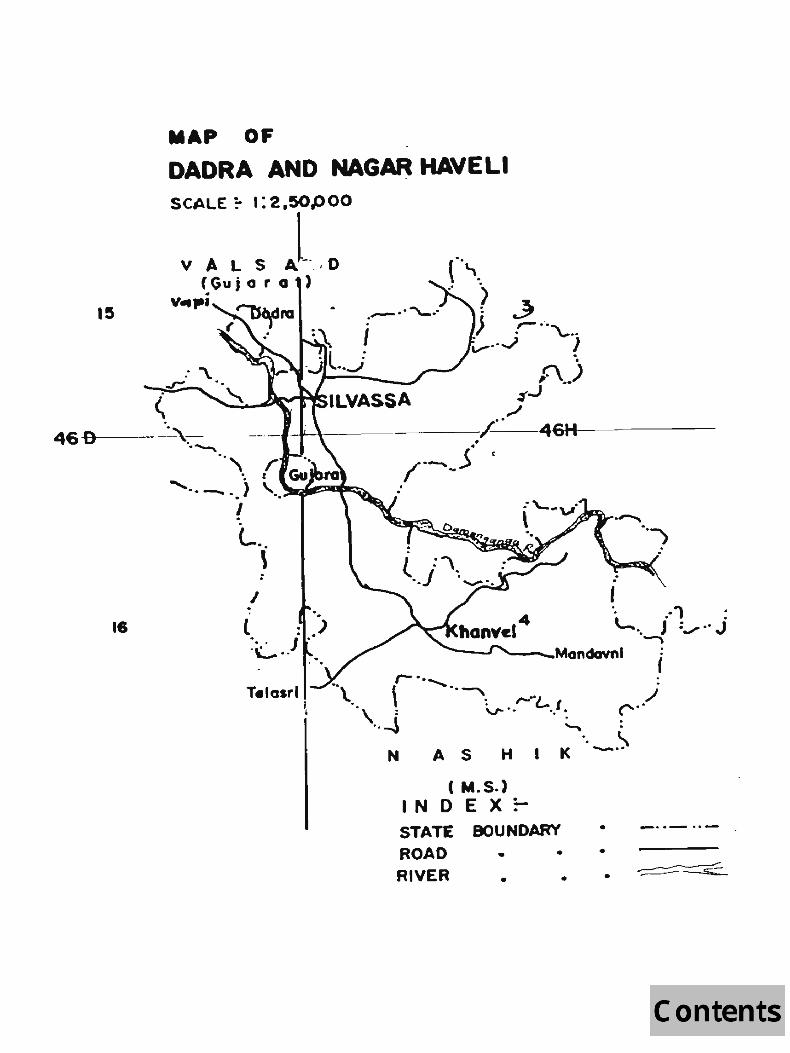
MAP OF
DADRA AND NAGAR HAVELI SCALE :- I: 2 .50P 00
VALS j--.D (Gu jar a )
v .... i ~ ... U¥IQ A
( ." :l i . L . - .. J
C"'. .' "> ~~ ) ,- •.. \_.
"" .. ..) "j . . {\ )
~..J •• ,/
~~----------/--"--~4~t6~H~---------
J .
/o-._Soo .
., . L.... i:..,·· j
""-'"'l
{ r- ..........
\. \ "~ . : ,... .. l- .I
\,.j va- " "I ~ f" " l..
N ASH I K _.,
( M. S.) INDEX:-STATE BOUNDARY . ..... .. - .. -ROAD RIVER
•
•
• •
• •
INDEX
--------~-~~-----~------------------------------~----------Para Contents ------------------------------------------------------------
Map of India showing ·the survey area Detailed map of D8dr.a and Nagar Haveli.
------------------------------------------------------------CHAPTER -I INTRODUCTION
---------------------------~--------~-----------------------1.0 1.1 1.2 1.3 1.4 1.5 1.6 1.7 1.8 1.9 1.10
General 1 Situation and boundaries 1 Administrative units and ·area 1 Climate and rainfall 2 Topography 2 Drainage 2 Geology, rock and soi 1 3 Land-usB pattern 3 Socio-economic cond i tion 3 . Infrastructure 5 Forest produce and forest based industries 5
------------------------------------------------------------CHAPTER - II THE FORESTS ------------------------------------------------------------2.0 2.1 2.2 2.3 2.4 2.5
General description Forest types Forest man&eelllcmt Dam8QB to forest' Rights and concessions Wild-life
6 6 7 8 9 9 ------------------------------------------------------------CHAPTER - III RESOURCES SURVEY METHODOLOGY
------------------------------------------------------------3.0 3.1 3.2
3.3 3.4 3.5 3.6-3.7 3.8
Objectives ot survey Area considered for survey Inventory des ign Diagram showing inventory design and layout of sample plots Location of plot on the ground Format for data collection Field work Field checking Maps and plots Consistency checking of field forms
10 10 10
12 13 13 15 16 16 16 . . ------------------------------------------------------------
CHAPTER - IV DATA PROCESSING ------------------------------------------------------------. .. .
4.0 4.1 4.2 4.3 4.4 4.4.1
Sampling design Data Data processing Area Volume estimation Volume equations
17 17 17 19 19 19
4.4.2 4.4.3 4.5 4.6 4.7
Enumerated tree volume Plot volumes Stand tables Stock tab leo Sampling error
21 21 21 21 21
------------------------------------------------------------CHAPTER - V INVENTORY RESULTS - AREA
-----------------~-------------------------------------------5.0 5.1 5.2 5.3
5.4
5.5
5.6
5.7 5.8 5.9 5.10 5. 11 5.12 5.13
Area 23 Forest area by land covers 23 Forest area by crop compositions 24 Area by crop compositions and topography classes 25 Area by crop compoaition3 and slope olasses 25 Area by crop compositions and soil-depth classes 26 Area by crop oompositions and top-height classes 26 Area by crop compositions & aize classes 27 Area by crop compositions & oanopy layers 27 Soil erosion 28 Regeneration status 28 Fire-incidence 28 Grazing-incidence 28 Bamboo occurrenoe 29
------------------------------------------------------------CHAPTER - VI INVENTORY RESULTS - GROWING STOCK
------------------------------------------------------------6.0 General 30 6.1 Total no. of stems and sterns per hectare;
Stratum Teak 30 6.2 Total no. of stems and stems per hectare;
Stt"atuw: MiGcellaneous 31 6.3 Total volume and volume per hectare;
Stratum: Teak 31 6.4 Total volurlle and volume per hectare;
Stratum: Miscellaneous 32 6.5 Combined growing stock in terms of stems 32 6.6. Combined growing stock in terms of volume 33 6.7 Standard error 34 ------------------------------------------------------------
G ROW I N G , S T 0 C K TAB L E S ------------------------------------------------------------6.1 A 6.1 B 6-.2 A 6.~ B 6.3 A 6.3 B 6.4 A 6.4 B 6.5 A
Stems '000; Stratum: Teak 35 Stems per hectare; Stratum: Teak 36 Stems '000'; Stratum Miscellaneous 37 Stems per hectare; Stratum: Miscellaneous 38 Volume '000'; StratuUJ Teak 39 Volume per hectare; Stratum: Teak 40 Volume '000'; Stratum: Miscellaneous 41 Volume per hectare; Stratum: Miscellaneous 42 Combined growing stock; Stems '000' 43
6.5 B 6.6.A 6.6 B
Combined growing stock; Stems per hectare 44 Combined growing stock; Volume, '000' 45 Combined, growing stock; Volume per hectare 46
------------------------------------------------------------WOOD CONSUMPTION STUDIES
--------------------------------------~---------------------CHAPTER - VII
47 47 47
7.0 7.1 7.2 7.3
7.4
7.5
7.6
General Population of Dadra & Nagar Haveli Methodology Estimated per capita annual ~ood consumption by income groups Esi;imated per capita annual wood consumptiorl irrespective of income, Estimation of preoent wood consuMption and future projection Projected requirements of timber and firewood for the year 1991
49
50
50
52
------------------------------------------------------------ANN E X U RES
------------------------------------------------------------Annexure I Glossary of local names with
corresponding botanical names of common trees', herbs. shrubs, grasses and bamboos found in Dadra and 'Nagar Haveli
Annexure II Bibliography
******
1.0 GENERAL;
CHAPTER-.1
INTRODUCTION
The tract dealt with in this report comprises of two enclaves - (i) Dadra and (ii) Nagar Haveli. The area is administered by the Union Government and is thus called union territory. This territory remained under the Portuguese colonial rule from the years 1783 to 1954. It was finally liberated on 2nd August, 1954 by the local nationalist workers. During the period from 1954 to 1962, the admini~tration of Dadre. and Nagar Haveli was run by the select~ village panchl1Yat members. In the year of 1962, it .... as declared. as unloT! terri tory under the Dadra and Nager Haveli Act, 1961 arld was integrated with the Indian Union. Consequently, the free Dadra and Nagar Haveli administration was succeeded by a for'mal statutory Admini stration headed by an Administrator.
SilVl1sse., the capital town of the 185 krns. fro!l! Bombay and 142 us . from Surat. is bounded on various sides as follows:
territory is The territory
1. North: Pardi and Dharampur talukas of Valsad district of Gu jare.t state.
2. East
3. South
4. West
1.1
Dharampur taluka of Valsad district of Gujerat state .
Dahanu and Jeweller ta.lukas of Thane district of Maharashtra state.
Dahanu taluka of Tha.ne district of Mahareshtra or,~te and Umargaon taluka of Gujarat ~~~te.
SITUATION ANQ BOUNDARIES;
The territory dealt with in this report is situatgd in .the wes~ern part of India between the parallels of 20-00' and 20 - 25' of North latitude and between the meridian 00' 72 -50' and 73 - 15' of East longitude.
1.2 ADMINISTRATIVE UNITS .liliD ~:
The territo~y comprises of two enclaves viz; Dadra and Nagar Haveli. The former consists of three villages and the,later 68 villages with the capital town of Silvessa which i s ~ non-mimi r.i Ph 1 town and is arlml n; ~t-,p.rP.d by a Vi 11 age Panchayat. This t.erritory is a. single district, singlf'1 taluka tf~rr'i r,c)t-.Y with Si 1 Vl\ssa t;.own HS i ts st~te, d isr.rict and
taluka headquarters. Total territory is 48882 ha. spread small territory of Gujarat administered by ten Group Gram
geographical are_a of the ·over two parts separated by a state. The territory is
Panchayats spread allover .
The total forest area under this territory 19935.42 ha. of Reserved. forests. Apart from -these 440 of road side plantations 8rld canal plantations are added Protected forests but these: protected forests are included in this survey.
is ha. as
not
The whole of the forest area ·is administered by a single Forest Division with headquarter at Silvassa.
1.3 CLIMATE AND RAINFALL:
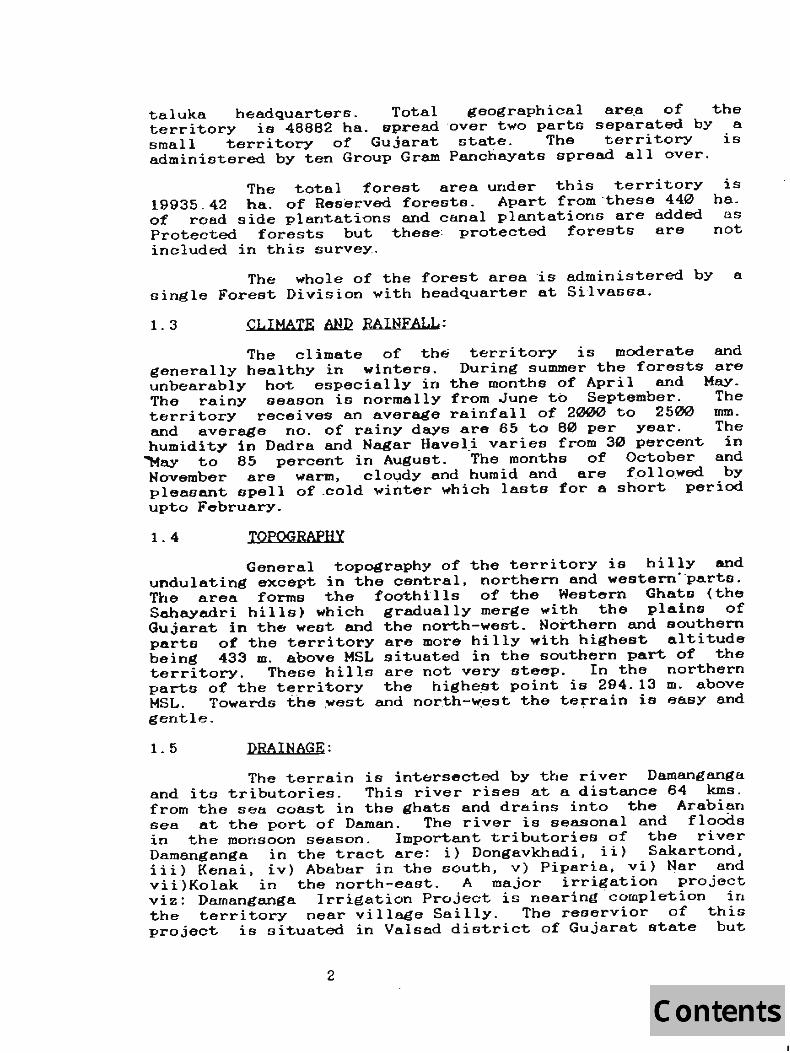
The climate of the territory is moderate and generally healthy in winters. During summer the forests are unbearably hot especially in the months of April and May. The rainy season is normally from June to September. The territory receives an average rainfall of 2000 to 2500 mm. and average no. of rainy days are 65 to 80 per year . The humidity in Dadra and Nagar Havel_i varies from 30 percent in ~ay to 85 percent in August. The months of October and November are 'Warm, cloudy and humid and are f .ollo_wed by pleasant apell of .cold winter 'Which lasts for a short period upto February.
1.4 TOPOGRAPHY
General topography of the territory is hilly and undulating except in the central, north~rn and western· parts. The area forms the foothills of the Western Ghats (the Sahayadri hills) which graduallY merge with the plains of Gujarat in the west and the north-west. Northern and southern parts of the territory are more hilly with highest altitude being 433 m. above MSL situated in the southern part of the territory. These hills are not very steep. In the northern parto of the territory the bighe.st point is 294. 13 m. above MSL. Towards t.he .west and nor.th-west the terrain is easy and gentle. . . .
1.5 DRAINAGE:
The terrain is intersected. by the river Damangange. and its tributories. This river rises at a distance 64 kms. from the see. coast in the ghats and dra.ins into the Arabian sea at the port of Daman. The river is seasonal and floods in the monsoon season. Important tributories of the river Damanganga in the tract are: i) Dongavkhadi, ii) Sakartond, iii) Kenai, iv) Ababtir in the south, v) Piparia. vi) Nar and vii)Kolak in the north-east. A major irrigation project viz: Darnanganga Irrigation Project is nearing· completion in the territory near village Sailly. The reservior of this project is situated in Valsad district of Gujarat state but
2
the main canal originating from the dam site traverses a cfistance of 40 kmc. through the terri tory creating a vast potential for irrigation.
1.6 G EOLQGY, BQ.QK .A.liD ~:
The geological strata of the tract belongs to Deccan Trap formations which are mainly made up of basic volcanic rocks of basaltic composition. The composition' of the soil is a varying mixtures of clay and murrum. Depth of the soil depends upon the degree of disintegration and extent of erosion. The soil is clayey in the central and western parts. Soils in the northern and southern parts of the territory are shallow and murummy on account of shifting cUltivation practised in the past. On the slopes of hilly areas and the plateaus the soil is shallow and rocky and supports stunted vegetation. The soil in the forest areas is devoid of humus content. The absence of humus is mainly due to its collection and burning in Rabs by the tribals.
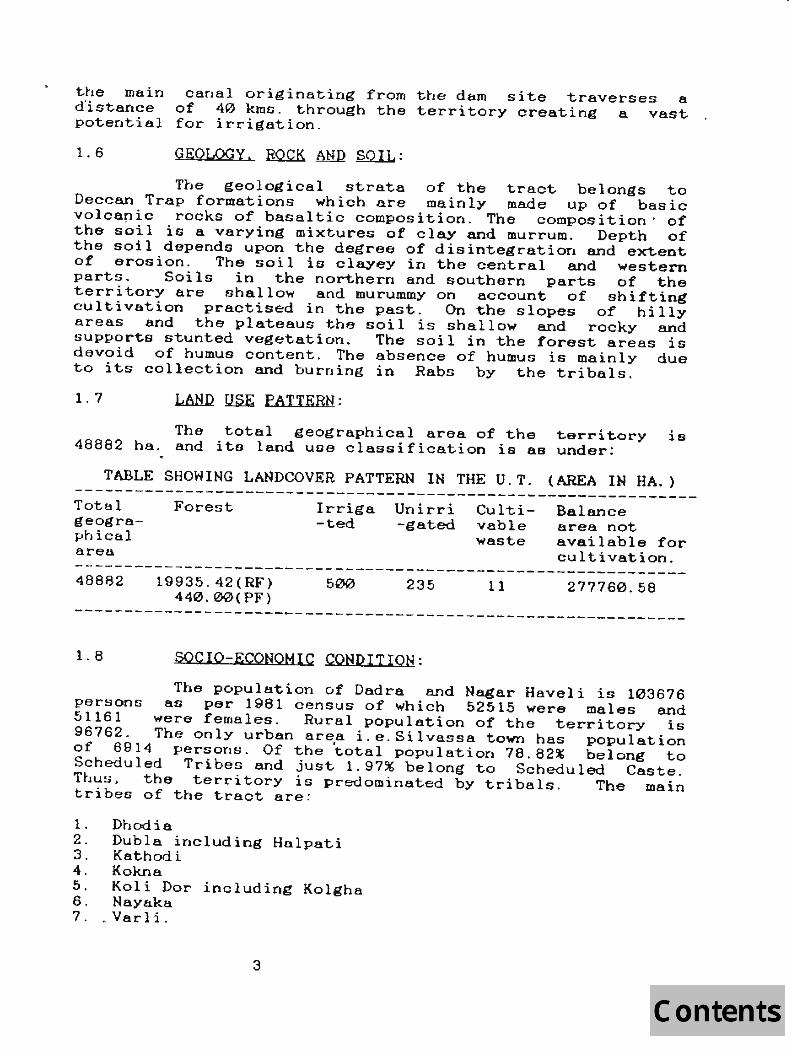
1.7 LAND USE PATTERN:
The total geographical area of the territory is 48882 ha. and ito land use classification is as under:
TABLE SHOWING LANDCOVER PATTERN IN THE U.T. (AREA IN HA.) --------------------------------------------------------------Total geographical area
Forest Irriga Unirri -ted -gated
Cultivable waste
Balance area not available for cultivation. _._-----------------------------------------------------------48882 19935. 42(RF)
440. 00(PF) 500 235 11 277760.58
-------------------------------------------------------------1.8 SOCIO-ECONOMIC CONDITION:
The population of Dadra and Nagar Haveli is 103676 persons as per 1981 census of which 52515 were males and 51161 were females. Rural population of the territory is 96762. The only urban area i.e.Silvassa town has population of 8914 persons. Of the ~otal population 78.82% belong to Scheduled Tribes and just 1.97% belong to Scheduled Caste. Thus) the territory is predominated by tribals. The main tribes of the tract are:
1. Dbodia 2. Dubla including Halpati 3. Kathod i 4. Kakna 5. Koli Dor including Kolgha 6. NaYl1.ka 7. . Varl i .
3
Looking towards the predominantly tribal population of this union territory, most of the developmental. programmes of the Adminiatration are aimed at t~ibal welfare. Education facilities are provided in all the villages (numbering 70).
Power supply is available to most of the even in remote areas. Rice, wheat and ragi form staple food of the people.
vii leges the main
Agriculture is the main occupation of the people. The main agricultural crops are paddy# ragi, small millets and pulses. Of the total cultivated area only 500 ha are irrigated but on completion of the Damanganga Irrigation Project, approximately 7000 ha area will come under irrigation.
The territory being predominantly tribal, the Administration is implementing various developmental schemes aiming mainly to train them in modern methods of cultivation. Development in the field of animal husbandry is also remarkable with establishment of a well equipped veterinary hospital at Silvassa and two veterinary aid centres at Dapoda and Khanvel.
Many voluntary organisations are playing significant role in the socio-economic welfare of the tribals. In variouG developmental schemes launched by the Administration members of Scheduled Tribes are given preference. They are also being encouraged to start cottage or SMall scale industries to improve their standard of living.
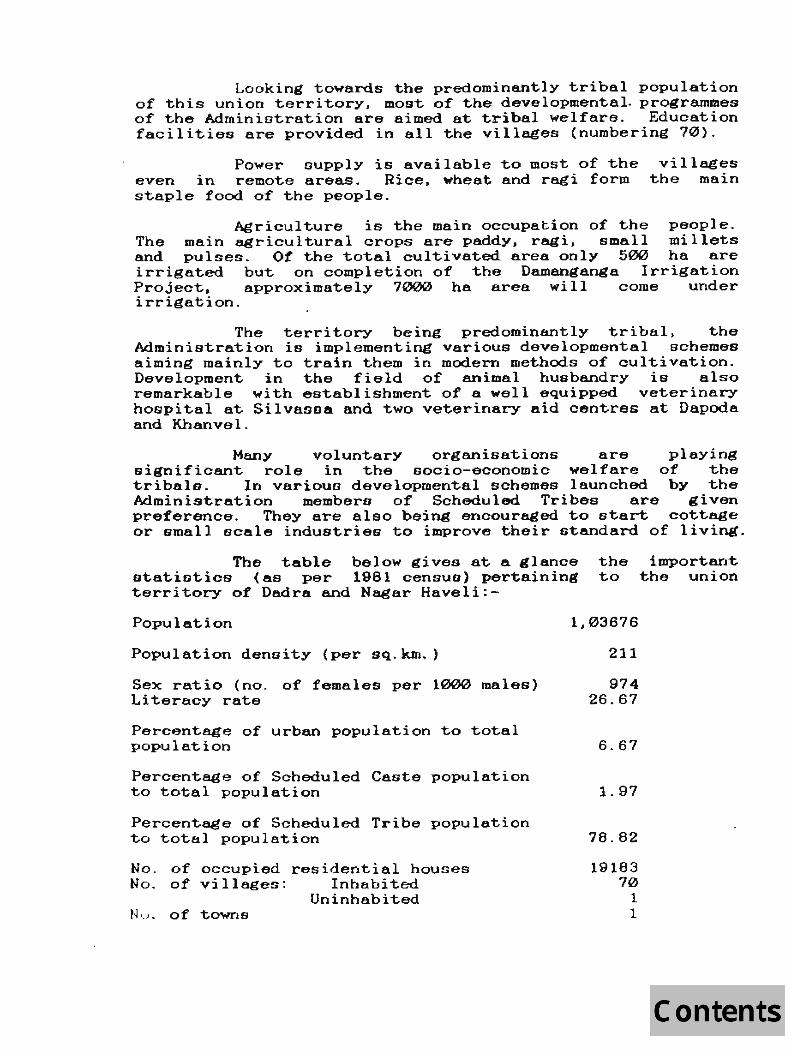
The table below gives at a glance otatistios (as per 1981 censuo) pertaining territory of Dadra and Nagar Haveli:-
the important to the union
Population
Population density (per sq.km.)
Sex ratio (no. of females per 1000 males) Litera.cy rate
Percentage of urban population to total population
Percentage of Scheduled Caste population to total population
.Percentage of Scheduled Tribe population to tota.l population
No. of occupied residential houses No. of villages: Inbflbited
Uninhabited N .. ). of towns
1,03676
211
974 26.67
6.67
1. 97
78.82
19183 70
1 1

1.9 INFRASTRUCTURE:
As r~gar-ds transport and communication facilities, 83 percent of the villages comprising about 90 percent of rural population are served with this facility. Most. of the villages are linked by fair weather roads. The roads in the territory are .... ell rna.intained and useable throughout the year. In addition, there ere forest roads many of which cannot be UGed during rainy season. The capital town of Silvaosa is well connected by roads with the important commercial towns in the adjoining states such as Vapi, Valsad, Surat in Guja.rat and Dahanu, Bombay etc . in Maharashtra. Vapi in Gujarat is the nearest railway station .
1. 10 FOREST PRODUCE AND FOREST BASED INDUSTRIES:
Important foreot produces of the territory are timber, fuel wood, ballies, tendu leaves, mahua flowers and seeds, etc. With the setting up of industrial estates within the territory, the pressure on the forests has increased considerably. Apart from teak which is the most demanded timber species, other species like haldu, bio and tivf:ls are also in great demand. In fact inadequate supply of timber has caused a phenomena.l incrr.:u:;',: in iL!l price. Timb(;H' and fuel was usually extracted from Silvassa and Khanvel areas.
Vapi is the nearest market) 20 kms from Silvassa and 40 kTfm from Kbanve 1. Forest produces are transported to Vtipi by road and from there to various places by rail (if required) or by road. With the imposition of moratorium on fellings. the needs of timber are being met by importing the ~imber from Vapi or other places. Govt. d~partments are generalily supplied their required quota of timber from the fore~t6 of the territory itself.
An important forest ba.sed industry manufacturing 'katha' from khair trees .... as established in the territory about tWenty years back and it is still working.
********
2.0
CHAPTER - II
.IHE FORESTS
GENERAL DESCRIPTION:
The forest cover is spread over an area of 19935.42 lha of the territory. It forms an important economic resource of Dadra and Nagar Haveli. The rorest area is spread over 58 villages. These forests are owned by the Government and have been declared Reserved Forest. Forestry planta.tions along road-side and canal-side have been declared Protected Forest since the year 1982. Teak and khair are the two predominent species found in the tract. The clear felled areas have been planted with teak and kha.ir to meet the local demand of timber and fuel. Emphasis is also being laid on road-side and canal-side plantations. The Administration of Dadra and Nagar Haveli has placed a moratorium on commercial felling of timber since the year 1982 and it is still continuing.
2.1 FOREST TYPES:
As per the classification of Champion and Seth, the forests of this territory fall under GROUP 3BC2: SOUTH INDIAN TROPICAL MOIST(MIXED) DECIDUOUS FOREST but the floristic composition of the crop indicates that it tends towards SEMlMOIST DRY TEAK type forests. The reason for this may be nttributed to presumably less moisture retention capacity of the soil. The composition of the forest crop is as follo,",8:-
Tactona grandia (Teak), Terminalia crenulata (Sadad) , Adina co~folia (Haldwan), Ougeinia oojeinenBis (Tiwas),Albizzia lebbek (Sires), Erythrina indica (Pang~ra). Lagerstroemia parvi£lora (Bondar), Garuga pinnata (Kekad>_ Madhuca latifolia(Mahua). Bridelia retusa (Asan), Acacia catechu (Khair), Acacia ferruginea (Kante). Pterocarpus mara~um (BiD), Albizzia procera (Killai). Sterculia urena (Kandol), AnogeiaauG latifolia (Dhawda). Salmalia malabarica (Sawer), -Holoptelea integrifol i8 (Papda) , Terminalia belerica (Beha.das). Grewia tiliaefolia (Dhaman). Dalbergia latifolitt (Shisham), Di11enia pentagyna (Karmal), Mangifera indica (Amba), Gmelina arborea (Sivan), Syzygium cuminii (Jambul),Lannea coromandelica (Mociae.), Car-eya arborea (Kumbhio), Diospyros melanoxylon (Timru), Wrighti8 ~inctoria (Kudi), Emblica officina1is (ArnIa), Butea monOGperme (Kbakhu), etc.
The quality of the forest crop as well as' it~ condition are not uniform throughout the tract. Quality is slightly better in arees having deeper soils with less biotic interference. The fort.::sts of the terri tory have been degraded to varying degrees. The factors affecting this degradation are site/locality, intensity of biotic
6

interference/pressure and extent of protective measures. The Qegradation at many places is quite visible yet some places can be reclaimed through plantations and other conservation meaf}lJres.
BAMBOO:
In addition to various tree species~ Dendrocalamus strictus (Manvel bamboo) appear in damaged condition alongwith Bambuaa arundinacea (Katas bamboo) along nalaa . Bamboo crop is in a state of degeneration due to reckless and unabated. hacking. The tract underwent gregarious flowering during late fifties but areas were not reestablished adequately. Although Bamboo clumps are noticed in the growing stock they are devoid of young and useful culms.
GRASSES:
Though this survey was confined exclusively to the estimation of growing stock of trees, yet following grass species were found in the territory during the course of this survey: -.
1. Spodiopogon rhizophus - Polad, 2. Cymbopogon martinii - Dab. 3. Vetiveria zizanoides - Valchond. and 4. Chloris incompleta - Gandheri.
2.2 FOREST MANAGEMENT:
Keeping in view the objectives of forest management following working circles are proposed to be constituted in the working plan under preparation.
1. MAIN WORKING CIRCLE :
It comprises all the forest areas of the territory except those put under the Nature Conservation Working Circle. wild life sanctuary and deer park. This working circle has been created to rehabilitate the degraded forests and to give total protection to the worked areas for ten years.
2. MATURE CONSERVATION WORKING CIRCLE:
This working circle covers the following areas:
1) Catchment area of Damanganga river falling within the territorial limits of Dadra and Nagar Haveli.
ii) Forest areas between the industrial estates of Khadoli and Masat. and
iii) Slopes of Athal hills.
This working circle has been created to give permanent protection to the ecologically endangered area. It ~lso includes areas of a proposed wild life sanctuary.
3. HlLD LIfE MANAGEMENT (OVERLAPPING) WQRKING CIRCLE:
This working circle extends over entire forest area ·of the territory including the proposed area of 715 ha for a wild life sanctuary in Umber Kui and Bonta areas.
4. FODDER DEVELOPHENT (OVERLAPPING) WORKING CIRCLE):
This working circle extends over all the forest areas except those under Nature Conservation Working Circle. Special attention will be paid to the grass bearing areas o£ some vi lIeges.
5. MINOR FOREST PRODUCE (OVERLAPPING) WORKING CIRCLE:
This working circle overlaps the entire forest area in the territory. It aims at collection of minor forest produce in the territory.
6. COMMUNITY FORESTRY WORKING CIRCLE:
This working circle extends over all the 000-forestry areas in the territory available for production forestry namely for raising fuelwood, small timber and fodder required by the local population for their domestic consumption.
7. TRIBAL WELFARE WORKING CIRCLE:
This working circle extends over entire tribal habitat of the territory. The object is to create ecological awarene~~ amongst the tribals and to uplift their socio-6c:onomic condition so that the conservation of environment becomes meaningful and beneficial to the tribal population.
2.3 DAMAGE IQ FORESTS:
Following l:1gencies are mainly responsible for causing daroga to the forest6:
1. HUMAN INTERFERENCE
Growing population and rapid industrialisation In and around Dadra &. N'ttgar Haveli has taken its toll of destruction of forests. Even during Portuguese regime forests were subjected to over-exploitation for commercial purposes. Grant of various rights find privileges to local tribals has also caused tremendous demFlge 1;.0 the forest wealth of the t..erritory. Adjoining area~ of Maharashtra and Gujarat states have relatively sparse forests which has obviously resulted in the increaoe of biotic preS[lure on the territorial forests
8
beyond their capacity. Many industrial estates have mushroomed right amidst dense forest areas. The construction activities of Damanganga Irrigation Project in the territory have'also resulted in the influx of people from outside the terr.itory which too bas resulted in pressure on the local forests. Over all phenomenal increase of human population of the territory has also influenced the demand rendering the forests more vulnerable to injuries caused by man. The plucking of leaves for rab burning and for thatching of houses is also an undesirable practise of the local tribals.
2. ILLICIT FELLING:
The illicit felling in the territory is attributable to many factors such as (i) absence of good forest in the adjoining states. (ii) escalating prices of timber and fuel wood. (iii) exploitation of poverty ridden tribals by illicit wood-cutters,(iv) inadequate number of check'poato, & (V) development of good net-work of roads etc.
3. r.I.BE:
The fires are quite common in the territory and cause considerable damage to the forest regeneration. The trib~ls are responsible for initi~ting such fires for collection of minor forest produce and practicing rab burning in their agricultural fields.
2.4 BIGHTS AND CONCESSIONS:
The forest department haG framed rules regarding free and concessional grant of timber viz;
a. Free grant of timber for construction of houses; b. Free grant of timber for repair of houses; c. Free grant of timber for agricultural implements; and d. Concessional grant of timber.
2.5
Owing to heavy degradation of forests, the wild life habitat has been badly affected. Many wild animals have disappeared from the territory. Whatever have managed to survive are likely to become extinct unless immediate appropriate protection and management is ensured. Loss of forest wealth in the adjoining states has also contributed to rapid dis~ppearWlce of wild life in the territory. A working circle has been constituted to effect better wild life O'Ianagernent in the enti re forest areas of the terri tory . A wild life sanctuary is proposed to be created around Umberkui and Bonta villages over a proposed area of 715 ha. Such positive measures are likely to improve the present state of wild life in the territory.
***>t*****
3.0
1 .
2.
3.
4.
5.
6.
7.
3.1
_!:;HAPTER -'- l.ll
RESOURCES SURVEY METHODOLOGY
OBJECTIVES QE IHE SURVEY:
The objectives of this resources survey were :
To collect information on distribution of forest with regard to various parameters such as topography altitude, aspect, slope, soil-depth etc.
To collect various informations on crop data including origin of crop (whether the crop is of seed origin, coppice origin or a plantation). its composition, height, size,quantum of regeneration, injury to crop. fire incidence, grazing incidence, presence of weeds and grasses etc.
To collect various informations under bamboo occurrence such as species found, their density, quality, quantity and regeneration etc.
To estimate the areas falling under various covers.
land
To estimate the growing stock of trees and bamboos existing in various land covers.
To determine the planta.tion potential of the land which is poorly stocked or unstocked.
To focus attention o£ the planners and forest officials on the critical aspects and condition of the forests for timely remedial measures and for future planning.
ARE.6 CONSIDERED EOR SURVEY:
For the purposes of this inventory the forest areas falling in the union territory of Door-a and Nagar Haveli were considered. In order to decide the forest areas, recent Survey of India toposheets on 1:50,000 scale were used. All those areas which were demarcated by double dotted forest boundaries on these toposheets and were having green wash within or outside such boundaries, were taken as forest areas' for undertaking this inventory survey.
3.2 INVENTORY DESIGN:
A common inventory design for organi~ation was evolved in consultation with Statistica.l Orgl1nisation (Govt. o£ India) for inventory wor'k in variow .. parts of the country.
10
the whole the Central undertaking The design

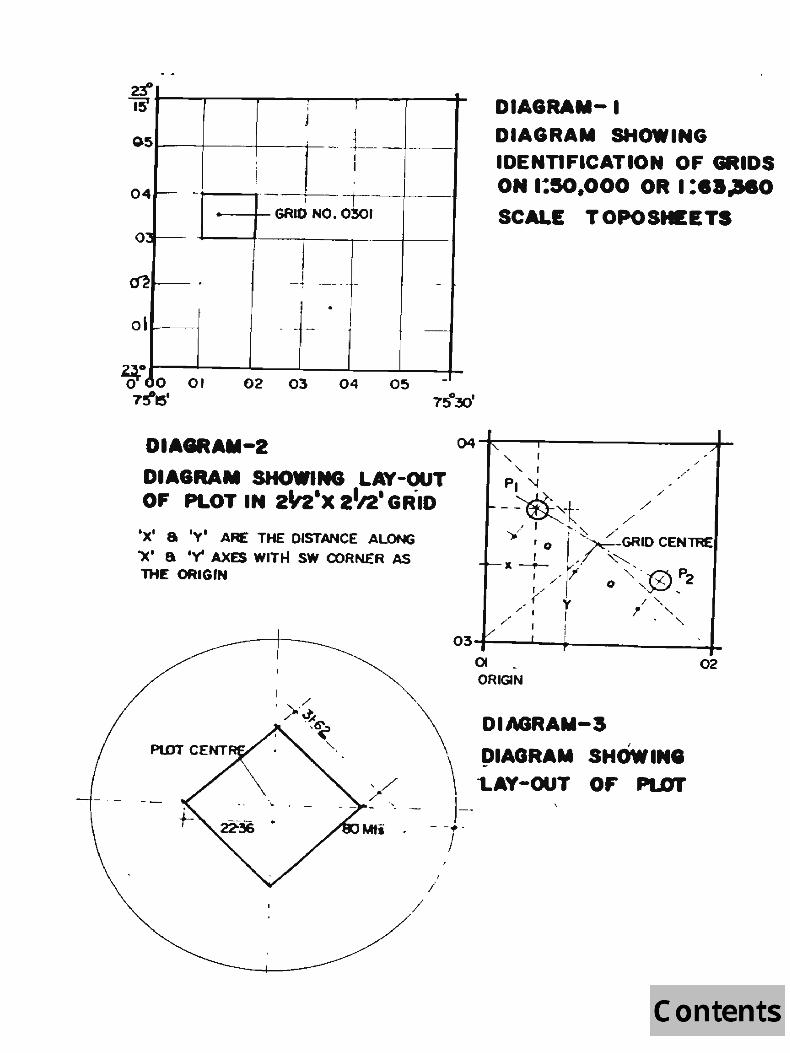
envisaged the survey of two randomly selected plots each of 0.1 he. area in each grid of 2 1/2' x 2 1/2' (latitudes and longi_tudes) on the toposheet of 1: 50. 000 scale. A grid boun~ed by 2 1/2' x 2 1/2' latitudes and longitudes covers about 20 sq.km. area in which 0.2 ha. area is actually sampled. Thus the sampling intensity of the survey comes to 0.01%. The method of marking the plot centre on the map within a grid is as follows:-
Two sides (X - axis and Y-axis) of a grid were 'measured in millimeters. The length of these sides was divided by 0.6324 mm (side of 0.1 he. square plot) for the maps on 1:50,000 scale. The quotient so obtained was rounded up. Let the numbers (quotient) for X axis be x and that for Y-axis be y. Actually the number x gives the no.of plots that may fall along X-axis and number y gives the no.of plots that may fall along Y-axis. The product x X y gives the tota-l number of sample plots that may exist in 8. grid of 2 1/2' x 2 1/2'. Out of these plots (x X y), one plot has to be selected on the basis of random numbers and the second one with the help of the first plot which will be explained in next para. For the selection of 1st plot, one set of three random numbers was selected from random numbers table. If the random number selected for X-axis was less than x (quotient for X-axis), then it was retained and if the random number was more than x, then it was divided by x and the remainder was retained. Similar exceroise was done tor Y bXis also by.taking next three digit set of random numbers. The figure (remainder) so obtained was multiplied by the side of the plot i.e. 0.6324 rom for 1:50,000 scale map so as to get the actual co-ordinates of the 1st plot. The plot no.1 of all the grids was marked on the map taking south- west corner of respective grid as origin. The distance along X-axis was measured towards east ~Jd along Y axis towards north. Thus the centre of plot no.l was marked on the map at crossing of' the two co-ordinates.
For marking the centre of second plot of each grid_ the plot centre of 1st plot and centre of 2 1/2' x 2 1/2" grid were joined and the line extended to the same distance in opposite direction beyond grid centre. The point so reached was the plot centre of the second plot. The layout of 2 1/2' x 2 1/2' grid and the plots are shown in diagram nos . l flfld 2. All such plots were marked on the toposheets and they were visited only if they were falling in areas covered by green wash or by double dotted forest boundaries on 1:50,000 mapshee~s. tSince the number of samples available from two p_l_ots HI a ~_Fid were not ~.~_q\J~~~, ( two-:::-addl'tronal pal rs ',of plo,ts.~were-le.id-=i..~:-the-samJLgrig_s_i_n_t!le~si.liiUir manner so as t_o_ge_t_ total . . 62-sample .. plots in the entire territory_ .. - -, - -, . -
11
i r j
t 1 - . -t--
o
, j
I I
r- -8 GRJO NO. ;;b, .,. ...
04
.- __ 4_ •.• _ -
t • I~-- - ._ -o
.0 ~o o 01 02 03 04 05 -7r!'el
DIA8RAM-2
DIAGRAM SHOWING LAY-OUT OF PLOT IN 2~'X 21/21 GRID
.)(1 a Iyl ARE THE DISTANCE ALONG
')(1 8 Iv' AXES WITt-I SW CORNER AS THE ORIGIN
I
DIAGRAM-I DIAGRAM SHOWING IDENnFICATION OF GRIDS ON 1:50.000 OR I : •• ~O
SCALE TOPOS_ETa
01 ~ ORIGIN
02
,>.~ ,Io(~
, '~ '\..
\ DIAGRAM-3, DIAGRAM SHOWIN.
, / \ "LAY-OUT OF Pl.DT ,,-_. - - 1--- -of>-
/ /
/
3. 3 LOCAl ION QE £LQ.I QH .TIlE GROUND;
As stated earlier. the survey was confined to the forest areas only. All the forested plots of the survey area of Dadra and Nagar Haveli. duly marked on toposheets. were allotted to the crew deputed for this inventory work. The crew had drawn up its programme of halts at some convenient places in order to tackle maximum plots from those camps. The plots marked on the toposheets had to be exactly located on the ground with the help of some conspicuous features which could be identified on the map as 'well as on the ground. Usually the following features were selected for this prupose:
1. Bench mark. 2. Triangulation point. 3. Village or road trijunction. 4. Old bridges and culverts. 5. Old temples, mosques and churches. 6. Crossing of rail tracks with roads, streams. rivers etc. 7. Confluence of rivers or streams and junction of roads. 6. Prominent bends in roads, rivers or streams . 9. Old ponds and wells.
10. Springs. 11. Prominent t-~ographical features in hi lly ['egion f.;ucb u:.;
spurs, knolls etc. 12. Mile stones or kilometer stones on the road side. 13. Pillars of international, inter state or inter-district
boundaries and those of forest areas etc. 14. Prominent bends of boundary etc.
After locating the above referenoe points on the ground as well as on the map. the bearing and distance from referenoe point to the plot oentre were marked. This distance was traversed at the bearing calculated for the plot using Silva Compass and distance measured with a nylon rope/tape etc. While using compass the magnectio deolination as indicated on the conoerned toposheet was also taken into account. Similarly, for distance measurement the slope correction was applied to get the actual horizontal distance.
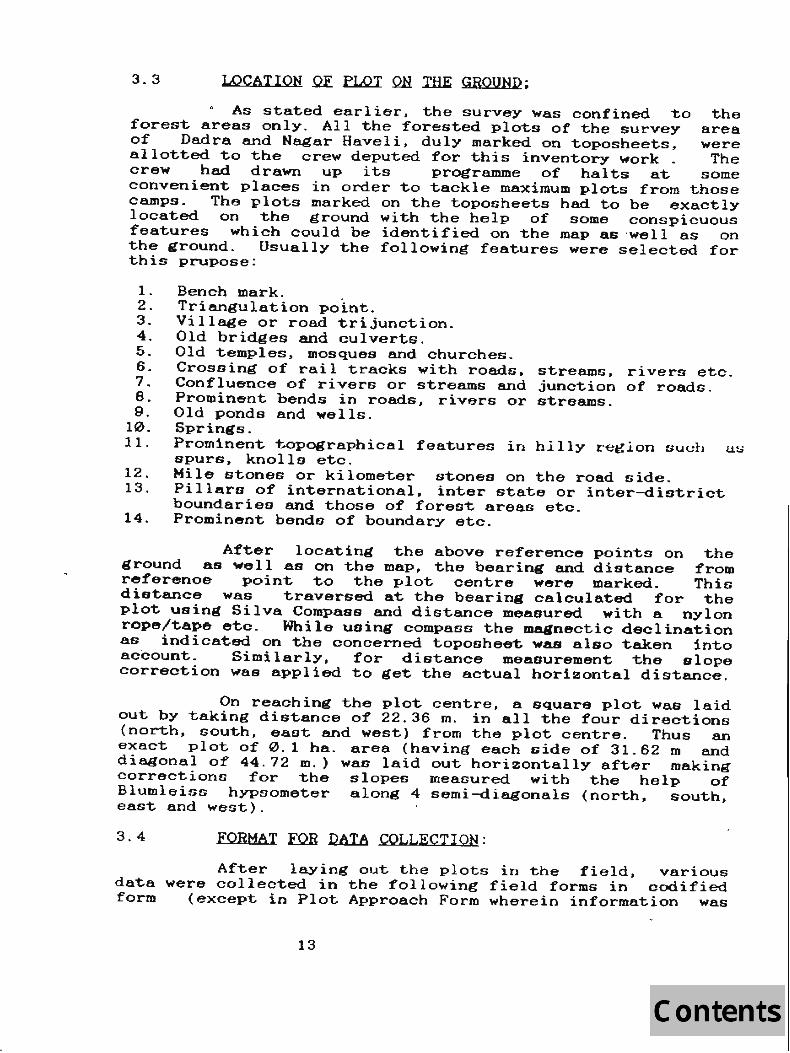
On reaching the plot centre, a square plot was laid out by taking distance of 22.36 m. in all the four directions (north. south, eaot and west) from the plot centre. Thus an exact plot of 0.1 ha. area (having each side of 31.62 m and diagonal of 44.72 m.) was laid out horizontally after making corrections for the slopes measured with the help of Blumleiss hypsometer along 4 semi-diagonals (north, south, east and west).
3.4 FORMAT EQH DATA COLLECTION:
After laying out the plots in the field. various data were collected in the following field forms in codified form (except in Plot Approach Form wherein information was
13
collected in descriptive manner) as described in the field manual issued to the crew for the purpose of data collection. This facilitated the transfer of data on punch cards, consistency checking of collected data and finally in processing the data on electronic computer at a later stage. The yarious field forms used in this survey are :-
1. Plot Approach Form. 2. Plot Description Form. 3. Plot Enumeration Form. 4. Sample Tree Form. 5. Bamboo Enumeration-cum-Clump Analysis Form. and 6. Bamboo Weight Form.
1. ELQI APPROACH E.QRM:
As the title indicates, the form is a record of approach to the plot centre from the field camp of a crew. It is filled. in by the Crew Leader as he proceeds from his camp to some conspicuous feature called reference point existing near by the plot. The distance and bearing tram this well defined reference point to the plot centre were also recorded. The exact location of plot centre, i.e. bearing and distance from two trees to the plot centre is also noted together with the time of departure from camp, time taken in various studies and time of arrival in the camp. This form helps the check crew or any other person to relocate the plot easily when required. The data on this form is recorded in descriptive manner with a neatly ' drawn ~ketch showing the location of reference point and the plot centre.
2. fLQT DESCRIPTION EQBM:
This form is designed for recording qualitative description of 2 ha area around the plot centre. The information regarding administrative units. legal status. land use, topography, soilJ vegetation, bamboo regeneration, biotic influenceJ accessibility and plantation potential etc. were recorded. The data was recorded in codified form and was transferred to punch cards for further computer analysis . The stratification of area and classification of growing stock was done on the basis of these descriptions only.
3. £LQI ENUMERATION EQRM: t
In this form, all the trees with dia 10 em. and above and all the bamboo clumps occurring in whole of 0.1 ha sample plots were recorded by species. This was meant for oomputing total growing stock existing in all such sample plot;s:i ~i< and finally ~n whole of the survey area which was estlmated on the bas1s of these sample plots. This form helps in distributing the grwing stock in terms of stems and volume by various parameters like species, diameter classes. forest types etc.
14
4. SAMPLE IREE .EQRM:
Detailed information regarding the species, diameter at breast height (over bark), height of tree, clear bole, bark thickness, dominance and defects etc. of all the trees occurring in north-west quadrant of each of the sample plots, were recorded in this form. On the basis of these parameters (i. e., heigbt, diameter and olear bole). volume of plots was calculated
5. BAMBOO ENUMERATION-CUM-CLUMP ANALYSIS fQRM:
In this form,the data of individual culms occurring in the selected clumps bearing S.Nos. 1,9,17,25,33 . . .... . etc. (h e.. the first and every eighth clump appea.ring in Plot Enumeration Form) was recorded. Thus, the information about age, soundness. size and condition etc. of the culms of the above clumps Was obtained and analysed in various columns of this form. This information gave the position of total bamboo stock by clump sizes occurring under various conditions.
6. BAMBOO WEIGHT EQRM. :
This form wu.G df':RignF:!i fnr c:r.ll F.!c"t,ing data to determine the green weight of bamboos of different species and sizes and further for establishing relationship between green weight and dry weight of bamboo culms. The data was recorded in respect of two selected culms from each dia. class, i.e., 2 to 5 em, 5 to 8 cm. and 8 cm and the green weight of three 50 cm long sub-samples, each taken from the bottom, the middle and the top portions of the culms were recorded. These 'three sub-samples are dried in air and finally in the oven in order to remove their entire moisture contents and to get their air dry weight. This facilitates to establish relation between the gree~eight and the dry weight of culms by species and sizes~ ~o know ' the total growing stock of bamboos in terms of weight.
3.5 FIELD HQRK:
The rield work of union territory of Dadra end Nagar Haveli waG completed in two stages. Only one field party carried out the survey. It consisted of one Dy.Ranger and two Fieldmen. Initially inventory of 29 sample plots was undertaken in the month of October, 1985 with camps at Silvasa and Khanvel. After completion of inventory, Wood Consumption Studies were also undertaken to assess the quantity of wood. being consumed in the territory for various purposeo. Second visit was in the month of Janury February, 1988 during which 33 additional plots were tackled . Thus total sample plots tackled in the territory were 62.
15
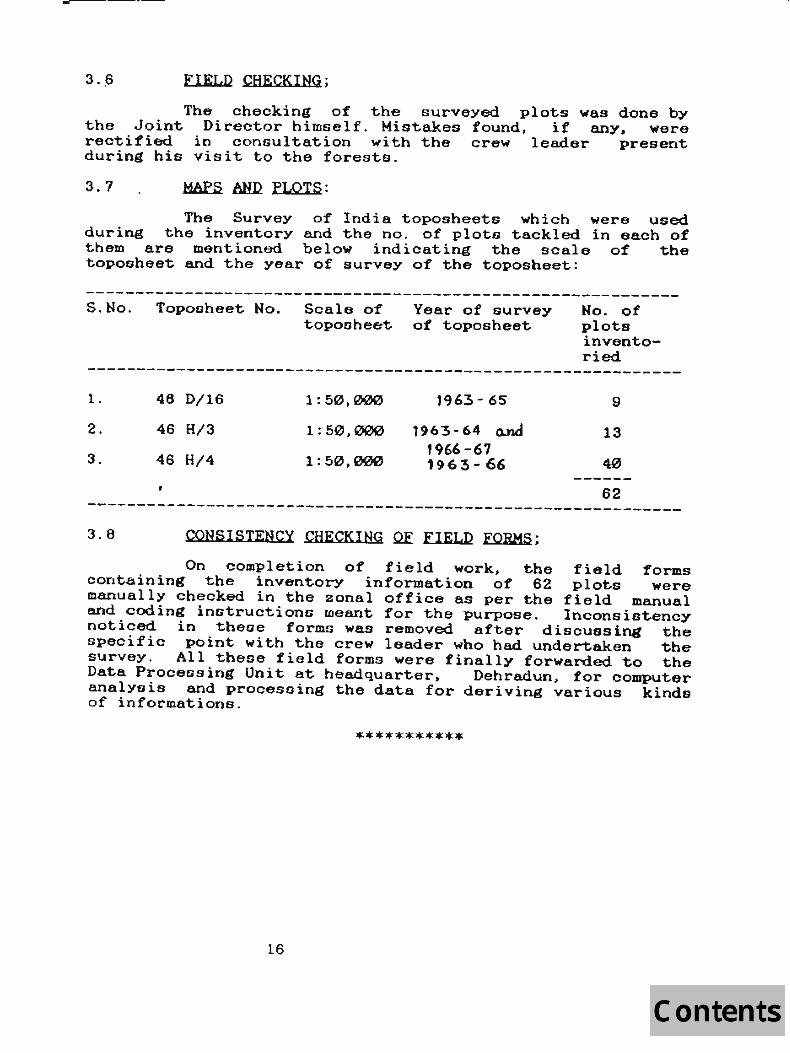
-3. ,6 FIELD CHECKING;
The checking of the surveyed plots was d~ne by the Joint Director himself. Mistakes found. if any, were rectified in conGultation with the crew leader present during his visit to the forests.
3.7 MAfS .AH.I2 PLOTS:
The Survey of India toposheets which were used during the inventory and the no. of plots tackled in each of them are mentioned below indicating the scale of the toposheet and the year of survey of the toposheet:
------------------------------------------------------------S.No. TopoDheet No. Scale of
topoaheet Year of survey of toposheet
No. of plots inventoried
------------------------------------------------------------1. 46 D/16 1:50,000 196:3 - 6S 9
2. 46 H/3 1:50,000 1963- 64 o.»d 13
3. 46 H/4 1:50,000 1966 -67 '96:3 - 66 40
------62
------------------------------------------------------------3.B CONSISTENCY CHECKING Of FIELD FORMS;
On completion of field work, the field forms oontaining the inventory information of 62 plots were manually checked in the zonal office as per the field manual and coding instructions meant for the purpose. Inconsistency noticed in theae formD was removed after discussing the specific point with the crew leader who had undertaken the survey. All theDe field forms were finally forwarded to the Data Processing Unit at headquarter. Dehradun. for computer analysis and procesDing the data for deriving various kinds of informations.
***********
16

4.0
CHAPTER -1.Y
DAIA PROCESSING
SAMPLING DESIGN . ctJ
Grids were marked at 2 1/2' x 2 1/2' interval in the forest areas 'of Dadra and Nagar Haveli (union territory). Initially two plots were laid in each grid. These plots were square in shape each having an area of 0. 1 ha. The first plot was laid out at random and the second was linked to the first in the opposite quadrant at an equal distance from the grid centre. Since the number of samples available from two plots in a grid were not adequate two additional pairs of plots were laid in the same grids in the similar manner so as to get total 62 sample plots in the entire territory.
4.1 D.aTA:
The basic data of inventory survey was collected in the Plot Description Form. Plot Enumeration Form. Sample Tree Form. B~boo Enumeration Form. The volume data from felled trees was not collected since a moratorium on felling of trees was in force in the territory. The field forms were precoded so that the field data could easily be transferred on to the punch cards.
No. of cards punched for the f111ed-in field forms were as under:
1. 2. 3. 4. 5.
4 . 2
.c.a..r::d. design I
Plot description Plot enumeration Sample tree Bamboo enumeration Bamboo weight data
Total
DATA PROCESSING
t:I.Q.._ ~ corda .
62 103 151
16 16
348
The operations:-
data processing involved the
i} MANUAL PROCESSING;
following
The field forms received in the Machine Data Management Unit of Forest S .... rvey of India, Dehraciun were checked with the list supplied by the central zone. Entries of the field forms were made in the register regarding the number of field forms relating to each map-sheet. grids and plots. The total number of cards required to be punched
17
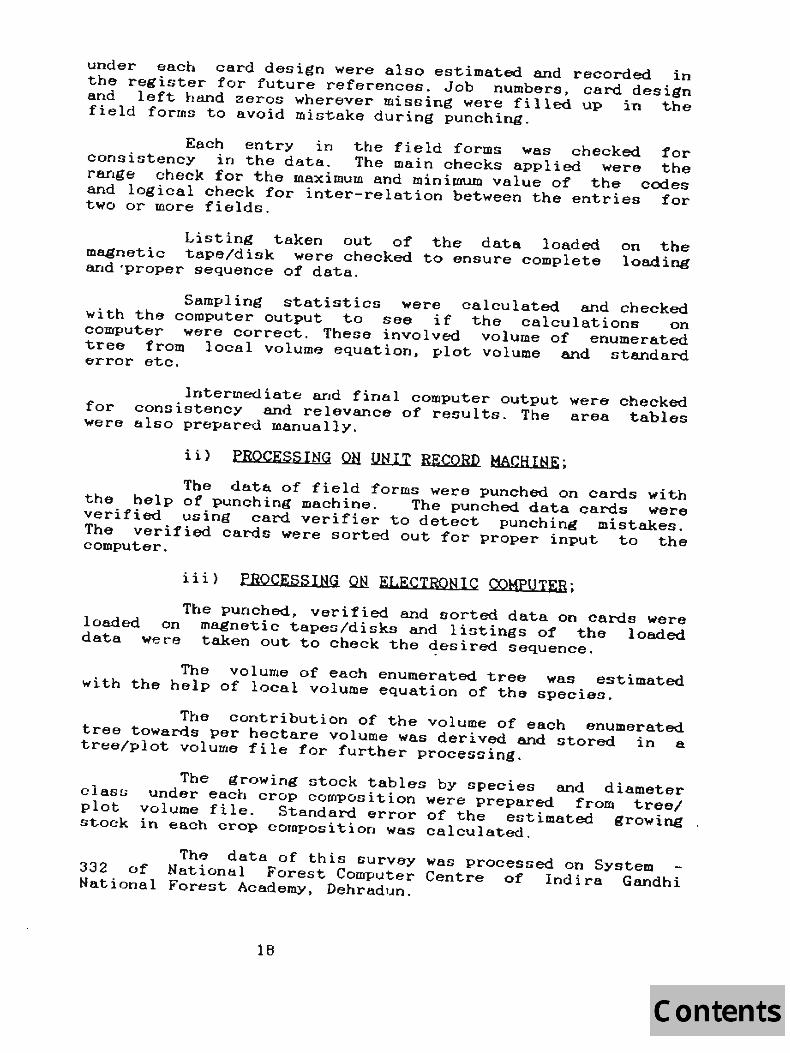
under each card design were also estimated and recorded in the register for future references. Job numbers, card design and left hand zeros wherever missing were filled up in the field forms to avoid mistake during punching.
Each entry in the field forms was checked for consistency in the data. The main checks applied were the range check for the maximuUl and minimum value of the codes and logical cbeck for inter-relation between the entries for two or more fields.
Listing taken out of the data loaded magnetic tape/disk were checked to ensure complete and ·proper sequence of data.
on the loading
Sampling statistics were calculated and checked with the computer output to see if the calculations on COmputer were correct. These involved volume of enumerated tree from local volume equation, plot volume and standard error etc.
Intermediate and final computer output were checked for consistency and relevance of results. The area tables were also prepared manually.
ii) PROCESSING QH llH1I RECORD MACHINE;
The data of field forms were punched on cards with the belp of punching machine. The punched data cards were verified using card verifier to detect punching mistakes . The verified cards were sorted out for proper input to the computer.
iii) PROCESSING QN ELECTRONIC OOHPUTER;
The punched, verified and Darted data on cards were loaded on magnetic tapes/disks and li~tings of the loaded data we~e taken out to check the desired sequence.
The volume of each enumerated tree was estimated with the help of local volume equation of the species.
The contribution of the volume of each enumerated tree towards per hectare volume was derived and stored in a tree/plot volume file for further processing.
The grOwing stock tables by species and diameter class under each crop composition were prepared from tree/ plot volume file. Standard error of the estimated growing stock in ea.ch crop composition was calculated .
The data of this survey was processed on System 332 of National Forest COmputer Centre of Indira Gandhi National Fore:::;t Ac ademy, Dehradun.
18

This computer had the following configurations:
1- Memory 256 K bytes 2. Card reader 1 3. Tape drives 2 4. Disk drives 2 5. Line printer 1 6. Terminals 4
4.3 ABU.
The entire area of 19a35 . 42 ha Reserved forests was surveyed for the estimations. On the basis of total number of sample plots falling in these areas, weightage of each sample plot was calculated. This ractor was used to derive area by different land use classes. The total area was classified by land use covers given in table no. 5.1 . The area falling in land use dense tree forest, moderately dense. open forest, young plantations of forestry species and young crop of natural and artificial regeneration was considered as tree vegetated cover and was classified by crop composition classes on the basis of the number of sample plots in crop compositions viz; Teak and Miscellaneous. The details of which are given in table No. 5.2
The total area under each crop composition was classified by topography, slope, soil depth, top height, size class. canopy layer.and estimated plantable area in the Govt. forest land. All area details by these parameters have been explained in Chapter V of this report.
4.4
4.4.1
VOLUME ESTIMATION;
VOLUME EQUATIONS;
The data was not collected from freshly telled trees. The sample tree data was inadequate to develop local volume equations. Therefore, local volume equations developed for various species for adjoining Surat Circle in Gujarat State were used for estimating the enumerated tree volume.
The following local volume equations were used:
1. Acacia catechu (114)
=- 0.048108 + 5.873189 D~
2. Adina cordifolia (127)
=- 0.215690 + 4.32a878 D - 1 . 504a77/t)
3. AnogeissuG latifolia (122)
./ F =- 0.357373 + 2.430449 D + 0.794626/D
19
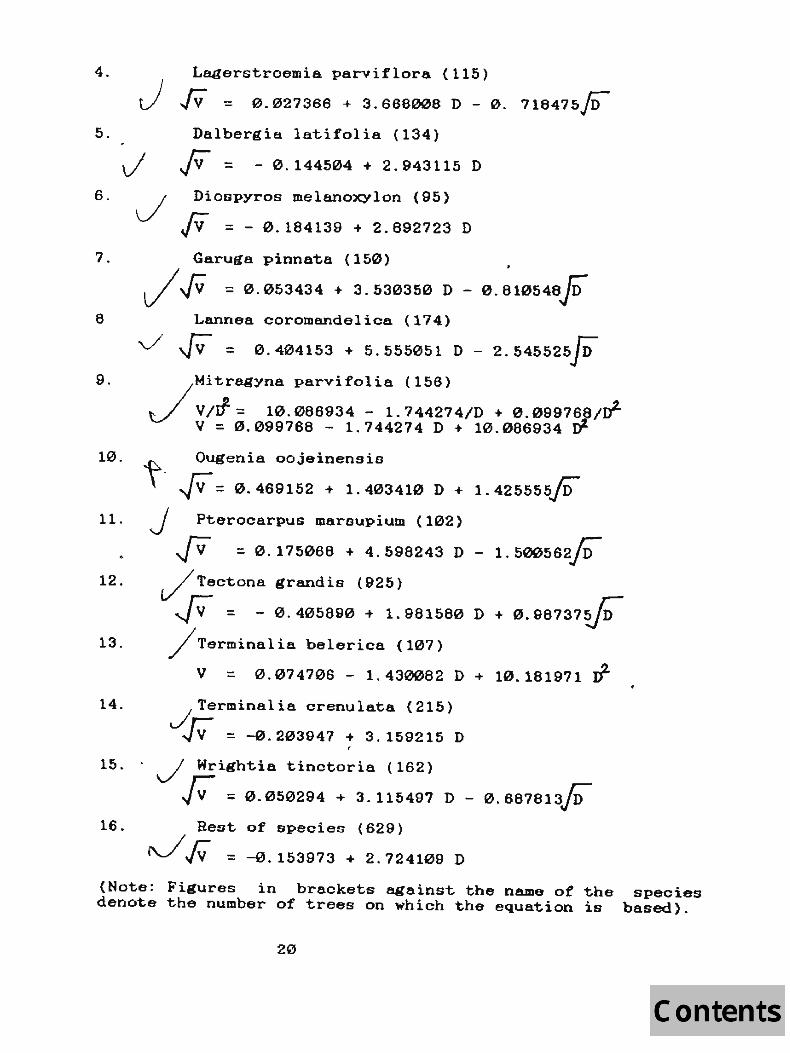
4.
5.
Lagerstroemia parviflora (115)
J IV = 0.027366 + 3.668008 D - 0. 718475,[r)
Dalbergia latifolia (134)
6.
7.
J F:: - 0.144504 + 2.943115 D
~ Diospyros melanoxylon (95)
JV :: - 0.184139 + 2.892723 D
Garuga pinnata (150)
e
9.
10.
11.
12.
13.
14.
~ ~ :: 0.053434 + 3.530350 D - 0.810548~ Lannea coromandelica (174)
V rv :: 0.404153 + 5.555051 D - 2.545525jD
Mitragyna parvifolia (156)
~v/if:: 10.086934 - 1.744274/D + 0.09976~/ot V :: 0.099768 - 1.744274 D + 10.086934 D'
Ougenia oojeinensis
~. ~= 0.469152 + 1.403410 D + 1.425555~ ~ Pterocarpus marsupium (102)
F :: 0.175068 + 4.598243 D - 1. 500562;;
~Tectona grandis (925)
~:: - 0.405890 + 1.981580 D + 0.98737~ ~Terminalia belerica (107)
V :: 0.074706 - 1.430082 D + 10.181971 ~
J Terminalia crenulata (215)
~ :: -0.203947 + 3.159215 D
15 .. ~ Wrightia tinctoria (162)
~ :: 0.050294 + 3.115497 D - 0.687813~ 16. Rest of species (629)
J rv :: -0.153973 + 2.724109 D
(Note: Figures in brackets against the name ot the species denote the number of trees on which the equation is based).
20

4.4.2 ENUMERATED IEEE VOLUME;
The volume o£ each enumerated tree was estimated from the breast height over bark diameter of the tree and the local volume equation used for the species. The estimated tree volumes were converted to per hectare and stored in tree/plot volume file with speices code, tree diameter. parameters of Plot Description Form, per hectare stems and volume in the sample plot. The file helped in the tabulation of results by species and diameter for different crop compositions.
4.4.3 fltQ.I VOLUMES:
The estimated volume of Bach enumerated tree in a plot when added up over the whole plot provided the plot volume. It waB converted to per hectare baBis and stored in the tree/plot volume file. The per hectare plot volumes were used to estimate volume under different classes of desired parameters. The plot volumes were also used to estimate the average volume per hectare (cu.m.) and the sampling error of growing stock in each crop composition .
4.5 STAND TABLES:
The estimates of tree/plot volume file were utilised to classify the trees by species, diameter and crop composition etc. Estimates of the number of stems per hectare and total stems by speoies and diameter classes were obtained for each orop composition. These are giyen in the computer out put originally.
The number of stems per hectare and total stems over all crop compositions were also derived and are ~iven in the table nos. 6.1 A & B, 6.2 A & B and combined growing stock in terms of stems is given in table no. 6.5 A & 6.5 B.
4.6 ST00CK TABLES.
Estimatec; of volume per hectare and total volume by species and diameter classes were obtained for each crop composition from the tree/plot volume file. These are also given in table nos. 6.3 A & B. 6.4 A & B and combined growing stock in terms of volume is given in table no. 6.6 A & 6.6 B.
4.7 SAMPLING ERROR;
ThE: sampling was considered as systematic cluster sample having two sample plots in each cluster. In order to estimate sampling error the sample plots were considered to constitute simple random sample of unequal clusters because
21
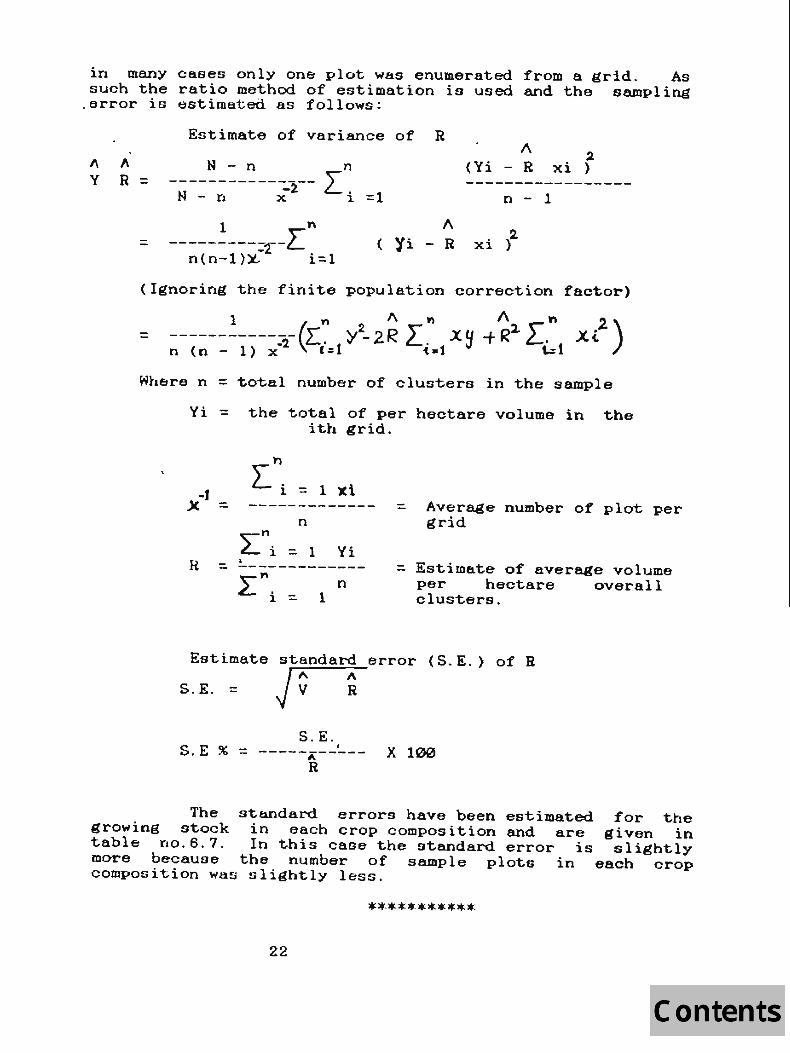
in many cases only one plot was enumerated. :from a grid. As such the ratio method of estimation is used and the sampling
.error is estimated as follows:
1\ " y R
Estimate of variance of R ~
" N - n n (Yi - R xi ) = ------------:.2-- L. -----------------
N - n x. 1 =1 n - 1
1 n A r = ---------~'["-L ( Yi - R xi n(n-l»)i i=l
(Ignoring the finite population correction factor)
= 1 .,.. 1\., 1\ n 2.)
-----------~-rL. }'2-2R L. xy of Rl. L. Xi n (n - 1) x ~ ,=1 '(-1 1-1
Where n = total number of clusters in the sample
Vi ~ the total of per hectare volume in the ith grid.
~t )( =
" )'). L 1. = 1 xi
n n
~ i = 1 . Vi R = -------------
Estimate
S.E. =
n 1
standard
J~ S . E .
t
" R
S.E % = -----'1\-----R
= Average number of plot per grid
= Estimate of average volume per hectare overall clusters.
error (S. E.) of R
X 100
The standard errors have been estimated for the growing stock in each crop composition and are given in table no.6.7. In this case the standard error is slightly more because the number of sample plots in each crop composition was slightly less.
***********-
22
CHAPTER - Y.
INVENTORY RESULTS - AREA
5.0
The forest resources information of Dadra and Nagar Haveli has been compiled on the basis of randomly selected 62 plots falling allover the forest areas of the territory. The forest area figures supplied by the Forest Department of union territory {as per their Working Plan) are adopted. Out of a total geographical area of 46882 ha the territory has a forest expanse of 19935.42 ha on which the results of this survey are based. For the purposes of this invent.ory :';UI'vey the territory was taken as a single unit and a9 such growing stock as well as area results pertain to the territory as a whole.
This forest area of 19935.42 ha was divided by the total no. of sample, i.e., 62 falling in the entire forest areas giving the weightage of each sample plot as 321 . 53903 ha. Further break-up of area under different land uses covers, crop compositions. topography classes. slope classes, soil depth classes, top-height classes, size classes, canopy layers etc. was worked out giving due weightage to the sample plots falling under various lcality factors as observed during the course of field work. These are discussed below in details;
5. 1 FOREST .6REA BY .LAND COVERS:
Table no. 5.1 produced below gives a pattern in which forest land of the territory is being used . It shows that 8.07% of the forest area is under dense forest with canopy density more than 70%, 33.87 % is under moderately dense forest with canopy density ranging between 30-70% and almost an equa.l proportion (32.26%) is under open forest with a canopy density 5-30%. 3.23% of forest area is under young pla.nta.tions having diameter between 2-10 ems at breast height, 16.13% of forest land was under young crop of natural or artificial regeneration with diameter below 2 ems. Such crop cannot be considered to be an established one. Area under scrub. agricultural land with and without trees and water bodies each constituted 1.61%. All the randomly selected plots which were sprea.d over the entire forest a.rea. of the territory were visited by the field party .
23
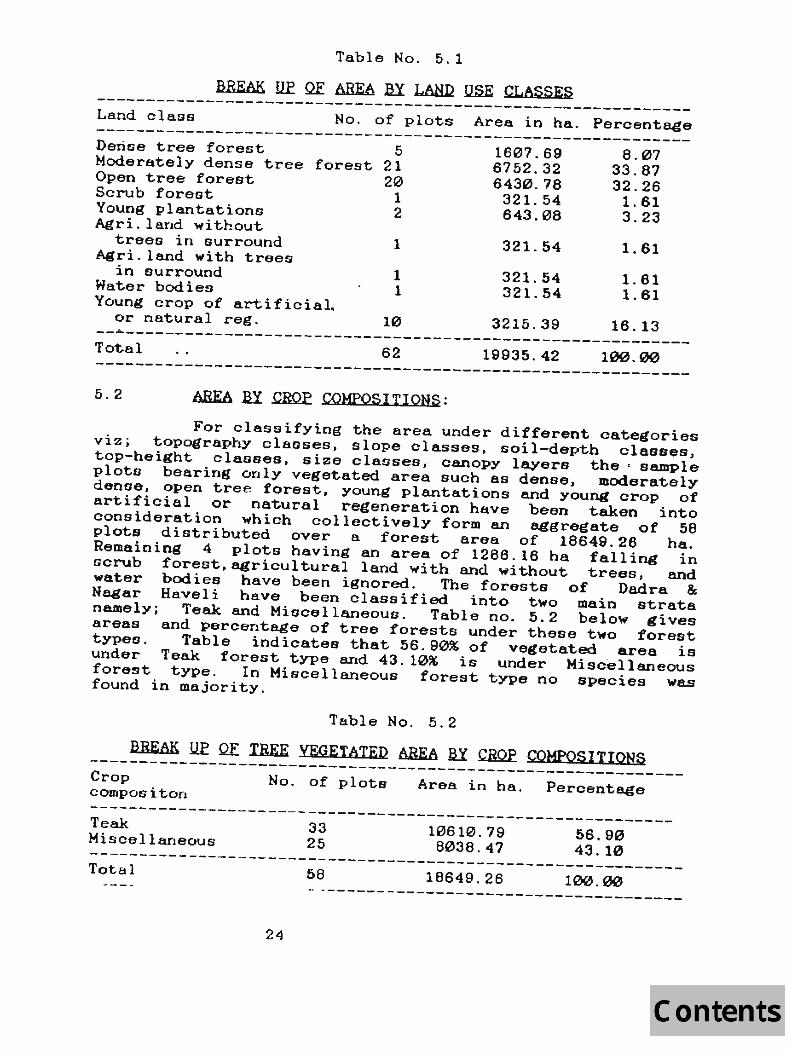
Table No. 5.1
BREAK UE QE AREA BY LAHD USE CLASSES ------------------------------------------------------------Land class No. of plots Area in ha. Percentage ------------------------------------------------------------Derise tree forest 5 Moderately dense tree forest 21 Open tree forest 20 Scrub forest 1 Young plantations 2 Agri.land without
trees in surround 1 Agri. land with trees
in surround 1 Water bodies 1 Young crop of arti ficia1.
or natural reg. 10
1607.69 6752.32 6430.78
321. 54 643.08
321. 54
321. 54 321. 54
8.07 33.87 32.26 1. 61 3.23
1. 61
1. 61 1. 61
3215.39 --~---------------------------------------------------------Total
16.13
62 19935.42 100.00 ------------------------------------------------------------5.2 AREA ay ~ COMPOSITIONS:
For classifying the area under different categories viz; topography classes, slope classes, soil-depth classes, top-height classes, size cla!lses, canopy layers the' sample plots bearing only vegetated area such as dense~ moderately dense, open tree forest, young plantations and young crop of artificial or natural regeneration have been taken into consideration which collec~ively form an aggregate of 58 plote distributed over a forest area of 18649.26 ha. Remaining 4 plota having an area of 1286.16 ha falling in Gcrub forest. agricultural land with and without trees, and water bodies have been ignored. The forests of Dedra & Nagar Haveli have been classified into two main strata namely; Teak and Miscellaneous. Table no. 5.2 below gives areas and percentage of tree forests under these two forest types. Table indicates that 56.90% of vegetated area is under Teak forest type and 43.10% is under Miscellaneous forest type. In Miscellaneous forest type no species was found in majority.
Table No. 5.2
BREAK U£ QE 1REE VEGETATED AREA ax CRQf COHPOSITIONS ------------------------------------------------------------Crop compositon
No. of plots Area in ha. Percentage
Teak Miscella.neous -----------------------------------------------------------
33 25
10610.79 8038.47
56.90 43.10 ------------------------------------------------------------Total 58 18649.26 100.00
-~ -------------------------------------24
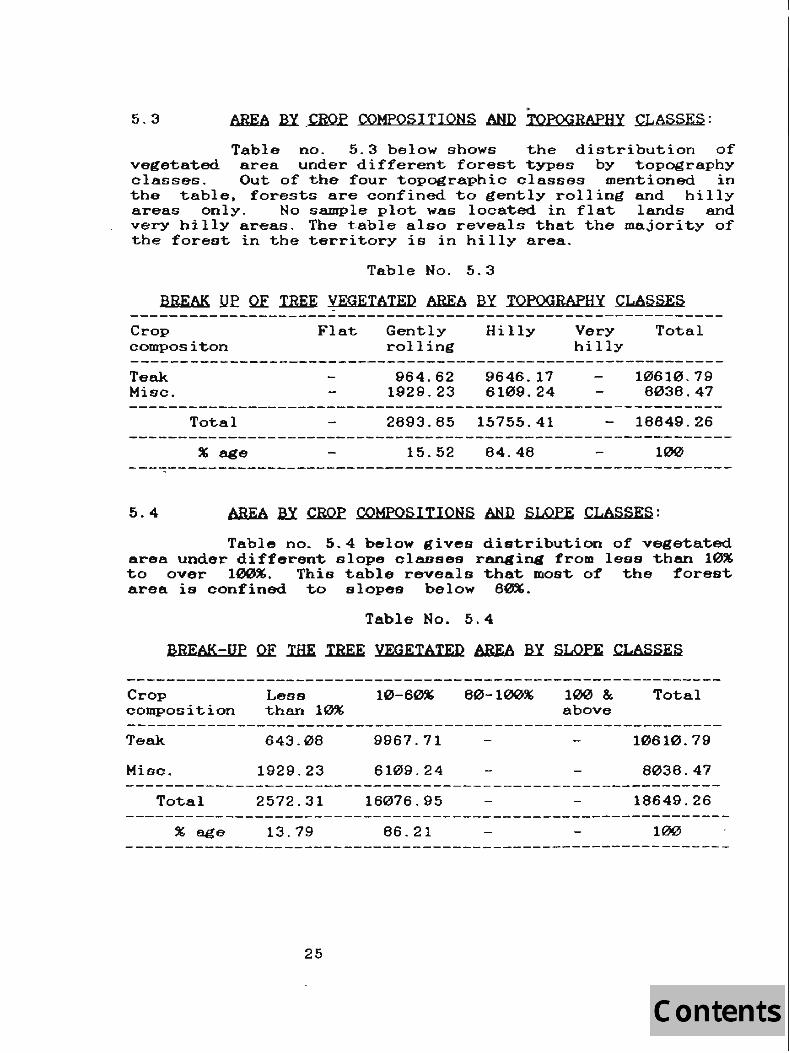
· 5.3 ~ aI_~ COMPOSITIONS AND TOPOGRAPHY CLASSES:
Table no. 5.3 below shows the distribution of vegetated area under different forest types by topography classes. Out of the four topographic classes mentioned in the table. forests are confined to gently rolling and hilly areas only. No sample plot was located in flat lands and very hi lly a.reas. The t-able also reveals that the majority of the forest in the territory is in hilly area.
Table No. 5.3
BREAK UI: Of IREE VEGETATED AREA B.Y TOPOGRAPHY CLASSES
Crop compositon
Teak Misc.
Tota.l
Flat Gently rolling
964.62 1929.23
Hilly
9646.17 6109.24
2893.65 15755.41
15.52 84.48
Very hilly
Total
10610. 79 8038.47
18649.26
100
5.4 AREA BY ~ COMPOSITIONS AHll SLOPE CLASSES:
Table no. 5.4 below gives distribution of vegetated area under different slope clauses ranging from less than 10% to over 100%. This table reveals that most of the forest area is confined to elopes below 60%.
Table No. 5.4
BREAK-UP QE IRE IEEE VEGETATED AREA B.Y SLOPE CLASSES
Crop composition
Teak
Misc.
Total
% age
Less than 10%
643.08
1929.23
2572.31
13.79
25
10-60%
9967.71
6109.24
16076.95
86.21
60-100% 100 & above
Total
10610.79
8038.47
18649.26
100
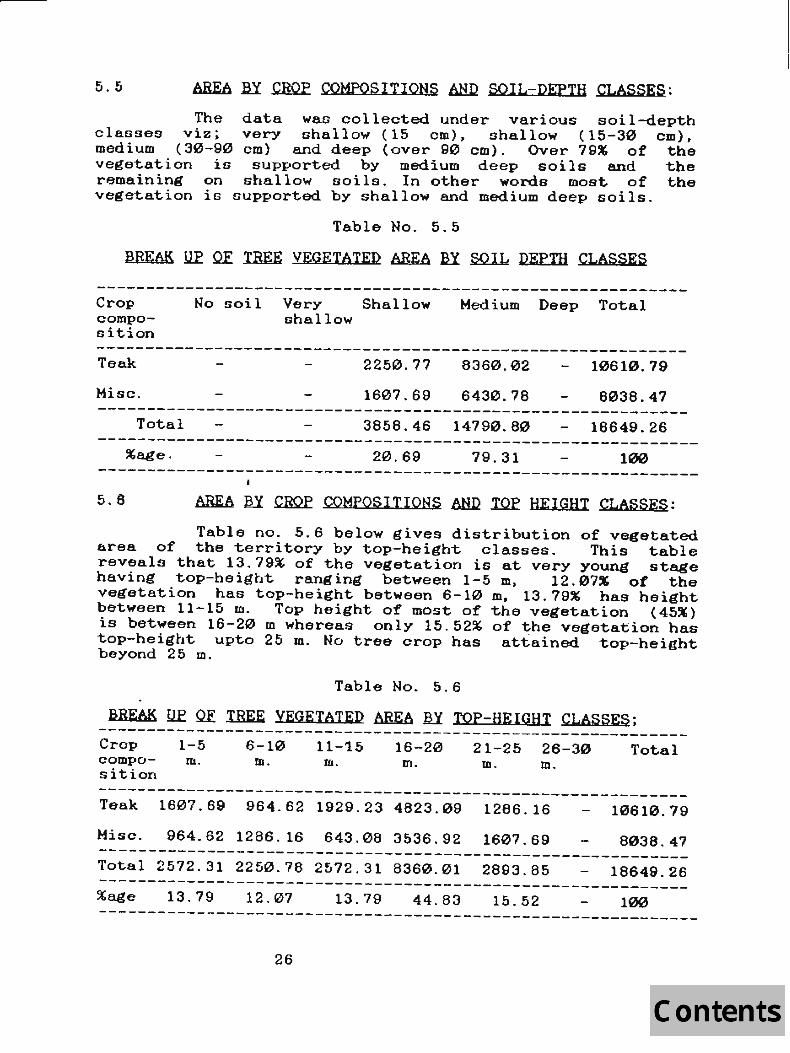
5.5 AREA BY ~ COMPOSITIONS AND SOIL-DEPTH CLASSES:
The data was collected under various soil-depth classes viz; very shallow (15 em), shallow (15-30 em). medium (30-90 em) and deep (over 90 em). Over 79% of the vegetation iu supported by medium deep soils and the remaining on shallow soils. In other words most of the vegetation is supported by shallow and medium deep soils.
Table No. 5.5
BREAK Qf QE IEEE VEGETATED AREA BY ~ DEPTH CLASSES
------------------------------------------------------------Crop composition
No soil Very Shallow Medium Deep Total uhallow
------------------------------------------------------------Teak
Misc.
2250.77
1607 . 69
8360.02
6430.78
10610.79
8038.47 ------------------------------------------------------------
Total 3658.46 14790.80 16649.26 -------------------------------------------------------------
20 . 69 79.31 100 -------------------------------------------------------------5.S AREA aY ~ COMPOSITIONS aHD IQf HEIGHT CLASSES:
Table no. 5.6 below gives distribution of vegetated area of the territory by top-height classes. This table reveals that 13.79% of the vegetation is at very young stage having top-height ranging between 1-5 m. 12.07~ of the vegetation has top-height between 6-10 m. 13 . 79% has height between 11-15 m. Top height of most of the vegetation (45%) is between 16-20 m whereas only 15.52% of the vegetation has top-height upto 25 m. No tree crop has attained top-height beyond 25 m.
Table No. 5.6
BREAK Uf QE IHEE YEGETATED ARi6 BY TOP-HEIGHT CLASSES; -------------------------------------------~----------------Crop composition
1-5 m.
6-10 m.
11-15 UJ.
16-20 m.
21-25 26-30 Total m. m.
------------------------------------------------------------Teak 1607.69 964.62 1929 . 23 4823.09 1266.16
Misc. 964.62 1286.16 643.0B 3536.92 1607.69
10610.79
8038.47 ------------------------------------------------------------Total 2572.31 2250.78 2572.31 8360.01 2893.85 18649.26 ------------------------------------------------------------
13.79 12.07 13.79 44.83 15.52 100 -------------------------------------------------------------26
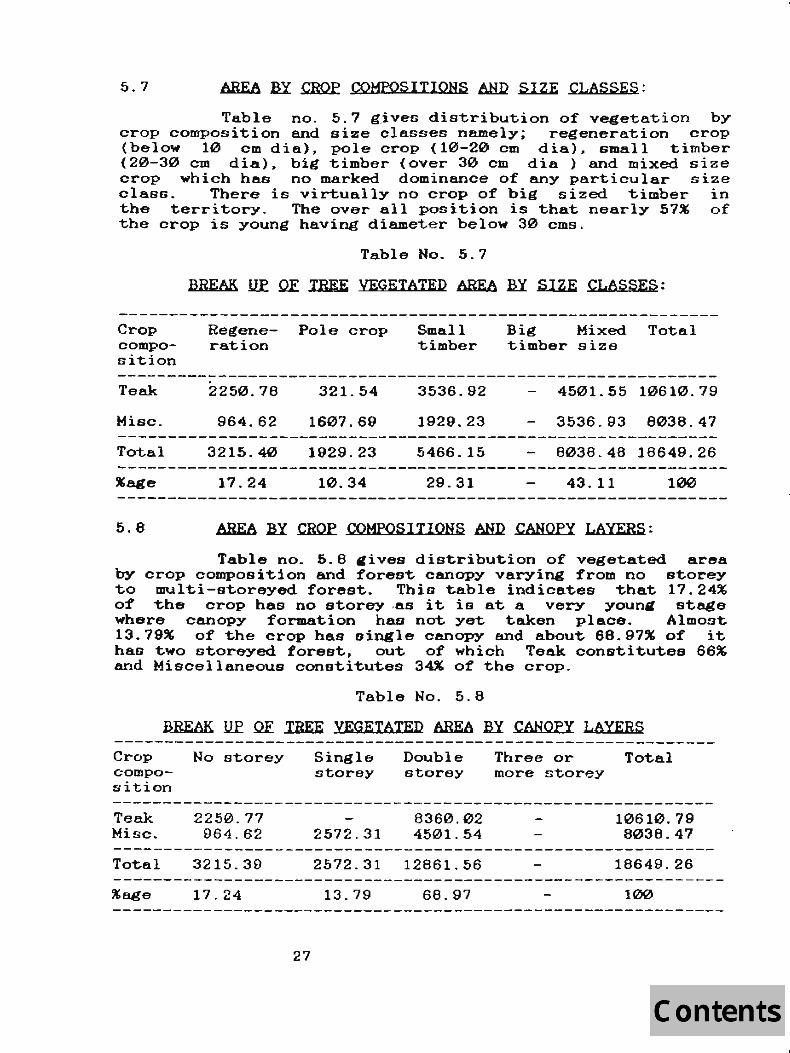
5.7 AREA BY ~ COMPOSITIONS ~ Sl2E CLASSES:
Table no. 5.7 g,ives distribution of vegetation by crop composition end size classes namely; regeneration crop (below 10 em dia), pole crop (10-20 cm dia). small timber (20-30 em dia), big timber (over 30 cm dia) and mixed size crop which has no marked dominance of any particular size c1asG. There is virtually no crop of big sized timber in the territory. The over all position is that nearly 57% of the crop is young having diameter below 30 ems.
Crop composition
Teak
Misc.
Total
5.6
Table No. 5.7
BREAK UE QE 1BEE VEGETATED AREA BY ~ CLASSES:
Regene- Pole crop ration
2250.78
964.62
3215.40
17.24
321. 54
1607.69
1929.23
10.34.
Small timber
3536.92
1929.23
5466.15
29.31
Big Mixed Total timber size
4501.55 10610.79
3536.93 8038.47
8038.48 18649.26
43.11 100
AREA BY ~ COMpoSITIONS AHD CANOPY LAYERS:
Table no. 5.8 gives distribution of vegetated area by crop composition and forest canopy varying from no storey to multi-storeyed forest. This table indicates that 17.24% of the crop has no storey ,as it is at a very youn~ stage where canopy formation has not yet taken place. Almost 13.79% of the crop has single canopy and about 68.97% of it has two storeyed forest, out of which Teak constitutes 66% arld Miscellaneous conotitutes 34% of the crop_
Table No. 5.8
BREAK U£ Q.E .TREE VEGETATED AREA lri CANOPY LAYERS
Crop No storey compo-sition
Teak Misc.
Tota.l
2250.77 964.62
3215.39
17.24
27
Single storey
2572.31
Double storey
8360.02 4501. 54
2572.31 12861.56
13.79 68.97
Three or Total more storey
10610.79 8038.47
18649.26
100
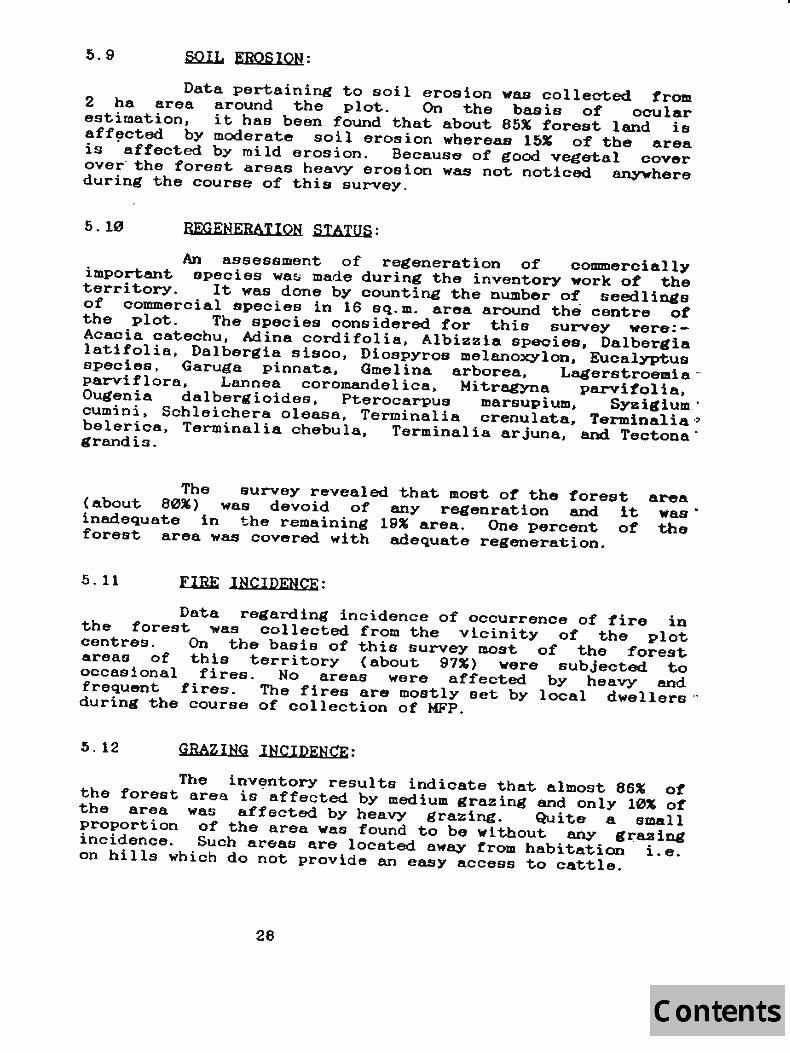
5.9 SQlL EROS ION:
Data pertaining to soil erosion vas collected trom 2 he area around the plot. On the basis of ocular estimation, it has been found that about 85~ forest land is aff~cted by moderate soil erosion whereas 15% of the area is affected by mild erosion. Because of good vegetal cover over' the foreat areas heavy erosion was not noticed anywhere during the course of this survey.
5.10 REGENERATION STATUS:
An assessment of regeneration of commercially important opecies wa~ made during the inventory work ot the territory. It was done by counting the number of seedlings of commercial species in 16 sq. m. area around the centre ot the plot. The species oonsidered for this survey were:Acacia catechu, Adina cordifolia, Albizzia speoies, Dalbergia latifolia, Dalbergia sisoo, Diospyros melanoxylon, Eucalyptus species, Garuga pinnata, Gmel ina arborea, Lagerstroemia .' parviflora, Lannea coromandelica. Mitragyna parvitolia. Ougenia dalbergioides, Pterocarpus marsupium. Syzigium' curnini. Schleichera 01eas8, Terminalia crenulate. Terminalia" belerica. Terminalia chebula. Terminalia arjuna, and Tectona' grandis.
The survey revealed that most of the forest (about 80%) was devoid of any regenration and it inadequate in the remaining 19% area. One percent of forest area was covered with adequate regeneration.
5.11 E.lBE INCIDENCE:
al"ea was· the
Data regarding incidence of occurrence of tire in the forest was collected from the vicinity of the plot centres. On the basis of this survey most of the forest areas of this territory (about 91%) were subjected to occasional fires. No areas were affected by heavy and frequent tires. The fires are mostly set by local dwellers " during the course of collection of MFP.
5.12 GRAZING lNCIDENCE:
The inventory results indicate that almost 86% of the forest area is" affected by medium grazing and only 10% ot the area was affected by heavy grazing. Quite a small proportion of the area was found to be without any g~aaing incidence. Such areas are located away from habitation i . e. on hills which do not provide an easy access to cattle.
28

5.13 BAMijOO OCCURRENCE:
The forest areas of the te~ritory are poor in bamboo growth. No areas with pure bamboo brakes or even dense bamboo could be found in the territory. Moderately dense bamboo (with 50-100 clumps per ha) was noticed in 12~ of the forest area. Scattered or sparse bamboos were found here and there in association with the tree crop. The bamboo in regeneration stage was also found in some sample plots (15% of the forest area) - these were the areas where clump formation had not yet taken place. Thus, bamboo occurrence in the territorial forests is not of much significance and, therefore, not dealt separately.
*******
29
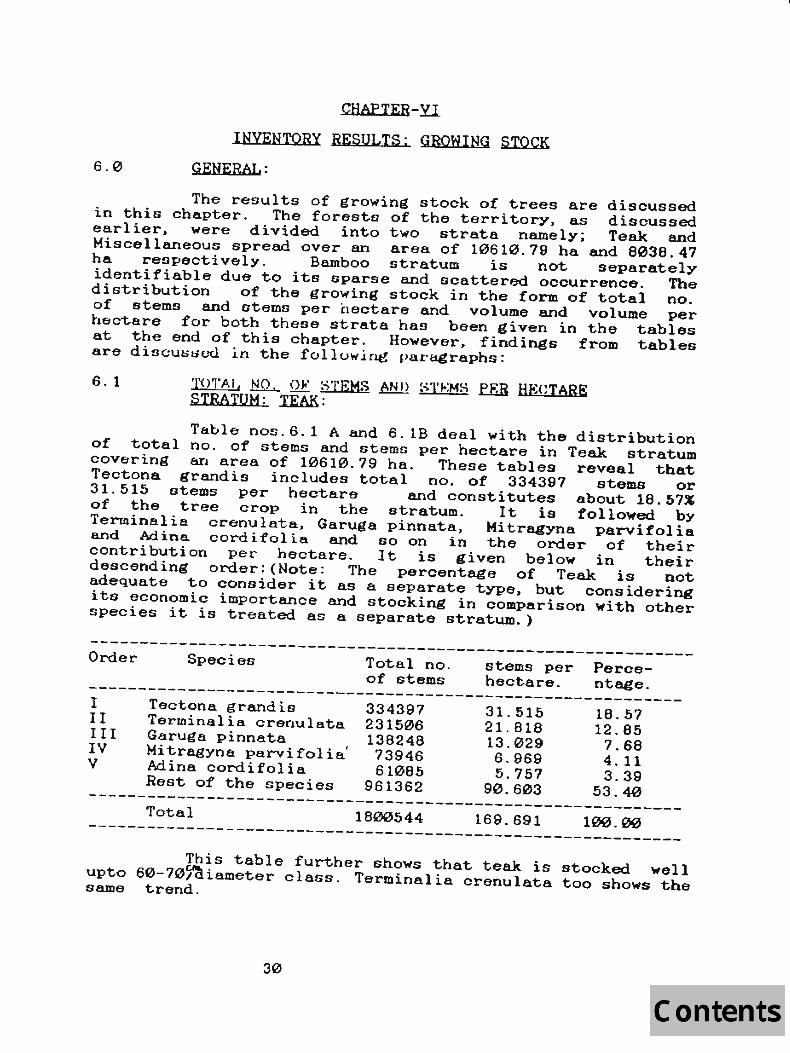
6.0
CHAPTER-Yl.
INVENTORY RESULTS; GROWING STOCK
GENERAL:
The results of growing stock of trees are discussed in this chapter. The forests of the territory, as discussed earlier, were divided into two strata namely; Teak and Miscellaneous spread over an area of 10610.79 ha and 8038 . 47 ha respectively. Bamboo stratum is not separately identifiable due to its sparse and scattered occurrence. The distribution of the growing stock in the form of total no. of stems and stems per hectare and volume and volume per hectare for both these strata has been given in the tables at the end of this chapter. However. findings from tables are discut;t;;od in the folluwing par~raphs:
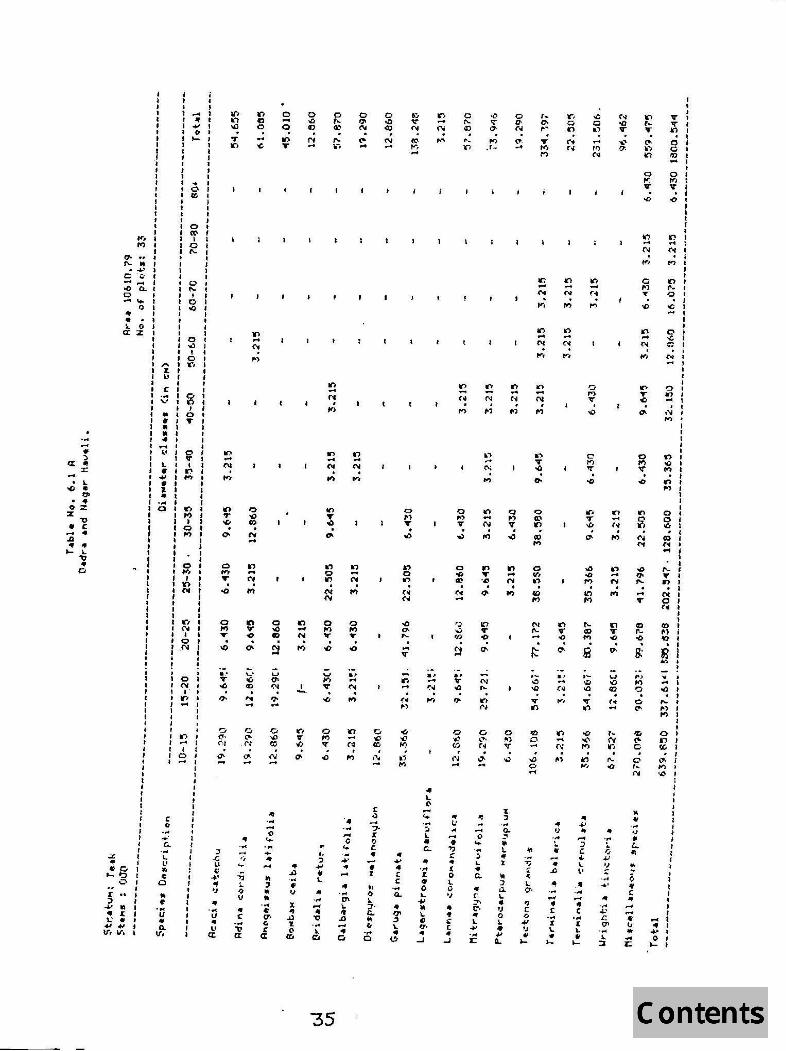
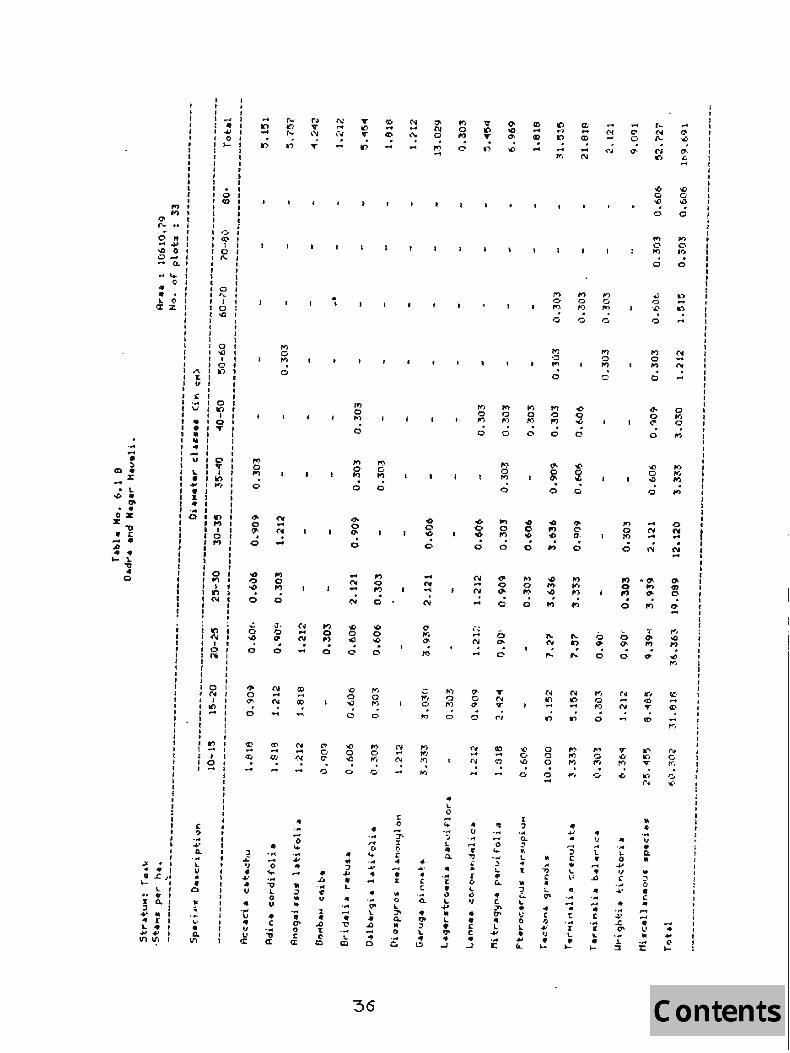
6.1 TOTAl, NO, ()It" STEMS Alli2 ~·;J'jo:MS .eER HECTARE STRATUM: lEAK:
Table nos.6.1 A and 6.1S deal with the distribution of total no. of stems and stems per hectare in Teak stratum covering &1 area of 10610.79 ha . These tables reveal that Tectona grandis includes total no. of 334397 stems or 31.515 stems per hectare and constitutes about 18.57% of the tree crop in the stratum. It is followed by Terminalia crenulata, Garuga pinnata, Mitragyna parvifolia and Adina cordifolia and so on in the order of their contribution per hectare. It is given below in their descending order: (Note: The percentage of Teak is not adequate to consider it as a separate type, but considering ita economic importance and stocking in comparison with other species it is treated as a separate stratum.)
Order -------------------------------------------------------------Species Total no. of stems
stems per Percehectare. ntage. ------------------------------------------------------------I
II III IV V
Tectona grandis Tenninalia crenulata Garuga pinnate Mitragyna parvifolia' Adina cordifolia Rest of the species
334397 231506 138248 73946 61085
961362
31. 515 21. 818 13.029
18.57 12.85 7.68 4.11 3.39
6.969 5.757
90.603 53.40 ------------------------------------------------------------Total 1800544 169.691 100.00 ------------------------------------------------------------This table further shows that teak is stocked well
upto 60-705~iameter class. Terminalia crenulata too shows the same trend.
30
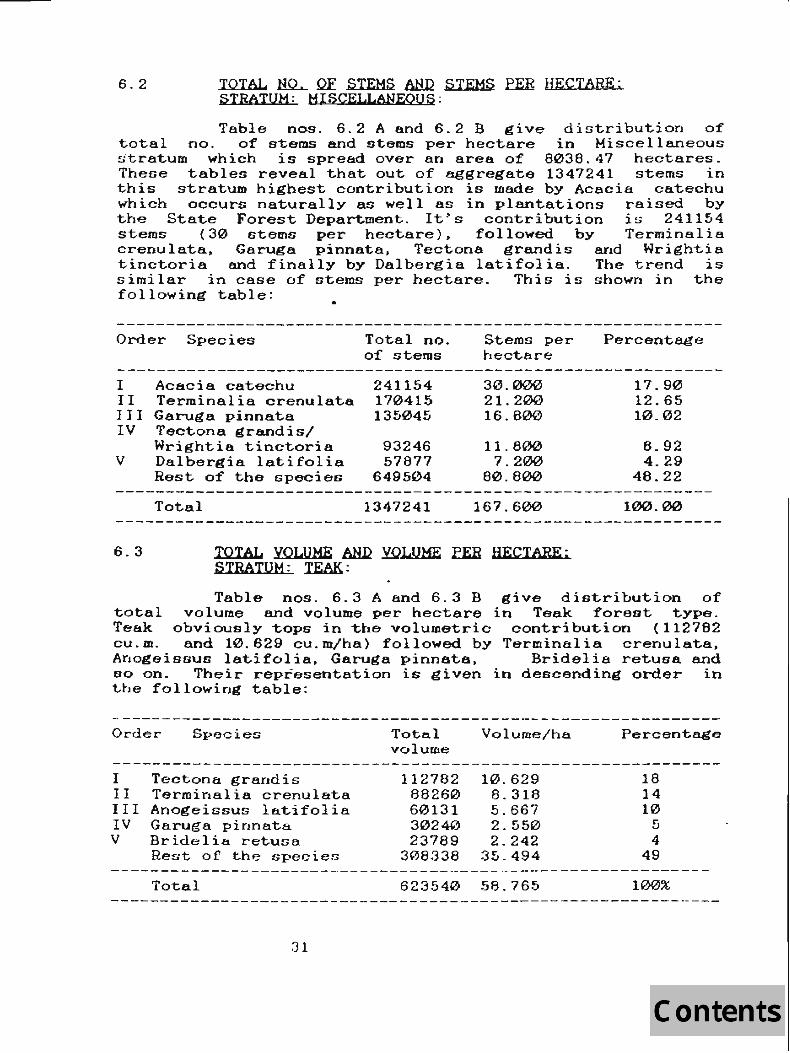
6.2 TOTAL ~ QE STEMS AND STEMS fER HECTARE; STRATUM: MISCELLANEOUS:
Table nos. 6.2 A and 6.2 B give diatribution of: total no. of stems and stems per hectare in Miscellaneous ~·tratum whieh is spread over an area of: 8038.47 hectares. These tables reveal that out of aggregate 1347241 stems in this stratum highest contribution is made by Acacia catechu which occurs naturally as well as in plantations raised by the State Forest Department. It~s contribution is 241154 stems (30 stems per hectare), followed by Terminalia crenulata, Garuga pinnate. Tectona grandis and Wrightia tinctoria and finally by Dalbergia latifolia. The trend is similar in case of: stems per hectare. This is shown in the following table:
Order Species
I Acacia catechu II Terminalia crenulata III Garuga pinnate. IV Teetona grand is/
Wrightia tinctoria V Dalber-gia. latifolia
Rest of the species
Total no. of stems
241154 170415 135045
93246 57877
649504
Stems per hectare
30.000 21. 200 16 . 800
11. 800 7.200
80.800
Percentage
17.90 12.65 10.02
6.92 4.29
48.22 ------------------------------------------------------------
Total
6.3
1347241 167.600
TOTAL VOLUME AND VOLUME EEH HECTARE; STRATUM: .TEtJ\:
100.00
Table nos. 6.3 A and 6.3 B give distribution of total volume and volume per hectare in Teak forest type. Teak obviously tops in the volumetric contribution (112782 cU.m. and 10.629 cu.m/ha) followed by Terminalia crenulata. Anogeis9us la.tifolia. Garuga pinnata. Bridelia retusa and so on. Their representation is given in descending order in the following table:
Order Species
I I I III IV V
Tectona grandis Terminalia crenulata Anogeissus latifolia Garuga pinnata Bridelia retusa. Rest of the specie8
Total
31
Total volume
112782 88260 60131 30240 23789
308338
Volume/ha
10.629 8.318 5.667 2 . 550 2.242
3 5.494
623540 58 . 765
Percentage
18 14 10
5 4
49
100%

, J:
i's 623540 Total volume and volume per hectare in this stratum cU.m. arid 58.765 cU.m. per hectare.
A comparison between table no. 6.1 and 6.3 pertaining to Teak stratum shows that teak tops the list both in terms of stems and volume.
6.4 TOTAL VOLUME AND yOLUME EER HECTARE: STRATUM: MISCELLANEOUS:
Table nOB. 6.4 A and 6.4 B deal with the distribution of total volume and volume per hectare in Miscellaneous stratum (Mixed forest type). Out of total volume of 364793 cU.m. contribution of Anogeissus latifolia is maximum i.e, 56920 cU.-m. (7.081 cu.m./ha) followed by Terminalia crenulata with 52119 cU.m. (6.485 cu.m./ha), Garugti pinnata, Acacia oatechu, Iectone. grandis and so on. Total per hectare volume in this stratum is 45.381 cU.m. Maximum volume contribution is rendered by trees between 20-25 em di~Qeter class followed by those of 25-30 em diameter class and 30-35 cm. diameter class. Following table depicts the descending order of the volumetric representation of various species'in this stratum:
------------------------------------------------------------Order Species Total volume
Volume/ha. Percentage
------------------------------------------------------------I II III IV. V
Anogeissus latifolia Terminalia crenulate. Garuga pinnata Acacia catechu Tectona grandis Rest of the specie~
56920 52129 35666 34245 20434
165399
7.081 6.485 4.437 4.260 2.542
20.576
15.60 14.29 9.78 9.39 5.60
45.34 -----------------------------------------------------------_ Tota.l 364793 45.381 100
------------------------------------------------------------6.5 COMBINED GROWING STOCK IN TERMS QE STEMS:
Table nos. 6.5 A and 6 . 5 B deal with total no. of stems and stem!"; per hectare combined together for the enti re the vegetated area of the territory, i.e .• 18649.26 ha. A combined picture i~ somewnat different from that by stratumwise. Here. Tactona grandis and Terminalia crenulata contribute maximum stock, as in Teak forest type with 427643 and 401921 stems (22.930 and 21.552 stems per hectare). They are followed by Acacia catechu, Garuga pinnata. Wrightia tinctoria and Mitragyna parvifolia and so on. These species are given in the follL,wing table in their descending order:
32

---------------------------------------------------------Order Species Total
stems Stems/ha Percentage
------------------------------------------------------------I II III IV V VI
Teetona grandis Terminalia crenulata Acacia catechu Garuga pinnata Wrightia tinctoria Mitragyna parvifolia Rest of the species·
427643 401921 295809 273293 169709
99669 ~ 1459741 ._,
22.930 21. 552 15.862 14.654 10. 172 5.344
78.270
13.59 12.77 9.40 8.68 6.08 3.17
46.36 ------------------------------------------------------------
Total 3147785 168.784 100%
------------------------------------------------------------Total no. of sterns estimated in the territory is
3147785 and stems per hectare is estimated as 168.784.
6.6 COMBINED GROWING STOCK lil TERMS QE VOLUME:
Table nos. 6.6A and 6.6. B give distribution of total volume and volume per hectare for whole of the forest area of the union territory combined together for both the strata. Total volulXte estimated in the terri tory is to the tune of 988333 cU.m. (52.995 cU.m. per ha.). On the whole maximum contribution is made by Terminalia crenulata wi1-h 140389 cu.m.(7.528 cU.m. per hal followed by Teetona grandiG with 133216 CU.m. (7.143 cU.m. per hal, Anogeissus latifolia. Garuga. pinnata. Acacia catechu, Mitragyna parvifolia, Lannea coromandelica and so on. As seen on tbe whole. maximum contribu1-ion is made by the tree crop between 20-25 em dialllF:T,F:l' r.1M1!'": "'·("'.lln'WF:ci by thhT, be .... ween 2[>-30 em dia.meter class and 30-35 em diameter class and so on. Minimum contribution is of 70-80 em. die. class which shows that big sized trees are not many in the territory. Following table gives volumetric contributions of various species in their descending order in the whole forest area:
------------------------------------------------------------Order Species Total Vol/ha Percentage
volume ---------------~--------------------------------------------I Terminalia crenulate. 140389 7.528 14.20 11 Tectone. grandis 133216 7.143 13.48 III Anogeis9uG latifolia 117051 6 . 276 11.84 IV Garuga. pinnate. 65906 3.534 6.69 V Acacia catechu 51329 2.752 5.19 VI Adina cordifolia 37197 1.994 3.76 VII Mitragyntl parvifolia 30927 1. 658 3.13
Rest of the species 412318 22.110 41.71
----~~~:i--------------------9~~;;;~--;;~99;--J(---~00%---------------------~-----------------------------~--------
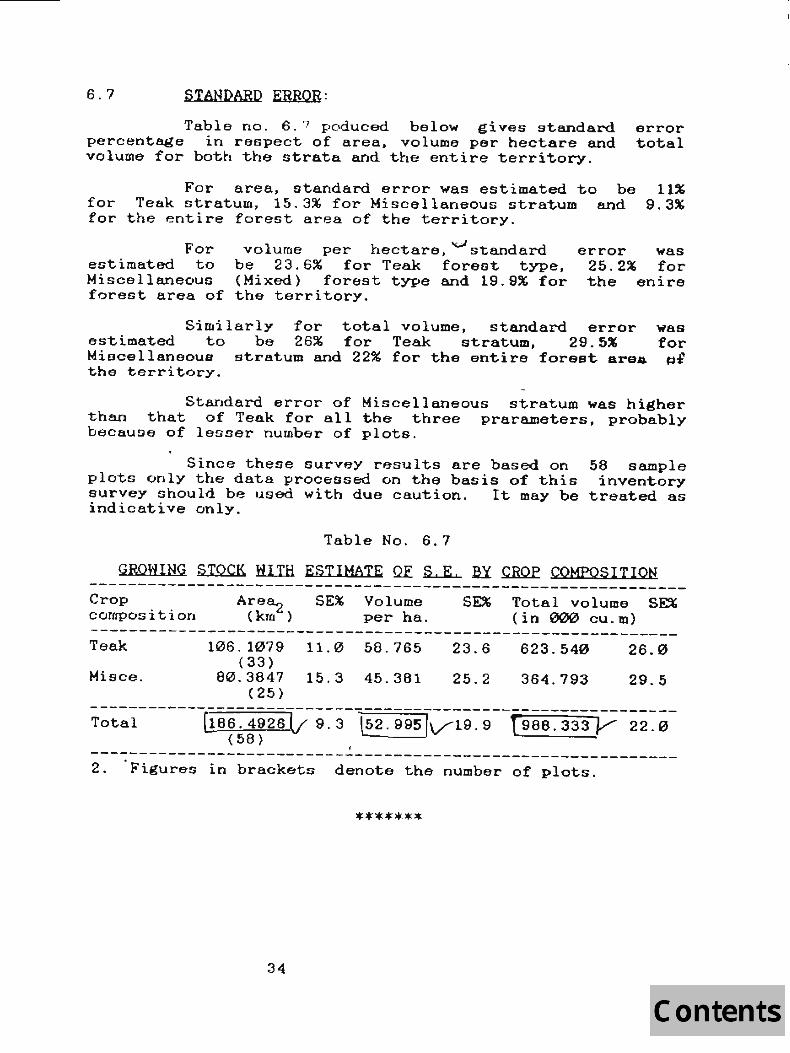
6.7 STANDARD ERROR:
Table no. 6. 7 poduced below gives standard percentage in respect of area. volume per hectare and volume for both the strata and the entire territory.
error total
For area. standard error was estimated to be for Teak stratum, 15.3% for Miscellaneous stratum and for the entire forest area of the territory.
11% 9.3%
For estimated to Miscellaneous forest area of
v volume per hectare, standard be 23.6% for Teak forest type. (Mixed) forest type and 19.9% for the territory.
error was 25.2% for the enire
Similarly for total volume, standard error was estimated to be 26% for Teak stratum, 29.5% for Miacellaneous stratum and 22% for the entire forest arS4 ~£ the territory.
Standard. error of Miscellaneous stratum was higher than that of Teak for all the three prarameters, probably because of lesser number of plots.
Since these survey results are based on 56 sample plots only the data processed on the basis of this inventory survey should be used with due caution. It may be treated as indicative only.
Table No. 6.7
GROWING STOCK Hl1H ESTIMATE QE ~ BY ~ COMPOSITION -------------------------------------------------------------Crop composition
Are~ (km )
SE% Volume per ha.
SE% Total volume SE% (in 000 cu.m)
------------------------------------------------------------Teak 106.1079 11.0 58.765 23.6 623.540 26.0
(33) Misce. 80.3847 15.3 45.361 25.2 364.793 29.5
(25) ----~-------- ---------------------------------------Total (i86.4926V 9.3 @2.99Sfv19.9 [988.333Y 22.0
(58) , ------------------------------------------------------------2. Figures in brackets denote the number of plots.
*******
34
... ... • !)
CD " x: • L '" . IJ' . .. 0%
Z "'0
• i A .. " 1-";
" C
, I I I , I ..... I I " I I ~ , , 0 • j I- I I I I I I 1 I • I I I I I I I .;;) I I <D I
'" I I I') I 1
t t I i
o .. ...... f or;, t f I ~ t
: : 6 : ..0 0 0_ ... <t.
I I,," I , • I
.. .. I I I
.... I I I o I 1 I
, I\:)I
... (I a::z
t • f"- t I 'J I ItO I t t ~ I r I , , I I I I I I I 1 I lOt I I '() I I I. t J 1<::" I " I ~., , I r. I I J ", I I , I I s: I I I· .. 101 I V I In I
I '" t .. • 0. 1 • J T I 1 '" 1 , .. 1 I I .. I , I ...... t I u , co I I , ... , I ~ , I I I • I I<') I • .., I t', • : :: : I '" , I ... I , 10110' I I,., I I I 1 I I 101 I ,'''' I
• I I I I I , t I I I I t '0 I
• I '" • I I I I I I n I
I : <'I :
! : : I I I , I I t I I t I , I I I I , , , 1 • , I I I I i
• l I I , I I , I
~ • I .. 4!1 •
: ~: • I t • 0, I N I I , , , , I I I 10 I I N I I , I « ttl I I I I I I , , , • I , .., I 1 ... , I I • : ~ :
." .. a.. ...
, I I I I I I ,
". o 17-. o
;g -D . (;)
". o 07-. o
::r ..: 'J • II.J; JI
.... t
I. U ~ ....
I. I .. I
J: 110. I ::l I
... ' .. t .. ][ I L .. I ~"'I VI 11', ,
• o
... • Q. VI
.. V
10 ...
N ... N
..:
,., o It)
o J. o "co
.. ... '0 ~ ... "'0 I. o II .. ,
:;; a:
\~ ... ('oj . ...
" -o ... ... ... .. " ::l .. .. ... .. Cf' ., r a:
M o II' . o
.. .... . ; "
N ... ,"
. I
If)
o M
o
",. o 0-. o
-.... ...
.. .. ::> ... • '-..
It) o It)
o
'(J o
'" o
I', e t<l
" ~ .. -" .... .. .. ... ~ \. ..
.Q -.. o
36
s; <: ... -:T' ::r ,., i': .. • ][
oQ
0-N o . 1':1 ...
~ . o
4 -+' • , C
0.. .. "-" ::> \. ..
C)
~..,
o ,,' c
.. \.
" .... .. .... ::. "-" t1. ..
-.. ][ .. ., L ... " L • 0-..
J
o
.. U
e .., ~ . i c, I. C) OJ
.. .. t:: C .. .J
'IT n ....
... o I")
o
.. '0 ... ._ ~ '.. Co..
" C. ;;w. fl"
" L .., ," r::
-0 o ~ . o
,., o ~ . o
1 '::I ," 0.. ~ t, \. .. 'I
'" :J .:.. t.. .. U o I. • ..
"-
CD .... CP ...
1",
M ':;l ...
.., o ,., o
..,
o o o o
.. ... .., C .. I.. ".. .. C ., ... oJ
" I-
..,
'5 c .' I.. I'
... . c
... N
1". o ,., o
.. OJ .... 'I.
" .... .. .oJ
.. . .. ... .. t ... ][ .. " I-
.. ... L o ... OJ C . .. .. .. .,. ~ t7'
.I. ::1
.... o 1", . o
.... o ·co
I')
Q .... . o
N ... . ""
10 .. . .. OJ • CL • .. .., o • c: ..
..... .. U .. -.. 1:
",
o I', . o
~',
00 ('I ... . ('oj -
...... .. ... " I-
I , I I I I I I 1 I , • I I I I
• , I : I
• i I I I I , : I , , I I , , J I I I I I I I , I , I I I , , , I I , , I I I , ) I I I I
f I , • I I I , I , I , I I r

... ~
a: ~ .. N% . ~ l
• C7' o .. zz
!~ .1:1 .. .. ~ ..
10. "'0 .. o
-... 0 (\ ro .. I • • C LOr'ZZ
...
I I I , I I I • I I I I I I I I I
• , 1 I I
• I 1 I I I I I I I • j t t f • , 1 I I
• I I I I , ..
'J .. I .... 0 , 1:0.
'C' i • , I t • , I I
,.. I: U
.:: ... "V .. .. ..
110 .. ...
o " I o ..r"
g I
o ....
U I CO 1 'II'"
\.. I I • I t."')
.... ·4 fit) • I I 1 .. I
.0 : .r,-I ~ I I 10 If') I I I I 10
:'l' I~ I I I I
r fJ I I 10 IN I I
• I 10 IN
• I , 1(:",
J I I I I
:~ I I 10 I
c o :v r.. . ~ ... l'
" .. Q
" • ... IJ • A.
V.
,., 'l'" . -D
:l ..c. v • .., '" " • . .. U .. " cz:
'" 1"1
... .. .... . '" II) ... ('~
... M V
'"
..
., ... N . M
" .... (\ .... :t -..
j .. to
II") ... N . ,..,
II") ... N
po;
... 'J
J ... Jl I: D ~
" !; :> ~
• \.
" ." ... " "'0 ... .. Ir<
n ... N . ""
N
'" lID . ('II ...
I~ f_
o
'"
.. ,.. Q .. ... .... .. .. ... .1:1' ;
.Jl -... o
7/1
11'1 ... N
I')
t <) ,. r c. c .. .... .. t .. ,._, L
" a.. " oil ...
o
.. \. (0
.. .",
t -co ., '.... .. l... ~. ...
..J
,.. co ... N ...
... ,., 'I"
..;
to .. (~
M
... po;
"'" . '()
" 'j .. .., C .. J[ Ij
\.. .~
' J .. .. c r. • .J
... '" T . or.
.. ... o .... '$ \. • 0..
" t -;:r, 'CT'
" L .... i:
,._ ,... o , ~
10
('oj . n
,.. ,._ o . ~
. N N
.. ... .., 1: .. L c:ro .. t o .., " • ...
... '" V
.. 'I .,. .. .... ..
..0
.... .. C . .. x '• ...
1<", ... V
.:> t · .
o ,-
" "" .. S [. tI \. ~,
.... .. C
'x L • ...
... ., ... . '"
".
'" t-
o ,.
.. 'r' ,; .., 'I £: . .. .... .. .,. ~ g. ... L
::a
-0 T 0:;,
T .... ,..,
.. .. . .. 'J • Q. .. .. ~ .. s: ..
.... .. l ' .. ...
:a:
. c • (\I
'() .... .... . .. or
lO IJ) I")
, I I I I' I

... .... to
Co , :t:
'" • I.
00 " go
• • OZ z:
"0 • C
.... " .b .. ...
~1 o
.. ;, o • c "
,._ ....
..
• • • .... 1 .. I
"" 14 • j... •
I 1 , • I I
• I 01 'II' •
1 I
• , " . I. c-
O. ~I 1 I 01
a:2
""' , i : I • lo:l I
t • ('. ,
f • f • I 101 I • 'D • 1 I •
• I • , , I I I I I 10. 1 '00. , 4 I •
: " : g : • 1: 1 • I U' I I 1 • I .s:, I I· .. 101 • V I In I 1 " I • .. 10' • • I ... I • .. , I t .. I I 1 ~ I I I .... , I , V , 0 I
: L I 1" 1 1 • , ., I
~4"''''''' I • I I 1 Z I I I ... I , • ...4 • 10 ... I ,., ,
I " I 0 I I M I I 1 , I I I
I 0 I I ... I I .1 I
I IN 1 1 I , • I I
I I 1 : I ~ l • 'f. I I a I I I I\j I I 1 1 , I I , I , I , I , 10, I I (It I , I 1 I t t .no , 1 , 1 I 1 I t I I I 1 I I I • I :; r. , 1 ) .... t 1 I 1 1 i • 0 l I • I 1 1 I I 1 I
I
• ! I I
I:
"
I I I
.... 1
I I 1 I 1 I I I I 1 I I 1 I 1 ,
. , 'J I .. .. I
C 4:
So. 1 . " Q.J
I I
.... L V .. • .0
to • ... U
" 11. V.
I 1 I 1 I
o g o ...
, o
o i . o
o o ., . o
8 CIt . .. g .., , ..
o o N
;, ..c. l' • ..v ... 'I .. ·u .. IJ
a:
o o Co . "
o o ... . o
o ~ . o
g ~
o
~ . ..
g .... o
.. -0 .... ... "0 I. ~ V
" C
g ... . o
o o .... . N
.. 'M -Co .. ... .v .. ... " :J .. 11 ... • (!\ ')
:I: a:
o o Gl . ....
c o v-a
o o ~ . o
o a .... o
g ... . o
.. J:; . ; 'J
:z " ..0 ~
.t
g ... , o
g .... . o
o o II:)
o
... • , .., • L
.. . ,. ... .. " ... 10. j(j
o ~ . ...
8 (It . ..
g o N
" ... ... c. ... ... .... .. " 0-\. • .I. -• o
o o N-
o ....
g .... , o
c o (D
o
~ . ...
c o ... ~ I o C .. ..... • I
" I) I. :T. Q. .. ') ... c
"38
00 o T
N
'=' o 'If . C
c c;, co Q
o o 00 . I')
o o .... . tl>
co .... , ('oj
o o .... o
o a .,. o
0-CI
'" . ....
o o T . N
o Ii o
o o or o
8 ~ . o
Co '=' 'II"
o
'=' o ..... . o
..
.' .... " "0 C .. J: C. ... c· v .. .. c c ..
J
o o CD , o
o o 11) . c
o o 'D , o
g T
o
0-o ...
o o
" ... .... Co .... .... ::l \..
" C.
~ C ~ C7> .. I. .... . ..
x:
'.J Co o ('oj
o o CI . o
o o .... . o
o o 41)
o
o o oD
g o . N
o o .., ,.,
g oX) . N
o c '" ,.,
'=' o .. o
c o ~
o o ,.. ...
o o .,. ,
....
o o .,. .,..
.. ..., • ..... , c • I. l'
-" [ .,.. I \.
• ....
o ~ . o
~ '.J ... .. .... • .D
" ... ... " s: . ,. r: L. • ~
o o I£J
o 00 <:' .~
o o «-o
o o <:'
N
.. .,. L Ci +' u r
. ... .... ... ... ... . .&. 0' ... " ::l
o o ~ . o
g ('C . ...
00
li! o
o o o .....
o o ".
~
\II • ... 'J • 0.. -. .. :l V .. C • ,.... .. u .. .,. x:
Co C N ...
<0 o It<
o
'"
o o
'" . ..... ...
... 1<',
... .. .... o ....
, • 1 I • 1
• I
• I I r I I I I I I , I , r I I I 1 , J 1 I I r I I I I I )
I , 1
• I I , I I I I I I
• I
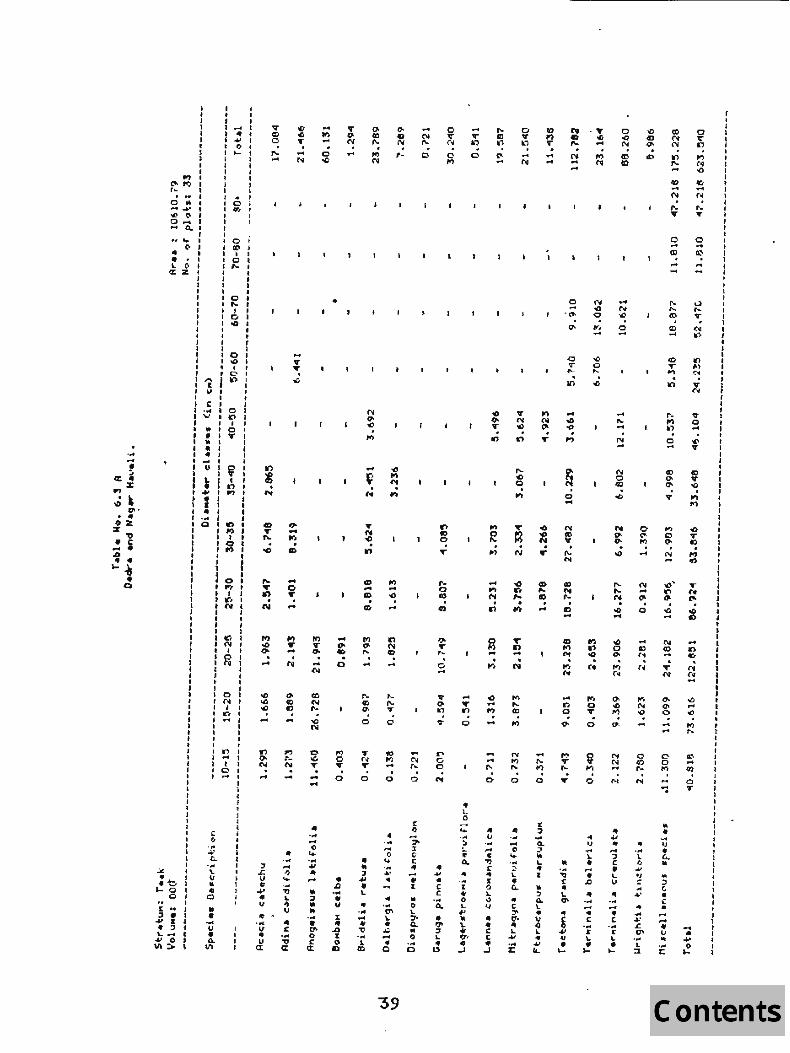
o ... .... ~
~~ ."
~ , 0" . ..
oz z " • c -. .Z1I. .. ..
""~ .. Q
.ot.
, I
• • J I 1 I .... , I" , I ... t t 0 I J 0-j I I , I I
.", I "',., I , r", 1 I
o .. -~ ~ <' 0_ ... Co
I , .. I 'Co • 'III> I I I I I , I ,
.. I '0 I CO, I «' J
.. I I 1 I .. , 'C, ~ "I ,,._,
CZ; Z, , I J J I I I 1 I , I I I C I I I .... I J I J I I 101 I I 00 I , , I , , I J , r , , I , 10' I 'ooj) I I • I • J • po ,
I 'I I ~ I , \II. , I I • I C I I.,. I 0 I " • ~ I " ... t 0 I • I ". I ... I I • , I .. J • ... I
I 1.1 I ~ I ~ I ~ I ... I ." I
ttl : I II I I f ... f I , Q , II) • I f I') I , I I I
: : ~ : I , ,
: 1 I I lo: , I..,.. I I J f , I r. I , I til I f f J , , , I I I 1 I 1 I I 10 , f '''' I , I I I J 10 , IN I I j I I , , I I '0 I r l". I I I • lor-. , , ... I I I , I I I ,
J I'" I I'" r I I I 10 , I , I , I I I , , I I I I , J ,
... t
..
.b 10-0
J I ,
... \. U .. .. o c
It ., :J •
... I: .. :J '-... 0 VI:;"
r I J , f I I I
• •
v CD o ..... ...
. N
"" ... In . til
:J .&. V o +' .. OJ .. ... OJ .. u
a:
... o w-...
~ ". ...
o t"t
,., 1"_ (\oj . -
.. ... .... 1", .... ... ." L I)
" .. 1: ... .., a:
o .c, ... . ... ..
... (I ... ... ... .. .. :J .. .. ... .. 0'> o !:. a:
•
... : . o
,., C w-e
.. D . .. tI y
~ ..Q I: o
II)
". CI' N . ...
cD ... cD . II)
II .. :J ... .. L .. ... ... • -g ...
c5
~ CI N . r-
...
C'I N C) . ...
o
.. ... " .. ... .. .. ... '" '0, \. ..
..J ... .. o
-('I r~ . o
.. o ~ ":1. 0.. .. o ...
o
N ,.._
I:)
,._ o «) . II)
co o ,..
.. .., .. c: c ... (&. .. .,.. :J L ..
a
". In
o
.. I. o «: ... ? ; c..
... c ....
o 1"
... or> N
o C'I
f, ... . ~
... ... r-. o
" u ,.. C ." :r:: .. s ~ \. '0) lj
II .. c: c ..
..J
roC o
o ".,
. I'll
... ., ... . til
" ... ... " ... . .. " \. .. c.. .. C ':!' (1.
" L ... . .. z:
10 II) ...
. ".
f 10 . ..
... l"n o
.... ct
"" N ... ...
o o .. . .... ~
01)
'" ,... . II)
. ". 00 ... . ,.,. 1'4
".. ...
'" c .... . 00
,... o ,... o
o v
"" . o
.. oJ .. ; ... .. .D
" -.. c ... Jr L ..
10-
... "" ... . N ...
00 o ... . I') l".
N
.. ,oJ .. ... E • L V
.II . .. ... .. c ... r \. .. ....
e (9-M . ..
... ., (~
r~
,... N ..,
o ... ~
M o C)o
N ...
N <0 ... . T N
.. ., ... 'J • c.. .. .. ;:, G • .. · .... .... ., u .. :r:
v o ...
<0 .,. 10 . ,., .,
-• .... G ....
, I I I , I , I I , I I I I I • I
I r I I I I I I I I I r , r 1 I , I I , I I , I 1 , I I
I , , I J 1 I I I , I I , , I , I I t J I I I • • 1 , , , , I ,
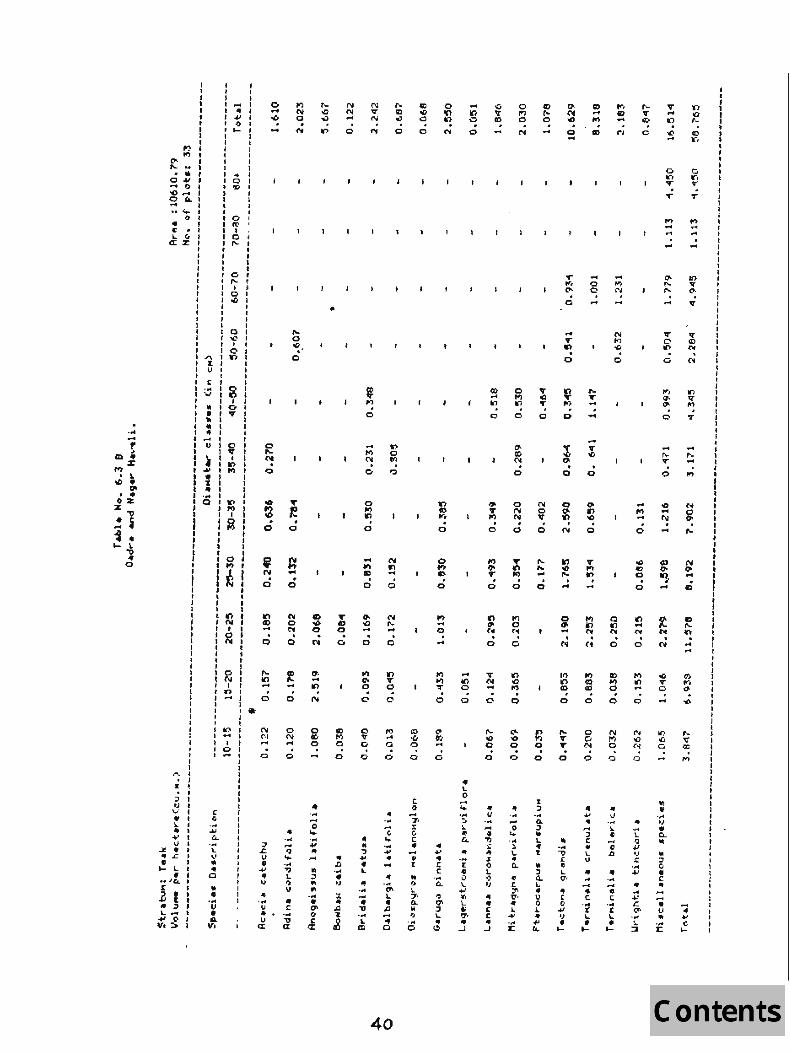
.... ..
.4J (i I-
"'i 1'), •
.. e • L. U
a::z:
'" , Z
;;) tJ ..... .. lo.
" .' U ~ .. " .c. • I- L. • •• .Ie&. J:
Z I " ;, L ... ~ 0 v. :.
I I , , I I .. , 10 , . ~ I I , I , I I I , , o
It' , I , I I I I I t • I , I I I t , , I t I I I I I , I I I , , I I I , I I I , I , I I", 1 I ~ , , U I , t I ~ , , .... I I'" I I , t .. , I • , 1 .. 1 I ~ , f of , , .... I I II I I I
I ) : I .... ,
I : : I " I J ..... 'Q 1 : { I j I , , I I I t , , I , ,
I I , ,
I 0' ,,"I
I I I ,
O. ...... I I 01 "', I ,
I I
01
'" I I I 01 101
I I , I
~l I I 01 VI
I I I ,
il , 1
."
... I I I I I
10' 1")1 I I
~: I , I I o ,
1')' , l ~,
I , I I 1
I , ~ I I , I I , , , 1 , , , , 1 , I , , I I I I
c « ... .... c... I.. ., .. ..
C .. • ... II • .Q.
11',
I I 01 NI ,
I , I
~: , I
v , I I ,~ I ,
to I I
I I 01
t I I I I , I I I I , I 1 I I I I I I I t I I ,
00 ,.,
- til -I> c . i't
. . " o
. o
"" (\I
Q
til C N . C
~ ... . o
o N
o
.. .... ;;) ... .c. ., u ... . . .. .... ."
" l.. " I)
V ... " U C .. ~ ...
r'i. '3.
o 11:1 Co
'0 ... ... ., .. .... .. :l ... ., ... • C1' o J
"" N ... o
..
.. ~ Co . C
C) 1"1 Co
o
.. n . ... " .J
, ,., · o
... I") (If
o o
o ,., 1fl · o
.... '" 01) · o
co
~ II ., ... " I.. .. ... .... " " ... L
IX'l
o
,., ... o o
.. ... ... C; .. ... .., .. of ... t" I.
" ..0 .... ... o
40
c o ,... 7 ' X (; C
" .... .. I .. '> ~ 7, 0. .. " ... o
o I'> C)
o Q
If) ... o
o ..
(0.
VI .. , o
.. ..,
... t C .~
In o . o
... 10 o o
" \. o .... .. ... j
e CL ..
.~
" o I..
-OJ w, I.. to '1"
" ..J
"" to C
o o
.. V
.... • "P) .: .. '" (i \. " IJ .. " c r::
" ..J
o I'l o N
o M if)
o o
o N N
o o
.. 10
'" . Co
" . .. .... o ..
." ~ \. .. c... <I C; :!' 17, ... l. .., ....
:r::
~ ,., o . ...
N o v o
,.,. ,., ... o
~ o
o o
Do ('01 .c . o ..
... .. In . o
~ . o
o ~ . to!
III In CD
o
,.._ T 'II"
Co
.. . .. ." C ~ I.. '7'
" • o
'" oJ
• I-
... o c:-
o ...
l"T ...
· o
.. '" ., · ...
If) ., N · (t
If) ~ GO
o
o o N
o '.:>
.. .., .. '3 c .. \. V .. ... " s::
. .. r l.. • I-
t"1
.... I') t"1 . ....
o It) (\I . CO
Gl OIl o . o
N ,.., C
o
.. V . .. I.. ., ~ Jl
" .,. .... CI C. . .. r \. • ...
... ,., ...
.<) 41> o . Co
It) ... (\I
o o
o
'II" ... 10
Co 10 ,.. ,..
... ".. 'II"
o o
<l:I ... N . ...
.. :l o tI C ..
.... • U ..
." z:
Co 1('. V'
T
... .. ... o ....
or, 1Q" ,.., T
... ~-...
I) ,.,. _., . ...
I , : I I
• , I I I • I I I , , I I I , , f I I I t I I I I ! I I I I I , I I I I , 1 I , , , 1 I I I I I t I , I 1 I 1 I
: I
• I
I , I , I I I I I I
I I
r I I , I I I I , , I I I , • I I , J , j
1 I I t I I I I I I 1 J , I I 1 t , • I , t r , I 1 , , I I I
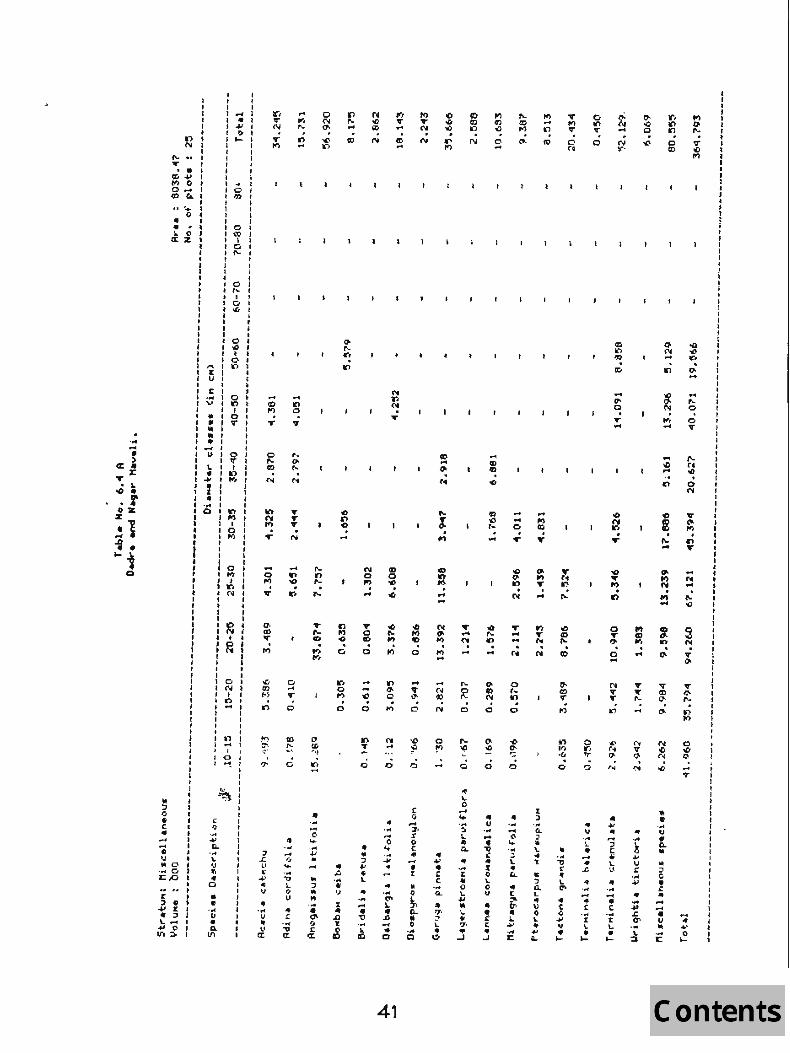
t I I I 1 I
1'), NI
I J'.. 1 .... I ... I
u:.'-I ~ CI ~ 0 ... 1 'l) (&. I
I
'0 : .. I ••• I.. 0 I ~Z.
I I , I
.. o '1>
o \"'t\ I
o f'.
1 i I I , 0 I I' f~ I , I I t 0 I I '" 1 I I , I I I I I I 0 I I .0 I I • I I <:', t,r,. n' I r:: I I U I I • I i: I : ~: ~ : I I, I • .. to, I • 1 'I" I 1 It 1 I I .. I I f • I i
: -.; ~ : I 1 ~ I
: ~ : i, : t _", t ~, , J ., I 1 'I I J '" I I . .,. I I I 0 I ~ I
: I I :
: : ~: • I I
: : I • I I , I 0 I I I f') I
: I J, l t • N I I t I I , I
I I I I : ~ : I I ••
I : ~ I I I I I I I I I I I I I I lOt I I (II I I I I I tao t J ...... ) 1 1 I I I I I , I I , t I Il")l , I .... 1 • J I I t • (:) , ~ '-t t J J 1 I I I
j .q_: ~: : Go r • • I C I C I I) t .. • .... I
.... : i i G • .... • t.l I: \.. 1 .. 0 I Ii , .... 0 ' " I 1:,0 I .. I
r:: , 0 ... r:: • ::I 1..... 0 Vo:>
• 0 , I I I .. I I • I • ...c ~ , U I I • , , a. I I In I
.... (I) ..,
o or
In ('oj .... . ... ... o I")
o ....
a, m .... . ~
::I -C t' L' .., " OJ
" ." u .. t'
!r
... ... ~.., ....
... 10 o .,.
" .... 'V'
...:
o ... v o
Q) ,._
.... '.I ... :;; '.., u
1 '0< ." a:
" ' .. ... o ... ....
.jJ .. .. :J .. .. ... • '" Ii s: ([
«l
'" G . o
V> o I? . o
.. .Q ... fI V
1: ... ..0 'C
~
('oj o I') . .. .... o ID . o
... ... -0 . o
" .. ::I 4' • I-.. ... ... • "0 .... ~
fI'i "II" .. tl\ ..
N TN . ....
.. ... ,.. o ..
. .. ~ .. .. ... to' I.. • ..0 ... .. o
41
If) .... ('oj
{'of
00 ,., 'II . o
... ". .:t-
o o
o
c ')
..... 7· X cc .. .... • I
• 0-
~ II 0-...
o
o ...
.. ..., .. , c . .. 4 .. '7' :J' I.. .. ~
'II" ... ('It . ....
..... R o
o
.. I.. o ...
to. ... ;. :.. .. Q. .. . ... z: 41 o I~ .. l.. .. '7'
• ...J
" U ... ... • " " .. ll' o Io U .. ~ " ..
oJ
,.. .. o ....
.... ... . N
o r~ 10
o
o
" ... -() ... ... ~ ... .. (L
.. r: ~ CT> .. I.. .... ... I:
I") co · ....
~ II) .... · ... .., .... N · N
I') II) .(1 . o
'II"
"" v-a rc
.. .., ... • ..... • 1.
-.. c ... , I.
• ....
o 10 v-a N
Y,.'
.. 11' o . " ...
00 ('oj n .;
~ QO . o ...
.. .., .. ] • l-I I .. . .. ... • t ... s: l-• ~
" ~ I'-
a(\J ....
. f', ....
...
.c ...
. I\...
"" • . .. u fI (L
"" .. ;;, c • ,;; .. .... ~ • u .. ... I:
... ,.._ c o ~
,.._ rc oil . o (\J
... '"' "., . C") 'II"
~ N . T (10
.... "
I I • I 1 I I , J I I I I I I I I I , , t ; I I 1 I I I , I I J
• ! I I , , I I , • I I I I • I I I I I I I I , I , I I I I I I I I , J I I , • I I I I
• I I , I I I 1
• I , I I I I I , 1 I I I , I I I

I , , 1 f
I 101 ,..tII.
... , .. I ... , o ,
y-I .... , • • 41» .. I I "' ... , g~1
I I ,
a.. I
•• w. • o I
• I 01 41», .. I
I I 1
.. . ~ 0 «Z
• • • , J
• • I , 0' G) I , , ~ ~
I • I I
I
I I I I I I I I
• , • ,
I 01 f- • 1 I ,
I I
01 001
• • , I
I • , I
I , I I , ~I ,
I , , . ,
I '" I It I I I
01 ... I
I U , I .~ IV I
i i I '" I " I~ I i
I
!s , , I 0 r y
f
I • , I I I 1 • I I I I I
I , 4'
! i i ~ I
j I! ! f ~·I 1 i : I ~ I , I ,
I I I ! ! ~ I I I ~ i ~ i I
I I til I I J I 1 N I
I I It.
I I I I I ~: I I en '. I I"" I I 1 I , . . I , I I • I I I ~ 1 It,... , I I., , 10. " I"', I I
" I I • I I tr I I • I ,
.. ::I I 1 :J V I I o v • • • I C I c: .. tOt .. L I ... I
... .. I 4' I
....... I 0. I • U I .,. • 'J .. I \. I .. .(;. \I I
... I .. I 'C/1.~ .. I
"I 0 I 0.. t
l: 1 • 1 :J • I • I
.~ ~ I .~ ,I '" -, .. t ~~I ~
o 00 N . Y
. o
a · o
· o
· o
o ,... '" · o
... G) .... ..:
" ' .. U
~ 10
o
, In . o
. o
... 10 o Q
,.._ .... o . o
... o ... ...
"2
~ U .. C ... • U
a; " a;
.. Cl Q
1'-
..
10
'" '" . o
N o {10
" ... ... o .. ... .. ..
If1> ,,_ o . o
f:)' I') o . o
.. .Jl ... .. 'J
,._ .. Q ..
('If
'" ... . o
g ... Q
00 ... o o
~ .. ~ .. .. L
" ... • 'V ... 10.
ID
0-N 10
o
('If
; . o
... o ... . o
" ... ... o ... • .c .., " ... .. ... V' \. ..
.1:1
-:; o
42
y o ~ · o
· o
ClllO o · o
c 00 ... ~
I .... .. I[
" o
~ .. o ...
o
-~ · o
I") ... y • ...
00 WI CI · ...
... 10 I'l · o
~ ... · o
... n ... . o
ID ID o . o
I') CZ) o o
~ III · o
~ rt · o
00 a-... · o
00 II) o . Q
-('4 o . o
.. U -" "Q ( .. J: o ~ IJ .. • C £ .. ..l
. o
... ~ o
N ... o o
'0 ... ... ~ L .. c.. .. ~
~ .. I.. .... .,.
I:::
. o
Z :l . .. 0.. :l .. .. .. l[
... ::I Q. L .. U o L .. ... ..
'" a-o . ...
o
'" ('-o . o
· o
to
'" 00 · o
-WI fOt · ..
" .., .. ... :J C fI LU
" ... .... .. C . .. IC. L • ...
.0 If) o . o
" U ... \. .. :i '" . .. ... .. [
.: ... • I-
('II ,._ ... . o
,._ .. N
o
'" .0 I'l . o
.. . .. 3 u C ... .... " --41
L (11
~
... ~ . o ...
. -til .... N . ..
.. • . .. 'J • Q. .. .. ~ • c ... ... ... • U .. ... I:
. ....
,.. ~ . III
~ ,.. , ... ..
o til N . C)
r I , f f I I t I t
: , • • I I , I , I I I I I , I I I I , I I I I I I , I I
I I I ~ I 1 I • • I I I
• , I , I , I
I , , I
I I I I
I I , I I I I
I I I
I , I I
I , I I I I
I I J I I
• I
I f I I
I I , , I I I I I I 1 I I
• , I , , , I 1
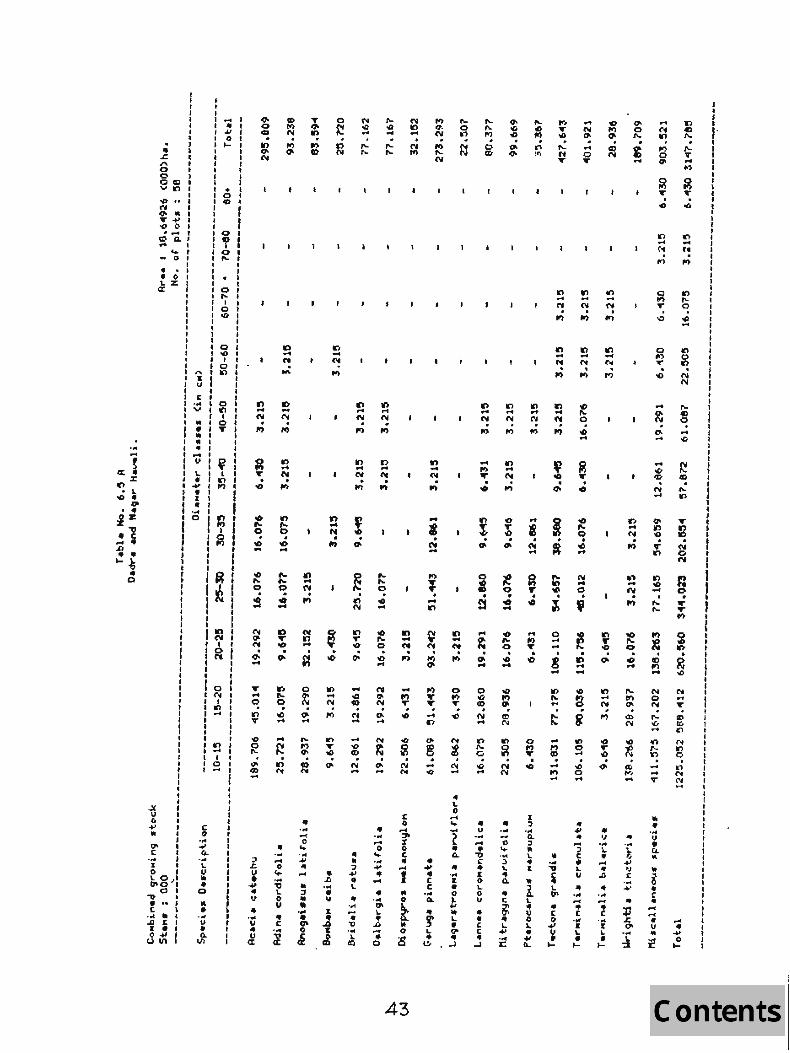
, I I , I I I , I
" I ~ , " I o I <::' I Celli vIC'll
I 'to " I t'I , 0-., ........ , "" " I ..... , CO) Q. I ... I
.. I •• 0 4
I " . , • 0 I .iZI
I , 1 I I • I I I I I I I , , I , I I I I
I I I I
I I 4 ,
I • , I ... I I " I , .... , I I) 1 , ,_ I I I I I , I , , I I I I I • I 101 , CI ,
I I : f 10'
1'1 I (2 I I ~ , I , , , I • I I I 10' '''' , , I I Ie, : ol) I , I I , , I I 0 I I -0 , "' , . 101
" 1 In I
~ I I I I
C I I ... 101 Vltnl
I I I .. I 0 I • , .... I lilt I I l1li I I .. I ,
.... , I
VI~I i I !! I
.... I ,., , I I
I I
f
: I I .!: I o I ~ ,
I I I I I I r I , I I I • I I , , I I I I I I I , , I I 1 I I I I I , I , , • I I
.x I U I C. I
-41 I
" I , 0\ I C I
'1 : o I ~g,:
01 "0 • ••• J C ,
. .,( • t ~ .c , Z • I
J~I
: ~ I I •
I I 1 ,
I ~ : I J. I I l.i I , I
: I I fJ : I I ,
~I t I I
01 ~l tn, ... ,
I , I I
~I I I s:
~ I I I j I I I I
... I
.... 1 14 I . ., L 1.1 lilt
" o
" • ." v " J,-
I I j I I I I I I I I I , 1
In ... <'I . ,.,
• ~ c . • ...
... .... o In V'
~ L
~ .... .. v
" ... 1.1 4 1.1 a:
I[) ... n · ... ID ... <'II · ~ ID .. ('oj · ~
. II) <'II
" -o ... ... ." \. o U
~ ... ~
If) .. <'II . II'l
<'II In .. . ~
" ... -< Q ... ... ., .. ... .. :r .. .. ... " : ~
. D N
tr", ... N
I')
n ... « . ..,
" ..r. . .. " \I
J:
" A
J
C'II ~ .... . ,.._ r~
· tn ('oj
In .... 00 · 0'
...
..0 '10 · C'. ... ... 'D CD · N
" " ~ 41
" \.
" .... ... " '0 . .. I..
In
In ... N . ...
... "" o . '" ...
. '" ...
" ... ... o ... ... .... " " ... 0' L
" ... .. o
It
~ o is
43
N 10 ... . ~
In -oN
~
-, . N ...
i . ... In
. ... 00
" .... " c c ... ~
10 ... (If . II'l
o Itt .. . '"
("oj .. .. 'o .... ... 1 " CL. .. ... • • o l; lilt I.
" 0'
" ..J
... If> ~ · •
· 0-
· ~
o oCr '10 · ('oj ...
II u ... ,... " ~ " ! L o II
" " c c ..
..J
In ... ('oj
I')
In ... oN ,,;
. N <'II
.. ... -o ... .w< ;)
" .. 0..
II C
~ .. I. ., ... z:
.. ~ . (\I ...
.. ~ . 'i)
~ . .. (L ;,
" \. .. • .. i \. .. U I) !I. • ...
L
. §
.. ,., CD . ... .., ...
lilt
:; i L 17'
II C
.$ ¥ ,_
... ~ . ... ~
tn ... N . I')
N .. ~ , .
10 ..
tn o .. 0./) o ...
" 41 .. 1 • L \I
... ... " II C
.w< I: I..
" ,_
... I~ ... ~ • -" ..D .. ...
... r I. • ,_
tr", ... <'II · .., .., -N · ~ '00 ,._ o · 00 ...
.. .... ~ '.r ., >J £ . .. ....
. «D
"" ... N o ('oj
r>II .... ~ I'n . -.. ,..
III
" . .. I.}
• r.. ... '" 5 " , .. .... -• v .. ~
g ".. . oCt
In .... o 00 ... ~
g . ('oj N
. ... oCr
~ o . ~ .... II)
-.. .... o ....
J • j I ,. f , I I , I I I 1 I I I I I I , I J I I I I I 1 I I I I I I I • I I I I I , I I , • I 1
j I I 1 I J I , 1 I J I J
·1
• J « I I
f « I I , J I
t I I J I I
t I , I I I 1 J 1 I , I I I 1 I I I I I I I I I I r I , I I I I , I I , I I I I I I I I
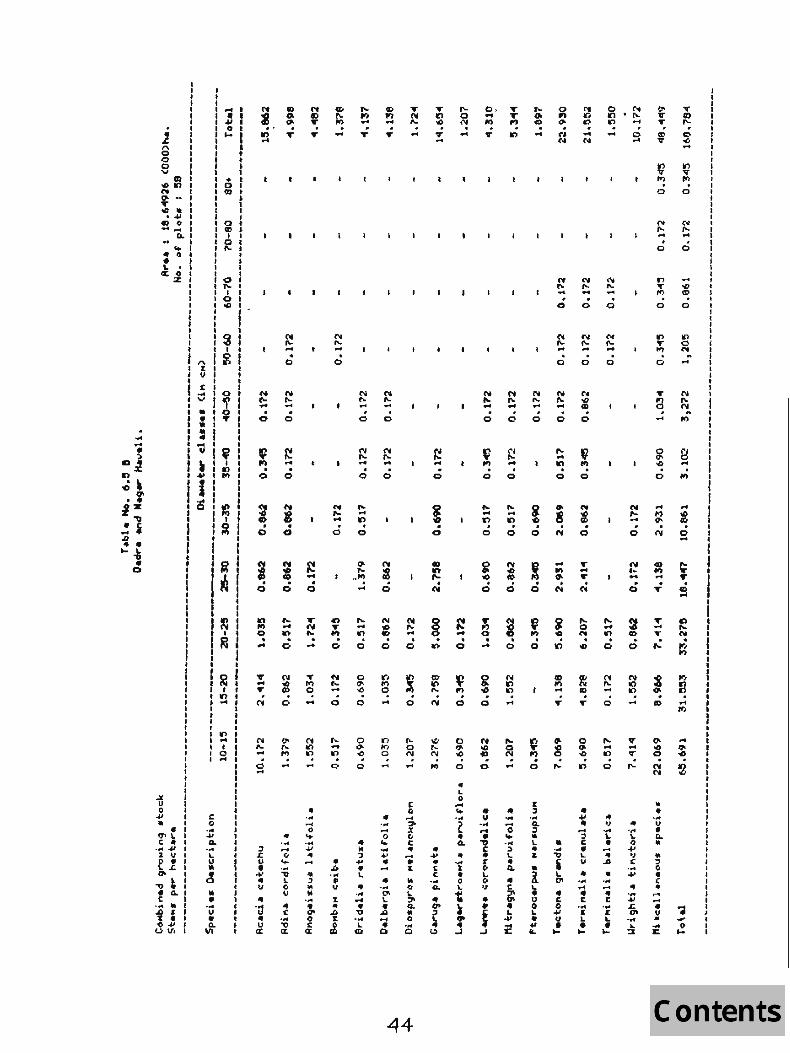
. 1 " o o o '" CI) -ClIO ('t go. •• ... ~ .. .",
., 0 ......
, , 1_. I ~ : ! .! I , : : I
I t I • I 101 I «t I I i I I I I I ,
D.
101 I m I I I I
eo. '" 0 • L • ~~
: ~ : I • I , I I I I 10'
: I ~ : , 101 I ,,.g I
, ,,' f I, I I
: I ~ : , I I ,
: " : ~ I ; ~ I : t t •
I ~ : 0 : : V I ~ 1 : : ~
111 I
i I , , I , I I I I I I I , I , I I I I I I I I , I I , I , I I I ,
= I ~ii ~:~ ~I'"
I ! is:~
I I
1 ~ t
c o -.. 4' (I. -.. I.. U ... J ... • -.. u • 0..
'"
~I ~I
I I I
~ 1 ~ 1
I I
~ ! , I
10 • ... I
10 ... I a ....
I
., ...
· o
i · o
i · o
10 f') o • ...
... ... ... N
o ....
;, s; u • ... 4 U
" '0 " u
cz:
N ~ ... · o
N ~ .... · o
~ ... · o
i • o
.. . " .... '" .... ...
"OJ I.. (I U
'" C ... "0 cz:
~ .... . o
... N ... . ..
... o ... ... .... .. .... .,. :1 III .. ... • Q\ o :C a:
N "M . o
N ,._ ... . o
Q
r .. ... ., . C'
" .u ·of • u :r. ott
.u ~
J!
T
· o
<'4
'" ... · o
~ ... 10 · o
f'... 10 · o
.. ~ ,
4' • L.
" ... ~ • "0 ... L.
CIi
co n .... .;.
o
~ ... · o
· o
N
~ · o
'n Ir, a · ....
.. . .. .... o ... ... .. .. ....
" -.. 01 \.
~ -.. o
~ .. . o
o
r-. a N
&: o ... :JIo .:r C'I c 4 ... .. ~ .. o 5-(I. .. o ... o
44
... 10 -CI . ... ...
~ ... · o
· o
· II)
'" o .... . ....
~ -. o
~ f') . o
~ L o -... ... l " 4-
" ... 1:
• o I..
t ~ .. .. -I
0, ... It)
.;.
~ ... · o
f'... n · o
~ 0' · ...
o
• u ... ... 1 r I>
~ .,t
" • ~ -I
... T ,., ..;
n ,.. .. · o
1"
'" ... · o
'" .. 10
o o
i · o
N 10 10 ...
"" o N · ...
'" -.. ... o ... ... ;) I, .. Q. .. ~ • L ~ ... 'II:
N
'" .. . o
i 00 . o
~. .., . o
I: ;, . .. 0. , ... I..
" I:
... i ~ u o L
" ... L
cv r>... · o
n ,.. .. · o
o
,._ ... 10 · o
• !
4C It) ...
. ,._
'" ." "OJ
i t;.
~ o
'" II • ...
('f 10 ., · ...
N
'" ,._ .. · o
('t
~ · o
~ 10 · ....
o a.,Q · to
.. ~ ] • ... " " ... ... .. c . .. II: L. • ...
o N 10· .... In .... · ... 0
.'Ii f'.... · o
'" ,._ .... · o
,.. .... 10 · o
N ,.. .... · o
,._ .. 10 · C)
.. OJ
·c .. .... .. ~
" ...
...
('I ,._ ... . o
~ 0-. o
• .,. '\. ¢ .... OJ ~ ... ....
... .. 4 .,. C ....
... .c. J[ 01 L ... . ... ~ ~
('It ,._ ... . o
n ... I')
o o
. ....
~ ... . ...
.. • . .. tt • C&.. * ;, o • (
" .. U • ...
lI:
... CD ,._ . ~ ....
N ,._ ... <:)
IP o N
A ....
C\I .... N .. II)
g ... o
fO)
. o ...
.. 1",
J , J , I I I I I I I t I I I I , I I I I , I I I I I I , J I I I , I I I j I J I I I I I I
I , J I I I I I I
I I
t 1 1 I I I I , I
i I
I I , , I I I , • 1 • I , I • • I • I I I • t • I t I
• I I I I I I I , I I , I I I I
I I J I I 1
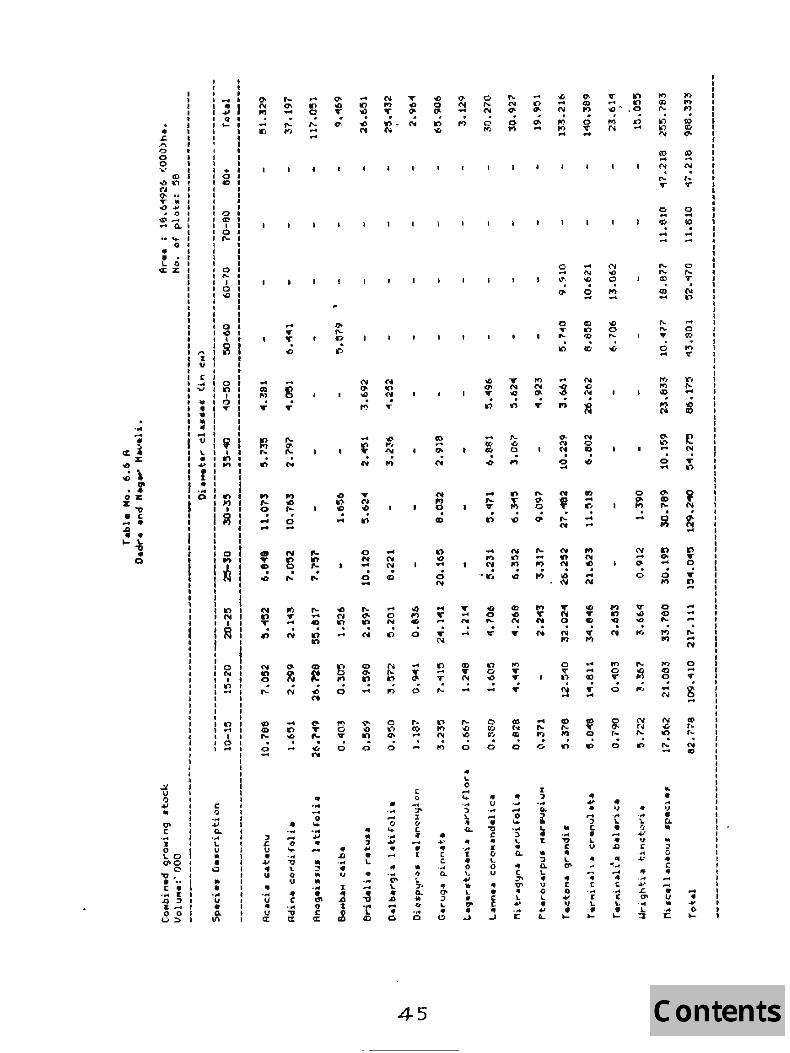
... .... • a: , :r::
."
..; " .r o z Z"'O • C.
.... " i ..
.... ~ .. Q
" r-... o o o '_'
•• <0-o .. ...
1.. 0 G:Z
~ u I) 4J .. tTl c: ... :J o 1..0 0'0
o "'0, ... c: " ... I[
..Q ;) It .... o 0 u::>
, I I
.... .. 41 Q ,_
I • '0 , G , , • • ,~ ,~ , , 'A ,,... , , I I '0 If>. I J 10 l..a I 1 I I 10 I'll) , .
"IS % I U I
• C J ... I 0 'V11n
, I
"'0 :1"-: I ~ 1 i t \. .. ~
r .. ... o
I t In •
'" t I I
I ~ ; I I
~: • I I
101 I '" I
I ~! 1 , J I 1 1 I In I , N I I I I
I ~ I I I
: i 101 I N I I I i 1 on t , .... I , , I I , , I , I 10 I I ... I I , I 101
''''' I
... .. 0.. . .. 1.. IJ .. • o .. • 'OC IJ • ~
I I , , I I , I , , I 1 I I I 1 I I I , 1 , J , , I
..:
... c;g 1"
-or
I') ,._ o · ... ..
ON In ,. · .,
(I) (I) I'-· o ...
" c. u .. ~ .. u .. ... tJ At U a:
r~ ...
... ". .... · Q
.... g .;
'" ~ 1-
o
o ... N
8 · I'-
~ ... · N
· N
.... 10 ~
..:
.. .... 00 ... ... "0 \. 00 V .. C
:.g ct
.... In o ,._ .... ....
.... In ,._ . 1'0
"" ... Q . ~
" ... .... o ... ... ... III ;, .. .. ... " .,. o c a:
,.
0/) ., Q · ...
g It) · o
~ o ..,. · o
.. ~ . ., .. OJ
C N .. . o ...
" .. ;) ... " 1.. .. . .. .... ~ 't' 4)
~ ,., <:'I,j · It)
... N N · <I)
.... o N · 10
.. . .. .... (I ... . .. ..., " .... ..
..0
~ . o
o
( 00
7-x (I
~ .... .. I
.~
\. .. A .... .. Co
45
· CI)
.. -or .... · .,. N
10 .... .... ,.._
.., I') ('II · n
.. .... .. ( c. ... c... .. CI' ;, \,
" I!I
0-N ... . ...,
.... .... '" . ...
c;g .... N . ..
.. \. o .... .. .... ') \.
" 0.. .. .... I
" o I. .. to L .. !1'
" -l
.. ... N . . "', <0 o ,.. . ....
If) o y;)
o ...
" v . ... .... .. "0 C .. " CJ L o u
... .. E " _J
,. N 'II) . In
I'~ o ..;
II' ..,. .,. . or
" ... -o .. .... ) \.
" 0.. .. C ~ V' ... L ...,
~ ~. o
o C7'
... ,_ ....
I[
" . .. Co.
l ~ I[ .. :I Il. 1.. .. 1) 00 L .. ..,
10..
o ... (>. · 0J0
o .... ... · It)
0-~ N · o ...
... N y;) · o ....
N ..a
'" o
N o CD · 0/)
.. ... "', o ...
If) N ~
o ... N
... .... Q:)
o .,. ...
~ o IP
If ..., " ... , c: • I. .... ~
• t . -; I. • ....
It)
o .... . o
" IJ ... \,
" ... " .J:l ..
" .. .... .. t:. . ... [ \, • ....
. ....
N ... a-. o
,..-,
o ... 'l:I
~ ... · o ....
III .,. ... o
o I')
... ('II
N 01:. on · ....
.. " A
'J • c.. " .. :0 C
" C ... ... • II • ... ~
Q ... to
o
'" V" o
(\I ..,
i N
o
; 10 ... o . .... 10
,_ .... (\I
o ... 'If' . g ...
J , t , , I , I I
I I I , I , , t I I I I 1 I I I I I I I , J , t 1 I I I I I I , I I I
I I
t

... .... • ~ G ..
X. o{J
• 10. o{J ..
C1' . " 0%
%~ .. C ... " Jl
" " ... \.
1 Q
I I I I I I I
~ I .s: I ,.. I o I o I OCDI '" k" I
I ~ ... I
~ " t "'~I .... (> t "C) ..... , • c.. I
II) , ...... , o , , • I
" 0 f • Z f 10. ,
IX , , , , , I , , I I I I I , I
''''
I • I ... ,
" I "" . (t ,
I- I , , , I , , .. ,
0' cD I
o «l I
C , .... • I I
• 10 II'I , 10 1.0 , I , I 10
'''' , .
, I I I , , , I , , I I I I , I J ~ I
• • J • I t • ,
J ~ 10 110 I , I
I • I I • , f .!
IV , 'g !~
1 I ,
I -. I .. I .. . -. I ~ t ....
I I , ,
I I I , ,
t \J I I. I .. t .. I • I X
, 0 IV , I
I , I , , '~ I I
I .! I I I
10 I
I In
f ~ I~
, I I , I I , I , I I I I I I I
I I I ~ 1 I
• I • , I I I I I I I , I , I
• t L I
I ..:t. :;J I U U I 00 V I ~ I ... I
I.. ,
~" I C ... I . .,. " . "J. " , OJ:. f 'L.. I
'" 'L..' I .. I .", 4. I .. I C • I
.... E. I ~ , I E .....
0~:
, I f 0 ,~
I~ I
1 f ~ , . I~ I I I I 10 It\! I I , .n I , I I I
'n I ... I I '0 '''''
... .. c.. ... 'L.. l'
'" .. Q
• .. ... u .. ~
Vl
, , I , , , I I , I , I , , , I I , I I I , I I , , I I I I I I I t I • I I , , I , I t I I I t f , I I I , I , I I I I , I , , , I , I
8 If) · o
.. (IA III · o
· a
(\I
~ · o
ell ,.,_ In . o
;, c. u .. .... .. u
" ... u .. V
tX
In .... n . o
o
.... ,._ to · o
CD .... If) · o
a .. · o
If) ('oj .. C)
.. -'" ... ... ." \. C, V
" 1: ... ~ a.
'" -.... a
. r,
.. V 1", .. , ...
.. ... ..... o ... ... ... .. .... -. j .. .. ... .. 0' '1 C
tX
. o
~ . o
.0 ... o o
N N o . o
" ~ ... • v
X
" ..:l E ('
ICJ
0-N .... . ...
co 17' ... o
.. I') ... . 0;)
o
f') .... .., . o
q. ", ... . o
o 1', o o
" ... J +I
" 'L..
" ." ... .. "0 . .. I
ICI
. o
... .... .... . o
.... p o . ~
.. ... ,.. Co .. . .. ... " .. ... en \. • .Ill .... " o
o
It) .... o . o
o on o o
,.., o
C o
..... ;r> x 00 c " ... .. • " ., I:::7> Cl.
" o .... a
46
... CII ~ o . ...
.. ... " t I: ... (l. .. Do ;, to. ~
Co-'
II) .0 .. . o
10 .0 o . o
.... oD o o
.. . ... l[ .. U \. ... • '-• rro .,
..J
VJ 0-N . o
.. C) N . o
,.._ T o o
" u .... -: ~ .. [ 00 \. o U .. .. I: I: of ..J
N o I<)
o
.... '" .. o
. o
. o
.... T o o
.. ... .... o ... 'i I. .. (l. .. c :n t7. .. \. .., ." :c
V .0 N · o
· o
It) ,._ .. · o
o N .. · o
o N o o
.., .. ... . ,._
", ., a
co o .., a
'8. -o
.. ~ . ...
,._ ... ,._ ..:
ell <D ('04 . o
• c o .. 'J • ....
o rIo') . o
.., "C) 1'1 · a
." .. oD · o
.,.. I() ... · -· -
.... ~ · c
ri ,._ N · o
'" .., ~
"3 c • L ~,
"" ... ... .. t: ... II \. .. ....
o <:) ,.._
o
~. .... ... . a
~ o . o
.. 'J ... L • ... • ~
" . .. ... .. C
.0<
t \. • ...
It"> I'o . o
'" .... o . o
o G) ... o
,.._ o 1",
.;
('oj ... o
q;
"" N · ...
I() oD · ...
.... ... II) · ...
.... 1'1 ... ~
.. .. . .. OJ
~ .. .. .. c.. .. c .. -'" u
" ." l:
... .. .. o I-
j
• : • I I I , I I I • , , I I , I I I I I I I I I I I I f t I I , I I I I I I I I I I I I I I I I I I I I 1 I I I I I I I I , I , I I I I , I I I , • I I I I I I , I I
• t • I • I , I , I I I I I I I I I I I I 1 I , I , I I I I , I I I I I 1 I I I I I I I I I I
CHAPTER-Y.il
~ CONSUMPTION STUDIES
7.0 GENERAL;
Wood consumption studies were carried out in Padra and Nagar Haveli alongwitb the forest inventory during the months of October-November, 1986 in order to estimate the annual consumption of wood for various purposes.
7.1 poPULATION QE DADRA 6HD NAGAR HAVELI:
The population of Dadra and Nagar Haveli according t..o 1971 and 1961 census is given below:
Population in the year 1971 Population in the year 1961
Annual rate of increase in population in 10 years per 100
Total no. of households in the year 1981.
Average size of the housebold
Projected population in the year 1985<based on 3.978% annual increase).
Projected population in the year 1991
74,170 1.03,676
3.978
12,428
5.336
1,20,173
1,44,918
The above figures have been used as a basis for calculation of wood consumption during the year 1985 (year of survey) and projection of demand for the year 1991.
7.2 METHODOLOGY:
For conducting thene stud.ies, methodology prescribed in the Manual for wood consumption survey prepared by the Forest Survey of India. in 1985 was adopted. However, it was rIOt posnible to stratify the villages according to their distance from the forests or on the basis of rur~l and urban areas. Except for Silvassa town all other habitations a.re r'ural and they tire wi thin 6 kw. from the forests. Except for 3 villages of Dadra. Pemni & Dhapsa. all other villages possess for-ests within their boundaries. While selecting the villeges for survey proper representation was given to different kinds of villages. Out of 68 forested villages 8 villages were selected. Out of non-forest villages 2 were chosen and Silvassfi being the only urban a..rett was also taken up for this survey. In each village 10-16 households were selected for study classifY1ng each into low income, middle
47

incl'"lmF.- (.,)'" lJJ;'per inl";oTrlp, groups depending inoome of the household. The limits of classification were as follows:
upon the annual income used for
Annual income Income group
Upto Rti. 3600/- Low income
Rs.3600 - Rs . 7000/- Middle income
Above Rs. 7000/- Upper income
Table below gives the list of villages with population and no. of households selected in each different income groups. ~
their under
-------------------------------------------------------------5l. Name of No. of Popula- No. of households Total No. village/ house- tion surveyed
town holds (1981 --------------------(19B1 census) Low Middle Upper census) income income income
-------------------------------------------------------------l. Galonda 431 2532 5 5 2 12 2. Chimda 302 1647 5 5 5 15 3. Amboli 229 1269 5 5 5 15 4. Khedpa 177 866 5 5 4 14 5. Tinoda. 63 328 5 5 10 6. Ki 1 veni 104 560 5 5 10 7. Goratpada 38 205 5 5 1 11 8. Naroli 1071 5952 5 5 6 16 9 .. Dhapsa 30 183 4: 5 5 14
10. Demni 131 723 5 5 5 15 1l. 5ilvassa 1305 6914 10 10 10 30
(town) -------------------------------------------------------------
The data on actual wood consumed for various purposes was collected by measurement of wood actually used by the households. So far as the consumption of firewaod is concerned. it is based on the informati on furni shed. by the members of the households. The data waf:; recorded in the forum prescribed in the Manual for wood consumption survey.
This data was analy~ed by regression analysis taking size of the household as independent variable to estimate per capita wood consumption for all the village~/town as a Whole and separately for each income groups in these villag l":s. The formula Y = mx + c was used in this eotiI!lation where x it.:; tbe average size of the household in Dadra and Nagar Haveli{as determined from 1981 census figures) t1.nd m and c are the constants which were estimated by regression analysis to predict the value of dependent variable which is the per capita consumption of wood for specific uses like building construction. furniture,
48

f1{tricultural implements etc. The consuwption of teak and other species W6S estimated separately as well as combined together. For statistical analysis cif data DCM MOSCAL 14025 desk calculator was used. It gives the values of correlation co-efficients, co-efficient of x, constant etc. directly on entering the data.
7.3 ESTIMATED EER CAPITA ANNUAL ~ CONSUHPTION BY INCOME GROUPS:
As already pointed out the households were divided into their income groups and data was analysed separately for eacb income group 1. e. low, middle and upper. Based on the regression analysis ··of this vilage-wise da.ta. per capita consumption of wood in the territory for different income groups is tabulated below:
----------------------------------------~--------------------Item Species Unit Income group
Low Middle Upper ------------------------------------------------------------A) Tiwber
Building Teak Cu. Ill . 0.0595 0 . 1034 0.1456 construction Other wood 0.6328 0.7801 0.2152
Furniture Tefik 0.0003 0 . 0143 0.0382 Other wood 0.0005 0 . 0042 Neg.
Agriculturt1l Teak 0.0063 0.0078 0.0284 implements Other wood 0 . 0081 0.0126 0.0056
Total<tirraber> Teak 0.0661 0.1255 0.2122 Other wood 0 . 6414 0.7969 0 . 2208
-----------------------Total: 0.7075 0.9224 0.4330
-----------------------31.8.5 28.01 16.88
The above table brings out the effect of income on wood consumption for various purposes. The total consumption of teak in upper income group is more while the consumption of other wood is more in middle income and low income groups . In cese of building constructions teak is preferred by upper income group while: othE:'r woods are used by middle and low income groups. The use of teak for furniture is more in upper income group. LikewifOe the USE:: of teak for agricultural implements is less in low income groups while the consumption of other wood for agricu Itural implements i!. lowest in the upper income group.
49
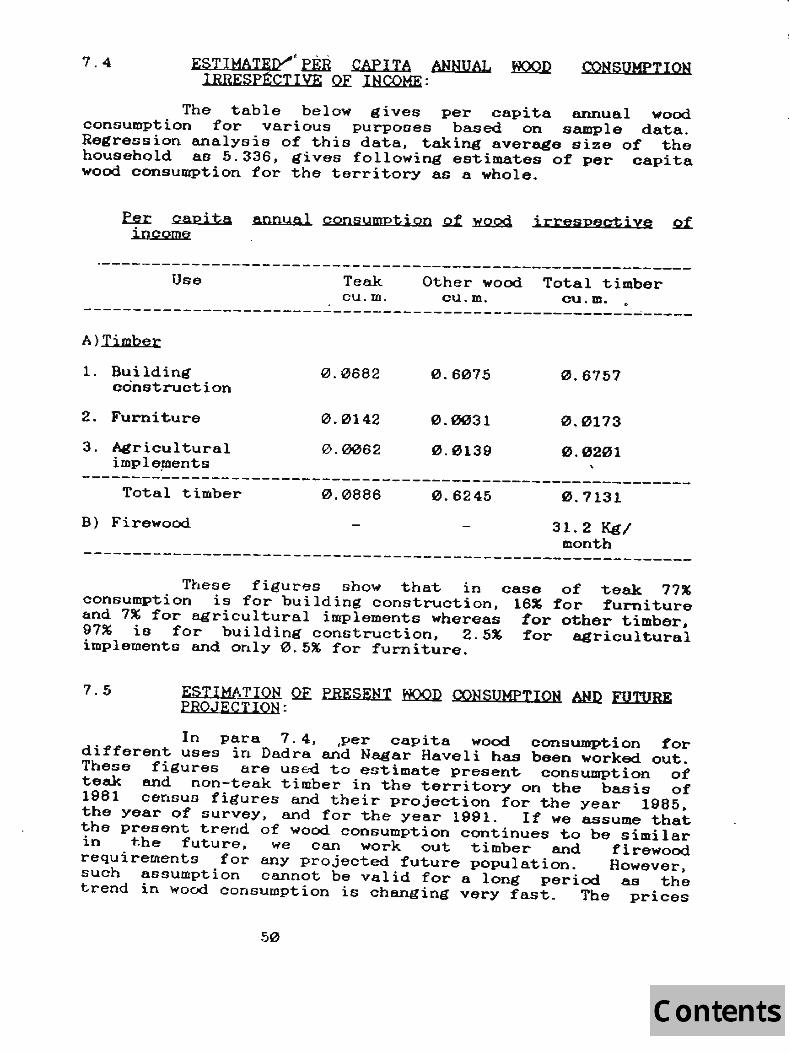
7.4 EaLIMATE~~EEE CAPITA ANNUAL ~ IRREsrtcTlVE QE INCOME:
CONSUMPTION
The table below gives per capita annual wood consumption for various purposes based on sample data. Regression analysis of this data, taking average size of the household as 5.336, gives following estimates of per capita wood consumption for the territory as a whole.
~ oapita annyal consumption ~ ~ irrespective 2f income
~-----------------------------------------------------------Use Teak
cU.m. Other wood Total timber
cU.m. cu.m. . . -------------------------------------------------------------A)Timber
1. Building construotion
0.0682 0.6075 0.6757
2. Furniture 0.0142 0.0031 0.0173
3. Agricultural 0.0062 0.0139 0.0201 imple~ents
-------------------------------------------------------------Total timber 0.0886
B) Firewood
0.6245 0.7131
31. 2 Kg/ month
-------------------------------------------------------------These figures show that in case of teak 77%
consumption is for building construotion, 16% for fUrniture and 7% for agricultural implements whereas tor other timber, 97% is for building construction, 2.5% for agricultural implements and only 0.5% for furniture.
7.5 ESTIMATION QE PRESENT HQQD QQNSUMPTION AHD FUTURE PROJECTION:
In para 7.4, ,per oapita wood consumpt.ion for different uses in Dadra and Nagar Haveli has been worked out. These figures are used to estimate present consumption of teak and non-teak timber in the territory on the basis of 1961 cenSUG figures Elnd their projection for the year 1985. the year of survey, and for the year 1991. If we assume that the present trend of wood. consumption oontinues to be similar in the future. we can work out timber and firewood requirements for any projected future population. However. suoh assumption cannot be valid for a long period as the trend in wood consumption is changing very fast. The prices
50
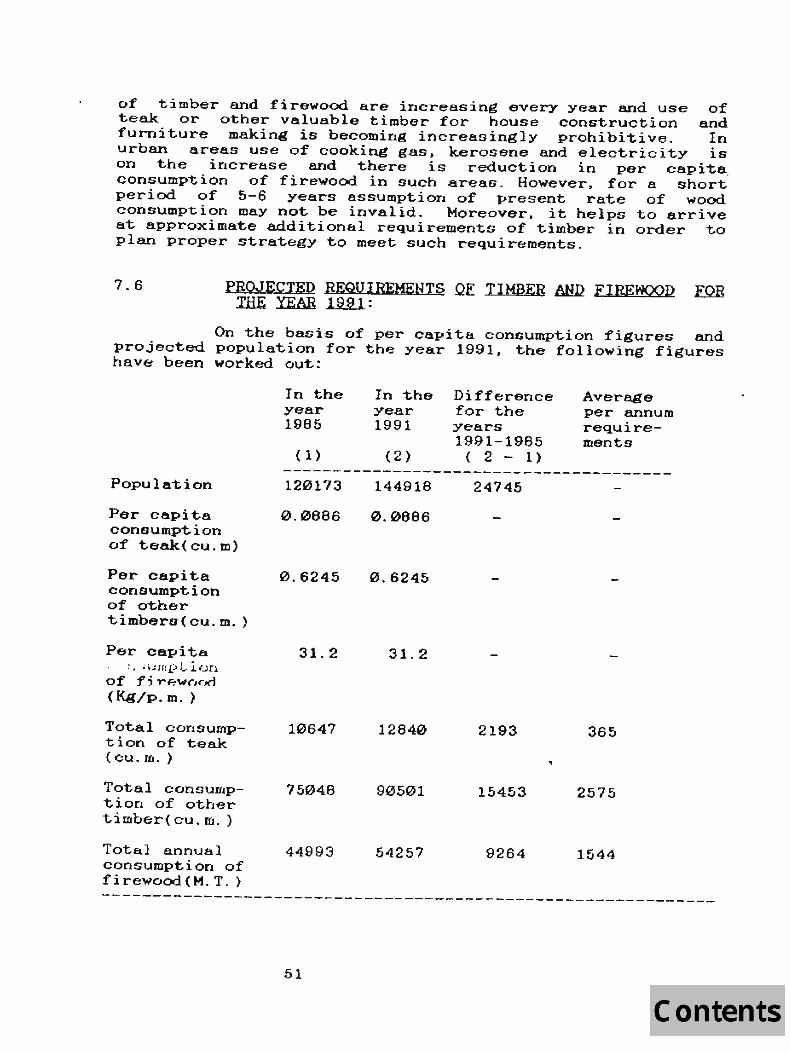
of timber and firewood are increasing every year and use of teak or other valuable timber for house construction and furniture making is becoming increasingly prohibitive. In urban areas use of cooking gas. kerosene and electricity is on the increase and there is reduction in per capita, consumption of firewood in such areas. However. for a short period of 5-6 years assumption of present rate of wood consump~ion may not be invalid. Moreover. it helps to arrive at approximate additional requirements of timber in order to plan proper strategy to meet such requirements.
7.6 PROJECTED REQUIREMENTS QE TIMBER ~ FIREWOOD EQB .THE YEAR l.Ml:
On the basis of per capita consumption figures and projected population for the year 1991. the following figures have been worked out:
Population
Per capita consumption of teak(cu.m)
Per capita consumption of other timbers ( cu. m. )
Per capita . ~, ;ump t lon
of :fi rF.-'W("Jc,o
(Kg/P. m. )
T ota1 corlS umption of teak (cu. J{J. )
Total Consumption of other tilIlber(cu.m. )
Total annual consumption of firewood(M.T. )
In the In the Difference Average year year for the per annum 1985 1991 years require-
1991-1985 ments ( 1 ) (2) ( 2 - 1)
---------------------------------------120173
0.0686
0.6245
31. 2
10647
75048
44993
144918 24745
0.0666
0.6245
31. 2
12840 2193 365
90501 15453 2575
54257 9264 1544
----------------------------~--------------------------------
51
Above figures show that during the year 1985·~tO ·~~ . ·tr:-i! 1991 on an average 365 cU.m. of teak and 2575 cu.m. of other
timber-s o would be required for new houses, furniture and agricultural implements etc . on account of increase in population. In addition to this there would be additional; annual requirement of timber for repairing existing houses, furniture and agricultural implements etc. also.
Since the year 1982-83 the Govt. have imposed a moratorium on cOrfllLlercial felling of trees in the forest . Before the moratorium was placed, the recorded production of timber frolll the forests was to the tune of 3000 cU. m. and firewood to the tune of 10,000 metric tonnes per year. Almost all of this production was disposed of by auction either through the contractors or through the agency of Forest Cooperative Sociatiee and very little wae actually available for consumption in the territory. It is thus clear that most of the needs of the people for firewood and a large proportion of timber used for house consumption etc. were met through unrecorded production from the forests. This trend is likely to continue during the period of moratorium also.
**********
52
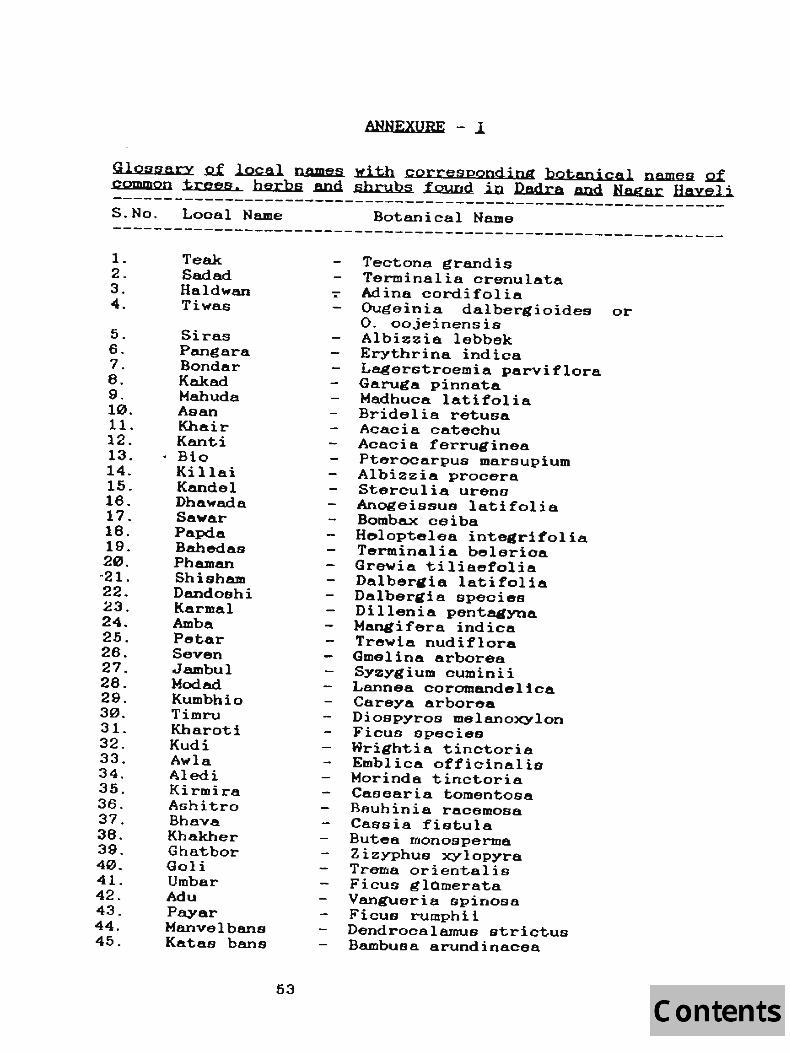
ANNEXURE - ~
Glossary Q.f local nomes l.d.:th cQrresponding botc.nical Dames g:f. common trees. berbs .arui shrubs found .in Dodra .a.ru1 Nagar Hayel i -------------------------------------------------------------S.No. Looal Name Botanical Name
-------------------------------------------------------------1. 2. 3. 4.
5. 6. 7. 8. 9. 10. 1I. 12. 13. 14. 15. 16. 17. 18. 19. 20. ·21. 22. 23. 24. 2.5. 26. 27. 28. 29. 30. 31. 32. 33. 34. 35. 36. 37. 36. 39. 40. 41. 42. 43. 44. 45.
Teak. Sadod Haldwan Tiwas
Sires Pangara Bondar Kakod Mahuda Asan Khair Kanti
. Bio Killai Kandel Dha'Wada Sawar Papda Bahedas Phaman Shisham Dandoshi Karmal Amba Peter Seven Jambul Mod ad Kumbhio Timru Kharoti Kudi Awla Aledi Kirmira Ashitro Bbava Khakher Ghatbor Goli Umber Adu Payar Manvel bane Katas bans
53
Tectona grandis Terminalia crenulata Adina cordi folia Ougeinia dalbergioides or O. oojeinensis Albi~zia lebbek Erythrina indica Lagerstroemia parviflora Garuga pinnata Madhuca latifolia Bridelia retusa Acacia catechu Acacia ferruginea Pterocarpus marsupium Albizzia procera Sterculia urena Anogeissus latifolia Bombax ceiba H~loptelea integrifolia Terminelie belerioa Grewia tiliaefolia Dalber~ia latifolia Dalber~ia species Dillenia pentagyna Mangi£ero indica Trewia Dudiflora Gmelina arborea Syzygium cuminii Lannea coromandelica Careya arborea Diospyros melanoxylon Ficus species Wrigbtia tinctoria Emblica officinalis Morinda tinctoria Casearia tomentosa Beubinia r~cemosa Cassia fistula Buteo rtJonosperma Zizyphue xYlopyre Trame orientalis Ficus glomerata Vangueria spinosa Ficus rumphii Dendrocalamus strictus Bambuso arundinacea

46. 47. 48. 49. 50. 51. 52. 53. 54.
1. 2.
3. 4. 5. 6. 7. 8. 9.
1. 2. 3. 4.
Hurudasing Karvand Niri{udi Ukshi Rui Kuda Ranbhendi Ranwnbadi Chikta
Bokarvel Palascel or Vedvel Garvel Nandanvel Chilhar Kangvel Toran Tanvel Kawich or quili
Pole.d Dab Valchond Gandhei
Helicteres isora Carissa carandas Vitex negundo Calycopteris floribunda Calotropis gigantea Holarrhena antidysenterica Thespesia macrophylla Hibiscus tetraphyllus Desmodium pulchellum
CLIMBERS
Combretum ovalifolium
But-ea superba Tinospora cordifolia Vitis repands. Acacia intsia Ventilago madraspatana Zizyphus rugosa Cocculus villosus
Mucuna pruri ens
GRASSES
Spodiopogon rhizophus Cymbopogon martinii Vetiveria zizanoides Chloris incompleta
ANNEXURE-ll
B I BL IOGRAPHY
1. Working Plan of Dadra and Nagar Haveli
2. Census Report of Dadra and Nagar Haveli - 1981. (
********
54