foreword welcome to the 4th international...
TRANSCRIPT

The Fourth International Conference on Entrepreneurship | Book Three
I
FOREWORD
Welcome to the 4th International Conference on Entrepreneurship (ICOEN) 2017, Dili, Timor Leste
On behalf of The Organizational Committee, Honorable Chairs, Conference Chairs , and Conference Co-Chairs, its is a great pleasure to welcome you to this 4th ICOEN Annual Conference 2017 in Dili, Timor Leste. A special word of appreciation to our Conference Chair , Miguel Lucas Lay Costa, SE., M.M.; Manuel Gonvalves Lic. Eco, M.M, Fransisco Vicente Lic Eco, M.A; Manuel Loe Siga Lic Eco, M.M; Faustina da Costa Lic, CSH for their enormous efforts and good collaboration toward the arrangement for hosting this annual ICOEN conference. The ICOEN 2017 activity will enhance good relationship between academic scholars and business practitioner in Organization.
We do hope you have enjoyable and enriching experience throughout the conference , and take adventage of the collaborative, friendly and community of advanced scholarship from our international conference. May I also take this opportunity to invite you to the 5th ICOEN 2018 to be held in Universitas of Ciputra , Surabaya, East Java, Indonesia. Last but not least, we would like to express our sincere gratitude to everyone who has contributed and made the joint conference a success. Best wishes, ICOEN 2017, Steering Committee Chair Dr. J.E.Sutanto, M.M. Graduate School, Universitas of Ciputra Surabaya, INDONESIA

The Fourth International Conference on Entrepreneurship | Book Three
II
FOREWORD
It is my great pleasure to welcome you all in the 4th International Conference on Entrepreneurship (ICOEN) 2017 I would like to delivery my sincre thanks to the working. Team Universitas of Ciputra, Surabaya Indonesia, for their Enormous contribution towards the detailes arrangement of the 4th International Conference on Entrepreneurship (ICOEN) 2017, Dili, Timor Leste). The conference is held on September 06th and 08th, 2017,
moreover. It attracts educators, researchers, and entrepreneurs which related with scientific disciplines of practitioners. On this occasion, let me give special thanks to the Keynote Speakers: (1) Dr. Charles Chow East-West Management University, Singapore; (2) David S. Dixon University of New Mexico, USA, (3) Dr. Amir Shaharuddin, Universiti Sains Malaysia, Malaysia, (4) Prof. Dr. Lucas da Costa, S.E., M.Si., Universidade da Paz, Timor Leste, (5) Dr. Ir. Denny Bernadus, M.M.,Ciputra Education Foundation, Indonesia, (6) Dato Dr. Kim Tan Advisor, TBN Asia; TRUSTEE, TBN UK I also want to thank the kind support all of co-host which your contribution to this seminar as reviewers and keynote speakers make this event more meaningful and evaluable. We are also thankful to all reviewers, for their commitment, effort and dedication in understanding the task of reviewing all of the full paper. We would like to thank to all authors who have submitted their papers to be reviewed, those whose paper were chosen to be presented in the seminar, and those who have submitted manuscripts to be publishes in proceeding. On behalf of all my colleagues, I would like to offer my best wishes for a successful, stimulating and memorable conference Sincerely, ICOEN 2017, Conference Chair Miguel Lucas Lay Costa, SE., M.M Universidada da Paz, Dili, Timor Leste

The Fourth International Conference on Entrepreneurship | Book Three
III
COMMITTEE
Steering Committee
1. Dr. J.E.Sutanto, M.M.
Universitas of Ciputra Surabaya
2. Dr. Ir. Dominggos Cairesi B.B. Gomes, M.Sc.
Universidade da Paz, Dili, Timor Leste
3. Ir. Rini Retnowati, M.PA
Universidade da Paz, Dili, Timor Leste
4. Fernando Diaz Gusmao, Amd., S.IP., MAP.,
Universidade da Paz, Dili, Timor Leste
5. Rosinho da Crusz, Lic.Dir., M.Dir.,
Universidade da Paz, Dili, Timor Leste
6. Dr. Wirawan Endro Dwi Radianto, S.E., M.Sc., Ak
Universitas of Ciputra Surabaya
7. Dr. Trianggono Wiradinata, S.T., M.Eng., Sc.
Universitas of Ciputra Surabaya
8. Damelina B. Tambunan, SE., M.M., Ph.D.
Universitas of Ciputra Surabaya
9. Dr. David Sukardi Kodrat, M.M.
Universitas of Ciputra Surabaya
10. Dr. Tina Melinda, M.M.
Universitas of Ciputra Surabaya
11. Imam Wijoyo, S.E., M.M.
STIE IBMT Surabaya
12. Prof. Dr. Nyoman Puspa Asri, M.S.
University of W.R. Supratman Surabaya
13. Irwan Yulianto, S.H., M.H.

The Fourth International Conference on Entrepreneurship | Book Three
IV
University of Abdurachman Saleh Situbondo
14. Dr. H. Pribanus Wantara, Drs., M.M.
University of Trunojoyo Madura
15. Dr. Ir. H. Sundjoto, M.M.
STIE Mahardhika Surabaya
16. Dendi Sean T.
Indonesia Marketing Association Chapter Surabaya
17. Dr. Muhammad Alkirom Wildan, S.E., M.Si.
Insan Doktor Ekonomi Indonesia Surabaya
18. Drs. Eko Wahjudi, M.Si.
University of State Surabaya
19. Gabriel Neves
Institute of Business, Timor Leste
20. Lucio M. Gomes
East Timor Coffee Institute

The Fourth International Conference on Entrepreneurship | Book Three
V
Organizing Committee
Chair : Miguel Lucas Lay Costa, SE., M.M. Universidade da Paz
Secretary : Manuel Gonvalves Lic. Eco, M.M.. Universidade da Paz
Co-Secretary : Fransisco Vicente Lic Eco, M.A. Universidade da Paz
Treasury : Manuel Loe Siga Lic Eco, M.M. Universidade da Paz
Co-Treasury : Faustina da Costa Lic, CSH Universidade da Paz
HELD BY UNIVERSIDADE OF dA PAZ DILI COLLABORATED WITH
1. University of Ciputra Surabaya, INDONESIA
2. University of Trunojoyo Madura, INDONESIA
3. STIE Mahardhika Surabaya, INDONESIA
4. University of W.R. Supratman Surabaya, INDONESIA
5. STIE IBMT Surabaya, INDONESIA
6. University of Abdurachman Saleh Situbondo, INDONESIA
7. University of State Surabaya, INDONESIA
8. Insan Doktor Indonesia Surabaya, INDONESIA
9. Indonesia Marketing Association of Chapter Surabaya, INDONESIA
10. Institute of Business, TIMOR LESTE
11. East Timor Coffee Institute, TIMOR LESTE

The Fourth International Conference on Entrepreneurship | Book Three
VI
REVIEWER 1. Prof. Drs. Tatang Ary Gumanti, M.Buss. Acc., Ph.D
University of Jember.
2. Prof. Dr. Ir. Hening Widi Oetomo, M.M., Ph.D.
Sekolah Tinggi Ilmu Ekonomi Indonesia Surabaya
3. Prof. Dr. Lucas da Costa, SE., M.Si Da Paz Universidade, Timor Leste
4. Dr. Tina Melinda, Dra., M.M. Universitas of Ciputra Surabaya
5. Prof. Dr. F. Danardana Murwani, M.M University of State Malang
6. Dr. Christina Whidya Utami, M.M. University of Ciputra Surabaya
7. Dr. David Sukardi Kodrat, M.M. University of Ciputra Surabaya
8. Dr.Tommy Christian Efrata, S.E., M.Sc. University of Ciputra Surabaya
9. Dr. J.E. Sutanto, M.M. University of Ciputra Surabaya
10. Prof. Dr. J.G. Nirbito, M.Pd
University of Ciputra Surabaya
11. Jose Cornelio Guterres, Ph.D Universidade da Paz, Dili, Timor Leste
12. Dr. Elidio de Araujo, Lic.Eco, M.M
Universidade da Paz, Dili, Timor Leste 13. Dr. Augusto C Soares, S.E., M.M
Institute of Business, Timor Leste 14. Dr. Adolmando Soares Amaral, Lic.Eco, M.M
Universidade da Paz, Dili, Timor Leste

The Fourth International Conference on Entrepreneurship | Book Three
VII
15. Dr. Alex Pires, Lic.Eco, M.M
Universidade da Paz, Dili, Timor Leste

The Fourth International Conference on Entrepreneurship | Book Three
VIII
KEYNOTE SPEAKERS
1. Dr. Charles Chow East-West Management University, Singapore
2. David S. Dixon University of New Mexico, USA
3. Dr. Amir Shaharuddin Universiti Sains Malaysia, Malaysia
4. Prof. Dr. Lucas da Costa, S.E., M.Si. Universidade da Paz, Timor Leste
5. Dr. Ir Denny Bernadus, M.M. Ciputra Education Foundation, Indonesia
6. Dato Dr. Kim Tan Advisor, TBN Asia; TRUSTEE, TBN UK

The Fourth International Conference on Entrepreneurship | Book Three
IX
TABLE OF CONTENTS
1Raditya Putra Awangga, 2Tommy Christian Efrata
The Establishment of Employees’ Work
Motivation Strategy to Increase
Productivity in Corvette Workshop
Surabaya
1
1Cahya Riski, 2J.E. Sutanto
Quality Service Effect CV Bshb Towards
Perceived Service Quality Users of Gresik
Regental Goverment
7
1Sasongko Basuki, 2J.E.
Sutanto
Factors Affecting the Succesion Process of the
Family Business in East Java, Indonesia 21
1Manuel Goncalves, 2J.
Nirbito
Effect Of Attitude, Subjective Norms, and
Entrepreneur Behavior Control on Sme’s
Atsabe Community Behavior With
Entrepreneur Intention as Mediator Variable
30
1Jose da silva, 2Denny
Bernardus
Entrepreneurship Learning Analysis on the
Readabulity of Entrepreneur Trough
Subjective Norm and Attitudes in Students of
Economic Faculty Economy Unpaz
39
1Asy'ari
Financial Statement Control in the Wealth
Management for Individual Company 48
Wulandari Harjanti1
Social Network Influence to Subjective Norms
in Knowledge Sharing 54
1Dwi Perwitasari
Wiryaningtyas
Behavioral Finance in Debt Decision Making
59
1Hujjatullah
Fazlurrahman, 2Nindria
Untarini
Comparing of Entrepreneurial Intention
Student Between Science And Humanities
Students: A Literature Review
65
1Parwita Setya Wardhani, 2Menur Kusumaningtyas2
Women As Entrepreneurs With Small Capital 78
1Tias A. Indrawati, 2Riza
Y. Kurniawan
Enhancing Competitiveness Smes Women
Creative Industry in Surabaya 85
1Hafid Kholidi Hadi, 2Anik Lestari A
Change Management: An Islamics Perspective 95
1Yenny Kartika Halim, 2Trianggoro Wiradinata
The Influence of Leadership, Motivation,
and Discipline on Employees’ Performance
PT. LMA
100
1Senain, 2Farida Hanum
Utilization of Wood Cutting Waste Back to
Material Furniture Through Social
Entrepreneurship Approach
109
1Moch. Kalam Mollah
Influence Analysis of Motivation Factors
Work to Work Satisfaction in Low Education
Workers at Tanggulangin’s Sme in Sidoarjo
East Java
114

The Fourth International Conference on Entrepreneurship | Book Three
X
1Andre Tjahyono, 2Tina
Melinda
Traditional Snack Strategic Marketing
Analysis of PT. X 123
1Hadi Wijono The Implementation of Economic
Empowerment of Micro, Small and Middle
Enterprises For Food and Beverage Business
in The Regency of Situbondo
130
1Ardhito Himawan, 2Wirawan Endro Dwi
Radianto
The Effect of Leadership Style and
Organisational Culture to Company
Performance Through Strategy of Innovation
as Intervening Variable in PT. Bintang Sarana
Ekspress
134
1Muhammad Yusuf
Ibrahim
Legal Protection For Trademarks For Products
of Umkm Products in Situbondo District 142
1Nanik Hariyana, 2Lita
Permata Sari
The Effect of Marketing Mix Strategy on
Trust
and Product Purchase Decisions by Jember
Specifications
148
1R.A. Sista Paramita
The Influence of Size of Credit, Gender, Age
and Education to Opportunity of Smes
Performance Improvement in Malang
152
1Asra Al Fauzi, 2Denny
Bernardus
Motivational Compensation Design for
Surgeon in Neurosurgical Group Services in
Surabaya
165
1Made Kamisutara, 2I Putu
Artaya
Analysis And Design of Early Warning
Application for Pregnant Women Health for
Acceleration Reduce Mortality Rate Mother
And Baby Web Based And SMS Gateway
174
1Rony Prabowo, 2Moses
L. Singgih, 3Putu Dana
Karningsih, 4Erwin
Widodo
Inactive Problem Recognition Perspective in
Consumer’s Buying Decision: Study
Literature
181
1Surjohadi, 2Heri Tri
Saksono, 3Sugiarto
Marketing Analysis Of Agricultural Product
Sweet Potatoes Using Markov Chain 192
1Setya Haksama Efforts to Improve Patient Visit Based on
Perception, Motivation, Personality, and
Decisions to Uses Health Care Aspect
at Surabaya Lung Hospital
198
1Steven Irawan Innovation Strategy Analysis in UD. X Using
Business Model Canvas and Ten Types of
Innovation Tools
209
1Darwin Simangunsong, 2Bambang Syairudin
Benefit Cost Ratio Analysis of Sukorejo –
Batu Pass Road Project 215
1Tina Melinda
Family Business Viewed From Complexity
Family And Business And How to Manage to
Achieve Sustainability
231
The Fourth International Conference on Entrepreneurship | Book Three
XI
1Soffia Pudji Estiasih, 2Endang Prihatiningsih, 3Handri Kartiono
Profit Planning Model Using the Cost-
Volume-Profit Analysis Approach
(Case Study in CV Transtrek Indonesia Batu
Malang)
238
1Suparjo, 2Gatot Setyono
Information Technology to Develop and
Improving Sales Product on Middle Low
Business At seruni sidoarjo
247
1Churin In, 2David
Sukardi Kodrat
Launching Strategy Delish Coffeshop in Kota
Gresik 255
1Ristanti Ayu Dian
Permatasari, 2Tina
Melinda♠
Strategy Design Marketing Wood Flooring
Product in PT. Srikandi Mandiri Sakti 263
1Sugiono, 2Tina Melinda♠
Optimalization Property Aset of Village
(Study in Desa Ketajen, Kec. Gedangan, Kab.
Sidoarjo)
268
1Azaria Anindita Pandu’u
The Effect of Brand Image and Service
Quality on Perceived Value and Behavioral
Intention (Empirical Study in Culinary
Business Universitas Ciputra)
280
1Budi Utomo, 2Muri
Hardiyanto, 3Sri Purwanti
Analysis of Consumer Behavior in Choosing
Rice Packaging of Brands “Alami, Pak Tani
And Padi” (Cose Study at Rahma Jaya Store
Mojokerto City)
291
1Lavencia Dean Ananda, 2Tina Melinda
Influence Relationship Marketing to Customer
Satisfaction and Loyalty 302
1Ryan Rizki Herdianto, 2Tina Melinda
Marketing Strategy's Fullfreedom
322


The Fourth International Conference on Entrepreneurship | Book Three
1
THE ESTABLISHMENT OF EMPLOYEES’ WORK
MOTIVATION STRATEGY TO INCREASE
PRODUCTIVITY IN CORVETTE WORKSHOP SURABAYA
1Raditya Putra Awangga,
2Tommy Christian Efrata♠
Ciputra University Surabaya
INDONESIA
Email: [email protected]
ABSTRACT
This study aims to determine factors that are causing the low motivation
and also strategies that can be used to increase motivation in Corvette
Workshop. Corvette Workshop is one of the leading workshop in
Surabaya, backed up with high-end technologies and lead by well-
educated mechanics. Unfortunately, performance of this workshop is
proven to be declining, causing loss to the company.
After an observation concerning the performance is done, the decline is
mostly caused by the lack of employees’ work motivation. Employees, as
human, have many internal and external factors that can affect their work
motivations. Even though they have received adequate amount of salary,
the ever-growing needs will bring negative impact to their work lives, one
of them is the decline of work motivation.
Quantitative analysis from interview data will show internal and external
factors that can determine the quality of employee work motivation, and
in order to validate the findings academically, some theories will be used.
Motivation Theory and Maslow Theory will be applied in this study,
considering the subject of research is the motivation of human who have
degrees of life necessities. SWOT Theories will also be used to determine
the positioning of the company and to plan for future strategies. The
result shows that ST strategy with diversification means. This strategy
uses company’s strength (S) to repel threat (T) with concentric
diversification to fulfill material needs and horizontal diversification to
fulfill non – material needs.
Key words: motivation, productivity, and strategy.
INTRODUCTION
Corvette Workshop Surabaya as an organization has internal and external factors that contribute
to the future of the company. The internal factors mentioned include man (i.e. human and
employees), money or capital, machinery, material, and method (i.e. ways and procedures).
External factors mentioned include economic condition, market state, technological
development, and government policy or regulation.
The first year of Corvette Workshop Surabaya establishment was considered to be quite
flourishing, which makes the owner decides to increase the number of employees, equipments,
and service types. This action had proven to give negative result which is not proportional to the

The Fourth International Conference on Entrepreneurship | Book Three
2
investment made. This gives insight to the problems that need to be deeply analyzed. If we look
further, Corvette Workshop condition as of now faces some internal factors as such:
a. Man : Corvette Workshop’s employees are fulfilled quantitatively but
lacking qualitatively
b. Money : Corvette Workshop has an adequate amount of capital
c. Machine : Corvette Workshop has a complete array of offers, including a dyno test
d. Material : Corvette Workshop has a complete array of working tools and supporting
facilities
e. Method : Corvette Workshop’s methods and procedures are not optimal Based on
the analysis above, Man and Method factors give more contribution to the lack of growth
in Corvette Workshop. Employees as the main factor is not showing maximum
performance because of the lack of motivation, which reduces productivity and hinders
company from its goal. This situation will hold as long as ineffective methods are used.
LITERATURE REVIEW
Maslow’s Hierarchy of Needs
The essence of this theory says that human needs are composed in a hierarchy. The
lowest level of needs is physiology needs, and the highest is self – actualization needs.
This theory assumes that people tries to fulfill their needs starting from the lowest level
first before trying to fulfill the higher level. This is because people always have the desire
to improve.
Maslow in Mathis (2011) explains that human needs can be classified to 5 levels:
1. Physiological Needs
Physiological needs are the lowest level of human needs, which is the physical
requirement of human survival. This includes food, clothing, home, oxygen, sleep,
sex, and many more.
2. Security Needs
This need includes safety and security from work risk, work insurance, and pension
plan.
3. Social Needs
This need includes friendship, affiliation, and interaction with other human beings.
4. Esteem Needs
This need includes appreciation and respect for their achievement, and also
recognition for their skills and talents.
5. Self – Actualization Needs
Self actualization is related with the process of developing the true potential of
human – the need to show skills, abilities and potentials
The most important thing taken from this theory is that fulfilled human need is a form of
motivation, where if someone feels adequate with their salary, then money is not the
cause for the lack of work motivation. Unfulfilled need is one of the potential threats for
the company. It can cause frustration, conflicts, and mental strain.
RESEARCH METHODS
Research method is a framework in a particular study that measures and analyzes data in
order to answer research problems. This research uses qualitative method research with
descriptive approach. There are some definitions about the description of qualitative
approach. Moleong (2011) stated that qualitative research is a collection of data in a
natural setting using natural method and done by researchers who are naturally
interested.

The Fourth International Conference on Entrepreneurship | Book Three
3
The research is done, at Corvette Workshop in Surabaya, Karang Menjangan street
no.106. It is done carefully with scientific method and approach, including interviews
and archiving their documents for seven months from June to December 2016.
This study uses purposive sampling technique for sampling method. This technique set
samples based on certain criteria which are adjusted to the information needed by the
researcher. The samples that were chosen with this method are 6 (six) employees who
work at Corvette Workshop Surabaya. The researcher chooses these 6 particular
employees because the researcher believes that these 6 people take part in the
management of Corvette Workshop Surabaya. Data analysis technique used in this
research is qualitative data analysis technique from Miles and Hubberman. Miles and
Hubberman state that there are 3 different analyses happened at the same time, which are
data reduction, data presentation, and conclusion making.
RESULT AND DISCUSSION
IFAS and EFAS Analysis
Table.1 below is the result of IFAS analysis done after the identification of internal factors.
Table 1. IFAS Matrix of Corvette Workshop Surabaya
INTERNAL STRATEGY FACTORS WEIGHT
RATING
SCORE
Strength (S):
1. Salary and Compensation
2. Allowance
3. Work Safety and Amenities
4. Archievement Award 5. Pension
0.16
0.12
0.12
0.07 0.07
4
3
3
2 2
0.64
0.36
0.36
0.14 0.14
SUB TOTAL 0.54 1.64
Weakness (W):
1. Life Expediency
2. Cooperation and Communication
3. Management Control Function
4. Organization Policy 5. Self Development
0.04
0.07
0.07
0.12 0.16
1
2
2
3 4
0.04
0.14
0.14
0.36 0.64
SUB TOTAL 0.46 1.32
TOTAL 1 2.96
Legend : For Strength (S), column “Rating”
means: Rating 1: Small strength
Rating 2: Medium
strength Rating 3: Big
strength Rating 4:
Massive strength
For Weakness (W), column “Rating”
means: Rating 4: Small weakness
Rating 3: Medium weakness Rating 2: Big weakness Rating 1: Massive weakness
Table.2 below is the result of EFAS analysis done after the identification of external
factors.

The Fourth International Conference on Entrepreneurship | Book Three
4
Table 2. EFAS Matrix of Corvette Workshop Surabaya
EXTERNAL STRATEGY FACTORS WEIGHT
RATING
SCORE
Opportunity (O):
1. Lack of Outside Employment
2. Information Technology
3. Automotive World Advancement
4. Workplace Environment 5. Employee Actualization
0.15
0.07
0.12
0.07 0.07
4
2
3
2 2
0.60
0.14
0.36
0.14 0.14
SUB TOTAL 0.48 1.38
Threat (T):
1. New Competitor in Similar Business
2. Employee Hijacking
3. Price War
4. Social Setting Development
5. Change in Government
Policy SUB TOTAL
0.04
0.12
0.07
0.12
0.16 0.51
1
3
2
3
4
0.04
0.36
0.14
0.36
0.64 1.54
TOTAL 1 2.92
Legends: For Opportunity (O), column “Rating”
means: Rating 1 : Small opportunity
Rating 2 : Medium
opportunity Rating 3 : Big
opportunity Rating 4 :
Massive opportunity
For Threat (T), column “Rating”
means: Rating 4 : Small threat
Rating 3 : Medium
threat Rating 2 : Big
threat Rating 1 :
Massive threat
Analysis result from Table.1 IFAS and Table.2 EFAS show the total score of each factor as:
Strength [1.64], Weakness [1.32], Opportunity [1.38], and Threat [1.54]. The result above
shows that Strength point is higher than Weakness point with the difference of (+) 0.32 and
Opportunity point is lower than Threat point with the difference of (-) 0.16. Those points can be
implemented into SWOT diagram as shown in Figure.1
Figure 1. Cartesian Diagram of Corvette Workshop SWOT Analysis

The Fourth International Conference on Entrepreneurship | Book Three
5
SWOT Matrix Strategy Combination will also be made based on the points from each
factor. The result can be seen at Table.3.
Table 3. SWOT Matrix Strategy Combination
IFAS
EFAS
STRENGTH (S)
WEAKNESS (W)
OPPORTUNITY (O)
STRATEGY (SO)
=1.64 + 1.38
= 3.02
STRATEGY (WO)
=1.32 + 1.38
= 2,7
THREAT (T)
STRATEGY (ST)
=1.64 + 1.54
= 3.18
STRATEGY (WT)
=1.32 + 1.54
= 2.86
Based on the result on SWOT Matrix combination, ST strategy has the highest point
(3.18) among the others. This is in line with IFAS and EFAS matrix analysis which put
itself at fourth quadrant.
Strategy of Choice
Analysis and research of IFAS and EFAS factors shows that ST strategy has the highest
point (3.18) among other strategies, and calculation of Cartesian matrix shows result that
is positioned at fourth quadrant, between Strength and Threat in the form of
diversification. Based on these results, Corvette Workshop Surabaya will try to increase
employees work motivation using ST Strategy with many kind of diversification
activities.
a. Concentric Diversification Strategy
ST strategy with concentric diversification focuses on the means to fulfill material
needs of employees, such as:
Giving employees an adequate and on-time salary and wage.
1. Giving employees a new motorcycle if they work diligently for three years
without resigning.
2. Giving employees a cut of salary or wage when they are absent without
explanation as a form of reward and punishment.
b. Horizontal Diversification Strategy
ST strategy with horizontal diversification focuses on the means to fulfill immaterial
needs of employees, such as:
1. Giving employees recognition of their achievement.
2. Giving employees information about modest lifestyle in the midst of
consumptive society.
3. Having a good and clear communication among employees as well as between
employees and owner.
4. Setting “work is prayer” motto at workplace.
CONCLUSION
Based on the above result and discussion, there are some conclusions that can be taken as
listed below:
1. Motivation is placed at moral dimension beside intellectual dimension. Motivation is
a spiritual process which can only be felt and cannot be touched. In an employee’s
life, motivation acts as a drive for them to work.

The Fourth International Conference on Entrepreneurship | Book Three
6
2. Motivation enhancement is not separated from influencing factors. The influence of
environment became more dominant altogether with the development of society that
tends to be more materialistic. Honestly speaking, the influencing factors give more
negative effects to the company.
3. The usage of Maslow Theory stating that “motivation is in line with need
fulfillment” will give burden to the company because employee’s need always grows
with each passing days.
4. The aforementioned problems happened at Corvette Workshop Surabaya where its
productivity recently declines. Research shows strong indication that the main cause
is the lack of employee work motivation.
5. Research result shows that company must do some diversification in order to solve
the problem.
6. The company must consider different type of diversification because of the
involvement in motivation factors, which focus on the fulfillment of material and
immaterial needs.
7. Calculation combination shows that the company must make use of its strength in
order to cover any possible weakness.
8. Research results and considerations shows that the strategy of choice is the one that
uses Strength to cover Weakness through the usage of concentric diversification.
REFERENCES
Maslow, A. (2011). Teori Hiraki Motivasi. Retrieved 5 November 2016, from
http://rajapresentasi.com/2009/03/teori-hirarki-motivasi-dari-abraham-
maslow.
Mathis, R.L. & Jackson, J.H. (2011). Human Resource Management. Jakarta. Salemba
Empat.
Moleong, L.J. (2012). Metodologi Penelitian Kualitatif. Bandung: PT. Remaja
Rosdakarya.
Miles, B.M. & Huberman (2007), Analisis Data Kualitatif: Buku Sumber Metode- metode
Baru, Universitas Indonesia Press,Jakarta.
Rangkuti, F. (2001). Analisis SWOT Teknik Membedah Kasus Bisnis, PT. Gramedia
Pustaka Utama, Jakarta
Rangkuti, F. (2011). SWOT Balanced Scorecard. Jakarta: PT Gramedia Pustaka Utama.

The Fourth International Conference on Entrepreneurship | Book Three
7
QUALITY SERVICE EFFECT CV BSHB TOWARDS PERCEIVED
SERVICE QUALITY USERS OF GRESIK REGENTAL
GOVERMENT
1Cahya Riski, 2J.E. Sutanto♠
Ciputra University Surabaya
INDONESIA
Emails: [email protected], [email protected]
ABSTRACT
This study aims to examine partially the
dimensions of SERVQUAL construction service
providers against perceived quality service in the
Government of Gresik Regency. The independent
variables were examined in this study is Tangibles
(X1), Reliability (X2), Responsiveness (X3),
Assurance (X4) and Empathy (X5). For the
dependent variable in this study is perceived
Service Quality (Y). The population in this study
were officials and staff of the District Government
of Gresik as much as 1,967. After sampling using
methods slovin, the samples used in this study as
many as 100 people. Based on the analysis that
has been done by using multiple linear regression
modeling is known of 5 (five) dimensions servqual
only 3 (three) variables that had a significant
influence on service quality perceived. These
variables are Tangibles (X1), Reliability (X2) and
Assurance (X4).
Keywords : SERVQUAL, Perceived Service
Quality, Construction
INTRODUCTION
CV BSHB is one of the firms that participates in the regent government. The service given
by this cv includes the building of new offices as well as the maintenances and renovation.
CV BSHB has been established since 2003 and it operates in Gresik regent government.
The company gradually develops and improves its service quality in order to meet the
need of the clients.
To accommodate the services of its clients, the company always communicates actively
either by phone or the social media so that its clients can monitor the updates information
and the progress of its projects considering the amount of fund executed for the project.
The intensity of communication is one effort to measure the service in dealing with
complaint. To evaluate the qualities of its service, e.g., experience with its score 15% and
technical with its score 75%, the table 1 below shows the recapitulation of the clients of
Gresik Regent Secretary office of equipment division.

The Fourth International Conference on Entrepreneurship | Book Three
8
Table 1 Evaluation Recapitulation Towards Service Provider Fiscal Year 2012-2013
Source : Data is processed from the Recapitulation of Evaluation Gresik Regional Secretary
Towards Service Provider For Fiscal Year 2012-2013
The evaluation result done influenced towards the project volume which is conducted
by the company.
Below table 2 shows the onset decrease for 39,36% within the last year (2013-2014)
Table 2 CV. BSHB project data in fiscal year 2012-2014
Source : Company internal data on fiscal year 2012-2014

The Fourth International Conference on Entrepreneurship | Book Three
9
The service quality of CV BSHB as the supplier of construction work, based on the last
evaluation of by the clients, experienced the decrease of the project standard execution.
Based on the fact that the company should conduct research to identify the cause as well
as the factors that affected the decrease of the company’s service quality.
Customers or clients’ readiness to re-order in 2012-2013 can be stabile if the project
contract is reached 1, 566 Billion Rupiah. The evaluation conducted by the clients can be
used as reference in executing the project in the 2014 annual’s budget; therefore the
company is also evaluated. In 2014, the company experienced the decrease of project
volume i.e, four projects are in line within the onset decrease for 39,36% or Rp.
616.635.040 from 2013 annual budget.
According to Gunarathne (2014) customers might have different value as well as different
reason for evaluation and most of the time; they are given the same service with different
method. For this reason, the research entitles “The Service Quality Effect of CV BSHB
towards Perceived Service Quality clients in Gresik Regent Government”. Henceforth,
the company’s future can improve its aspects to increase its performance through
SERVQUAL dimension in order to accommodate the clients’ expectation.
PURPOSE
This research aims to test the partial effect among the five dimensions of SERVQUAL
(Tangibles, Reliability, Responsiveness, Assurance, dan Emphaty) clients in Gresik regent
government. The significance of this research is to determine that Servqual constitutes
precise dimension service and product quality that can influence the clients’ perception
and expectation.
REVIEW OF RELATED THEORIES
According to Brandt (2014:31) these five gaps of service quality that give the effect
towards the service:
1. Gap 1 : Gaps between client’s expectation and the managerial perception. These
show that the difference between the client expectation and its managerial perception are
caused by the management mistake or flaw in understanding the consumers’ expectation.
2. Gap 2 : The Perception Gap between the supplier towards the client expectation and
the specification quality of service. This gap shows the difference between the managerial
perception related to the clients’ expectation and the specification of service quality.
3. Gap 3 : The Gap between quality service specification and the process of service
delivering/ dispatch. This gap shows the difference between quality service specification
and the process of service delivering/ dispatch given by its employees. This gap
constitutes the incompatibility of the service performance as its employees are not able or
do not intend to deliver/ show the level of service required by the customers or clients.
4. Gap 4 : The gap between service and external communication to customers.
Customer expectations of service quality are influenced by statements made by the
company through marketing communications. This gap occurs as a result of a discrepancy
between the promised service and the service delivered.
Gap 5: The gap between customer perceptions and customer expectations. If customer
perceptions and expectations about service quality prove to be the same and even better
perceptions of expectations
the company will get a positive image and impact. Conversely, if the quality of service
received is lower than expected then this gap will cause problems for the company. The
Quality Gap can be shown in Figure 1

The Fourth International Conference on Entrepreneurship | Book Three
10
Figure 1 Conceptual Method SERVQUAL
RESEARCH METHODS
In this study has a goal to describe the expectations of service users about the quality of
services provided by service providers. Therefore, there are stages needed to obtain all this
information, the stages include the method of collecting samples, data collection, and data
analysis that aims to answer the purpose of this research.
The respondents in this research will use sampling by Probability Sampling. We select
groups or clusters within the local government of Gresik Regency. Here is the sample
cluster we use in this research (Table 3)
Table 3 Population in Regent Government Institution /Regent-Owned enterprises at
Gresik Regent Government
No Institution Numbers of
Employees
1 Gresik Regent Secretary 265
2 Public Works Services 229
3 Health Services 1.087
4 Environmental Services 73
5 Financial Revenue, Management, and Local Asset
Services
110
6 Procurement of goods and services Unit 53
7 Bank Jatim Gresik Branch 150
Total 1.967
Source : Gresik in Figures 2014
The Sampling technique in this study population used simple random sampling
as the number of population in the Government of Gresik Regency and Regional
Owned Enterprises that operate in Gresik Regency has been known, the technique
of sampling using Solvin technique with the formula. (Siregar, 2014)

The Fourth International Conference on Entrepreneurship | Book Three
11
The Sampling is done by random sampling method to population of Government Institution
and BUMD spread in Gresik Regency. However, in this study the number of samples is
computed to 100 respondents. According to Franken and Wallen for descriptive research
large minimum sample of 100 respondents
The Data collection is a process of collecting primary and secondary data in a study. Data
collection is a systematic and standard procedure for obtaining the necessary data, and there
is always a relationship between the data collection method and the research problem to be
solved (Siregar, 2014). The following data collection methods are needed to answer the
purpose of research, including :
The type of data used is cross sectional data (data consisting of several variables
collected at the same time) and based on the nature of data collected in the form of
quantitative data because the data obtained in the form of numbers.
Based on how it is obtained, this study uses primary data and secondary data. In this
study, used secondary data in the form of internal company data and literature review
of various forms of publication and also research that has been done and published.
The data of this research is taken from the service user as the result of the survey /
filling questionnaires of officials and staff at the local government agencies of Gresik
Regency, as well as from the literature and research results that have been done
before.
This study uses data collection techniques with a gradual and in-depth interview
technique (in depth interview) with a number of respondents who have chosen
deliberately.
Findings and Discussion
The Respondents participated from this research are all officials and staff of Local
Government of Gresik Regency who actively communicate and cooperate with CV. BSHB
as of September 2015. Staff / Officials who work with companies in the Local Government
of Gresik Regency amount to 100 people with details as shown in the table below.
Table 4. Number of Respondent Based on Institution in Gresik Regent
Government
No Institution Total
1. Gresik Regent Secretary 14
2. Public Works Services 12
3. Health Services 55
4. Environmental Services 4
5. Financial Revenue, Management, and Local
Asset
Services
5
6. Procurement of goods and services Unit 4
7. Bank Jatim Gresik Branch 6
Total 10
0
In this case, the researcher has conducted instrument test on 100 staff / employees
(SKPD Gresik and Bank Jatim) who interact / communicate directly with our company.
The researcher uses the instrument of validity test and reliability test by distributing the
research instruments we have compiled to the research respondents. The results of valid

The Fourth International Conference on Entrepreneurship | Book Three
12
research when there is similarity between the data collected with the actual data occurred
on the object under study. Here are the instruments used in this research :
1. Tangibles (X1)
▪ Company has proper license and certification meets Government standard needs
(X1.1)
▪ Company has representative office / workshop (X1.2)
▪ Company has facilities and infrastructure to support daily operation during project
(X1.3)
▪ Company has staff and field workers with permanent employee status (X1.4)
2. Reliability (X2)
▪ Company is able to maintain its reputation in client environment (X2.1)
▪ Company have a good recommendation from a supervisory consultant (X2.2)
▪ Company provides transparent information regarding project development (X2.3)
▪ Company can shown decent work ethic (X2.4)
▪ Company must be able to fulfill its obligations under the contract (X2.5)
3. Responsiveness (X3)
▪ Company can be flexible with any changes request from client (X3.1)
▪ Company can handling client complaints (X3.2)
▪ Company have acceptable and approving solution by client during project
development (X3.3)
▪ Company give information access to client regarding recent update about project in
progress (X3.4)
4. Assurance (X4)
▪ Company can instill confidence in clients (X4.1)
▪ Company has competent technical staff (X4.2)
▪ Company staff able to answer all inquiries from clients (X4.3)
Company have enough manpower to deliver / complete project according to the schedule
(X4.4)
1. Empathy (X5) ▪ Staff can give special attention towards clients (X5.1)
▪ Understand client specific needs (X5.2)
▪ Put an effort to understand client’s general needs (X5.3)
▪ Project representative can be contact at any time (X5.4) 2. Perceived Service Quality (Y)
▪ Company meets administrative requirements in accordance with Standard
Operational Procedure (Y1)
▪ Company has an effective and efficient working system (Y2)
▪ Company can complete project according designated schedule (Y3)
▪ Company has system for handling complain from client (Y4)
▪ Company has competent human resources (Y5)
The validity of an instrument item can be determined by comparing the Pearson product
moment correlation index (r) with the 5% significance level with the critical value (Sugiyono,
2009). For Reliability The method used is Cronbach’s Alpha. A questionnaire / instrument is

The Fourth International Conference on Entrepreneurship | Book Three
13
considered reliable when Cronbach's Alpha value Cronbach’s Alpha > 0,6 (Kuncoro, 2013:181).
The following test results of the research instrument for each variable that we tested, can be
seen in the table below.
Table 5 Test Result Validity and Reliability of research instruments
Variable
Item
r
Sig
Information
Cronbach's
Alpha if Item
Deleted
Cronbach's
Alpha
Result
Tangibles (X1)
X1.1 0,405 0.000 Valid 0,776 0,805
Reliable
X1.2 0,611 0.000 Valid 0,745
X1.3 0,550 0.000 Valid 0,765
X1.4 0,437 0.000 Valid 0,738
Reliability (X2)
X2.1 0,709 0.000 Valid 0,677
0,736
Reliable
X2.2 0,821 0.000 Valid 0,627 X2.3 0,695 0.000 Valid 0,686 X2.4 0,729 0.000 Valid 0,696 X2.5 0,508 0.000 Valid 0,742
Responsiveness (X3)
X3.1 0,719 0.000 Valid 0,646 0,712
Reliable
X3.2 0,781 0.000 Valid 0,605 X3.3 0,696 0.000 Valid 0,668 X3.4 0,741 0.000 Valid 0,680
Assurance (X4)
X4.1 0,903 0.000 Valid 0,470 0,704
Reliable
X4.2 0,523 0.000 Valid 0,734 X4.3 0,562 0.000 Valid 0,730 X4.4 0,857 0.000 Valid 0,497
Empathy (X5)
X5.1 0,640 0.000 Valid 0,644 0,669
Reliable
X5.2 0,697 0.000 Valid 0,632 X5.3 0,745 0.000 Valid 0,552 X5.4 0,756 0.000 Valid 0,577
Perceived Service Quality
(Y)
Y1 0,489 0.000 Valid 0,659
0,639
Reliable
Y2 0,672 0.000 Valid 0,567
Y3 0,760 0.000 Valid 0,494
Y4 0,711 0.000 Valid 0,528
Y5 0,570 0.000 Valid 0,651
The table above describes the results of the validity and reliability test of the statement on all
servqual variables. To test the validity of Sig value. By Pearson Correlation nothing greater than 0,5 then all statement items are declared valid. As for the reliability test value by Cronbach's Alpha for each item statement has shown the value above 0.6 so it can be said that the reliability of the questionnaire is reliable or trustworthy.
In this research used multiple linear regression analysis to know the influence of
independent variable consist of Tangibles (X1), Reliability (X2), Responsiveness (X3),
Assurance (X4) and Empathy (X5) to one dependent variable that is Perceived Service
Quality (Y). Based on the data processing of the questionnaire results using SPSS 20.0
program obtained the results as in Table 6 below.

The Fourth International Conference on Entrepreneurship | Book Three
14
Table 6 Result for Multiple linear regression analysis
Model Unstandardized Coefficients Standardized Coefficients
t Sig.
B Std. Error Beta
(Constant) -4,107 1,414 -2,904 ,005 Tangibles ,672 ,105 ,461 6,399 ,000
1 Reliability
Responsiveness
,203
,097
,081
,065
,177
,079
2,496
1,493
,014
,139 Assurance ,408 ,093 ,299 4,383 ,000 Empathy ,122 ,072 ,104 1,685 ,095
a. Dependent Variable: Perceived service quality
Based on the regression results in the above table, there are 3 variables
(Responsiveness (0,139), and Empathy (0,095)) which have no significant effect (sig>
0,05) on perceived service quality. So with these conditions need to be re-modeling
(multiple linear regression) using 3 variables that significantly influence and eliminate
the 2 variables that have no significant effect. Here are the results of multiple linear
regression modeling without variable Responsiveness and Empathy. (Table 7).
Tabel 7 Result for Multiple linear regression analysis removing
variable X3 dan X5
Coefficientsa
Model Unstandardized Coefficients Standardized Coefficients
t Sig.
B Std. Error Beta
(Constant) -2,754 1,287 -2,140 ,035
1 Tangibles Reliability
,674 ,218
,107 ,082
,462 ,191
6,306 2,650
,000 ,009
Assurance ,512 ,082 ,375 6,257 ,000
a. Dependent Variable: Perceived service quality
The statistical test F shows whether all the independent variables included in the
model have a significant influence simultaneously on the dependent variable (Kuncoro,
2013: 245). Decision making based on Sig value. Of F, if Sig. < 0,05 then Ho is rejected
(Ha accepted) and vice versa. After processing data using SPSS 20.0 program, then got
the result of F test as in Table 8 below.
Tabel 8 Result for F Test
ANOVAa
Model Sum of
Squares
df Mean
Square
F Sig
.
Regression 501,485 3 167,162 94,89
7
,000
b 1 Residual 169,105 96 1,762
Total 670,590 99
a. Dependent Variable: perceived service quality
b. Predictors: (Constant), Assurance, Reliability, Tangibles
Based on Table 8 can be seen that the value of F arithmetic with the dependent
variable perceive service quality of 94.897 with Sig. Of 0,000 (Sig. <0.05). Then Ho is
rejected and Ha accepted. Therefore, it can be concluded that tangibles, reliability and

The Fourth International Conference on Entrepreneurship | Book Three
15
assurance have a significant influence simultaneously on perceived service quality of
service from the clients in the local government of Gresik Regency.
The statistical of t-test has shown how far the influence of one independent variable
individually or partially in explaining the variation of the dependent variable (Kuncoro,
2013: 244). After testing, the following t test results in Table 9 below.
Table 9 Result From t Test
Coefficientsa
Model Unstandardized Coefficients Standardized Coefficients
t Sig.
B Std. Error Beta
(Constant) -2,754 1,287 -2,140 ,035
1 Tangibles
Reliability
,674
,218
,107
,082
,462
,191
6,306
2,650
,000
,009 Assurance ,512 ,082 ,375 6,257 ,000
a. Dependent Variable: perceived service quality
Based on test results above the sig value for each Tangibles (0,000), Reliability
(0.009), and Assurance (0.000). It can be concluded that the three variables are
partially significant effect on perceived service quality of service users in the local
government of Gresik Regency.
The coefficient of determination (R2) is a device that measures how far the
model's ability to explain variations of bound variables. After processing data using
SPSS 20.0 program, then got the result as in Table 10 below :
Table 10 Coefficient of Determination Result
Model Summaryb
Model R R Square Adjusted R Square
Std. Error of the Estimate
Durbin-Watson
1 ,865a ,748 ,740 1,327 1,983
a. Predictors: (Constant), Assurance, Reliability, Tangibles
b. Dependent Variable: perceived service quality
From Table 10 it can be seen that the value of R Square (R2) is 0.748. Therefore,
it can be concluded that 74.8% of service users or clients in the local government of
Gresik Regency are influenced by tangibles, reliability and assurance while 25.2% are
influenced by other factors not examined. Here are the results of the classic
assumption test (Table 11) which includes normality test, multicollinearity,
heteroscedasticity, autocorrelation, and linearity using 3 servqual variables against
Perceived Service Quality.
Table 11 Classic Assumption Test
No. Classic Assumption Test Perceived Service
Quality Conclusion
1 Normality Test Kolmogorov- Smirnov Z
0,737 Residuals are normally distributed (> 0,05)
2 Multicollinearity Test
Tangibles VIF 2,044 VIF < 10 (Multicollinearity does not occur)
Reliability VIF 1,974 VIF < 10 (Multicollinearity does not occur)
Assurance VIF 1,369 VIF < 10 (Multicollinearity does not occur)
3 Heteroscedasticity Test

The Fourth International Conference on Entrepreneurship | Book Three
16
Tangibles Sig. 0,622 Heteroscedasticity does not occur (Sig > 0,05)
Reliability Sig. 0,642 Heteroscedasticity does not occur (Sig > 0,05)
Assurance Sig. 0,933 Heteroscedasticity does not occur (Sig > 0,05)
4 Autocorrelation Test Durbin- Watson
1,983 Autocorrelation does not occur (1,73 < DW < 2,27)
5 Linearity Test
Tangibles Linearity 0,000 Tangibles concluded has a significant linear relationship
Reliability Linearity 0,000 Reliability concluded has a significant linear relationship
Assurance Linearity 0,000 Assurance concluded has a significant linear relationship
SERVQUAL GAP
The servqual gap calculation of the statement attribute in the 3 servqual
dimensions (tangibles, reliability, and assurance) variables is all negative. Servqual
scores (-) negatively indicate that there is an indication of a quality gap on the quality
attribute. While servqual score (+) positive indicates the quality of the quality is quite
satisfying customers. The result of servqual score (service quality) can be seen in
table 12.
Table 12 Servqual Gap Calculation
Variable
No.
Statement Instrument
Perceived
Service (X)
Expected
Service (Y)
Servqual
Score
Tangibles
X1.1 The company's technical expertise can be applied according to project needs
3,36 4,57 (1,21)
X1.2 The office / workshop has adequate working facilities 2,98 4,55 (1,57)
X1.3 Project facilities and infrastructure can support project operation
2,74 4,51 (1,77)
X1.4 Staff and workers work effectively and efficiently in project operation
3,54 4,59 (1,05)
Variable
No.
Statement Instrument
Perceived
Service (X)
Expected
Service (Y)
Servqual
Score
Reliability
X2.1 The company has a good reputation in the Gresik Regent Government
3,26 4,37 (1,11)
X2.2 The company has good quality references from supervisory consultants
3,64 3,95 (0,31)
X2.3 Companies regularly and periodically submit project progress reports
2,81 4,25 (1,44)
X2.4 The Company demonstrates good work ethics in the process of project work
2,94 3,75 (0,81)
X2.5 The company is able to keep promises in accordance with the commitments stated in the contract
3,42 4,67 (1,25)
Assurance
X4.1 Proposal of service provider's offer able to increase client confidence
2,09 4,65 (2,56)
X4.2 The company's technical presentation indicates that the staff has good technical skills
2,82 4,82 (2,00)
X4.3 Client curiosity can be answered well by service provider staff
2,13 4,88 (2,75)

The Fourth International Conference on Entrepreneurship | Book Three
17
X4.4 The company was able to complete the project on time due to the availability of sufficient workers
3,28 4,83 (1,55)
The calculation results showed that the service user is not satisfied with the
quality of services provided by the service provider in this case is CV BSHB. After
finding servqual score further analysis of the perceptions. This analysis is used to
determine the position of service quality attribute of the company based on the service
user's opinion about the level of perceived service (perception) and expected service
(expectation / expectation). In addition, it can also be used to identify the actions that a
company must perform with regard to the position of the attribute. Data value of
perception and expectation level and location of quadrant of each attribute can be seen in
Table 13. While the cartesius diagram result of elaboration can be seen in Figure 2.
Table 13 Result Data value of perception and expectation
Variable No. Statement instrument Perceived
Service (X) Expected
Service (Y) Quadrant
Tangibles
X1.1 The company's technical expertise can be applied according to project needs
3,36 4,57 II
X1.2 The office / workshop has adequate working facilities
2,98 4,55 I
X1.3 Project facilities and infrastructure can support project operation
2,74 4,51 I
X1.4 Staff and workers work effectively and efficiently in project operation
3,54 4,59 II
Reliability
X2.1 The company has a good reputation in the Gresik Regent Government
3,26 4,37 IV
X2.2 The company has good quality references from supervisory consultants
3,64 3,95 IV
X2.3 Companies regularly and periodically submit project progress reports
2,81 4,25 III
X2.4 The Company demonstrates good work ethics in the process of project work
2,94 3,75 III
X2.5 The company is able to keep promises in
accordance with the commitments stated in
the contract
3,42
4,67
II
Assurance X4.1 Proposal of service provider's offer able
to increase client confidence 2,09 4,65 I
X4.2 The company's technical presentation indicates that the staff has good technical skills
2,82 4,82 I
X4.3 Client curiosity can be answered well by service provider staff
2,13 4,88 I
X4.4 The company was able to complete the project on time due to the availability of sufficient workers
3,28
4,83
II
Variable No. Statement instrument Perceived
Service (X) Expected
Service (Y) Quadrant
Mean 3,00 4,49

The Fourth International Conference on Entrepreneurship | Book Three
18
Figure 2 the attribute description in Cartesian diagram
Conclusion
This research is done by distributing its instrument/ questionnaires to 100
respondents as samples of the populations both active officers and public servants of
Gresik governmental regent. From the data analysis used SPSS 20.0 program, hence the
conclusions can be elaborated as follows :
Tangibles partially influences significantly towards the servqual gap of its clients in
Gresik governmental regent.
Reliability influences significantly towards the servqual gap of its clients in Gresik
governmental regent
Responsiveness partially does not influence significantly of its clients in Gresik
governmental regent
Assurance influences significantly towards the servqual gap of its clients in Gresik
governmental regent
Empathy partially does not influence significantly of its clients in Gresik
governmental regent.
Suggestions
The results of this research have shown that there three of five servqual dimention :
tangibles, reliability, and assurance are the influential variables of perceived service
quality. To acquire the result of managerial implications which also have three specific
variables organized and analyzed by applying importance- performance (IPA). The
tangibles improvement plan can be explained below:
1. The procurement of A3 printing: this printing machine is aimed to enhance the
distribution of A3- sized printed pictures within half day for clients and the field
workers.
2. The Procurement of project appliances (grinder and cutter): the additional stock for
one unit can effectively involve the number of its workers for two personnel. By
having appliances the service can be done in half day.
3. Direction keet : Companies need to create design and build a direction keet with

The Fourth International Conference on Entrepreneurship | Book Three
19
size 3 x 6 m. The area of the board of directors provides benefits to the worker in
order to store material, project equipment and private goods with more organize.
4. Commercial vehicles : The ownership of commercial vehicles with this type of
pickup is needed by the company in order to make distribution and mobilization of
project equipment more quickly without having to hire a freight service provider.
Plans related to improving the skills of employees and project workers are embodied in
managerial implications for assurance variables. The first step that companies need to
take is that companies need to create an implementation manual in each project handled
by the company. Technical staff need to learn the process of project implementation
through the manual and companies need to provide training on handling the problems
faced in project implementation. Through this training is expected to increase staff
maturity in recognizing the stages and constraints that occur within the project.
SUGGESTIONS FOR FURTHER RESEARCHERS
To obtain a more precise result, researchers who will conduct similar research are
advised to explore the literature review and other studies to find other variables that can
improve the concept / model of servqual. If the researcher is an employee or owner of the
company to be investigated, you should use the services of consultants who usually
carry out research professionally. This will increase the honesty of the respondent's
answers and will ultimately increase the objectivity of the study. Limitations in this study
is the use of five servqual variables for research types of construction service business
operating in the local government of Gresik Regency is still not enough. And the result of
the coefficient of determination shows that 74.8% of perceived service quality is
influenced by three independent variables (tangibles, reliability and assurance), and there
are 25.2% which can be predicted by other variables not examined in this study.
REFERENCES
Adat, Noel, & Penceliah. 2014. Customers’ Expectations and Perceptions of Service
Quality: The Case of a Retail Pharmacy Chain in South Africa. Mediterranean
Journal of Social Sciences, Volume 5 No 20, September 2014. Roma, Italia :
MCSER Publishing.
Asogwa, B. 2014. Use of ServQUAL in the Evaluation of Service Quality of Academic
Libraries in Developing Countries. Library Philosophy and Practice (e-journal).
Makalah 1146, 2014, hal 1-25. Nebraska : University of Nebraska-Lincoln.
Bahauddin, Ekawati, & Pratiwi. 2013. Integrasi Importance-Performance Analysis (IPA)
dan Lean Six Sigma untuk Memperbaiki Kinerja Jasa Logistik. Makalah
disampaikan pada Prosiding Seminar Nasional Industrial Services (SNIS) III :
Peningkatan Daya Saing Industri Nasional Melalui Integrasi Industri Baja
Berkelanjutan Menuju ASEAN Economic Community 2015. Cilegon : tanggal 8
Oktober 2013.
Brandt. 2014. Applying the SERVQUAL model to describe the satisfaction of the Aviva
Company’s employees in Dublin, Ireland, regarding to the canteen service quality
in their workplace. Disertasi Master of Business Administration, Mei 2014. Dublin
: Dublin Business School.
Chen & Lin. 2013. Applying Importance-Performance Analysis for Improving Internal
Marketing of Hospital Management in Taiwan. International Business Research.
Vol. 6, No. 4, 2013, hal : 45-54. Canada : Canadian Center of Science and
Education.
Gonçalves, Pinto, Batista, Pereira, & Ambrosano. 2014. Importance-performance
analysis: Revisiting a tool for the evaluation of clinical services. Journal of Health

The Fourth International Conference on Entrepreneurship | Book Three
20
Care Marketing, Vol 6, No. 5, 2014, hal : 285- 291.
http://dx.doi.org/10.4236/health.2014.65041
Gunarathne. 2014. Relationship between Service Quality and Costumer Satisfaction in
Srilankan Hotel Industry. International Journal of Scientific and Research
Publications, Volume 4, No 11, November 2014, hal 1-8. Srilanka : Department of
Marketing, Faculty of Management and Finance, University of Ruhuna.
Kumar & Mishra. 2015. Widening Service Quality Gap and Customer Satisfaction: A
case of Public Sector Banks. International Journal of Advance Research In
Computer Science and Management Studies, Volume 3, No 1, Januari 2015, hal :
30-36. Gujarat, India : IJARCSMS Publication.
Lind, Marchal, & Wathen 2014. Statistical Techniques in Business and Economics,
16th Edition, 2015.
United States of America, New York : McGraw Hill Education
Milan, Silva, Bebber, & Toni. 2014. Multifamily Buildings Construction’s Service
Quality in Brazil. Australian Journal of Basic and Applied Sciences, Volume 8 No.
15, September 2014, Hal: 42-52. Amman, Jordan : AENSI Publisher.
Mudita, P. 2015. Analisis Faktor-Faktor Yang Mempengaruhi Waktu Tunggu Pengadaan
Material Konstruksi Pada Proyek Gedung di Kabupaten Badung. Tesis Tidak
Diterbitkan. Denpasar, Bali : Universitas Udayana.
Oktavianti, M. 2015. Pengaruh kualitas layanan (servqual), citra perusahaan (corporate
image), dan kepuasan pada getho tular positif serta niat beli ulang. Skripsi Tidak
Diterbitkan. Yogyakarta : Universitas Atma Jaya Yogyakarta.
Ramadhan, Setyanto, & Efranto. 2013. Analisis kepuasan konsumen terhadap kualitas
pelayanan dengan penerapan importance performance analysis (ipa) dan model
kano (studi kasus pada asrama mahasiswa griya brawijaya universitas brawijaya
malang). Jurnal Rekayasa dan Manajemen Sistem Industri. Vol 1, No. 2, 2013.
Malang : Universitas Brawijaya.
Tzeng & Chang. 2013. Applying Importance-Performance Analysis as a Service Quality
Measure in Food Service Industry. Journal of Technology Management &
Innovation, Volume 6, Issue 3, 2011, hal : 107-115. Santiago, Chile : Universidad
Alberto Hurtado, Facultad de Economía y Negocios.
Wilson. 2009. Pengembangan atribut jasa dengan menganilisis hubungan antara kualitas
jasa, kepuasan pelanggan, dan niat membeli kembali studi kasus : TM Bookstore. Skripsi
Tidak Diterbitkan. Jakarta : Universitas Indonesia.

The Fourth International Conference on Entrepreneurship | Book Three
21
FACTORS AFFECTING THE SUCCESION PROCESS OF THE
FAMILY BUSINESS IN EAST JAVA, INDONESIA
1Sasongko Basuki, 2J.E. Sutanto♠
Ciputra University Surabaya
INDONESIA
Email : [email protected]
ABSTRACT
The purpose of this research is to analyze the factors affecting the succession
process in the family business in East Java, Indonesia. The variables used in
this research are succession planning (X1), preparation of heirs (X2),
relationships among family members (X3) as independent variables while
succession process (Y) and post transition business performance (Z) act as
dependent variables. Questionnaires are used to collect the study data.
Additionally, quantitative analysis with path analysis is used as analysis tool.
The population in this study is medium and large scale family business in
Surabaya, Sidoarjo, Mojokerto, Pasuruan, dan Gresik. Samples are taken
from 43 family businesses with total employment of minimum 20 and have
performed at least one generational transition.
The statistic analysis findings reflect the non-significant relationship between
succession planning and preparation of heirs towards successful transition.
While relationships among family members gives the most significant
influence on the successful transition, as well as the significant influence
between succession process to the post transition performance.
Keywords: succession planning, preparation of heirs, relationships among
family members, succession process, post transition business performance
INTRODUCTION
Family business takes important role in the global business in the world as they rule more than
80% of total world economy and approximately 75% of world’s gross domestic product (GDP)
(Pousa,2007). The same situation occur in Indonesia where 96% or 159,0000 out of 165,000
companies in Indonesia are family managed businesses (Pikiran Rakyat, 2006) and contribute to
82.44% of national gross domestic product (Suara Merdeka, 2010).
Indeed not many family business can survive and grow from generation to generation.
According to Family Business Editor Review in United States of America only 30% can survive
until the 2nd generation, 12% up to the 3rd generation, and only 4% surviving up to the 4th
generation and below (Astrachan, Family Business Editor Review). Meanwhile in Asia only
33% can survive until the 2nd generation, 15% up to the 3rd generation, and only 9% surviving
up to the 4th generation and below (INSEAD InnovAsia’s Team, 2006). In Indonesia, similar
situation occur where 78% of family business are run by the founder, while 15% run by 2nd
generation and only 7% by the 3rd generation according to a survey done by Jakarta Consulting
Group.
Family business faces some challenges such as the conflicts of business value and direction
among founder and the successors, the differences of characters and expectation among family
members in making decision, position and remuneration for the family members involved in the

The Fourth International Conference on Entrepreneurship | Book Three
22
business and the lack of long term planning in the family business. Therefore it is necessary to
plan a succession process in order to maintain the continuity growth of the family business and
to keep a good relationship among the family members. According to research by KPMG
enterprise (2011) main key of a succession process is comfortable level between two party, i.e
meeting the expectation of the founding generation and the acceptance of successor on the
family business rules about management’s responsibility, compensation, profit sharing, etc.
LITERATURE REVIEW
The definition of a family business itself is effectively described by Davis (1983) as an
organization where its policies and management is strongly influenced by one or more family
members. Because family itself plays such a significant role in the company, family business is
generally believed to be resistant to change by being overly dependent on family values.
Balancing between optimum company expansion and fulfillment of family needs is also a
constant challenge for family businesses (Palacios et al, 2013). The succession process for the
next generation is inevitable for a family business, yet only a few could survive. More than 70%
of businesses died out after the second generation, with the number increasing to 90% after the
third generation. A few important components of a long-lasting family business can be seen
below.
First, a detailed long-term plan is needed to ensure the process runs smoothly. A sufficient plan
will allow the company to set out a process to determine the most suitable inheritor, including a
specific time frame for the entire procedure. Ideally the company will also need to involve
outside opinion and consultation, and make sure that everyone involved in the company is
aware of the succession that is about to take place.
The second crucial step is preparing the future generation and making sure they have the
managerial and leadership capabilities needed to lead the company. Some good preparation
strategies include providing high-level education, exposing candidates to work experience
outside the family business, and one-on-one mentoring from the senior to the successor to
transfer the company vision and mission.
Third is maintaining a healthy relationship between the senior and the successor, especially
during the transition period. Either an unwillingness by the incumbent to part with the powerful
role in the company, or an unwillingness by the successor to learn from their seniors can cause
substantial issues during the succession. It is vital for successors regardless of their education
level to learn firsthand from their seniors in managing the company, because those skills can
never be learned through formal education alone.
A fourth key component is regular communication among family members, which can reduce
the risk of conflict both in the business and in the family. Regular meetings among all family
members involved must be done to make sure everyone is on the same page. Indications of
positive communication include the presence of clear rules and boundaries among members, the
ability to solve disputes effectively and the presence of unified support from all family members.
(Morris, 1997)
This study judges the success of a family business succession through the following criteria: the
increase in company sales, the increase in the number of employees, the increase in company
assets, and new product availability and growth in market share.
Prior to the writing of this paper, extensive research had already been conducted on the concept
of the family business and the components that contribute to its success. A study by Palacios et
al. (2013) found that family-oriented businesses tend to view their company as a means for
family members to gain a living, placing more emphasis on providing jobs for family members
as opposed to thinking about the company legacy and recruiting the best professionals for
important leadership roles. Another study by Wang et al. (2004) was conducted to small-middle

The Fourth International Conference on Entrepreneurship | Book Three
23
scale family businesses (having maximum 250 employees) in UK to identify the relationship
between succession issues towards the business performance of the company. In Italy Bigliardi
and Dormio (2009) performed a study to identify the contributing factors of successfully
inheriting a family business. Having a well thought out succession plan over an extended period,
keeping a well-educated family background, and enforcing strict rules by sticking to family
values are a few aspects that are highlighted to ensure a successful generational change in a
family company.
HYPOTHESIS GENERATION
Based on earlier discussion and using the factors of family business succession have been
identified by researcher i.e: succession planning (X1), preparation of heirs (X2), relationships
among family members (X3) as independent variables while succession process (Y) and post
succession performance (Z) act as dependent variables , below model is generated:
Figure 1.The conceptual model
Source : adapted from Wang et al. (2004)
H1 : Succession planning is positively related to succession process
H2 : Preparation of heirs is positively related to succession process
H3 : Relationship among family members is positively related to succession process
H4 :Succession planning, preparation of heirs, and relationship among family members are
simultaneously related to succession process
H5 : Succesion process is positively related to post succession business performance
RESEARCH METHODS
This descriptive quantitative research uses survey method towards the population of medium to
big scale family business –using the indicator of Biro Pusat Statistik i.e: hiring more than 20
employees- in Indonesia that have survived at least one transition or succession in the business.
Surveys were done in some area in East Java province including Surabaya, Mojokerto, Pasuruan,
and Gresik area within the time frame in July-October 2015 collecting data from 73 family
businesses. Independent variable of succession planning (X1) using in the research are measured
by indicators such as B1 the selection process of heir, B2 definition of time span, B3 hiring of
consultant, B4 stakeholder awareness, B5 company rules about succession. Preparation of heirs
(X2) used indicators of B6 formal education, B7 mentoring and training, B8 working experience
outside the family business and B9 entry position. Independent variable X3 (relationship among

The Fourth International Conference on Entrepreneurship | Book Three
24
family members) used some indicators such as B10 open communications, B11 regular meeting
among family member involved in the business, B12 regular gathering among family members
involving and not involving in the business, B13 family business rules, B14 mechanism of
conflict resolution, B15 support of family members towards family business, B16 formal
discussion of family members involved in the business, B17 formal discussion of family
members involved and not involved in the business, B18 rules for the family members in
relation to the business. Meanwhile the dependent variable Succession Process (Y) uses some
indicators such as C1 time span of succession, C2 successful transition, C3 willingness to
delegate authority and control to the heirs, C4 control of business is taken by heirs. The other
dependent variable Post Succession Business Performance (Z) is measured by indicators D1
sales growh, D2 employee growth, D3 asset growth, D4 product line growth and D5 market
share growth.
A questionnaire with cover letter was sent to the managing directors of these family businesses
of total 126, while 105 replies were received. Quantitative data analysis was done after all
questionnaires collected and data were classified, tabulated and coded in order to be processed.
However before data analysis was done, some instrument tests were performed i.e: validity test
with Pearson correlation method and reliability test with Cronbach’s alpha method. Path
analysis was performed to examine the influences of intervening variables dan to determine the
relationship pattern among three or more variables (Latan and Ghozali, 2013). This technique is
used to measure the contribution showed by path coefficients in every path diagram of causal
relationship among variables X1, X2, and X3 towards Y and the influence to Z.
The calculations of path analysis using inter variables causal effect decomposition model will
result in direct causal effects, indirect causal effects and total causal effects. The t-statistic test
will be performed in order to test the hypothesis H0 (the independent variable not significantly
influence the dependent variable) and Ha (independent variable significantly influence the
dependent variable). According to Ghozali(2012) if T statistics > 1.96 H0 is rejected and Ha is
accepted and if T statistics <1.96 thus H0 is accepted and Ha is rejected. Next step is to examine
the coefficient of determination, denoted R² or r² and pronounced R squared, is a number that
indicates how well data fit a statistical model – sometimes simply a line or a curve. An R² of 1
indicates that the regression line perfectly fits the data, while an R² of 0 indicates that the line
does not fit the data at all.
RESULTS AND DISCUSSION
The data for the purpose of this study was taken from middle to large scale family industries in
the Surabaya, Mojokerto, Sidoarjo, Pasuruan and Gresik area with indicators of having over 20
employees and which has experienced the succession process at least once. In total, data from
73 companies were used for this research.
There are a few ways to categorize the respondents used for this study. Based on the number of
successions, most of the respondents interviewed (58.14%) have only went through one
succession, while 32.56% had experienced succession twice. Based on company lifetime,
companies that have been established 30-39 years make up 32.56% of the collected data,
followed by 10-19 years with 23.26%, 20-29 years with 18.60% and 40-49 years making up
16.28% of the data. Based on position within the company, 48.83% of the respondents take up
the position of Director within their companies, while those who are Owners and Managers of
the company each make up 18.60% of the data.

The Fourth International Conference on Entrepreneurship | Book Three
25
Table 1. Characteristic of respondents
Number of
Successions
Company Type
Total
% Trade Industr
y
Servic
e
Property
1 6 7 9 3 25 58,14
2 3 5 6 - 14 32,56
3 1 1 1 - 3 6,98
4 - 1 - - 1 2,32
Total 10 14 16 3 43 100
Company
Lifetime
Company Type
Total
% Trade Industry Service Property
0-9 - - 1 - 1 2.32
10-19 - 2 7 1 10 23,26
20-29 3 1 3 1 8 18,60
30-39 5 5 3 1 14 32,56
40-49 1 4 2 - 7 16,28
60-69 - 1 - - 1 2,32
70-79 1 - - - 1 2,32
90-99 - 1 - - 1 2,32
Total 10 14 16 3 43 100
Position Company Type
Total
% Trad
e
Industry Service Property
Director 5 9 6 1 21 48,83
Commissioner 1 2 - - 3 6,98
Manager 1 - 5 2 8 18,60
Other - 1 2 - 3 6,98
Owner 3 2 3 - 8 18,60
Total 10 14 16 3 43 100
To make sure all the variables used in this study are accurate, we apply the validity and
reliability test. From the validity test using the Pearson bivariate correlation method, it is found
that all indicators from variables X1, X2, X3, Y and Z are valid.
The reliability test is also done to measure how reliable the indicators are when measuring large
samples of data using the Chronbach’s Alpha method. From the reliability test on X1, we found
that variables B1 and B3 are not reliable and will not be used for this paper. The test on X2
shows that variable B6 is not reliable, while variables B8 and B9 are reliable and will be used.
For X3, all variables B10-B18 are reliable. For Y, variables C1-C3 are reliable, while C4 is not.
Last for Z, variables D1, D3, D4 and D5 are reliable and is valid for use for this paper.
After the reliability and validity test, a path analysis is done to evaluate the direct relationships
between the variables. Planning of Succession (X1), Preparation of the Successor (X2), and
Relationships between Family Members (X3) is discovered to be directly related to the
succession process (Y). The succession process (Y) is directly related to Business Performance
(Z). By looking at the coefficients of the path analysis diagram, we can draw conclusions
whether the variables are closely related (with T-statistics of >1.96) or not closely related (T-
statistics of <1.96).

The Fourth International Conference on Entrepreneurship | Book Three
26
Figure 2. Path analysis diagram
In this case, the variable for Succession Planning (X1) is not significantly related to the
Succession Process (Y) because it has a T-statistic of 1.178232 (<1.96). However, a positive
original sample value of 0.228142 shows that Succession Planning still has a positive influence
towards the succession process. A proof that can be seen is that business owners from around
East Java have not considered hiring consultants to help them prepare for the succession
process. Therefore, there are no strict rules in place regarding the succession process of their
businesses.
Likewise, the variable for Preparation of the heirs (X2) does not have a major influence toward
the succession process (Y) as it has a T-statistic of 0.984663 (<1.96), but a positive original
sample value of 0.183329 still makes it have a positive influence for a successful transition.
From the responses received the level of education of the successors is not vital in ensuring
success. Rather, getting the right guidance and management advice from their predecessors is
much more important for the successors during the takeover period.
On the other hand, Relationships among Family Members (X3) has a considerable influence
toward the succession process (Y) with a T-statistic of 2.961620 (>1.96) and a positive original
sample value of 0.403622. A majority of respondents agreed that a friendly and open
relationship among family members, along with the unified support from all family members is
vital for the success of a family business succession. In addition, organizing meetings from time
to time with all family members involved in the business is important to keep everyone aware of
the current business situation.
Finally, the succession process (Y) also has a tight correlation with post succession Business
Performance (Z) with a T-statistic of 6.46779 (>1.96) and a positive relationship with an
original sample value of 0.602796. The success of a family business post succession can be
measured by how the previous generation ownership is able to smoothly hand over the duty and
responsibility of leadership to their successors, as according to what has been planned
beforehand.
Table 2. Path coefficient result of path analysis
Original
Sample
(O)
Sample
Mean (M)
Standard
Deviation
(STDEV)
Standard
Error
(STERR)
T Statistics
(|O/STERR|)
Family Relationships
(X3) -> Succession
Process (Y)
0.403622 0.383294 0.136284 0.136284 2.961620

The Fourth International Conference on Entrepreneurship | Book Three
27
Succession Process (Y)
-> Business
Performance (Z)
0.602796 0.595257 0.093200 0.093200 6.467779
Preparation of heirs
(X2) -> Succession
Process (Y)
0.183329 0.192469 0.186184 0.186184 0.984663
Succession Planning
(X1) -> Succession
Process (Y)
0.228142 0.241250 0.193631 0.193631 1.178232
Through the R square method, it is found that the variables of Succession Planning, Preparation
of heirs and Relationships among Family Members (X1, X2 and X3) make up 49.51% of the
main components for the succession process (Y) while the other 51.49% are made up of
variables that are not identified in this paper. Using the same method, the succession process
(Y) is found to have an influence towards Business Performance (Z) by 36.34%, with the other
63.66% coming from other factors not discussed in this paper.
From there, we identify the direct and indirect effects for each variable. The direct effects of the
variables X to Y and Y to Z are found from the path analysis coefficients. The indirect effects of
variables X to Z (via Y) can be calculated by multiplying the values for each X variable by the
value of the Y variable. The total effect towards Z for each variable, then, is just the direct effect
and indirect effect added together. The total effect for each variable towards Business
Performance can be seen from the table below.
Table 3. Total effect of path analysis
Direct Effect Indirect Effect
Total Effect
(Z) Succession
Process (Y)
Business
Performance
(Z)
Business
Performance (Z)
Succession Planning
(X1)
0,228142 - 0,146661 0,374803
Preparation of Heirs
(X2)
0,183329 - 0,110510 0,293839
Relationships among
Family Members (X3)
0,403622 - 0,243301 0,646923
Succession Process (Y) - 0,602796 - 0,602796
There are a few limitations that can be pointed out from the results of the study above. First is
the size of the sample population used, which is comparatively small. Some of the data received
were not valid as different companies were experiencing various parts of the succession process.
Because of the difficulty to find viable interviewees, the researcher had to interview some
companies that have yet to complete a full succession. Second is the inability of the respondents
to answer the questions accurately. The main reason for this is that family business owners tend
to keep the details of their succession process a family secret. Some of the questions, however
general, may be considered as too sensitive to be answered accurately by the interviewees.
Lastly, the limited time that was allocated to data collection caused some of the data to not be
received on time for the purposes of this study.
CONCLUSION
Succession Planning (X1) has a positive influence but is not significantly related to the
Succession Process (Y). One of the major factors contributing to this is due to the majority of
sample size or up to 93% being relatively new family businesses established under 50 years ago,

The Fourth International Conference on Entrepreneurship | Book Three
28
and only 58% of the entire sample having gone through only 1 succession. In this case, this first
succession process only involves a few members of the inner family circle and almost occurs
naturally. This also reflects the study from Wang et al. (2004) where the succession process
does not significantly affect business performance for small-scale family industries. However,
as the company grows bigger and more family members are involved, a more systematic
approach is needed in preparation for the succession process in the form of educating and
mentoring.
Healthy relationships among family members in the form of continued support, open
communication, clear division of roles and responsibilities and effective conflict resolution
strategies can do wonders to ensure the success of a succession process and improve business
performance in the post-succession period.
The wide scope of respondents used in this study causes the data to be more spread out,
reducing the reliability in some areas. The variety of respondents include businesses from
trading, services, industries and real estate with some only being established 10 years to others
who have been in business for 100 years.
One of the greatest challenges in running a family business is the discipline to follow rules that
have been agreed upon, especially among family members due to the intimate nature of the
relationship. Being overly tolerant and giving special treatment to members of the family will
provide a negative effect in the long run. Things will be different if the same regulations are
carried out by professionals. As a result, hiring professionals to operate in the management of
the family business is a great solution to solve internal conflicts, provide outside opinion and
provide an overall balance for the company after succession.
REFERENCES
Astrachan, J, Allen, E., Spinelli, S., Wittmeyer, C. and Glucksman, S. (2003). American Family
Business Survey 2002. George and Robin Raymond Family Business Indtitute, New
York, NY.
Beckhard, R. and Dyer, W.G (1983). Managing continuity in the family-owned business.
Organizational Dynamics 12(1):5-12.
Bigliardi, Barbara and Alberto Ivo Dormio (2009). ‘Successful generational change in family
business’. Measuring Business Excellence Vol.13 No.2, pp.44-50.
Brace, Ian (2011). Questionnaire Design: How to Plan, Structure and Write survey material for
effective market research, 2nd edition. London: Market Research in Practice.
Dyer, G. (1988). Cultural Change in Family Firms. San Francisco: Jossey-Bass.
Davis, J.A. (1998) ‘Developing the next generation’ in the program, Families in Business: from
Generation to Generation. Harvard Graduate School, Boston, MA.
Fox, M., Nikalant, V. and Hamilton, R. (1996). ‘Managing succession in family-owned
businesses’. International Small Business Journal, Vol.15 No.1, pp.15-26.
Ghozali, Imam. (2011). ‘Aplikasi Multivarian dengan Program SPSS’. Semarang: UNDIP.
Kets de Vries, M.F. (1993). “The dynamics of family controlled firms: the good and the bad
news’. Organizational Dynamics Vol. 22 No.3, pp.59-71.
Kuncoro, Mudrajad (2013). Metode Riset Untuk Bisnis dan Ekonomi. Edisi 4. Jakarta : Erlangga.
Lansberg, I. (2002). The Succession Conspiracy. Family Business Sourcebook. Marietta: Family
Enterprise Publishers.
Latan dan Ghozali. (2012). Partial Least Square Konsep, Teknik dan Aplikasi Menggunakan
Program SmartPLS 2.0 M3. Semarang: Badan Penerbit Undip.
Morris, Michael H.; Roy O. Williams, Jeffrey A. Allen, & Ramon A. Avila (1997). ‘Correlates
of success in family business transitions’. Journal of Business Venturing Vol.12, pp.385-
401

The Fourth International Conference on Entrepreneurship | Book Three
29
Nisfianoor, Muhaman. (2009). Pendekatan Statistika Modern untuk Ilmu Sosial. Jakarta:
Penerbit Salemba Humanika.
Noor, Juliansyah.(2011). Metodologi Penelitian : Skripsi, Tesis, Disertasi dan Karya Ilmiah.
Jakarta: Prenada Media.
Palacios, Tomas M.Banegil; Ascension Barroso Martinez & Juan Luis Tato Jiminez (2013).
‘Family Growth versus family firm growth: professional management and succession
process’. The Journal of the Iberoamerican Academy of Management, Vol.11 No.1,
pp.58-76.
Raharjo, S. (2013) ‘Belajar Praktek Analisis Multivariate dengan SPSS (IBM SPSS’ Statistics)’
Edisi 1. Komsistensi. Klaten-Jawa Tengah
Sarwono, Jonathan. (2007) Analisis Jalur untuk Riset Bisnis. Yogyakarta: Andi.
Siregar. (2014). ‘Statistik Parametrik untuk Penelitian Kuantitatif’. Jakarta: Bumi Aksara.
Sugiyono. (2012) Metode Penelitian Kuantitatif Kualitiatif dan R&D. Bandung: Alfabeta.
Susanto, A.B, Wijanarko, H., Susanto, P. & Mertosono, S. (2008). ‘The Jakarta Consulting
Group on Family Business’. Jakarta: The Jakarta Consulting Group.
Wang, Yong; David Watkins and Neil Harris; Keith Spicer (2004). ‘The relationship between
sucession issues and business performance’. International Journal of Entrepreneurial Behaviour
& Research Vol.10 No.1/2, pp.59-84

The Fourth International Conference on Entrepreneurship | Book Three
30
EFFECT OF ATTITUDE, SUBJECTIVE NORMS, AND
ENTREPRENEUR BEHAVIOR CONTROL ON SME’S ATSABE
COMMUNITY BEHAVIOR WITH ENTREPRENEUR INTENTION
AS MEDIATOR VARIABLE
1Manuel Goncalves, 2J. Nirbito♠
Ciputra Univercity Surabaya
INDONESIA
Email: [email protected], [email protected]
ABSTRACT
The purpose of this research is to examine and analyze the influence of attitude,
subjective norms, and perceived behavior control on SME’s atsabe community
behavior with entrepreneur intention as mediator variable. The research is
research causal by adopting quantitative approach. A population that used in
the research is are SME’s agents in Atsabe, Timor Leste by the number of as
many as 1,300 people.Technique the sample collection in this research was
purposive sampling and the number of respondents used in this research
determined by using slovin formula.Technique data collection was carried out
by interviews, survey and documentation. Technique analysis was conducted
using analysis structured equation model (SEM) partial least square (PLS).The
results of the study indicating that attitude, subjective norm and perceived
behavior control have had a positive impact and significant impact on SME’s
atsabe community behavior, in Timor Leste. In addition, perceived behavior
control also have a positive impact and significant impact on SME’s atsabe
community behavior, in Timor Leste.
Keyword: Small Medium Entreprises, behavior, attitude, subhective norms,
perceived behavior control.
INTRODUCTION
Now the activity entrepreneurial traits that encouraged by many regions is small and medium
entreprises programs (SME). It because the SME had already been assessed having a resistance
relatively better than with effort a larger scale. The role of umkm are also highly strategically
important in terms of various aspects. First, the number of its industry a great and there are in
every sector of economic. Second, the potential that is great in creating more employment
opportunities compared with the investment that same at a venture with scales greater. Third,
contribution SMEs in it was reflected from gdp significant. Fourth , having donation to foreign
exchange the state with the export value are fairly stable (Hadiyati, 2011). The empowerment of
SME, will also capable of engendering a flagship program of program entrepreneurship and
existing partnership .
SME in indonesia arranged on constitution no. 20 years 2008 who classifies micro business is
business have criteria having net assets most of fifty million rupiah, except land and building,
and having earnings a year the most three hundred million rupiah, small businesses is the
business that have criteria net assets more than fifty million rupiah up to 500 million rupiah, and
having results sales were from 300 million rupiah to 2.5 billion rupiah a year, while medium

The Fourth International Conference on Entrepreneurship | Book Three
31
enterprises menpunyai criteria having net assets more than rp 500 million up to rp 10 billion and
earnings were 2.5 billion rupiah up to 50 billion rupiah a year. In Timor Leste, SMEs arranged
on the act of no. 5 of year 2005 and can be seen in Table 1 follows:
Table 1 The classification of SME in Timor Leste
No Criteria Asset
($)
Rendimento Annual
($)
1 Micro Empresa 100 ate 5.000 6.000
2 Medio Empresa 5.000 ate 100.000 6.000 ate 500.000
3 Alto Empresa 100.000 ate 1.000.000 500.000 ate 5.000.000
Sumber: MoF, Imposto Timor Leste
Timor Leste was one of the countries in Asean having dependence on natural resources as main
source of revenue the state. The main commodities be main source of revenue Timor Leste is oil
and gas.This shown through the data is presented in Figure 1 follows:
Figure 1. The Prediction GDP Timor Leste from oil and gas on 20 years.
Source: (Kementrian Perencanaan dan Keuangan-RDTL, 2005)
Figure 1 shows that the contribution of oil and gas to state revenues reached more than 90% or
more precisely of 94%. This condition and pushing level demand job high in the oil sector and
gas.But, private companies also is not optimal to do investment because security conditions and
politics in east timor not yet stable. This led unemployment rate in Timor Leste increased.
Unemployment rate consisting of productive age between 15 up to 35 years. Researcher find
that economy of Timor Leste divided between the non oil and gas, which is agriculture, and oil
and gas. The 11% from age productive work in the agricultural sector, which was taken from
76,899 the Timor Leste population, who exertion on the agricultural sector and others workers
was between 40 to 55 years, with most of them still depends on agricultural production
subsystem .According to SEPFOPE (Secretaria de Estado The Formacao Prefesional e
Emprego), through force survey work done in 2013 unemployment in east timor to 11 % of the
total productive age as many as 699,620 people of the population as many as 1.212.107 million
people, where consisting of male are 618,789 and female are 593,318 (source: Satistic East
Timor The Population Projection 2014).
Readiness of youth people Timor Leste to labor market, if there was a progress in the education
sector, but still too many young people at adulthood without education, about 20 percent youth
people of Timor Leste is, only 12 percent who completed secondary education and succeeded in
continuing their studies to college. The unemployment rate in Timor Leste also caused by the
more youth educated who aspires to leave sectors traditional and not formal, in particular the
agriculture. Similarly, the impact of economic growth in the future to employment opportunities
promised because the private sector do not increase and almost does not develop the last few

The Fourth International Conference on Entrepreneurship | Book Three
32
years. It’s not really simple in solving the unemployment rate in Timor Leste is a problem
happened since three decades ago, but some field who promised can identified with consider the
prospect of natural resources and opportunities demographic faced by Timor Leste in to
overcome the problem of unemployment. Solution can try to get out of the complexity problems
above demanding thoughts and actions creative and innovative, achieved through the creation of
entrepreneurial young in the quantity and quality of sufficient.
Entrepreneurial contribution in timor leste was significant, this can be seen from the receipt of
the state tax sourced from SME, count of 2012 until 2015 $198,072,270.05. This contribution
only come from 5,557 SME’s entrepreneurs who is active, while in the ministry of industry
trade and environment the number of investors micro and small entrepreneurs who teregistrasi
as many as 9,722. (source: The Department Of Taxation And The Department Of Commerce In
Town), when calculated on a mathematics means that there are 4,165 SME entrepreneurs who
were not contribute to government income sourced from tax.
Tracing desire for knowledge or the initiative of the entrepreneurship of Timor Leste people,
researcher convey in this scientific, that there are several municipio the city madia in Timor
Leste is the famous with a entrepreneurship, of them are municipio ermera, exactly posto
administrativo municipio Atsabe .Atsabe is one of areas in Timor Leste that having the number
of entrepreneurs reached 10 % of the total the population as shown by table 2 the following.
Table 2 The population of Atsabe
Male Female
10.034 3.897
SME’s entrepreneur are 1.393 (10%)
Mostly people of atsabe was not a a graduate of a college who has knowledge and skills from a
stool in entrepreneur lecture and concentrate on entrepreneurship, but factors that located within
the around which affect the pattern he thought to be an entrepreneur. The environment around
which mostly comes the community who also work as entrepreneur teaches about knowledge
and skills being entrepreneur.
The study is done to analyze behavior entrepreneurial traits that doing the atsabe by using
fundamental principle of the theory behavior the theory planned behavior. Conceptually tbp said
three determinan intention is independent. First is attitude, is a pattern of behavior, tendention,
predisposing to to fit in social situation, or simply too are defined in response to social
stimulation which have been conditioned (Musdalifah, 2015). Then there is subjective norm
which is a social pressure that was felt to be to do or behave certain (Mahmoud et al, 2015). The
third of the determinan intention according the concept of TPB is perceived behaviour control,
is a variable showing easy or the difficulty of doing of an act which referred to (Firmansyah,
2013).
The Objectives of Study
The objectives of this study are:
1. To know and analysis the influence of entrepreneur attitude against entrepreneur
intention of Atsabe people.
2. To know and analysis the influence of subjective norm against entrepreneur intention of
Atsabe people.
3. To know and analysis the influence of perceived behaviour control against entrepreneur
intention of Atsabe people.
4. To know and analysis the influence of entrepreneur intention against entrepreneur
behavior of Atsabe people.
5. To know and analysis the influence of perceived behaviour control against entrepreneur
behavior of Atsabe people.

The Fourth International Conference on Entrepreneurship | Book Three
33
LITERATUR REVIEW
Theory of Planned Behavior
Theory of planned behavior (TPB) developed by Ajzen as the expansion of theory of reasoned
action (TRA). TPB is the conceptual framework that used to scrutinize the conduct individual
which in theory of planned behavior allow it can be seen factor that influences individual
decisions in behave so that it can be said an individual in behave based on taking into account
rational (Kumar, 2012). TPB is model resulting from tra by assuming that certain behavior
determined by intention of actually doing it. TPB as the expansion of tra because in TRA there
is no components control behavior felt, so that TRA model difficulty in clarifying conduct of
one who not having control over his behavior (Mok & Lee, 2013). TPB explained that conduct
of one determined by intention behavior. In TPB components an attitude toward behavior and
subjective norm have in common with the theory TRA, but in TPB added perceived behavior
control as a component that determines intention behavior.
Intention behavior is the size of individual willingness to do desired behavior. Based on thought
TPB model, so intention behave is strong predictor determine behavior. Someone who
intentional behavior high will allow the person engages or undertakes these behaviors are (Mok
& Lee, 2013). TPB consisting of three variable, which is determinan that determines intention
behave someone, namely:
1. The first variable is attitude, that define as the extent to which someone evaluate or
judge these behaviors are profitable or not, agreeable or disagreeable, good or bad,
dangerous or beneficial, like or dislike towards an object will mediate all responses to
the object. Become determinan attitude that determines intention behave someone
(Hasbullah et al, 2014). Attitude are steps from the belief conduct of one, this is a
function individuals who feel that they have the possibility of the result of behavior that
will be done as well as their evaluations (Mok & Lee, 2013).
2. The second variable is subjective norm, that define as a reference that originated in the
neighborhood of social impact a person in behave. TPB suggested that someone could
be certain based on what is expected others on the person .People can have good
manners towards an object certain, but if any pressure from others not to do it, so that
person will be have a negative attitude (Hasbullah et al, 2014). A subjective norm
measuring the effects of the influence of social given on individual (Mok & Lee, 2013).
3. The third variable is perceived behavior control, namely feel ease or trouble in carrying
behavior. Behavior felt can be a reflection of a creed against the resources and the
chance to make any specific behavior (Hasbullah et al, 2014). Perceived behavior
control is size of perception someone about ease and difficulty where they were certain
behavior. The extent to which someone succeeded in changing behavior intention to
conduct actual relies heavily on the control of behavior felt (Mok & Lee, 2013).
Entrepeneur
Entrepreneur is someone who develops of a new product or a new idea and build business with
a new concept. In this case will require a number of creativity and a the ability to see patterns
and trend-trend that apply to be an entrepreneur (aprilianty, 2012). Sonny et. al (2012) clear that
entrepreneur is a soul take risks to open a business on a number of occasions, independent and
will begin to business, without over to the fear or anxious even in the condition uncertain. Based
on a number of understanding about entrepreneur can be explained a entrepreneur having in the
ability to change things for the better or created seseuatu an entirely new, soul creative and
innovative.
Behavior business expressed by Thobias et al, (2013) as spirit, the ability, attitude, behavior
individual in handling businesses or activities that leads to the effort to recruit, created, apply

The Fourth International Conference on Entrepreneurship | Book Three
34
how to work, technology, and new products with improve the efficiency in order to give better
service and or make a profit greater.
Behavior approach in the concept of entrepreneurship like approach trait is emphasized behavior
whatever dominated in entrepreneurship successful. In this approach, myths about
entrepreneurship be broken.For example that entrepreneurship not can be learned. It approach
behavior is emphasized an opportunity for anyone to learn entrepreneur (Helmi, 2011). Based
on a number of the discussion definition entrepreneurial behavior, so can be concluded that
behavior entrepreneur man is actions that can be measured performed with courage, eminence
and strength in meet the needs and issues concerning activities business with capability and
power derived from itself.
Small Medium Entreprises (SME)
Anggraeni et al, (2013) describing on small and medium entreprises as follows:
1. Micro business is a productive belonging to someone individuals and or business entity
individuals meet the criteria micro business as regulated by law.
2. Small businesses are productive economic undertakings that stands alone, practiced by the
individuals or business entities that are not is a subsidiary or not the branch company
owned, controlled, or become a part either directly or indirectly of an effort middle class or
big enterprise that meet the criteria small businesses as stipulated under the law.
3. Medium enterprises is a productive economic that stands alone, practiced by the
individuals or business entities that are not is a subsidiary or branch company owned,
controlled, or become a part either directly or indirectly with small businesses or great
effort with the total net assets of or result annual sales as are regulated in the law of.
Based on the meaning of on top can explained that SME is a form of productive
economic undertakings practiced by the individual or business entity individuals meet the
criteria micro business, small, and medium business. Based on the literature review above, the
conceptual and thinking framework for this study can be illustrated as the Figure 2 and Figure 3.
Figure 2 Thinking Framework
Literature Review:
1. Theory Planned Behavior
2. Entrepreneurship
3. Small and Medium Entreprises (SME)
Research Questions: Whether entrepreneur attitude, subjective norm, perceived behaviour control have
influenced againts entrepreneur intention and entrepreneur behavior of Atsabe people?
Penelitian Terdahulu:
1. Gopi & Ramayah (2007)
2. Dahalan et al., (2015
3. Handaru et al., (2014)
4. Amin, (2015
Data Analysis and The Result
Conclusion, Implications and Suggestions
Hypothesis
Research Background: High rate of unemployment and lack of employment opportunities available
in the city atsabe, timor Leste get the economies to its lethargic in timor leste.
P

The Fourth International Conference on Entrepreneurship | Book Three
35
Figure 3 Conceptual Framework
Research Hypothesis
Based on the background and the formulation of the problem posed in this study and the
previous study presented above, then the hypothesis proposed in this research are as follows:
H1: Entrepreneur attitude has significant influence against entrepreneur intention of people of
Atsabe.
H2: Subjective norm has significant influence against entrepreneur intention of people of
Atsabe.
H3: Perceived behavior control has significant influence against entrepreneur intention of
people of Atsabe.
H4: Entrepreneur intention has significant influence against entrepreneur behavior of people of
Atsabe.
H5: Perceived behavior control has significant influence against entrepreneur behavior of
people of Atsabe.
RESEARCH METHODS
The kind of research it is the type of research causal by adopting quantitative approach .The
research also expected descriptive, according to Hamdi & Bahruddin, (2015:6) is research
devoted to describe or described the facts is. Descriptive research is a form of research devoted
to described the facts is, good a natural phenomenon and phenomena were made. The
phenomena can be the form of, activity, characteristic, change, relations, in common, and the
contrast between phenomenon one with the phenomenon other.
The population used in this study is a society Atsabe SMEs in Timor Timur with a total of 1,300
people. The sampling technique in this research is purposive sampling. Counting technique
using a sample size formula Slovin. Data collected by conducting interviews, survey and
documentation study. Then the analytical technique used is structural equation model using
partial least square.
RESULT AND DISCUSION
In this research will test hypotheses done with review of the coefficients path by comparing
between p-value this value of alpha 0,05. Decision making hypothesis would be if value of
alpha 0,05 smaller than p-value so ho rejected that is significant. But if value of alpha 0,05
Entrepreneur
Attitude
Subjective
Norm
(SN)
Perceived
Behavior
Control
(PBC)
Entrepreneur
Intention
Behavior

The Fourth International Conference on Entrepreneurship | Book Three
36
larger than p-value so ho received does not affect significantly. Are the main the analysis shown
in figure 4 following:
Figure 4 Partial Least Square Model for Bootstrapping
Based on the analysis that has been done and the criteria used in this study, the following table
is the result obtained in hypothesis testing are obtained.
Table 3 Hipothesis Analysis Result
Hipotesis Pengaruh t-Hitung P-Value Keputusan
H1 Niat Entrepreneur => Behavior 5,860 0,000 Diterima
H2 Perceived Behavior Control =>
Behavior 2,609 0,009 Diterima
H3 Perceived Behavior Control =>
Niat Entrepreneur 4,055 0,000 Diterima
H4 Subjective Norm => Niat
Entrepreneur 2,107 0,036 Diterima
H5 Sikap Entrepeneur => Niat
Entrepreneur 2,561 0,011 Diterima
Sumber: Data processed
The analysis has shown in table 2, explain that entrepreneur attitude have significant influence
on the entrepreneur intention of people Atsabe. This result confirms that the that the interest is
something which excite attention on something thing. Interest will indicate what is desired or
done or what people being endeared. Someone who is interested in a thing , then all action or
what is done will led him to his interest (Aprilianty, 2012). Based on results of descriptive
analysis, known that attitude entrepreneur and intentions entrepreneur atsabe of society
including in the category of high, that reveals the attitudes entrepreneur owned by the
community high atsabe also cause or affecting entrepreneur intention of people atsabe.
The influence of subjective norm on entrepreneur intention of people atsabe, known to have a
positive and significant. This outcome indicating that when a norm subjective increased, so
intention people to do a business are also increased. Vice versa, if a norm subjective decline, so
intention people in doing effort or entrepreneurship also declined. Based on analysis of the

The Fourth International Conference on Entrepreneurship | Book Three
37
descriptive, it is also known that a norm subjective the people atsabe have a high. Hence known
that in the people atsabe a subjective norm owned the affect his intention to perform the act of
entrepreneurship hopefully with a a subjective norm high so the intention is also high.
The influence of perceived behavior control, based on the results of the analysis which is shown
in table 2 , be seen that is the positive a significant impact on entrepreneur intention .This
outcome indicating that perceived behavior control increased, so intention people to do the
effort or entrepreneurship also rose. Vice versa, if perceived behavior control decline, so
intention people to do the effort or entrepreneurship also declined. Based on the results of
descriptive analysis done, be seen that perceived behavior control of the people Atsabe have a
high. In addition the people Atsabe also have high entrepreneur intentional. Thus known that in
the people Atsabe perceived behavior control owned the affect his intention to perform the act
of entrepreneurship hopefully with a control behavior entrepreneurship high so the intention is
also high.
On entrepreneurial intentions having significant influence and give a positive response to the
entrepreneurs behavior of the people people Atsabe. This result confirms that if the entrepreneur
increased, then entrepreneur behavior residents to conduct a business are also increased. Vice
versa, if entrepreneur intention decline, then entrepreneur behavior the people to make an effort
or entrepreneurship also declined. Based on analysis of the descriptive it is also seen that the
people entrepreneurship intention Atsabe have a very high level. Then for variables behavior
owned by the people Atsabe also has a very high level. Thus seen that on the community atsabe
intention entrepreneurship owned that affected conduct of a in the community atsabe to perform
the act of entrepreneurship.
On perceived behavior control to entrepreneur behavior of the people atsabe, seen that control
behavior berwirausaha having influence a positive and significant impact on entrepreneur
behavior of the people atsabe. This outcome indicating that when perceived behavior control
increased, so the behavior of the people to perform the business or entrepreneurship also rose.
Vice versa, if perceived behavior control decline, so the behavior of the people to perform the
business of also declined. Based on the results of descriptive analysis be seen that perceived
behavior control the people atsabe and entrepreneur behavior owned by the people atsabe have a
high.
CONCLUTION AND RECOMMENDATION
The conclusions obtained from this study based on the formulation of the problem and the
results of data analysis that has been done in previous chapters are as follows:
1. The attitude of the entrepreneur has a significant influence on the entrepreneur intention
of the people Atsabe. If the attitude of the entrepreneur increases, the entrepreneur
intention will also increase.
2. Subjective norm has a significant influence on the entrepreneur intention of the people
Atsabe. If subjective norm increases, the entrepreneur intention will also increase.
3. Perceived behavior control has a significant influence on the entrepreneur intention of
the people Atsabe If the perceived behavior control increases, the entrepreneur intention
will also increase.
4. Entrepreneur intention has a significant influence on the entrepreneur behavior of the
people Atsabe. If entrepreneur intention increases, the entrepreneur behavior will also
increase.
5. Perceived behavior control has a significant influence on the entrepreneur behavior of
the people Atsabe. If perceived behavior control increases, the entrepreneur behavior
will also increase.
Recommendation that can be given based on the results of the analysis and conclusions
of this study is that the government may increase entrepreneurial attitudes, subjective norms,

The Fourth International Conference on Entrepreneurship | Book Three
38
and perceived behavioral control by the people Atsabe to improve entrepreneurship intentions.
The intention then would increase public entrepeneur behavior. This is necessary because based
on the results of the analysis still needs to improve the community who work as entrepreneur.
So as to improve on the three factors to be able to increase the number of entrepreneurs from the
people Atsabe.
REFERENCES
Anggraeni, F. D. (2013). Pengembangan Usaha Mikro, Kecil dan Menengah (UMKM) Melalui
Fasilitasi Pihak Eksternal dan Potensi Internal (Studi Kasus Pada Kelompok Usaha"
Emping Jagung" di Kelurahan Pandanwangi Kecamatan Blimbing Kota Malang). Jurnal
Administrasi Publik, 1(6), 1286-1295.
Aprilianty, E. (2012). Pengaruh Kepribadian Wirausaha, Pengetahuan Kewirausahaan, Dan
Lingkungan Terhadap Minat Entrepreneur Siswa SMK. Jurnal Pendidikan Vokasi, Vol. 2,
No. 3.
Firmansyah, B. (2013). Keterkaitan Pengalaman Kewirausahaan, Sikap, Norma Subjektif,
Kontrol Perilaku Terhadap Niat Untuk Menjadi Wirausahawan (Studi Pad Pengrajin
Batik Di Kota Surakarta, Kabupaten Sragen Dan Kabupaten Karanganyar). Riset
Manajemen dan Akuntansi, Vol. 4, No. 7.
Hadiyati, E. (2011). Kreativitas Dan Inovasi Berpengaruh Terhadap Kewirausahaan Usaha
Kecil. Jurnal Manajemen Dan Kewirausahaan, Vol.13, No. 1, 8-1.
Hamdi, Asep, S., Baharuddin, E. (2014). Metode Penelitian Kuantitatif: Aplikasi Dalam
Pendidikan. Yogyakarta: Deepublish.
Hasbullah, Norazlan., Mahajar, Abdul, J., Salleh, Mad I. (2014). Extending the Theory of
Planned Behavior: Evidence of the Arguments of its Sufficiency. International Journal of
Humanities and Social Science. Vol. 4, No. 14, December 2014. Pp. 101 – 105.
Helmi, A. F. (2011). Model Determinan Perilaku Inovatif Pada Mahasiswa Yang Entrepreneur.
Jurnal Psikologi, Vol. 38, No. 2, 134-146.
Kumar, Bipul. (2012). Theory of Planned Behaviour Approach to Understand the Purchasing
Behaviour for Environmentally Sustainable Products. Working Paper Indian Institute of
Management. Desember 2012, pp.1-43.
Mahmoud, M. A., Muharam, F. M., dan Mas'ud, A. (2015). Factors That Influence The
Entrepreneurial Intention Of Nigerian Postgraduates: Preliminary Analysis And Data
Screening. Asian Social Science; Vol. 11, No. 4.
Mok, WK., Lee, Y.K. (2013). A Case Study on Apllication of The Theory of Planned Behavior:
Predicting Physical Activity of Adolescents in Hongkong. Journal Community Medicine
and Healthy Education. Vol. 03, Issue, 5, pp.1-6.
Musdalifah, A. B. (2015). Pengaruh Locus Of Control Dan Sikap Entrepreneur Terhadap
Intensi Entrepreneur Melalui Kreativitas (Studi Kasus Pada Ibu Rumah Tangga Di
Kecamatan Donri-DOnri Kabupaten Soppeng). Jurnal Administrasi Publik, Vol. 5, No. 2.
Sonny, Eman, dan Burdinasari, S. (2012). Analisis Minat Mahasiswa Fakultas Ekonomi
Universitas Singaperbangsa Karawang Menjadi Entrepreneur. Jurnal Manajemen, Vol.09,
No.4.
Thobias, E., Tungka, A. K., dan Rogahang, J. J. (2013). Pengaruh Modal SOsial Terhadap
Perilaku Kewirausahaan (Suatu Studi Pada Pelaku Usaha Mikro Kecil Menengah Di
Kecamatan Kabaruan Kabupaten Kepulauan Talaud). Journal “ACTA DIURNA” Edisi
April 2013.

The Fourth International Conference on Entrepreneurship | Book Three
39
ENTREPRENEURSHIP LEARNING ANALYSIS ON THE
READABULITY OF ENTREPRENEUR TROUGH SUBJECTIVE
NORM AND ATTITUDES IN STUDENTS OF ECONOMIC
FACULTY ECONOMY UNPAZ
1Jose da silva, 2Denny Bernardus♠
Ciputra University Surabaya
INDONESIA
Email: [email protected], [email protected]
ABSTRACT
This study aims to determine the effect of entrepreneur readability to entrepreneur learning
through subjective norm and attitudes on Unpaz Students of the Faculty of Economics. The
method used in this research is quantitative method by using Structural Equation Modeling
(SEM) AMOS. The sample used in this study were students UNPAZ Faculty of Economics
majoring in Accounting, Management, and Banking totaling 187 students. This research
data collection methods by using a questionnaire with Likert scale. The results of this study
are entrepreneurial learning, subjective norm, attitude to entrepreneurs have a significant
and positive influence on the intention entrepreneur. Meanwhile, entrepreneurial learning
also has a significant and positive effect on the subjective norm. Four variables showed Da
Paz implication that the University should provide an opportunity to the students a lot of
activity in the field, sharing with colleagues who merged his business. Students are taught
to try to learn the business from the communities around and from an entrepreneurial
family background, always creative and read a great opportunity to succeed and never
give up until achieving success.
Keywords: Analysis of Entrepreneurship Education, Subjective Norm, Attitude and
Entrepreneur Readability.
INTRODUCTION
The State of Timor-Leste is a fully independent State and a fully sovereign State on 20 May
2002. In 2005 East Timor's population was estimated at 1,040,880 inhabitants. The population
of Timor Leste is a mixture of Malay and African tribes, a small part of Portuguese descent. The
majority of the population is Catholic (93%), followed by Protestant (3%), Islam (1%), and
Buddhist, 1%, 0.5%), and 2% confidence. Because the majority of the population is Catholic,
with international recognition through the United Nations (UN). As a newly independent State,
where the actual world situation enters the era of globalization, the era of global development
along with the development of science and technology, thus, the Government of East Timor in
general and the Office of the Ministry of National Education and especially in the Human
Resources Management Division of East Timor , Certainly faced with global challenges and
developments, this condition will greatly affect the development process in Timor Leste. To
respond to these conditions, the Human Resource Management Department is required to
develop a strategic plan in order to increase Entrepreneur's work spirit towards subsequent
development. (Kusminitarti, 2014).
Entrepreneur is one of the supporters who determine the advancement of the economy, because
the field of entrepreneurs have the freedom to work and independently. A person will have a

The Fourth International Conference on Entrepreneurship | Book Three
40
desire for an object or behavior if the individual is affected by the people around him to do it or
the individual believes that the environment or the people around him support what he does
(Saeroji & Tjahningsih, 2015). Profession as an entrepreneur is an option for Life and a
respectable professional choice that must be well planned and mature. Entrepreneur is a chosen
way of life because it has been believed with the facts and facts that the entrepreneur has a big
role in improving the quality of life of individuals, communities and countries.
Readability of entrepreneurship should and should be grown in the community including
students because it has many benefits, among others, proposed by Siswadi (2013).
Entrepreneurship learning can also increase the interest of students to choose entrepreneurship
as a career option in addition to career choice to be a private employee, civil servant, or BUMN
employee. Based on research conducted (Boukamcha, 2015) states the importance of
entrepreneurial learning in raising the desire to do entrepreneurship. Interest in entrepreneurship
activities will predict entrepreneurial behavior. Based on research conducted by Hussain and
Norashidah (2015) also shows a significant influence of entrepreneurial learning on
entrepreneurial readability. Attitudes of entrepreneurship is one aspect that must be prepared
mentally or emotionally in the form of action on a form of entrepreneurship. Based on research
(Dahalan et al.2015) shows that there is an influence between attitudes or entrepreneurial
behavior towards entrepreneurial readability. In addition, Susetyo and Lestari research (2014)
also mentions that entrepreneurship attitudes have a significant influence on entrepreneurship
readability of students.
Unemployment is not bad for the economy of Timor Leste. The country's GDP grew by eight
percent last year, according to the Asian Development Bank, and this will continue until 2015.
But Paulo Alves, the labor director at the Secretary of State for Skills and Employment Training,
warned of no employment in Timor Leste, Making it the poorest country in Southeast Asia. The
proof, Timor Leste has raised more than $ 10 billion since independence in 2002 from offshore
oil and gas reserves, but remains a low-income country, with extreme poverty and complex
social problems (UCA News, 2014).
LITERATURE REVIEW
Entrepreneurship
Entrepreneurs are individual activities aimed at starting or maintaining the management of
profit-oriented business units (Singh and Gupta, 2015: 14). Understanding of entrepreneurship
is a creative effort built on innovation to produce something new, have added value, give
benefits, create jobs, and the results are useful for others (Soegoto, 2011: 3).
Another sense Entrepreneur is the process of creating a new business. Through the process, an
individual will spend time, energy, money and risk taking for intrinsic rewards and extrinsic
rewards (Khuong and An, 2016). Entrepreneurship can also be interpreted as an individual way
of managing any opportunity with regard to resources currently owned or controlled (Bula,
2012).
The entrepreneurial process involves more than just solving a problem in a management
position. The entrepreneurship process has several stages, namely (Leach and Melicher, 2015:
5): formulating ideas for opening new businesses, gathering resources, and managing and
running a business.
Entrepreneur Learning
Entrepreneur learning can be interpreted as a process of acquiring new knowledge from direct
experience or from observing directly the behavior and actions of others applied to open new
business (London, 2011: 392). In entrepreneurial learning will be trained skills, abilities, and
attitudes to be creative and courageous and to be able to recognize opportunities, act
independently, and also develop the ability to work together (Axelsson, et al, 2015).

The Fourth International Conference on Entrepreneurship | Book Three
41
Students in this process start thinking how to run business creation. Students also experience
personal development processes and connections with their individual needs to achieve personal
satisfaction with what they will do (Mueller & Anderson, 2014)
Subjective Norm
According to Fishbein and Ajzen in Anggelina and Japarianto (2014) explains subjective norms
or subjective norms are individual perceptions related to whether the important person thinks
that behavior should be done. The subjective norm is also interpreted as a social influence, ie the
perception of a person indicating that most people are important to think about should or should
not do the behavior in question (Yau & Ho, 2015).
Meanwhile, according to Huda et al. (2012) subjective norm is a person's perception or
assumption about the expectations of others from certain behaviors that one will or will not
perform. Because, this perception is very subjective naturally, this dimension is called
subjective norm. The same attitude toward behavior, subjective norms is also influenced by
belief. Saeroji et al. (2015) explains that subjective norms are a person's perception of social
pressures to perform or not to engage in behavior. According to Marhaini in Saeroji et al. (2015)
states that in this theory the behavior of a person depends on the intention, then the intention in
behaving depends on the attitude (attitude) and subjective norms. On the other hand, beliefs
about behavior and evaluation will determine behavior. Normative beliefs and motivations to
follow the opinions of others will determine subjective norms. Therefore, the theory of
subjective attitudes and norms is also called the theory of reasoned action.
The subjective norms are the social influences that influence a person to behave. A person will
have a desire for an object or behavior if the individual is affected by the people around him to
do it or the individual believes that the environment or the people around him support what he
does Saeroji et al. (2015).
According to Ajzen in Anggelina and Japarianto (2014), the subjective norm is the extent to
which a person has the motivation to follow the person's view of the normative belief. If the
individual feels it is his personal right to decide what he or she is going to do, not determined by
others around him, then that person will ignore people's view of his behavior. Fishbein and
Ajzen in Anggelina and Japarianto (2014) use the term motivation to comply to describe this
phenomenon, namely whether the individual obeys the views of others who have influence in
his life or not.
Entrepreneurship Attitude
Entrepreneurship attitude is a feeling or selection in becoming an Entrepreneur.
Entrepreneurship attitude is something that is based on the beliefs and beliefs of the
entrepreneur in the business that is being worked on (Susetyo and Lestari, 2014). The formation
of entrepreneurial attitude can be seen in everyday life. A person who decides to become an
entrepreneur can be called an entrepreneur. An entrepreneur is someone who develops new
products or new ideas and builds a business with a new concept. An entrepreneurial attitude of
an individual can be seen from how one's appreciation of entrepreneurship up to the individual's
willingness to act and change attitudes in accordance with the characteristics of
entrepreneurship (Nurbudiyani, 2013).. Individuals who are entrepreneurial will have the beliefs,
feelings and tendencies to behave entrepreneurs or establish business independently. The
presence or absence of an entrepreneurship spirit in a person is something that is very important
in encouraging someone to become Entrepreneur because it is the boundary of an individual
attitude in starting to become an entrepreneur. Entrepreneurs' attitudes can be measured using
several indicators, namely (Susita, 2013): self-confidence, task-oriented, risk-taking, leadership

The Fourth International Conference on Entrepreneurship | Book Three
42
traits, pioneering, and exemplary, shown by an attitude that always wants to be different, and
originality.
Entrepreneur Readability
Generally the stronger the readability, the more likely someone is to perform certain behaviors.
Readability in entrepreneurship is closely related to entrepreneurial behavior. Interest is a direct
predictor of Koe et al. (2012). Can also be interpreted readability in entrepreneurship as a level
of cognitive awareness that leads individuals to establish a new business. Readabilities are
situations of thought that involve individual concentration, experience and behavior toward a
particular purpose or behavior. In the entrepreneurial study, readability is usually related to
building new business Mat et al. (2015).
RESEARCH METHODS
Population and Sample
The population according to Ferdinand (2002: 223) are all units from which the sample is
selected. The population may be an organism, person or group of persons, communities,
organizations, objects, objects or events. In this study the population is an even semester student
of Faculty of Economics, consisting of regular class and extension class with a total of 2591
students and each department with the number of students as being scattered: management =
950 students, accounting = 562 students, and banking = 989 students and the sample used is 187
students.
Test Validity and Reliability
Test validity by Waluyo (2011: 16) validity test is the essence and truth of a study. A statement
item is said to be valid if it is able to measure what is desired and can reveal data from the
variables that will be accurately precisely. The vailidity test was performed with SPSS 16.0 to
measure the validity performed by using Pearson Correlation. If the sig value is less than 0.05
then it is declared valid. Data obtained from the research quizoner must be tested first
instrumentation. Testing of research instrument used in this research is test of validity and
reliability test. Validity test is used to measure whether the instrument or indicator used in the
study is valid or not. Valid means the instrument can be used to measure what should be
measured. An instrument or indicator can be said to be valid if pearson product moment has a
significant value smaller than alpha 0.05 (Ghozali, 2002). Reliability test according to Ridwan
and Sunarto (2013) reliability is a tool to measure a questionnaire which is an indicator of a
variable. A questionnaire is said to be reliable or reliable if the answer to the question is
consistent or stable over time. The measurement scale is said to have good reliability if it has a
value of cronbach alpha > 0.6.
Model of Structural Equations
The model used to analyze the data in this study is Structural Equation Modeling (SEM) using
AMOS software. Its software is used because in the conceptual model there are latent variables
and indicators, and to know how big influence of each latent variable and covariance based.

The Fourth International Conference on Entrepreneurship | Book Three
43
RESULT AND DISCUSSION
Here is a model image after modification
Figure 1. One Step Approach Modification Model of Causality Measurement
Table 1. Evaluation of Goodness of Fit Indices Criteria after Modification
Criteria Result Cut-off Value Evaluation
Chi-square (χ2) 200,024 < X2 (172;0,001=235,05) Good
Probability 0,071 ≥ 0,05 Good
CMIN/DF 1,163 ≤ 2,00 Good
RMSEA 0,030 ≤ 0.08 Good
GFI 0,911 ≥ 0,90 Good
AGFI 0,881 ≥ 0,90 Marginal Fit
TLI 0,982 ≥ 0,90 Good
CFI 0,985 ≥ 0,90 Good
Source: Results Data Processing
Effect of Entrepreneurial Learning on Subjective Norm
Entrepreneurial learning has a significant and positive influence on subjective norms because it
has a positive estimate standard value with a significance value of less than 0, 05. The existence

The Fourth International Conference on Entrepreneurship | Book Three
44
of this significant and positive influence means that the increase of entrepreneurial learning will
be able to increase subjective norms on UNPAZ students of the Faculty of Economics.
This is also supported by research conducted by Gerba (2012) which states that students who
follow entrepreneurial learning or who have entrepreneurial learning tend to have
entrepreneurial interest and have a good perception of things about entrepreneurship.
Effect of Entrepreneurial Learning on Attitude to Entrepreneur.
Entrepreneurial learning has a significant and positive influence on attitude to entrepreneurs
because it has a positive estimate standard value with a significance value of less than 0.05. The
existence of this significant and positive influence means that the increased entrepreneurial
learning will be able to improve attitude to entrepreneurs in UNPAZ students of the Faculty of
Economics. Susetyo and Lestari (2014) which concluded that there is a significant influence
between entrepreneurship knowledge variables on entrepreneurship attitudes
Effect of Entrepreneurial Learning on Intention Entrepreneurs
Entrepreneurial learning has a significant and positive influence on intention entrepreneurs
because it has a positive estimate standard value with a significance value of less than 0.05. The
existence of this significant and positive influence means that the increase of entrepreneurial
learning will be able to increase the intention of entrepreneur in UNPAZ student of Faculty of
Economics. This is supported by research conducted by Hussain and Norashidah (2015) which
suggests a significant influence of entrepreneurial learning on entrepreneurial interest.
Influence of Subjective Norm to Intention Entrepreneur.
Subjective norms have a significant and positive influence on intention entrepreneurs
because they have a positive estimate standard value with a significance value of less than 0.05.
The existence of this significant and positive influence means that the increasing of subjective
norm will be able to increase intention of entrepreneur at UNPAZ student of Faculty of
Economics. Huda et al. (2012) the subjective norm is a person's perception or assumption about
the expectations of others of a particular behavior that one will or will not perform. Meanwhile,
Saeroji et al. (2015) explains that subjective norms are a person's perception of social pressure
to perform or not to engage in behavior.
Influence of Attitude to Entrepreneur to Intention Entrepreneur
Attitude to entrepreneur has a significant and positive influence on intention entrepreneurs
because it has a positive estimate standard value with a significance value of less than 0.05. The
existence of this significant and positive influence means that the increased attitude to
entrepreneur will be able to increase intention of entrepreneur in UNPAZ student of Faculty of
Economics. The results of this study also supported by research conducted by Susetyo and
Lestari (2014) states that there is a significant influence relationship on entrepreneurship attitude
towards entrepreneurship readability.
CONCLUSION AND SUGGESTION
1. Entrepreneurial learning has a significant and positive influence on subjective norms. It is
proved that UNPAZ students of Faculty of Economics who follow entrepreneurial learning
or who have entrepreneurial learning tend to have interest in entrepreneurship and have good
perception about matter of entrepreneurship.
2. Entrepreneurial Learning has a significant and positive influence on Attitude to Entrepreneur
It is proved that students who have followed the learning of entrepreneurship will have
entrepreneurial knowledge and start thinking how to run and create business,
Entrepreneurship attitude to entrepreneur them.

The Fourth International Conference on Entrepreneurship | Book Three
45
3. Entrepreneurial Learning has a significant and positive influence on intention entrepreneur.
This is evidenced by students of UNPAZ Faculty of Economics who have followed the
learning of entrepreneurship will have knowledge and entrepreneurship skills that encourage
student interest to become entrepreneur.
4. Subjective Norm has a significant and positive influence on intention entrepreneur. This can
be proven in the UNPAZ students of the Faculty of Economics who have a subjective norm
regarding entrepreneur will bring the intention to behave entrepreneur.
5. Attitude to Entrepreneur has a significant and positive influence on intention entrepreneur.
This can be proven in UNPAZ students of Faculty of Economics who have entrepreneurial
attitude have confidence, interest and tendency to behave entrepreneur or establish business
independently.
Suggestion
1. The results of this study can be used as reference material for students to conduct
assessments and considerations in increasing their interest in entrepreneurship through
entrepreneurial learning, subjective norm, and attitude to entrepreneur.
2. For further research using the same theme is expected to add or use new variables other than
those in this study. So that the results obtained can be mutually support and strengthen.
REFERENCES
Anggelina, J., & Japarianto, E. (2014). Analisis Pengaruh Sikap, Subjective Norm dan
Perceived Behavioral Control Terhadap Purchase Intention Pelanggan SOGO Department
Store di Tunjungan Plaza Surabaya. Jurnal Strategi Pemasaran, Vol. 2, No. 1, 1-7.
Axelsson, Karin., Hagglund, Sara., Sandberg. (2015). Entrepreneurial Learning in Education
Preschool as a Take-Off for the Entrepreneurial Self. Journal of Education and Training.
Vol. 02, No. 02, 2015, pp. 40 – 58.
Ajzen, I & Fisbeinn, M. (1980). Theory of Reseuned Action. Understandiing attitudes and
perdecting social Behavior Englewood Clifts, NJ, prentice –Hall. Vol. 01,No.1, 15.
Boukamcha, Faycal. (2015). Impact of Training on Entrepreneurial Intention: An Interactive
Cognitive Perspective. European Business Review. Vol. 27, Issue 6, pp. 583-616.
Bula, Hannah Orwa. (2012). Evolution and Theories of Entrepreneurship: A Critical Review on
the Kenyan Perspective. International Journal of Business and Commerce. Vol. 01, No.
01, pp.81-96.
Dahalan, Norziani., et al. (2015). Attitude and Entrepreneurial Intention Among Rural
Community: The Mediating Role of Entrepreneurial Opportunity Recognition. Published
EDP Science (2015).
Ferdinan, A. (2002). Struktural Equation modeling Dalam Penelitian Manajemen. Edisi kedua.
Semarang: Badan Penerbit Undip.
Gerba, D. T. (2012). Impact Of Entrepreneurship Education On Entrepreneurial Intentions Of
Business And Engineering Students In Ethiopia. African Journal of Economic and
Management Studies, Vol. 3, No. 2, 258-277.
Ghozali, I. (2011). Structural Equation Modeling, Metode Alternatif dengan Partial Least
Square (PLS). Semarang: Badan Penerbit - Undip.
Huda, N., Rini, N., Mardoni, Y., & Putra, P. (2012). The Analysis of Attitudes, Subjective
Norms, and Behavioral Control on Muzakki’s Intention to Pay Zakah. International
Journal of Business and Social Science, Vol. 3, No. 22.
Hussain, A. & Norashidha. (2015). Impact of Entrepreneurial Education on Entrepreneurial
Intentions of Pakistani Students. Journal of Entrepreneurship and Business Innovation,
Vol. 2, No. 1.
The Fourth International Conference on Entrepreneurship | Book Three
46
Khuong, Mai Ngoc., An, Nguyen Huu. (2015). The Factors Affecting Entrepreneurial Intention
of the Students of Vietnam National University: A Mediation Analysis of Perception
Toward Entrepreneurship. Journal of Economics, Business and Management, Vol. 4, No.
2, February 2015.
Koe, Wei-Loon., et al. (2012). Determinants of Entrepreneurial Intention Among Millennial
Generation. Social and Behavioral Sciences, 40 (2012), pp.197-208.
Kusmintarti, et al. (2014). The Relationships among Entrepreneurial Characteristics,
Entrepreneurial Attitude, and Entrepreneurial Intention. Journal of Business and
Management, Volume 16, Issue 6. I (Jun. 2014), pp. 25-32.
Leach, Chris J., Melicher, Ronald W. (2015). Entrepreneurial Finance. USA: Cengage
Learning.
London, Manuel. (2011). The Oxford Handbook of Lifelong Learning. Oxford: Oxford
University Press.
Mat, Salwah Che., Maat, Siti Mistima., Mohd, Norhatta. (2015). Identifying Factors that
Affecting the Entrepreneurial Intention among Engineering Technology Students. Social
and Behavioral Sciences, 211 (2015) 1016 – 1022.
Muller, Sabine., Anderson, Alistair R. (2014). Understanding the entrepreneurial learning
process and its impact on students' personal development: A European perspective. The
International Journal of Management Education. 12 (2014) 500-511
Nurbudiyani, Iin. (2011). Model Pembelajaran Kewirausahaan dengan Media Koperasi Sekolah
di SMK Kelompok Bisnis dan Manajemen. Jurnal Pendidikan Vokasi. Vol. 3, No. 1,
Februari 2013. pp.53-67.
Sadeli. (2011). Model Penciptaan Wirausaha Mandiri. Jurnal Administrasi Bisnis. Vol. 8, No.2,
Januari 2011, pp.1-13.
Saeroji, A., Maskur, A., & Tjahjaningsih, E. (2015). Pengaruh Norma Subjektif Dan Kontrol
Perilaku Yang Dipersepsikan Terhadap Niat Pinjam KUR Mikro (Studi Pada Nasabah
BRI Di Pati). Prosiding Seminar Nasional Multi Disiplin Ilmu & Call For Papers
Unisbank.
Singh, S.K., Gupta, Sanjay. (2015). Entrepreneurship: With Practice. New Delhi: SBPD
Publications.
Siswadi, Yudi. (2013). Analisis Faktor Internal, Faktor Eksternal Dan Pembelajaran
Kewirausahaan Yang Mempengaruhi Minat Mahasiswa Dalam Berwirausaha. Jurnal
Manajemen dan Bisnis. Vol. 13, No. 01 April 2013.
Susetyo, D., & Lestari, P. S. (2014). Developing Entrepreneurial Intention Model of University
Students (An Empirical Study on University Students in Semarang, Indonesia).
International Journal of Engineering and Management Sciences, 184-196.
Susita, Dewi. (2013). Pengaruh Sikap Kewirausahaan, Kepribadian, Kepuasan Kerja, dan
Komitmen Terhadap Efektivitas Kerja Karyawan Kementrian Perindustrian. Makalah
disajikan dalam 2nd International Seminar On Quality and Affordable Education (ISQAE
2013), pp.399-405.
Soegoto, Eddy Soeryanto. (2011). Entrepreneurshi: Menjadi Pebisnis Ulung. Jakarta: Elex
Media Komputindo.
UCA News (2014). Bom waktu pengangguran di Timor Leste. Diakses dari
http://indonesia.ucanews.com/2014/05/14/bom-waktu-pengangguran-di-timor-leste/
Viva.co.id. (2015). 9 Negara dengan Jumlah Pengusaha Terbanyak. Diakses dari
http://bisnis.news.viva.co.id/news/read/642682-9-negara-dengan-jumlah-pengusaha-
terbanyak.
Waluyo, M. (2011). Panduan dan Aplikasi Struktural Equation Modelling (SEM). Jakarta: Alex.
Yau, H. K., & Ho, T. C. (2015). The Influence of Subjective Norm on Behavioral
Intention In Using E-Learning: An Empirical Study in Hong Kong Higher

The Fourth International Conference on Entrepreneurship | Book Three
47
Education. Proceedings of the International MultiConference of Engineers and
Computer Scientists, Vol. II, 18-20.

The Fourth International Conference on Entrepreneurship | Book Three
48
FINANCIAL STATEMENT CONTROL IN THE WEALTH
MANAGEMENT FOR INDIVIDUAL COMPANY
1Asy'ari
STIE Mahardhika Surabaya
INDONESIA
Email: [email protected]
ABSTRACT
This study aims to determine the cause of the deterioration of the
individual companies. This research is a qualitative approach. The
object of this study is a located in Sumenep, East Java. Data
collection method used is to study literature related to the theories of
financial statements Accounting, control and wealth management.
The results of this study indicate that the company is bankrupt
because of being influenced by the lack of control over the
company's finances.
Keywords: Controlling, Financial Statement, Wealth Management,
Individual Company
INTRODUCTION
Business world make a decision based on the calculation of profit and loss(Purwati&
Prawinegoro2013).One of such toolsto make a decision is accounting, whereby the information
that presented in the form of qualitative and figures are real pictures of the business activities
from time to time.
A manager needs information at any time to make decisions. Accounting information in the
business world is an important subject for management decisions. Therefore Ari Purwati and
Darsosono Prawinegoro (2013) suggested that all lavel managers must know and understand the
accounting information and are able to use in decision-making, both in the business and non-
business organizations. Here, manager will be the one to control, view and filter all of the
elements that are likely to make a business organization will suffer a setback.
Various functions of the financial statements of one of them to see how big turnover of assets to
cover debtsthat could be detrimental if the turnover pattern is not significant in certain quarters
(James O. Gill in Kashmir, 2015: 140)
The financial report is very important because the financial statement allows to predict how the
continuity of a company in the future. The financial statements also is a source for a manager to
draw conclusions about what to be taken to map or developed and even to save an agency or
company that he leads.
Without controlling the financial statements correctly, a company will have various problems
and even adownturn. it has been experienced by the individual company in Sumenep, East Java,
which was engaged in the trade field and grew very rapidly in the 2000s. Even this business that
located in front of these traditional markets was considered big and got many customers and
demands. However, after more ten years of running, in the year of 2014 the company declared a
bankruptcy.
There is a stigma that states that individual businesses are often not professional, can not
separate the interests of the family and business interests and has insufficient control system.

The Fourth International Conference on Entrepreneurship | Book Three
49
But the existence of the business always shows a pretty good development. This can be due to
most of such companies always prioritizethe importance to relations within the family in the
company. While in the term to choose to run their business, they are more flexible than the
professionals-implemented control system.
The main objective of this research is to discover the wealth management control of the
financial statements that sometimes the manager is wrong to describe the financial statements
for decision making. However, the specific purpose of this study is to determine the role of
financial control for individual companies, how the practice of wealth management in individual
companies and how the role of financial control within an individual company's efforts in
managing wealth.
LITERATURE REVIEW
Control Financial Statements
Controlis the final part of the management process (Kenneth A. & Wim A.: 2012). The use the
term management control has the same meaning as the terms of execution and implementation
of the strategy. Similarly, in terms of achieving the goals we want, a company requires a control
system. According to (V. Wiratna Sujarweni, 2016: 95), control is a process to ensure that
activities lead to the desired goal. Hilmia Nora (2010) in S. Mia Lasmayana et.al (2013) stated
that the main focus in the financial control is an initiative that selected to change the
possibilities and achieve the expected results.
According to Mulyadi (2010) internal control system is an organizational structure, methods and
coordinated measures to safeguard the wealth of the organization, check the accuracy and
reliability of accounting data, promote the efficiency and encourage adherence to management
policies.
Internal control system shall be composed of some basic elements as follows (Mulyadi, 2010)
1. The organizational structure that separates the functional responsibility firmly.
2. System of authorization and record keeping procedures that provide adequate protection
against wealth, debt, income and expenses.
3. Healthy practice in carrying out the duties and functions of each organizational unit.
Financial Statements
According to Lasmi (2016: 56) Financial Report is a report of organization's financial
information published by the company on the results of the accounting process as a means of
communicating financial information to external parties. Therefore, the financial statements for
an Investor (external parties) will be needed in terms of both accuracy and validity to see the
company's performance during a particular quarter. This relates to the control and prediction of
an investor to determine whether it is still worth mentioning that the company is ‘healthy’ or
not, and whether the company can still compete.
Medium according toKashmir (2015) the financial report is a report that shows the current
condition of the company. Current company conditions means the company's financial
condition at a particular date (for balance) and a certain period (for the income
statement).Warren & Fees in Lasmi (2016) defined financial report as a transaction which is
recorded and summarized for users of accounting reports that generate information called
financial statements.
Meanwhile, according to Statement of Financial Accounting Standards (SFAS) No.. 1,
"Financial statements are a structured representation of the financial position and financial
performance of an entity (IAI, 2009: 1-5). Farid & Siswanto (2011:21) said that the financial
statements are expected to provide information that help users to make economic decisions that
is financiallypurpose financial statements

The Fourth International Conference on Entrepreneurship | Book Three
50
As already known that the financial statements are made certainly have a specific purpose. In
practice, there are several objectives to be achieved, especially for business owners and
management companies. In addition, financial reporting purposes are prepared to meet the
interests of the various parties interested in the company. Kashmir (2015) stated that the
financial statements details, capable of providing financial information to parties in and outside
the company who have an interest in the company.
According to Lasmi (2016) the Purpose Financial Report are:
Useful information for investment decisions and credit
Useful information in assessing the future cash flows
Information about the company's resources, claims to resources, and change.
To meet the needs of users of financial statements
To compare performance between entities so that uniformity in the presentation may
facilitate users to read and analyze.
The purpose of financial statements in accordance with IAS 1 is to provide information
regarding the financial position, financial performance and cash flows of the entity that will
benefit the majority of the users report in making decisions (Dwi Martini .et .al: 2016)
The financial report contains financial information is essentially information qualitative
(Dwi Martini .et .al: 2016). In order for such information is useful to users of such information
must satisfy the qualitative characteristics. With the qualitative characteristics, qualitative
information in the financial statements can memenihi needs of the user.
Users and financial reporting purposes of investors, potential investors, lenders,
employees, suppliers, other creditors, customers, governments, institutions and the public. The
user uses financial statements to meet the needs of different information.
Wealth Management
Wealth Management started being popular in recent years. Wealth management services to
appear early in 2000, when foreign banks operating in Indonesia offer wealth management
services. Widiastuti (2009) in Sina (2015) explained that the real financial wealth management
is a science older than risk management. Triggers initiated by private wealth management
banker at the beginning of the establishment of an international financial center in the 17th and
18th Wealth management is an ongoing investment of an expert which includes planning the
financial statements and financial services. Financial planning as a plan to manage the revenue
plus lifestyle.
Sole Proprietorship
By definition, the meaning of individual vendor is a company owned by one individual
(Sukirno, et.al, 2014: 34). But the field, practice these enterprises are often the family company,
a company that uses whole or in part members of the family to run it. Although some individual
holdings are large and have a lot of employees, but many are small and businesses owned
(usually operated) by one man (Pride et.al, 2014).
While Rudianto (2012) defined Sole Proprietorship is a company owned by an individual, where
the owner invests in the enterprise and take full responsibility for the company's operations. All
assets and liabilities of the company are often difficult to be distinguished to the assets and
liabilities of the owner.
RESEARCH METHODS
The method used in this research is qualitative research methods that the research methods used
for research on the condition of the object is natural (Sugiyono: 2015). For Finding an
alternative model of controlling financial statements for the management of wealth, then the
element must be found in accordance with the formulation of the problem, objectives and
menfaat research, we used qualitative descriptive method with a model library research.

The Fourth International Conference on Entrepreneurship | Book Three
51
In this case, the author obtained data by studying literature related to the theoretical basis of
accounting financial statements, control and wealth management, as well as matters other
matters relating to the issues to be discussed as a basis for the preparation of this manuscript.
RESULTS AND DISCUSSION
UD.X is a company engaged in the trade, especially groceries and snacks. UD.X Based in
Sumenep Madura, East Java. This effort has established and operated in the early 2000s. Every
day it operates from 07.00 am until completion.
In terms of the location and layout, UD.X has a very strategic place. In addition to a place which
is the main road south of the island of Madura lines, the company is also situated in front of a
traditional market that opens every Wednesday. The company also serves the retail and
wholesale purchase. When viewed in terms of the place and the density of people who buy both
wholesale and retail enterprise hard common sense to decline or even closed (bankruptcy).
UD.X is one of the companies that existed in 2000's and developed rapidly. However, in 2014,
companies that operate in the field of trade groceries declared bankrupt. In this case, the decline
of the company were not because ofbeing disrupted by the business competitors but because the
company can not develop supervision in financial matters and unable to control and manage
your finances well.
According to some sources the company is starting to find its decline when the owner can not
separate personal, family and business interests. This implies a profound effect on his business
finances marked by the least amount of supplies of goods per weekend because of dwindling
finances.
Related to the above cases, this allows the weak control of the company in the financial sector
where it is company-oriented family interests and personal interests without seeing the bad side.
While UD.Y is a company engaged in the trade of birds equipment and supplies, both in terms
of brackets, feeding and bird species as well. The company also is in the district Sumenep,
Madura, East Java.In addition to a shop, the owner also has a bird nest, as an asset. The
beginning of the journey of this company, swallow it has very smoothly and promising. There is
no indication that it will relocate swallow. So the current owners often buy other assets by
borrowing funds from the bank, and the owners thought as seeds at harvest as well swallow as
the collateral.
The cause of this company decline was the migration of swallows out of the nest. While
dependent on the bank to be paid progressively growing. It was never expected that he might be
able to miss the predictions. The number of loans made by UD.Y increasingly choked to pay off
her credit. And right at that moment proceeds from the sale of store equipment and supplies
birds can not cover the amount of loan that should be paid to the bank due to a similar company
that sells merchandise far below the price of the company.
Paradigm of the author in an enterprise organization, either acompany profit-oriented or non-
profit-oriented supervisory control especially in the financial statements has to be carried out or
a feeling of responsibility and a high integrity to create leadership model that fits that could
overshadow his staffs in his company development and able to form a coalition in the business.
Money management
In individual companies (sole proprietorship) is indeed the owner has the ultimate responsibility
and not limited to all obligations of the company. Because a proprietorship company tends to do
an activity in person, as an individual Vendor is a company owned by one individual only. Here
the owners sometimes difficult to distinguish between personal and corporate money as
experienced in UD.X case where the lack of rigor on the separation between private and
corporate money. Moreover, in this case UD.X never make record of financial accounting, there
is never a financial statement because they assume that the owner of the company did not need
it. He did not know that financial records are necessary to see how good a company's future

The Fourth International Conference on Entrepreneurship | Book Three
52
prospects. Moreover, in terms of finance as a whole there is no separation between personal and
corporate money that it is very important given the cash is the most liquid asset (Rudianto,
2012)
It can be concluded that UD.X here had lack of good company in terms of financial
management even in management wealth, due to financial planning as a plan to manage the
income and lifestyle was not quite right. Because the cause of its decline in this case is the lack
of supervision and control of wealth (asset). One problem that is often overlooked by businesses
is on financial management (Hutagaol, 2012).When judging in terms of lifestyle. The company
owner is very glamorous in social life. They did not realize that sometimes lifestyle that exceeds
the maximum limit will be dropped on to thebankruptcy.
Financial Supervisory
From several sources obtained by the authors that UD.X has a very generous leader, in terms of
the family he never bothered to family happiness was the staffs. In this case (Sukirno, 2014)
confirmed that the financial oversight relating to the protection of wealth must be no assurance
of the accuracy of the financial statements and bookkeeping. This means that any money comes
in and issued either for personal collection or related to the company should remain in control
and recorded clearly in accounting. The goal is to anticipate recording errors or worse to a
deterioration of the company as experienced UD.X the last few years. The impact of ignoring
financial supervision may not be seen clearly, but without an effective accounting method, the
business prospects of success may be bankruptcy. Accounting is the key indicator of the
business as the information provided by the accounting records are useful for decision-making
so as to improve the management and oversight of the company's finances.
Until now many businessmen ignore and do not realize the importance of recording financial
accounting. The businessmen thingthe financial statements is less important. It is considered as
fine situation when no accounting records executed, because of their knowledge of accounting
and the importance of a financial statement for the company are not sufficient, as experienced in
UD.X.
Debt
Debt is the obligation of the company incurred due to the purchase in the form of credit
(Kashmir, 2015). This means that companies purchase the goods with which payment is made in
the future. In this case the financial planning needed to buy goods on credit. Things like that
happened is feared that the business UD.Y insolvent. Many assets purchased and must be sold
to pay off debts. What remains now is to sell the shop occupied a bird equipment and even then
will be sold to cover the remaining debt.
Market Competition
In the competitive business world has become commonplace, which sometimes competing is a
necessity. In the business world and the law of the jungle applies where that is not capable of
being the ruler and survive then he will fall down as it is stated in the theory of disruption where
innovation becomes the most important factor in business, who does not change or innovate it
will die (Kasali, 2017).
Like what happened UD.Y he dazzled at existing businesses and satified because the company's
business runs normally and looks forward to the famous the expensive and rarely owned bird
nests. So when companies are struggling and running the same business with different models,
he cannot do anything. A competition in the market this modern era rules that whoever can not
afford to innovate they will be buried, erased from the business. UD.Y can not compete with his
competitors who issued the new product (what he himself sold was less updated).
Somehow, the control on financial report cannot be avoided because many entrepreneurs still do
not understand what the importance of financial report is and sometimes, in reality, many
businesses run without proper financial report still exist. Nevertheles, the control of business
components in all elements should be done well for better goals.

The Fourth International Conference on Entrepreneurship | Book Three
53
CONCLUSION
In individual company (sole proprietorship), supervision or financial control is needed to see
the company's performance and prospects for the future. The need for financial planning and
lifestyle are subjective to anticipate waste.Lack of understanding to manage money is also an
issue in the enterprise cause the company's bankruptcy. The absence of accounting records of
the financial statements is also one significant problem.In terms of asset management, the
company purchased to many assets on credit assets that are not controlled by reserving the right
things will lead the company's obligation to pay a very high liability.Lastly, the competition is
also a cause of the decline of the company because the company was unable to innovate and
look at the model of the future market. However, the financial report control in proprietorship is
very important to minimize the possibilities in failure and bankruptcy.
REFERENCES
Farid &Siswanto. (2011). Analisa Laporan Keuangan. Bandung : Alfabeta.
Hutagaol, Renaldo M. N. (2012). Penerapan Akuntansi Pada Usaha Kecil Menengah. Jurnal
Ilmiah Mahasiswa Akuntansi. Vol.1 No.2 Maret 2012
Ikatan Akuntan Indonesia (IAI). (2009). Pernyataan Standar Akuntansi Keuangan (Revisi
2009). Jakarta : Salemba Empat.
Kasali, Rhenald. (2017). Disruption. Jakarta : Gramedia Pustaka Utama
Kasmir. (2015). Analisa Laporan Keuangan. Jakarta : PT RajaGrafindo Persada
Lasmayana, S. Mia et.al. (2013) Pengaruh Pengendalian Keuangan Terhadap Penggunaan
Anggaran Pada keuanagn Pusat II Direktorat Keuangan Angkata Darat. Jurnal Ekonomi,
Bisnis & Entrepreneurship. Vol.7 No.2 Oktober 2013
Lasmi, Mia Wardiyah. (2016). Akuntansi Keuangan Menengah. Bandung : Pustaka Setia.
Martini, Dwi et.al. (2012). Akuntansi Keuangan Menengah (Berbasis PSAK). Jakarta : Salemba
Empat.
Merchant, A. Kenneth et.al. (2012). Sistem Pengendalian Manajemen. Jakarta : Salemba Empat.
Mulyadi. (2010). Sistem Akuntansi. Jakarta : Salemba Empat.
Pride, William M. et,al. (2014). Pengantar Bisnis. Jakarta : Salemba Empat
Purwati, Ari dan Darsono Prawinegoro. (2013). Akuntansi Manajemen. Jakarta : Mitra Wacana
Media.
Rudianto. (2012). Pengantar Akuntansi (Konsep dan teknik menyusun laporan keuangan).
Jakarta : Erlangga
Sina, Peter Garlans. (2015). Wealth Management Untuk Pensiunan yang Sejahtera.Jurnal
Economia. Vol.11 No.2 Oktober 2015
Sugiyono. (2015). Metode Penelitian Kualitatif. Bandung : Alfabeta
Sukirno, Sadono et.al. (2014). Pengantar Bisnis. Jakarta : Kencana
Wiratna, V. Sujarweni. (2016). Akuntansi Manajemen. Yogyakarta : Pustaka Baru Press.

The Fourth International Conference on Entrepreneurship | Book Three
54
SOCIAL NETWORK INFLUENCE TO SUBJECTIVE NORMS IN
KNOWLEDGE SHARING
Wulandari Harjanti1
STIE Mahardhika, Surabaya
INDONESIA
Emails: [email protected]
ABSTRACT
This quantitative research aimed to examine the social network influence
to subjective norms in knowledge sharing in order to support the SMEs in
Situbondo, East Java Province Indonesia in increasing the technology
factor which influences the behavior of knowledge sharing and designs
knowledge management system. Sosial network significantly and
positively influenced the knowledge sharing. It shows when the social
networking is increasing the employees will feel positive feeling to share
the knowledge. The social network influences significantly and positively
to the subjective norms in knowledge sharing. It is where the employees
who have social network will extensively experience bigger social
presure in sharing knowledge.
Keyword: social network, subjective norms, knowledge sharing
INTRODUCTION "Knowledge" is a key component for companies to create such competitive advantage
(Davenport and Prusak, 2000). Thus, Knowledge Management has become a very important
thing for all companies (Chang et al., 2012). Companies that focus on the management and
utilize it have a greater chance of building a competitive advantage than their competitors (Gray,
2001). The fundamental element of knowledge management is Knowledge Sharing which is
considered very important in an organization.
One of the factors contributing to Knowledge Sharing is social capital, which is based on the
willingness of employees to share and social pressure from the organization. Social capital takes
place in the relationship between a person and another person. It is used to describe a wide
range of pro-social behaviors, such as collective action and community involvement. Coleman
(1988), in Chow and Chan (2008), stated that it helps in encouraging action between individuals
or corporations.
Social capital is divided into three main classifications, namely structural, relational, and
cognitive (Granovetter (1992), in Munson et al. (2008)). The structural dimension involves
social relationships and networks that define who can be reached and how to reach them and the
factors in this dimension are related to the pattern of relationships, attachments, connections
between members, and the degree of structure in relationships that occur. The relational
dimension describes the level of trust developed during interactions, norms, obligations, beliefs
and identifications that increase the awareness of their collective goals. The cognitive dimension
refers to enhanced resources in understanding between one party and another. Wasko and Faraj
(2005) stated that sharing knowledge requires understanding, which is related to common
culture and common goals as an important factor. In this case the structural and cognitive
dimensions are the two main things applied in this study.

The Fourth International Conference on Entrepreneurship | Book Three
55
In a sustainable interaction situation such as sharing knowledge within the organization,
appropriate feedback is critical. When others respond in an anticipated way, the individual
concludes that his thoughts and behaviors are correct, at the same time the similar roles are
being in progresses as the exchange of knowledge continues according to role theory, which is
the basis of a symbolic interactionist perspective on the formation of self- Concept) (Bock et al.,
2005). This reflective appraisal process contributes to the formation of self-worth, which is
strongly influenced by the feeling of competence and closely related to effective performance.
Therefore, employees who got feedback on knowledge sharing actions in the past tend to have
better understanding on how these actions have contributed to the work of others and/or
improve organizational performance. Such an understanding will enhance her sense of worth.
Therefore, as a reciprocity will make employees tend to develop supportive behavior in sharing
knowledge compared to employees who can not see the linkage. The greater the self-worth
through knowledge sharing, the attitude to sharing knowledge will be more supportive.
Reference group norms become the standard for individuals to judge themselves. Individuals
who feel a high sense of worth in sharing knowledge tend to be aware of the demands of other
members related to knowledge-sharing behavior and adhere to these demands.
A personal attitude toward a behavior is a predictor of the intention to engage in such behavior
and the intention of knowledge sharing behavior is determined by the individual's attitude
toward knowledge sharing. If the attitude of members of the organization of positive knowledge
sharing, it will be stronger intention to do knowledge sharing
Knowledge sharing behavior is also very useful to help decision making. Therefore, it is
necessary to be familiarized in the organization to form a knowledge sharing culture within.
Things related to the issues of knowledge sharing are also experienced by SMEs which are
increasing their business in Situbondo area such as improper feedback, too fast in executing
tasks, friction between hierarchy and responsibility, dependence on employee knowledge of
other parts, and imperfect monitoring , The company encountered various obstacles.
The biggest obstacle to rapid packing readiness is unavailable and the need for expert staff tends
to increase thus this study will examine how social network influences on attitudes in
knowledge sharing and how the social network influences subjective norms in knowledge
sharing.
LITERATURE REVIEW
Social Network
Social network is the structural dimension of social capital (Granovetter (1992), in Munson et al.
(2008)). The structural dimension is related to a social system and network as a whole. These
conditions illustrate the configuration of relationships between people or units. It is the overall
pattern of connections between individuals to reach and how to reach them (Burt (1992), in
Chua (2002)). One of the most important parts of this dimension is the presence or absence of
network ties between individuals, network or morphological configurations that illustrate
patterns of relationships measured by density, connectivity, and hierarchy, and the right
organization, the existence of a network, Built for one purpose that can be used by others
(Nahapiet and Ghoshal (1998), in Inkpen and Tsang (2005)).
Inkpen and Tsang (2005) also stated that the social network which is the structural dimension of
social capital involves patterns of relationships between individuals within the network, and can
be analyzed through the perspective of network ties, network configuration and network
stability Network stability). The bond in the network is related to the specific way individuals
are connected. Bonding is a fundamental aspect of social capital, because the individuals within
the network of bonds that are formed will create opportunities for social capital transactions
(Adler and Kwon, 2002). A key feature in a network is that network members are part of the
same corporation. Therefore, the bonds between members, such as interdepartemental and

The Fourth International Conference on Entrepreneurship | Book Three
56
interpersonal relationships are not very different between members. In other words, network ties
to members will be stronger (Adler and Kwon, 2002), so that individual social capital will form
the basis for organizational social capital. Through strong cooperation in performing work tasks
and problem-solving work the bonds that occur between Members of the organization will
become stronger so that is an important social capital for the organization.
Chow and Chan (2008) suggest that social networks have a significant direct influence on
subjective attitudes and norms in knowledge sharing. Therefore, management must develop
clear mission and objectives so that all members of the organization can appreciate and
contribute knowledge and therby it is critical for the HR division.
Subjective norms
Subjective norms are a measure of individual perceptions of social reactions to behavior.
People's perception of whether others will approve or reject the respective behavior. Subjective
norms consist of two components, namely normative belief and motivation to comply (Ajzen,
1991). Normative belief is an understanding of something significant. "(Corner and Armitage,
1998). Perceptions about the judgment of others are influenced by a motivation to fulfill / follow
that is influenced by the assessment. Research on compliance measures shows that peers have
an important influence on predicting behavior.
Attitudes and subjective norms are two thoughts about the use of influence or not when a person
requires an activity. In general research has shown that attitudes are a better predictor of making
an action than subjective norms (Ajzen, 2001).
Knowledge Sharing Each knowledge sharing behavior consists of bringing (knowledge donating) and getting
(knowledge collecting) (Van den Hoff and De Ridder, 2004). Knowledge donating is the
behavior of communicating intellectual capital owned by someone to others, and knowledge
collecting is individual behavior to consult with other individual about intellectual capital
owned. Both of these behaviors have different properties and can have different effects. The
same is also expressed Ardichvili et al. (2003), knowledge sharing requires two parties, namely
those who provide new knowledge and who ask for knowledge.
Effective knowledge-sharing and learning behaviors require cultural change in organizations,
new practical management, senior management commitment, and technological support.
Organizational culture should be transformed into a sharing culture and it should be handled
with strong top-level leadership, and by providing a means of knowledge management that can
make the job better. (Turban et al., 2002).
RESEARCH METHODS
Here the model was evaluated by using R-Square for dependent constructs, t test and the
significance of the structural path parameter coefficients (Ghozali, 2008: 26). The change in R-
Squares value is used to assess the influence of certain latent independent variables on latent
dependent variables whether they have substantive effects. Hypothesis testing is done by
comparing the value of t statistics with the value of t table. If the statistical t value is greater
than the value of t table (1.96), then there is a significant influence between a variable on the
other variables and vice versa if the t value of the statistic is smaller than the value of t table
(1,96), there is no significant influence .
This research has two hypothesis:
H1: Social network positively influences the attitude in knowledge sharing
H2: Social network positively influences subjective norms in knowledge sharing
RESULTS AND DISCUSSIONS
Only 37 employees from several SMEs in Situbondo were taken as respondents and divided into
several characteristics according to gender, age, last education and years of service. All
respondents or 100% were males. Major age range is between 36 years to 40 years with the

The Fourth International Conference on Entrepreneurship | Book Three
57
number of 15 people or 41%. About 20 people or 54% are high school graduates. As for the
period of employment, respondents with a working period of more than 4 years to 6 years is the
dominant respondent with the number of 12 people or 32%.
Descriptive statistics of the social network (X1) show an average value of 3.65, which indicates
the condition that the overall level of social network employees are in the high category. Shared
goals (X2) show an average value of 3.75, which indicates the overall condition that the overall
levels of the employees' share goals are in the strong category.
The social network indicator that has the lowest rating related to good relations and conducts in-
depth discussions with other members of the organization, because it has the lowest average
value of 3.62. The social network indicator that has the highest rating associated with spending
a lot of time to interact with other members of the organization, because it has the highest
average value, which is 3.70.
While the indicator of shared goals that have the lowest rating associated with the statement of
employees that “they are always enthusiastic in pursuing the goals and collective mission of the
organization as a whole”, because it has the lowest average value of 3.40. The shared indicators
that have the highest rating associated with the statement of employees “ always share the same
ambition and vision in the work”, because it has the highest average value, which is 3.75.
The results show that the value of Composite Reliability and Cronbach Alpha for each social
network variable (X1), shared goals (X2), shows the number above 0.75 so it can be stated that
the variable construct has good reliability, thus the path coefficient value (Path) social network
(X1) to the attitude of knowledge sharing is positive by 0.3678, with the value of t statistics of
2,5518> t table value of 1.96. It shows that social network (X1) has a significant positive effect
on attitudes on knowledge sharing (Z1).
While the value of path coefficient (path) shared goals (X2) on the attitude of knowledge
sharing is positive at 0.3752, with t statistics of 2.2739> t table value of 1.96. Shows that shared
goals (X2) have a significant positive effect on attitudes on knowledge sharing.
The influence of social network (X1), shared goals (X2), on attitudes towards knowledge
sharing shows the R-Square value of 0.6624, means that the variability of attitudes on
knowledge sharing (Z) can be explained by social network (X1 ) And shared goals (X2),
66.24%, while the remaining 33.76% is still explained by other non-researched variables such as
self-worth. From the above calculation The first hypothesis states that the social network has a
positive effect on attitudes on knowledge sharing. Based on analysis results show that the
coefficient path (path) is positive with a t value of statistics of 2.5518> t table value of 1.96, it
shows that Social network (X1) has a significant positive effect on attitudes on knowledge
sharing. Therefore, the first hypothesis that social networks have a positive effect on attitudes on
knowledge sharing is accepted.
The second hypothesis states that social network positively influences subjective norms in
knowledge sharing is positive with the value of t statistics of 2.4207> t table value of 1.96, it
indicates that social networks have a significant positive effect on subjective norms in
knowledge sharing Therefore, the second hypothesis that social networks have a positive
influence on subjective norms in knowledge sharing is accepted.
CONCLUSIONS
This study examines the influence of social networks, shared goals, and self-worth in
influencing subjective attitudes and norms in knowledge sharing, as well as the influence of
subjective attitudes and norms in knowledge sharing on intentions of knowledge sharing, and
the influence of intent on sharing knowledge on knowledge sharing behavior. The results show
some conclusions as follows:
1. Social networks have a significant positive influence on attitudes on knowledge sharing,
which shows that through increasing social network employees will feel a positive

The Fourth International Conference on Entrepreneurship | Book Three
58
feeling about sharing knowledge, so with the increasingly extensive social network built
among employees, the attitude of employees to share knowledge is better.
2. Social networks have a positive effect on subjective norms in knowledge sharing, where
employees with more extensive social networks will experience greater social pressures
for sharing knowledge, because of high expectations from co-workers on knowledge
sharing is also stronger.
The suggestion raised is the need for the company's efforts to increase employee's
motivation and positive beliefs on knowledge sharing behavior, by increasing the frequency of
activities that lead to the exchange of knowledge among employees, as well as enhancing
superior support to optimize the knowledge sharing culture within the company so as to realize
more effective and efficient work processes.
REFERENCES
Adler, P.S. and Kwon, S.W. (2002). Social Capital: Prospect for A New Concept. Academy of
Management Review, 27: 17-40.
Ajzen, I. (1991). The Theory of Planned Behavior. Organizational Behavior and Human
Decision Processes, 50: 179-211.
Ajzen, I. (2001). Nature and Operation of Attitudes. Annual Review Psychology, 52: 27-58.
Ardichvili, A., Page, V., and Wentling, T. (2003). Motivation and Barriers to Participation in
VirtualKnowledge-Sharing Communities of Practice. Journal of Knowledge
Management, 7(1): 64-77.
Bock, G.W. and Kim, Y.G. (2002). Breaking Myths of Rewards: An Exploratory Study of
Attitudes About Knowledge Sharing. Information Resources Management Journal,
15(2): 14-21.
Bock, G.W., Zmud, R.W., Kim, Y.G., and Lee, J.N. (2005). Behavioral Intention Formation in
Knowledge Sharing: Examining The Roles of Extrinsic Motivators, Social-
Psychological Forces, and Organizational Climate. MIS Quarterly, Vol. 29(1): 87-111.
Chang, C.W., Chan, M.L., and Tseng, C.P. (2012). Human Factors of Knowledge Sharing
Intention Among Taiwanesse Enterprises: A Model of Hypotheses. Human Factors and
Ergonomics in Manufacturing & Service Industries, 22(4): 362-371.
Conner, M. and Armitage, C.J. (1998). Extending The Theory of Planned Behavior: A Review
and Avenues for Further Research. Journal of Applied Psychology, 28: 1429-1464.
Davenport, T.H. and Prusak, L. (1998). Working Knowledge: How Organizations Manage What
They Know. Boston: Harvard Business School Press.
Granovetter, M.S. (1992). Problems of Explanation in Economic Sociology. In N. Nohria & R.
Ecles (Eds.). Networks and Organizations: Structure, Form and Action: 25-26. Boston:
Harvard Business School Press.
Gray, P.H. (2001). The Impact of Knowledge Repositories On Power and Control in The
Workplace. Information Technology & People, 14(4): 368-384.
Hogel, M., Parboteeah, K.P., and Munson, C.L. (2003). Team-Level Antecedents of
Individuals’ Knowledge Networks. Decision Sciences, 34(4):741-770.
Inkpen, A.C. and Tsang, E.W.K. (2005). Social Capital, Networks, and Knowledge Transfer.
The Academy of Management Review, Vol. 30(1): 146-165.
Turban, E., McLean, E. and Wetherbe, J. (2002). Information Technology for Management:
Transforming Business in The Digital Economic. John Wiley & Sons.
Van Den Hoof, B. and De Ridder, J.A. (2004). Knowledge Sharing in Context: The Influence of
Organizational Commitment, Communication Climate Use on Knowledge Sharing.
Journal of Knowledge Management, 8(6):117-130.
Wasko, M. M., and Faraj, S. (2005). Why Should I Share? Examining Social Capital and
Knowledge Contribution in Electronic Networks of Practice. MIS Quarterly, 29(1): 35-57.

The Fourth International Conference on Entrepreneurship | Book Three
59
BEHAVIORAL FINANCE IN DEBT DECISION MAKING
1Dwi Perwitasari Wiryaningtyas
Program Studi Manajemen Fakultas Ekonomi
Universitas Abdurachman Saleh Situbondo
Jl. PB Sudirman No. 07 Situbondo, Jawa Timur
INDONESIA
Email: [email protected]
ABSTRACK
This article explores about behavioural finance in debt decisions
making on the owners of MSMEs batok in Situbondo district of East
Java. Data collected using interview method, literature study and also
direct observation. Data analysis technique used is an interactive model
that refers to the model of qualitative data analysis techniques. The
results showed that most owners of batik MSMEs in Situbondo argue
that debt is a positive thing as a source of funding and stimulator.
Based on the results of the study found that there are three dominant
psychological factors important in debt decisions making on owners of
batik MSMEs in Situbondo, namely optimistic, availability, and illusion
of control.
Keywords: behavioral finance, decision making, debt
INTRODUCTION Micro Small Medium Enterprises (MSMEs) is a business established by individuals and groups.
MSMEs is one of the government's efforts to overcome the problem of poverty and
unemployment in Indonesia, in addition MSMEs also has a high degree of flexibility compared
to businesses that have greater capacity. Human Resources (HR) owned by MSMEs is also still
limited, it can be seen that some MSMEs are hereditary efforts of the family. So the manager in
the business is the owner of the business itself and not others
Many problems in MSMEs, there are internal and external problems. The internal problem in
MSME owners is the capital problem used for the development of their business. The lack of
capital is because MSMEs is a small business and managed by individuals, so that the capital is
very limited. As for the loan capital to the bank or other financial institutions are also still
difficult to obtain because constrained by administrative requirements that can not be met by
business owners. In addition, because of human resources that cause less development of the
business. One strategy to develop a business is to meruput the competent human resources in the
field.
Internal problem by other MSMEs is the marketing network is still weak and limited. Some
MSMEs in Situbondo is a home business where the goods produced are only marketed in the
area only and most far only marketed out of town. Seeing the goods generated by MSME itself
actually has a high quality and not less good with the results of large companies, but owners of
MSMEs Situbondo still can not penetrate the international market due to lack of information,
knowledge and network. In addition, the technology used by SMEs is still not bnayak, most
UMKM using traditional power. MSMEs are still many who do not yet have a clear legal entity,

The Fourth International Conference on Entrepreneurship | Book Three
60
it is because the requirements that must be met to take care of the legality and licensing aspects
still can not be met.
External problems by MSMEs one of them is the business climate is not fully conducive, as still
the happening of less healthy competition occurs between small entrepreneurs and big
businessmen. The second external problem is the problem of very limited facilities and
infrastructure. The lack of information gained about the current technological advances that are
so rapidly makes MSMEs less developed and can hurt the progress of its business.
The third problem is the implications of free trade. As it is known that AFTA which came into
effect in 2003 and APEC 2020 which has wide implications for small and medium enterprises to
compete in free trade. In this case, inevitably Small and Medium Enterprises (MSMEs) are
required to perform production processes productively and efficiently, and can produce products
in accordance with the frequency of global markets with quality standards such as quality issues
(ISO 9000), environmental issues (ISO 14000 ) And human rights issues and employment
issues. This issue is often used unfairly by developed countries as a barrier (Non Tariff Barrier
for Trade). Therefore, MSMEs is expected to prepare to be able to compete both in comparative
advantage and sustainable competitive advantage.
Internal and external problems greatly affect the decision of owners of MSMEs. Especially in
funding issues, especially to develop a business or manage the permit and legality of the
business. According to Gibson (2007) the relationship between sources of financing derived
from self-capital and debt to individual micro and small businesses is often complex because the
assets of the business owner are used as debt guarantees, the business owner faces the risk of
obtaining uncertain returns. Preferences to debt as a source of funding are also analyzed through
behavioral finance approaches that emphasize that a person often behaves strangely or
irrationally when making decisions involving money because psychological factors play a
greater role in financial decision making (Hirschey & Nofsinger, 2008).
Preferences of MSME owners in using debt as a source of funding may not be separated from
the perception of business owners about the benefits and risks of debt used and psychological
factors of business owners. Psychological factors here such as overconfidence, optimism, or
lifestyle. The existence of the theory of behavioral finance is very helpful for business owners to
understand their own behavior. According to Brigham and Houston (2014), behavioral finance
is a psychological element incorporated in finance to better understand how individuals and
markets respond to different situations. The academics develop a more comprehensive model by
linking the finance and psychology of human behavior with financial markets (Shiller, 2002).
Shefrin in Supramono and Putlia (2010) also argues how entrepreneurs can understand factors
such as weakness of cognitive ability, personality, emotional, mood or mood and others affect
behavior that deviates from expectations. Research on behavioral finance is very interesting to
study because it is very useful, not only for the academic field but also useful business owners
in improving business management.
RESEARCH METHODS
This research was conducted using qualitative method of interpretive model. This method is in
accordance with the model outlined in the constructivist paradigm, that the researcher or writer
serves to translate what has been said by the respondent. The subject of research is the owners
of batik MSMEs in Situbondo. Research data were obtained through indepth interview and
participant observation. Validity of data obtained by performing member check and
triangulation both on data and source. All data were analyzed using an interactive analysis
model, a series of interconnected since the study was designed, verified and drawn conclusions.

The Fourth International Conference on Entrepreneurship | Book Three
61
Results and Discussion
Batik is one of the cultural characteristics of each region. Batik motif of each region was also
different. Batik motif in Situbondo Regency is marine biota such as shellfish, starfish, fish, and
so on. This is because the District Situbondo is one of the regencies in the northern coastal
region with a wealth of abundant sea. Batik in Situbondo has existed since the 1970's, this can
be proved by the existence of batik cloth in Peleyan Village Kecamatan Kapongan (Batik
Cotto'an). The development of batik in Situbondo has ups and downs, this is due to the lack of
economic and capital conditions.
Various kinds of batik there are 3, namely batik tulis, batik cap and batik printing. Batik tulis is
batik painted / drawn manually by hand with canting as a tool to paint and lilin batik as ink.
Batik tulis higher value than batik cap because of the value of art and requires high creativity to
paint batik so that the price of batik is also higher than batik cap. Batik business owners in
Situbondo regency not only as craftsmen but also as traders or who market the batik. While the
batik cap is batik cloth that is stamped using a mold that already has a motif like a stamp and
then dipped into a hot wax. Making batik cap is faster than batik because it must be painted one
by one using canting, while batik cap can be completed only with one tap only. The last is batik
printing, batik printing is done directly in the print using a screen printing tool.
The price offered for batik cloth in Situbondo is very diverse, from the price below Rp. 100,000,
- up to millions of rupiah. It depends on the fabric, the material / dye used and the difficulty
level in painting batik motifs. Situbondo batik cloth is not only marketed around Situbondo
District, but also marketed outside the city. Batik entrepreneurs in Situbondo also receive batik
orders with certain motives, usually used for school uniforms or agencies - institutions in the
District Situbondo. Situbondo batik business although it has been standing / formed for a long
time but still often face capital problems. This is because the household industry is moving
downhill since the 1970's. Business owners get capital from financial institutions such as banks,
other than that batik business owners in Situbondo can also get capital from non-financial
institutions.
Perceptions of Debt
The perception of MSME owners about debt causes the existence of psychological bias and debt
decision making. The results show that business owners have a positive view of the existence of
debt. Debt is considered as a good and positive for the business it has. The business owner said
that borrowed debt can help smooth the business and be useful in meeting their business needs.
The funding activity through debt is done by utilizing formal financial institutions (banks) and
non formal (relatives, moneylenders and middlemen). Here is a general overview of MSMEs in
Situbondo in meeting its funding.
Table 1. Funding of MSMEs in Situbondo
Description Percentage
Bank Debt 42.35%
Non Bank Loans 20.65%
No Debt 37%
Source: MSMEs in Situbondo 2016
From the Table above shows that the owners of MSMEs Situbindo many who use debt as a
source of funding with varying amounts. Debt is considered as a stimulator and not as a burden
on business owners. In addition, the debt is also a motivation for business owners to develop
their business so that their business can be more productive and get the desired profit in order to
pay the debt obligations. The debts obtained by the owners of batik MSMEs are usually used as
business development such as, the addition of products produced, purchase of raw materials and
tools used for batik and to pay for labor. Funds obtained from these debts are also used to

The Fourth International Conference on Entrepreneurship | Book Three
62
expand the marketing network of batik cloth products produced. In addition, debt funds are also
used to add or improve the infrastructure for batik. For example, a place to wash or soak batik
cloth or cloth to dry batik cloth.
Debt in a business will be useful if used as needed. The amount to owe must also be calculated
and estimated by the business owner not to become a burden. Given the debt or external funds
earned by the business owner should be used in accordance with the needs of his business and
not used for the personal needs of business owners.
Debt obtained by business owners not only from financial institutions or banks, but some are
obtained from non-financial institutions such as from family or relatives. Borrowing money on
non-financial institutions or to families is usually more easing because there is no interest nor
guarantee. However, many business owners are not too concerned about how much interest or
collateral provided by the bank. This is done because the funds obtained from the debt will be
used for business development and improve business performance. According to the view of
Champion (1999) states that the use of debt is one way used by companies in improving
performance.
Psychological Factors in Debt Decision Making
In general, economic actors are unable to make rational considerations, but economic actors
often make irrational considerations. Economic actors rely more on intuitive aspects or
emotions so as to analyze the costs and benefits appropriately. Similarly, when making debt
decisions, business owners more often process information quickly in order to get conclusions
and results quickly so that it can lead to error bias financial practitioners psychology. In
accordance with the theory of behavioral finance that is not entirely economic actors apply
rationally in financial decision-making, they sometimes also behave irrasional in decision-
making.
According to Shefrin (2007) about the classification of psychological factors that there are three
dominant psychological factors that play a role in debt decision making in the entrepreneur
MSMEs air rifle that is optimistic, availability, illusion of control. Optimistic attitude is
expected by all entrepreneurs because of its influence on behavior that always try to achieve
targeted results. Owners of batik MSMEs in Situbondo are confident that their business
prospects will grow and the product produced are accepted by community. This happens
because the demand for batik production is increasing in Situbondo. In addition, business
owners also believe that the debt they get will be useful for the development of business in the
future. Owners of batik MSME Situbondo also stated that by thinking optimistically they will be
able to grow and get the return they want and can pay or pay off the debt on time.
Optimistic attitude is needed in the development of a business, but optimism is also not too
excessive. The over optimistic nature of optimism becomes excessive and makes the
entrepreneur unrealistic with the real situation faced or underestimated the risk that will occur
(Bratvold, Begg & Campbell, 2005). Shefrin (2008) argues that someone who is too optimistic
will have a tendency to feel that he has the ability to process debts beyond the ability of his
colleagues. Owners of batik SMEs Situbondo also very optimistic about the prospects of his
business to the fore. These beliefs can be seen from their ability to produce high quality
products and in great demand by consumers.
Owners of batik MSMEs Situbondo also included in the category of illusion of control that is,
one feels confident to control or influence the outcome of a decision, but in reality is not the
case (Supramono & Putlia, 2010). This is supported by employers' statements regarding their
ability to conduct or process information about debt. An entrepreneur who feels confident in his
ability to process information about debt, goes into the category of illusion of control. This is in
line with the opinion of Taylor & Brown (1998) which revealed that illusion of control is an
unrealistic perception of an event. There is a possibility that the owner of batik MSMEs

The Fourth International Conference on Entrepreneurship | Book Three
63
Situbondo feel familiar with the debt because it has often done decision making task (task
familiarization), determine its own choice of choice (debt) and feel to have adequate
information (information). Entrepreneurs feel that their ability to manage their finances is good
and also feel that they have obtained adequate information about the debt. Baker and Nofsinger
(2002) explain that people often prefer something that is familiar to them. Consequently, the
entrepreneur will make debt decisions to the people he knows without seeking other information
as a comparison. Entrepreneurs who are informed that debt to certain banks are cheaper in
interest and easy to process, are likely to use the bank as a source of funding.
The next category is avalaibility bias, ie someone rely more on information available at the time
of decision making (Supramono & Putlia, 2010). Entrepreneurs who experience avalaibility bias
tend to trust the information they remember only. Some of the owners of SMEs Situbondo
borrow money as business capital from members of their relatives, they do not do the
information adequately, but only rely on information that is spontaneous is to borrow money
from the family only. Business owners will trust the information they get from people they trust.
Families and people who are already familiar, must have a strong emotional bond and usually
will affect a person's ability to think. This is what often causes a person to make or produce
decisions spontaneously and his thoughts are focused on something familiar.
Conclusion
Based on the results of research and discussion about behavioral finance in debt decision
making on batik MSMEs in Situbondo, it can be concluded that most of them consider that debt
is a positive thing as a source of funding and is considered as a stimulator rather than as a
burden, and spur the MSMEs entrepreneurs in motivating themselves To advance his business.
It also revealed that psycological factor bias occurs in debt decision making. The results of
research there are three psychological factors that predominantly play a role in making debt
decisions on entrepreneurs SMEs Situbondo namely:
1. Optimist, is the nature of assuming himself to exceed, surpass, or surpass the human
average in a population.
2. Availability, is conditions where entrepreneurs will trust the information they get
from people who are trusted only.
3. Illusion of control, is an unrealistic perception of an event
Three psychological aspects make the actors or entrepreneurs of MSMEs in decision making is
more likely to put forward the emotional aspects without taking into account the good financial
calculations that lead to biased decisions. Employers should minimize bias in their financial
behavior in making debt decisions in order to minimize losses because they have a strong
optimist and illusion of control. How, MSME entrepreneurs should still seek information and
listen to suggestions derived from others who are judged to provide an objective view of the
profit and loss of sources of debt in accordance with the needs of his business. Thus the
entrepreneur will be able to minimize the risk of debt and the loss of his business.
Suggestions
Future research is expected to allow the objeck to be studied not only in one district but in one
province to see how the differences in financial behavior of the community in the district and
province. The results of study are expected to be input to business owners to be smarter in the
selection of debt with low risk.
REFERENCES
Baker, K. H. & Nofsinger, R. J. 2002. Psychological biases of investors. Financial services
review 11. 97-116
Brigham, Eugene F&Houston, Joel F.2014. Dasar-Dasar Manajemen Keuangan, Edisi 11,
Buku 1. Salemba Empat: Jakarta.

The Fourth International Conference on Entrepreneurship | Book Three
64
Champion, D. 1999. Finance: The Joy Of Leverage. Harvard Business Review. 77, 19-22
Shefrin, H., 2008, Risk and Return in Behavioral SDF-Based Asset Pricing. Models, Journal of
Investment Management 6 (No. 3), 1-19.
Supramono dan Putlia, Nancy. 2010. Persepsi dan Faktor Psikologis Dalam Pengambilan
Keputusan Hutang. Jurnal Keuangan dan Perbankan. 14(1). 24-35.

The Fourth International Conference on Entrepreneurship | Book Three
65
COMPARING OF ENTREPRENEURIAL INTENTION STUDENT
BETWEEN SCIENCE AND HUMANITIES STUDENTS : A
LITERATURE REVIEW
1Hujjatullah Fazlurrahman, 2Nindria Untarini
Universitas Negeri Surabaya
INDONESIA
Emails: [email protected], [email protected]
ABSTRACT
This paper is preposition paper to know factor entrepreneurship intention
and compares two model entrepreneurial intention between science
students and humanities students taking subject. This paper will explore
and discuss entrepreneurial intention theory.
It is a causality study which uses multiple regression for data analyzing.
The samples of this research are undergraduate students and Sampling
method used judgement sampling the sample size are 150.
This research contrasts student taking entrepreneurship subject with
considering background study of the subject.
This paper suggests contribution to board of director faculty and
department to make decision and policy in designing entrepreneurial
learning programs for science and humanities students where later
whether there should be differences in the content of learning programs
on the different fields of study followed by students
Keywords: entrepreneurial intention, entrepreneurship subject, student,
and proposition
INTRODUCTION
Indonesian government campaign for spirit of entrepreneurship in university and push student to
follow the program for student and university every year. This program such as program
mahasiswa wirausaha (PMW), program Coop, dan program kreativitas mahasiswa
kewirausahaan (PKM-K). Indonesian government strike for spirit entrepreneurship student by
that program. Same as the opinion from Wijaya (2008) he explain to built entrepreneurship
intention that influenced by environment such as parent, culture, education process etc. this is
same as opinion from indarti dan rosiati (2008), their research in 3 country in japan, Indonesia
and Norway. Their research explain that environment have the highest influence to
entrepreneurship intention to be entrepreneur. This research show that Indonesian government
made culture of entrepreneurship with university. That program can stimulate student to be
entrepreneur. In contrast, Wijaya (2012) explain that program hasn’t ideal and contributed to
made entrepreneurship intensions
In other side, There is an indication of the relationship between the background of the field of
study with student entrepreneurial intentions. That same as researched by Wu & Wu (2008) to
student in shanghai China. This research show that the formation of the entrepreneurial intention
is influenced by the background of the field of study. Galloway et al. (2006), Shows that the
entrepreneurial intentions of the Faculty of Business students are higher than the entrepreneurial
intentions of the students of the Faculty of Science and Engineering. Bu the other opinon,
Suharti & Sirine (2011), show there is no significant difference between student entrepreneurial

The Fourth International Conference on Entrepreneurship | Book Three
66
intentions from exact faculty with non-exact faculty students. This is same as research made by
Chrissanti (2010) show there is no significant different between in need for achievement, locus
of control, self efficacy, instrumental readiness, subjective norms and entrepreneurship student
based on their department.
There are contradiction opinion of some previous studies researcher interested to know more
about the differences in entrepreneurial intentions are antecedent by the background field of
study. It is specially for student on the science and humanities. Researchers also want to explore
more deeply what exactly are the factors that shape the intentions of entrepreneurship in science
and humanities students. Empirical studies that examine the interrelation between the field of
study with entrepreneurial intentions are still limited. A number of empirical studies only
indicate the existence of a link between the type of pilot efforts of scholars with their field of
study (Lee & Wong, 2002; Alwan & Yenny, 2003).
The purpose of this research is to know the difference between entrepreneurship intention
between science and humanities students. In addition, it also forms a proposition related to the
role of factors influencing the entrepreneurial intentions of science and humanities students. It
aims to provide inputs to Board of Director of University (Rector and Dean) in designing
entrepreneurial learning programs for science and humanities students. For the future question,
Whether there should be differences in the content of the learning program on the different
fields of study that students follow
LITERATURE REVIEW
The academic research on entrepreneurship motivation was started 50 years ago and dominated
by social researchers rather than economics researchers. The development of literature (Lewis,
1991) has being debated in the economic growth. The needed for achievement is a personality,
also the result of demographic characteristic and environmental factors. Hagen (1971) using the
basic theory as used by McClelland on research in burma. Salam "traditional environment", he
said, the existing social structure is hierarchical and authoritarian structures in all aspects of
economic, political, and religious. The status of individuals in a society is a heritage, social
mobility is limited, and therefore, entrepreneurship motivation to be low (Hagen, 1971, p. 126).
Therefore, Hagen has been regarded as a pioneer of environmental determinants (environmental
determinist).
A number of studies have investigated the relationship between field of study and
entrepreneurial intention in a university environment. Grassl and Jones (2005) indicate that
distinct nuances exist between students of differing fields of study when considering
entrepreneurial intent. The studies have produced conflicting results which call for further
investigation.
A number of authors conclude that a definite relationship exists between entrepreneurial
education and entrepreneurial intent (Fatoki, 2014; Ramkhumise, 2014; Muofhe & Du Toit,
2011; Malabena & Swanepoel, 2014, 2015; Susanj, Jakopec & Krecar, 2015). Furthermore,
Otuya, Kibas, Gichira & Martin (2013) investigated the impact of entrepreneurial education in
influencing student’s entrepreneurial intentions. The study reported that students who partook in
an entrepreneurial program exhibited greater intention towards entrepreneurship than those
students who were not exposed to entrepreneurship education. These findings also concur with
those reported by Gerba (2012), who concludes that students who are registered for business-
related qualifications tend to have a higher attraction towards entrepreneurship than those
registered for engineering related qualifications. In addition, Ho, Low and Wong (2014) also
emphasized that an entrepreneurial education gives students a better understanding of the
venture creation process and the necessary skills required for venture creation, thereby
confirming a positive relationship between entrepreneurship education and intention. Also,
business students seem to have thought about entrepreneurship much more than other students;

The Fourth International Conference on Entrepreneurship | Book Three
67
however, they are less excited about entrepreneurship. A possible reason for this finding could
be that business studies are much more aware of the realities and high failure rate of
entrepreneurial ventures (Grassl and Jones, 2005). In contrast, a number of other authors
conclude that entrepreneurial intent is more strongly influenced by a comprehensive study
offering which is not necessarily focused on entrepreneurship education (Wu & Wu, 2008;
Solesvik, Westhead & Matlay, 2014; Abbas, 2013).
Entrepreneurial Intentions In the literature of social psychology, intention has proved to be a strong predictor of the
Planned individual behavior, especially when that behavior is rare, difficult to observe, or do
role in the timeframe that cannot be determined (Krueger, Reilly and Carsrud, 2000);
entrepreneurship is a special example of planned individual behavior and behavior that based on
the intention (Bird, 1988; Krueger and Brazeal, 1994) in karimi (2011).
There is a large literature debate that intention have an important role in the decision to start a
new business (Linan and Chen, 2009). As a consequence, over the last few years, several
models of job status that focus on the employment has become a topic of interest and have a
large enough space in entrepreneurship research (Krueger and Carsrud, 1993; Kolvereid, 1996)
in karimi (2011).
In this model, intension in careers seen as a direct antecedent of behavior (such as starting a
business). Intention in turn are determined by attitudes, and attitudes are influenced by "the
influence of exogenous" like nature, education, demographics and situational variable (Ajzen,
1991; Kolvereid, 1996; Krueger, 2003; Segal, Borgia & Schoenfeld, 2005; Souitaris et al.,
2007) in karimi (2011).
Need for achievement The need for achievement can be defined as "the behavior of the competition with a standard of
excellence" (McClelland, 1953). In other words, the need for achievement refers to the
expectation of doing something better or faster than others or that person achieve better
performance than ever achieved before (Hansemark, 2003). In the context of entrepreneurship,
"need for achievement" refers to the perceived outcome and the result of creating a new
business that significantly affect a person's tendency to take on the challenges and
responsibilities when starting and growing new businesses (Hansemark, 1998; McClelland,
1961). Some research suggests that the need for achievement is one of the strongest predictors
of entrepreneurial behavior (McClelland, 1961; Pillis and Reardon, 2007; Babb and Babb, 1992).
The research of Gorul and Astan (2006) showed that the need for achievement was found is
higher in students who received learning about entrepreneurship than students who did not get.
Entrepreneurial self-efficacy Bird (1989), Boyd & Vozikis (1994) put the construction of self-efficacy in entrepreneurial
research model. In the entrepreneurial, theoretically, self-efficacy is proposed in order to
improve the entrepreneurial intentions and behaviors (Boyd and Vozikis; 1994) and empirically
has a positive influence on entrepreneurial intention (Chen, et al, 1998). According to Mc. Gee,
et al, (2009), the construction of self-efficacy was first used for general self-efficacy for
entrepreneurship research, this also be used for students in general, so it's not accurate enough to
be used to measure entrepreneurial intention.
According to Bandura (1986), self-efficacy are specific task and should be assessed based on
the task and the specific behavior. In Chen, et al, (1998); DeNoble, et al, (1999), has a special
self-efficacy name in the entrepreneurial as an entrepreneurial self-efficacy. According to
Krueger, et al, (2000), in the study of entrepreneurship, entrepreneurial self-efficacy similar to
behavioral control that be perceived in the theory of planned behavior and the perceived
feasibility of the theory of entrepreneurship (Shapero & Sokol 1982). In subsequent research,
the construction of entrepreneurial self-efficacy is widely used to predict the behavior of

The Fourth International Conference on Entrepreneurship | Book Three
68
entrepreneurial research object; university or MBA students (Chen, et al, 1998, DeNoble, et al,
1999; Kristiansen and Indarti 2004, Ramayah and Harun, 2005, Zhao, et al, 2005, Gaddam,
2008).
As a basic entrepreneurial self-efficacy that was developed in the study of entrepreneurship,
Chen, et al, (1998) and DeNoble, et al, (1999), Barbosa, et al, (2007) defines the entrepreneurial
self-efficacy into four types of specific task of self-efficacy: (1) opportunity identification self-
efficacy: (2) the relationship of self-efficacy: (3) managerial self-efficacy: (4) tolerance of self-
efficacy. These categories have characteristics more emphasis on the managerial skills, both
internally (leadership, human resource management) and externally (relationship, opportunist).
According to Mc. Gee, et al (2009), a previous study using the entrepreneurial self-efficacy as
anteceden of the behavior and entrepreneurial intentions which has three limitations: it fails to
distinguish between general self-efficacy and self-efficacy, failed in calculating the
entrepreneurial self-efficacy multidimension, fails to involve new entrepreneur to the sample
(most research on entrepreneurial self-efficacy associated with the university or MBA students
as subjects of study) (Chen, et al, 1998; DeNoble, et al, 1999; Zhao et al, 2005).
Locus of control Several authors argue that the argentic characteristics of internal locus of control is
entrepreneurial self-efficacy, risk-taking propensity, and proactivity to not only distinguishes
between entrepreneurs and non-entrepreneurs, but they also affect the intention to start a
business. In the first place, internal locus of control implies a perception of high control and
feasibility in relation to specific behaviors, which is a strong predictor of intention (Shapero &
Shokol, 1982). That is why the locus of control is often associated with the development of
intentions of entrepreneurship (Krueger, 1993).
Contextual Elements
According to Anderson (2000, p. 102) in Indarti (2007) examined the entrepreneurs around the
Scottish Highlands and found that a person cannot understand about entrepreneurship, and
assume that entrepreneurship is the real object has its own characteristics environment objection
is not true; '... The environment is basically played and, has a consequently to became an object'.
Furthermore, this paper focuses on three contextual elements: access to capital, availability of
information, and social networking.
Access to Capital
Access to capital clearly an obstacle which is typical for the establishment of new businesses,
especially for new businesses in developing countries. Sources of capital can be personal
savings, a large family network, mutual savings and credit systems, or financial institutions and
banks.
Availability of Information
Singh and Krishna (1994) in their study of entrepreneurship in India found that the desire to
look for information is one of the few characteristics of entrepreneurs. Searching information
describes the frequency of contact by individuals with various informers. The results of these
activities often depends on whether it easy or not to access informers, either through its own
efforts or human resources or as part of their social resources and networks. In a study of
agribusiness entrepreneurs in Java, Kristiansen (2002b) found that access to the new
information is indispensable for the survival and growth of the company. The availability of
new information that is found to depend on personal characteristics such as education level and
quality of infrastructure such as media coverage and telecommunications systems.
Social Networking Studies on entrepreneurship has reflected a general agreement that entrepreneurs and new
companies should form a network together in order to survive (Huggins, 2000). Networks
describe a tool for entrepreneurs to reduce risk and transaction costs and improve access to ideas,
knowledge and resources for businesses (Aldrich and Zimmer, 1986). A social network consist

The Fourth International Conference on Entrepreneurship | Book Three
69
of formal and informal relationships between key behaviors and supporter in one circle that
know each other and describes the channel where the entrepreneurs can have access to needed
resources for the establishment of new businesses, growth, and success (Kristiansen and Ryen,
2002).
Figure 1. Reasearch Model Entrepreneurship Intention
Source : Indarti (2007)
RESEARCH METHODS
Papers were included if they were published since 1988, in English and had a qualitative
research focus. Papers with a quantitative research focus were excluded. Other relevant
literature, specifically books and book chapters, were identified through an iterative process
based on the journal papers. This paper is proposition and the researcher explain the hypothesis.
“What is differentiation entrepreneurship intention student in science and humanities?
RESULT AND DISCUSSION
Several studies have explained about differentiation entrepreneurship intention between
business student and non-business student. Student business represented by individual with
spend time in entrepreneurship education more than non- business student. Because it is
assumed they have higher knowledge, skills, and business competencies. In studies humanities
student is classified by business student and science student is classified by non-business
student. Table 1 show differentiation between entrepreneurship intention business student and
non-business student from many literatures
Table 1 Comparison of Entrepreneurship Intentions to Students
Author Basic Model Variables Unit Analysis Finding
Susanj,
Jakopec,
Krecar (2015)
Krueger and
Breazel's
(1994)
Entrepreneurial
potential model
Entrepreneurial
potential (EPO),
Entrepreneurial
characteristics
(EC),
Entrepreneurial
propensity
(EPR),
Entrepreneurial
University of
Applied
Sciences in
Zagreb,
Faculty of
Humanities
and Social
Sciences in
Osijek,
EC has positive
effect to ESE and
DOE
EC has positive
effect to ESE and
DOE
The EC is able to
directly affect the
EI
Personality Factors
Need for Achievement
Locus of Controll
Self-Effication enterpreneurship
intention
Contextual Elements
Access to Capital
Availability of Information
Social Networking
Entrepreneurial
Intentions

The Fourth International Conference on Entrepreneurship | Book Three
70
self-efficacy
(ESE),
Desirability of
entrepreneurship
(DOE),
Entrepreneurial
intentions (EI)
Faculty of
Humanities
and Social
Sciences in
Rijeka
ESE and DOE have
a positive effect on
EI
ESE and DOE are
able to mediate EC
relationships to EI
ESE and DOE are
better able to shape
EI in business
students than non-
business students
Eresia-Eke,
Shaum, Jean-
Claude (2016)
The Theory of
Planned
Behavior (TPB)
Entepreneurial
Intention diukur
dengan:
Entrepreneurial
Activity, Skills
related to
entrepreneurial
activity,
Attractiveness
towards
entrepreneurship,
Professional
attraction after
degree
completion,
Importance of
educational
courses
to develop
entrepreneurship
South
Africa’s
leading
Universities
There is a significant
difference in the
level of
entrepreneurial
intention of business
students compared to
non-business
students but the value
is not large
Marie Mbuya,
Schachtebeck
(2016)
The Theory of
Planned
Behavior (TPB)
Personal Attitude
(PA), Subjective
Norm (SN),
Entrepreneurial
Capacity (EC)
and overall
selfperceived
EI
(Entrepreneurial
Intent)
the Faculty of
Management,
at the
University of
Johannesburg
Both entrepreneurial
and non-
entrepreneurial
students have the
same views and
believe that
entrepreneurship is a
career choice in the
future (personal
attitude)
Both entrepreneurial
and non-
entrepreneurial
students believe that
entrepreneurship is
the right career
choice if they are

The Fourth International Conference on Entrepreneurship | Book Three
71
able to find
opportunities and
available resources.
Entrepreneurship
students show more
entrepreneurship than
non-entrepreneurial
students
Y. Abiodun,
O. Oyejoke
(2017)
Entrepreneurship
skills (ES),
Students’
Motivation
(SM),
Parental
Occupational
(PO),
Entrepreneurial
Intentions (EI),
Age, Gender
Olabisi
Onabanjo
University
(OOU) and
Tai Solarin
university of
Education
(TASUED)
There is a positive
and significant
influence between
ES and EI
There is a positive
and significant
influence between
SM and EI
There is
significant and
negative influence
between PO and
EI
There is no
significant
difference in
entrepreneurial
intentions between
men and women
There is no
significant
difference in
student
entrepreneurship
intent based on
discipline
There is no
significant
difference in
student
entrepreneurship
intentions based
on age group
Natrah Abbas
(2013)
The Theory of
Planned
Behavior (TPB)
Subjective norm,
Attitude toward
behavior,
perceived
behavior control,
entrepreneurial
intention
three
engineering
faculties: the
civil
engineering
faculty, the
electrical
There are different
entrepreneurial
intentions to students
in three engineering
majors
The highest

The Fourth International Conference on Entrepreneurship | Book Three
72
faculty, and
the
mechanical
faculty in
Malay
intentions of
entrepreneurship are
electrical engineering
students and civil
engineering students,
and finally
mechanical
engineering students
Boyd, Fietze,
Phipsen (2015)
The Theory of
Planned
Behavior (TPB)
Age, Gender,
Marital status,
Regular job,
Nationality,
Level of studies,
fields of study
the University
of Southern
Denmark
All students have
the desire to
establish their own
business.
However,
Business,
Economics and
Law (BECL)
students have a
higher desire to
start a business
than natural
Sciences and
Medicine students
(NSM) and Social
Sciences (SSC)
Based on table 1 it is seen that most of the studies have stated that the intention of
entrepreneurship in business students is higher than for non-business students although the
difference level is not too high. This is because individuals who take entrepreneurship education
classes have greater entrepreneurial intent than those who do not take entrepreneurship
education classes (Galloway and Brown, 2002). Individuals who hold high knowledge, skills,
and competencies will perform better than those with low education (Ployhart and Moliterno,
2011).
Like the entrepreneurship intention study conducted by Natrah Abbas (2015) on students in
three engineering majors University of Malaysia, where it was found that there is a degree of
difference in intentional entrepreneurship among students in all three majors. Where, students of
electrical engineering have a higher level of intention than students of civil engineering and
mechanical engineering. Meanwhile, mechanical engineering has the lowest intentions of
entrepreneurship. This indicates that engineering students have a degree of entrepreneurial
intentions at a moderate level. Generally, students from non-business majors have a lower level
of intention than business-oriented students (Wennberg & Berglund, 2008). There are five
elements that contribute in weakening the entrepreneurial intentions within the student that are
educational resources, learning methods, motivation in training, regulations, future views and
hardware resources. Of the several elements, educational resources receive special attention.
Due to lack of educational resources can create less effective learning process of
entrepreneurship. Educational resources include weak curriculum, improper course planning
process, lack of reference books.
In accordance with research conducted by Ismail, (2010), it was found that non-business
students in Malaysian polytechnic are not interested in studying entrepreneurship modules.
There are two underlying reasons: first, an entrepreneurial learning model that focuses only on
theory and outdated. Second, the applied entrepreneurship curriculum failed to cultivate an

The Fourth International Conference on Entrepreneurship | Book Three
73
entrepreneurial culture. Only about 20% of teachers have experience in business, have
entrepreneurship teaching experience and have attended entrepreneurship training. The minimal
number of teachers with experience in business and entrepreneurial learning led to a
monotonous, rigid, and theory-oriented learning method.
The condition is similar to that of students at the University of Southern Denmark. The
entrepreneurship climate in the university is relatively low. Danish students consider
entrepreneurial learning to be less important and the entrepreneurship courses offered only
partially improve entrepreneurial understanding. They are only interested when the campus
offers seminars with themes such as innovation and exploring business ideas, business planning,
and general entrepreneurship and are somewhat uninterested in the offer of continuing the
family enterprise.
This confirms that universities should position themselves as entrepreneurial centers. The
pedagogical approach at the university is considered effective in assisting students in
determining career options. Entrepreneurship education programs that include interesting
learning elements such as developing virtual companies, providing specialized training on new
business start-up strategies, conducting seminars that can raise awareness and foster
entrepreneurial spirit in students. On the other hand, the collaboration between higher education
institutions and business actors is still low. Whereas success story of business actors can
stimulate awareness and develop entrepreneur spirit among students. But it is rare, because first,
it is difficult to get commitment of business actors. Many business actors do not have time to
discuss other than their business interests. Second, low incentives. Incentives offered by
educational institutions to business actors as resource persons are still based on their level of
education. If their education level is lower than the incentives. Though they have included
successful entrepreneurs (Natrah Abbas, 2015)
Meanwhile, Susanj et al. (2015) studying business students and non-business students at Rijeka,
Osijek and Zagreb, Eastern European faculty found that entrepreneurial characteristics could
influence entrepreneurial intentions if individuals have entrepreneurial self-efficacy And the
desirability of high entrepreneurship. Entrepreneurial desires may arise if reinforced by the
combined training in any entrepreneurship education program. Entrepreneurship education is
able to empower individuals with high knowledge, skills and competence in the field of
entrepreneurship that ultimately allows them to have self-efficacy and high self-esteem
The entrepreneurship education that business students have acquired to grow entrepreneurial
intentions after they graduate from college. Because they feel that entrepreneurship education
can be used as stock in managing and developing business. Higher education can foster cell-
efficacy and hope for positive business outcomes (Pfeifer, Sarlija, and Zekic Susac, 2014).
Entrepreneurship education and training provide positive and significant results with a number
of entrepreneurial intentions linked to human capital assets and entrepreneurial outcomes
(Martin, McNally and Kay, 2013). In fact, entrepreneurship training programs are able to
develop competencies and intentions of doing business.
The degree of difference in entrepreneurial intentions between business students and non-
business students also occurs in college students who have graduated in one of South African
universities. However, the difference rate is low. This is because in South Africa,
unemployment and poverty rates are so high that they are forced to do business. Thought is
supported by the fact that how difficult friends, relatives or colleagues who have graduated from
college get a job in a company. Faced with such a disadvantage situation forced them to think of
starting their own business (Chan & Quah, 2012; Shariff & Saud, 2009). On the other hand, this
low level of entrepreneurial intentions is driven by attitudes attributed to the younger generation.
This group tends to be more adventurous and free than the older generation who tend to think
more conservative. Advances in technology and ease of access to information and networks
stimulate them to start businesses.

The Fourth International Conference on Entrepreneurship | Book Three
74
However, there are differences of opinion related to knowledge and self-efficacy that need to be
considered in generating entrepreneurial intentions. Non-business students sometimes
overestimate their ability to identify business opportunities and challenges and create their own
businesses. Whereas business students who had previously received entrepreneurial education
and training led to a high understanding of the risks, conditions and challenges of becoming
successful entrepreneurs, being anxious and afraid of stepping in to start a business. It is this
condition that causes different levels of entrepreneurial intentions between business and non-
business students (Eresia-Eke, Shaun, Jean-Claude, 2016).
In Nigeria, it was found that there was no significant difference in student entrepreneurial
intentions based on disciplinary levels (Y. Abiodun & O. Oyejoke, 2017). The educational
process does not have a beneficial or adverse effect on entrepreneurial intentions. The intention
of entrepreneurship can be formed by several other factors besides entrepreneurship education
such as family background, low job opportunity, the influence of friends and relative success.
Finally, between business students and non-business students there are still different
entrepreneurial intentions. Although, the average study shows a low rate difference result.
Business students show greater entrepreneurial intentions than non-business students because
they have gained entrepreneurship education, attended courses, and are accustomed to academic
tasks related to entrepreneurship so they have better knowledge, skills and competencies in
starting a business. Although, not entirely a high level of competence can stimuli individuals in
starting a business. Sometimes individuals who increasingly understand about the risks, terms,
and challenges in business make them fearful and anxious in starting a business. On the other
hand, entrepreneurial intentions arise from self-motivation to start a business because of
unfavorable conditions such as the difficulty of finding employment, termination of
employment. The desire to be more flexible in terms of time, energy, and income also
encourages individuals to intend to do business regardless of which individual comes from
which discipline.
CONCLUSION
Entrepreneurship is a crucial source in improving and developing a nation's economy. The study
sets out to define and identify what constitutes a degree of difference in entrepreneurial
intentions between business students and non-business students. The degree of difference occurs
because of the different levels of entrepreneurship education resources that have been obtained
during college. The average business student has better knowledge, skills, and competence
related to entrepreneurship than non-business students. Competence is derived from
entrepreneurship education and training. An interesting learning model also stimulates them to
always follow entrepreneurial learning. The high knowledge and insight into entrepreneurship
leads to self-efficacy and high self-esteem to start a business. The most obvious finding
emerging from this research is that the level of entrepreneurial intentions is not only influenced
by the background of discipline and entrepreneurship education. Sometimes these two things are
less able to stimulate the intentions of entrepreneurship, but motivational factors (such as desire
for security, need for more income) and contextual (such as cultural, economics, political) also
need to be considered in encouraging entrepreneurial intentions in students. This research will
be the basis of further studies that can help researchers to consider other factors in predicting the
degree of difference in student entrepreneurial intentions. On the other hand, it can be used as a
basis for higher education policy makers to pay more attention to entrepreneurship-related
education curriculum more interesting.
REFERENCES
Achadiyah, Bety Nur., Irafami, Diana Tien. (2013). Perbandingan Intensi Kewirausahaan
Mahasiswa Fakultas Ekonomi Universitas Negeri Malang: Jurusan Akuntansi,
Manajemen Dan Ekonomi Pembangunan. Jurnal Nominal, 2(2): 162-180

The Fourth International Conference on Entrepreneurship | Book Three
75
Aldirch, h., zimmer, c. (1986) entrepreneurship ‘through social network’ , in D . L Sexton and R.
W. Smilor (eds) the art and science of entrepreneuship, Cambridge: ballinger publishing,
3-25.
Alwan, A.P. & Yenny. L. (2003). Motivasi Alumnus Universitas Kristen Petra untuk menjadi
Entrepreneur. Skripsi tidak dipublikasikan. Surabaya: Universitas Kristen Petra.
Anderson, A. R. (2000). Paradox in the periphery: an enterpreneurial reconstrucktion?
Entrepreneuship and regional developmanent, 12, 2: 91-11.
Bandura, A. (1977). Social learning theory, englewood cliffs, new jersey: prentice hall.
Bird, B. (1988). Implementing entrepreneurial ideas: the case for intention, academy of
Management Review, 13, 3: 442-453.
Britta Boyd, Simon Fietze, Kristian Philipsen. Entrepreneurial Intentions and Behaviour of
Students Attending Danish Universities Department of Border Region Studies Working
Paper Series. Working Paper No. 06/15
Chan, J.K.L. & Quah, W.B. (2012). Start-up factors for small and medium-sized
accommodation business in Sabah, Malaysia: push and pull factors. Asia Pacific Journal
of Tourism Research, 17(1),
Chrissanti, Mariska Andriani. (2010). Faktor-Faktor Yang Mempengaruhi Intensi Berwirausaha
Di Kalangan Mahasiswa. Skripsi. Fakultas Ekonomi Universitas Atma Jaya,
Yogyakarta.
Chukuakadibia Eresia-Eke, de Villiers Shaun, Pinto Jean-Claude. (2016). Study Streams and
Student Entrepreneurial Intention. AUDOE, 12 (5), pp. 251-265.
Cromie, S. (2000). Assessing Entrepreneurial Inclinations: Some Approaches and Empirical
Evidence, European Juornal of Work and Organizational Psychology, 9, 1: 7-30.
Galloway, L., Brown, W. (2002). Entrepreneurship education at university: a driver in the
creation of high growth firms?, Education+ Training, 44(8/9), 398-405.
Galloway. L, Kelly.S. & Keogh. W. (2006). Identifying Entrepreneurial Potential in Students.
Working Paper No. 006, National Council for Graduate Entrepreneurship
Hagen, E. (1962) On the Theory of Social Change. How Economic Growth Begin. A study from
the Center for International Studies, Massachusetts Institute of Technology, Homewood
Illinois.
Hagen, E. (1971). How Economic Growth Begins: A Theory of social Change, in. P. Kilby (ed.)
Entrepreneurship and Economic Development, New York: The Free Press, 123-139.
Hamidi, D. Y., Wennberg, K., & Berglund, H., (2008). Creativity in entrepreneurship education.
Journal of Small Business and Enterprise Development, 15, 304-320.
Hansen, El. (2001). Resource Acquisition as a Startup Process: Initial Stocks of Social Capital
and Organizational Foundings. http://www/babson.ude/entrep/fer/IVB/html/IV-B.html.
Hisrich, R. D. Peters, M. P. (1998). Entrepreneurship, boston: irwin/mcgraw-hill.
Indarti, N. (2002) determinant of entrepreneurial intentions among norwegian students,
sivilokonom thesis, agder university college, norway.
Indarti, N. (2007) Entrepreneurship dan usaha kecil menengah di Indonesia, Ardana Media,
Magelang.
Indarti, N. dan Rostiani, R. (2008). Intensi Kewirausahaan Mahasiswa: Studi Perbandingan
Antara Indonesia, Jepang dan Norwegia. Jurnal Ekonomika dan Bisnis. Vol. 23 No. 4.
Jean-Marie Mbuya and Chris Schachtebeck (2016). Future entrepreneurs: does the field of study
matter? A comparison of students in a South African urban environment. Problems and
Perspectives in Management , 14(2-1). doi:10.21511/ppm.14(2-1).2016.12
José C. Sánchez, Director, (2014) Accepted: February 19, 2014 Online Published: February 26,
2014. Doi:10.5430/bmr.v3n1p31URL: http://dx.doi.org/10.5430/bmr.v3n1p31 business
and management research/ volume 3 no. 1 2014.

The Fourth International Conference on Entrepreneurship | Book Three
76
Karimi, S., Biemans, H., Lans, T., Arasti, Z., Chizari, M., Mulder, M. (2011, September).
Application of Structural Equation Modelling to Assess the Effect of Entrepreneurial
Characteristics on Students’ Entrepreneurial Intentions. H. Fulford (Eds.). Proceedings
of ECIE 2011,The 6th European Conference on Entrepreneurship and Innovation,
Robert Gordon University, Aberdeen, Scotland, UK, pp. 954-967.
Kristiansen, S. (2001). Promotong african pioneers inbusinnes: what makesa context conducive
to small-scale entrepreneurship? Journal of entrepreunership, 10, 1: 43-69.
Kristiansen, S. (2002a). Individual perception ofbusinnes contexts: the case of small-scale
entrepreneurs in tanzania, journal of developmental entrepreneurship, 7, 3 (october).
Kristiansen, S. (2002b). Competition and knowledge in javanese rural businnes, singapore
journal of tropical geography, 23, 1: 52-70.
Kristiansen, S., ryen, A. (2002). Enacthing their bisinnes evvironment: asian entrepreneurs in
eastafrica, african and asian studies, (forthcoming)
Larson, A. (1991). Patner Networks: Leveraging External Ties to Improve Entrepreneurial
Performance. Journal of Business Venturing, 9(3):173-188.
Lee, S.H. & Wong, P.K. (2004). An Exploratory Study of Technopreneurial Intentions: A
Career Anchor Perspective. Journal of Business Venturing, 19(1): 7-28.
Lewis, J. (1991). Reevalu Jating the effect of N-Ach on economic growth, world development,
19, 9: 1926-1274.
Lieli Suharti, Lieli & Sirine, Hani. (2011). Faktor-Faktor Yang Berpengaruh Terhadap Niat
Kewirausahaan (Entrepreneurial Intention) (Studi Terhadap Mahasiswa Universitas
Kristen Satya Wacana, Salatiga) Jurnal Manajemen Dan Kewirausahaan, Vol.13, No. 2,
September 2011: 124-134
Lutfiah Natrah Abbas. 2013. Engineering Students: What factors effects their entrepreneurial
intention? IOSR Journal Of Humanities And Social Science (IOSR-JHSS). Volume 15 ,
Issue 2 (Sep. - Oct. 2013), PP 35-40 e-ISSN: 2279-0837, p-ISSN: 2279-0845.
www.Iosrjournals.Org
M. Z. Ismail, (2010). Developing entrepreneurship education: Empirical findings from
Malaysian polytechnics, doctoral diss., University of Hull, Yorkshire, United Kingdom.
McCelland, D. (1961). The Achieving society , princeton,New Jersey : Nos t rand.
Mcclelland ,D. (1965). Achievement motivation can be devel0ped, harvard business review.
Nov-dec.: 6-24.
Mcclelland, D. (1971). The Achievement Motive in Economic Growth, in: p. Kilby (ed.)
Entrepreneurship and Economic Development, New York The free press,109-123.
Oguntimehin, Y. Abiodun, Olaniran, O. Oyejoke. (2017). The Relationship Between
Entrepreneurship Education And Students’ Entrepreneurial Intentions In Ogun State-
Owned Universities, Nigeria. British Journal of Education, 5 (3), pp.9-20
Ployhart, R. E., Moliterno, T. P. (2011). Emergence of the human capital resource: A multilevel
model. Academy of Management Review, 36(1), 127-150. pp. 49-62
Segal, G., & Borgia, D., Schoenfeld, J. (2005). The Motivation to Become an Entreprenur.
International Journal of Entrepreneurial Behavior & Research, 11, 42-57
Sekaran, Uma&Bougie (2009). Research Method for Bussiness: a skill building approach. Fifth
edition. United kingdom. Wiley.
Shariff, M.N.M. & Saud, M.B. (2009). An attitude approach to the prediction of
entrepreneurship on
Singh, K. A., Krishna, K.V.S.M. (1994). Agricultural Entrepreneurship: The Concept and
Evidence, Journal of Entrepreneurship, 3, 1:97-111.
students at institution of higher learning in Malaysia. International Journal of Business and
Management, 4(4), pp. 129-134.

The Fourth International Conference on Entrepreneurship | Book Three
77
Wijaya, T. (2008). Kajian Model Empiris Perilaku Berwirausaha UKM DIY dan Jawa Tengah.
Jurnal Manajemen dan Kewirausahaan. Vol. 10. No. 2, 93-104.
Winanrno, Agung. (2012). Intensi Kewirausahaan : Perspektif Karakteristik Kepribadian,
Pembelajaran dan Jaringan Sosial (Studi pada Mahasiswa Akademik dan Vokasi UM.
Jurnal Ekonomi Bisnis, 17(1):67-68.
Wu, S. & Wu, L. (2008). The Impact of Higher Education on Entrepreneurial Intentions of
University Students in China. Journal of Small Business and Enterprise Development,
15(4): 752–774.
Zoran Sušanj, Ana Jakopec, Irena Miljković Krečar. (2015). Verifying The Model Of Predicting
Entrepreneurial Intention Among Students Of Business And Non-Business Orientation.
Management, 20 (2), pp. 49-69

The Fourth International Conference on Entrepreneurship | Book Three
78
WOMEN AS ENTREPRENEURS WITH SMALL CAPITAL
1Parwita Setya Wardhani, 2Menur Kusumaningtyas2
STIE Mahardhika Surabaya
INDONESIA
Emails: [email protected], [email protected]
ABSTRACT
Seeing the reality of the many successful women and the running of
their businesses, shows that nothing is impossible to be a successful
woman entrepreneur. Creativity to develop the business is also a
concern of woman entrepreneur with small capital. This is important
because so many women entrepreneurs of small capital are emerging.
Only with creative work the business can be successful. In addition to
creativity, managing finance cannot be separated from every type of
business. Not a few women entrepreneurs small capital who cannot
continue its business due to how to manage the wrong money. The result
from this research are woman entrepreneur of small capital started
business with aim to increase income, their passion, and their business
is supported by husband, they want to expand their business in the
future. But not all women who run their business have done the
financial recording that is crucial for developing their business.
Keywords: women, women entrepreneur, small capital
INTRODUCTION
In the economics, the existence of women can not be ruled out. They have contributed a lot with
the minimal capital they have. The spirit in managing the existing income for small and medium
enterprises gets a good response from the national market.
Small businesses with little capital, in addition to being able to generate extra income for them,
also become a separate market on a national scale. The targets of these women are the lifestyle
market. Because this segment is in great demand by women in developing countries. For
example fashion, women's accessories from hair to foot are provided by them. Although it is
possible to them to try another chalenge which are temporal like parcels or catering.
There are several reasons why they are interested in doing this business. First, they have their
own personal income without having to work at the office that takes up a lot of time. And leave
the family as well. Second, for network expansion so they have multiple channels from different
fields. Third, as a social status. By having their own income, they hope to get acceptance from
some circles. Fourthly, they do this because they are motivated by the success of their parents.
So that by following the trail of parents, easy access will be obtained, as well as to get an
injection of funds.
But in addition to providing small capital for business, there are also women who desperately
undergo business with very limited capital. This is usually driven by economic and living costs.
It is rife among students.
They are not ashamed to provide students, from toiletries, snacks, accessories to typing services
of campus tasks.

The Fourth International Conference on Entrepreneurship | Book Three
79
Creativity in looking for business opportunities among IRTs or students should continue to be
processed. Not only that, with good service will arise either continuous relationship or
commonly called networking. The purpose of this paper is to find out how businesspeople in
women run their business with little capital and how they manage their finances.
The role of women in the economy of the country cannot be underestimated. They run a lot of
effort to help the family economy or run their business just to channel their talent. The type of
business that is generally run fashion (clothes, accessories) bags and shoes, catering, and others.
The desire to be independent especially in the matter of having their own source of income
independent of job vacancy offered by the company. And now there are many women
entrepreneurs who open their own business. Indeed there are following the career of parents
who background as a businessman and get a capital injection. But not a few also dare to run a
small business with just a mediocre capital because o
f economic factors, education and so forth. Some women open a small capital business from
home only. Usually housewives who want to be able to increase income for the family. But
many are still single and even students can have an effort to pay for their own tuition
(www.betabicara.com).
Creativity to develop the business is also a concern of women entrepreneurs with small capital.
This is important because so many women entrepreneurs of small capital are emerging. Only
with creative work the undertakings can flourish. In addition to creativity, regulating finance is
inseparable from every type of business. Not a few women entrepreneurs small capital who
cannot continue its business due to how to manage the wrong money. The objectives of this
study are to know how an entrepreneur with small capital runs the business and how the
business woman as the entrepreneur manages her financial.
LITERATURE REVIEW
The growth of the number of women who became business owners in a few years are increased.
According to Vice Dean of Resources and Finance Faculty of Economics and Business of
Telkom University, Lia Yuldinawati, entrepreneurs also have to get attention from several
agencies, both private and government. "All agencies should give rewards and capital assistance
for female entrepreneurs," Lia said, Women have an important role to play in the economic
progress of a country.
Based on a recent study conducted by the Asia Foundation, shows that about 23 % are women
entrepreneurs. The amount, growing 8 % annually. In Indonesia alone, the number of female
entrepreneurs is mostly in the micro and small scale. Data from the Ministry of Cooperatives
and SMEs in 2015 was recorded, from about 52 million perpetrators of SMEs that exist
throughout Indonesia, as many as 60 % of businesses run by women. This women's SMEs, she
said that most survive from the crisis of Monetary, economic, food, and energy that hit the
world and Indonesia 10 years ago. Thus, much support should be given to women to become
entrepreneurs. Looking at the enormous number of women entrepreneurs, Lia said that it is
expected that the number will continue to increase. In order, women entrepreneurs can play a
significant role in economic development in Indonesia there should be a strategic program to
increase the number and quality of entrepreneurs in Indonesia. The strategic programs to
support the increase in the number and quality of Indonesian entrepreneurs are capital assistance
and training for entrepreneurs (http://www.republika.co.id)
Examples of women business types with small capital, shown in the picture ;

The Fourth International Conference on Entrepreneurship | Book Three
80
ttps://www.google.co.id/search?biw=1024&bih=494&tbm=isch
http://www.sihanoukville-cambodia.com/Images/2016c/resto-indonesian-restaurant2.JPG
Tips for Successful Women For Small Capital Entrepreneurs
Seeing the reality of the many successful women and running the business, shows that nothing
is impossible to be a successful entrepreneurial lady.Some tips that can be followed successful
business ways for women entrepreneurs small capital from scratch:
Socializing Through the Media
Women entrepreneurs of small capital can run independent businesses by choosing to use social
media.Sebaiknya concentrate on some social media that is in accordance with the target market.
There are several popular sosmed in Indonesia such as: Facebook, Twitter, Path, Instagram,
Linkedin, Google+, BlackBerry, Pinterest, etc.
Take advantage of Network
As a small business owner often gets stressed. Therefore, supports from various parties become
important. If you do not currently have a business network, you can start from an existing
network of friends. Friends around can be a machine that can be utilized with the principle of
mutual benefit. Engaging in the appropriate business forums can be a way to get business
partners who provide many benefits. Frequent get together with friends, colleagues,
acquaintances is a successful business tip. Women's association lunch, botram show, family
gathering are useful social events.
Delegation
Owning a business does not mean that all activities are carried out by the personnel themselves.
If you already have employees or labor, you should start learning to be able to organize and
assign tasks to subordinates. Only need to control and supervise what has been done by
subordinates in accordance with the task. In this way, definitely have more time and energy to
think more about other things, because it also takes time to socialize. Must be able to read the
business needs for the system to run in a balanced, effective, efficient and profitable without
having to always sweat alone.
Make Your Home Inspirational

The Fourth International Conference on Entrepreneurship | Book Three
81
Generally women who have their own business, also have responsibility to take care of their
home, children and husband. Often women feel the activity makes them depressed but it should
be an inspiration as a tip to become a successful entrepreneur with a strong mental and vision.
Never Stop Trying
Pursuing business opportunities is not simple and exhausting. But there is no need to be
discouraged and discouraged. Continue to widen the network and resources in order to make the
business more familiar and sought after .
(http://betabicara.com)
How to Manage Business Finance To manage the business finances properly, it takes the name 'financial discipline'. This material
is taken from the book Book of Anti-Bankrupt essay Jaya Setiabudi. Here's how to manage
business finances with 7 Financial Disciplines.
1. Separate Personal Account from the Company. This is to avoid the use of unintentional
or considered money as well. Although the company is 100% owned, the separation of
this account will make it easier to calculate accuracy.
2. Make a budget for Monthly Spending. Including salary. Pay for yourself according to
the position and 'number' of needs. If forced to borrow, calculate as a cash / debt to be
paid in the next payday.
3. Create a Cash Flow Projection. With cash flow projection, know when will receive
money, expend money, and will be minus/plus money. Thus, the anticipatory steps can
be taken before going minus.
4. Create a Cash Flow Statement. Ideally, the financial statements (profit / loss and
balance sheet). But, if not possible because it is still a new venture, make at least the
report out of money.
5. Separate Accounting with Cashier. If the share of money (cashier) also make financial
reports, then there is the potential for report manipulation. For example, cash in the
report is there, it turns out when audited there is no (used for personal use).
6. Avoid Money Staying at Employees. Many events brought home money tends to be
used, ranging from reasons for spree, sick brother, returned home, until the cat is injured.
7. Perform Stock Checks Periodically. The manipulation gap is stock already sold,
reported unsold. As a result, his money was gone. (Falasik.com/how-to-management-
company).
Previous research
The Role of Human and Financial Capital in the Profitability and Growth of Women-Owned
Small Firms
Authors *Susan Coleman
This paper examines the relationship between human and financial capital and firm performance
for women- and men-owned small firms in the service and retail sectors. Results indicate that
human capital variables, including education and experience, had a positive impact on the
profitability of women-owned firms, whereas measures of financial capital had a greater impact
of the profitability of men-owned firms. The ability to secure financial capital also had a
positive impact on the growth rate of men-owned firms, but did not appear to affect the growth
rate of women-owned firms. These findings suggest that the growth aspirations for women-
owned firms may be driven by factors other than human capital or the ability to secure external
capital. (https://scholar.google.co.id/scholar)
What Makes Muslim Women Entrepreneurs Successful? A Field Study Examining Religiosity
and Social Capital in Tunisia
Authors
Authors and affiliations

The Fourth International Conference on Entrepreneurship | Book Three
82
Lisa E. BaranikEmail author
Brandon Gorman
William J. Wales: 01 June 2017
The present study sheds light upon critical factors that help explain the entrepreneurial success
among Muslim women living in a democratic Tunisia, a Muslim-majority country considered
by many to be the lone Arab Spring success story. We hypothesized that successful
entrepreneurs need social capital, including the capital that comes from marriage and high levels
of wasta (the Arabic concept of having personal connections with influential others). Moreover,
given the lack of empirical attention paid to the role of the culture, language, and customs
associated with Islam on women’s empowerment, we examine whether religiosity is related to
entrepreneurial performance among Tunisian women. Data collected with 84 female
entrepreneurs participating in entrepreneurship training programs across Tunisia reveal that two
forms of social capital, marital status and wasta, are related to training center directors’ ratings
of women entrepreneurs’ performance, suggesting that social capital is a critical asset for
Muslim women entrepreneurs. Religiosity, on the other hand, had no statistically significant
relationship with entrepreneurial performance. Our study contributes to research on
entrepreneurship by identifying wasta as a form of social capital that may be necessary for
women entrepreneurs to succeed in the Middle East and North Africa and by taking an initial
step towards better understanding the empirical (and controversial) relationship between
religiosity and career success among Muslim women. We recommend that training
organizations supporting entrepreneurs directly assist women in the development of social
capital and acknowledge, rather than ignore, that nepotism and wasta are linked to
entrepreneurial success in some cultures.
(https://link.springer.com/article/10.1007/s11199-017-0790-7)
RESEARCH METHOD
The type of research used is descriptive research method. Data used is primary data from
interview with five respondents, whose business are in different fields, culinary ,fashion and
Umroh & Hajj travel.
DISCUSSION
Some of women entrepreneurs with small capital have not done the financial recording well.
This situation also seen from the sources in this study. Some of the entrepreneurs with small
capital interviewed in this study were as follows:
Table 1. Respondents’ Information
Name Business fields Established Initial Investment
Mrs. Rusli Culinary 2014 IDR 200,000
Mrs. Vita Fashion Since study in college IDR 500,000
Mrs Vera Asesoris (bros) 2014 IDR 150.000
Miss Risa Hajj&Umroh Travel 2013 IDR 3.500.000
Mrs Ana Bakery + Rice Box 1994 -
Mrs. Vita is one example of local entrepreneur who has succesful. Her business is fashion that
are purchased by her own money collected from the provision of parents since she were at
college. Once a housewife, the 45-year-old Vita established the boutique . Since she was at
school, she was selling clothes, accessories. At first the customer is her own friends. Now she
used uses social media to offer her wares. selling , Next plan, she want to expand another

The Fourth International Conference on Entrepreneurship | Book Three
83
business. We ask her about the financial statements ,and she answered ; “I have simply
financial statement”.
Mrs. Rusli is another success story. From her loving of baking, she manages the production of
wet and dry cakes. Her husband is very supported.
“ My first order was 30 pieces of pastel and risole within first month of my announcement
through neighbourhood and relation. Now I can supply as many as 500-600 pieces of cakes,”
said the 51 year old woman.
While renting a shop, now she is setting aside funds to buy her own business place. But
unfortunately, she have not the recording for her finances
Mrs. Ana also one of the successful woman with small capital. in the field of bakery and rice
box. She started the business since 1994. At first, She is continued her mother's business which
progressing rapidly while in her hands. Mrs Ana has a promotional strategy to introduce her
business . Mrs. Ana’s bakery products that many customer are interested in is cake and food..
Mrs Ana already has a professionally finance statement.
Unlike Mrs. Ana, Mrs Vera ( one of five respondents) has not managed the financial report
professionally. She started selling her own creations of brooch and necklaces. The initial idea
for business of accessories is the interest of his her friends when he she uses his her own hand
made creation. She has not any strategy marketing and financial report. And her business
become undeveloped. It is important for her to do this business with serious intention.
The last respondents is Miss Risa who has Hajj travel agency, the initial capital is about
3,500.000. She always separating syiar and shopping tool need. The marketing strategy is to
share with the prospective pilgrim and telling the opportunity of this program. Usually, she uses
the brochures, banners, business cards and seminar for promotion. She wants to expand her
business area not only at Surabaya, but also to Makasar, Medan, Palembang and Semarang.
CONCLUSIONS
There are various reason why women start their business. Some are because the necessities of
life such as a pleasure. Most of their business is are supported by their husbands, so they feel
good about it.
Women entrepreneur with small capital have creativity to develop the business. Some of them
have promotion and product strategy, and planning to expand their business area.
Unfortunately, not most of of these women are running their business by doing the correct
recording. They only need to calculate the profit every day without having a financial report.
This is one of the weaknesses in doing business. Businesses become difficult to control and the
wealth of their business is difficult to quantify.
It is important to knows about human capital variables, including education and experience, so
that we can measure the profit of theirs business. And the strategic programs to support the
increase in the number and quality of Indonesian entrepreneurs are capital assistance and
training for entrepreneurs.
LIMITATION OF THE STUDY
1. This study is only performed on adult women, while many young women are also successful
as small capital entrepreneurs.
2. The form of financial records is not attached by the data source due to confidential issues
REFERENCES
falasik.com/cara-mengelola-keuangan-usaha
http://betabicara.com/5-kunci-usaha-sukses-untuk-wanita-wirausaha-modal-kecil/
http://www.republika.co.id/berita/ekonomi/makro/15/07/13/nrfiur-jumlah-pengusaha-umkm-
perempuan-meningkat

The Fourth International Conference on Entrepreneurship | Book Three
84
https://scholar.google.co.id/scholar?q=WOMEN+AS+SMALL+CAPITAL+ENTREPRENEUR
S+JOURNAL&hl=id&as_sdt=0&as_vis=1&oi=scholart&sa=X&ved=0ahUKEwig9p_Wp
6DVAhUDk5QKHVCQCAgQgQMIJzAA
https://link.springer.com/article/10.1007/s11199-017-0790-7
http://www.sihanoukville-cambodia.com/Images/2016c/resto-indonesian-restaurant2.JPG
ttps://www.google.co.id/search?biw=1024&bih=494&tbm=isch

The Fourth International Conference on Entrepreneurship | Book Three
85
ENHANCING COMPETITIVENESS SMEs
WOMEN CREATIVE INDUSTRY IN SURABAYA
1Tias A. Indrawati, 2Riza Y. Kurniawan
Universitas Negeri Surabaya
INDONESIA
Emails: [email protected], 2rizakurniawan@unesa,ac,id
ABSTRACT
This study was conducted to support the increased competitiveness of
women entrepreneurs in the creative industries, especially handicrafts
that have been shown to contribute the economy. The importance of
understanding the obstacles to be able to solve the problem right on
target creative product marketing related business women in the
online business that currently emerging with the rapid world of
communication via the Internet.
This study used the descriptive qualitative method. Data was catch
using observation, interviews and focus group discussion (FGD). The
sample is a handicraft business woman in Surabaya held its products
through online marketing.
The issues raised are how good housewife and a student as women
entrepreneurs can improve marketing and finance in their online
business. Practical knowledge of what is needed to be able to increase
the turnover of the online business.
The result is an increase in the skills they need to be able to increase
its sales. Currently needed include science photography simple using
a smartphone to be able to maximize the product to be marketed on
their online shop. Simple financial records required to be able to
know the financial position that has been generated. Proper
packaging so that the goods can’t be broken up and sold is given the
crafts that have a value will form, with the proper packaging will
make the value of the craft is not reduced due to the damage caused
by shipping. So by knowing these skills need improvement, then the
employer crafts in Surabaya held its products through online
marketing can improve their competitiveness.
Keywords: women entrepreneurs, improvement of skills, creative
industries, online business
INTRODUCTION
Telecommunications rapid development makes the Internet is not new. Marketing world began
to evolve with the advancement of this technology. In 2015, the total value of trade transactions
through the Internet (e-commerce) reached 20 billion US dollars, much improved compared to
2013, which still reached 8 billion US dollars. The Government through the Ministry of
Communication has launched a number of programs targeted to be achieved in 2020, namely
1,000 techno, 1,000,000 farmers and Fishermen Go Digital, 8,000,000 SMEs Go Digital and
Integrated Broadband village in District 187 are categorized outermost, isolated and

The Fourth International Conference on Entrepreneurship | Book Three
86
underdeveloped.(Www.bisnis.tempo.co).These changes lead to competition leading companies
in different areas of design and product development, production, distribution, communication,
and marketing (Singh, Garg, and Deshmukh, 2008)
SMEs play a major role in the Indonesian economy with the ability of the employment rate is
about 97% of the national workforce and contributes to gross domestic product (GDP) of about
57%. Therefore, SMEs have an important and strategic role in national economic development.
In addition, SMEs also play a role in the distribution of development outcomes. With the
evidence of SMEs are not influenced by the economic crisis in the period 1997 - 1998, only
SMEs are capable of standing strong (LPPI & Indonesia, 2015).
Employment population ratio in Indonesia is somewhat higher than the average rate of global,
this is partly due to the high percentage of the working age population and the limited choice of
income outside the world of work. There is a big difference in the ratio of employment
population of men with women, where men are estimated at 89.5 percent in February
2015.while young women estimated 32.6 percent in the same period. In Indonesia, the
participation rate of women in the labor force is very low this is because the number of women
who did not participate in the workforce due to family responsibilities, where there are many
women who claim that they are fully engaged in household activities (ILO, 2015).
Based on a recent study conducted by the Asia Foundation, showed that about 23 percent are
women entrepreneurs. The total, grew 8 percent each year. Some female entrepreneurs are in the
micro and small scale. Data from the Ministry of Cooperatives and SMEs in 2015 was recorded,
from about 52 million SMEs in Indonesia, 60 percent of businesses run by
women.(Http://www.republika.co.id)
The economic value of a product or service is no longer determined by the raw materials or
production system, but rather the use of creativity and creation of innovation through the
development of increasingly advanced technology. This is called a new economic era that
prioritizes the information and creativity that is popular with the title of Creative Industries or
the Creative Economy is driven by the industrial sector concerned in the field. The creative
industry itself is a development concept based capital of creativity that can potentially increase
the economic growth and social welfare. The concept of the creative industry itself is creativity-
based activities that affect the economy and welfare of the community, the small-scale
industries such as handicrafts in the city of Surabaya is one of them.
During this growth creative industry in Indonesia has a particularly prominent economic
contribution in the field of fashion and crafts. So naturally when the government gave serious
attention to the development of creative industries. As presented MEMPERIN during the
exhibition "Fashion Products and Accessories" at Plaza Exhibition Industry, the Ministry of
Industry, Jakarta, Wednesday (12/8) that the added value of the creative economy sector is
estimated to reach Rp. 11 \ 1.1 trillion. The highest contributor of added value, among other
sub-sectors of fashion, food, and crafts (www.kemenperin.go.id).
In 2015 digital industry online store is already crowded, but with the power of the Internet
network faster and devices that support the application, then the phenomenon of online stores is
believed to be further strengthened and increased in 2016. This is because the Internet
technology fourth generation (4G LTE) has been unveiled by the government.
(www.dimbleweb.com)
Rapid telecommunications development makes the Internet is not new. Marketing world began
venturing developed with the advancement of this technology. Digital marketing research
institution E-marketer estimates that in 2018 the number of active users of smartphones in
Indonesia for more than 100 million people. With that amount, Indonesia will become the
country with the fourth largest smartphone active users in the world after China, India, and
America. (www.kominfo.go.id)The world of marketing is growing with the advancement of this
technology. Such changes leading companies to compete simultaneously in different dimensions

The Fourth International Conference on Entrepreneurship | Book Three
87
such as product design and development, production, distribution, communication, and
marketing (Singh, Garg, and Deshmukh, 2008)
The main activity is trading in Surabaya. Geographically the city of Surabaya has been created
as a trading city since Majapahit Period until today. As a business town lasted all the activities
and facilities that support. Today, the trading activity in Surabaya not only serve the needs of a
local and national but also international trade. This study triesto be identified in order to
increase the competitiveness of SMEs female creative industries in the city of Surabaya.
LITERATURE REVIEW.
A. Micro, Small and Medium Enterprises (SMEs)
SMEs picture can be seen from the aspect of business and entrepreneurial nature of the
SME entrepreneurs. In accordance with Law No. 20 the year 2008 on Micro, Small and Medium
Enterprises (SMEs):
1. Micro, is a productive economic activity belonging to individuals and/or entities that
meet the criteria of individual businesses, Micro as stipulated in this Law.
2. Small Business is a productive economic activity that stands alone, carried out by an
individual or entity that is not a subsidiary or not branches of companies owned, controlled, or
be a part either directly or indirectly from medium or large businesses that meet the criteria of
business small referred to in this Act.
3. Enterprises Medium is an economic enterprise productive stand-alone carried by an
individual or business entity that is not a company or branches of companies owned, controlled
or be a part, directly and indirectly with a small business or large enterprise with total net assets
or result in sale annual as stipulated in this Law.
The term comes from the word entrepreneur entrepreneurship. Entrepreneurship is a tool from
the tool life view someone who wants their freedom in the economy to create something new by
using existing resources. To achieve this, of course, a necessary skill in exploiting the
opportunities through a variety of business opportunities, the ability of proper risk management
decision to achieve opportunity, and through communication skills and management expertise in
mobilizing human, financial and material resources to produce a good project. (Ranto, 2007)
Definition of women entrepreneurs according to Meng & Liang (1996) is defined as a business
owner who has the initiative, accept all the risk and finance, responsible administration, social
and effective lead management.
The condition of women entrepreneurs in Indonesia to experience rapid growth. The fact that
women were open for business 2.4 times more than men, but the impact is not at all small. The
companies owned by women employ over 15.5 million employees, or 35 percent more than all
employees of Fortune 500 worldwide. Despite their businesses tend to be slower than the
company man, his power is higher than the overall business. Although 72 percent of women-
owned businesses concentrated in the areas of retail, services, women entrepreneurs thrive in an
industry previously dominated by men such as manufacturing, construction, transportation, and
agriculture. This condition can also be seen from the number of new women's cooperatives and
its diverse businesses small and medium enterprises are formed and success. (SMECDA 2006)
C. Creative Industry
According to the Ministry of Trade (2009, H.5), Creative Industries is an industry that
comes from the use of creativity, skill and talent of individuals to create prosperity and jobs to
generate and empower the creativity and inventiveness of the individual. Simatupang (2008,
h.69) also explains that the creative industries are industries that rely on the talents, skills and
creativity which is a basic element of every individual. The main elements of the creative
industries are the creativity, skill, and talent potential to increase prosperity through offering
intellectual creations. Meanwhile, among the experts in these fields, seems to be no fundamental
discrepancy between the Creative Economy Creative Industries. Judging from the aspect of

The Fourth International Conference on Entrepreneurship | Book Three
88
practical need is not a serious problem. In general, it can be said that both of them implies
creativity-based activities that affect the economy or welfare of the community.
The scope of activities of the creative economy can cover many aspects. Department of
Commerce (2008, H.4) identified at least 14 sectors included in the creative economy, namely:
1) Advertising
2) Architecture
3) Art Goods Market
4) Handicraft
5) Design
6) Fashion
7) Film, video, and photography
8) Interactive games
9) Music
10) Performing arts
11) Publishing and printing
12) Computer services and software
13) Radio and Television
14) Research and Development
Can be seen the extent of coverage of the creative economy, most of the economic sectors that
do not require large-scale production quantities. Unlike the manufacturing industry oriented
product quantity, creative industries more reliant on the quality of human resources. More
precisely the creative industry emerged from a group of small and medium industries.
D. Competitiveness
According to the Indonesian big dictionary (KBBI), the strategy is defined as the science
and art of using all the resources of the nation to implement a certain wisdom in war and peace.
While some other sense of competitiveness, namely:
1. According to the Council on Competitivenessin Washington, DC, in 2006, the nation's
competitiveness is the capacity to face the challenges of the international market competition
and maintain or increase its real income.
2. According to the European Commission in 1999, the competitiveness is defined as the
ability to produce goods and services that meet international testing, and at the same time also
be able to maintain a high level of income and sustainable, or the ability to generate local
income and employment levels are high remain open to external competition.
Anton et al. (2015) found that the competitiveness of SMEs originated at the level of innovation,
entrepreneurship, human capital, financial resources, market potential and business strategy.
SMEs also need government assistance to develop marketing networks and access to financial
institutions. In the case in Indonesia Tambunan (2009) found that their competitiveness can be
improved through human resources, working capital, as well as management expertise and
technology.
In the perspective of development, SMEs can be classified into four (4) groups: [3]:
1. Livelihood Activitiesis an SME that is used as a job opportunity to earn a living, which is
more
commonly known as the informal sector. Examples are hawkers
2. Micro Enterprisean SME that has the properties of craftsmen but do not yet have an
entrepreneurial nature
3 SmallDynamicEnterprise an SME that already have an entrepreneurial spirit and able to accept
work sub-contracted and export

The Fourth International Conference on Entrepreneurship | Book Three
89
4. Fast Moving Enterprise, isSMEs already have an entrepreneurial spirit and the will to
transform into Big Business (UB) one law is the reference product and development for
SMEs in Indonesia is law No. 20 the year 2008 on Micro, Small and Medium
Enterprises.
RESEARCH METHODS
This study used the descriptivequalitative method. Data taken with the observation, in-depth
interviews and focus group discussion (FGD). Samples are the women entrepreneur in the field
of creative industries are mainly craft in Surabaya. SMEs have been using social media and
websites to market the products of creative industries.
Surabaya as the second largest city in Indonesia has a population of the diverse community from
migrants seeking jobs in Surabaya so that students and students. Current trends work is work
that can be done at home, especially for mothers,
The focus of this research is the disclosure process and interpretation of meaning. In this study,
held assumption that women and entrepreneurs not only be termed as a relationship but also on
the pattern of action or interaction with the surrounding conditions entrepreneurial development
effort
Based on these assumptions, this study focused on a qualitative approach. The qualitative term
refers to the process and meaning that are not tested or measured strictly in terms of quantity,
intensity or frequency, the emphasis given to the nature of the social construction of reality and
look at how social experience is shaped and given meaning (Denzin and Lincoln, 1994).
According to Denzin and Lincoln (1994), Creswell (1994) and Maxwell (1996), for research
that focuses on the disclosure process and interpretation of the meaning of the qualitative
approach is more relevant. A qualitative approach here means how qualitative research methods
and techniques.
RESULTS AND DISCUSSION
As the second largest city in Indonesia, Surabaya is a business hub where it means a lot of
trading activity carried out in the city. This activity has an impact one of them is garbage. As we
know that for this kind of garbage bins are difficult to recycle. Large companies supporting the
provision of waste management related skills. Surabaya is mainly urban vase is one in which the
place is finally emerging entrepreneurs recycling craftsmen. Creative industries thrive on the
creativity of the use of the waste that can’t be destroyed by itself. Plastic waste one of them,
residents of the vase makes the work of these materials to produce products that have more
value.
Housewife recycling business owners, for example, to produce other products from plastic
materials as well as waste paper. Mrs. Kayubi is one of the creative industry employers where
his work in the form of bags and purses from used plastic packaging material. Mrs. Retno is one
of the woman entrepreneur in craft bag made of cement bags. Mrs. Tris processing scrap
materials from plastic cups, plastic bottles, bottle caps, cap gallon and others. Mrs. Tris many
craft into a flower, clothing and another carnival.
Here creativityshowed by woman entrepreneur Surabaya where the results of their work on the
materials used in the form of plastic waste and waste paper into products that can be sold into
the market through the online store either a blog or Website. The student of one of the
universities in Surabaya also no less creative by making their own products such as pillows

The Fourth International Conference on Entrepreneurship | Book Three
90
different shapes and scrapbooks, where they also do marketing of their products through an
online store.
The Context of marketing online offers convenience and new media in marketing
communications media. Segal product is basically the things that can be marketed and able to
satisfy customers when worn or used (Morissan, 2010: 75). In promoting the product in online
business then upload photos of the products are things that must be done by an online business
entrepreneur. So the photos have displayed that is used to communicate what products are sold
to buyers.
Recycled handicrafts produced Mrs. Kayubi shown in his blog daurulangyobi.blogspot.co.id.
While Mrs. Tris using trisflower.com to display their products. This she expressed in the
following interview excerpt:
"... My Product in photo using my child's mobile then uploaded to the web by my husband
.." (Mrs.Tris, July 26th, 2016)
In contrast to housewife, Dea an Ervira choose using social media such as Facebook and
Instagram. This he expressed in the following interview excerpt:
"... photograph the order of my friends on the phone then uploaded on Instagram
@moody_handicraft account, so friends can see my scrapbook example... "(Ervira,
August 5th, 2016).
From the interview above it can be seen that the small business crafts display only modest
picture. They used a camera phone to take a picture and upload it on their online store. Judging
from the photos in their online store seemed to see less professional. They only show sober. One
picture speaks more than a thousand words, this motto is widely known among lovers of
photography. A good image to attract the attention and tells the events in the pictures though
without using words.
These handicraft entrepreneurs realize that the display of photos in online represents their
products in order to avoid questions that are too much for such products. As disclosed in the
following interview excerpt:
"... The picture is indeed because if the photo in the studio so expensive, but sometimes
they ask a lot more because the picture is less clear
...." (Mrs. Retno, July 23, 2016).
DeaNatania @bantal.id business owners displaying their products through Facebook and
Instagram.Nonetheless,Dea still wants to improve the image quality of the products as described
in the following interview excerpt:
".... Photography is currently the most important to attract customers to our products, I
want to learn to maximize photos from my smartphone for more professional product
displays... "(Dea, August 6th, 2016)
If the note of the interview above, we see that the photos displayed on social media, blog or web
are part of the activities to advertise their products. Advertising (ad) over the Internet is
advertising delivered via the Internet (Rangkuti 2009: h.229). So that advertising or ads that are
implemented in the internet marketing as a function is still the same but used in a different
container. So in advertising its products to consider things that can attract buyers.
Packaging is a complex subject that has become an important part of any promotional product,
although devoted to consumer products, and this can’t be separated from sales. Should be able
to distinguish between the packaging and the packaging, although both are often synonymous.
Packaging includes the whole concept including packaging directly, outside, wrapping and
others, and part of that whole role in the marketing and display. A good package will not sell

The Fourth International Conference on Entrepreneurship | Book Three
91
any product if the packaging concept is not appropriate, and also will not sell a bad product. A
poor packaging could give a bad image of the product which is very good, however well
thought up the concept of packaging (Danger, 1992: 3).
Packaging linking promotional support provided by the manufacture shelf space laid out by the
retailer, and the needs and desires of last buyer (Danger, 1992: 4).
Online marketing is also walking regardless of the delivery of goods, as we know that the online
buyer can from outside the region or even from abroad. This makes the shipping of goods is one
thing to note by online entrepreneurs. When in the store businessman adequately prepare
conventional plastic or paper bags to carry their products. It will be very different when the
product needs to be packaged for delivery, it is also given that it is associated with other parties,
namely freight forwarder.
Courier services not only bring our products just so that entrepreneurs need to think about
how the product packaging to avoid damage when up purposes. Moreover, handicraft products
are especially vulnerable so need a lot of rethinking packaging. It is as expressed in the
following interview excerpt:
"... I once got an order from Jakarta for a recycled plastic wallet for Rp 50.000,00.
Customers usually ask to be sent using heavy but this can damage the product, I explain
better using the volume (cardboard) so that the product is not damaged but the postage
becomes more expensive it turns them down and not so buy.... "(Mrs. Kayubi, July 21st,
2016).
As experienced by Ms. Kayubi, postage because packaging can make customers
discouraged buying. Mrs. Retno Made bags from Sack Cement vulnerable when packaged
plastic and isolated to avoid package packing volume, this gives rise to high postage due if
heavy wear it is possible to damage the product, whereas if the packaging using cardboard than
the postage used are volume becomes more expensive. This is expressed in the following
interview excerpt:
"... .. I once got an order of one bag and the customer asked to be packed with a box
because it is expected to be weighed not volume considering the box is not too big, but it
turns out to reach the expedition place is subject to volume. After reconfirming the
customer objection and not so buy. "(Mrs. Retno, July 23rd, 2016).
Asked about the package delivery, Dea explainedin the following interview excerpt:
".....If the pillow heavily hits, the pillow I packing use isolation let me compress and not
get the volume, if the person he bought the two packing is not separated so hit 2 kg, if the
taxable volume is expensive. Customers do not want to usually get 2 kg...... "(Dea,
August 6th, 2016).
Ervira from the beginning has been to prepare packing boxes for his scrapbook products,
it is linked also to store the product itself. So for packing sent then ervira wrap it with brown
paper explained in the following interview excerpt:
".....My scrapbook box plastic safety continue I love the box so let the buyer is not
confused to save it because scrapbook like a photo album, well if you want in the package
I add brown paper to the outside ... .. "(Ervira, August 5th, 2016)
Judging from interviews on appearance that packaging for packets need attention. Dea
around the packaging with sealing up small form because their products are less susceptible
cushion the damage then this can be done. Unlike the recycled products Mrs. Kayubi dan Mrs.
Retno which there are some that can be made of plastic packaging, but there should be packing

The Fourth International Conference on Entrepreneurship | Book Three
92
boxes. And it is difficult for employers. Ervira better prepared in packaging by providing a box
in addition to keeping the product also to facilitate the delivery packaging.
As is understood that the existence of accounting is very useful for SMEs, as it is a tool that can
help business decision-making. In addition, it is also useful accounting information in order to
construct a variety of projections, such as projections of cash needs in the future, control costs,
measure and improve productivity and provide support to the production process.
An attempt can’t be separated from the activities of sales and out of money. In addition to the
products delivered, online sales also use banking services in terms of payment for the sale of
products. Mothers craft entrepreneurs have not been doing financial records related to revenue
from sales and expenses during the production process until the product is sold. Dea itself as an
engineering student was completely unaware that he had no basic bookkeeping as expressed:
"... .If I still need to manage financial finance is the same as learning bookkeeping is good,
the same entry flows out because there is no basic there...." (Dea , August 6th, 2016).
The ability associated with the financial statements are often considered trivial by SMEs,
without realizing that by having a financial report many benefits they get. By having their
financial statements to determine its profits. Financial Statements can also be used as evidence
to apply for a loan if employers need additional capital.
When asked about the employer’s concerned many companies or parties who make frequent
service training in order to improve their business competitiveness This he expressed in the
following interview excerpt:
"... Usually many people who do training on online marketing in general only.... "(Mrs.
Kayubi, July 21, 2016).
While Mrs.Tris as collecting flowers from recycled paper reveals:
"... . If in Jambangan this yesterday we made the training of recycled goods making, but if
the marketing of our own, the friends gathered to me and my husband who takes care of
his web... .."( Mrs. Tris, July 26, 2016)
Asked about online marketing training related to the complaints by employers on display
products and packaging to delivery. This is expressed in the following interview excerpt:
"... Not there we never asked, any training we just follow...."(Mrs. Retno, July 23, 2016)
What about the training on financial statements that are often a part of the training. This he
expressed in the following interview excerpt:
"... It's a lot of theory I do not have time to do it... .."(Mrs. Tris, July 21, 2016)
Training in accounting will determine how well the ability of a manager to the technical mastery
of accounting. The more a manager of accounting training, the better the ability of the managers
to use accounting information, (Hadiyahfitriyah, 2006).
Results of interviews with female entrepreneurs fields of creative industry, it appears that the
resulting product is a form of its intention. Recycling entrepreneur can create a wide range of
products from scrap materials that may not think by others. In addition to reducing the amount
of waste that is not biodegradable, the craft can replace the function of the product. Bags of
cement paper, for example has the power to bring the goods without fear of tearing. Plastic
packaging can look beautiful with woven into a variety of versatile wallet. Plastic bottles can be
transformed into ornaments to beautify the room. Beautiful pillows that can be more personal

The Fourth International Conference on Entrepreneurship | Book Three
93
items for the owner. Creativity stick to make a scrapbook is the result of the wills of skilled
hands that display the photos to appear more beautiful and meaningful. While the characters
into the pillow cushions, more personalized, unique because not all have it.
With their online marketing opens wide opportunities for entrepreneurs who have products to
market extensively. The photos represent products sold need to be considered for one picture
speaks more than a thousand words. While the use of delivery services have consequences for
how employers can package products to be intact arrived at the destination. Lastly, employers
need to evaluate its performance by looking at the existing financial statements. Because of the
financial statements can be viewed ahead of a business.
CONCLUSION
Good online marketing using blogs, web and social media brings a great opportunity for
entrepreneurs to market their products. Surabaya as a trade city a consequence the number of
companies operating in Surabaya. This provides an opportunity for the citizens of Surabaya to
obtain various kinds of training that run from the companies or agencies.
Activity increased competence to enhance the economic competitiveness of Surabaya citizens,
especially women is necessary because 60 percent of businesses run by women. But there must
be responsive education and training in accordance with the need to support improving the
quality of entrepreneurship. Therefore both companies and agencies who want to do the training
needed to figure out what kind of training requirements needed by entrepreneurs.
This study is confined to the training needs of SMEs excavation creative industries woman in
Surabaya and do the marketing through online. SME creative industry has to prove its existence
and needed support related training photographer, packaging and simple finance to improve
their competitiveness.
Future studies could explain how the contribution-based training needs in order to develop
SMEs in rail. This study is expected to contribute to their development of creative industry
which jointly suppots the national economy and the environment.
REFERENCES
A., NS, Rahmat, AN, & Sukarn, PA (2016, March 7). Kala Bank Sampah Membangkitkan
Ekonomi Daerah. Bisnis Indonesia. Retrieved from
http://industri.bisnis.com/read/20160307/87/526022/kala-bank-sampah-membangkitkan-
ekonomi-daerah
Becherer, RC, Halstead, D., & Haynes, P. (2003). Marketing orientation in SMEs: effects of the
internal environment. New England Journal of Entrepreneurship, 6(1), 13–22.
Brodie, R., Coviello, N., &Winklhofer, H. (2008). Contemporary marketing practices research
program: a review of the first decade. Journal of Business & Industrial Marketing, 23(2),
84–94.
Coviello, N., Brodie, R., Danaher, P., & Johnston, W. (2002). How firms relate to their markets:
an empirical examination of contemporary marketing practices. Journal of Marketing,
66(3), 33–46.
Coviello, N., Milley, R., &Marcolin, B. (2001). Understanding IT-enabled interactivity in
contemporary marketing. Journal of Interactive Marketing, 15(4), 18–33.
Danger, EP 1992. Memilih Warna Kemasan, PT. PustakaBinamanPressindo, Jakarta.
Damanpour, F. (2001). E-business e-commerce evolution: perspective and strategy. Managerial
Finance, 27(7), 16–33.
Galloway, L., &Mochrie, R. (2005). The use of ICT in rural firms: a policy orientated literature
review. Info, 7(3), 33–46.

The Fourth International Conference on Entrepreneurship | Book Three
94
Hadiyahfitriyah (2006). "Analisis faktor-faktor yang Mempengaruhi Penggunaan Informasi
Akutansi Pada Usaha Kecil dan Menengah". Universitas Negeri Jakarta. Thesis Magister
dipublikasikan.
Iacovou, C., Benbasat, I., & Dexter, A. (1995). Electronic data interchange and small
organizations: adoption and impact of technology. IS Quarterly, 19(4), 465–485.
Ipank. (2016). Berwisata di Lingkungan Sehat Kampung Wisata Jambangan Surabaya.
Retrieved from http://surabaya.panduanwisata.id/wisata-alam/berwisata-di-lingkungan-
sehat-kampung-wisata-jambangan-surabaya/
Kessler, C. (2007). Where were you when YouTube was born? Journal of Brand Management,
14(3), 207–210.
Kim, BJ, Jun, T., Kim, JY, & Choi, MY (2005). Network marketing on a small-world network.
Physica A, 360(2), 493–504.
LPPI, & Indonesia, B. (2015). ProfilBisnis Usaha Mikro, Kecil Dan Menengah (Umkm).
McCartan-Quinn, D., & Carson, D. (2003). Issues which impact upon marketing in the small
firm. Small Business Economics, 21(2), 201–213.
Morissan. 2010.
Perikalanan:KomunikasiPemasaranTerpaduCetakanPertama.Jakarta :KencanaPrenada
Media Group
Pavic, S., Koh, S., Simpson, M., &Padmore, J. (2007). Could e-business create a competitive
advantage in UK SMEs? Benchmarking: An International Journal, 14(3), 320–35.
Pedrood, N., Ahmadi, H., &Charafeddine, HA (2008). Systematic profitability analysis of
binary network marketing organizations. Direct Marketing: An International Journal,
2(2), 81–96. http://doi.org/http://dx.doi.org/10.1108/17505930810881743
Pollard, C., & Hayne, S. (1998). The changing face of information system issues in small firms.
International Small Business Journal, 16(3), 70–87.
Rangkuti, F 2009, Strategi Promosi Yang Kreatif : Analisis Kasus Integrated Marketing
Communication, Gramedia Pustaka Utama, Jakarta.
Singh, R., Garg, S., &Deshmukh, S. (2008). Strategy development by SMEs for
competitiveness: a review. Benchmarking, 15(5), 525–547.
Trisflower.com. (2016). Trisflower. Retrieved from www.trisflower.com
Walter, JC (2001). Presentations of an e-commerce business opportunity. University of Iowa.
Zalud, B. (1999). E-commerce obstacles, solutions for small businesses. Security DistrMrs.ting
and Marketing, January.

The Fourth International Conference on Entrepreneurship | Book Three
95
CHANGE MANAGEMENT: AN ISLAMICS PERSPECTIVE
1Hafid Kholidi Hadi, 2Anik Lestari A
Universitas Negeri Surabaya
INDONESIA
Emails: [email protected], [email protected]
ABSTRACT
This paper attempts to review the literature on the Islamic values and
change management, then presents the importance of its delineated
dimensions. Two main theories of Islamic perspective and practices are
discussed comprehensively based on the Qur’an verses as the ultimate
source in Islamic thinking. The review includes the comparison between
certain components’ implementations. This reveals that each of
dimensions are clearly change management. It suggests that Islamic
emphasizes on commercial activities which denied the authors’ opinions
on its’ teaching for not governing the materials aspect or success in
change management. The Islamic religion seeks to deliver the goodness
to all mankind according to its rules and principles. The integrated
system of the Islamic worldview encompasses all aspects of both worldly
and hereafter- including the aspect of change management. The
researcher have three part Islamic for change management such as
human, development and change. We need other Islamic perspective for
change management that can add many reference for other researcher
Keywords: Islamic values, Islamic practice and change management
INTRODUCTION
"There is nothing eternal in the world except the change itself". This is an ever-changing
analogue of the world. The theory of change has actually been discovered by Darwin with his
theory of evolution. Darwin's revelation associated with the theory of evolution "survival in the
fittest" is related to something that is adaptable. Darwin's claims relate to the living beings of
the world that can survive that are compatible with the state of nature. In other words, Darwin's
theory is related to natural selection. This theory can help each other and no few companies
can’t change with existing conditions it will fall by itself
Companies can’t adapt to the environment then the company is heading for destruction. We can
see some companies are destroyed because they can’t adjust to the state of the market. Examples
of companies destroyed because they can’t adapt to the environment. First Nokia, this company
has become the king of mobile phone companies in the world. Nokia phones are excellent in the
hearts of consumers around the world. But since the existence of smart phones, Nokia did not
quickly catch the changes that are in the market. The second example of Blackberry to be a
pioneer of Smartphone, but lost to compete with the late Samsung lost also in the market.
Samsung used to be scorned by Sony but now Samsung has left Sony. Another example that
exists in Indonesia and still warm in our minds, how minimarket Seven Eleven that must close
and lift the foot from Indonesia because it can not compete with other competitors.
Examples of companies that are destroyed by change can explain the importance of a change. In
other words, we are required to adapt to the environment, otherwise we will be crushed by the

The Fourth International Conference on Entrepreneurship | Book Three
96
change. This is in accordance with Darwin's theory of natural selection. After studying the case
of a falling company because it can’t adapt to the environment and its relationship with
Darwin's natural selection toe. The question is why should we change?
Change Management
According to kasali (2010) First, change is a sign of life. We used to be a baby who really need
the help of others, then after growing up we begin to reduce dependence with others. Similarly,
companies and products that have life cycles such as living beings are born, developed, old and
died. It is like the life cycle of a product such as introduction, growth, mature and decline. Many
companies enters the introduction period then immediately decline because it can’t be accepted
by the market.
Second, change gives hope. Any change will give hope. We feel every turn of the Country
leader there is hope for the better. But basically every change is not all changes give the
appropriate expectations.
Figure 1. Sigmoid Curve
When viewed figure 1 , that a company will grow and then fall down in the phase of maturity.
Therefore, they should make changes to their developing. Examples of companies do not make
changes when changing as developed by Nokia that does not directly respond to the existence of
a smartphone. Therefore, they have to pay dearly by far behind by its competitors. Companies
that do not want to change because they feel comfortable with the situation that is facing
develop and then they are lulled.
According to Kotter (2002) the reluctance to change is influenced by the first, satisfied with the
performance of the company. Second, do not want to move or stop in place and protect
themselves do not want to receive input from others. It could be because they are panicking and
fearful of a change. Third, pessimistic for fear of change then many companies that do not make
changes.
Change management in islamics perspective
Human The Islamic context in the management of change originated from the creation of man. Man was
created by Allah SWT as a perfect being. This is also evidenced by Darwin's theory of natural
selection. Man is a creature created by Allah SWT is the most adative to change. Humans can
survive to this day because it is adative to the environment. This different from the large and
powerful dinosaurs but in fact they can’t survive until now.
According to Majid (2003) the natural basic law of all that exists is "change and development",
for: all these things are God's creation and development by Him in an unrelenting process. This
revelation explains that human beings are created to continue to evolve and change. Both of

The Fourth International Conference on Entrepreneurship | Book Three
97
these things have become human nature created by Allah SWT. In addition, human beings are
created to constantly evolve and grow in a better direction.
According to Al Qur’an, S. Al Qashash (XXVIII); 20 “ a man came from the uttermost part of
the city, running. He said: O Moses! Lo! the chiefs take counsel against thee to slay thee;
therefor escape. Lo! I am of those who give thee good advice”. This Qur'anic doctrine explains
that we are asked to grow and develop ourselves for the better. Basically a human born to the
dead is developing and a sign of a life
Development Based on Al-Mujadila 58:11 “O ye who believe! when it is said unto you, Make room! in
assemblies, then make room; Allah will make way for you (hereafter). And when it is said, Come
up higher! go up higher; Allah will exalt those who believe among you, and those who have
knowledge, to high ranks. Allah is Informed of what ye do”. In verse has given doctrine about
capacity building. We are encouraged to increase the scientific capacity and skill that we
possess wherever we are. This is in accordance with the opinion of Rafiki and Wahab (2014)
about the concept of self-development that is in the Qur'an.
Rasullah SAW said: "Demanding knowledge is a duty for every Muslim man and woman".
Allah gives virtue and glory to those who are knowledgeable in His word in Al-Qur`an Surah
Al-Mujaadilah verse 11: "Allah will exalt those who believe among you and those who are given
knowledge of some degree". Hadith and verse al qur'an above shows that we are required to
study or in other words increase our capacity in order to develop for the better.
“But (as for) those who believe and do good works – We tax not any soul beyond its scope –
Such are rightful owners of the Garden. They abide therein”(al A’raf: 42). In this verse we are
asked to run the worship is no longer a duty or burden but a willingness or a requirement. This
is also in accordance with what has been delivered Rafiki and Wahab (2014) about continous
improvement in the concept of al qur'an.
Change management in Islamic Human and development are two very related things. In accordance with the characteristics of
change according to kasali (2010) that the nature of change is due to the sign of a life. Therefore,
after we discuss and develop then we will then discuss the nature of change in the Qur'an and
hadith.
The first verse QS Al-Anfal [8]: verse 53 “That is because Allah never changeth the grace He
hath bestowed on any people until they first change that which is in their hearts, and (that is)
because Allah is Hearer, Knower” .This verse describes a pleasures given by Allah SWT. If we
change the favor then God will not change the favor. This corresponds to a sigmoid curve that
explains if we do not change at the time the company is growing, then we will reach the level of
maturity. Thus the sigmoid curve suggests making changes as we progress
Problems about the changes in accordance with Al Qur’an Surah Ar-rad verse 11 ” For him are
angels ranged before him and behind him, who guard him by Allah’s command. Lo! Allah
changeth not the condition of a folk until they (first) change that which is in their hearts; and if
Allah willeth misfortune for a folk there is none that can repel it, nor have they a defender
beside Him. This verse explains if we change, then we will be crushed by the change”. In
accordance with the sigmoid curve that explains after the company develops then the next level
is maturity. At this level the company must make changes (or jump to the second curve)
otherwise it will lead to the gate of destruction. In accordance with the doctrine above, that God
will not change a people if the people do not change. Just as with the company, if the company
does not want to change it will lead to the gate of destruction.
"Whoever his day (today) is better than before, then he has been lucky, whoever his day as
before, then he has lost, and whoever is more ugly than ever, then he is classified as the cursed"
(alhadith) "Whoever is two days (today and yesterday) the same then he has lost, anyone who
day is worse than the previous day then he was classified as the cursed". The origin of this

The Fourth International Conference on Entrepreneurship | Book Three
98
hadith is unknown except in the dream of 'Abd' aziz Bin Abi rawaad, he says "The Prophet had
a will to me in a dream, with the added word at the end" (HR al-baihaqy), possibly the
additional contents are " Then he is in need.
In the above hadith explained that the Prophet invites us to be better every day from time to time.
It aims to improve our ability and capacity in life. In addition, to face a changing world, we are
required to improve ourselves every day. Nothing is eternal except change itself, and therefore
we have to improve every day, month and year in order not to be crushed by such changes.
Tabel 1. The Al-Qur’an reference of Islamic change management
NO Subject Al-Qur’an Verses
1 Human Al Qashash (XXVIII); 20, an-nas,
2. Development Al-Mujadila 58:11, hadist
3. Change management Ar-rad ayat 11, Al-Anfal [8]: ayat 53
CONCLUSION
Figure 2. Change Management in Islamic
Management of change in Islamic perspective consists of 3 parts of human, development and
change. This corresponds to the sigmoid curve present above. Companies are required to make
changes as the company develops. It corresponds to the doctrine of the Qur'an and hadith.
Therefore, the management of change in the perspective of Islam is in accordance with the
teachings of Islam. We hope there are other authors who provide a new reference to change
management in an Islamic perspective.
REFERENCES
Al Hadits
Al Qur’an
Kasali, Rhenald (2010), “Change!: Manajemen Perubahan dan Manajemen Harapan”, Gramedia
Pustaka Utama.
HUMAN CHANGE DEVELOPMENT
Al Qashash Al-Mujadila Ar-rad
CHANGE MANAGEMENT
IN ISLAM

The Fourth International Conference on Entrepreneurship | Book Three
99
Kotter, John P & Cohen, Dan S (2002), The heart of change : real-life stories of how people
change their organizations. Boston: Harvard business Press
Majid, Nurcholis (2003), Islam Doktrin dan peradaban: Sebuah telaah kritis terhadap masalah
keimanan, kemanusiaan dan kemodernan. Jakarta: Paramadina Press.
Rafiki dan Wahab (2014) Islamic Values and Principles in the Organization: A Review of
Literature Asian. Published by Canadia n Center of Science and Education.Social
Science; Vol. 10, No. 9; 2014ISSN 1911-2017 E-ISSN 1911-2025

The Fourth International Conference on Entrepreneurship | Book Three
100
THE INFLUENCE OF LEADERSHIP, MOTIVATION, AND
DISCIPLINE ON EMPLOYEES’ PERFORMANCE
PT. LMA
1Yenny Kartika Halim, 2Trianggoro Wiradinata♠
Ciputra University Surabaya
INDONESIA
Email: [email protected]
ABSTRACT
This study aims to analyze and prove the influence of leadership,
motivation and discipline on employees’ performance. This study
provides some recommendations on how to improve employees’
performance. The study was conducted at PT. LMA Surabaya 2017. Data
were collected through questionnaires and distributed to 60 people. This
study used a quantitative method with Likert scale measurement. The
data were analysed using SPSS program. Improved leadership qaulities,
motivation and discipline would improve employees’ performance
outcomes. The results of this study produce recommendations for future
job improvements related to leadership, motivation, discipline, and
employee performance.
Keywords: leadership, motivation, discipline, performance and employee
performance
INTRODUCTION
In Indonesia, a family business is one of the biggest business opportunities. A lot of
entrepreneurs in Indonesia hold principles of a family business. Family business is one of the
most consistent and flexible businesses that are subject to change and adapt to very fast and
uncertain economic growth. "For the first time, US-based audit firm Price Waterhouse Cooper
(PwC) conducted a survey on family business in Indonesia. From the survey, more than 95
percent of companies in Indonesia are family businesses "(CNN Indonesia, 2014). From the
results of PwC family business audit is a very dominant business in Indonesia.
PT. LMA is a family business owned by one owner and his children. PT. LMA is a stockist
business and engineering good distribution. It has been run for more than 30 years. At the
beginning of its establishment, this company only sold spare parts for travos and inverters. After
several years, PT. LMA has expanded its business by moving in the field of techniques such as
"Generator, Compressor, Hoses, Water Pump and others".
The company realized the importance of making some changes. However, the management of
the company did not know how to do and change. The writer got permission from the owner of
the company to do a research. PT. LMA had a lot of problems that needed to be solved. In this
study, the existing problems of the company will be discussed, covering the style of leadership,
motivation, discipline, and employee performance.
The style of leadership at PT LMA was authoritarian despite the fact that other companies have
changed their leadership styles from being conventional to being professional. Although PT.

The Fourth International Conference on Entrepreneurship | Book Three
101
LMA has already had some professionals, all decisions were taken by the owner. The
authoritarian leadership made employees reluctant to give feedback to superiors. In this research,
the writer is seeking some strategies that help the company make some improvement.
PT. LMA never gave rewards to motivate the employees. While the programs have not been
well prepared employes had no challenge to improve the performance of PT.LMA. Punishment
and reward stretegies have never been employed that enable employees to reflect upon their
performance.
Having good discipline work ethos in business is very important. However, when inconsistency
takes place, employees will feel difficult to provide good performace at work. PT. LMA has
long experience the shortage of discipline. It is due to a lack of firmness from the head of the
department at the company. For example, they were often late to come to work. They even
missed their work hours.
Table 1.1 below describes a three-month absence from PT. LMA. This table shows the
attendance of all employees every month
Table 1. Employee Attendance at PT. LMA 2016
Month Enter Permission/Miss Late Go Around
June 1,221 (78%) 230 (15%) 85 (5%) 24 (2%)
July 980 (82%) 130 (11%) 70 (6%) 20 (1%)
AUgust 1,256 (80%) 200 (13%) 80 (5%) 24 (2%)
Source: Employee Attendance Card (2016), (day/month)
Authoritarian and inflexible leadership styles, lack of motivation, and work discipline are
problemes at PT. LMA. This company is committed to change the existing system to make the
performance of employees and leaders better.
LITERATURE REVIEW
Leadership
Leadership is a factor or process of giving direction by leaders to followers in an effort to
achieve success. Without effective leadership, individuals and groups tend to have no direction,
no complacency and less motivation.
According to Judge (2007) in Mappamiring (2015) leadership can be explained by concepts like
this "Leadership is a force that flows in unknown ways among leaders with their followers,
encouraging followers regularly to gather energy into formulated targets together. Working
towards goals and achievements gives satisfaction to leaders and their followers. "
According to Sarros and Butchatsky (2007) in Sari (2014), leadership is a behavior with a
specific purpose to influence group members’ activities in order to achieve common goals to
benefit individuals and organizations
Motivation
According to Herzberg (1966) in Juniantara (2015) motivation is divided into two factors:
motivators or often referred to as intrinsic motivation and hygiene factor or often called
extrinsic motivation. Motivator is a factor that comes from within oneself. It is a desire to move
forward and achieve. Hygiene factors prevent dissatisfaction. These factors do not lead to
satisfaction and they are usually derived from company’s policy.
Herzberg (1996) explains two factors of motivation. There are 9 indicators that make upp these
two factors.
A. Intrinsic Motivation
Intrinsic motivation is the motivation that exists within oneself. This motivation drives one to
excel and desires to get something better than before. Intrinsic motivation is better known as

The Fourth International Conference on Entrepreneurship | Book Three
102
motivational factor. According to Herzberg (1996) in Juniantara (2015), there are four
motivational indicators:
1. Achievement (Achievement work) is the success of an employee in completing tasks.
2. Advancement (self-development) is a person’s desire to develop a career in the field of
finance.
3. Work itself (job itself) is a variation of work and control over methods and work steps.
4. Recognition means the employee gains recognition from the company that gives rewards or
praises because of achievements.
B. Extrinsic Motivation
Extrinsic motivation is a motivation that comes from outside people. This factor helps people
determine theur behavior in life. This factor is known as as hygiene factor theory. Herzberg
(1966) in Hong and Waheed (2011) has classified five indicators of hygiene factors:
5. Company policy (corporate policy) is a rule established by the company as a management
guidance to carry out activities
6. Relationship with peers (relationship with colleagues) is communication between employees
in completing tasks.
7. Work security (job security) is the employee's individual perception of employees’ variability
in terms of reward values, regional mutation, opportunities of termination of relationship.
8. Relationship with supervisor (Relationship with superiors) is a major element of employees’
job satisfaction.
9. Salaries are financial rewards earned by employees including wages, bonus premiums, and
benefits.
Discipline
Discipline is based on people’s desire to do good and right work. Being disciplined also refers
to people’s attitude, behavior and willingness to do things in accordance with written or
unwritten rules.
Discipline in work can be interpreted as follows: "The awareness and willingness of a person is
to comply with all corporates’ rules and social norms." Hasibuan (2002) in Evanita (2013)
Consciousness is a voluntary attitude of a person to obey all rules or order while they are aware
of their tasks and responsibilities. Willingness is people’s act, attitude, and behavior which are
in accordance with companies’ written or unwritten rules.
Employees’ performance
Performance is an end result of a job people do. The result can be either good or bad. Good
results show good performance. According to Maharjan (2012) in Juniantara (2015)
performance is a result driven by motivation or satisfaction towards work people do.
Anwar King Mangkunegara (2009: 67) argues that: "Performance is related to quality and
quantity of work achieved by employees in performing their duties according to with their
responsibilities".
Sedarmayanti (2011: 260) states that: "Performance is a translation of meaningful performance,
work of a worker, a management process or an organization as a whole where people have to
show through evidence, and their work is measurable (compared with the prevailing standard). "
Research Hypothesis
The hypotheses of the present study are as follows:
H1: leadership has a positive and significant effect on employee’s performance.
H2: Motivation has a positive and significant effect on employee’s performance.
H3: Discipline has a positive and significant effect on employee’s performance.

The Fourth International Conference on Entrepreneurship | Book Three
103
Figure 1. Research Model
RESEARCH METHODS
Research design
This research was designed to investigate the relationship of some variables. Researchers used a
quantitative research method. The data were gathered through questionnaires. The variables
included leadership style, motivation, discipline and employee performance. These variables are
described in accordance with their respective indicators.
Variable Research
This study examines the relationship between three variables:
1. Exogenous variables (free) are variables that affect other variables. There are three exogenous
variables in this research: leadership (X1), motivation (X2) and discipline (X3).
2. Endogenous variable (bound) is a variable influenced by other variables such as employee
performance (Y).
Population and Sample
The population of the present study involve sixty employees of PT. LMA. The sample size was
determined using Slovin formula: Sampling method used was Saturated Sampling. This
sampling technique was used in this study because the numbers of employees were too few than
the overall employee population. All employees were included in the samples.
Data Type
The data of this study were quantitative data. The data were analyzed using multiple linear
regression statistics. According Sugiyono, a quantitative research method can be interpreted as a
research method based on positivism philosophy. This method was used to examine the
population or particular samples. The samples were selected randomly. Statistical computation
was employed to test the hypothesis (Sugiyono, 2012: 7).
Data Gathering Techniques
The data were gathered using questionnaires. This data gathering method was chosen since it
was cheap and very practical to obtain the data. Moreover, the data collection could be directly
done in the research sites. The question scores in the questionnaire were rated using Likert scale.
FINDINGS AND DISCUSSION
The Description of Respondent's Characteristics
The characteristics of respondents is a description of the existence of respondents involved in
research in terms of age, gender, level of investigation, and years of service. Sixty sampleshave
(Y)
PERFORMANCE
(X1)
LEADERSHIP
(X2)
MOTIVATION
(X3)
DISCIPLINE
H1
H2
H3

The Fourth International Conference on Entrepreneurship | Book Three
104
returned the questionnaires. These four characteristics had played important roles in the present
study.
The characteristics of respondents of this study are as follows:
1) Age of respondent, <20 years old consisted of 2 people (3.33%); 20-25 years consisted of 16
people (26.67%), 26-30 years consisted of 6 people or 10%; 31-40 years consisted of 20 persons
(33.33%); and> 40 years consisted of 16 people (26.67%).
2) In terms of gender, there were 39 men (65%) and 21 women (35%).
3) In terms of education level, 23 people graduated from the elementary schools (38.33%), 4
people with Junior High diplomas (6.67), 31 people with senior high school diploma (51.67%),
and 2 people with undergraduate degree (3.33%).
4) In terms of work p of employment, 7 people has worked for <1 year (11.67%), 22 people
have worked for <5 years (36.67%), 8 people have worked for <10 years (13.33%) and 23
people have worked for > 10 years (38.33%)
Description of Respondents' Perception towards Variables X1, X2, X3 and Y
Validity Test (Pearson Correlation)
Table 2. Validity Test Result (Pearson Correlation)
No. Simbol Research Variables Mean Categori
1 X1 Leadership 4.601 High
2 X2 Motivation 4.092 High
3 X3 Discipline 4.015 High
4 Y Staff’s Performance 3.858 Good
The analysis test on leadership variable (X1), motivation (X2), discipline (X3) and
employee performance (Y), showed significant correlation: Pearson correlation for each
indicator is smaller than 0.05. Therefore, it is concluded that all indicators are valid.
Reliability Test (Alpha Cronbach's)
Table 3. Reliability Test Results (Alpha Cronbach's)
Reliability Statistics
Variables Alpha Cronbach’s N of Items Interpretation
Leadership (X1) 0.843 9 Reliable
Motivation (X2) 0.761 8 Reliable
Disc(X3) 0.742 10 Reliable
Staff’s Performance (Y) 0.704 6 Reliable
Table 3 shows the Cronbach's Alpha coefficient value for all variables in this study is
above the 0.70. The alpha value for each variable is 0.843, the motivation 0.761, the discipline
0.742 and the employee's performance 0.704. Viewed from the results of reliability test, it can
be concluded that measurement technique used is reliable.
Hypothesis Testing Results
Hypothesis 1: Leadership has no significant effect on employee’s performance.
Hypothesis 2: Motivation has a significant influence on employee’s performance.
Hypothesis 3: Discipline has no significant effect on employee’s performance.

The Fourth International Conference on Entrepreneurship | Book Three
105
DISCUSSION
The Influence of Leadership on Employee Performance
In this study leadership has no significant effect on employees’ performance. The results of this
study are not in accordance with the theory of leadership and performance. The mismatch with
the theory is due to the fact that the questionnaire has focused more on how leaders lead the
company. Table 5.5 shows the three lowest mean with values of x1.9 of 3,850; and x1.2 and
x1.7 respectively of 3,950. The mean is still below 4. These three indicators also have a high
standard deviation. It means that the opinions of respondents are quite varied (inconsistent).
Three questions have something in common that employees view that leaders have the shortage
of direction and approach towards employees.
Strategies currently employed by leaders and employees in the company are as follows:
• The leaders have conducted regular visits to each division in the company.
• The leaders have appointed division heads in every division. The owners and children of the
company owners have still taken all decisions for each division.
The results of this study are different from theories by experts such as Sarros and Butchatsky
(2007) in Sari (2014) and Judge (2007) in Mappamiring (2015).
Effect of Motivation on Employee Performance
In this study, motivation has a significant effect on employee performance. The results of this
study were in accordance with the theory of motivation and performance. Tt would be better to
drop two questions whose mean values are below number 4. These two questions were
concerning tasks and responsibilities; the employments’ relationship with superiors and
subordinates.
The company is running a program to raise employees’ motivation to have more sales. To
achive this goal, "Rewards and Punishment" program for the marketing division was conducted.
The company would provide rewards to employees whose sales are at or beyond a predefined
level. If they can do that, more rewards would be granted. Punishments would be given to those
who could not reach the target or whose sales were below the targets. This program has just
been run, and the company is still waiting for the desired result. For now, sales are rising
slightly, although it is still below the target set. The program was relatively new and employees
needed time to adjust the program.
The results of this study have supported several theories by experts: Uno (2007); Robins and
Judge (2007) in Juniantara (2015); (2010) within Sajangbati (2013); Gomes (2003: 171) in June
between (2015) and Herzberg (1996) in Juniantara (2015)
Effect of Discipline on Employee Performance
In this study, discipline has no significant effect on employee performance. The results of this
study are not in line with the theories of discipline and performance. The mismatch with the
theory is due to the fact that the questionnaire of the present study has focuses more on
individual self-assessed work. The researchers found the two lowest mean values of x3.4 and
x3.9 respectively of 3,900. This mean is still below 4. Both of these indicators also have a high
standard deviation, meaning the opinions of respondents are not consistent.
PT.LMA is currently preparing new job schedules such as delivery schedules. The current
delivery of goods has been irregular, and frequent shipping has not been effective.
To improve employees’ discipline in using and taking time, PT.LMA has condected three new
programs. They were a long-term program. The first program was that employees who never
come late and always come to work would be given a bonus in the form of money. It was called
bonus present. The present bonus money was a gift beyond the basic salary received and given
every 1 week. However, a number of employees often come late and even miss their office

The Fourth International Conference on Entrepreneurship | Book Three
106
hours. Therefore, sanction punishment needed to be implemented. Gor example, if they did not
come for 1 day, they would have their present bonus cut half (50%). Moreover, if they miss 2
working days, they would never get their bonus. The third program was that employees who
came late would never get compensated food money. These three programs were not the same
and run on their own.
The results of this study differ from the theories presented by experts as follows: Hasibuan
(2002) in Evanita (2013).
CONCLUSION
Based on the results of research and discussion, some conclusions are drawn:
1. Leadership does not have a significant effect on employees’ performance in PT.LMA.
Thuis finding is not in line with the theory of leadership and performance. The mismatch is
due to the facts that the questionnaire of the present study has focused more on how leaders
lead the company. In table 5.5 the researcher took the lowest mean value ie x1.9 of 3,850;
and x1.2 and x1.7 of 3,950 respectively. These means are still below 4. This indicates
leaders are demanded to learn about how know they have to pay attentions to their
employees.
2. Motivation has a significant influence on employees’ performance in PT.LMA. Thus
finding is in accordance with the theory of motivation and performance. The average result
of this variable is 4,092. The average value of each statement in this variable is very close
to the average value. A lot of respondents have given their agreement or strong agreement.
3. Discipline has no significant effect on employees’ performance in PT.LMA. This finding is
not in line with the theory of discipline and performance. The mismatch is due to the fact
that the questionnaire has focuses more on individual self-assessed work. The researchers
took two of the lowest mean values of 3 ie, x3.4 and x3.9, respectively, of 3,900 to do
deeper research. These results show that discipline in the company needs to be improved.
The respondents tend to give bias responses.
SUGGESTION
Based on the conclusions, several suggestions are provided for further studies:
1. It is necessary to develop further programs in order to improve motivation so that employees
can improve their performance in PT.LMA.
2. The programs in PT.LMA need to be analyzed further.
3. Although this study shows leadership and discipline are not significantly related to employee
casework, we learn that these two variables are actually very important to consider especially
when running companies. Involving more respondents can provide more optimal results in
futher studies.
4. It is highly recommended that next studies not only use questionnaires but also interviews
with employees.
5. Bringing opinions from outside the company will provide good input for research.
6. Suggestions for subsequent research is to develop and have more variables and involve more
respondents to produce more optimal results.
REFERENCES
Brahmasari, I. A., & Suprayetno, A. (2009). Pengaruh Motivasi Kerja, Kepemimpinan dan
Budaya Organisasi Terhadap Kepuasan Kerja Karyawan serta Dampaknya pada Kinerja
Perusahaan (Studi kasus pada PT. Pei Hai International Wiratama Indonesia).

The Fourth International Conference on Entrepreneurship | Book Three
107
Chang, S., & Lee, M. (2007). A Study on Relationship Among Leadership, Organizational
Culture, The Operation of Learning Organization and Employees' Job Satisfaction. The
Learning Organization, 14(2), 155-185. doi:10.1108/09696470710727014
Evanita, L. (2013). Disiplin Kerja, Gaya Kepemimpinan, Pelatihan dan Kinerja Karyawan di
RSUD Lubuk Sikaping.
Ghozali, I. (2011). Aplikasi Analisis Multivariate Dengan Program SPSS.
Indermun, V. (2013). Family-Owned Businesses : An Assessment of the Various Leadership
Styles and its Influence on Management Decision-Making. Singaporean Journal of
Business , Economics and Management Studies, 2(3), 63-72. doi:10.12816/0003862
Juniantara, I. W. (2015). Pengaruh Motivasi Dan Kepuasan Kerja Terhadap Kinerja Karyawan
Kopperasi Di Denpasar.
Ma'rufah, L., Tibrani, & Zamora, R. (n.d.). Pengaruh Disiplin Kerja Dan Kepuasan Kerja
Terhadap Kinerja Karyawan Pada PT. Loe Utama Motor Batam.
MSi, M. P. (2015). Effect of Cultural Organization, Leadership and Motivation of Work on the
Performance of Employees (Studies in Islamic Banking in Makassar). IJARBSS, 5(12).
doi:10.6007/ijarbss/v5-i12/1940
Muogbo U .S., M. U. (2013). The Impact of Strategic Management on Organisational Growth
and Development (A Study of Selected Manufacturing Firms in Anambra State). IOSR
Journal of Business and Management, 7(1), 24-32. doi:10.9790/487x-0712432
Muogbo, U. S. (2013). The Impact of Employee Motivation On Organisational Performance (A
Study Of Some Selected Firms In Anambra State Nigeria). The International Journal
Of Engineering And Science (IJES), 2(7), 70-80.
Nugroho Arianto, D. A. (2013). Pengaruh kedisiplinan, lingkungan kerja dan budaya kerja
terhadap kinerja tenaga pengajar. Jurnal Economia, 9(2), 191-200.
Rahmawati, P. (2012). Analisis Kinerja Pegawai Kantor Dinas Kesehatan Kabupaten Bintan
Provinsi Kepulauan Riau Tahun 2012.
S. Sajangbati, I. A. (2013). Motivasi, Disiplin, Dan Kepuasan Pengaruhnya Terhadap Kinerja
Pegawai PT. Pos Indonesia (Persero) Cabang Bitung, 1(4), 667-678.
Sari, Y. K. (2014). Pengaruh Kepemimpinan, Motivasi Dan Disiplin Kerja Terhadap Kinerja
Karyawan Pada PT. Patra Komala Di Dumai. Jurnal Tepak Manajemen Bisnis, 6(2).
Sukmasari, H. (2011). Pengaruh Kepemimpinan, Motivasi, Intensif, Lingkungan Kerja, Dan
Kepuasan Kerja Terhadap Kinerja Pegawai Dinar Pengelolaan Keuangan Dan Aset
Daerah Kota Semarang.

The Fourth International Conference on Entrepreneurship | Book Three
108
Thamrin, H. M. (2012). The Influence of Transformational Leadership and Organizational
Commitment on Job Satisfaction and Employee Performance. International Journal of
Innovation, Management and Technology. doi:10.7763/ijimt.2012.v3.299
Tjahjono, H. K. (n.d.). Hubungan Budaya Organisasional, Keefektifan Organisasional Dan
Kepemimpinan: Telaah Perpektif Untuk Riset.
Wan Yusoff, W. F., Kian, T. S., & Mohamed Idris, M. T. (2013). Global journal of commerce
and management perspective. Herzberg's Two Factors Theory On Work Motivation:
Does Its Work For Todays Environment, 2(5), 18-22.

The Fourth International Conference on Entrepreneurship | Book Three
109
UTILIZATION OF WOOD CUTTING WASTE BACK TO
MATERIAL FURNITURE THROUGH SOCIAL
ENTREPRENEURSHIP APPROACH
1Senain, 2Farida Hanum
Abdurachman Saleh University
INDONESIA
Email: [email protected]
ABSTRACT
One of the excellent products from Situbondo regency is wooden
handicraft product so easy furniture business we meet. Waste wood
pieces are the remnants of wood pieces in the form of boards or
small pieces that can still be seen form. Wooden board consisting
of pieces of wood can be utilized into various objects used in the
interior of a room. In addition to adding functionality from waste
wood pieces, wooden waste board can also add aesthetic value on
an object. This is because the board has different characteristics
compared to ordinary wooden boards. Activities that have been
done include interior design training, interior making from waste
wood pieces, Business Management Training and Employee
Motivation Program on UKM Meubel Heni and UKM Meubel
Kyky. For 6 months the partners' activities are provided with
continuous facilitation and training to produce a table of waste
wood products and grow entrepreneurial spirit in all partners.
Keywords: Waste, meuebel, entrepreneurship
INTRODUCTION
UKM development needs to get great attention both from government and society in order to
grow more competitive with other economic actors. Future government policies need to be
made more conducive to the growth and development of UKM. Development of UKM through
business empowerment approach, need to pay attention to social and cultural aspects in each
region, considering small and medium enterprises in general grow from the community directly.
The government needs to improve its role in empowering SMEs in addition to developing
mutually beneficial business partnerships between large entrepreneurs and small entrepreneurs,
and improving the quality of their human resources (HR).
Small and medium enterprises that grow a lot in Situbondo area is handicraft industry.
Handicraft industry in Situbondo area among others; Batik handicrafts, earthenware handicrafts,
wooden handicrafts, leather industry, bamboo handicrafts, metal crafts, and various traditional
food industries.
One of the superior products of Situbondo district is wooden handicraft product. As a rural area,
the potential of Situbondo area is very supportive of the development of wood craft industry.
The development in timber processing and processing goes very fast, especially since Indonesia
has a tremendous wealth of various types of wood. Knowing the wood material with the purpose
of being used and utilized, is important for entrepreneurs engaged in timber industry, and other
wood users so that in the utilization of wood can be used properly and maximally so that there is

The Fourth International Conference on Entrepreneurship | Book Three
110
no waste of wood use and ultimately can reduce the impact Bad both to nature and to humans
who use it.
In the utilization of wood made by UKM Furniture, wood is widely used as the main material of
furniture making and as part of the foundation of the building. In making furniture for example,
the wood is processed into pieces of wood that is tailored to the form of furniture that will be
made. The remainder of the piece of wood is usually a piece of medium-sized wood and small
which in the end is only considered as waste is not useful and thrown away, then lead into
firewood and smoke will produce CO2 that can pollute the environment.
After the wood utilization process is completed, then other problems arise both in the
community itself and its utilization later in the Interior. The problem that arises in the
community is the lack of public knowledge about how to use waste wood pieces to be wasted
and can be a creative idea that is also useful. While in the Interior itself, the problem arises is
how waste wood pieces can be used properly to be part of the furniture and space forming
elements, so in addition to useful in terms of functions can also add to the beauty of the interior
itself.
The management process undertaken by UKM is still relatively simple. Managers play a double
role as business owners and designers. SMEs are also not yet have a neat bookkeeping so that
the record of good cash flow is not owned by both UKM. Owned capital comes from personal
capital and added from Bank loans. Bookkeeping is still very simple include only the
components of material purchases, employee salaries, and income from sales. UKM feel that
employee motivation needs to be improved, so it is very necessary motivation training for
employees. In addition, training opportunities that can be implemented include training to
cultivate entrepreneurial spirit, machine maintenance, business management, graphic design and
internet use as a marketing medium.
The purpose of this activity is to form UKM Mebeul in order to have a strong entrepreneurial
spirit and motivation by utilizing waste wood pieces into valuable interior products.
LITERATURE REVIEW
Social Entrepreneurship is a derivative term from entrepreneurship. A combination of two
words, social meaning social, and entrepreneurship which means entrepreneurship. Simple
understanding of Social Entrepreneur is someone who understands social problems and uses the
ability of entrepreneurship to make social change, especially covering welfare, education and
health (Santosa, 2007).
Social entrepreneurship is entrepreneurship devoted to the interests of society rather than simply
maximizing personal gain. Social entrepreneurship is commonly called 'community
development' or 'social purpose organization' (Tan, 2005: 1).
According to J. Gregory Dees, Professor of Social Entrepreneurship at Duke University who
says that social entrepreneurs are actors of social sector reform or revolution (education, health,
economic development, environment, art and so on). According to Bill Drayton, CEO and Chair
of Ashoka, social entrepreneurs are individuals who have innovative solutions to tackling social
problems by altering systems, delivering solutions and influencing people to make changes.
According to Muhamad Yunus, Founder of Grameen Bank, a social entrepreneur is an
innovative (economic or non-economic, profit-driven or non-profit) initiative to help the
community.
Forms of Social Entrepreneurship There are several forms of social entrepreneurship by Tan
(2005):
1. Community-based organizations; Such organizations are usually created to address certain
issues within the community (community groups), such as providing educational facilities for
poor children, social home for abandoned children etc.

The Fourth International Conference on Entrepreneurship | Book Three
111
2. Socially responsible enterprises; This social entrepreneur is in the form of a company
conducting a commercial business to support / finance its social enterprise. Some of the profits
earned from profit organizations are intended to support / finance their social enterprises.
3. Socio-economic or dualistic enterprises; This social entrepreneur is in the form of a
commercial company that runs its business on the basis of social principles. For example,
companies that do household waste recycling, organizations that employ disabled people, micro
credit for rural communities.
RESEARCH METHODS
Methods of implementing the activities of Wood Waste Disposal Become Furniture Materials
and Elements Forming Space In The Interior depicted in the following diagram in the form of
solutions offered to overcome the existing problems
Figure 1. Research Methods
RESULT AND DISCUSSION
Interior Design Training
This training activity was followed by partners from UKM Furniture Heni and UKM Kyebel
Furniture on February 19, 2017. Design drawings that are interesting and needed by consumers
are now used as training materials. In this activity the participants directly make the design
according to the idea and creativity of the participants with the accompaniment of the servant.

The Fourth International Conference on Entrepreneurship | Book Three
112
Participants follow this activity with great enthusiasm so that the target outsider understand the
participants / partners manifested well.
Making Interior Of Wood Waste Cut
Armed with training conducted on 19 February 2017, partners again given a direct
understanding of how to do the practice of making the interior of the design they created on
February 25, 2017. Interior made is a table of waste wood pieces.
Figure 2. The Process Of Making Table Of Wooden Waste
From this activity the output targets achieved in the form of products and the increased
understanding and skills of the partner community as shown in Figure 2
Figure 2. Table Making Process of Wood Cut Waste
Business Management Training
The management process undertaken by both UKM is still relatively simple. Managers play a
double role as business owners and designers. UKM are also not yet have a neat bookkeeping so
that the record of good cash flow is not owned by both UKM. The bookkeeping is very simple
including material purchasing components, employee salaries, and income from sales. Therefore,
it is necessary to reform the administrative system. Human resources owned by UKM Meubel
Heni is 5 employees, with educational qualifications of junior high school graduates, high
school / vocational school. While Meubel Kiki has 4 employees with educational qualifications

The Fourth International Conference on Entrepreneurship | Book Three
113
of high school / vocational graduates. On March 5, 2017, business management training was
conducted to improve the management of both partners in order to make the bookkeeping so
that the financial records can be well known by the owner.
Employee Motivation
Program Motivation is the energy and strength of a person who will arouse the level of
enthusiasm and perseverance in doing an activity or effort, whether coming from within
(internal motivation) or from outside the individual (external motivation). This motivation is the
task of a leader to make his subordinates or employees eager to do his duties. Work motivation
comes from the opportunity to move forward and develop, from the type of work, and the
feelings of pride themselves become part of a company or place a person is working. In addition,
work motivation is strongly influenced by a sense of security in work, income or a fair and
competitive salary, favorable working environment conditions, rewards and recognition of work
performance, as well as fair treatment of the leadership. (Anonymous.2017) The main target of
this training is the owner of UKM Furniture Kyky and UKM Furniture Heni. The activity was
carried out on April 2, 2017. The achievement is motivated employees to be more productive in
eliminating the product from wood waste waste so that the quantity target can be fulfilled and
the quality also accompanying by continuing to do the assistance to the employees to be
productive. Quantity and quality will also affect the motivation of employees because there will
be awards from the work in the form of wages and recognition of work performance.
CONCLUSION
Activities that have been done to date include interior design training, interior making from
waste wood pieces, Business Management Training and Employee Motivation Program runs
smoothly. During the 6 months of the activity has been obtained outcome according to the
planned target. Enthusiastic partners follow the activities so that the understanding and skills of
partner communities in processing waste wood pieces into quality products with sustainable
assistance through training that has been done.
REFERENCES
Anonim.2017. Cara dan Upaya Meningkatkan Motivasi Kerja Karyawan
https://pendaftaran-cpns.blogspot.co.id, diakses tanggal 01 Juli 2017
Anggriani, Swastika Dhesti,2011. pemanfaatan-kembali-limbah-potongan. http://ecointerior-
isi.blogspot.co.id. Diakses tanggal 15 April 2016
Fakhri,dkk. 2010. Pemanfaatan Sisa Potongan Kayu Olahan Untuk Produk Papan Lantai
Komposit. JURNAL APTEK Vol. 3 No. 1 Januari 2010
Purwanto,joko.2011. Pembuatan balok dan papan dari limbah industri kayuBoard and wood
block making from waste of wood industries. Jurnal Riset Industri Vol. V, No. 1, 2011,
Hal. 13-20
Ratniarsih,Ika dkk.2013. Pemanfaatan limbah potongan kayu jati
Untuk penyekat ruang non permanen. Simposium Nasional RAPI XII - 2013 FT UMS
Santosa, Setyanto.2007.”Peran Social Entrepreneurship dalam pembangunan”
Tan, Wee-Ling., Williams, John., dan Tan, Teck-Meng. (2005). ‘Defining the ‘Sosial’ in ‘Sosial
Entrepreneurship’: Altruism and Entrepreneurship’.International Entrepreneurship
and Management Journal 1, pp 353-365
Westra, I Made. 1993. Pengetahuan Bahan dan Alat Industri Kerajinan Kayu.Jakarta : Pusat
Perbukuan, Depdikbud.

The Fourth International Conference on Entrepreneurship | Book Three
114
INFLUENCE ANALYSIS OF MOTIVATION FACTORS WORK TO
WORK SATISFACTION IN LOW EDUCATION WORKERS AT
TANGGULANGIN’S SME IN SIDOARJO EAST JAVA
1Moch. Kalam Mollah
Department of Mining, Faculty of Minerals and Marine,
Institut of Technology AdhiTama Surabaya, East Java
INDONESIA
ABSTRACT
Currently manufacturing SMEs have a very rapid development and
competition is also getting tighter. The decisive factor of this business
excellence is human resources, so the improvement of employee
performance and motivation becomes a very important program in
SMEs. Every SME always wants to achieve a high level of productivity.
One way to achieve productivity is to provide jobs that match the
needs of the employees. This is done to increase work motivation and
simultaneously to improve employee's own job satisfaction. Thus, the
employee does not feel burdened with the tasks they carry and enjoy
the work they do so that the impact on the willingness and ability to
work so that indirectly impact on employee productivity.
In improving the quality of human and quality of work life which is
reflected in the improvement of job satisfaction needs to be done
continuously. Employee engagement and dedication are critical to
maintaining product consistency and product quality. The creation of
employee loyalty will ensure that employees are not discharged from
SMEs, decreased productivity and work strikes. Sidoarjo is a district
that has many SMEs with various types of businesses such as leather
processing for shoes, bags, wallets, jackets etc., SMEs in the field of
woodcraft, toys, accessories, and so on. Where SMEs are able to
dismiss the workforce of the majority of low educated elementary or
junior high school graduates. This research seeks to explore the
factors that motivate these SMEs in working to know the factors of
employee job satisfaction, thus can be used as a proposal for the
owners of SMEs to be able to formulate a strategy of good employee
management in order to obtain high work productivity.
Keywords: motivation, job satisfaction, SME, education, productivity
INTRODUCTION
Workers in SMEs Sidoarjo are generally employees with low level of education ie primary or
junior high school so that SME owners pay them with relatively low salaries (generally far
below the established minimum wage level). This often results in high employee turnover in
SMEs. Employees of SMEs expect salary or wages received not in accordance with
expectations will cause discontent for employees so that the motivation of work is also
decreased and generally employees out of the company to find a job that is better able to meet
his expectations. Every SME always wants to achieve a high level of productivity, the way it
does is to provide jobs that fit with the ability of employees.

The Fourth International Conference on Entrepreneurship | Book Three
115
Thus the employee will not feel burdened with the task and enjoy the job so that indirectly
increased productivity. Employee engagement and dedication are important in maintaining
product consistency and product quality. The creation of employee loyalty will ensure that
SMEs can grow and survive in a tight competition, and productive because they still have
competent human resources. With SMEs growing and growing, the economy in a region
becomes stronger because many workers are absorbed and the level of consumption increases.
LITERATURE REVIEW
Work Motivation
Motivation is a condition that encourages or causes a person to do an act or activity that takes
place consciously (Robbins, 2012). Management should be able to leverage others to achieve
organizational goals effectively and efficiently. Hezberg (1981) divides the motivation into two
parts namely the theory of motivator and hygiene. Motivational factors can also be referred to as
intrinsic fakor because these factors come from within the person concerned. The aspects of the
operational formation of the motivator factors are as follows: (1) achievement factors, (2)
recognition of success, (3) responsibility, (4) challenging work, (5) firms trying to create an
atmosphere for the design of a job to be more attractive , Varied and challenging (6)
development with organized training for skilled employees, opportunities to improve education
and training levels prior to promotion.
The aspects of hygiene factor formation are as follows: (1) unity and administration, (2)
supervision, (3) working environment, (4) employee relations, (5) wages and salaries.
The purpose of providing work motivation to SME employees themselves according to
Tambunan (2013), among others: (a) improve employee morale and job satisfaction; (b)
maintaining employee loyalty and stability; (c) encourage employee enthusiasm and morale; (d)
improve discipline and reduce employee absenteeism; (e) creating good relationships and
working conditions; (f) improving employee welfare; (g) enhance the employee's sense of
responsibility for his duties.
Work Satisfaction
According to Ramos (2010) job satisfaction is a pleasant or unpleasant emotional state in which
employees view work. A person working in an organization will bring the desires, needs,
desires and past experiences that come together to form work expectations. According to Lee
and Shau (2014) job satisfaction shows the degree of fulfillment of employee expectations, the
suitability between the desire that arises with the rewards provided. Feelings of low job
satisfaction can arise as negative actions such as strikes, slacking of work, loss to follow-up,
absenteeism and may even lead to employee turnover.
Davis, Weisj and Lotquist (2011) divide job satisfaction in two groups: internal and
external job satisfaction.
1. Internal work satisfaction. Job satisfaction arising from a person doing a job that
includes: (a) activity is always able to work; (b) social services in the form of an
opportunity to do something for others; (c) the responsibility of the employee's freedom
to use its own decisions; (d) security is the way of employment by ensuring the stability
of the position; (e) social status is the opportunity to be yourself in the organization; (f)
the variation of the opportunity to do things differently over time; (g) authority is the
concept of telling others what to do; (h) independence is the opportunity to work alone in
the work; (i) the utilization of the ability of the opportunity to do something by utilizing
the capabilities possessed; (j) normal values of the ability to do something that is not
contrary to the beliefs held; (k) creativity in the form of an opportunity to try their own
methods of execution of work; (l) the accomplishment of the employee's feelings after
achieving something in his work.

The Fourth International Conference on Entrepreneurship | Book Three
116
2. External job satisfaction. Job satisfaction that arises as driven by the company
(management), namely: (a) the rewards of wages and the amount of work done; (b) the
relationship with the superior is the way the managers manage their subordinates; (c)
superior technical capability in the form of employee supervisor ability in making
decision; (d) working conditions relating to workplace conditions; (e) corporate policy
that is the way company policy is applied to the job; (f) recognition is an award received
by employees for doing a good job; (g) coworkers: the way employees are
interconnected; (h) skill in the form of an opportunity to move forward and become
proficient at work.
Definition of Labor
Labor is a working or working resident, who is looking for a job, and who carries out other
activities such as schooling and housekeeping (Simanjuntak, 2012). Manpower ie individuals
who are seeking or already doing work that produces goods or services that already meet the
requirements or age limits that have been determined (Ruthorf, 2011). According to Eudes
(2014) classification of labor is a grouping of manpower that has been compiled based on the
criteria that have been determined. Eudes (2014) classifies labor based on :
1. The population that includes: (a) the workforce is the entire number of people who are
considered able to work and are able to work if there is no work request; (b) Non-
employment shall be those who are deemed incapable and unwilling to work, even if
there is a request for work; (c) Based on the working limit of the productive age
population aged 15 - 64 years who already have a job but temporarily not working, or
who are actively seeking employment; (d) Not the labor force are those aged 10 years
and over whose activities are only in school, taking care of the household and so forth.
2. Based on the quality that includes : (a) The educated worker is a workforce who has a
skill or expertise in a particular field by way of school or formal and non-formal
education; (b) Trained labor Trained workers are those who have expertise in certain
areas through work experience; (c) Uneducated and untrained workers are rough
laborers who rely on energy alone.
RESEARCH METHODS
In this research there are several stages of methodology that will be described as follows:
1. Research Sites. Place of research in this research in SME Industrial Cluster Sidoarjo East
Java by taking the object of research as much as 10 SMEs.
2. The measured variable. This research is measured variable is independent variable and
dependent variable. Independent variable is motivation variable with indicator that is: (a)
fair and decent wage; (b) recognition as an individual; (c) working security; (d)
acceptance by the group. While the dependent variable is employee job satisfaction (Y)
with indicators such as: (a) opportunity to move forward; (b) job security; (c) employees
obtain proper facilities from the company.
3. Model Used. This study uses a simple linear regression statistic model. In general this
regression equation is:
Y = a + b. X + e
Where: Y = the variable is not free; A = constants; B = regression coefficient; X =
independent variable; E = error
1. Research Design In this research first formulate problems related to motivation and job
satisfaction of employees faced by small business owners in SME industrial clusters in

The Fourth International Conference on Entrepreneurship | Book Three
117
Sidoarjo region together, so that after obtained the problem that is considered important
then made a design as follows: (a) Conducting Surveys to small businesses in the SME
industry cluster in the Sidoarjo region and make statistical data related to the growth and
business development of small business actors in the SME industry cluster of Sidoarjo;
(b) Identify the strengths, weaknesses, opportunities and threats posed by small business
actors in SME industry clusters to create SWOT matrices in relation to their own
resources; (c) Design a human resource development model based on work motivation
and job satisfaction suitable for small businesses in SME industry clusters in Sidoarjo
region, so it is expected that with this HR development strategy this small business can
be more developed.
2. Data Collection and Analysis Techniques
Data collection is done through: (a) Primary data of this research is obtained by
interview and distributing questionnaires to respondents, ie owners and employees of
Small and Medium Enterprises; (b) Secondary data is primary data obtained further and
presented either by primary data collectors or other parties. In addition, books and
literature related to research problems.
Figure 1. Research Methods
Start
Literature Study
Survey and Data Collecting
Primary Data Selection
Determination of trigger Motivation factors
and Work Satisfaction factors
Strategic Identification of HR Development
Benchmarking to SME’s Successful in
HR Development
Strategic Design of HR Development in
Competition Basic
Publication
End

The Fourth International Conference on Entrepreneurship | Book Three
118
Primary data and secondary data contains the results obtained from the data analysis based on
the previous step which can then be implemented with real conditions in the field. The method
of analysis used in this study is multiple linear regression analysis method to explain the effect
of independent variables on the dependent variable in SMEs studied. This data analysis is
preceded by the validity and reliability test of the data, t test to determine the effect of
independent variable to the dependent variable partially and calculate the value of the
coefficient of determination (R2) and the correlation coefficient r to know the influence of
independent variable to dependent variable.
3. Conclusions and Suggestions. The final step in this research is to draw conclusion based
on analysis result and suggestion in improvement proposal related to human resource
management to be more productive, innovative, creative and highly competitive with
linked to motivation factor and job satisfaction to SME management side in Sidoarjo in
the future And suggestions for further research.
1. Result and Discussion
1. Validity and Reliability Test
With 50 employee as respondents at SMEs leather craft in Tanggulangin then first
tested the validity of the proposed statement
Table 1. Validity Test
variable
Coefficient Value
of Product Moment
Correlation
Coefficient Corralation
Value of Product
Moment
(N = 50; = 0,05)
Conclusion
X
Y
0,759
0,409
0,235
0,235
Valid
Valid
Table 1 shows that all of the question items in this study were valid. Where the critical
value (r) Product Moment with degree of freedom of 50 and significance level of 0.05 is
0.235.
Table 2. Reliability Tesst
Variabel Alpha Conclusion
X
Y
0,7390
0,7826
Reliable
Reliable
Based on the results of reliability test conducted showed that the value of Alpha
Cronbach () is greater than 0.6 so it can be concluded that the test results that have
been done reliable for further analysis.
2. Heterocedasticity Test
From Figure 2 it shows that there is no clear pattern, where the points spread above and
below the number 0 on the Y axis, so that the resulting linear regression model does not
occur heterokedaktisitas.

The Fourth International Conference on Entrepreneurship | Book Three
119
Figure 2. Scatterplot The Influence of Motivation Factors to Works’ Satisfaction
3. Multicolinearity Test
Table 3. Multicolinearity Test
Variable Tollerance VIF
Work Motivation Factor (X) 0,886 1,128
Table 3 shows that the amount of VIF for each independent variable appears to be
below the number 10 or ranged between 1 and 3, as well as the tollerance value above
0.5 or close to 1. So that it can be concluded between the independent variables does not
occur correlation (does not occur Multicollinearity).
4. Autocorrelation Test
From the calculation results, obtained Durbin-Watson value of 1.616 (appendix 8).
Durbin-Watson value of 1.616 lies in the criterion 1.66 D - W 2.34 means the model
of linear regression equation is not autocorrelation. Or be in the criterion between the
numbers -2 1.616 + 2 which also concludes that there is no autocorrelation
5. t Test
Based on the comparison of t value arithmetic with t table where t arithmetic is located
above or outside the interval t table, it can be concluded that the variable of work
motivation (X) have a significant effect on employee work satisfaction at SME Skin
Crafts Tanggulangin Sidoarjo (reject H0 and accept H1) , So the second hypothesis is
proved true.
Table 4 Comparison Value of t calculate with t table
Variable t table t calculate
Work Motivation (X) 1,681 2,467
6. Simple Linear Regression Test
Table 5 Recapitulation of Simple Linear Regression Analysis Result
Variable Regression
Coefficient (b) t Sig r2
Work Motivation Factor
(X)
0,317 1,6
67
0,103 0,061
R = 0,871
R2 = 0,758
F Change = 11,281
Sig. F = 0,000

The Fourth International Conference on Entrepreneurship | Book Three
120
Constanta = 8,932
Standard Error = 0,4892
Durbin Watson = 1,616
Based on the calculation in Table 4, it can be made a simple linear regression equation
model of work motivation factors that affect the employee job satisfaction in SMEs skin
crafts, as follows:
Y = 8,932 + 0,317 X
Some things that can be known from the multiple linear regression equation above are
as follows:
a. Constant intercept of 8.932 is the intersection of the regression line with the Y
axis showing the average employee satisfaction factor in SME Skin Crafts
Tanggulangin Sidoarjo at the time of motivation factors of cooperation with
zero.
b. The regression coefficient X of 0.317 indicates that if the variable of work
motivation increased 1 unit then employee job satisfaction factor will increase
by 0,317.
c. The value of multiple correlation coefficient (R) from the simple linear
regression equation above is 0.871. This value (R) shows the relationship
between employee satisfaction variable (Y) and employee's work motivation
variable (X) is very strong (because above 0, 5).
d. The determinant coefficient (R2) of the multiple linear regression equation
above is 0.758 ≈ 0.76. This means that 76% of variation of work motivation
variable (X) affect employee job satisfaction. While the rest, 26% showed the
development of employee job satisfaction influenced by other variables outside
of work motivation variable.
e. Standard Error of The Estimation (SEE) of 0.489. The smaller the SEE will
make the regression model more appropriate in predicting the independent
variables.
Conclusion, Managerial Implication and Suggest
Conclusion
1. Employee motivation assessment has a strong effect on job satisfaction of employees in
working in SMEs Skin Crafts in Tanggulangin Sidoarjo, which is said to have a strong
effect because it has a value of correlation coefficient (R) of 0.691 and based on
interpretation table correlation coefficient that the value of 0.691 is between 0, 60 - 0.799
which means have a strong effect.
2. From the test result using t test, the result of tcount value on employee motivation
variable equal to 2,467 with significance value equal to 0,003 so (0,003 <0,005), where
result stated that hypothesis proposed acceptable and proven correctness.
Managerial Implication
This research can have an impact on decision making for managerial related to strategy to
increase employee motivation and also measures to give job satisfaction for employee so that
expected to increase work productivity of employees.
Suggest
1. Manager or Leadership in SME Handicraft Tanggulangin Sidoarjo should pay attention
to the wage variables fair and decent, job security and acceptance by the group.

The Fourth International Conference on Entrepreneurship | Book Three
121
2. In order to form the expected employee job satisfaction. SME owners need to pay
attention to the provision of proper facilities and opportunities to advance for their
employees.
3. Skills and motivation training should always be done so that employees feel comfortable
and loyal to the company, this is given in the questionnaire there are respondents who
answered that a small percentage of employees feel like moving to another SME.
4. Leaders should be able to foster morale and form a conducive organizational climate by
taking into account psychological factors such as in the form of good communication
between employees or leaders with employees, improvement of promotion mechanisms
and so on.
Keterbatasan Penelitian
1. This research still uses simple linear regression analysis because it only involves.
Variables only that is variable of work motivation (independent variable) and job
satisfaction (dependent variable), in the next research is expected to do multiple
regression analysis with more variable or by using moderation variable
2. This study uses relatively few respondents so that in the next research is expected to be
used more respondents so that more representative. In addition it is expected the
involvement of the management to participate.
3. This research use indicator good for independent variable and dependent variable
relatively little that is 4 and 3, in subsequent research expected use of more indicator.
REFERENCES
Arikunto, Suharsimi. 2012. Prosedur Penelitian : Suatu Pendekatan Praktis, Edisi Revisi
Jakarta : PT. Rineka Cipta.
Amstrong, Wayne F.. 2014. Managing Human Resources, Productivity, Quality of Work Live,
Profits. Third Edition. Singapore : MC Graw – Hill International Edition
Barkah, Patrick. 2012. The management of People at Work. New York. Mac Milian
Campbell, Michael. 2013. Human Resource Management, 4rd Edition. London : Scienetics
Economics Association.
Dajan. 2015. Metode Penelitian Bisnis, Bandung, Alfa Beta
Dalil, Lumarks. 2012, Management Similiarities and Differences Under Different Cultures.
Rotterdam : Ned. Inst. V. Efficiency University Press.
Dipboye. 2014. Career Experiences, Perceptions of Employment Practices and Psychological
Commitment to The Organization. New Jersey. Human Relations Press
Djui. 2006. Human Relations : A Job Oriented Approach. Fourth Edition. New Jersey. Prentice
Hall, Inc.
Ford, Nollen. 2014. Organizational Culture Characteristics. 4th Edition, New York. Prentice
Hall
Gibson. 2010. Organizationa Behaviour : Concepts, Controversies, Apllications, New Jersey :
Prentice Hall, Inc
Handoko, Hani. 2006. Manajemen Sumber Daya Manusia. Edisi Kedua. Yogyakarta : BPFE.
Husnan. 2007. Analisis Statistik Tingkat Lanjut. Jakarta, Gramedia
Indriantoro, Nur, dan Supomo, Bambang. 2007. Metodologi Penelitian Bisnis Untuk Akuntansi
dan Manajemen. Edisi Pertama. Yogyakarta : BPFE UGM
Mondy, Rumaire. 2003. Building Organizational Commitment with Personality Approach. First
Edition. Wesbster. California
Narayanan and Nath. 2003. Corporate and Performance. New York. : The Free Press
Sumitro. 2010. Perilaku Organisasi. Edisi Kedua, Jakarta, Bina Insan Media.
Suparmoko. 2012. Metode Penelitian Praktis. Yogyakarta : BPFE UGM

The Fourth International Conference on Entrepreneurship | Book Three
122
Triguno, Sugandi. 2014. Pemberdayaan Sumber Daya. Lembaga Administrasi Negara. Jakarta
Wolseley, M. 2001. The Theory of Social and Economic Organization (A.N. Henderson and T
Parsons, eds.and trans.). The Free Press. Glencoe.

The Fourth International Conference on Entrepreneurship | Book Three
123
TRADITIONAL SNACK STRATEGIC MARKETING ANALYSIS
OF PT. X
1Andre Tjahyono, 2Tina Melinda♠
Ciputra University Surabaya
INDOENSIA
ABSTRACT
This research represent about marketing strategic analysis for
traditional snack which produce by PT. X, hence PT. X can find
marketing strategy that work effectively and efficiently for market share.
The objective of this research is to obtain marketing strategy for
traditional product of PT. X. This research is a qualitative research,
obtain data through interview from credible sources which have
experiences in marketing both from inside company and outsider who
have connection with the company itself. The result from interview will
be processed with SWOT Analysis to get the Strength, Weakness,
Opportunity, and Threat from PT. X. Moreover the result from SWOT
Analysis will be processed further with 7P’s Marketing Mix to obtain
the marketing strategy for Product of PT. X. The result of this research
indicates there some marketing strategy which have to implemented by
company for it’s traditional-trade product, they have to concerned
about Price and Product from Marketing Mix. The main factor for
modern-trade product are Product and Physical Evidence. The
company have to do many improvement regarding this matter, not only
for the main factor but also the other factor, hence it will be a great
help for company to maximize their marketing strategy.
Keywords : Marketing Mix, SWOT Analysis, Marketing Strategy
INTRODUCTION
Snack nowadays is not only for complementary food, but also subtitute to fulfill people
needs.One of the main reason is because most people feel so busy which lead them to eat
something that easy to get or make.The most important factors which become the main reason
for people to choose a snack is food hygiene, hence people will not buy it. Import snack become
really renown because of unique packaging and food hygiene. The point of view from local
market about traditional snack is not as good as what they see in import snack. Traditional snack
manufacturer have to make something unique and fresh product, otherwise they will not be able
to compete with import snack.
There are so many traditional snack, not only ready-to-eat snack but raw snack as well. One of
the most well-known traditional snack is snack pellet or so-called kerupuk in Indonesia. Local
brands that quite famous even in other countries are Qtela, Kusuka, Lumba-lumba, Finna and
Nixxa. Other countries that make snack pellet are China, Korea, Taiwan, and India. PT. X is one
of snack pellet manufacturer that established since 1989 which located in Mojokerto. PT. X
develop their business to compete with other competitor in international market and local
market as well. Food Hygiene, unique and healthy encourage PT. X to develop new traditional
snack pellet which packed with unique packaging, natural ingredients, healthy and hygiene.

The Fourth International Conference on Entrepreneurship | Book Three
124
PT. X produce traditional snack such as onion snack pellet, fish snack pellet, shrimp snack
pellet, prawn snack pellet, cassava chips, egg noodle. Creative and fresh idea and innovation
will give new taste for PT. X traditional snack to compete with other local and global
competitor. One of the most important aspect beside a good product is how we introduce and
promote the product. One of the most important marketing theory is called Marketing Mix
which presented by Kotler in Saputra (2013), Marketing mix contain marketing tool that can be
used by some companies to get them closer to their goal. Marketing Mix have four basic factor,
there are Product, Price, Promotion and Place. Those factors have been developed into seven
factors ,according to Boom and Bitner’s in Lin (2011) , as follows Product, Price, Promotion,
Place, People, Process, Physical Evidence.
Creative idea and a new innovation are needed to support for new product, one of the main
factor that really important to improve is marketing strategic. Marketing Mix is a tool to help
company in analyzing marketing strategic which effective and efficient to develop a product.
Marketing Mix will be used to get basic elements in marketing. All of the basic elements will be
combine to get a good way to promote and market the product, for example how PT. X explain
that the new product is a healthy product , hygiene and safe. Another example to promote are
using social media and follow the trend, hence people will know the product easily through this
way. A good way to promote and market the product will make the company have a chance to
tell what the value of their product. PT. X will increase their sales and develop their business
one step ahead, according to Lamb Hair & Mc Daniel in Dharmawan (2012).
Marketing is a organizational function and chain of process to create, communicate and give
value to customer to build relationship between customer through a profitable way for the
organization, according to Kotler & Keller in Lengkey (2014). Marketing Mix is a combination
of four variables that build basic and core from a marketing system, as follows Product, Price,
Promotion and Place. Product is the first element in Marketing Mix, a product have to fulfill the
customer needs. Product have some elements as follows, physic, service, branding, packaging,
colour, standaritation, planning, development, modification, innovation, etc. Price is element
that affect product’s sales, price covers pricing policy, discount, profit margin, term of payment,
credit, etc. Promotion is element that draw customer to buy a product, promotion can be
described as a way to communicate about the product from a company to the customer.
Promotion includes few things, as follows direct sales, advertisement, promotion activity, public
relations, demonstrate, exhibition, etc. Place is the last element from Marketing Mix that show
time, place and utility. Place is a combination of distribution, storage, market place, facility,
storage level, transportation, warehouse, etc. Four basic elements are really important and must
be balanced, hence it will maximize the potential of Marketing Mix.
Promotional Mix is a tool for promotion in marketing strategic to communicate the value from
the product to the customer in persuasively and build relationship between customer. There are
five main components, as follows advertising, sales promotion, public relation & publicity,
personal selling, and direct marketing. Advertising is element that contains promotion idea
through sponsors. Sales Promotion is element that have short-term incentive which draw
customer interest to try or buy a product or service. Public Relation is element that cover
programs to promote and protect company profile and product. Personal Selling is element that
contains direct interaction with customer to give a demo, presentation, interaction and receive
order. Direct Marketing is an element that cover media communication as follows phone,fax,
and e-mail to communicate with customer.
Marketing Mix is not management theory which comes from scientific analysis, but a
conceptual framework which emphasize into decision-making principle, according to Boom &
Bitner’s in Lin (2011). Marketing Mix is really useful when it comes to long-term and short-
term development, according to Palmer in Lin (2011). Four elements of Marketing Mix then
developed into seven elements, as follows Product, Price, Promotion, Place and the additional

The Fourth International Conference on Entrepreneurship | Book Three
125
elements are People, Process, and Physical Evidence. The framework of seven elements can be
applied in a wider range rather than four elements. New elements of Marketing Mix have to be
integrated with the old one, hence it will maximize the potential of Marketing Mix itself. The
fifth element is People, that can be described as customer, employee, management, and every
individual. Products reputation can be affected by people who involved in the process to make
those product. The sixth element is Process which a method and process to make services or
products. The last element is Physical Evidence that cover experience of using services or
products, company’s image, etc.
SWOT Analysis is a way to identify factors systematically to produce strategy for company.
Analysis is based on internal and external from the company, there are four factors, as follows
Strength, Weakness, Opportunity, Threat. Strength is a resources, skills, and other advantages
which related with internal. Weakness is a limitations or boundaries which inhibits company’s
performance. The limitations can be described as capital limit, facility, human resources.
Opportunity is a situation which lead to a profits and advantages, for example new technology,
new way to promote and marketing, etc. Threat is a unfavorable situation which come from
external and have a chance to become a threat to company, for example government policy that
prohibit some technology, new product that can subtitute the product, etc.
Research Design
Figure 1. Research Design

The Fourth International Conference on Entrepreneurship | Book Three
126
RESEARCH METHODS
This study is a descriptive research with qualitative approach. Qualitative research is a tradition
in social science which based on observing the human being and related to themselves,
according to Kirk & Miller in Moeloeng (2012:2). Qualitative research have characteristic, there
is involving certain measurement. Characteristics can be described are data collected as a
picture, sentence, except numeric. Qualitative research is not using statistic data as well. The
method used to collect data is through direct interview.
Place and Period
This research was conducted in Sidoarjo and Mojokerto. The periode time of this research is
between April 2016 – Juni 2016 with limitation one product.
Research Subject
Research Subject is part which become sample for the research to get information. There are
three kinds of subject, as follows Distributor, Supermarket and Competitor in the same field of
business. Distributor to be interviewed is one of snack distributor that work for a long time,
hence they understand and know very well about sales strategy for the product. Another
research subject is Supermarket that sell traditional snack, so that they have the knowledge
about strategy to sell those products. The last subject is competitor who produce the same type
of product, through this subject it can obtain many kind of information about the strategy for
traditional snack. Research object is PT. X, a traditional snack and crackers manufacturer. PT. X
have a goal that develop a product and build a good marketing strategic. Informant from this
research are Marketing Manager from PT. X, Distributor product from PT. X, and Director from
PT. X. There are some certain criterias which informant must have.
Method of collecting data
Interview is a technic to collect data if researchers want to study and find the problem,
according to Sugiyono (2011). Collecting data technic with interview can be done in some
ways, phone, face to face, another communication tool. Interview will be done with some
questions which lead to some detail information. In this research is using structured interview.
Observation is a complex process which contain biological and physcological process,
according to Hadi in Sugiyono (2013:145). Observation have a specific characteristic compare
to other data collecting technic, it’s because there are no boundaries and limitations
Data Analysis
PT. X is family business which produce indonesia traditional snack, established in 1987 by
Rudy Tjahyono. PT. X have potential to produce good quality traditional snack. PT. X located
in Mojokerto, East Java, Indonesia. The informant who give information to assist this research
from PT. X are Rudy Wijaya as Director of PT. X and Irene Chandra as Local Marketing from
PT. X. Other informant is Aditya Kurniawan as Distributor from PT. Y who distribute PT. X’s
product.
SWOT Analysis is a tool to identify factors in organization to give impact through comparison
internal factor and external factor. Four factors are Strength, Weakness, Opportunity, Threat.
SWOT Analysis need data which obtain through interview. The results from interview will be
analyzed and identified. PT. X’s Strength are good quality product, cheaper price for modern
trade product, experienced staff, diversified product, custom product, return policy, and free
sample. PT. X’s Weakness are some process still using traditional machine, there are no system
for distribution path, price for traditional trade product are overpriced, quality of main
ingredients unstable, international certification for export, no warehouses in some distribution
area. PT. X’s Opportunity are purchasing power of customer increasing, awareness of food
hygiene, government policy about export become less strict, government facilite local product to
enter exhibition with accomodation, new technology. PT. X’s Threat are changing of dietary
and instant food, import snack, price war with other company, etc. Results from SWOT

The Fourth International Conference on Entrepreneurship | Book Three
127
Analysis will be used to improve PT. X performance, most powerful thing in PT. X’s Strength
is product quality. PT. X’s Weakness which affect the most is traditional machine and process.
PT. X’s Opportunity which have the biggest chance to get is accomodation for exhibition from
government. PT. X’s Threat which give the most impact is import snack from other countries.
Improved 7P’s Marketing Mix used by PT. X to get a new way for sales marketing to promote
and introduce products of PT. X. Results from Improved 7P’s Marketing Mix are changing each
element in PT. X, as follows Product, Price, Place, Promotion, People, Physical Evidence,
Process. Improvement in Product are the limitation for custom product, ingredients that permit
in other countries, additional smaller packaging, natural food-grade colouring. Improvement in
Price is adding a new traditional-trade product with cheaper price. Improvement in Place is
building new warehouses. Improvement in Promotion are registering membership for e-
commerce and social media, entering exhibition in other countries, registering as member of
food association.Improvement in People are adding more training for employee and operator,
changing the organization culture, changing the organization structure to flat-organization-
structure, adding some reward for employee of the month, adding system for distribution,
adding new system for employee opinion, empowering young generation employee.
Improvement in Process are researching about new technology, using belting and conveyor
system for production line, adding system for return policy. Improvement in Physical Evidence
are adding new storage and warehouses, changing production system to get HACCP
certification and GMP certification, changing traditional-trade product packaging, maintaining
company’s facilities, making new design for brochure and product catalogue. The results from
analyze most important factor in Improved 7P’s Marketing Mix as follows, Price-Product-
Promotion-Physical Evidence-Place-Process-People for traditional trade product and Product-
Promotion-Physical Evidence-Process-Price-People for modern-trade product.
CONCLUSION
This research explain marketing strategic for traditional snack PT.X and how to get the
marketing strategic itself. The first step is analyzing condition and current marketing strategic of
PT. X. SWOT Analysis is the second step to understand more about PT. X’s Strength,
Weakness, Opportunity and Threat. Data which collected through interview will be proccesed
with Improved 7P’s Marketing Mix. The seven factor of Marketing Mix are Prouct, Price,
Promotion, Place, Process, People, and Physical Evidence are not management theory from
scientific analysis, rather a conceptual framework which help the company to adapt and fulfill
customer needs, according to Boom & Bitner’s in Lin (2011).
The result from this research are improvement in seven factor of Marketing Mix which lead
some change in PT. X. PT. X traditional-trade product’s most important factor are Price and
Product, therefore modern-trade product’s most important factor are Product, Promotion and
Physical Evidence. Another results is PT. X need to re-evaluate about positioning and target
market for traditional-trade product because it’s too expensive.
There are some improvements and change for PT. X to develop their business. PT. X have to
change in order to compete with other competitor. Improvements and change in PT. X as
follows in seven aspects of Improved 7P’s Marketing Mix. Improvement in Product are the
limitation for custom product, ingredients that permit in other countries, additional smaller
packaging, natural food-grade colouring. Improvement in Price is adding a new traditional-trade
product with cheaper price. Improvement in Place is building new warehouses. Improvement in
Promotion are registering membership for e-commerce and social media, entering exhibition in
other countries, registering as member of food association.Improvement in People are adding
more training for employee and operator, changing the organization culture, changing the
organization structure to flat-organization-structure, adding some reward for employee of the
month, adding system for distribution, adding new system for employee opinion, empowering

The Fourth International Conference on Entrepreneurship | Book Three
128
young generation employee. Improvement in Process are researching about new technology,
using belting and conveyor system for production line, adding system for return policy.
Improvement in Physical Evidence are adding new storage and warehouses, changing
production system to get HACCP certification and GMP certification, changing traditional-trade
product packaging, maintaining company’s facilities, making new design for brochure and
product catalogue. PT. X have to add training program for their employee to increase
company’s performance. A good human resource will lead company to work more effective and
efficient. PT. X have to be aware with investment priority, which one will give the most impact
and vice versa. The expecation from this research is PT. X can increase their sales and become a
whole-new-level company. Last of all, PT. X still have long way to go, hence continuous
improvement is one of important things that need to do in the future.
For future research, this research can be used as data resources with other theory and other
factors, followed by more detail research.
REFERENCES
Afifah, N, T. (2013). ‘Strategi Marketing Mix dalam mengokohkan Brand Image’. Program
Sarjana Strata Satu Pada Universitas Islam Negeri Sunan Kalijaga.
Darmawan Y, R. (2012) ‘ Perancangan Strategi Bauran dan Komunikasi Pemasaran Pada
Rumah Makan Ayam Goreng dan Ikan Bakar Bu Cokro Surabaya’. Journal Ilmiah
Mahasiswa Universitas Surabaya, I, (1).
Dusan, M.(2013). ‘Marketing Plan’. Master Thesis pada Masaryk University.
Febrianti, O, V.(2014). ‘Usulan Alternatif Strategi PT. X Menggunakan Quantitative
Strategic Planning Matrix (QSPM)’. Journal Graduate Unpar, I, (1).
Herowati, Aulia. (2013). ‘Kebutuhan Informasi Guru dan Siswa Tunarungu Dalam Kegiatan
Belajar Mengajar di SLB Manunggal Slawi. Program Strata Satu, Ilmu Perpustakaan.
Lengkey, L, M, E. (2014). ‘Peranan Komunikasi Pemasaran Dalam Meningkatkan Minat
Pengguna Iklan di Harian Komentar Manado’. Journal “Acta Diurna”, III, (3).
Lin, S, M. (2011) ‘ Marketing Mix (7P) and Performance Assessment of Western Fast Food
Industry in Taiwan : An Application by Associating DEMATEL and ANP’. African
Journal of Business Management, V, (26).
Mingmo, Z. (2013). ‘Developing Strategic Marketing Plan for International Tourism Industry’.
Bachelor’s Thesis pada Kemi-Tornio University of Applied Sciences.
Mulyahati, B. (2014). ‘Analisis Buku Tematik Terpadu Kurikulum 2013 Kelas IV Sekolah
Dasar’. Program Strata Satu Pada Universitas Pendidikan Indonesia.
Prayoga, B, A.(2015). ‘Pengaruh Marketing Marketing Mix terhadap Loyalitas’. Program
Sarjana Strata Satu Pada Universitas Islam Negeri Sunan Kalijaga Konsumen PT.
Madubaru PG/PS Madukismo Yogyakarta’. Program Profesi Ahli Madya Pemasaran
Pada Universitas Negeri Yogyakarta.
Pristyo, M. (2013). ‘Pengaruh Produk dan Harga Terhadap Volume Penjualan Pada UD. Eka
Jaya di Surabaya’. Journal Kewirausahaan, I, (1).
Qin, W. (2012). ‘Analysis for Marketing Strategy Plan of Nanchang City China Post Logistics
Company in OTC-MEDICINAL Market’. Degree Programme Supply Chain
Management pada HAMK University of Applied Sciences.
Saputra, M, D. (2013) ‘Pengaruh Bauran Pemasaran Terhadap Keputusan Pembelian Pada PT.
Aneka Regalindo di Sidoarjo’. Journal Ilmu & Riset Manajemen, II, (10).
Saputra O, A. (2014). ‘Strategi Komunikasi Pemasaran Dalam Memasarkan Produk Cemilan
Khas Samarinda di UKM ( Usaha Kecil Menengah ) Center Samarinda’. Journal Ilmu
Komunikasi, II, (1).
Sugiyono. (2013). ‘Metode Penelitian Kuantitatif Kualitatif dan R&D’.Bandung : ALFABETA.
Sugiyono. (2012). ‘Memahami Penelitian Kualitatif’. Bandung: ALFABETA.

The Fourth International Conference on Entrepreneurship | Book Three
129
Tristantin V, V, Yunita T, S. (2013). ‘Pengaruh Promotion Mix Terhadap Minat Beli Konsumen
di Family Fun Karaoke Keluarga’. Journal Hospitality dan Manajemen Jasa, II, (1).
A. Wambui. (2013). ‘Samsung Smartphone Marketing Strategy’. Bachelor’s Thesis
pada Turku University of Applied Sciences.

The Fourth International Conference on Entrepreneurship | Book Three
130
THE IMPLEMENTATION OF ECONOMIC EMPOWERMENT OF
MICRO, SMALL AND MIDDLE ENTERPRISES FOR FOOD AND
BEVERAGE BUSINESS IN THE REGENCY OF SITUBONDO
1Hadi Wijono
Universitas Abdurrachman Saleh Situbondo
INDONESIA
ABSTRACT
Based on the data of BPS (Statistic Central Bureau of Situbondo Regency),
the number of Micro, Small and Middle Enterprises (hereafter called
UMKM) in 2015 was 57,235 UMKM. It increased to 57.385 UMKM in
the next year of 2016 and 70 % of them, more than 40.170 UMKM, were
managing food and beverage businesses which become the locus of this
study. The figure shows that Situbondo has great potential for economic
empowerment to support the increase of economic growth in this region.
This study aims to give guidance, especially to the writer to always be on
the track when undergoing his activity. In line with the problem
formulation, the purpose of this study is to analyze the implementation of
economic empowerment of UMKM for food and beverage businesses in
Situbondo. The results of study conclude that : Firstly, the economic
empowerment of UMKM which manage food and beverage businesses
has not optimally done yet, especially those which are related to
accompaniment, capital injection and couching [rpgram. Secondly, There
are still a lot of both external and internal barriers in the implementation
of economic empowerment of UMKM which manage food and beverage
businesses, such as : invalid data, sectoral ego among goverment offices,
the reluctance of businessmen to take part in empowerment program and
the low attention of Head Local Government for better development of
UMKM.
Key Words : Implementation, Economic empowerment, UMKM ( Micro,
Small and Middle Enterprise
INTRODUCTION
The entrepreneurship has a strategic and important role from the dimension of economic
turbulence which has recently occurred in Indonesia, especially UMKM that has been proven to
have strong endurance to face economic crisis.
The occuring of 1997 economic crisis gave real example. When most of large enterprises were
collapsing, UMKM could still stood up and sustained their existences and this condition pushed
the government to produce Law Number 20 of 2008 on UMKM and the issuence of
Government Regulation Number 17 of 2013 on the implementation of Law Number 20 of
2008 on UMKM.

The Fourth International Conference on Entrepreneurship | Book Three
131
The general description of Regulation Number 20 of 2008 says that UMKM is an activity
which is able to expand job oppurtunity, provide wider economic services to community and
increase people’s income as well as push economic growth which is expected to materialize
national stability.
UMKM, a c c o r d i n g t o L a w N u m b e r 2 0 o f 2 0 0 8 o n U M K M i s :
1. Law No. 20 of 2008 on UMKM, Article 1, Verse 2 : Small Enterprise is an activity of
independent productive economy organized by individual or business entity which
doesn’t belong to the branch of company or subsidiary owned, dominated or become
part both directly and indirectly of Middle and large Enterprise, which fulfil the
criteria of small enterprise as mentioned in this regulation.
2. Law Number 20 of 2008 on UMKM, Article 1, Verse 3 : Middle Enterprise is an
activity of independent productive economy organized by individual or business entity
which doesn’t belong to the branch of company or subsidiary owned, dominated or
become part both directly and indirectly of Small and large Enterprise, which has net-
worth and annual sale results as mentioned in this regulation.
It is of course a good moment If related to the implementation of Regional Autonomy because
Regional Government has respective role to freely manage, develop and push forward the
region in line with the availibility of its resources. In its strategic planning and general policy
Situbondo Local Government has not yet so far given priority to the development and the
progress as well as the growth of UMKM and cooperative. The absence of partnership with
large enterprises which have orientation to employement has become certain problem.
Based on the data of BPS ( Statistic Central Bureau of Situbondo Regency ), the number of
Micro, Small and Middle Enterprises in 2015 was 57,235 UMKM. It increased to 57.385 in the
next year of 2016 and 70 % of them, more than 40.170 UMKM, have managed food and
beverage businesses
The large number of UMKM which especially focus on food and beverage business indicate
that Situbondo has great potential for economic empowerment to support the increasing
economic growth in this regency. According to Data from the office of Cooperative and UMKM
of Situbondo Regency, the contribution of UMKM to Original Regional Income is very
significant, although there is no exact publication so far.
Referring to the condition, This study focuses on the optimalization of UMKM empowerment
which manages food and beverage businesses in Situbondo.
Problem Formulation
Based on the background and definition, the formulation of problem of this study is the
implementation of economic empowerment of UMKM which manage food and beverage
businesses in Situbondo.
Purpose and Benefit of study
This study aims to give guidance, especially to the writer to always go on the track when
undergoing his activity. In line with the above problem formulation, the purpose of this
study is to analyze the implementation of economic empowerment of UMKM which
manage food and beverage businesses in Situbondo Regency
DISCUSSION According to Sumodiningrat, 1999 ( in Hutomo, 2000), Community’s economic empowerment
is an effort of building strong, competitive, large and modern economy in the right mechanism
of market. Because of barrier of structural factor in the process of people’s economic
development, the solution must be formulated through structural changes.

The Fourth International Conference on Entrepreneurship | Book Three
132
Kartasasmita, 1996 explained that Community Economic Empowerment is an effort of
resource deployment to develop community economic potential to increase their productivity,
so that the productivity of both human and natural resources can be improved at the same time.
Considering those above ideas on empowerment it can be said that economic empowerment of
community is the strengthening of ownership of production factors, the increasing domination
of distribution and marketing, the increasing salary/wage of people, the wider access of people
to get adequate information, knowledge and skill which can be realized through the
implementation of many aspects, either the aspect of people themselves or the aspect of
government policy.
Another opinion from Sumodiningrat, 2001 said that people empowerment is an effort of
creating independency of the people by optimilizing their own potential to choose the
most appropriate activity for their respective self-progress. Moreover, Kartasasmita,
1996 said that the act of empowering is an effort of improving the prestige and dignity
of poor people to escape from the trap of poverty and backwardness. In other word,
people empowerment is the way how to make people capable and independent.
The effort of community economic empowerment can not be separated from employment / job
opportunity and the increasing income of people. Relating to people empowerment to widen
employment opportunity is very much influenced by the policy of UMKM development,
which has not so far become the priority of local government. Many UMKM, especially those
which manage beverage and food businesses have never gotten capital injection,
accompaniment program and coaching activities from the related government office, namely
Office of Cooperative and UMKM.
Based on the writer’s observation UMKM development has strategic role to spur the economy
of local government because the growth and activity of real sector undergone by UMKM can
provide added-value for the people, namely the availibility of job opportunity and the increasing
income of people..
Capital injection, accompaniment and coaching program are very important to eridacate
UMKM weaknesses, like the low productivity and the low quality of products. With the capital
injection, accompaniment and coaching program provided by Office of Cooperative and
UMKM Situbondo Regency, UMKM which are managing food and beverage businesses are
expected to still survive and develop in the competition with stronger domestic and foreign
economic businessmen. Unfortunately, Office of Cooperative and UMKM are reluctant to do it
seriously.
In writer’s opinion that the coaching program organized by office of cooperative and UMKM
towards UMKM does not consider the specific characteristic of UMKM as the comparative
values which can be utilized to increase UMKM competitiveness with another stronger
economic businessmen.
We need to know that UMKM have unique chracteristic that are only able to manage certain
activity of business. But again the uniqueness of UMKM can be made as competitive value if
UMKM take certain position in business and industry.
The results of study conclude that UMKM which manage food and beverage businesses
constitute one of important part of economic development in Situbondo. This kind of UMKM
help the local government in the process of opening new job opportunity because their
existences can create new working units by giving chance to new workforce to support family’s
income. This kind of UMKM is also having higher flexibility if compared to Large enterprises.
Barriers of UMKM empowerment which manage food and beverage business in
Situbondo.
In my opinion, the important points that become the barriers of UMKM development in

The Fourth International Conference on Entrepreneurship | Book Three
133
Situbondo, are among others :
1. The usual factor that become barrier for government to monitor and identify the
increasing number of UMKM because most of them, on the other side, are reluctant to
report their existence and busnisess to the office of cooperative and UMKM.
2. Sectoral ego among working units of local government office which are responsible to
handle education and training especially Office of trade and industry as well as Office
of cooperative and UMKM.
3. Nepotism in the process of UMKM selection as the participants of Training program.
4. The reluctance of many UMKM to participate in training programs which are,
according to them, considered unuseful and waste the time.
5. The low attention of local government for the development of UMKM which can be
measured from the lack of UMKM development infrastructures.
CONCLUSION
The results of study on the implementation of economic empowerment of micro, small and
middle enterprises which undergo food and beverage business in Situbondo regency conlude
that :
1. Economic empowerment of UMKM which undergo food and beverage business has not
been optimally done, especially those related to capital, accompaniment and coaching
activity.
There are still many obstacles in the implementation of UMKM empowerment which undergo
food and beverage business, both internally and externally, such as : invalid data, sectoral
egoism among government offices, , the reluctance of businessmen to take part in empowerment
program and the low attention of Head Local Government for the development of UMKM.
REFERENCES Ginanjar Kartasasmita. 1996. Pembangunan untuk rakyat: Memadukan Pertumbuhan
dan Pemerataan. PT Pustaka Cidesindo. Jakarta.
Suhendi dan Indra Sasongko. 2014. Pengantar Bisnis. Alfabeta . Bandung
Tambunan, Tulus.2012. Usaha Mikro Kecil dan Menengah di Indonesia. Isu-isu penting.
Penerbit LP3ES. Jakarta.
Hasan, Ali. 2008. Marketing. Media Utama, Yogyakarta.
Martoyo, Susilo. 1999. Manajemen Sumber Daya Manusia. Yogyakarta: BPFE.
Surakhmad, Winarno. 1999. Pengantar Penulisan Ilmiah Dasar, Metode dan Tekhnik.
Bandung: Penerbit Tarsito.
Suryabrata, Sumadi. 2006. Metodologi Penulisan. Jakarta: PT. Raja Grafindo Persada.

The Fourth International Conference on Entrepreneurship | Book Three
134
THE EFFECT OF LEADERSHIP STYLE AND ORGANISATIONAL
CULTURE TO COMPANY PERFORMANCE THROUGH
STRATEGY OF INNOVATION AS INTERVENING VARIABLE IN
PT. BINTANG SARANA EKSPRESS
1Ardhito Himawan, 2Wirawan Endro Dwi Radianto♠
Ciputra University Surabaya
INDONESIA
Email : [email protected] , [email protected]
ABSTRACT
This research represents about leadership style and organisational culture
mediated by PT. Bintang Sarana Ekspress to improve company performance.
The purposes of this research are acquiring and analyzing leadership style
and organisational culture which should be executed to acquire favorable
company performance. In this research leadership style and organisational
culture used as independent variable, company performance (organization)
used as dependent variable and strategy of innovation as intervening
variable. This research used quantitative research approach by applying
survey research method with primary data collection utilizing questionnaire.
Sample used in this research were obtained by sample taking technique (non
probability sampling) with saturated sampling. Populations used in this
research were middle management and staff. Data processed by using
Structural Equation Modelling (SEM) by applying software program of
Partial Least Square (PLS). The result of research indicates that (1)
leadership style affects positively and significantly to company performance,
(2) organisational culture does not affect to company performance, (3)
leadership style affects positively and significantly to strategy of innovation,
(4) organisational culture does not affect to strategy of innovation, (5)
strategy of innovation affects positively and significantly to company
performance.
Key Words: Leadership Style, Organisational culture, Strategy of
Innovation, Company Performance, Structural Equation Modeling (SEM),
Partial Least Square (PLS)
INTRODUCTION
Sector of transportation plays key role in the sustainability of industries in Indonesia regarding
to distribution of goods as the result of production. This case is evidenced by Data of Indonesian
Truck Entrepreneurs Association (Data Asosiasi Pengusaha Truk Indonesia) (2014) indicating
that nowdays there were 5,1 millions fleet of trucks in Indonesia and also Data from Lembaga
Riset Frost and Sullivan (2015) that showed market growth of Transportation and Logistic
increased as high as 15,2 % from the previous year. Each industry has to be capable to have
strategy of innovation to be able to compete to show the best performance for its consumers.
Innovation can be created as main indicator in an organization to achieve competitive

The Fourth International Conference on Entrepreneurship | Book Three
135
excellence. Innovation is the effective way to create different thing not only create added value
for its consumers. Emergence of strategy of innovation is caused by leadership style in the
company. Leadershidp style based on innovation has to have evolution in accordance with its
environment development. Leader with her or his leadership style has to be intrepid to think
differently to create opportunity and actualize purpose of organization. Leadership style is very
decisive for the success of an organization in developing capability and its competency to win
the rivalry sustainably by showing the best performance. Leadership style with organisational
culture have a close relation. Leadership style and organisational culture are a highly dependent
phenomenon, since each aspect from leadership style finally establish organisational culture.
Tendency of organization in order to encounter global rivalry has to be addressed well since it
can cause impact to the company practice. Compatibility between organisational culture and
values owned by member will create facvorable performance. This case issues need of
organization for innovative organisational culture which is able to direct and develop company
to manage and control in order to survive constantly to global rivalry. This research was
conducted in PT. Bintang Sarana Ekspress with reason (1) that trust given by Direktur Utama to
Direktur Komersial to lead PT. Bintang Sarana Ekspress (2) existence of reshuffle of
organization structure in the early 2016 (3) this trucking company does not have differentiator
compared to its competitors. Based on theory and previous research result, it can be seen that
few researchers investigates direct effect between leadership style and organisational culture to
company performance and they have not indicated consistent result in relation among variables.
This research was conducted to find whether there is effect of leadership style and
organisational culture to company performance through strategy of innovation.
LITERATURE REVIEW
Previous Research
One of research which can be created as reference is research conducted by Romadon and
Hanifah (2015). This research aimed to test effect of leadership style, technology and rivalry to
strategy of innovation and company performance (organization). Leadership style, technology
and rivalry used as dependent variable, organization performance as independent variable and
strategy of innovation as intervening variable. Data was processed by using SEM method by
utilizing PLS software. Result of this research indicated that leadership style affected positively
to strategy of innovation, advanced manufacturing technology affected positively to strategy of
innovation, rivalry affected positively to strategy of innovation and strategy of innovation
affected to company performance (organization). Research which can be created as referenece is
research by Marta dan Suharnomo (2011). The research aimed to ascertain effect of leadership
style, organisational culture to organization performance with responsiveness as intervening
variable in CV. Enggal Jaya. Result of this research indicated that leadership style affected
positively to organization performance and organisational culture affected positively to
organization performance.
Company Performance
Measurement of performance can be conducted by evaluating by comparing performance set to
realization. Result of the measurement can be used to ascertain how high the deviation occurs
and how far the improvement has been achieved so that further action on performance
measurement results can be taken (Hartini,2012:84). Tika (2010:121) defined performance as
work or activity of someone or group in an organization orienting to result and the performance
was affected by various factors to achieve the purpose of organization. Assessment of success in
achieveing the purpose can be ascertained from implementation of work result. Simbolon
(2015:92) opined that company performance was success level of management in company
resources management in order to create value for stockholder.

The Fourth International Conference on Entrepreneurship | Book Three
136
Strategy of Innovation
Strategy of innovation is as a form of formal plan regulation and it develops long term strategy
of organization to achieve purpose and target of organization (Sidow and Ali, 2014:114).
Strategy of innovation is new paradigm, different focus and new tools. The outcomes are
differentiation in form of new market, new business model, dan increased value which will yield
new growth (Sniukas, 2014:1). Nurjanah (2015:28) opined that innovation has been known as
noteworthy factor in escalating profit, positioning and performance for company in
encountering market dynamics. By performing innovation, organization shows off to
transformation of dynamic market to create or maintain its competitiveness.
Organisational culture
Sutrisno (2010:2) defined that organisational culture as device of values system, trust,
assumptions, or norms which have stood protractedly, agreed and followed by the members of
an organization as guidance of attitude and behavior and solution of problems of its organization.
Tika (2010:14) opined that the main function of organisational culture was as differentiator limit
to organization, as adhesive among employees in organization, to promote stability of social
system, as control mechanism in uniting and establishing behavior of employees, as integrator,
as medium to solve main problems of organization, as reference in company, as reference in
establishing company plan and as communication device.
Leadership Style
Leadership style is pattern of leader behavior in affecting attitude, behavior and others for her or
his followers. Leadership style of a leader can vary depend on quantity and quality of the
followers, situation and culture of social system. A leader can use a number of different pattern
or style in affecting her or his followers (Wirawan, 2013:352). Sengupta and Sunita (1997) in
Mas’ud (2004) in Marta dan Suharnomo (2011) stated that leadership style consisted of four
dimensions of leadership style namely: Authoritarian Style, Nursery Style, Task Oriented Style
and Participative Style. Behavior of leadership style was interaction ways of a leader in
executing activity of her or his employees. Behavior style and action style will emerge from
ways of the leader while executing work (Soekarso, dkk. 2010:44).
CONSEPTUAL STRUCTURE

The Fourth International Conference on Entrepreneurship | Book Three
137
Hypothesis
1. There is effect of leadership style which is significant to company performance of PT.
Bintang Sarana Ekspress.
2. There is effect of organisational culture which is significant to company performance of PT.
Bintang Sarana Ekspress
3. There is effect of leadership style which is significant to strategy of innovation of PT.
Bintang Sarana Ekspress
4. There is effect of organisational culture which is significant to strategy of innovation of PT.
Bintang Sarana Ekspress
5. There is effect of strategy of innovation which is signigficant to company performance of
PT. Bintang Sarana Ekspress
RESEARCH METHODS
Variable and Definition of Operasional Variabel
Definition of operasional variable is required in order to measure a concept. As for the
definition of operasional variabel from each variable of this research namely:
Population and Sample
Writing of this thesis used quantitative research approach. Samples used in this research were
obtained by sampling technique of probability sampling with saturated sampling. Populations
used in this research were middle management and staff which were created as sample, so that it
can be stated that samples in this research were saturated sample. Quantity of samples which
were created as respondents in this research was 20 people. Reason of sampling of middle
management and staff was fixed since a) was executive of summit management decision who
was able to interact with employees and summit management and b) often involved directly
with policies implemented by summit management.

The Fourth International Conference on Entrepreneurship | Book Three
138
Data Collection Method
Data source used in this reseach originated from primary data and secondary data. Primary data
obtained by using data collector tool by utilizing questionnaire as data collector tool and
secondary data was monthly financial report of company. Questionnaire in this research used
closed question format with alternative answers which have been provided. This research used
interval measurement scale to evaluate answers from respondents. Respondents were asked to
determine the choice of answers on rank in accordance with their respective thoughts. This
research used likert scale to measure level of bargain to a question with criterias which have
been determined.
Data Analysis Technique
Data analysis method used in this research was SEM method based on variants by utilizing
analysis of Partial Least Square (PLS) since researchers intend to ascertain relation among
variables obtained from direct survey result. PLS analysis could be used in sample quantity
which was not great and could be applied in all data (Abdillah dan Jogiyanto, 2015:150).
Examination in this research used smart PLS version 3.0 software. PLS analysis was executed
by three steps namely, outer model analysis (convergent validity, discriminant validity and
composite realibility), inner model analysis (assessment of goodness of fit and inner model
hypothesis test) and hypothesis test. In this research there was intervening variable namely
strategy of innovation. It could be determined as intervening variable if variable of strategy of
innovation influences relation between variables of independent and dependent. Examination of
direct or indirect effect was executed by testing strength of indirect effect of independent
variable to dependent variable through intervening variable. It could be stated that it had direct
effect if the coefficient value of its direct effect was greater than its indirect effect and it could
be stated that it had indirect effect if the coefficient value of its indirect effect was greater than
its direct effect.
RESULT
Outer Model Evaluation
Convergent Validity
An indicator could be stated that it had its convergent validity if it had outer loading value
>0,5 Hussein (2015:19). Cut-off AVE value which was often used was 0.50, in which AVE
value minimum 0.50 indicated standard of good convergent validity namely condition in
which latent variable could explain the average more than half of variance from its
indicator (Purnami, 2013:58). Since in this research outer loading value >0.5 was obtained
accordingly there was no indicator which was removed and validity of each indicator
variable could measure exactly or it could be stated that the whole indicators were valid.
Discriminant Validity
Discriminant validity could qualify the requirement if cross loading value of indicator in its
variable was the greatest compared to other variables. The result of cross loading above
indicated that each indicator used in this research had the greatest cross loading value in that
variable itself compared to the other variables. It could be stated that indicator used in this
research had good discriminant validity value in its respective variables. The other method
used to assess discriminant validity was comparing square root of average variance
extracted value of each construct with correlation among the other constructs in model. If
the root value of AVE of each construct was greater than correlation value between
construct and the other construct in model, it could be stated that it had good discriminant
validity value. AVE value for each variable had construct value > 0.50 which meant no
problem of validity convergen in the tested model.

The Fourth International Conference on Entrepreneurship | Book Three
139
Composite Reliability
Composite reliability tested consistency in measurement of each variable. Composite
reliability could be stated that it was favorable if it had the value above >0.70. Based on the
test result it could be seen that composite reliability value for each latent variable had value
> 0.70 and it could be stated that measure used in this research was reliable.
Outer Model Hypothesis Test
Advisability of a model also could be seen from hypothesis outer loading test, in which if t-
statistik was greater than t-hitung (1.96) accordingly it could be stated that it was significant
which meant the indicator could be used as measure to latent variable. From the test result it
could be seen that t-statistik for each indicator already stood above recommended value
specifically above 1.96 or t-hitung > t-tabel. The result was stated that indicator in variable
of leadership style, organisational culture, strategy of innovation and company performance
could be used as measure to the variables.
Inner Model Evaluation
Godness of Fit Assessment R-Square Test was used to variant measurement in transformation of independent variable
to dependent variable. The higher R2 value accordingly the better prediction model and
proposed model. Based on the test result it could be discovered that R2 value for company
performance variable was in the amount of 0.763. This value indicated that company
performance was affected by leadership style and organisational culture in the amount of
76.3%, the rest was in the amount of 23.7% was affected by other factor which was not
found in model and R2 value for variable of strategy of innovation was in the amount of
0.297. This value indicated that strategy of innovation was affect by leadership style and
organisational culture in the amount of 29.7%, the rest was 70.3% was affected by other
factor which was not found in model.
Goodness of fit assessment in PLS model could be discovered from Q2 value. Q2 value had
the same meaning with coefficient of determination (R2). It could be stated that the higher
Q2, accordingly the fitter model with data. From model in this research total Q2 value
which was obtained was in the amount of 83.4 % which meant the magnitude of data
percentage which could be explained by model was in the amount of 83.4 % while the rest
was 16.6 %, in which this was the effect of other variable which was not found in model.
Inner Model Hypothesis Test Hypothesis of research could be accepted if value of t count > t table in the error rate (α) 5%
specifically 1.96. Result of the research indicated that t-statistik was greater than t-tabel
which meant that there was positive and significant effect from leadership style effect to
company performance (H1), there was positive and significant effect from leadership style
effect to strategy of innovation (H3) and there was positive and significant effect from
effect of strategy of innovation to company performance (H5). However, result of the
different research was showed in (H2) specifically there was no significant effect from
organisational culture effect to company performance and (H4) there was no significant
effect from organisational culture effect to strategy of innovation.
Direct and Indirect Effect From result of the research it could be seen that coefficient value of direct effect path of
leadership style to company performance was in the amount of 0.480 while coefficient of
effect path of leadership style to company performance through strategy of innovation was

The Fourth International Conference on Entrepreneurship | Book Three
140
0.695. The calculation result indicated that effect coefficient through strategy of innovation
was greater than its direct effect acoordingly it could be stated that the correlation of
leadership style to company performance was greater than its effect when it was mediated
by variable of strategy of innovation.
DISCUSSION
In this research, examination of direct effect of leadership style and organisational culture to
company performance and also examination of indirect effect of leadership style and
organisational culture to company performance through mediation of strategy of innovation as
intervening variable was conducted.
Acceptance of hypothesis 1 indicated that leadership style of someone could affect company
performance. It meant, when PT. Bintang Sarana Ekspress was led by someone with autocratic
leadership style accordingly the style could affect to company performance. In this respect,
autocratic leadership style obtained effect coefficient value specifically 0.858. If autocratic
leadership style was continually used accordingly company would be able to affect people who
were in the company through decisive communication process, favorable and hard to achieve
organization goal which was expected. Commercial Director of company in each discussion
always emphasized the importance of result and profit while she or he positioned as facilitator
and executor to develop synergy among individuals in group through decision that she or he
made. Leader did not expect feedback from subordinate so that leader did not understand
condition and organization requirement for the development of organization in the future.
Determination of company performance in the future was on the perception of the leader. Denial
of hypothesis 2 indicated that organisational culture which was going on in the company did not
affect to company performance. It meant, organisational culture did not affect since internal
environment of company which was very political in which many problems occurred that were
solved by making decision based on invidual or group having the strongest political power and
also formed groups which was contrary to each other in which loyalty to groups exceeded
loyalty to organization. Analysis result of variable of risk taking obtained the highest effect
coefficient value specifically 0.870. Action of risk taking which was conducted by company
was not able to improve the effectiveness of the company. This case indicated that
organisational culture did not affect to company performance which meant that it could not
improve competitiveness of company.
Acceptance of hypothesis 3 indicated that leadership style through strategy of innovation
affected to company performance, which meant in this research it indicated that leadership style
in company would be able to apply fit strategy with characteristics of the company and its
environment condition and able to determine company strategy both long term and short term.
This case could be seen from strategy of innovation by research and development it obtained
high effect coefficient value specifically 0.914. Leadership style such as the innovation showed
by the program which was triggered through external research having concept background of
“trucking” less gave economic value for company so that leader triggered “retail delivery” in
which leader aimed to reduce costs to be lowe and obtained higher revenue.
Denial of hypothesis 4 indicated that organisational culture which existed through staretgy of
innovation did not affect to company performance, which meant in this research it indicated that
high formalization and centralization in organisational culture of company would inhibit process
participation of strategy of innovation. Organisational culture did not affect since there was
paradigm in company which refused to look for and follow the evolution which occurred out of
the company to best way of business practice, new managerial approach and innovative ideas.
Internal environment of company which was very political and unilateral bureaucracy made
member of the organization difficult to communicate each other when they worked. Employees
gave poor perception to organisational culture to strategy of innovation. However, in this

The Fourth International Conference on Entrepreneurship | Book Three
141
perception formed the answers with the average value for each variable specifically > 3.50
which included in “agree” category. It meant that employees worked based on organisational
culture which was apllied by company, if organisational culture had anomaly which was
occurring with employees accordingly employees performance could be affected.
Acceptance of hypothesis 5 indicated that strategy of innovation developed by company could
affect company performance. Transformation in business process innovation was started from
strategic initiatives coming from top management team. This case was conducted by company
to create potential opportunities. Financial data indicated that strategy of innovation which was
executed by PT. Bintang Sarana Ekspress included in high category and increased company
performance along with the innovation.
CONCLUSION
Leadership style affected positively to performance of PT. Bintang Sarana Ekspress which
means that the better leadership style from a leader the more it affects people to achieve the
expected goal. Enhancement of company performance also can be achieved through application
of leadership style which is mediated by strategy pf innovation. Organisational culture gives
negative effect to company performance of PT. Bintang Sarana Ekspress. Company
performance and work result which is not satisfied including organisational culture that tends to
remain within the organization since there is no compatibility between individual characteristics
and organisational culture so that brings up innovative strategy ideas hampered.
REFERENCE
Abdillah, W dan Jogiyanto. 2015. Partial Least Square : Alternatif Structural Equation
Modelling dalam Penelitian Bisnis. Yogyakarta : Andi.
Hartini, S. 2012. Peran Inovasi : Pengembangan Kualitas Produk dan Kinerja Bisnis. Jurnal
Manajemen. (XIV) : 1, pp. 82 – 87.
Hussein, A. S. 2015. Peneitian Bisnis dan Manajemen Menggunakan Partial Least Square
(PLS) dengan Smart PLS 3.0. Modul Ajar. Malang : Universitas Brawijaya.
Marta, O. E dan Suharnomo. 2011. Analisis Pengaruh Gaya Kepemimpinan dan Budaya Organisasional
terhadap Kinerja Organisasi : Responsiveness sebagai Variabel Intervening. Jurnal Ekonomi dan
Bisnis. (II) : 1, pp. 1 – 30.
Nurjanah, S. 2015. Peranan Manajemen Inovasi dalam Meningkatkan Kinerja Organisasi
Pendidikan. Jurnal CBAM, (II) : 1, pp. 27 – 33.
Romadon, F dan Hanifah, I. A. 2015. Pengaruh Kepemimpinan, Teknologi dan Persaingan
terhadap Strategi dan Kinerja Organisasi. Jurnal Akuntansi. (XV) : 2, pp. 1 – 17.
Sidow, M. A. and Ali, A. Y. S. 2014. Corporate Innovation and Organizational Performance:
The Case Of Somalia Telecomunication Industry. International Journal Of Business
and Law. (IV) : 1, pp. 112 – 118.
Simbolon, F. 2015. Perbandingan Sistem Pengukuran Kinerja Perusahaan. Journal Binus. (VI)
: 1, pp. 91 – 100.
Sniukas and Marc. 2014. Presentation of Doujak Corporate Development, Strategic
Innovation. Available at : www.sniukas.com. (Accessed: 15 Juni 2016).
Soekarso, Sosro, A., Putong, I dan Hidayat, C. 2010. Teori Kepemimpinan. Jakarta : Mitra
Wacana Media.
Sutrisno, E. 2010. Budaya Organisasi. Jakarta : Kencana.
Tika, M. P. 2010. Budaya Organisasi dan Peningkatan Kinerja Perusahaan. Jakarta : Bumi
Aksara.
Wirawan. 2013. Kepemimpinan Teori, Psikologi, Perilaku Organisasi, Aplikasi dan Penelitian.
Jakarta : Rajawali Press.

The Fourth International Conference on Entrepreneurship | Book Three
142
LEGAL PROTECTION FOR TRADEMARKS FOR PRODUCTS OF
UMKM PRODUCTS IN SITUBONDO DISTRICT
1Muhammad Yusuf Ibrahim
Lecturer Faculty of Law
Universitas Abdurachman Saleh Situbondo
INDONESIA
Email: [email protected]
ABSTRACT
Brand is a sign of a product and service. Brand can also provide
information for consumers about a product of goods and services produced
by the manufacturer, even the brand can show the quality of a product
goods and services. To acquire a legal protection of Marks, the owner of
the Mark shall register its Marks as set forth in article 3 of Act Number 15
of 2001 Concerning Trademarks, namely the right to Trademark is an
exclusive right granted by the state to the owner of the Mark registered in
the General Register of Marks for A period of time by using the Mark's
own or permitting others to use it.
UMKM Currently in Situbondo District has grown very rapidly. As a
business wheel in the region, many UMKM start a business by focusing on
the development of goods and services without regard to the legal
protection of the brand that has been made, so many brands made by
business actors in areas that are still not registered at the Directorate
General of Intellectual Property Rights. The lack of information and
knowledge of IPR in the regions increasingly makes the business actors in
the regions do not pay attention to the Intellectual Property owned. So if in
the future there are products of the same goods and services as those made
by other business actors with registered trademarks then business actors
will be harmed. To avoid this then research on intellectual property rights
is created.
Keywords: IPR, Brand, UMKM.
INTRODUCTION
The general principle of IPR is to protect intellectual enterprises that are creative based on
registration. In general, registration is one of the intellectual property conditions generated by a
person. Some branches of IPR requiring someone to register are Brand, Patent, Industrial
Design, Layout Design of Integrated Circuit, and Plant Variety Protection. Whereas the other
two IPR branches, namely Copyright and Trade Secret are not required to be registered for legal
protection.
Brand has the ability as a sign that can distinguish the results of one UMKM with other UMKM
in the market, for goods or services of the same or unlike. The function of the brand is not only
to distinguish a product from another product but also to act as an invaluable asset of a
company, as it is an intellectual property, especially for a well-known brand. Because through a
product brand of goods or services of a kind can be distinguished origin, quality and security

The Fourth International Conference on Entrepreneurship | Book Three
143
that a product is genuine. Through the brand, a UMKM has built a character to its products,
which is expected to create an increasing reputation for the use of the brand.
From that background, the brand can be used as an asset for the company, therefore the
employer must know about how a brand gets legal protection as well as how its registration
process, its transfer, and the removal of legal protection of the brand in the trade of goods and
services.3
LITERATURE REVIEW
Brand Definition
The definition of a brand is formulated in Article 1 paragraph (1) of the Trademark Number 15
of 2001 which reads, Brand is a sign in the form of pictures, names, words of letters, numbers,
arrangement of colors, or combination of these elements Which has a differentiating power and
is used in trading activities of goods and services. To distinguish between goods or services
with each other. According to Article 3 of Law No. 15 of 2001 on Marks, a right to a mark is a
special right granted by a state to a trademark owner registered on the general register of a mark
for a certain period of time by itself or giving consent to a person or persons jointly, The same
legal entity to use it.
Brand for producers of goods and services is very important, because it serves to distinguish
between goods or services with each other and serves as a sign to distinguish the origin,
reputation image and bonafiditas among companies with one another similar. Brand function
also as a sign to connect a particular product with the source at once used because it can
differentiate from other goods producers. For consumers with the increasing variety of goods
and services that are marketed through the brand can be known the quality and origin of these
goods and services.
Brand Registration
The procedure for the acquisition of a right to a trademark is governed by the provisions of
Article 7 of Law Number 15 Year 2001 regarding Trademark, granted on the basis of the
application, the registration must contain:
a. Date, Month and Year.
b. The full name, nationality, and address of the applicant.
c. Full name and power of attorney's address, if the application is submitted
by power.
d. Colors if the brand applied for registration by using color elements.
e. The name of the country and the date of the first request for the mark in
the case of the application is filed with priority right.
The principle of brand registration in Indonesia uses the first to file system. First to file is the
principle of registration based on who first registered a creation either personal or legal entity
either in the form of industrial company.
Brand Redirection
Article 40 of the Trademark Law describes ways to transfer the rights to a registered mark, is:
1. Inheritance,
2. Testament,
3. Grants,
4. Agreement,
5. Other causes justified by legislation.
The transfer of rights to the mark shall be requested by the Director General of IPR to be
recorded in the general register of the mark accompanied by documents proving it. The transfer
of rights has the legal power of a third party only if it has been recorded in the general daftra of

The Fourth International Conference on Entrepreneurship | Book Three
144
the mark. A transfer of the mark may be accompanied by a transfer of name or otherwise
associated with the mark.
Brands as immaterial material can also be switched and diverted, therefore as the material
immaterial brand must be respected as the personal rights of the wearer. Property rights as a
perfect material right when we compare with other material rights provide perfect enjoyment to
the owner. The right to a trademark may be granted to another party by the owner of a registered
mark to another party through an agreement in which it contains the right to use the mark,
whether for all or part of the type of goods or services registered within a specified time and
condition.
Brand licensing through an agreement is basically a matter of granting the right to enjoy the
economic benefits of a brand within a period of time and on certain conditions as well. The
license agreement shall be registered with the Directorate General of Intellectual Property
Rights or recorded in the general register of the mark and published in the official news of the
mark.
The transfer of inheritance law, grant and testament, nothing has been applied uniformly, still
different for each class of the population. Some are subject to customary law, some are subject
to Islamic law, and some are subject to civil law. The transfer of a trademark registered with the
agreement shall be set forth in the form of the deed of agreement and accompanied by
supporting documents such as a brand certificate that supports the ownership of the mark.
Brand Removal
Trademarks registered with the Directorate General of IPR may be removed in the general
register of the mark, as contained in Law Number 15 Year 2001 on Marks, is:
a. Article 61, Removal of a trademark registration from the general register
of a mark may be made on the initiative of the Directorate General of IPR or based on
the request of the owner of the mark concerned.
b. Article 63, the abolition of a trademark registration may also be filed by a
third party in the form of a lawsuit to the commercial court.
c. Article 67, the abolition of collective trademark registration may also be
filed by a third party in the form of a lawsuit to the commercial court.
The Directorate General of Intellectual Property Rights may initiate the removal of a trademark
registration if:
a. Marks shall not be used for 3 (three) consecutive years in the trade of
goods or services since the date of registration or last resort, unless there is a reason that
may be accepted by the Directorate General of Intellectual Property Rights. The last use
is the use of such marks on the production of traded goods or services. When the last
use is calculated from the last date of use even after that the goods are still circulating in
the community.
b. Marks are used for the type of goods or services that are inconsistent
with the type of goods or services applied for registration, including the use of
unsuitable trademarks in the form of wording or letters or non-compliance in the use of
different marks.
Article 63 and Article 64 of the Trademark Law Number 15 Year 2001 Concerning Trademarks
stipulates that the abolition of the registration of a mark for the above reasons may also be filed
by a third party in the form of a lawsuit to the Commercial Court and to a Commercial Court
Judgment may only be filed an appeal to the Supreme Court. Regarding the abolition of the
registration of collective trademarks, Article 66 of the Trademark of Branding Number 15 of
2001 on Marks, states that the Directorate General of Intellectual Property Rights may remove
the registration of a collective mark on the basis of:

The Fourth International Conference on Entrepreneurship | Book Three
145
a. Own solicitation of collective brand owners with the written consent of
all users of the collective brand.
b. Sufficient evidence that the collective mark is not used for 3 (three)
consecutive years from the date of its registration or the last use unless there is reason to
be accepted by the Directorate General of Intellectual Property Rights.
c. Sufficient evidence that a collective mark is used for a type of goods or
service that is inconsistent with the type of goods or services applied for registration.
d. Sufficient evidence that such collective marks are not used in accordance
with collective brand usage rules. Removal of brand registration is recorded in the
general list of brands and announced in official brand news. An objection to the
removal of a trademark registration may be filed with the Commercial Court.
RESULT AND DISCUSSION
Protection of famous Brands
Famous Brand is a brand that becomes a symbol of pride that can be relied upon by consumers
even though consumers do not know or do not realize who the owner of the brand. The brand
issue becomes very important, with respect to the issue of legal protection and legal certainty for
the owner or the holder of the mark and the legal protection of the public as the consumer of a
good or service that uses a brand to avoid being fooled by other brands. Can not be denied again
that the problem of the use of famous brands by unauthorized parties, is still a lot happening in
Indonesia and the fact is really realized by government.
If viewed from the side of the law it can not be tolerated anymore because the State of Indonesia
has ratified the International Covenant on TRIP'S and WTO that has been in accordance with
international agreements. It is undeniable that in the world of commerce today the brand is a
manifestation of the intellectual work of human beings who have a decisive role because of the
use or use of the brand in the company, but also contains a wide legal aspect both for the owner
or holder of the rights to the brand as well as for Society as consumers who use or exploit goods
or services of a particular brand.
The famous Brand Criteria can be formulated as follows:
a. So long brand upgrading.
b. Brand appearance that has its own characteristics that are attached to the
memories of the community.
c. Brand registration in many countries.
d. Good brand reputation because the products or services produced have
excellent quality and aesthetic value and high commercial value.
e. Marketing and product distribution with a wide reach in almost all the
world.
Protection of Brand rights
Protection of Trademarks or Rights on Marks is an exclusive right granted by the State to
registered mark owners in the General Marks Register. For a period of time the holder of the
rights to the mark may use the mark himself or permit a person, some persons together or a legal
entity to use it. Protection of Registered Marks is the legal certainty of Registered Marks,
whether for extended use or as evidence in case of dispute over the implementation of
Registered Marks.
Article 76 paragraph (1) of Law Number 15 Year 2001 regarding Trademark, stating that the
registered trademark owner may file a lawsuit against another party who unlawfully uses a
marking brand in common or in whole for similar goods or services in the form of a claim of
indemnity Or termination of all deeds associated with the use of such marks. Article 76
paragraph (2) of Law Number 15 Year 2001 regarding Trademark, a registered trademark

The Fourth International Conference on Entrepreneurship | Book Three
146
infringement lawsuit is filed with the Commercial Court. This means that the jurisdiction of
adjudicating disputes or litigation lawsuits lies with the Commercial Court as a special judicial
body.
Legal protection internationally
Legal protection of registered trademarks is absolutely granted by the government to the holder
and user of the right to the mark to ensure:
a. Certainty strives for producers.
b. Attract investors to foreign trademarks, while the legal protection
afforded to local trademarks is expected to eventually expand widely in the international
world.
The national legislation on brand, society is also bound by international brand rules such as the
Paris Union Convention held on March 20, 1883, which is specifically designed to provide
protection to industrial property. Indonesia still has the freedom to govern its own Brand Law,
as long as Not contrary to the provisions already standardized in the paris Convention.
Repressive Protection
Understanding of repressive law protection is protection done to solve or overcome an event or
event that has happened, that is in the form of violation of right to brand. In repressive
protection this has a greater role to the judiciary and other law enforcement agencies such as the
Police, Civil Service Officials and the prosecutor's office to take action against brand violations.
Repressive legal protection is exercised in the event of a violation of the right to the mark
through civil suits and / or criminal charges. That the owner of a registered mark obtains legal
protection for violation of the right to the mark either in the form of a claim of compensation or
the cessation of all acts relating to the use of such marks or based on criminal lawsuits through
law enforcement officers.
CONCLUSION
Legal protection of the Trademark holder of the trade in goods and services in Indonesia is very
necessary because to prevent and avoid dishonesty of Trademarks, such as counterfeiting and
piracy of Trademarks. Not only that, but also to obtain legal certainty from the government to
the holder of a well-meaning Brand. For that the state regulates the legal provisions to create
legal protection.
Registration procedures, transfer and removal of legal protection on Trademarks in the trade in
goods and services have been regulated by the government in Law No. 15 of 2001 on Marks.
Registration is one of the requirements to obtain legal protection, but registration in Indonesia
uses a fist to file system for registration. Likewise with the transfer and removal of Brand
protection can be done if it has complied with the provisions of the legislation.
REFERENCES
Abdulkadir Muhammad, 1994. Hukum HartaKekayaan, Citra AditiaBakti: Bandung.
AndrianSutedi, 2009. HakAtasKekayaanIntelektual, SinarGrafika: Jakarta.
Djulaeka. 2014. KonsepPerlindunganHakKekayaanIntelektual: PerspektifKajianFilosofis HAKI
Kolektif-Komunal. Setara Press: Malang.
HariyaniIswi, prosedurmengurus HAKI yang benar, PustakaYustisia, Yokyakarta, 2010
HeryFirmansyah, Perlindungan Hukum TerhadapMerek, PustakaYustisia, Yogyakarta 2011
Much. Nurachmad. 2012. SegalaTentang HAKI Indonesia. BukuBiru: Jogjakarta.
Muhammad Djumhanidan R. Djubaidillah, HakMilikintelektual, Citra AditiaBakti, Bandung,
1993

The Fourth International Conference on Entrepreneurship | Book Three
147
Rachmadi Usman. 2003. Hukum HakAtasKekayaanIntelektual:
PerlindungandanDimensiHukumnya di Indonesia. PT. Alumni: Bandung.ErmansyahDjaja.
2009. Hukum HakkekayaanIntelektual. SinarGrafika: Jakarta.
Saidin. 2010. Aspek Hukum HakKekayaanIntelektual: Intellectual Property Rights. PT.
rajaGrafindoPersada: Jakarta.
Sudaryat, 2010. HakKekayaanIntelektual: MemahamiPrinsipDasar, Cakupan, Dan Undang-
Undang Yang Berlaku, Oase Media: Bandung.

The Fourth International Conference on Entrepreneurship | Book Three
148
THE EFFECT OF MARKETING MIX STRATEGY ON TRUST
AND PRODUCT PURCHASE DECISIONS BY JEMBER
SPECIFICATIONS
1Nanik Hariyana, 2Lita Permata Sari
Lecturer at the Faculty of Economics
University Of Abdurachman Saleh Situbondo
INDONESIA
Emails: [email protected]
ABSTRACT
The purpose of this study was Menegetahui and analyze Influence
marketing mix strategies to trust an d product purchasing decisions
souvenirs jember, Techniques of data collection techniques used
compilers in making this report is a qualitative method of observation,
namely by jumping directly in the field Place of
study. consumers generally purchase the product's decided typical
souvenirs jember themarketing mix strategy.
Keywords: marketing mix, and trust purchasing decisions.
INTRODUCTION
Indonesia is one country that has a wealth of natural resources, but not least the potential of
natural resources that have not been managed and touched by technology. One of them is water
potential, therefore development policy in the fisheries sector essentially leads to the welfare of
living standards, capacity, independence and access of fishermen community in the
development process through improvement of quality and quantity of production, distribution
and diversity of fishery products, Fair and prosperous national development, to achieve these
objectives needs to be developed and managed the available resources. A country that consists
of various ethnic groups and has a diversity in various fields, one of which is a typical food
area. At first we can only find local foods in the place of origin only. However, along with the
development of the era, we can now find typical food areas in various places, not only the area
of origin alone. One is the typical souvenirs typical muddy muddy ie the usualsnacks consumed
in an area. Typical snacks muddy character in an area generally reflects the character of its
people. Area residents in the area with most of the population still work as farmers, many
supported jember economy of the agricultural sector that gave birth to many souvenirs
jember and mixtures enrich typical regional products.
One of the typical souvenir of jember Is Suwar-suwir, prol tape, the consumer finds sellers
suwar-suwir and prol tape in various along the way by typical souvenir shop jember. The city of
jember is also called the city of tape, because to the creative community processing cassava-
based tape into several types of snacks are much preferred and high selling value, some
processed from the famous tape is suwar-suwir, dodol tape, prol tape, and The latest is pia tape,
which is increasingly popular especially for souvenirs and other typical souvenir from jember.
In running the food business, not just the capital taste that is needed by business
actors. Although many say the food business is never empty of consumers, in fact

The Fourth International Conference on Entrepreneurship | Book Three
149
strategy marketing Food business is still needed to run the business can generate a targeted
turnover. Especially in the middle of the tight competition of the market as it is today, the
marketing of food business Become the decisive factor for future business development.
Food business is one business that has considerable potential, has many business actors who
reap profits from this business. But not a few business people food bankrupt alias bankrupt,
kar ena marketing strategy Which is used less precisely.
Confidence (trust) has received much attention of research and has been identified as a key
driver of the success of e-commerce (Jarvenpaa et al. 2000). Consumer confidence according to
Mowen (2002: 312) is all knowledge owned by consumers and all conclusions made by
consumers about the objects, attributes, and benefits Consumers who have confidence in a
product or brand will generate interest in purchasing the product or brand. Trust is more difficult
to build and more important in the online world, as compared to offline stores, barriers that most
affect the success of the Internet as a commercial medium in the market is the lack of consumer
confidence in the internet (Jarvenpaa et al. 2000). A person forms three types of beliefs namely
object-attribute trust, attribute-benefit trust and object-benefit trust (Mowen, 2002: 312).
Online purchase decision / ofline can be influenced by several factors, including ease of
transaction, price, reputation, responsiveness, security and trust. According to Kotler &
Armstrong (2001: 226) purchasing decisions are the stage in the buyer's decision-making
process in which the consumer actually buys. K eputusan purchase has dimensions of product
selection, brand selection, the selection of distributors, the purchase amount, the timing of the
visit and Payment method (Kotler & Keller, 2012: 161).
A. Formulation of the problem based Description on background back then could Put
forward problem as following:
1. There is The influence of marketing mix strategy against an d trust product purchasing
decisions souvenirs Jember?
2. How marketing mix strategy against an d trust product purchasing decisions
souvenirs Jember?
C. Research Objectives
1. Knowing and analyze Influence marketing mix strategy against an d trust product
purchasing decisions souvenirs Jember.
2. Knowing and analyze the marketing mix strategy against an d trust product purchasing
decisions souvenirs Jember.
RESEARCH METHODS Techniques of data collection techniques used in the creation of this report authors
were interviews, observation and documentation, namely by jumping directly in the field where
the research.
The method used mainly in this study using qualitative research that its respondents are
consumers who are making purchasing decisions souvenirs products Jember.
RESULTS AND DISCUSSION
The influence of marketing mix strategies to trust and product purchasing decisions
souvenirs Jember. In running the food business, not just the capital taste that is needed by business
actors. Although many say the food business is never empty of consumers, in fact
strategy marketing Food business is still needed to run the business can generate a targeted
turnover. Especially in the middle of the tight competition of the market as it is today, the
marketing of food business Become the decisive factor for future business development.

The Fourth International Conference on Entrepreneurship | Book Three
150
Food business is one business that has considerable potential, has many business actors who
reap profits from this business. But not a few business people food bankrupt alias bankrupt,
kar ena marketing strategy Which is used less precisely.
Marketing mix strategies to trust and product purchasing decisions souvenirs Jember.
The marketing blend strategy used in marketing of Jember's typical souvenir products
business is as follows:
1. Make Brand The food business Interesting
Before you start a food business, you should have menyiapk's brand or name for
the business. Choose a name that is interesting, unique, and easy to remember by
consumers. Because the business name becomes an image that will be embedded in the
consumer, So they are easy to remember your efforts.
Besides, things to consider when looking for a business name, adjust the name of the
business on the run. Name of business can you place in front of business location by using
neon box or X-Baner in front of business location. In order for consumers who happen to
pass by, interested to stop by to buy food products presented.
2. Publish On the Community
Start marketing by introducing your business To the surrounding community. With the
introduction of products, people know what the advantages of your food business products,
the price of food offered, as well as services offered to the food business to consumers.
To introduce your food business to the community, it can be done by creating an event and
inviting the public to visit your food business Have. Besides marketing can also be done
by taking local employees who are around the location of your business, so indirectly your
employees will promote their workplace to their relatives and colleagues.
3. Give a discount for Event - event certain
Provide rebate on Event - event Certain like at the moment grand opening of the
business, or the anniversary of your efforts, it could be the right choice for promoting your
business. In addition you can also provide special pricing packages on certain days, such as
providing the price of family packages on holidays, or holidays like Lebaran, or the new
year.
With the discount price, it is enough to be the main attraction for consumers to visit your
place of business. Besides that, you can also use brochures, pamphlets, or banners to
promote discounts that your restaurant or food stall has to offer.
4. Building a Business Supporting Network You
To build a business network is not easy, but the network is a very effective
marketing. Start by creating a business network with your colleagues and close
relatives Which can help you to grow your business.
How to build a network can be done by giving Test product To your friends or
relatives. For example for those who have a business bakso stalls, you can invite colleagues
and relatives to visit tasting meatball your homemade. If your colleagues and relatives are
interested in meatball products, they will be happy if invited to cooperate with the meatball
business.
5. Creating Innovation On the Menu Offered
To avoid saturation of consumers, create innovations on the menu - menu offered your
restaurant. At least 6 months create a new menu in your food business. The many variations
of the menu offered, will be the main attraction for each consumer.
6. Improve service quality
In providing services to consumers, should consider the time of serving food, the
quality of food taste and cleanliness and security of the place of business. Consumers will

The Fourth International Conference on Entrepreneurship | Book Three
151
feel uncomfortable if waiting for serving the food is too long, for that try to on time In
providing services.
Furthermore, you also need to maintain the quality of the taste of food produced, so
consumers are not disappointed if the food they ordered was not good. And the third is to
keep the cleanliness and security at the place of eating, so that consumers who eat in your
restaurant feel comfortable and happy to visit again next time.
Basically marketing the food business is very important, to do business promotion in total so
that your business is not less competitive with other players. Whether from the grand
opening until your food business is up and running, continue promoting and marketing
continuously. If you need to set aside 5 - 10% business turnover for the cost of promotion
and marketing your business. Send regards for success.
CONCLUSION Food is a staple for everyone. Opening the food business will indeed be very profitable, because
everyone would need to eat. There are many types of food businesses to choose from. One of
them is the prospect of a typical regional food business.
Each region certainly has a special food, which can not be found in other areas. Let's say,
Semarang has typical food of spring rolls. This food is always the fruit of tourists visiting the
city. Consumers of course want to try foods typical of other regions or miss home native
cuisine. Therefore, local food business is very prospective.
REFERENCES Alma, Buchari. 2000. Marketing Management and Marketing Services, Revised
Edition. Molds IV. Bandung: Alfabeta.
Arikunto, Suharsimi. 2006. Research Procedure A Practice Approach, revised
edition VI. Jakarta: PT Rineka Cipta.
Augusty, Ferdinand. (2005), Structural Equation Modeling in Management Research, 3rd ed.,
BP. UNDIP.
Belch and Belch. 2004 Celebrity Opinion Leader. ( Http://www.scribd.com/doc/ ). [November
19, 2004]
Braharja, Mavi. 2008. Various Media Graphic Communications as of 1 February
2008. http://www.mavibraharja.com [19 November 2008]
Buda R. And Y. Zhang. 2000. Consumer Product Evaluation: The Interactive Effect of
Messeage Framing, Presentation Order, and Source Credibility, Journal of Product and
Brand Management, Vol. 9, No. 4: 229-242.
Byrne, Barbara M. (1998) StructuralEquationModelingwithLISREL, PRELIS and SIMPLIS:
Basic Concepts, Applications and Programming. LEA, New Jersey.
Chairur, Heru. 2003. Effects of Advertising Messages on Television Soap Customer Satisfaction
(Case study Patrang District of Jember). (Unpublished thesis).
Churchill, Gilbert A. and Carol Suprenant (1982), "An Investigation into theDeterminants of
Customer Satisfaction," Journal of Marketing Research, 19 (November), 491-504.
Danny Satria (2009): Analysis of the Influence of Structure and Ads Formation of Djarum
Cigarettes on Purchase Decision, Satisfaction and Customer Loyalty (Case Study on
Motor Club Members in Jember)
Dharmmesta. 1990. Modern Marketing Management, Liberty Yogyakarta.
Diana. 2000. Influence of Advertising Shampoo Sunsilk, Pantene and Clear Positive Attitude
Toward Consumer Faculty of Economics, University of Jember. (Unpublished thesis)
Dimyati, 2009. Sem Analysis in Test of Influence of Variable Variable on
Loyalty. Jember; Media Discourse Partners
Http://www.jemberbagus.com/2016/05/ini-dia-7-oleh-by-khas-jember-the-most-many-
dicari.html

The Fourth International Conference on Entrepreneurship | Book Three
152
THE INFLUENCE OF SIZE OF CREDIT, GENDER, AGE AND
EDUCATION TO OPPORTUNITY OF SMEs PERFORMANCE
IMPROVEMENT IN MALANG
1R.A. Sista Paramita
Universitas Negeri Surabaya
INDONESIA
E-mail: [email protected]
ABSTRACT
This study aims to analyze whether there is a relationship between the
size of the credit, gender, age and education of SME owners in Malang to
the opportunity of improving the performance of SMEs. This study uses
primary data which obtained by interviewing 100 respondents and after
sorting the questionnaire, only 81 respondents gave complete answers.
The sampling technique using simple random sampling. This research
was conducted in Malang during October 2016. This research was
employed Logistic Regression as analysis technique. The result of the
research shows that giving credit and gender has an effect on predicting
performance improvement, while age and education have no effect
predict improvement of SME performance. The implications of this study
indicate that SMEs need capital from bank to run and develop their
business. Gender has affect in predicting the improvement of SMEs
performance. It seems that man and women owned SMEs has an ability
and perform at similar levels to achive such high business-related
experience. While age and education did not reveal any prediction about
performance.
Keywords: Size of Credit, Gender, Age, Education, SME’s Performance
INTRODUCTION
Small and Medium Enterprises (SMEs) is one business sector that became the backbone of the
national economy. Although SMEs are independent economic activities of the people and
managed by community groups or families, the existence of SMEs is thought to greatly affect
the economy as it contributes to the absorption of unemployment through the creation of new
jobs (Adomako et al., 2015). SMEs have at least three indicators that show a significant role in
the Indonesian economy. First, the number is quite large and covers every sector of the
economy. Second, SMEs have great potential in absorbing labor. Third, SMEs contribute
substantially to national income (Hasan, 2013).
Every business, whether large, medium or small-sized companies will certainly expect a better
performance from year to year. The Government of Indonesia has identified the SME sector as
the key to promoting growth, employment creation, and poverty alleviation. Currently the
contribution of SMEs to the National GDP is 60.3% (Tempo, 2016). Even said that the
Governor of Bank Indonesia will target the contribution of the SME sector can reach 70% of
GDP with the support of increased access to financial services for SME financing. Bank

The Fourth International Conference on Entrepreneurship | Book Three
153
Indonesia (2018) has also undertaken research and development of SMEs to improve access to
business credit by utilizing financial services such as credit and financing.
Java Island has the most population in Indonesia, which also makes East Java has the largest
number of SMEs amounting to 6,825,931 SMEs, scattered in several cities and districts, with
the distribution as shown in table 1. Based on table 1, Malang as the second area that has the
largest number of SMEs in East Java which still has the potential to become more developed as
SMEs in East Java.
Table 1. Distribution of Number of SMEs in East Java in 2016
District Number of SMEs
Kediri 29.306
Blitar 21.291
Malang 77.778
Probolinggo 26.125
Pasuruan 24.257
Mojokerto 17.480
Madiun 22.622
Surabaya 260.762
Batu 23.544
Source: Central Bureau of Statistics, 2016
SMEs are often perceived as the main driver of the economy and the source of job creation, yet
they often still face financial difficulties (Schwab, 2015). Loan disbursement for micro, small
and medium sized segments became a segment of interest both by the banking industry and
other non-bank financial services. SMEs that run their business in Indonesia are often informal
SMEs. The majority of them have not registered their business so that their business activities
are still not legal entities. This has the potential to be a barrier to cooperation between large
companies and SMEs (both as producers, suppliers, and service providers). From the financing
aspect, informal SMEs will have limited access to financing institutions, especially banks. In the
IMK 2013 BPS survey, 28% reported access to finance as a major constraint (International
Finance Corporation, 2016)
The World Economic Forum Competitiveness Report 2014 states that 11% of SMEs say that
access to financing is the most severe constraint factor. Citing the BPS report, 35.10% of SMEs
expressed capital difficulties, followed by market certainty of 25.9% and raw material
difficulties 15.4% (Noer, 2005). Under such conditions this group will be very difficult to get
out of the problems that usually have been running long, unless there is intervention from other
parties. References (Saudin, 2008) further say that interventions to break the chain of concerns
can be undertaken if there is strong commitment from the government and the community
through lending of capital.

The Fourth International Conference on Entrepreneurship | Book Three
154
Figure 1: SME barriers per Formal status
Source: International Financial Corporation (2016).
Figure 1 shows that lack of financing is one of the three major challenges in business run by
SMEs. Companies with lower turnover experience greater constraints in relation to access to
finance. Other barriers that faced by the SMEs besides access to finance for SMEs are
competition (66%), material or labor costs are high (37%), rent / lack of business premises
(22%) and lack of skilled staff / difficulties in maintaining staff Experts / skilled (23%).
Demographics aspect is one of several very important aspects in influencing entrepreneurship,
job creation and innovation (Stangler and Spulber, 2013). The severity of the problems faced by
SMEs varies, including in terms of mastering a business sector, legal structure, including the
age of the business (Fatoki and Asah 2011; Omiunu 2014).
According to data from the Central Bureau of Statistics, from 2 million units of micro
businesses, 40.8% are managed by women. Out of a total of 5.5 million employees working in
small companies and home industries, 45% of these workers are women. Women entrepreneurs
are more likely to be found in small and micro enterprise sectors than in large-scale enterprises.
According to data from the Indonesian Employers Association (IWAPI), of the sixteen thousand
members in 2006, about 85% were concentrated in small businesses, 12% in medium
enterprises and only 3% in large-scale enterprises. There are about 3,500 female cooperatives,
which constitute 30% of the total number of cooperatives in Indonesia. Most of them are located
outside of Jakarta and 82% of female owners or managers of small and medium enterprises have
monthly income of less than 50 million rupiah. Over 90% of women who own or manage small
to medium sized enterprises use their savings to build their business. In addition, many women
entrepreneurs have limited knowledge about access to financial institutions and still register
their businesses on behalf of their husbands.
One example, in Cameroon which consider as an emerging economy, gender is not associated
with business outcomes (Akinboade 2015), but other research found different conclusion
(Delmar & Wiklund 2008; Richbell, Watts & Wardle 2006). Gottschalk and Niefert (2012)
found that business-related experience varies between male and female firm owners. Popescu,
Deaconu and Popescu (2014) mentioned that most of the firms having lack of managerial skills
and experience there for they become underperform. In small firms, the owner usually assumes
has the role as a manager (Popescu et al., 2014), therefor the performance of the entity relies
heavily on the experience of the owner as a manager. This implies that business-related
experience plays a significant role in a firm’s performance.
LITERATUR REVIEW
Small Business Performance
Performance is a form of activity or program implemented by the head of the company to direct
and control the performance of employees, and provide an overview of the extent to which the

The Fourth International Conference on Entrepreneurship | Book Three
155
results achieved by the company (Sudiarta, et.al., 2014). Studies on employee performance
various measures (Radipere and Dhliwayo, 2014; Dele, 2012). These measures can be
summarized as financial and financial measures. Financial measures include cash flow, return
on assets, return on equity, sales and profit as a means of assessing firm performance. While the
nonfinancial measure includes aspects such as customer service, marketingeffectiveness, human
capital, strategy achievement, innovation, employee satisfaction, employee number, financial
practice, processes, andcorporate culture (Dele, 2012).
Some studies (Li, Huang and Tsai 2009) suggest a combination of financial and non-financial
measures in order to offer a complete evaluation of the business performance. The use of
nonfinancial data was adopted in this study for several reasons. Several scholars affirm that such
nonfinancial measures have been endorsed by both academic andmanagers. (Ii) Nonfinancial
data can provide indirect, quantitative indicators of a firm's intangible assets, and (iii)
nonfinancial measures are less susceptible to external " Noise "than accounting measures. Noise
being change inperformance measure that can not be controlled by business owner, such as
changes in the economy or even luck.
Secondly, the perceived measure of performance (perceived performance) was used as a
substitute to financial data as recommended by Dele (2012). This is due to the limitations of
financial data by Rooks, Szirmai & Sserwanga (2009) in the case of small businesses in Uganda.
Smallbusinesses are reluctant to share their financial data due to several reasons (eg, e-mail:
Rooks, Szirmai and Sserwanga, 2009), including no financial records, poor financial record
keeping or manipulating books for the sake of tax evasion tomention a few.
Size of Credit
Adequate working capital and use with careful planning will be beneficial, because with
sufficient working capital can enable a business to operate economically. The amount of capital
in need depends on the type of business to be worked on. In everyday reality we recognize the
existence of small businesses, medium enterprises, and large businesses. Each requires capital to
some extent. Thus, the type of business determines the amount of capital required. Working
capital is divided into three concepts, namely quantitative concepts, qualitative concepts, and
functional concepts. The working capital of a functional concept is based on the concept that
every fund used by a business is to generate income (income) (Oktavianti, 2013).
The results of the Federal Reserve Bank of New York (2013) survey show that of the 812 small
businesses surveyed in New York, New Jersey and Connecticut, the majority of owners said that
ease of access to capital was important, but only a third applied for credit. Those applying for
the majority credit experience better business performance.
Subjective measurements of performance are selected from objective measurements for several
reasons (Miles, et.al., 2000). 1) Small and Medium Enterprises are often very cautious and
strong in safeguarding business financial data. 2) objective financial data of small businesses are
not accurately publicized and are sometimes not available. 3) the existing data is largely
difficult to interpret. 4) subjective assessment by comparing with other similar business
performance would be more appropriate to use good.
Therefore, the hypotheses that can be built from the concept of the influence of credit to the
probability of improving the performance of SMEs are as follows:
H1: The amount of credit received by SMEs has an effect on the probability of improving the
performance of SMEs
Gender
The social feminist mention that women differ inherently as a result from early socialization
(Calas & Smircich 1989). When compared between women and men, then between women and
men have differences in achieving the desired goals (Verheul, Thurik & Grilo 2008). Due to

The Fourth International Conference on Entrepreneurship | Book Three
156
their different attitudes towards risk and growth, women, therefore, adopt a different approach
to business activities, thus resulting in small business entity size and lower expansion rates
When viewed from attitudes to risk and business development, women seem to adopt different
approaches in running their business activities, so this will result in small business entities and
low expansion rates (Gottschalk & Niefert 2012).
Men and women also view the world in different ways. Calas and Smircich (1989) Indicates that
Social Feminist theories suggest that the experiences of female respondents indicate a valid
basis for knowledge development and organizing society. By comparing with the views of
liberal feminist theories, then between men and women are not essentially similar by
fundamental nature. It is argued that male perception is regarded as innately superior or more
functional to the benefit of society (Gottschalk & Niefert 2012). Literature developed countries
provides a clear picture of how male- and female-owned firms differ in performance-related
issues - firm closure rates, level of sales, profits and employment creation (Robb & Wolken
2002).
The Asia Foundation reports that women have 35% of small and medium enterprises (SMEs) in
Indonesia. In the Asia / Pacific region, Indonesia ranks highest in terms of the number of
women as SME owners, although one of the reasons for the high entrepreneurship among
women can be attributed to low employment in the formal sector for women. Therefore, the
hypotheses that can be built from the concept of gender influence on the probability of
improving the performance of SMEs are as follows:
H2: Gender of SME owners affects the probability of improving the performance of SMEs
The Business Owner Age
It is a fact that the age of business owners in all studies is determined in years, and more
specifically within agegroups (Kaunda, 2012). TheILO (2006) revealed that one-third of all
successful entrepreneurs originate from the age group of 18 to 34 years. Similarly, Osunsan and
Sumil (2012) found that majority of small business owners within the range of 20 to 39,
accounting for half of small business owners in their study. (26%) within the age group 55 to 64
in his study.
Kaunda (2012), running a multiple regression, found that the age of owner has an inverse
relationship with business performance. More specifically he found that the age group of 18 to
24 made the most significant contribution to the performance, followed by the 25-34 year old
group. He however discovered that the age group 35-44 year old made a negative contribution
to performance.
Therefore, the hypothesis that can be built from the concept of the influence of age to the
probability of improving the performance of SMEs is as follows:
H3: Age of SMEs owner has influence to the probability of improving the performance of
SMEs
Education
Education is a form of long-term investment in the field of human resources, because the
benefits can only be felt minimalalsetelah ten years (Atmanti, 2005) Therefore, there is actually
a relationship between the level of income with the level of education The higher the level of
education the higher the productivity of employees and Ultimately affect the level of income.
Education simultaneously has a significant effect on income (Utari, and Dewi, 2012). There is a
relationship between income and education levels. The higher the level of education the higher
the level of employee productivity and ultimately affect the income level of a business. In other
words, education simultaneously has a significant effect on income.
Managerial competence is measured by level of education, managerial experience, from first
gaining experience and business knowledge that positively impact on the performance of Small

The Fourth International Conference on Entrepreneurship | Book Three
157
and Medium Enterprises (UMKM) (Hisrich and Drnovsek, 2002; Martin, 2008). Testing of
management competencies conducted by Martin (2008) on MSMEs who have been successful
in business practices, they found that lack of managerial experience, personal abilities and
qualities, was found to be a consideration of why a Micro Small and Medium Enterprise
(MSME) falls in business. Lack of education and training will reduce the ability of MSME
management in South Africa about failing to do business (Herrington and Wood, 2003).
Therefore, the hypothesis that can be built from the concept of the influence of education on the
probability of improving the performance of SMEs is as follows:
H4: SME owner education will have a positive effect on the probability of improving the
performance of SMEs
RESEARCH METHODS
Type of Research
This study aims to see a picture of improving the performance of SMEs based on the amount of
credit received, gender, age, and Education SME owners. The unit of analysis in this study is
SMEs in Malang who apply for credit to financial institutions of Bank and Non Bank. For non-
bank financial institutions, many respondents use the services of financial institutions from
cooperatives, KSU, and BMT (Baitul Maal wat Tamwil) in Malang.
Data retrieval
The data used are cross sectional data in the form of primary data taken using survey method
that is research method to a set of objects, but only take some of the population in a certain
period by using questionnaire. Selection of sample using Simple random sampling, where
sampling is randomly simple. This sample is taken so that each research unit or elemental unit
of the population has equal opportunity to be selected as sample. The data were collected during
October 2016 by taking locations in Sukun, Lowokwaru, Klojen, Kedung Kandang, Blimbing,
Kepanjen, Singosari, Dau Malang, Lawang, Sumber Pucung, Wagir and Pakis. Of the 100
questionnaires distributed, only 91 questionnaires were returned, and the complete data was
only 81 respondents.
Variable and Measurements
The variables used in this study consist of dependent and independent variables. The dependent
variable is the Improved performance variable of SMEs, as measured by see whether there is an
increase in turnover or not. This variable is a Dummy variable, based on respondent's answer
which is then expressed in category form. Category 1 for SMEs that shows an increase in
performance, Category 0 indicates there is a decrease in SMEs performance.
Other variables are independent variables, namely 1) The credit score, indicating the nominal
amount of credit received by the SME owner, and 2) Gender refers to the classified sex of the
owner of SMEs, ie male and female, 3) The age of the owner is classified into young age and
Old age, and 4) Education, which is classified based on the latest education of SME owners.
Table 2. Operational Definition
Variable Operational Definition Measurement
Value of
Credit
Amount of credit granted by the bank to
SME
credit = Ln (amount of credit
received)
Gender Gender SME owners 1 = Male 2 = Female
Age of owner Age of business owner classified based
on research Kaunda (2012)
Kaunda (2012):
1 = the age group of 18 to 24
2 = 25-34 year old group
3 = 35-44 year old
4 = more than 45 years old
Education Latest education from SME owners
1 = SD 2 = SMP
3 = SMA 4 = University

The Fourth International Conference on Entrepreneurship | Book Three
158
Performance The results achieved by the company,
viewed from the financial and non
financial aspects, namely:
1. There is an increase in profit
2. There is an increase in turnover
3. There is an increase in the number of
labor
0 = no increase
1 = there is an increase in
walaupin only one aspect
Data Analysis Method
The research consists of descriptive and verification research. The data used are primary data
obtained from interviews and data collection in the field through questionnaires. The research
method used is: descriptive survey and explanatory survey. The object of research is the amount
of credit, gender, age, and education to improve the performance of SMEs. Measurement and
descriptive analysis is done to obtain the picture or portrait of respondents. The result of the
descriptive measurement is then used as the basis for performing statistical analysis. Further
technical analysis will be solved by using logistic binary regression model (binary logistic
regression).
Logistic logistic regression analysis (binary logistic regression) is used to see the effect of
independent variables X1, X2, ...., Xk on the dependent variable Y in the form of binary
response variable which has only two values or also predicts the value of a dependent variable Y
(which is a variable Binary) based on the values of the independent variables X1, X2, ...., Xk.
Defined α = 0.1 as the tolerable error level.
The binary logistic regression equation of this research is:
ln(ρ/1-ρ)= ρ =ρ) = ß0 + ß1(Credit ) + ß2(Gender) +ß3(Age) +ß4(Education)
FINDING
Characteristics of Respondents
Respondents of this research are the owners of SMEs located in Malang and still operate until
now. The number of Samples of 81 people, with the youngest age is 27 years old and the oldest
is 63 years.
Table 3. Respondent Characteristic
Variable Number of Responden %
Gender 1. Male 62 76,5 %
2. Female 19 23,5 %
Age 1. 18 – 24 0 0
2. 25 - 34 8 10%
3. 35 - 44 30 37%
4. > 45 43 53%
Pendidikan 1. Elementary 25 31%
2. Junior 16 20%
3. High 20 25%
4. University 20 25 %
Source: Results description of respondent tabulation, processed

The Fourth International Conference on Entrepreneurship | Book Three
159
B. Model Feasibility Test
Iteration History table results in block 0 and 1 are as follows:
Table 4. The Result Test Blocks 0 and 1
Block 0 Block 1
-2 Log Likelihood 56,511 40,270
Overall Percentage 88,9 88,9
Source: SPSS output
The result of the Iteration History table in block 0 shows that the value of -2Log Likelihood (-
2LL) at the beginning (Block number = 0) is 56,511, while in Block Number = 1 denotes the
decreasing -2LL number, to 40.270. This indicates Likelihood's decrease in binary regression is
similar to the decrease in "sum of squared error" in the regression model, which shows a better
regression model (Santoso, 2015).
Overall Percentages results show the number 88.9. In Block number = 0, the overaall percentage
value before the independent variable is included in the model is 88.9%. The same result
obtained on block number = 1, also shows the value of 97.3%. This result means the accuracy of
this research model is sebear 88.9%.
Test of goodness of fit or model feasibility test for Logit Regression can also be done by
looking at the output of Omnibus Test, Nagelkerke R Square, and Hosmer and Lemeshow Test.
Table 5. Summary Output To Test The Model
Sig
Omnibus Test 0,003
Nagelkerke R Square 0,362
Cox & Snell R Square 0,182
Hosmer & Lemeshow 0,783
Source: SPSS output
Table 5 shows that the Omnibus Test yields a significance value of 0.003 (<0.05) indicating that
the addition of the variable can have a real effect on the model, and the model is said to be FIT.
If on the regression model (OLS) to test the simultaneous significance using the F test, whereas
in logistic regression using Chi-Square value. This test is called Maximum Likelihood test.
Therefore, the value of p-value (sig) Chi-Square is 0.003 where <0.05 indicates there is a
significant influence simultaneously between the size of credit, gender, age, and education on
the opportunities for SME performance improvement.
Table 3 also shows from the Summary Model, where the value of Nagelkerke R Square is 0.362
and Cox & Snell R Square is 0.182, indicating that the ability of independent variable to explain
dependent variable is 36.2% and there are 63.8% Beyond the model that explains the dependent
variable. The value if Linear regression (OLS) is known as R-Square, whereas in Logistic
regression known as Pseudo R-Square.
Hosmen and Lemeshow results can be used to compliment the Goodness of fit test. The
probability number is 0.783 where this number> 0,05 then Ho is accepted. This means that the
binary regression model is appropriate for further analysis, since there is no apparent difference
between the predicted classification and the observed classification.
Testing the Regression Coefficients
With the t test seen at the end of the output, it is seen that Educational variables are statistically
significant, visible numbers of significance below 0.05. Interpretation and Prediction The
equation is as follows:
Ln
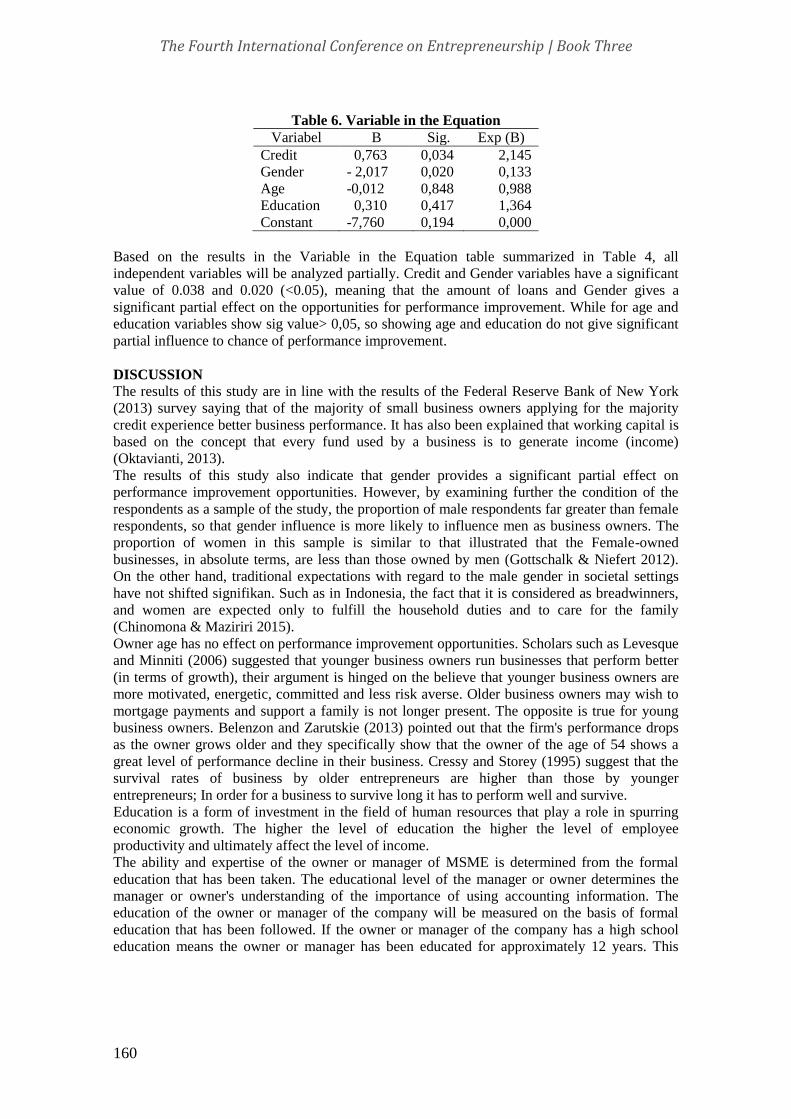
The Fourth International Conference on Entrepreneurship | Book Three
160
Table 6. Variable in the Equation
Variabel B Sig. Exp (B)
Credit 0,763 0,034 2,145
Gender - 2,017 0,020 0,133
Age -0,012 0,848 0,988
Education 0,310 0,417 1,364
Constant -7,760 0,194 0,000
Based on the results in the Variable in the Equation table summarized in Table 4, all
independent variables will be analyzed partially. Credit and Gender variables have a significant
value of 0.038 and 0.020 (<0.05), meaning that the amount of loans and Gender gives a
significant partial effect on the opportunities for performance improvement. While for age and
education variables show sig value> 0,05, so showing age and education do not give significant
partial influence to chance of performance improvement.
DISCUSSION
The results of this study are in line with the results of the Federal Reserve Bank of New York
(2013) survey saying that of the majority of small business owners applying for the majority
credit experience better business performance. It has also been explained that working capital is
based on the concept that every fund used by a business is to generate income (income)
(Oktavianti, 2013).
The results of this study also indicate that gender provides a significant partial effect on
performance improvement opportunities. However, by examining further the condition of the
respondents as a sample of the study, the proportion of male respondents far greater than female
respondents, so that gender influence is more likely to influence men as business owners. The
proportion of women in this sample is similar to that illustrated that the Female-owned
businesses, in absolute terms, are less than those owned by men (Gottschalk & Niefert 2012).
On the other hand, traditional expectations with regard to the male gender in societal settings
have not shifted signifikan. Such as in Indonesia, the fact that it is considered as breadwinners,
and women are expected only to fulfill the household duties and to care for the family
(Chinomona & Maziriri 2015).
Owner age has no effect on performance improvement opportunities. Scholars such as Levesque
and Minniti (2006) suggested that younger business owners run businesses that perform better
(in terms of growth), their argument is hinged on the believe that younger business owners are
more motivated, energetic, committed and less risk averse. Older business owners may wish to
mortgage payments and support a family is not longer present. The opposite is true for young
business owners. Belenzon and Zarutskie (2013) pointed out that the firm's performance drops
as the owner grows older and they specifically show that the owner of the age of 54 shows a
great level of performance decline in their business. Cressy and Storey (1995) suggest that the
survival rates of business by older entrepreneurs are higher than those by younger
entrepreneurs; In order for a business to survive long it has to perform well and survive.
Education is a form of investment in the field of human resources that play a role in spurring
economic growth. The higher the level of education the higher the level of employee
productivity and ultimately affect the level of income.
The ability and expertise of the owner or manager of MSME is determined from the formal
education that has been taken. The educational level of the manager or owner determines the
manager or owner's understanding of the importance of using accounting information. The
education of the owner or manager of the company will be measured on the basis of formal
education that has been followed. If the owner or manager of the company has a high school
education means the owner or manager has been educated for approximately 12 years. This

The Fourth International Conference on Entrepreneurship | Book Three
161
study supports the results of the research of Putra (2005) who found that the level of education
does not affect the size of income of street vendors in Medan. The similarity of this research lies
in the location of the business of the perpetrators of MSMEs located in big cities. Opening a
business in a big city is not influenced by the level of education because it is caused by a large
business competition and small business capital that makes UMKM actors difficult to grow. In
this study the average level of education of respondents who are still high school and equivalent
indicates that high school education is not able to provide knowledge for sufficient business
actors in running their business.
The owner of SMEs should also be able to play the role of managers in managing their business.
This requires them so they must also have managerial capabilities, one of which is measured
from the level of education so that they can manage their business well and achieve improved
performance (Hisrich and Drnovsek, 2002; Martin and Staines, 2008; Herrington and Wood,
2003) .
CONCLUSION
The conclusions that can be drawn from this research are as follows:
1. The amount of loan turned out to have an effect on improving the performance of SMEs.
This is due to the problem of availability of working capital to start a business becomes
the biggest obstacle of SMEs. The additional capital from credit provided by financial
institutions will make SMEs better able to create new innovations and improve
performance.
2. Gender Factor shows seemingly man and women owned SMEs has an ability and
perform at similar levels to achive such high business-related experience. In this study
did not distinguish the difference in contribution between men and women, so the
conclusions taken are general
3. Age factor does not show any influence on improving SME Performance. The majority
of respondents are aged between 35 years and above and belong to the Older business
owners group. It is said that their characteristics are already shifting aspirations, and are
not motivated to increase their business to support a family.
4. Education has no effect on improving the performance of SMEs. Opening a business in
Java (especially in big cities) is not influenced by the level of education because it is
caused by big business competition and small business capital that makes UMKM
actors difficult to develop. In this study the average level of respondent education is
high school and university, but the education of business owners can not afford to
provide knowledge for the sufficient business actors in running their business. The level
of education has no real impact on income because the location of the inland or rural
areas have no choice of business activity or type of work. This means that the level of
education affect the level of income, then there should be a choice of type of work and
within each type of job there is a job gap.
5.
REFERENCES
Adomako, S., Danso, A., dan Damoah, J. O. (2015). The Moderating Influence of Financial
Literacy on the Relationship Between Access To Finance and Firm Growth in Ghana.
International Journal of Entrepreneurial Finance, Vol.9, 1-19.
Akinboade, O.A., (2015), ‘Determinants of SMEs growth and performance in Cameroon’s
central and littoral provinces’ manufacturing and retail sectors’, African Journal of
Economic and Management Studies 6(2), 183–196. http:// dx.doi.org/10.1108/AJEMS-03-
2013-0033
Anwar, Hasan. (2013). Analisis Pengaruh Aset, Keuntungan, Lama Usaha, Persepsi Tingkat
Bunga, Jenis Kelamin, Pendidikan, Dan Usia Terhadap Keputusan Umkm Mengambil

The Fourth International Conference on Entrepreneurship | Book Three
162
Kredit Perbankan (Studi Kasus: Kabupaten Kudus), Skripsi Fakultas Ekonomika Dan
Bisnis Universitas Diponegoro, Semarang
Atmanti, Hastarini Dwi. (2005). Investasi Sumber Daya Manusia Melalui Pendidikan, Dinamika
Pembangunan Vol. 2 No. 1 / Juli 2005: 30 – 39
Belenzon, S. & Zarutskie, R. (2013). Consuming the Firm: Owner Age, Exit Strategy, and Firm
Performance, Federal Reserve Board, Division of Research and Statistics, Washington, DC.
Calas, M. & Smircich, L., (1989), ‘Using the F word: Feminist theory and the social
consequences of organisational research’, paper presented at the Annual Meeting of the
Academy of Management, Washington, DC, Aug 1, 1989, pp. 355–359.
Chinomona, E. & Maziriri, E.T., (2015). ‘Women in action: Challenges facing women
entrepreneurs in the Gauteng Province of South Africa’, International Business &
Economics Research Journal 14(6), 835–850. http://dx.doi.org/10.19030/iber. v14i6.9487
Cressy, R. and Storey, D (1995). New Firms and Their Banks, Warwick University Business
School and Nat West
Dele, A.O. (2012). The effects of successful outsourcing on perceived business performance in
Nigeria banking industry: an empirical analysis. Research Journal of Business Management
and Accounting, 1(3), 046 – 056.
Delmar, F. & Wiklund, J., (2008) ‘The effect of small business managers’ growth motivation on
firm growth: A longitudinal study’, Entrepreneurship Theory and Practice 32(3), 437–453.
http://dx.doi.org/10.1111/j.1540-6520.2008.00235.x
Eikhof, D.R., Summers, J. & Carter, S., (2013), ‘Women doing their own thing: Media
representations of female entrepreneurship’, International Journal of Entrepreneurial
Behaviour & Research 19(5), 547–564. http://dx.doi.org/10.1108/ IJEBR-09-2011-0107
Esaete, M. (2005). Quality of Record Keeping and performance in Small Business Enterprises,
Unpublished Master Thesis, Makerere University Business School, Kampala, Uganda
Fatoki, O. & Asah, F., (2011), ‘The impact of firm and entrepreneurial characteristics on access
to debt finance by SMEs in King Williams’ Town, South Africa’, International Journal of
Business and Management 6(8), 170. http://dx.doi.org/10.5539/ijbm. v6n8p170
Federal Reserve Bank of New York, (2013), Small Business Credit Survey, Federal Reserve
Bank of New York
Gottschalk, S. & Niefert, M. (2012). ‘Gender differences in business success of German start-
up firm’, International Journal of Entrepreneurship and Small Business Management 18(1),
15–46. http://dx.doi.org/10.1504/IJESB.2013.050750
Herrington, M. And Wood, E. (2003). Global Entrepreneurship Monitor, South African Report
[online] Available: http://www.gbs.nct.ac.za /gbswebb/userfiles/ gemsouthafrica2000 pdf.
Hisrich, R.D. and Drnovsek, M., (2002), “Entrepreneurship and small business research – A
European perspective”, Journal of Small Business and Enterprise Development, Vol. 9 No.
2, pp.172-222.
International Finance Corporation, (2016), UKM yang dimiliki Wanita di Indonesia:
Kesempatan Emas untuk Institusi Keuangan Lokal (Studi Penelitian Pasar), World Bank
Group.
Kementerian Koperasi dan Usaha Kecil Menengah (ID). (2014). Perkembangan data usaha
mikro, kecil, menengah (UMKM) dan usaha besar (UB) tahun 2011-2012. Tersedia pada:
http://www.depkop.go.id/index.php?option=comphocadownload&view
=file&id=394:perkembangan-data-usaha-mikro-kecil-menengah-umkm-dan-usaha-besa r-
ub-tahun-2011-2012&Itemid=93
Lévesque, M. & Minniti, M.(2006). The effect of aging on entrepreneurial behavior. Journal of
Business Venturing, 21, 177-194

The Fourth International Conference on Entrepreneurship | Book Three
163
Li, Y.H, Huang, J.W. & Tsai, M.T. (2009). Entrepreneurial orientation and company
performance: The role of knowledge creation process. Industrial Marketing Management
38(209),440–449.
Martin, G., Staines, H. (2008). Managerial competencies in small firm [online]. Available:
http://www.emraldinsight.com/insight/viewcontentitem. do?contenttype [Accessed: 15 May,
2006]
Miles, P Morgan, Covin G Jefferey, Heeley b Michael, (2000), The Relationship Between
Environmental Dynamism and Small Firm structure, strategy and Performance. Journal of
Marketing theory and Practice. Pp. 63-74.
Noer, Soetrisno. (2005). “Ekonomi Rakyat Usaha Mikro dan UKM”.
http://www.smecda.com/ebook/Ekonomi%20Rakyat/Ekonomi%20Rakyat%20-%205.pdf.
Diakses tanggal 11 Juni 2012
Oktavianti, Nurdiana, 2013, Hubungan Modal Kerja Fungsional Dengan Omzet Penjualan Pada
Koperasi Unit Desa “Karya Utama” Sanga-Sanga Tahun Buku 2009-2013,
https://www.google.co.id/url?sa=t&rct=j&q=&esrc=s&source=web&cd=1&cad=rja&uact=
8&ved=0ahUKEwixtb_2o7_QAhUBNo8KHTYyAoEQFggcMAA&url=https%3A%2F%2F
falahyu.files.wordpress.com%2F2015%2F02%2Fhubungan-modal-kerja-fungsional-dg-
omset-
penjualan.pdf&usg=AFQjCNHyKeKfsZ9sZafmWRSbvOiNJwcsYw&bvm=bv.139782543,
d.c2I
Omiunu, O.G., (2014), ‘Investigating the challenges faced by women rice farmers in Nigeria’,
Open Access Library Journal 1, e503. http://dx.doi.org/10.4236/ oalib.1100503
Popescu, A.L., Deaconu, A. & Popescu, T., (2014), ‘The impact of gender difference at
Romanian small and medium enterprises (SMEs) management level, analysed by
organisational citizenship behaviour (OCB) lens’, Procedia Economics and Finance 8, 563–
569. http://dx.doi.org/10.1016/S2212-5671(14)00129-4
Putra, M., (2005). Evrizal. Analisis Peran Pedagang Kaki Lima terhadap Pengembangan
Wilayah di Kecamatan Medan Kota. Tesis. Medan, Program Pascasarjana Universitas
Sumatera Utara.
Radipere, S., & Dhliwayo, S. (2014). The role of gender and education on small business
performance in the South African small enterprise sector. Mediterranean Journal of Social
Sciences, 5(9), 104-110.
Richbell, S., Watts, H. & Wardle, P., (2006), ‘Owner-managers and business planning in the
small firm’, International Small Business Journal 24(5), 496–514. http://dx.doi.
org/10.1177/0266242606067275
Robb, A. & Wolken, J., (2002), Firm, owner, and financing characteristics: Differences between
female and male owned small businesses, Federal Reserve working paper series: 2002–18,
Federal Reserve, Washington DC.
Rooks, G., Szirmai, A., & Sserwanga, A., (2009). The Interplay of Human and Social Capital in
Entrepreneurship in Developing Countries. The Case of Uganda. Research Paper No.
2009/09. United Nations University World Institute for Development Economics Research.
Saudin, Sijabat. (2008). “Potret Iklim Usaha Pemberdayaan UMKM”. INFOKOP ,Vol. 16, h. 1-
17
Schwab, Klaus. (2015), The Global Competitiveness Report 2015–2016, World Economic
Forum, Geneva
Stangler, Dane and Dan Spulber, (2013), Demographics and Entrepreneurship, IIIJ Innovation
and Communication, Menlo Park, USA
Sudiarta, I. P. I. E., Kirya, I. K.. and Cipta I. W. (2014). Analissi Faktor-Faktor Yang
Mempengaruhi Kinerja Usaha Mkro Kecil Menengah (UMKM) di Kabupaten Bangil, e-
journal Bisma Universitas Pendidikan Ganesha Vol 2.
The Fourth International Conference on Entrepreneurship | Book Three
164
Utari, Tri dan Putu Martini Dewi, (2012), Pengaruh Modal, Tingkat Pendidikan Dan Teknologi
Terhadap Pendapatan Usaha Mikro Kecil Dan Menengah (Umkm) Di Kawasan Imam
Bonjol Denpasar Barat, E-Jurnal EP Unud, 3 [12] : 576-585
Verheul, I., Thurik, R. & Grilo, I., (2008), Explaining preferences and actual involvement in
self-employment: New insights into the role of gender, Research Paper ERS- 2008-003-
ORG Revision, Erasmus Research Institute of Management, Rotterdam.

The Fourth International Conference on Entrepreneurship | Book Three
165
MOTIVATIONAL COMPENSATION DESIGN FOR SURGEON IN
NEUROSURGICAL GROUP SERVICES IN SURABAYA
1Asra Al Fauzi, 2Denny Bernardus♠
Ciputra University Surabaya
INDONESIA
Emails: [email protected] , [email protected]
ABSTRACT
Health development was an effort to fulfill one of the basic rights of the citizen,
it called the right to obtain health services. Furthermore, it was also an
investment to support the economic development and the poverty reduction.
Surabaya Neuroscience Institute, in order to improve the welfare of the
community tried to implement health development, especially those which
associated with neurological disorders. The success vision and mission of
Surabaya Neuroscience Institute was highly dependent on the performance of
its employees. It took a high motivation for physician working at the Surabaya
Neuroscience Institute to achieve optimal goals. A good compensation system
will support the employee's motivation. On the other hand, in the medical field
there was a different culture in term of applying this compensation system. In
addition to justice aspects, ethics and seniority aspects were still very
influential for the compensation model and the performance of physician. This
study was aimed to find a motivational compensation design for physicians
that would improve performance at the Surabaya Neuroscience Institute. This
research used descriptive qualitative method with in-depth interview and the
respondent was chosen by purposive non random sampling with 6 people
representing 19 member population of Surabaya Neuroscience Institute.
Based on the results, the analysis of respondent’s opinion indicated that
almost stated that there was still a problem in the motivation of the
physician’s work at the SNeI. In relation with the compensation system, it
showed that the financial compensation design is considered to be appropriate,
but the aspect of nonfinancial compensation need to be evaluated and
improved hence it can highly affects physician performance.
Keywords: Physician, Surabaya Neuroscience Institute, Compensation,
Motivation, Neurosurgical Services
INTRODUCTION Health development is an effort to fulfill one of the basic rights of the people, namely the right
to obtain health services in accordance with the Article 28 H paragraph (1) of the 1945
Constitution and Act Number 36 of 2009 concerning Health. In HDI measurement, health is one
of the main components besides education and income. Health is also an investment to support
economic development and has an important role in poverty reduction efforts. Health business
growth is around 50% per year (Rosalina and Hadinata, 2013). Coupled with the increasing
demand for quality health services in the region, due to the better economic growth (Pratama,
2015) to make the industry of health care services, especially in charge of nerve abnormalities is
a very strategic sector. On the other hand, the penetration rate of various medical indicators in

The Fourth International Conference on Entrepreneurship | Book Three
166
Indonesia is the lowest in the world (1.13 beds per 1,000 population, while for Singapore,
Thailand, Malaysia: 2.2 beds / 1.000 population) should be a concern for medical industry
players in Indonesia (Primary, 2015). Moreover, the government is currently actively promoting
BPJS Health and Prime Services Doctor (DLP) program, where the goal is the implementation
of constitutional mandate, the right to obtain health services can be accessible by all elements of
society, both in the city and in remote areas, and empowerment of existing human resources In
the face of the threat of Asean Economic Community (MEA). This should not a setback, but the
opportunity should be able to be a potential for the development of human resources and
continuous skill evident in a comprehensive effort to increase the quantity of the doctor.
SNeI in order to improve the welfare of the community seeks to carry out development in the
field of health, especially those associated with neurological disorders. To meet the needs of the
community in the field of health of neurological disorders, SNeI to make health development
efforts evenly throughout the province of East Java and Indonesia are quality and affordable by
all levels of society. The success of the company's vision and mission depends heavily on the
performance of its employees. Therefore, every employee is required to have knowledge, skills
and abilities, they must also have experience, motivation, self-discipline and high morale, so
that employees have good performance and company performance will also increase so that the
achievement of company goals will be optimal (Kusumah, 2015). According to Armstrong and
Baron (1998) there are several factors that can trigger employees to have good performance
such as skill level, competence, motivation, leadership, team trust, compensation and
organizational culture. In this research will be focused to know how big influence of
compensation to work motivation.
Along with the demands of excellent service quality improvement, the SNeI has upgraded its
human resources by sending them to some of the leading neurosurgery centers around the world
to take the fellowship so that it is deepening the field of neurosurgery ssubspecialist, so now the
SNeI Is one of the most comprehensive providers of health services in Indonesia. Other than
that, reputation SNeI is one of the best in Indonesia because it is affiliated with the center of
medical education and health care centers that are recognized in Indonesia. Given the
complexity of such a capability, supported by the opinion of Jay Kaks in Puspita (2013) which
states that doctors tend to maintain the image of the profession that are considered respectable in
society, so doctors tend to be arrogant and patronizing to further restrict
communication. Indirectly, the above is some of the reasons for the difficulty of maintaining as
well as build the motivation of the doctor's work in a health care company. One way to improve
work motivation according to Handoko (2004) is to apply a compensation system.
In previous research, conducted by Ndaru Prasastono (2012) note that compensation has a
significant effect on work motivation. On the other hand, when conducted with the same
variables by Julianingrum and Sudiro (2013), the result that compensation has no effect on
employee motivation and performance. That is, that direct or indirect compensation given to
employees has no impact on employee motivation or performance. SNeI has various doctors
members from individuals and hospitals where they work. There is a civil servant lecturer
(kemendiknas), functional civil servants (kemenkes), civil servant physicians and ABRI. Some
are functional and structural employees. Most are working in government and private hospitals,
but there is a small work in purely private hospitals, as a home doctor. Professionally also some
members already pursue certain sub-specialist and part of the activity as a general
neurosurgeon. With the BPJS program from the government, it also raises the dichotomy of
BPJS hospitals and non BPJS hospitals, where members also work in the two hospitals. With a
variety of backgrounds, functional activities and different hospitals, the workload impacts each
member of the SNeI is very different and varied. Until now, both financial and non-financial
compensation in SNeI has been implemented without considering the background, status and
type of sickness. Financial compensation is primarily based on performance in medical services

The Fourth International Conference on Entrepreneurship | Book Three
167
without considering other factors. This situation can lead to a sense of injustice and jealousy in
the long-term members who can affect work performance and continuity in SNeI.
LITERATURE REVIEW
Previous research Research and theory about employee motivation used prior to this study were taken from IOSR
Journal of Business and Management, titled Employee Motivation: The Key to Effective
Organizational Management in Nigeria. The journal published in 2014 discusses the
importance of employee work motivation in effective organizational management. The purpose
of this study is to determine solutions to efforts to increase employee motivation and its
consequences. Research in this journal is more focused on the understanding of work motivation
which should be prioritized based on the mastery of the concept of motivation, organizational
management, differences in individual needs, variations of motivational factors and dynamics
over time.
Compensation A well-compensated system will help the organization to achieve its goals, acquire, maintain
and maintain a productive workforce. Without proper compensation, employees will have a
desire to leave the organization. According to Malayu SP Hasibuan (1995, pp. 133, ed. 8):
"Compensation is all income in the form of money or goods directly or indirectly received by
employees in return for services authorized to the company". The compensation is in the form
of money, which means that the compensation is paid with some money to the employee
concerned. Compensation in the form of goods, meaning that compensation is paid with goods
(Hasibuan, 1995). Compensation can be divided into two: direct compensation (direct
compensation) in the form of salaries, wages, incentive pay and compensation
indirectly (indirect compensation or employee welfare) in the form of employee benefits
(Hasibuan, 1995).
In compensation should be noted that compensation can have different values for each
individual who receives it. This is because each individual has different needs, desires and
views from one another (Tanjung, 2005). According to T. Hani Handoko (2004), in his book
Personnel Management and Human Resources, in general compensation classified into two
parts, namely Financial and Non Financial Compensation. That are financial compensation can
be further divided into Direct and Indirect Compensation. Direct Compensation is the
compensation received by employees who have a direct relationship with the work, which is in
the form of wages, salaries, bonuses, and commissions. While Indirect Compensation is the
compensation received by employees who do not have a direct relationship with his work, such
as health insurance, educational assistance, paid during the leave and sick, and others. While
non-financial compensation consists of the satisfaction received by employees due to the
workers themselves and the work environment. For clarity the classification of compensation
can be seen in the following figure.

The Fourth International Conference on Entrepreneurship | Book Three
168
Table 1. Classification of compensation
Source: T. Hani Handoko, Manajemen Personalia & SDM; 2004
Motivation Motivation is a state in a person's person that encourages the desire of individuals to perform
activities to achieve a goal. With the motivation in a person will show a behavior directed to the
goal to achieve the goal of satisfaction. So motivation is a process to try to influence someone to
do something we want. When we accept motivation as an influence on behavior and if we
accept the notion that the greatest part of this influence on human behavior is the fulfillment of
the basic needs. So we will try to find out what these basic needs are. The process of motivation
begins with the need to show the deficiencies experienced by a person at a certain time (Tanjung,
2005). Unmet needs will cause people to start looking for ways to meet those needs, by having
actions to achieve behavior or actions against being evaluated. The evaluation results are used to
establish rewards or punishments. If there are unsatisfactory results, for example if the
employee's needs are not met, then a review is held, and so the process repeats from scratch to
form a circular pattern, as shown.

The Fourth International Conference on Entrepreneurship | Book Three
169
Figure 1. The process of motivation
Doctor The physician is a health worker who becomes the first contact point of the patient to solve the
health problems faced irrespective of the type of disease, organism, age group, and sex, as early
and as comprehensive, as possible, sustainable, and in coordination and collaboration with other
health professionals, Using the principles of effective and efficient service and upholding
professional, legal, ethical and moral responsibility (Love, 2008). The services held are limited
to the basic medical competencies he acquired during medical education. Arrogance in the
doctor's environment is not unusual and can damage the quality of health services. According to
Allan S Berger (2010), a professor of clinical psychiatry at the Georgetown University medical
school, arrogance arose out of sociological and psychological pressure. Thankfully, the trend
of reduction in the arrogance of doctors in a hospital environment showing signs of decline (Tan,
2013). Communication and leadership are now being taught in medical schools and residencies,
more nurses are brave to 'fight' doctors 'arrogance, and fewer hospitals tolerate doctors'
arrogance.
RESEARCH METHODS The problem to be studied by the researcher is a social and dynamic problem. Therefore, the
researcher chose to use descriptive qualitative research method to determine how to find, collect,
process and analyze data of research result. This qualitative research can be used to understand
social interaction, for example by in-depth interviews so that clear patterns will be
found. Furthermore, we will be given a careful description of the phenomenon that occurs on
how the compensation that can increase the motivation of the doctors in SNeI. In this study, 6
doctors were taken from the total population of 19 doctors working in SNeI. This is done so that
the data obtained is valid data and can find the problem appropriately. In the determination of
this sample, non-random sampling technique was used. This is done because the number of
doctors receiving compensation varies. So the sampling technique is hard to do. In this non-
random sampling technique there is no definite provision as to how many samples should be
taken to represent the population as well as the random sampling technique. Sampling is done in
the form of purposive sampling, meaning that certain people who have qualifications are the
sample of this study. Selection of the use of this technique is based on the consideration that the
sample to be studied has almost the same characteristics to be selected as the sample
respondents. Purposive sampling is chosen to be absolutely able to ensure that the respondents
are the elements to be researched and sure fit into the selected sample.

The Fourth International Conference on Entrepreneurship | Book Three
170
In this study, the subject of research is part of the doctors who are members of the core
membership of the SNeI, amounting to 6 people, out of a total of 19 doctors. In-depth
interviews (depth interview) conducted research to 6 sources of which are classified as
follows; 1) Neurosurgeon, 2) Domiciled in Surabaya, 3) Has joined SNeI at least 1 year, 4)
Practice in several health service centers. The criteria are chosen to get results that not only
meet market expectations, but also fit the theory from a doctor's point of view. In this study, the
object of research is the provision of compensation in improving the work motivation of doctors
at SNeI. The study of the object is devoted to the motivation of the doctors through seven major
themes related motivation factors that have been identified through research Willis-Shattuck et
al (2008). This research was conducted in the period of May to June 2017 in Surabaya. All data
used, including resource persons, are located in Surabaya, East Java. In this study researchers
used data collection techniques by means of observation, documentation, and interviews. To
avoid loss of information, the researcher asks the informant to use the tape recorder. Before an
in-depth interview, the researcher explains or gives a brief and clear overview of the topic of
research.
Data analysis begins by conducting in-depth interviews with key informants, which is someone
who really understands and knows the situation of the research object. After conducting the
interview, the data analysis begins by making transcripts of interview results, by playing back
the recorded interview, listening carefully, and then writing the words that are heard according
to what is in the recording. After the researchers write the results of the interview into the
transcript, then the researchers must read carefully to then do data reduction. The researcher
makes data reduction by making abstraction, that is taking and recording useful information
according to the research context or ignoring the unnecessary words to get the sentence core
only, but the language according to informant language. Abstractions that have been made in the
form of units then grouped by taxonomy based of the research domain.
RESULTS AND DISCUSSION In this study, researchers analyzed the compensation strategy used by the SNeI before the
study. Researchers analyzed compensation strategies based on data and interviews with
physicians. Researchers use the classification of compensation according to Handoko (2004)
which divides the compensation into two groups, namely financial and non-financial
compensation. Based on the opinions of the respondents, the researcher can analyze the
effectiveness of compensation design strategy owned by SNeI and add improvement of
compensation design strategy to increase the work motivation of the doctors. The researcher
determines the opinion of the pros and cons of the compensation design strategy. Here
are pros and cons of the design compensation SNeI:
Table 2. Pros and cons of compensation design strategy SNeI
Compensation Design Strategy Pros Cons
Financial The magnitude
of the current fixed
income received is good
enough compared ago
Fixed
income is still
too low, and
should be
improved.
Indicators for
assessing fixed income
and variable
income should be
developed from the
existing
Insurance has

The Fourth International Conference on Entrepreneurship | Book Three
171
been given by the
company
Special assistance
for those who will take
the educational program
has also been provided
by the company
The
assistance
provided by
the company,
is still far
from
expectations
in nominal
aspects given,
so that
members who
want to
increase their
knowledge
must bear a
greater cost
Aspects of time
worked and seniority to
determine the amount of
compensation
Better
productivity
factors should
also be taken
into account.
Non financially So far there has
been no specific
assignment of the
company to each
member about what
should be done by
members in their
respective positions in
their respective places
Members who
earn achievement in his
career has not been
optimized for a more
strategic lifted
The decision-
making process is
considered good enough
and in accordance with
the corporate culture
Need
to be
improved in
terms of
making a
decision,
often because
it is too
expensive
togetherness
it was agreed
to disagree,

The Fourth International Conference on Entrepreneurship | Book Three
172
so the
decision was
floating for
members
There is a system
of assistance to doctors
in SNeI, especially for
those who will attend the
scientific event.
The opportunity to gain
academic recognition is
wide open through the
holding of scientific
events.
Challenge in
every task is generally
quite high.
Based on the concept of strategy we make, and taking into account the pros and cons of
compensation issues at SNeI. Here's the recommended compensation design:
1. Financial compensation remains a concept combination of fixed
income and variable income. But for variable income plus bonus compensation
patterns that accommodate performance.
2. Indicators for performance appraisal other than medical service aspect, also
need to be reviewed from other aspect that is burden of teaching, research, and
achievement.
3. Financial compensation provided in the form of fixed allowance per month for
lecturers. As for research and accomplishments may be compensation
not determined a fixed routine.
CONCLUSION After researching and analyzing some aspects of compensation design at SNeI, it can be
concluded that:
1. Based on the analysis of respondents' compensation design strategy in SNeI relating to
the compensation system, indicates that compensation for members in SNeI have been
quite effective. However, compensation in the form of pure financial is not the main
thing, which needs to be optimized and improved is indirect financial compensation as
well as non-financial compensation.
2. Based on the analysis of respondents' compensation design strategy in SNeI related to
work motivation doctors, showed that almost all stated that there were still problems in
the motivation of doctors working in SNeI. Some of the things emphasized are no
member whose performance has not been optimized to improve the performance of the
company.
3. Based on the analysis of respondents' compensation in Surabaya design strategies that
relate Neuroscience Institute late with financial compensation, indicates that
compensation motivational design on the financial aspects broadly considered good
enough by the informant, but needs improvement, both in financial and non-financial
compensation by considering aspects of justice, ethics and seniority.

The Fourth International Conference on Entrepreneurship | Book Three
173
REFERENCES Armstrong, Michael & Baron, A. 1998. Performance Management : The New Realities, Institute
of Personnel and Development, New York.
Beer, M and Ruh, R A (1976) Employee growth through performance Management, Harvard
Business Review, July-August, pp 59-66.
Cinta. "Pengertian Dokter dan Tugas Dokter". 26 November 2008.
https://somelus.wordpress.com/2008/11/26/pengertian-dokter-dan-tugas- dokter/.
Cook, Curtis W. dan Hunsaker, Phillip L. 2001. Management and Organizational Behavior.
Third Edition. 2 title. North America: McGraw-Hill.
Kovner, C. T., Hendrickson, G., Knickman, J. R., & Finkler, S. A. (1994). Nursing care delivery
models and nurse satisfaction. Nursing Administration Quarterly, 19(1), 74-85.
Laschinger H, Finegan J, Shamian J. 2001a. The impact of workplace empowerment,
organizational trust on staff nurses‘ work satisfaction and organizational commitment.
Health Care Management Review 26(3):7–23.
Nujjoo, A., & Meyer, I. The relative importance of different types of rewards for employee
motivation and commitment in South Africa. SA Journal of Human Resorce
Management, 2012, 10(2), Art. #442, 10 pages.
http://dx.doi.org/10.4102/sajhrm.v10i2.442.
Prasastono, Ndaru. Pengaruh Gaya Kepemimpinan dan Kompensasi Terhadap Motivasi Kerja
karyawan Hotel Muria Semarang. Dinamika Kepariwisataan, 2012, 11(2), pp. 32-39.
Risher, H (2003) Refocusing performance management for high performance, Compensation
and benefits Review, September-October, pp 20-30.
Rousseau, D. M. (1996) Changing the deal while keeping the people. Academy of Management
Executive, 10, 50-61.
Schaffer, R H (1991) Demand better results and get them, Harvard Business Review, March-
April, pp 142-49.
Schultz, D.P. & Schultz, S.E. 2005. Theories of Personality (8th ed). Australia: Thomson
Wardswarth.
Shermerhorn. 2005. Management 8th. USA: John Willy & Sons inc.
Timmerick, T. (2001) 'Managing motivation and developing job satisfaction in the
health care work environment', Health Care Manager, 20(1), pp. 42-58.

The Fourth International Conference on Entrepreneurship | Book Three
174
ANALYSIS AND DESIGN OF EARLY WARNING APPLICATION
FOR PREGNANT WOMEN HEALTH FOR ACCELERATION
REDUCE MORTALITY RATE MOTHER AND BABY WEB BASED
AND SMS GATEWAY
1Made Kamisutara, 2I Putu Artaya
Teknik Informatika, Ilmu Menejemen, Universitas Narotama Surabaya
INDONESIA
Emails: [email protected], [email protected]
ABSTRACT
The Millennium Development Goals (MDGs) goal is to reduce maternal
mortality and child mortality rates. These two factors are the main goals of
development in the health sector in Indonesia. The achievement of the MDGs
objectives is an aggregate of the data of each Regency / City. The target of the
decline in maternal mortality does not reach the target set. To support the
achievement of the MDGs, there is a need for support and cooperation from
various stakeholders, from strategic planning, implementation, to evaluation
and monitoring.
All districts monitor data of illness and mortality of mother and child. However,
the implementation is still far from the hope of being able to provide accurate,
fast and complete data. Stake holders often get late information about the event
of sickness and death. In fact, the data is incomplete. District or Provincial
Health Offices receive invalid reports. The data is the result of estimation from
past condition. It happens because the lack of personnel who understand the
importance of monitoring and lack of skills in running the right surveillance
system.
It needs a system that can facilitate hospital or health service to monitor the
health condition of the population to reduce maternal and infant mortality. We
analyze and design systems that connect with sms gateway so that people can
access information via web or sms.
Keywords: Early Warning, SMS Gateway, Pregnant Mother, Mortality
INTRODUCTION
Maternal and child health (MCH) is a complicated issue in Indonesia. Improving the quality of
health services requires the conducive of socio-political, legal and culture. Based on the
Indonesian Demographic and Health Survey (IDHS) 2015, maternal mortality still stands at 228
per 100,000 live births. Despite various improvement efforts and handling has been done, but it
is realized still needed a variety of support earlier. MCH program aims to improve the health,
especially mother and child optimally. One important element to support the goal is the
availability of data and information that is very useful in planning, implementation, monitoring,
and evaluation of health service outcomes. Most maternal and child health programs have not
been supported by adequate information systems in terms of recording, processing, and analysis
as well as interpretation and reporting.

The Fourth International Conference on Entrepreneurship | Book Three
175
All districts monitor data of illness and mortality of mother and child. However, the
implementation is still far from the hope of being able to provide accurate, fast and complete
data. Stake holders often get late information about the event of sickness and death. In fact, the
data is incomplete. District or Provincial Health Offices receive invalid reports. The data is the
result of estimation from past condition. It happens because the lack of personnel who
understand the importance of monitoring and lack of skills in running the right surveillance
system.
With the Early Warning Application of Maternal Health, it is expected to contribute to provide
accurate data so that it can make the right decision in order to reduce maternal and child
mortality during childbirth.
RESEARCH METHODS This research uses waterfall method. It is also known as classic life cycle. It describes a
systematic and also sequential approach to software development. It starts with user requirement
specification. Then, it goes to stages such as planning, modeling, construction, and deployment,
which ends with support for the complete software generated (Pressman, 2012). Stages of
waterfall method are as follows:
Figure 1. Stages of waterfall method
Waterfall method has several sequential stages: requirement analysis, design system, coding &
testing, and program implementation, maintenance. The stages of the waterfall method are as
follows:
1. Requirement Analysis
At this stage, the system developer must communicate with the user so that the
developer knows the software the user expects. This information is obtained through
interviews, discussions or direct surveys. Then, it is analyzed to get the data needed by
the user.
2. System Design
Specification needs of the previous stage will be studied in this phase. System design
helps to determine the hardware and system requirements as well as to define the
overall system architecture.
3. Implementation
At this stage, the system was first developed in a small program called a unit, integrated
in the next stage. Each unit is developed and tested for functionality. It is called unit
testing.
4. Integration & Testing
After testing each unit, all units are integrated into the system. Then, it is tested to check
for any failures or errors.

The Fourth International Conference on Entrepreneurship | Book Three
176
5. Operation & Maintenance
The finished software, it is run and maintained. Maintenance includes fixing errors that
were not found in the previous step. Improve the implementation of system units and
improvement of system services as new needs.
Source : Pressman, Roger S. 2012. Rekayasa Perangkat Lunak – Buku Satu,
Pendekatan Praktisi (Edisi 7). Yogyakarta: Andi.
System Analysis
Current running system
At this stage, the authors conducted a direct interview with the hospital staff. This interview
was conducted to obtain information, current problems and supporting documents data in the
form of hard copy and soft copy. Problems of hospital are as follows:
1. The handwriting of SIP data causes the difficulty of searching data
because data is difficult to read, except by the officer who records the data.
2. Posyandu officers often use a handbook to record SIP registers. Then, it is
moved into the SIP register.
3. Data is not written efficiently because it is written over and over again into
different formats. It causes data redundancy
Figure 2. Current Business Process

The Fourth International Conference on Entrepreneurship | Book Three
177
To-Be System
The system is created at this stage. It is based on current problems and system
requirements. Figure 2 is a system business process to be created (To-Be System).
Figure 3. Business Process to be created
System planning
The use case diagram illustrates the functionality of an early warning system
application of pregnant women's health. The system is accessed by two users, the
general user and admin user. General users can access 11 functionality systems,
while admin user accesses 9 functionality systems. The arrows that connect between
the admin user and the general user are generalizations. It means everything that can
be done by a general user, can also be done by the admin. For detailing each
functionality and image of the interface design report each function is described in
the next chapter. The use case diagram is illustrated as follows:

The Fourth International Conference on Entrepreneurship | Book Three
178
uc Use Case Model
SIM Sutera Emas -Web-
Umum
Melihat Halaman
Home
Melihat Berita
Melihat Laporan
Penyakit Berpotensi
KLB di Wilayah tertentu
Melihat Laporan
Wilayah Penyakit
Berpotensi KLB
tertentu
Melihat Laporan15
Besar Penyakit
Berpotensi KLB tertentu
Melihat Laporan
EWARS
Melihat Laporan
ICDX
Melihat Laporan
Surv eilans Terpadu
di Wilayah
Sebaran Penyakit
Berpotensi KLB
Tertentu di Wilayah
tertentu
Melihat profil per
puskesmas
Melihat Gallery
Mengelola Logo
Mengelola Kontak
Mengelola Slide
Mengelola Tematis
Mengelola motto
Mengelola Link
Mengelola Berita
Mengelola
Puskesmas
Mengelola Gallery
Admin
Figure 4. Use Case Systems
RESULT AND DISCUSSION
USER ADMIN
1. Log In
To enter into this application as an admin, you must login first. Then, you will
go to the main page. You can access other features. Illustration of login page is as
follows:
Figure 5. Log in page
2. Home Page
The Home page is the start page displayed when opening this website. When it opens
the start page or when you press the "Home" button, the system will bring up the page:

The Fourth International Conference on Entrepreneurship | Book Three
179
Figure 6. Home
3. Master Community Health Centre (Puskesmas)
To add a new Community Health Centre Profile, the admin presses the "Add
Community Health Centre" button on this page. Then, admin fills in the title and
description of Community Health Centre Profile on the available column.
Figure 7. Community Health Centre

The Fourth International Conference on Entrepreneurship | Book Three
180
4. Officer
Figure 8. Officer
CONCLUSION
Early Warning Application of Pregnant Women's Health can provide early information to
midwives, doctors and officers at community health centers and health departments so that they
can provide services to the community quickly and accurately.
After the application program is run, especially in Community Health Centre Kepanjen, is
expected to reduce the mortality rate of mother and child during childbirth.
REFERENCE
Khayati, Nur, Sri Yuliati, dan M. Arie Wuryanto, 2012. Beberapa Faktor Petugas yang Berhubungan
dengan Pelaksanaan Surveilans Epidemiologi Malaria Tingkat Puskesmas di Kabupaten
Purworejo. Jurnal Kesehatan Masyarakat FKM UNDIP, 1 (2): 364- 373.
Survei Demografi dan Kesehatan Indonesia (SDKI) , 2015
Kristanto Andri, 2010, Perancangan Sistem Informasi dan Aplikasinya, Jogya, Java Media
Pressman, Roger S. 2012. Rekayasa Perangkat Lunak – Buku Satu, Pendekatan Praktisi (Edisi
7). Yogyakarta: Andi.
Dharwiyanti, Sri dan Wahono, Romi, Satria. Pengantar Unified Modelling Language (UML) :
http://www.ilmukomputer.com/umum/yantiuml.php.2003
Munawar. Permodelan Visual dengan UML : Graha Ilmu. Yogyakarta, 2005
William Davis S, 1983, Sistem Analysis & Desaign : A Structured Approach Addition –
Westley Publishing Company.

The Fourth International Conference on Entrepreneurship | Book Three
181
INACTIVE PROBLEM RECOGNITION PERSPECTIVE IN
CONSUMER’S BUYING DECISION : STUDY LITERATURE
1Rony Prabowo, 2Moses L. Singgih, 3Putu Dana Karningsih, 4Erwin Widodo
1Doctorate Program Student, Industrial Engineering, Industrial Technology Faculty, Sepuluh
Nopember Institute of Technology at Surabaya,
INDONESIA; 2-4Department of Industrial Engineering, Industrial Technology Faculty, Sepuluh Nopember
Institute of Technology at Surabaya,
INDONESIA
ABSTRAK
Marketing activities are not just sales or advertising, but are focused on
fulfilling the needs and wants of consumers. In the fulfillment of their needs,
consumers have different preferences of products or services they need. In
addition, more and more choices are available for consumers to choose
products that suit their needs and wants. With the increasingly diverse range
of products and services it is increasingly also the desire of consumers
associated with these products and services. Consumers often have a desire
for products and services but can not describe clearly so that producers can
not understand the desire and can not realize consumer desires. The condition
of consumer and producer's lack of understanding in describing the need
related to this product is called inactive problem. In active problem, the
company only convince consumers that they have problem and company
product is the best solution in solving the problem. While the inactive problem,
the company must be able to capture the phenomena of consumer behavior
associated with problems that can not be disclosed (problem capture) so that
the company is able to provide products that can provide solutions to
consumer problems. Problem recognition with inactive problem approach has
the advantage that defining problem exist in consumer but can not or can not
be expressed by consumer if company can reveal and define it become a
concept of product development hence will be opportunity that product will
have some advantage if company can make it, The benefits are: the product
will have brand awareness for the consumer so that the consumer is more
loyal to the product, the product will have a long life cycle because the
competitor has not thought of the product with the inactive problem design,
product replication by the competitor takes a long time, Supernormal profits
and the company can make many derivative products.
Keywords : inactive, problem, recognition, consumer, behavior
INTRODUCTION
Consumers as stakeholders of a company that must be considered, have different behaviors and
perceptions. Consumers can determine the viability of a company, therefore the company must
be able to take heart and create a good image in the eyes of consumers (Katila and Mang, 2003;
Ashby and Johnson, 2006). Attribute analysis on consumer behavior is a fairly new demand
theory, in which the analysis of attribute approach states that consumer satisfaction on
purchased goods or services is not actually located on the product or service itself, but from the

The Fourth International Conference on Entrepreneurship | Book Three
182
characteristics or attributes attached to the product concerned. In other words, when a person
buys an item, actually does not buy the item, but purchases the attribute on the item, which is
generally the attribute of a good not just one, but there may be some (Coney, 2011; Calegari,
2013). Thus if there are some goods or services to be consumed, the first consideration is to
compare the value of attribute values on each - each item or service.
The purpose of marketing is to meet and serve the needs and wants of target consumers. But
knowing the consumer is not easy. Customers may declare the needs and wants of the consumer
and may act against influences that change the mind of the consumer (Cesarani, et.al, 2011).
Marketers or corporations must study the consumer's wants, perceptions, preferences, and
buying behaviors. It provides guidance on developing the product for new products, product
features, prices, distribution channels, markets and other marketing mix elements. Most
consumer needs are not strong enough to encourage someone to do something at a time. A need
becomes a boost when the need arises until it reaches a sufficient level of itensity. Motives are a
strong need to direct consumers to seek satisfaction with those needs (Lengnick and Hall, 2010;
Robertson and Catignan, 2011).
LITERATURE REVIEW
Behaviour Customer Model
The starting point of understanding buyer behavior is to understand stimuli and responses. The
stimulus of marketing and the environment goes into the mind of the buyer. Characteristics and
decision-making processes by consumers produce certain purchasing decisions (Negation, 2004;
Grawin, 2011). The task of the company to understand what is going on in the buyer's mind,
between the influx of outside influences and consumer purchasing decisions.
Stimuli
Pemasaran
Stimuli Buyer
Characteristics
Buying Decision
Process
Buying Decision
Product
Price
Place
Promotion
Economic
Technology
Politic
Culture
Culture
Social
Person
Pshycology
Problem
Recognize
Information
Search
Decision
Buying Behavior
Product Choice
Brand Choice
Shop Choice
Time Choice
Number Choice
Figure 1. Behaviour Customer Model (Kotler, 2013)
The marketing mix on the buying behavior model is the most important marketing stimulus
including: product, price, place and promotion. While marketing and the environment will enter
the consciousness of the buyers so as to form a buying decision process. Furthermore, buyer
characteristics that include culture, social, personal, psychology, and decision-making process
include the introduction of problems, information search, alternative evaluation, purchasing
decisions and behavior (Balachandra and Frior, 2007). Both of these will lead to the decision to
purchase certain products. The consumer's decision in making a purchase is not within an exact
being isolated from the surrounding environment. Their behavior is strongly influenced by
cultural, social, personal and psychological factors. Most of these factors can not be controlled
by marketers, but must still be taken into account. Kotler (2013) mentions four factors that
influence consumers in buying decision-making behavior are as follows:

The Fourth International Conference on Entrepreneurship | Book Three
183
Culture
Culture
Sub Culture
Class Social
Social
Reference Group
Family
Role and Social
Status
Personal
Age
Stage of Life
Cyce Product
Economic
Condition
Life Style
Personality
Self Concept
Phsycology
Motivation
Perception
Learning
Trust
Attitude
Buyer
Figure 2. Factors Affecting Consumer Behavior (Markham, 2013)
Customer Models
According to Schiffman and Kanuk (2016) there are four consumer models that have different
perspective in making decisions, among others:
1. Economic Consumer. In a perfectly competitive market, consumers are often referred to
as economic consumers, ie consumers who make rational decisions. To make an
economical decision, one must recognize all alternatives, perhaps the consumer can
make a sequence of advantages and disadvantages with alternatives and can also identify
the best alternative. Nevertheless, consumers rarely have enough accurate information
that lacks the power level in motivation to make the perfect decision (Fabiani, 2005:
Hawkins, et al, 2011).
2. Passive Consumer. In contrast to economic man, passive man is described as a consumer
who basically adheres to self-serving interests and business ventures. Consumers
sometimes make purchases impulsively and irrational (Allione, et al, 2012).
3. Cognitive Consumer. Describe the consumer as an active person looking for products or
services that can meet the needs and enrich the lives of consumers. This model focuses
on the process by which consumers seek and evaluate selected information and retailers.
In this model the consumer is also described as an information processing system that
leads to the choice of choice and ultimately to the choice of purchase. In contrast to
economic consumer, cognitive man is more realistic and describes consumers as people
who do not search for all available information from each option, as they will
discontinue their information search once they have enough information about the
chosen alternative, which is enough information to make a decision Duanmu and Fai,
2012).
4. Emotional Consumer. Consumers always involve deep feelings or emotions when faced
with a purchase or to have something. This can be seen when consumers make
emotionally based decisions that do not emphasize the search for information before
purchase, but rather emphasize the mood, which means that emotional people can not
make decisions (Hosein, et al, 2011).
Types of Consumen Decision Making
The buying decision process varies greatly. Hawkins, et. Al (2011) divides the decision-making
process into three types, namely:
1. Extended Decision Making, the most comprehensive type of decision-making, stems
from the introduction of consumer problems that can be solved through the purchase of
multiple products. For this purpose consumers are looking for information about a

The Fourth International Conference on Entrepreneurship | Book Three
184
particular product or brand and evaluating some, whether each of these alternatives can
solve the problem. The evaluation of a product or brand will lead to a purchase decision.
The consumer will then evaluate the outcome of his decision (Thorgren, et al, 2009;
Senher, 2011). A broad decision-making process occurs for the specific benefit of the
consumer or for decision making that requires a high degree of involvement, such as
purchasing expensive products, containing prestige value and being used for a long time,
or for the case of first-time product purchases.
Figure 3. Types of Consumen Decision Making (Kotler, 2013)
2. Limited Decision Making. A limited decision-making process occurs when the consumer
knows the problem, then evaluates some alternative product or brand based on the
knowledge held without seeking new information about the product or brand. This
usually applies to purchases of less important products or routine purchases (Oxley and
Sampson, 2014). It is also possible that the process of decision-making is limited to the
needs of an emotional nature.
3. Habitual Decision Making. Customary decision-making process is the simplest process,
that consumers know the problem and then immediately take the decision to buy his
favorite brand (Duanmu and Fai, 2012). Evaluation occurs when the brand turns out not
to be as expected.
Inactive Problem Perspective
Purchase decisions will not be possible if consumers are not aware of a problem or identify
problems first, so the solution to be obtained from the problem that will be the goal to make a
purchase. The problem of the consumer may be an inactive problem and an active problem.
Low Involvement High Involvement
Habitual Decision Making Limited Decision Making Extended Decision Making
Problem Recognition
Selective
Problem Recognition
Generic
Problem Recognition
Generic
Internal Information
Searching (limited)
External Information
Searching (limited)
Internal and External
Information Searching
(limited)
Purchasing
Alternating Evaluation
A Little Attribute
Simple Decision Rule
A Little Alternating
Alternating Evaluation
Many Attribute
Complex Decision Rule
Many Alternating
Post Purchasing
No Purchases Matches
Limited Evaluation
Purchasing
Purchasing
Post Purchasing
No Purchases Matches
Limited Evaluation
Post Purchasing
No Purchases Matches
Complex Evaluation

The Fourth International Conference on Entrepreneurship | Book Three
185
Active problem is when the consumer is already aware or will be aware of a problem (Flynn et
al., 2010; McCutcheon, 2011; Meredith, 2013). Inactive problem is when the consumer is not
aware (Hawkins, et al, 2011). In active problem, companies only convince consumers that they
have problems and brand marketers are the greatest solution to the problem. While the inactive
problem, the company must be able to capture the phenomena - the phenomenon of consumer
behavior (customer behavior) in utilizing or using the products consumed.
According to Growin (2011), problem solving (problem recognition) consumer with
inactive problem approach is needed by company in new product development compared with
consumer problem collecting through active problem (Eisenhardt, 2006; Kotler, 2013).
Differences between Inactive Proplem and Active Problem can be seen in Table 1.
Table 1. Difference between Inactive Problem and Active Problem
No. Inactive Problem Active Problem
1. Consumers are not aware of the
existing problems associated with
the needs of consuming the product
(Ashby and Johnson, 2006)
Consumers are already aware of issues related to
product needs (Andido et al., 2011; Hosein et al,
2011)
2. Companies have little information
related to product problems that
consumers need (Vezzoli and
Manzini, 2008; Allione et al., 2012)
The company has a lot of information related to
product problems that consumers need
(Lindahl et al., 2013)
3. Consumers exhibit conative
behavior (psychological behavior
that leads to action) to meet needs
(Bhamra and Lofthouse, 2008)
Consumption decisions are based on the affective
aspect (how to respond to a good product by
receiving, responding and assessing) and
cognitive is how consumers remember and
understand the product(Baumann et al., 2002;
Boks, 2006; Borchardt et al., 2009)
FINDING
According to Alba and Hutchinson (2010); Kessler (2010) and Stanton (2013) consumers for
active problems generally have characteristics as economic consumer, ie people who make
rational decisions. In this case to make economical decisions, consumers must recognize all
alternatives, consumers analyze related advantages and disadvantages with alternatives and can
also identify the best alternative. While other characteristic is cognitive consumer that is
consumer which actively look for product or service that can fulfill its requirement. Consumers
with cognitive types seek and evaluate selected information and products. The cognitive
consumer in the processing of the selected information is directed to the choice of choice and
ultimately to the choice of purchase. The difference with the economic consumer, the cognitive
consumer is more realistic and does not look for all the available information from each option,
as the cognitive consumer will stop searching for information once they have enough
information.
As for consumers with inactive type generally characterized passive consumer that consumers
who are interested in buying at the time interested in buying or marketers require a hard enough
and creative efforts to persuade him to buy the product. Consumers sometimes make purchases
impulsively and irrational (Shenhar, 2014). And the second characteristic for the consumer with
the inactive type is the consumer conative that is the consumer who always involves a deep
feeling or emotion when faced with a purchase or to choose something. This can be seen when
consumers make emotion-based decisions that do not emphasize the search for information
before purchase, but more emphasis on mood, this means that the person chooses the product in

The Fourth International Conference on Entrepreneurship | Book Three
186
accordance with the wishes that have been there before but can not be expressed (Hawkins, et.
al, 2011).
Stages in new product development with inactive problem approach differ from new product
development stage with active problem approach. In general, the development approach through
the stages, among others, to observe consumer behavior related to how the use of products or
information search related to alternative needs replacement (Kirchain, 2011). This step is a very
important step to see consumer desire that can not be disclosed or see the phenomenon of new
idea as innovation opportunity required by consumer but not yet known by consumer (Moorman
et.al, 2011). The next step is to establish problem (problem recognizing) where it is important to
be a determination that there is a problem to the need for product development from existing
products to those who have an important role to the development of the product (Norman,
2012).
The third step to do is to adjust the innovation with the ability of resources, this as a basis to
measure the ability of SMEs in realizing the needs and desires of consumers who become a
capability to realize (tangible ability) new product development approaching or as desired
(Blindenbach et.al, 2010). Furthermore, SME management must be able to innovate new
product development process with knowledge management and inovative practice management.
It is very important to find the most effective and efficient way of making process or project and
to project the closest product Consumer desire (Calegari, 2013), in addition to the management
of resource use in accordance with the needs in realizing new products (Griffin et.al, 2012).
Figure 4. Stages of New Product Development through Inactive Problem Perspective
(Prabowo, 2016)
The fifth step in new product development through an inactive problem perspective is to create
a prototype with a physical type where real product development is made to estimate the
finished product (Gruner et.al, 2010). Aspects of the product that the development team is
Idea Generation
Concept Developing
Concept Evaluation
Core Concept and Design
Pre-Announcement
Product Launch
Post Production
Consumer Behavior Capture
Problem Recognition
Adjustable Resources and
Specialized Product Established
Trial and Benchmarking
Purpose Product to Special
Consumers
Product Modification
Specialized of Channel
Distribution
Product Relation Purpose

The Fourth International Conference on Entrepreneurship | Book Three
187
interested in are actually made into an object for testing and experimentation. The sixth step is
to market a new product or create a new marketing channel for a specific consumer, which is
marketing a product that has been created for a special customer or offering some features of a
new product made in comparison with an existing product to a particular consumer (Chen et.al,
2010).
The seventh step in new product development through inactive problem is by modifying the
product or process with lean and agile manufacturer approach, this is because the consumer with
the prototype or the new product that has become more understand the function or the desired
needs of the product so that it can provide input Or suggestions to further complement the
features or functions in accordance with consumer expectations (Katila et.al, 2014). The eighth
step is to create a special distribution channel, this is because the communication channel and
the consumer type on the inactive problem perspective are different from the active problem
perspective then in general the distribution channel for marketing new products with inactive
problem perspective is also special (Liesio et.al, 2013).
DISCUSSION
Researchers have conducted a study of 75 journals that discussed the development of new
products, SMEs and problem-solving either through the perspective of active problems and
inactive problems, but from the study researchers see that research related to new product
development through the perspective of inactive problem in SMEs is still not much discussed
comprehensively. The issue of new product development research through the perspective of
inactive problem at the time is an interesting and growing topic to be studied, this is because the
level of business competition is getting tight (red ocean) so that company need to apply rapidly
of product innovation.
According to Brezet and Hemel (2012) and Shenhar (2014) research into new product
development leads to the exploration of connective, behavioral and psychological aspects of
consumers because companies will be longer in innovation development if only expect feedback
from consumers (feedback) as more variations Of the product itself. This is reinforced by the
opinion of Stanton (2013) that the idea of new product development at a time of increasingly
fierce market competition will lead to the company's ability to know the psychological desire
and consumer expression or better known as micro expression method.
From the literature study that has been done by researchers, there is still no research describes
the relationship of each variable forming new product development with the perspective of
inactive problem comprehensively. Research conducted by Tambunan (2011) describes the type
or classification of SMEs in Indonesia in four types namely artisinal, active, dynamic and
advance, but does not discuss product development conducted by SMEs. Tambunan (2011)
focuses more on SME growth, the role of SMEs in Indonesia, the barriers of SMEs and SME
success factors in Indonesia While Cooper (2001), Carbonel, Rodriguez and Pujari (2009)
discuss the process and type of new product development in SMEs do not classify SMEs nor
explain the concept of collaboration undertaken by SMEs so as to develop new products.
Pershon (2004) and Hormiga at.al (2009) explained that SMEs who have the ability to develop
new products should have managerial knowledge or innovative types, but do not explain the
business aspects of cost analysis, profit projection, risk assessment and so on. While Shenhar
(2014) and Hawkins, Best and Coney (2011) describe the type of consumer for the perspective
of inactive problem: the passive and conative type in which the passive-type consumer has a
tendency to buy when interested in buying or tends to be impulsive and irrational so that the
marketer and the company must be creative To persuade him to buy the product. While the type
of conative is where consumers always involve deep feelings or emotions when faced with the
purchase or selection of products. However, this study does not specifically categorize

The Fourth International Conference on Entrepreneurship | Book Three
188
producers as SMEs and does not explain the concept of collaboration in new product
development.
Morales and Fernandes (2010), Meredith (2013) and Moran (2011) discussed the types of
collaboration undertaken by the company in the development of new products with consumers,
suppliers and competitors in innovation or innovative products resulting in various product
development alternatives new. But in this research does not discuss about the classification of
SMEs, research objects in large companies and managerial types. Similarly, research conducted
by Kaplan (2003), Puntonni (2004) and Zawada (2010) which discusses about business analysis
related to innovation in several companies with large corporate category with aspects of
problem determination, cost, sales projection, risk assessment, Process analysis, profit
projection and marketing design. However, the study did not explain aspects of consumer type,
managerial type or type of collaboration conducted by the company.
This review representatively and comprehensively describes the relationship and
interrelationship between the aspects that become the variables forming new product
development in Indonesian SMEs through the perspective of inactive problem that is type of
SMEs in Indonesia, managerial type, consumer type, type of collaboration and business analysis
concept so that can be developed into An appropriate business strategy for SMEs in Indonesia
with all its characteristics.
Managerial Implication
Problem recognition with inactive problem approach has the advantage that defining problem
exist in consumer but can not or can not be expressed by consumer if company can reveal and
define it become a concept of product development hence will be opportunity that product will
have some advantage if company can make it , The benefits are: the product will have brand
awareness for the consumer so that the consumer is more loyal to the product, the product will
have a long life cycle because the competitor has not thought of the product with the inactive
problem design, product replication by the competitor takes a long time, Supernormal profits
and companies can make many derivative products (Kim and Wilemon, 2009; Norman, 2011;
Oxley and Sampson, 2014).
Consistent product development and introduction as well as new product design is crucial to the
survival of most SMEs (Bessant, 2003; Uzzi, 2009). Products generated by SMEs generally
experience little change and if they want to remain competitive most SMEs must continually
improve their products (Harabi, 1998; Negassi, 2004). Decisions about the product affect the
decision of the operation, so the product decision must be carefully coordinated with the
operation to ensure that the operation is integrated with the product design. Through careful
cooperation between operations and marketing, market and product strategies can be integrated
with decisions about process, capacity, inventory and quality (Duanmu and Fai, 2007).
The development of new products through the perspective of inactive problem according to the
researchers more appropriately applied in SMEs because SMEs can directly interact with
consumers (interactive relational) more can give special attention to the consumer (Shenhar
et.al., 2014), SMEs have a fast in decision making process (Rapid response to growth
opportunities) so that new product development ideas are faster (Audretcsh and Fritsch, 2002)
and according to Jijou (2008) SMEs are able to create some types of products that are not
standardized and vary according to consumer demand (product made in small lots and Short
runs).
CONCLUSION
Stages in new product development with inactive problem approach differ from new product
development stage with active problem approach. In general, the development approach through
The Fourth International Conference on Entrepreneurship | Book Three
189
the stages, among others, to observe consumer behavior related to how the use of products or
information search related to alternative needs replacement.
In the inactive problem, companies must be able to capture the phenomena of consumer
behavior (customer behavior) associated with problems that can not be revealed (problem
capture) so that the company is able to provide products that can provide solutions to these
consumer problems.
Problem recognition with inactive problem approach has the advantage that defining problem
exist in consumer but can not be disclosed by consumer if company can reveal and define it
become a concept of product development hence will be opportunity that product will have
some advantage if company can make it , The benefits are: the product will have brand
awareness for the consumer so that the consumer is more loyal to the product, the product will
have a long life cycle because the competitor has not thought of the product with the inactive
problem design, product replication by the competitor takes a long time, Supernormal profits
and the company can make many derivative products.
REFERENCES
Alba and Hutchinson. (2010). The configuration of design and manufacture knowledge models
from a heavyweight ontological foundation. Int. J. of Product. Res.49(15). 4701–4725
Allione, S; Buyukozkan, K; Feyzıoglu, H. (2012). A fuzzy-logic-based decision-making
approach for new product development. International Journal of Production Economics 90.
27–45
Ashby, K and Johnson, S (2006). Small business growth: intention, ability, and opportunity.
Journal of Small Business Management 41: 417–425
Audretschand, P.S and Fitsch, B.M (2005). Performance measurement systems in SMEs: A
review for a research agenda. International Journal of Management Reviews 7(1). 25
Balachandra, F.A and Frior, V.S. (2007). Explaining development and change in organization.
Academy of Management Review. 20 (3). 510-540
Bessant, J. (2003). Best new product development and management practices in the Korean
high-tech industry. Industrial Marketing Management Journal 35. 262–278
Blindenbach,. Driessen and van den Ende. (2010). Organizational strategy and structural
differences for radical versus incremental innovation. Management Science, 30 (6), 682-
695
Brezet, A and Hemel, K.E (2012). Use and impact of performance measurement results in R&D
and NPD: an exploratory study. R & D Management 34(2). 191
Calegari, M.V. (2013). How much do your co-optetitors’ capabilities matter in the face of a
technological change?. Strategic Management Journal, 21. 387-404
Carbonel, T., Rodiguet, V.A., Pujari, M. 2009. Defining stakeholder involvement in
participatory design processes. Application Ergonomic Journal. 39 (4), 519-522
Cesarani, A.M, Consoli, V and J.S. Sentuti (2011). The changing basis of performance
measurement. International journal of Operations Production Management 16 (8). 63-80
Chen.T, Huang, M and Kwoo, N. (2010). Innovation sources of large and small technology
based firms. IEEE Transactions on Engineering Management, USA 51 (1), 13–18
Coney, M.S. (2011). Involving suppliers into product development: insight from R & D
directors and project managers. Industrial Marketing Management, 35: 936-943
Cooper, G. (1997). Organizational innovation in SME’s: the importance of strategic orientation
and competitive structure.. European Journal of Marketing 38. 1091–1112
Duanmu, J.C and Fai, D.L. (2012). Responsive and proactive market orientation and new-
product success. Journal of Product Innovation Management 21 (3). 334–347
Eisenhardt, G. (2006) Effect of risk management strategy on npd performance, Technovation 29.
170–180

The Fourth International Conference on Entrepreneurship | Book Three
190
Fabiani, G; Carbone T.A., Tippett, D.D. (2005) Project risk management using the project risk
FMEA. Engineering Management Journal 16 (4). 254-266
Flynn, G., Jassawalla, J.J,. Morgan, T.R. (2010). Vendor consideration and switching behavior
for buyer in high technology markets. Journal of Marketing. 59 (3). 30-43
Grawin, I. (2011). New product development from past research to future applications.
Industrial Marketing Management Journal. 12. 197–21
Griffin, J.B and J. Hauser (2012). Designing effective team-based performance measurement
systems: an integrated approach. Production Planning & Control Journal 16 (2). 208
Harabi, D. 1998. Understanding and Managing risks in large engineering projects. International
Journal of Project Management 19. 437–443
Hawkins R; Best, M and Coney, A. (2011). Quality models in an SME context: a critical
perspective using a grounded approach. International Journal of Quality & Reliability
Management 17: 305–323
Hosein, A; Thomas, Q; Webb, D (2011). Quality systems implementation in Welsh small-to
medium-sized enterprises: a global comparison and a model for change. Journal of
Engineering Manufacture 217: 573–579
Gruner, C.F and Homburg. (2010). A literature review of manufacturing performance measures
and measurement in an organizational context: a framework and direction for future
research. Journal of Manufacturing Technology Management 15 (6). 511
Jijou, A. (2008) Sources of new product ideas and creativity practices in the uk textile industry.
Technovation 22. 113–121
Johnson, T.R and Kirchain, Y.E. (2011). Perceived effectiveness of the automotive supplier
evaluation process. International Journal of Operation and Production Management, 14
(6), 91-103
Kaplan, J. S. (2003). Comparing alternative conceptualizations of functional diversity in
management teams: Process and performance effects. Academy of Management Journal,
45,875–893
Katila, R and Mang, T.M. (2003). Knowledge transfer in product development processes: A
case study in small and medium enterprises (SMEs) of the metal-mechanic sector from
Sao Paulo, Brazil. Technovation 28, 29–36
Kessler, H., 2007. Innovation creation by online basketball communities. Journal of Business
Research. 60 (1), 60e71
Kim, A.S and Wilemon, J.B. (2009) Development of a fuzzy fmea based product design system,
international. Journal of Advanced Manufacturing Technology 36. 633–649
Kirchain, R.K. (2011). Architectural innovation: the reconfiguration of existing product
technologies and the failure of established firms. Administrative Sciences Quarterly, 35. 9
Kotler, P. (2013). Markets and Hierarchies: Analysis and Antitrust Implication. American
Journal of Sociology, 87 (3). 548-577
Langner, A.L and Seidel, C.W. (2009). The influence of power driven buyer seller relationship
on supply chain satisfaction. Journal of Operations Management, 23 (1). 1-22
Liesio, Z.L; Nair, C.J. and Mosconi, W. (2013). Measuring performance in an advanced
manufacturing environment. Management Accounting Journal 69 (1). 28-31
Markham, N.M. (2013). Performance measurement: implementing strategy. Management
Accounting Journal 72 (12). 49-53
Mc. Cutcheon and Meredith. (2011). A multi-level case study critique of new product
development. Production Management Journal. 24: 530–549
Meredith, C.K. (2013). The influence of knowledge accumulation on buyer-supplier
codevelopment projects. Journal of Product Innovation Management, 20 (5). 356-373

The Fourth International Conference on Entrepreneurship | Book Three
191
Montoya–Weiss and Calantone. (2014). Technological innovations and firm performance of
manufacturing SMEs: determinants and outcomes. ASC Journal of Manage- ment 41 (1),
109–122
Moorman, C; Amason, R.C; Shrader, E. (2011). Newness and novelty: relating top management
team composition to new venture performance. Journal of Business Venturing 21(1). 125-
148
Morales, J and Fernandes, V. (2010). Top management and innovations in banking: Does the
composition of the team make a difference? Strategic Management Journal. 10, 107–124
Moran, K. M. (2011). Product development: Past research, present findings, and future
directions. Academy of Management Review, 20(2), 343–378
Negassi, S. (2004). An exploratory study of the effects of supplier relationships on new product
development outcomes, Journal of Operations Management. 20. 33–52
Norman, L.P. (2011) A research agenda to reduce risk in new product development through
knowledge management: a practitioner perspective. Journal of Engineering Technology
Management 20. 117–140
Oxley, M and Sampson, S. (2014). Best new product development and management practices in
the korean high-tech industry. Industrial Marketing Management Journal 35. 262–278
Pershon, S. (2004). Suitability of virtual prototypes to support human factors/ergonomics
evaluation during the design. Journal of Applied Ergonomic. 56, 11e18
Robertson, C and Catignon, R. (2011). Time evolving rule based knowledge bases. Data and
Knowledge Engineering, 29. 313-335
Schiffman, S and Kanuk, R.A. (2016). Virtual customer environments: testing a model of
voluntary participation in value co-creation activities. Journal of Production Innovation
Management. 26 (4), 388e406
Shenher, H; Deros, B.M ; and Pucik, V.T (2011). Relationship between innovativeness, quality,
growth, profitability, and market value. Strategic Management Journal 26. 555-75
Stanton, M. R. (2010). Triggers for virtual customer integration in the development of medical
equipment-From a manufacturer and a user's perspective. Journal of Marketing
Management. 39 (8), 1376e1383
Tambunan, T.T.H. (2011). Trade Liberalization Effects on The Development of Small and
Medium Sized Enterprises in Indonesia : A Case Study. Asia Pacific Development
Journal. 15 (2). 35-59
Thorgren, V.M,. Anderson, E,. Crawford. R. G. (2009). An exploratory investigation of
organizational antecedents to new product success. Journal of Marketing Research, 34.
107-116
Uzzi, R.T. (2009) High-tech marketing: concepts, continuity, and change. Sloan Management
Review 30 (4). 7–17
Zawadi, A. (2010). Management control, role expectations and job satisfaction of new product
development teams: The moderating effect of participative decision-making. Industrial
Marketing Management, 42(2), 248–259

The Fourth International Conference on Entrepreneurship | Book Three
192
MARKETING ANALYSIS OF AGRICULTURAL PRODUCT
SWEET POTATOES USING MARKOV CHAIN
1Surjohadi, 2Heri Tri Saksono, 3Sugiarto
1,2 Program Studi Teknik Industri Fakultas Teknik
1,2 Universitas Kartini Surabaya
3 Program Studi Teknik Informatika Fakultas Ilmu Komputer 3 Universitas Pembangunan Nasional “Veteran” Jawa Timur
1,2 Jl. Raya Nginden No. 19-23, Surabaya, Jawa Timur 60233 3 Jl. Raya Rungkut Madya, Gunung Anyar, Surabaya, Jawa Timur 60294
INDONESIA
Email : [email protected], [email protected], [email protected]
ABSTRACT
Agricultural is one of major livelihood of Indonesians. The economic
aspects of it has also developed and noticed. In marketing its products
farmers usually accept any prices determined by the buyer. Markov
Chain Analysis is a method that studies the nature of variable in the
present based on its nature in the past in order to estimate the
variables’ nature in the future. Markov Analysis is a mathematical
technique to forecast changes on certain variables based on its
knowledge of previous changes.
Initial matter for farmer is the middleman, who buys in lower price than
the market price community. The next problem is almost all farmer in
the village still do not have ability to process their agricultural
products, so that the selling price of its raw products is very cheap. By
analyzing using Markov Chain a simulation of shifting and raising
selling price to the market can be made to depress prodution cost.
Eventually it will be able to raise living standard of farmers of the sweet
potatoes commodity, With the result of these research, farmers can save
so much expenses from maintenance cost until the balance of
production, because from the beginning all can be predicted by 5% of
error rate.
Keywords: Analisis, Pemasaran Hasil Pertanian, Markov Chain
INTRODUCTION
Agricultural is one of major livelihood of Indonesia people. Its economic aspect is started to
bloom and noticed. As a developed country, Indonesia has character and potential resources
development which depend on agricultural sector. Meanwhile, agricultural sector has
contributed a lot on foreign exchange, especially from main export commodity. It is confirmed
by Nainggolan (1998), that agricultural sector has strategic role, which is as main source of life
and income of the farmer, food producer for the community, raw and basic material for 2
processing industries, employment provider and workplace for the community, source of
foreign exchange earners and one of the resources preservation life. As source of foreign
exchange earners, position of agricultural commodity becomes more important and strategic in
Indonesia non-oil export, especially since the drop of oil and gas price (migas) on international

The Fourth International Conference on Entrepreneurship | Book Three
193
marketing 1992. Since then Indonesia export commodity in form of agriculture products keep
showing improving significant role. It is achieved by the increase improvement of product
quality in accordance with the provisions and qualification set up by international market. The
importance role of agricultural sector on Indonesia economics will not be decreasing.
In marketing their products, farmers usually accept the price determined by the buyer. On good
marketing which is profitable for production farmer and consumer, it has to involve minimal
trading institution. Short marketing chain will be more profitable or the farmer because selling
price will be higher and offered price to the consumer will be lower. Then increasing consumer
purchasing power and accelerate marketing result process. Every trading institution formed in
marketing will gain some different shares or profit due to management cost that has been issued.
The amount of marketing cost depends on marketing distance and management during the
process of marketing.
But during marketing conducts by farmer it is often faced by problems which are fluctuative
trends on price of sweet potatoes (unstable), so the earning results accepted by farmer are tend
to be lower than expense cost they have paid. It is showing that sweet potatoes marketing is less
than optimal and profit share the farmer receives are relatively low. Price of agricultural
products are always fluctuative depends on occured changes on short terms which is monthly,
weekly or even daily, or it can be happening on long terms. The condition is causing difficulties
for farmer to plan production, buyer will also have difficulties on predicting demands. Because
seen from its nature and use, sweet potatoes commodity is easily damaged / rotten (perishable)
so that it need to be marketed directly to avoid large loss for farmers and marketing network is
limited. So farmer is forced to sell sweet potatoes at offered price by collectors / middleman
which is relatively minimal. In this case farmer is in difficult condition to bargain because they
can not wait for sweet potato prices to go up due to its nature. So they are forced to sell them on
relatively low price.
Weak producer (farmer) do bargaining to get good price. Their ability in bargaining products
is still limited because of limited capital owned, there is tendency to sell their product in low
prices. Then the one who won a great advantage usually is the buyer. Of course market price
will be fluctuative, maybe higher or lower, both side will gain profit or loss based on contract
price rather than market price. Nevertheless predetermined price on contract will be considered
profit or loss only theoritically, which is linked to a lost opportunity. Another marketing
problem faced by farmer is poor market information. Market information is factor which
determine what to produce, where, why, how and for whom it is sold to for the best profit gain.
Those conditions causes farming performs without proper planning, especially in macro
condition
RESEARCH METHODS
Markov Chain
Markov Chain Analysis is a method that study natures of variables on present time based on its
natures in the past in order to predicting its nature in the future.
Markov Analysis is a mathematical technique to predict changes on certain variables based on
knowledge of its previous changes.
Considering a very significant generated impacts, marketing aspect of this farming products is
one of the main subject on the modelling. Many approach model has been served on review of
literature, one of them is Markov Chain. Markov Chain method is one of the oldest model and
has been applied by various researches. Muller and Middleton (1994) use this technique in study
the dynamics of land change in Ontario, Canada. Other researcher, Vandeveer and Drummond
(1976) use it to examine a construction impact on a reservoir. Although it showed less
significant impact on forecasting level, Markov Chain concepts has often served as base concept
which is use on advance development, such as CA-Markov model (Ye and Bai 2008; Poska et al.

The Fourth International Conference on Entrepreneurship | Book Three
194
2008). The Markov Chain equation is build on using the distribution of field use at the
beginning and end of observation which is presented in a vector (one column matrix) and a
transition matrix.
Markov Analysis is vvery often use to help determining business and industrial decision, such
as brand change, debt credit problems, operational machine problems, supervision analysis and
other problems. Generated information is not absolute becoming a decision, because its nature is
only to assist on decision making process.
Markov Analysis Characteristic
Markov Analysis can be use to analyze several different decision making situation. For example
analysis of brand changes conducting by customer. Markov analysis give informations on brand
changes probabilities from one brand to another or more other brands.
A small community has two gas stations. Machine A and Machine B. Members of the
community buy gasoline from those gas stations monthly. Marketer of Machine A conducts
survey to several people and find out that customer is not totally loyal to any gas station. They
will move to any gas station due to advertisement, service and other factors. Marketing find out
that when a customer buy gasoline from Machine A on any month, there is only 0,6 probability
that he/she will still buy from Machine A on the next month, and 0,4 probability that they will
buy from Machine B on the next month. Likewise when a customer holds transaction with
Machine B on a month, there is 0,8 probability that he will buy from Machine B on the next
month and 0,2 that he will buy form Machine A. Those probabilites are concluded at Table 1.
Table 1. Customer Movement Probabilities each Month
This month Next Month
Machine A Machine B
Machine A 0.6 0.4
Machine B 0.2 0.8
These examples are containing several important asumptions :
1. Notice that on table 1, the number of probability on each row is equal to 1.0. It means when
a customer holds transaction with Machine A in a month, he will definitely hold transaction
either with Machine A or Machine B on the next month.
2. Probabilities on table 1 applies to every customers who buy gasoline.
3. Everytime a customer buy gasoline, his probability to hold transaction on one of the gas
station on the next month is stated on table 1.
The happening events are independent event all the time.
RESULT
Markov Chain Methods Trial
Tabel 2. Data Pemetaan 1 Komoditas
Dates
Wide
Prod
uctio
n
(Ha)
Produ
ction
Result
(Ton/
Ha)
Product
ion
Value
(Rp.
/Ton)
Selling
Price
from
Middle
men
(Rp.
/Kg)
Harg
a Jual
Pasar
(Rp.
/Kg)
18/07/20
17 3 36
34,200,0
00 3,500 7,200
20/10/20
16 3 27
22,200,0
00 3,500 7,000

The Fourth International Conference on Entrepreneurship | Book Three
195
30/10/20
15 3 31
28,000,2
00 3,000 6,500
Sumber : http://prodeskel.binapemdes.kemendagri.go.id
On table 2 above, It can be seen that mechanism of price determination on marketing a product
is one of key indicator of market behavior because it will ended up at number of earnings that
will be received by market players. Many factors can affect mechanism process of determining
price, such as level of competition between existing market players, regulation or rules from
governments and preference form buyers or consumers. The most common problems faced by
sweet potatoes commodity farmers is their helplessness on negotiating selling price of their
about to sold products. The current agricultural system has patterned with marketing network
structure which is tended to adverse farmers. The farmers’ helplessness toward access to
products market has caused increasingly difficult position in accepting some provisions which
are offered by market. Based on current phenomenon, one of the main components to determine
selling price of sweet potatoes commodity from farmers to collector buyer is the percentage of
water content. The higher percentage of water content of the product than price received by the
farmer will be lower. Meanwhile nature of farming management is still traditional. It is causing
the quality of product always below quality standard desired and set by the market. This
infirmity often becomes based for collector buyer to gain higher profits. Besides that, a long
marketing chain that has to be passed is causing certain problem of its own. Therefore it led to
inefficiency business as implication. Sweet potatoes commodity is marketable widely, on
domestic level until international ones. Thus, each fluctuation happens on both markets will
effects directly to determine price of sweet potatoes commodity. But the phenomenon that is
always happens is the farmers’ incapability to access each occurred changes. In other words,
price of sweet potatoes commodity at research location is always set by information belonged
by buyers. Development of price of sweet potatoes commodity cannot be accessed by farmers,
unless it is a based info that is given by those buyers.
Other factor that is influencing price determination mechanism is regulation or rules by the
government as regulator. Government regulation becomes determinants factor which have
power to make market players to obey them. However for sweet potatoes commodity,
government has not have regulation to set up mechanism for price determination as have been
applied on rice commodity (Sudaryanto and Kasryno, 1999) and for several kind of vegetable
oil (Suryana, 1999). Therefor development of price of sweet potatoes commodity only set up by
the strenght of farmers as producer on consumers at the market.
The production in the field on 2017 is 36 Tons,-
Sweet Potatoes Price per Kg = Rp 3.200,- (Middlemen)
Market Selling Price = Rp 7.500,-
Production Cost = Rp 30,- x 36.000 Kg x 30 days = Rp 1.080.000,- = 0,43%
Depreciation Cost = 0,90% +
Total Storage Cost = 2,13%
Product Storage Cost each Months = 2,13% x 36.000 kg x Rp 2.100,- x state i
Cost of shortage of supplies = Rp 530.000 + (Rp 2.100 x 36000 kg)
Based on Table 2, those datas will be uploaded statistically into data class groups, which are :
Range = Largest Data – Smallest Data = 3750 – 150 = 3600
Number of Classes = 1 + 3,3 log n = 1 + 3,3 log 24 = 5,54 = 6
Interval = 3600 / 6 = 600

The Fourth International Conference on Entrepreneurship | Book Three
196
Assumpted that Early Data = 0, 600, 1200, 1800, 2400, 3000
Based on Markov Chain provisions, that decision making x, a state of system have transition
from state i to state j = I +x-d with probability Pij(x) = P(d)
Order cost = Rp 530.000
Storage cost = production number x price = 3600 X Rp 2.100 = Rp 7.560.000
Number of material taken is number of quantity that occured mostly on the table (modus).
Then Markov Chain calculation begins fot each state row, which are :
For i = 0 ;
x = 520;
if j = 0
Then j = i + x – d 0 = 0 + 100 – d d = 520 Probability Pij = P0,0(520) = P(d >= 100) = 1
For other probablity = 0 Shortage Cost = Order Cost + Storage Cost
[∑( d – i – x )
P(d)] = Rp 530.000 + Rp 7.560.000[(36000-520)0.42 + (1800 - 520)0.17 + (2400- 520)0.13 +
(3000 - 520)0.08 + (3600-520)0.04] = Rp 39.820.000,-
Table 3 Calculation Result of Markov Chain Analysis
Dates Wide
Production
(Ha)
Production
Result
(Ton/Ha)
N
Production
Value (Rp.
/Ton)
Selling
Price from
Middlemen
(Rp. /Kg)
Selling
Price
on
market
(Rp.
/Kg)
18/07/2017 3 36 39,820,000 4,500 6,500
Sumber : Data Olahan Probabilitas Analisis Markov Chain
CONCLUSION
Early problem of farmers is a middleman, who buy in lower price than public market price.
Next problem is almost all farmers in the village have no ability to process their farming
products. So then its raw materials’ selling price is very cheap. Analyzing with this Markov
Chain will create a shifting simulation and raise its selling price to the market by depressing cost
production. So later it can raise standard living of farmers of sweet potatoes commodity. In this
case farmer or in larger scope groups of farmers can count on production cost calculation with
market selling price using Markov Chain Methods. Considering its result can reflects total
supply by connecting cost must be paid by the company, for example total current production is
36000 Kg, then minimal cost production target is Rp.39.820.000,-. With this research result,
farmers can save so much from maintenance cost until production balance, because from the
beginning it can be predicted with 5% error rate.
REFERENCES Abdurachman Edi. (1999), Konsep Dasar Markov Chain serta kemungkinan penerapannya di
Bidang Pertanian, Journal Inform atika Pertanian Volume 8, Desember
Acharya, S. S. (1998). Agricultural Marketing in India : Some Facts and Emerging Issues.
Indian Journal of Agricultural Economics, 53 (3) : 311-332.

The Fourth International Conference on Entrepreneurship | Book Three
197
Adri. (1999). Keragaan Kelembagaan dan Ekonomi Usahatani Kopi Arabika Organik di
Kabupaten Aceh Tengah. Tesis Magister Sains. Program Pascasarjana, Institut Pertanian
Bogor, Bogor.
Angginesa Pradika, Ali Ibrahim Hisyam, dan Achdiansyah Soelaiman. (2012). Analisisi
Efisiensi Pemasaran Ubi Jalar di Lampung Tengah Jurusan Agribisni Fakultas Pertanian
Universitas Lampung.
Arif Maulana Firdaus. (2004), Analisis Efisiensi Pemasaran Ubi Jalar Cilembu studi kasus di
Desa Cilembu Kecamatan Pamulihan Kabupaten Sumedang Jurusan Manajemen
Agribisinis Fakultas Pertanian Universitas Institut Pertanian Bogor.
Arismawanti Rahmala. (1996). Pemasaran Ubi Jalar dan Nilai Tambah Pengolahannya Studi
Kasus di Desa Pacet Kecamatan Pacet, Jurusan Agribisnis Fakultas Pertanian,
Yogyakarta: 2006. Djaslim Saladin, Unsur-Unsur Inti Pemasaran & Manajemen
Pemasaran Bandung: Mandar Maju.
Arif Al Nur Rianto. (2010). Dasar-Dasar Pemasaran Bank Syari’ah, Bandung : Alfabeta.
Assauri Sofjan. (2011). Manajemen Pemasaran. Jakarta: Raja Grafindo,.
David, F. R. (2006). Manajemen Strategis : Konsep, edisi 10 (Buku 1). Salemba Empat, Jakarta.
Erickson Steven P & W. David Downey. (1987) Manajemen Agribisnis. Jakarta : Erlangg.
Fatimah Siti Nurulita. (2011). Analisis Pemasaran Kentang (Solanum tuberosum L.) studi kasus
di Kabupaten Wonosobo, Jurusan Sosial Ekonomi Pertanian Fakultas Pertanian,
Universitas Sebelas Maret, Surakarta.
Amelia,S., et al. (2009). Integrasi kebijakan persediaan-transportasi. Jurnal Teknik Industri, Vol
11 (1), 2009, pp.15-32.
Assauri, S. (2008). Manajemen produksi dan operasi. Fakultas Ekonomi Universitas Indonesia,
Jakarta.
Nainggolan, K. (1998). Strategi Pemasaran Ekspor Pertanian dalam Pasar Global. Jurnal Agro
Ekonomika, 28 (2) : 53-73.
Kotler, Philip. (2001). Manajemen Pemasaran, Edisi Milenium. Jakarta: Prehalindo
Kuntoro Boga Andri. (2012) Analisa Manajemen rantai Pasok Agribisnis Tembakau Selopuro
Blitar Bagi Kesejahteraan Petani Lokal. Diakses dari http:pertanian.trunojoyo.ac.id pada
tanggal 24 November 2014 pukul 04.00 WIB
Lexy, J. Moleong. (2005). Metode Penelitian Kualitatif. Bandung: PT Remaja
Muhammad Khairil Anwar, Aji Dedi Mulawarman. (2014). Dari Ketergantungan Petani Menuju
Net Farm Income Berkeadilan (Etnografi Kritis Ketergantungan Petani Tembakau
Temanggung Terhadap PT. Bentoel International Investama). Diakses dari
jimfeb.ub.ac.id pada tanggal 19 Agustus 2015
Rambe, A. Jabbar M. (2005). Teknik Analisa Rantai Markov dalam Analisa Posisi dan
Perpindahan Fungsi Produk Sejenis. Jurnal Sistem Teknik Industri. Vol. 6 (5): hal. 1-4.
______http://prodeskel.binapemdes.kemendagri.go.id

The Fourth International Conference on Entrepreneurship | Book Three
198
EFFORTS TO IMPROVE PATIENT VISIT BASED ON
PERCEPTION, MOTIVATION, PERSONALITY, AND DECISIONS
TO USES HEALTH CARE ASPECT
AT SURABAYA LUNG HOSPITAL
1Setya Haksama
Faculty of Public Health, Universitas Airlangga, Surabaya
INDONESIA
E-mail: [email protected]
ABSTRACT
Surabaya Lung Hospital is required to always put service to community
first and also always pay attention to economic principal. The condition of
inpatient admission is tend to be lower each year with BOR of 2013 is at
51,57 % 2014 is at 39,66 % and 2015 is at 40,00 %, below the standard
BOR value at 85,00%. Based on the information, the purpose of this
research is to conduct efforts to improve patient visit based on perception,
motivation, personality, and decisions to uses health care.
This research is a survey research on 50 respondents with cross-sectional
approachment, result of data collection is analized using value level 1
(very bad) until 4 (very good) and weight percentage using spider-web
analysis by total score 100,00. Result of the research shows that perception
aspect including accessibility score “good” by 2,86 (0,19), inpatients
procedure score “very good” by 3,32 (0,29), room facility score “bad” by
2,26 (0,20) and service quality score “good” by 3,01 (0,32); motivation
aspect score “”very good” by 3,35 (0,25); personality aspect score “very
good” by 33,60 (0,26); and decision aspect using health care score “very
good”by 3,49 (0,25)
Conclusion and suggestion that can be delivered to Surabaya Lung
Hospital to increase pasients visit is by noticing room facility aspect,
accessibility, and service quality in order to be fix immediately; improving
and maintaining inpatients procedure aspect, patients motivation, decision
to use health care, and personality.
Key word : Perception, Motivation, Decision Using Health Care,
Surabaya Lung Hospital.
INTRODUCTION
Surabaya Lung Hospital is a specialized hospital which is transferring into become public
hospital. Recently as a hospital that serves lung disease it is known that pasient visit tend to
decrease lower as seen as table BOR below.

The Fourth International Conference on Entrepreneurship | Book Three
199
Table 1. Hospital Utilization Indicator based on Health Ministry.
No Indicator/ (Standard) Year
2013 2014 2015
1 BOR (60,00% – 85,00%) 51,57% 39,66% 40,00%
Trend - -23,09 0,86
2 Number of Visits 14.330 16.203 16.483
3 Number of Beds 41 49 49
Source : Annual Report of Surabaya Lung Hospital year 2013, 2014, and 2015.
BOR score as work indicator of Surabaya Lung Hospital performance tend to look decrease and
below standard BOR score, year 2013 BOR is 51,57 % which decrease by 23,09% on year 2014
into 39,66%; on year 2015 BOR is 40,00% slightly decrease 0,86%. Probable cause of
decreasing patient visits is because there is image from the public that Surabaya Lung Hospital
is a specialized hospital on lung disease patients only, actually it can accept common patient too
which intend to be inpatient.
Based on that, a research is conducted related to patient perception including accessibility,
inpatients procedure, room facility and service quality; motivation; personality; and decision
using health care which are consumer behavior aspect in efforts to increase patient visit in-
patients to Surabaya Lung Hospital. Supranto and Limakrisna (2007) stated that in designing
product or service which is appropriated, it needs to understand consumer behavior well.
Hawkins, Best, Coney (2004) stated that it is important for marketer to acknowledge factors in
consumer behavior.
Purpose
The purpose of this research is to conduct efforts to improve patients visit to Surabaya Lung
Hospital based on aspects of perception, motivation, personality and decision using patient
health care.
Benefits
1. As reference and study material on hospital management in order to increase patient visit in-
patient to the hospital.
2. As reference to improve service quality which is held by the hospital.
RESEARCH METHODS
Design of the research is a survey with cross-sectional approachment which the respondent is
taken on a certain time to achieve image of perception, motivation, personality, and decision
using healthcare on Surabaya Lung Hospital.
Population and Sample
Population
Research Population is all in-patient patients of Surabaya Lung Hospital. Population is a group
of subject or object which have certain characteristic that is different from other group of
subject or object, and those groups can be generalized from the result of research (Sumarsono,
2004).
Sample
Sugiyono (2010) stated that samples are part of number and characteristic which is had by the
population. Sample in this research is patient who has in-patients service at Surabaya Lung
Hospital as many as 50 respondent. There are inclusive criteria on patients who becomes
respondent, which are
1. Potential patients undergo hospitalization at Surabaya Lung Hospital.

The Fourth International Conference on Entrepreneurship | Book Three
200
2. Adult patients with minimal age of 17 years.
3. Agreeing patient to become research respondent and signing inform consent letter.
4. Patients is in conciuosness and able to communicate well.
Sampling assignment is using accidental sampling technique which is an engineering
sample determination based on existing conditions at the time by chance. Supriyanto and
Djohan (2011) explaine that accidental sampling gains respondents on existing conditions by
chance so that can be used as sample according to inclusive criteria. It is done because patients
visit at Surabaya Lung Hospital is relatively low.
Survey Instruments
Survey instruments is using questioner guidance which have been developed in a certain way to
gain information on perception consists of accessibility; inpatients procedure; room facility;
service quality; motivation; and decision using health care service at Surabaya Lung Hospital.
Data Analysis Technique
Data Analysis Technique is done to achieve several informations and analyze data process
which includes data editing process which is done to ensure and check completeness of the
contents of completed questionnaires. Follow by coding process and data entry. On above steps
it also does cleaning data mechanism.
Data analysis use measurement techniques assessment with score ranking of each
available question. Follow by measuring with composite each score on each question aspect of
the questioner. Score ranking given in questioner is as shown below:
1. Score 1 catagorize as Very Not Agree; Score 2 catagorize as Not Agree; Score 3
catagorize as Agree; and Score 4 catagorize as Very Agree.
2. Next average score obtained from the number of each aspect divided by number of
respondents to be categorized into some groups as below:
a. Range between 1,00-1,75 : included in the category “Very Bad” or “SK”
b. Range between >1,75-2,50 : included in the category “Bad” or “K”
c. Range between >2,50-3,25 : included in the category “Good” or “B”
d. Range between >3,25-4,00 : included in the category “Very Good” or “SB”
By obtaining those scores, then it is known and can become references and
consideration for Surabaya Lung Hospital in order to increase patients visit by doing
improvement and repairs on aspects that is found on low scores.
RESULT OF RESEARCH AND DISCUSSION
Description of Research Result
1. Overview of Respondents Condition
Overview of respondent condition expounded based on gender, ages, occupation,
education, and income expounded as shown as below:
Table 2. Respondent Characteristic Based on Gender
No Gender Number Procentage (%)
1 Male 21 42,00
2 Female 29 58,00
Total 50 100,00
Sumber: Data Primer
From above table data resut obtained is from gender there are more female at 58,00% than male
42,00%.

The Fourth International Conference on Entrepreneurship | Book Three
201
Table 3. Respondents Characteristic Based on Age
No Age Number Procentage (%)
1 More than 40 years 30 60,00
2 30-40 year 11 22,00
3 20-30 year 9 18,00
Total 50 100,00
Sumber: Data Primer
From above table data result obtained that 60,00% of respondents on ages above 40 years, while
age group 20-30 years there is 9 respondents or by 18,00%. This is shown that age of respondent
is dominated by they who are above 40 year. Probable because there are more illnesses suffered
by this groups.
Table 4. Respondents Characteristic Based on Occupation
No Occupation Number Procentage (%)
1 Jobless 32 64,00
2 Farmer 1 2,00
3 Factory workers 5 10,00
4 Privvate employees 2 4,00
5 PNS/ TNI/ Polri 0 0,00
6 Entrepreneur/ merchants 8 16,00
7 Etc 2 4,00
Total 50 100,00
Sumber: Data Primer
From above table data result obtained that there are majority respondents of jobless in 32
respondents or 64,00 %. No respondents from PNS/ TNI/ Polri who become inpatients patients
at Surabaya Lung Hospital. This needs to become main concern for managamenent of Surabaya
Lung Hospital to attract all elements of community to be treated at Surabaya Lung Hospital.
Table 5. Respondents Characteristic Based on Education
No Education Number Procentage (%)
1 Not educated 10 20,00
2 Finished Elementary School 14 28,00
3 Finished Junior High School 12 24,00
4 Finished High School 12 24,00
5 Finished Academy / D3 0 0,00
6 Finished Universities(S1/S2/S3) 2 4,00
Total 50 100,00
Sumber: Data Primer
Rom table above obtained data that based on education there are 14 respondents from Finished
Elementary School or by 28,00%, and that there are no respondents Finished Academy / D3.
Table 6. Respondents Characteristic Based on Income
No Income Number Procentage (%)
1 ≤ Rp.2.500.000,00 28 56,00
2 Rp.2.500.000,00 s/d Rp.4.000.000,00 18 36,00
3 ≥ Rp.4.000.000,00 4 8,00
Total 50 100,00
Sumber: Data Primer

The Fourth International Conference on Entrepreneurship | Book Three
202
Characteristic respondent based on income obtained by 56,00 % or as many as 28
respondent with income below Rp 2.500.000,-. Respondents whose income below Rp
2.500.000,- is possibly poor and member of BPJS Kesehatan in form of PBI (Penerima Bantuan
Iuran) and SKTM (Surat Keterangan Tidak Mampu).
2. Analysis of Respondents Perception Aspects (Accessibility, Inpatients Procedure,
Room Facility, dan Room Quality)
Analysis respondent perceptions which include accessibility, inpatients procedure, room
facility, service quality, are stated on table below:
Table 7. Result of Analysis respondent perceptions which include accessibility, inpatients
procedure, room facility, service quality at Surabaya Lung Hospital.
No Perception Aspect n Score Rate Desc.
A. Accessibility
1 Location of Surabaya Lung Hospital easy to reach 50 170 3,40 SB
2 Surabaya Lung Hospital passed by public transport 50 173 3,46 SB
3 Parking space Surabaya Lung Hospital wide and good 50 86 1,72 SK
Total A 429 2,86 B
B. Inpatients Procedure
4 To get inpatient room at Surabaya Lung Hospital is quick
and easy
50 181 3,62 SB
5 To obtained information about room availability on
inpatients at Surabaya Lung Hospital.
50 152 3,04 B
6 Admistration requirement at Surabaya Lung Hospital is
easy and not complicated
50 160 3,20 B
7 According to you Surabaya Lung Hospital have major
capacity of inpatients room
50 171 3,42 SB
Total B 664 3,32 SB
C. Room Facility
8 Inpatients room at Surabaya Lung Hospital are wide 50 118 2,36 K
9 Total number of bed in each room at Surabaya Lung
Hospital is ideal.
50 110 2,20 K
10 Facility of inpatients room at Surabaya Lung Hospital is
complete
50 108 2,16 K
11 Clean water supply in inpatient room at Surabaya Lung
Hospital is plenty.
50 115 2,30 K
Total C 451 2,26 K
D. Service Quality
12 Inpatients room at Surabaya Lung Hospital clean and
neat.
50 174 3,48 SB
13 Inpatients equipment at Surabaya Lung Hospital is
completed
50 121 2,42 K
14 Inpatients care at Surabaya Lung Hospital is fast. 50 120 2,40 K
15 Officer serves with friendly and polite manner 50 166 3,32 SB
16 Officer check on patients thoroughly 50 172 3,44 SB
Total D 753 3,01 B
Total A+B+C+D 2297 2,86 K
Sumber: data primer

The Fourth International Conference on Entrepreneurship | Book Three
203
0.000.010.020.030.040.050.060.070.08
1 Lokasi RS Paru mudah…
2 RS Paru dilewati…
3 Sarana parkir di RS Paru…
4 Untuk mendapatkan kamar…
5 Untuk mendapatkan…
6 Persyaratan admisnistrasi…
7 Menurut anda RS Paru…
8 Kamar rawat inap di RS…
9 Jumlah kamar tidur per…
10 Kelengkapan kamar rawat…
11 Kesediaan air bersih…
12 Ruang rawat inap di RS…
13 Peralatan rawat inap di RS…
14 Pelayanan rawat inap di…
15 Petugas melayani dengan…
16 Petugas memeriksa…
Based on table above, it is obtained result that show accessibility have total score 429 with
average score 2,86 which include in category “Good”, lowest score of accessibility aspect is
parking space at Surabaya Lung Hospital which is small and crowded. Inpatients Procedure
aspect which have score 664 with score rates 3,32 is include in category “Very Good”. For room
facility aspect obtained score 451 with score rates at 2,26 include in category “Bad”. While on
service quality there is a problem variable on completeness of in patients equipment score
2,42 means “Bad”, with total score on service quality obtained 753 with sore rates 3.01 include
in category “Good”.
Overall for this perception have score 2297 with average score 2,86 with include in category
“Bad”.
Next step is conducting aspect analysis by using spider-web which comparing procentage
score with available standard value, which result is shown as below.
Figure 1. Perception upon Accessibility, Inpatients Procedure, Room Facility, and Service
Quality at Surabaya Lung Hospital.
From picture above it is shown that accessibility aspect has low score on parking facility at
Surabaya Lung Hospital, with score value 0,04 from 0,06 standard. All room facility aspect
score are low, including facility inpatient room variable with score value 0,05 number of beds
score value 0,05 completeness inpatient room with score value 0,05, and clean water supply on
inpatient room score 0,05. While for service quality low score value is at incomplete inpatients
equipment and inpatients service that is not fast enough by each scores at 0,05 below standard
score 0,06.
Responden assessment linked to perception aspect is in accordance with what has been
described by some experts as stated by Suryani (2008) submitted that perception is a process of
how an individu choose, organize, and interpret stimulation into become something which have
meaning. Perception of each self about an object will be different upon same stimulation.
Perception is a patient opinion before getting inpatients care.
Kotler and Amstrong (2006) stated that perception is a process of someone in choosing,
organizing, and translating available information. A person can shape many different
perceptions from the same simulation. Definition of perception is “how we see the world around
us”. Hawkins, Best and Coney (2004) stated that perception is an information process model
which is useful and have four steps including exposure, attention, interpretation and memory.

The Fourth International Conference on Entrepreneurship | Book Three
204
0.230.230.240.240.250.250.260.26
17 Mendapatkan pelayananrawat inap yang ditangani
oleh dokter spesialis
18 Mendapatkan pelayananyang ramah, sabar, dan murah
senyum
19 Mendapatkan pelayananyang dekat dengan rumah
20 Dapat menerima pasienBPJS.
In the future Surabaya Lung Hospital needs to pay more attention on parking space and room
facility which is considered lack by patients or community. Respondent’s perception due to their
interest to assess service given by the hospital.
Therefore Surabaya Lung Hospital is obliged to to always understand and assess each coming
patients’ perception by doing simple research to obtain need and desire of the patients. It is
important if Surabaya Lung Hospital is able to measure the need and desire of the patients, the
in the future it can arrange health care that fit their needs. One of them is by managing parking
space, improving room facility, and improving healthcare quality gradually in accordance with
available resources condition. For budgeting it is wise to plan each year to improve those
variables with low scores.
3. Analysis Motivation Aspect
Analysis respondent motivation is an important matter to be assessed because it is as an effort to
response what represent inward strength which is invisibly response and encourage behavior
response and give certain direction for the response. The research is shown as below:
Table 8. Analysis Result on Respondents Motivation at Surabaya Lung Hospital.
No Motivation n Score Rates Des.
17 Getting inpatients care held by specialist doctor 50 167 3,34 SB
18 Getting service that is friendly, patients and smiling 50 160 3,20 B
19 Getting health care that is close from home 50 173 3,46 SB
20 Can accept BPJS patients. 50 169 3,38 SB
Jumlah Keseluruhan 669 3,35 SB
Sumber: data primer
Based on above data show that responden motivation total score obtained is 669 with average
score at 3.35 which means “Very Good”. This show that respondents motivation at Surabaya
Lung Hospital is in a very good condition to get inpatient healthcare held by specialist doctors;
close from home healthcare; and hospital accept BPJS patients. While friendly, patients and
always smiling service has gain total score of 3.20 within category “Good” which relatively
lower than other variable.
Next step is conducting aspect analysis by using spider-web which comparing procentage score
with available standard value, which result is shown as below.
Figure 2. Respondents Motivasi Aspect Surabaya Lung Hospital.

The Fourth International Conference on Entrepreneurship | Book Three
205
0.23
0.24
0.24
0.25
0.25
0.26
0.26
21 Merasa senang berobatke RS Paru karena nuansakekeluargaan yang tinggi
22 Saat disarankan dokteruntuk rawat inap segera
mencari informasikesediaan kamar.
23 Saat disarankan dokteruntuk rawat inap segeramenyiapkan persyaratan
rawat inap.
24 Saat disarankan olehdokter untuk rawat inapsegera mempersiapkanbiaya rawat inap yang
diperlukan.
From picture above it can seen that motivation variable on friendly, patients and smiley service
get lowest score than other variables with value score at 0.24 compared with standard value at
0.25. Management of Surabaya Lung Hospital need to improve friendly, patients and smiley
service by accustom and encourage this manner each day while serving the patients.
Motivation is an important thing because motivation is a supportive of human behavior.
Motivation gets more important so that consumer can get its desired goal optimally. According
to Nugroho (2003) stated that motivation is a tendency of nature that is the main contention
inside a person to evoke action. While according to Suryani (2008) stated that motivation is an
emerging process of impulse so that consumer moves to buy a product. Nevertheless motivation
is an impulse of needs and will of individu which iss directed to a goal for achieving satisfaction
(Hawkins, Best and Coney, 2004). That is why Surabaya Lung Hospital need to keep
respondents motivation by maintaining its very good service and improving its friendly, patients
and smiley service because respondents assess this variable relatively low.
4. Analysis of Personality Aspect and Decision Using Inpatients Health Care Facility
Analysis of Personality Aspect and Decision Using Inpatients Health Care Facility is combined
because personality aspect only has 1 (one variable) analysis. The result is shown as below:
Table 9. Result of Personality Analysis and Decision Using In patients Health Care
Facility at Surabaya Lung Hospital.
No Personality Aspect and
Decision Using Health Care Facility
n Score Rates Desc.
A. Personality
21 Feeling happy to have medical treatment at Surabaya
Lung Hospital because its highly familiar feeling
50 180 3,60 SB
Total A 180 3,60 SB
B. Decision Using Inpatients Health Care Facility
22 When suggested by doctor to inpatients immediately seek
information about room availability.
50 168 3,36 SB
23 When suggested by doctor to inpatients immediately
prepare its requirements.
50 178 3,56 SB
24 When suggested by doctor to inpatients immediately
prepare its necessary inpatiens expenses.
50 177 3,54 SB
Total B 523 3,49 SB
Total A+B 703 3,54 SB
Sumber: data primer
Based on data of table above it is obtained result that score value of personality shows 180 with
average score 3.60 means “Very Good”. Respondents personality related to medical care is high
because high familiar feeling qat Surabaya Lung Hospital.
Figure 3. Personality Aspect and Decision Using Health Care at Surabaya Lung Hospital.

The Fourth International Conference on Entrepreneurship | Book Three
206
From picture above it is seen that personality aspect shows score value as 0.26 above standard
score value 0.25. It is in line with research conducted by Abdul Ghani (2011) which mentions
that personality is a psychology order and environment influences including character. On the
other side Ginting (2011) also mention that personality often defined as individual characteristic
which is a combination of charater, temperament, common ability and talent which in its
development is influenced individual interaction and its environment.
Personality can be defined as a characteristic of one individu which involve several psychology
processes which will determine its tendency and response toward environment. Therefore,
familial shades that have been built by Surabaya Lung Hospital right now need to be always
maintained and even improved. While in decision using health care aspect shown in related
variable in suggestion to inpatients respondent is not immediately seek information on room
availability. This maybe because basically one behaviour in buying something also influenced
by personality factor of its related consumer.
For decision using health care aspect obtained total score value of 3 (three) questionare
variables as 523 with average score 3.49 means “Very Good”. Related to decision using health
care is conformed by Kotler and Armstrong (2003) which stated that one decision to buy is
influenced by personal characteristic such as age and life cycle phase, work, economic situation.
Buyer decision is also influenced by individual factor. Personal is deepest characteristic
difference of human. Characteristic differences describes unique signature of each individuals.
Therefore, one individu is not the same with the other. According to Amalia (2011) stated that
one habit is influenced by their nearest environment to make a choice, then it express in an
action.
Therefore to decide using health care personality need to e considered because each person has
personal character which will determine their buying behavior. Personality factor is a way to
collect and grouping reaction consistency of an individu towards happening situation
(Lamb.2001).
Next phase is doing analysis of personality aspect and decision using health care by using
spider-web which is average score compared with available standard score value, which result is
shown as below.
CONCLUSION AND SUGGESTION
Conclusion
Conclusions obtained that can be conveyed from research result are:
1. Perception aspect has low score on accessibility variables: parking facility; all room
facilities variable; and quality service: completeness equipment and speed service of the
hospital.
2. Motivation aspect has a need to improve score on friendy, patient and always smiling
service variable.
3. Personality and decision using health care has variable on suggestion to inpatient which
patient is not immediately seek information on available room.
Suggestion for Surabaya Lung Hospital Advisable suggestion to improve pasients visit at Surabaya Lung Hospital based on
research result are as below:
1. Conducting setting up parking space, improving room facility, and improving medical
care service quality gradually accordance to available resources condition.
2. Organizing training for excellent service regularly especially for behavior and ethics to
stay friendly, patient, and always smiling so that the culture is completely dive in every
officer at Surabaya Lung Hospital.

The Fourth International Conference on Entrepreneurship | Book Three
207
3. Developing an information system related to room availability, so that patient can
directly be able to know availability of empty room when suggested to be inpatients.
4. Budget need to be plan annually as effort to improve condition on every aspect and
variable which has low score.
REFERENCE
Amalia, F. (2011). Analisis Pengaruh Faktor Budaya, Sosial, Pribadi, dan Psikologis Terhadap
Keputusan Pembelian Minuman Penambah Tenaga Cair Merek M-150 di Semarang.
Skripsi. Fakultas Ekonomi, Universitas Diponegoro. Semarang.
Departemen Kesehatan, RI. (2005). Indikator Kinerja Rumah Sakit. Departemen Kesehatan RI.
Jakarta.
Ghoni, A; Brodoastuti, T. (2012). Pengaruh Faktor Budaya, Sosial, Pribadi, dan Psikologi
Terhadap Perilaku Konsumen (Studi Pada Pembelian Rumah di Perumahan Griya
Utama Banjardowo Semarang). Jurnal Kajian Akuntansi dan Bisnis. Volume 1, Nomor
1, 2012.
Ginting, Nembah F. Hartimbul. (2011). Manajemen Pemasaran. Cet. 1. Bandung: Yrama Widya.
Hawkins, DI; Best, RJ; Coney.(2004). Consumer Behavior: Building Marketing Strategy. 10th
Edition. McGraw-Hill Companies Inc. New York.
Kementerian Kesehatan, RI. (2009). Undang-undang Nomor 36 Tahun 2009 tentang Kesehatan.
Kementerian Kesehatan RI. Jakarta.
ementerian Kesehatan, RI. (2009). Undang-undang Nomor 44 Tahun 2009 Tentang Rumah
Sakit. Kementerian Kesehatan RI. Jakarta.
Keputusan Menteri Kesehatan RI Nomor 1161/Menkes/SK/X/2007 Tahun 2007 tentang
Penetapan Tarif Rumah Sakit Berdasarkan Indonesia Diagnostic Related Group (INA-
DRG).Departemen Kesehatan, RI. Jakarta.
Kotler, P; Amstrong, G. (2001).Dasar-dasar Pemasaran. Edisi Bahasa Indonesia. Jilid 1. Jakarta:
Prenhallindo.
Kotler, P. (2003). Marketing Management: Analysis, Planning, Implementation, and Control.
11th ed. Englewood Cliff: Prentice Hall, Inc.
Kotler, P; Amstrong, G. (2008), Prinsip-Prinsip Pemasaran (terjemahan), edisi ke 12, Jilid I,
Jakarta: Erlangga
Lamb; Hair. (2001). Pemasaran Buku 1. Penerbit Salemba Empat. Jakarta.
Mowen, J; Minor, M. (2002). Perilaku Konsumen. Jilid 2. Edisi Kelima. Erlangga. Jakarta.
Mamik. (2010). Organisasi dan Manajemen Layanan Kesehatan dan Kebidanan. Edisi 1. Prins
Media Publishing. Surabaya.
Mangkunegara, PA. (2002). Perilaku Konsumen. Edisi Revisi. Refika Aditama. Bandung.
Pasaribu, P. (2012).Determinan Faktor Yang Mempengaruhi Rendahnya Pemanfaatan Tempat
Tidur (Bed Occupancy Rate) di RSU Sipirok Kabupaten Tapanuli Selatan. Skripsi. Bab
I. Universitas Sumatera Utara (USU). Program Studi Administrasi dan Kebijakan
Kesehatan.
Peraturan Menteri Kesehatan RI Nomor 1045/Menkes/PER/XI/2016 tahun 2006 tentang
Pedoman Organisasi Rumah Sakit di Lingkungan Departemen Kesehatan. Departemen
Kesehatan, RI. Jakarta.
Purimahua. (2005). Pengaruh Faktor Internal dan Eksternal Konsumen Terhadap Keputusan
Pembelian Smartphone Merek Samsung Berbasis Android di Fakultas Ekonomi dan
Bisnis Unsrat. Jurnal EMBA, Volume 3, Nomor 3, 2015.
Schiffman, LG; Kanuk, LL. (2004). Consumer Behavior. Pearson Prentice Hall, Inc. New
Jersey.
Setiadi, J; Nugroho. (2010). Perilaku Konsumen. Edisi Revisi. Penerbit Prenada Media Grup.
Jakarta.

The Fourth International Conference on Entrepreneurship | Book Three
208
Simamora, B. (2004). Panduan Riset Perilaku Konsumen. Pt. Gramedia Pustaka Utama. Jakarta.
Sujanto, A. (2001). Psikologi Kepribadian. Bumi Aksara: Jakarta.
Sumarwan, U. (2003). Perilaku Konsumen: Teori dan Penerapannya. Ghalia Indonesia. Jakarta.
Supranto, J; Limakrisna. (2007). Perilaku Konsumen dan Strategi Pemasaran untuk
Memenangkan Persaiangan Bisnis. Mitra Wacana Media, Jakarta.
Suryani, T. (2008). Perilaku Konsumen: Implikasi pada Strategi Pemasaran. Graha Ilmu,
Yogyakarta.
Tjiptono, F. (2005). Perspektif Manajemen dan Pemasaran Kontemporer. Andi. Jogjakarta.
Zaltman, G; Wallendrot, M. (1983). Customer Behavior: Basic Findings and Management
Implication. McGraw-Hill Companies Inc. New York.
Zeithaml, A; Bitner, MJ. (2003). Services Marketing. International ed. Singapore: The
McGraw-Hill Companies, Inc.

The Fourth International Conference on Entrepreneurship | Book Three
209
INNOVATION STRATEGY ANALYSIS IN UD. X USING
BUSINESS MODEL CANVAS AND TEN TYPES OF INNOVATION
TOOLS
1Steven Irawan
Ciputra University Surabaya
INDONESIA
Email : [email protected]
ABSTRACT
The ever growing Indonesian real estate industry has enticed businesses to take
advantage of the current hype, in which one of them was UD. X. however,
contrary to the overall market, UD. X has not achieved its management – set
sales objectives for months on end. This issue is what started this study. This
study, which is qualitative by nature, intends to analyze the system and business
model of UD. X through tools Business Model Canvas, Blue Ocean Strategy,
dan Ten Types of Innovation, based on sales perspective of UD. X. This study
began with data foraging across a number of sources in order to more vividly
conjure the actual business model of UD. X. From the business model, this
study will further scrutinize each of its segments, which will then be processed
by Blue Ocean Strategy tools so that the study can reveal which elements need
to be improved, eliminated, or established. After the model is processed through
BOS, there will indeed be a set of key elements to add, eliminate, and/or
establish – in which these elements need to be mapped further into TTI.
Through TTI, it was revealed UD.X needs to focus on customer experience
aspect, in order to improve their business.
Keywords: innovation strategy, business model canvas, blue ocean strategy, ten
types of innovation, marketing mix, strategy analysis.
INTRODUCTION
The growth of Indonesia’s property industry is blooming as of late, encouraging businesses to
exploit the uptrend. One of those is UD X, which was established back in 2015 and working in
roof construction. UD X offers steel based roof installment for homes and other buildings, in
which its flea and weather resistant as well as fairly affordable components made it highly
favored for modern home constructions. In addition, wood materials are also getting scarce –
putting steel roofs industry in a favorable condition.
However, the current condition speaks otherwise. UD X has been fairly vacant – only taking 2-3
projects a month, whereas they were able to finish 10 monthly projects in regular. In order to
survive within this increasingly competitive environment, the business requires accurate
marketing and strategic analysis. According to Philip Kotler, marketing strategy is “a logic used
by a business to achieve business objectives”(Kotler, 2001: 76).
One of the tools often used to analyze business models is Business Model Canvas (BMC). In
BMC, a business will be scrutinized from nine interconnected perspectives, be it from owner’s
perspective as well as customers’. These aspects will then be analyzed further through Ten

The Fourth International Conference on Entrepreneurship | Book Three
210
Types of Innovation tool, where a proper innovation strategy can be laid out through the
mentioned nine perspectives. As such, the author will attempt to formulate a strategy with the
hepkl of BMC and Ten Types of Innovation.
LITERATURE REVIEW
Previous research
One of the journals used as a basis of this study is by Suharti on 2015, titled ‘Penerapan
Business Model Canvas Pada Perumahan Galaxy Regency Malang’. This study used qualitative
approach, based on the actual facts in the field. This study explains in detail the business
activities of Galaxy Regency Malang. After processing its business model through BMC,
Suharti concluded that Galaxy Regency Malang need only focus on its key activities.
Business Model Canvas
Business Model Canvas is a strategic management and lean startup template for developing new
or documenting existing business models. It is a visual chart with elements describing a firm's
or product's value proposition, infrastructure, customers, and finances. It assists firms in
aligning their activities by illustrating potential trade-offs.
BMC defines basic thoughts on how a company operates. BMC illustrates a detailed steps on
this matter. Osterwalder divides a business into nine important aspects, called nine building
blocks: Value Prepotitions, Customer Segments, Customer Relationship, Channels, Key
Resources, Key Partnership, Key Resources, Cost Structures dan Revenue Streams. According
to Osterwalder (2010), innovation ideas can be sourced from any kind of sources. Osterwalder
divides a business model innovations into five parts: Resource-driven (based on infrastructure
developments), Offer-driven (based on increased value add), Customer-driven (based on
customer requirements), Finance-driven (based on cash flow and cost management), and
Multiple-epicentre (based on multiple factors as above).
Ten Types of Innovation
According to Keeley et al., (2013: 16) Ten Types is a tool to diagnose and enrich the current
innovation processes, or to analyze the current competition and come up with a solid concept.
Ten Types of Innovaton is divided into three categories: Confinguration (emphasis on internal
business systems – marked in blue in the model), Offering (depth of product/service concept –
marked in orange in the model) dan Experience (emphasis on customer experience and
satisfaction – marked in red). (Keeley, 2013)
RESEARCH METHODS
Research methods are the approaches used to gather, process, and deduce the data in a research.
There are two big methods: qualitative, which emphasizes deep understanding on an issue
through descriptive analysis, and quantitative, which depends on systematic, structured, and
planned approaches along with quantifiable variables as its data references.
In this research, the author chose qualitative approach, with descriptive study case. This
research was conducted within April to November 2016 in Surabaya.
All researches focus on a certain subjects. A research subject can be defined as a person, place,
or object in focus of a research (Kamus Bahasa Indonesia, 1989:862). To acquire appropriate
information, the source has to be appropriate as well. In this research, the author established a
number of criterions on choosing the sources. One of the better sources are the employees from
its respective companies, and also its customer. The criterions can be seen as below:
Table 1. Specific criteria for determine the research subjects
Source Criteria
Company employee Minimum two years of working
Customer Two times buying or more

The Fourth International Conference on Entrepreneurship | Book Three
211
Applying
Calculating
Worker
Ilmu dasar
Harga sesuai
Warranty
SNI
Personal Assistant –
Special discount
Workshop
Flyer
Developer/kon
traktor kelas
menengah ke
bawah
Material; Worker Fee
Fixed cost
Sales
Buyer-
Supplier
Relationship
On the other hand, research object is basically the objectives of the research (Kamus Bahasa
Indonesia; 1989:622). According to Supranto (2000), research object is a set of elements
(person, place, or object) being researched. In this research, the object is UD X.
After the subjects and objects are chosen, then it will come up to data gathering. In this research,
the data will be gathered through direct interviews and observations. These data will then need
to go through validity test, in order to determine whether the data has reflected the actual
condition. One of the ways to make the data valid is through triangulation. According to
Sugiyono (2010), data triangulation can be defined as a combination of existing data sources
and gathering methods. There are three types of triangulation: technicality, time, and sources. In
this research, the author will employ technicality triangulation, which is multiple data gathering
methods towards UD X.
RESULTS AND DISCUSSION
The author has conducted interviews on four different sources:
Table 2. Criteria details for informant
Name Age Occupation Relation to UD X Code
Budiarta Arif 63 Contractor Customer BA
Suyanto Irawan 57 Entrepreneur Owner SI
Yuki Simon 32 Private Contractor New Customer YS
Mudji 37 Private Contractor Employee M
After a set amount of interviews towards all sources and the required data has been gathered, the
author try to analyze the information and map it through nine blocks of BMC. The result is as
follows:
Figure 1. UD. X’s Business Model Canvas
After the mapping of UD X, the author attempted to delve deeper for further data in
aforementioned interviews, which will then analyzed with Blue Ocean Strategy, so that the
aspects can be classified to the following:

The Fourth International Conference on Entrepreneurship | Book Three
212
Table 3. Blue Ocean Strategy results
From aforementioned four factors, the author will then attempt to construct new business
canvas:
Figure 2. New version of UD. X’s Business Model Canva
After the new business model is established, there are a number of factors singled out, in order
to be improved or fixed, which will then be analyzed further through then types of innovation.
According to Keeley et al (2013:16), ten types is a structure to analyze, diagnose, and enrich
the current innovation attempts, as well as analyzing the current competition to develop solid
concepts through ten specific aspects. Ten types structure is divided into three: Confinguration
(emphasis on internal business systems – marked in blue in the model), Offering (depth of
product/service concept – marked in orange in the model) dan Experience (emphasis on
customer experience and satisfaction – marked in red). The result is as follows:
Eliminate Raise
-
>> Promotion and
advertisment
>> Service level
Reduce Create
>> Selling price >> New variant
Applying
Calculating Training
pegawai
Worker Prinsip dasar
Harga sesuai
Warranty
SNI Varian baru lebih
lengkap
Personal assistant Special
discount
Workshop
Flyer Advertise
ment
Developer/kontraktor kelas atas-
bawah
Material Worker Fee
Fixed cost
Sales
Buyer-supplier
relationships

The Fourth International Conference on Entrepreneurship | Book Three
213
Table 4. Ten Types of Innovation of UD. X
As seen in above table, UD X needs to focus on 4 out of 10 available innovation. 2 of them are
in customer experience. As such, UD X needs to develop a Customer Experience Shift, which is
innovation focused on customer relations. This needs to be done in order to develop a new
strategic canvas, with elements previously not applied by the company.
CONCLUSIONS
This research succesfully showed us that UD. X really need some improvement in order to
increase their sales or revenue, and through this study, we can notice that there are several tools
to analyze the UD. X current problem and issues. According to the Ten Types of Innovation,
which is the final tools to analyze what kind of improvement that should be implemented, UD.
X needs to be more focused on the customer experience segments such as improve service level,
loyalty program and more branding. This study also can be used as a reference or guidane to
whom face this kind of situation as UD. X faced.
REFERENCES
Azwar, S. (1986). Reliabilitas dan Validitas: Interpretasi dan Komputasi. Yogyakarta: Liberty.
Dajan, Anto. (1986). Pengantar Metode Statistik II. Jakarta: LP3ES.
J, Supranto. (2001). Statistik Teori dan Aplikasi, Cetakan Kedua. Jakarta: Erlangga.
Keeley, Larry. (2013). Ten Types of Innovation: The Dicipline of Building Breakthrough. New
Jersey: Wiley
Kim, W. Chan and Renee Maubrogne. (2006). Harvard Business Review. Cambridge: Harvard
Magazine.
Kotler, Philip and Kevin Lane Keller. (2012). Marketing Management 13. New Jersey:
Pearson Prentice Hall, Inc.
Profit Model
Network
Structure
Process *Process
Standardization
Product
Performance
*Superior Product
*Safety
Product System
Service *Superior Service
*Loyalty Program
Channel
Brand *Brand Extension
Customer
Engagement

The Fourth International Conference on Entrepreneurship | Book Three
214
Osterwalder, Alexander and Yves, Pigneur. (2010). Business Model Generation: A Handbook
for Visionaries, Game Changers, and Challengers. New Jersey: Wiley
Permana, Dian Jingga. (2013). Analisis Peluang Bisnis Media Cetak Melalui Pendekatan Bisnis
Model Kanvas Untuk Menentukan Strategi Bisnis Baru, Faktor Excata, 6 (4), pp. 309
– 319.
Sugiyono. (2010). Metode Penelitian Kualitatif Kuantitatif & RND. Bandung: Alfabeta.
Suharti. (2015). Penerapan Business Model Canvas pada perumahan Galaxy Regency Malang
PT. Saran Hijrah Kamulyan, Jurnal Teknik Industri, I (1), pp 215 – 230.
Tjitradi, Elizaeth Cindy. (2015). Evaluasi dan Perancangan Model Bisnis berdasarka Business
Model Canvas, Agora, 3 (1), pp. 8 – 16.

The Fourth International Conference on Entrepreneurship | Book Three
215
BENEFIT COST RATIO ANALYSIS OF SUKOREJO – BATU PASS
ROAD PROJECT
1Darwin Simangunsong, 2Bambang Syairudin
1Magister Program Student, Magister Management of Technology, Project Management,
Sepuluh Nopember Institute of Technology at Surabaya, Indonesia; 2Department of Industrial Engineering, Industrial Technology Faculty, Sepuluh Nopember
Institute of Technology at Surabaya, Indonesia
ABSTRACT
Sukorejo - Batu Road is one of the efforts of local government of East Java
Province, to build new road access network that will have a big impact on
community activities and beneficial to the development of economy,
tourism, regional development, industry, services and agriculture
especially in Malang, Batu City as well as the surrounding area which will
generally have an impact for East Java Province.
Road construction, which requires a relatively large cost, will have an
impact on spatial structure and regional development in general. The
greater the amount of funds needed in the investment, the more important it
is to develop an analysis of the benefits of the project with the aim of
avoiding too much investment increment for unprofitable activities. One of
the analytical methods used to determine the feasibility of a proposed
project is the method of Benefit Cost Ratio (B/C Ratio).
This study aims to analyze the benefits of the Sukorejo - Batu toll road
development project using the Benefit Cost Ratio (B / C Ratio) Method,
taking into account the components of the cost, the job cost component
(construction cost and land acquisition), and the components of the traffic
accident cost. Benefit-Cost Ratio (B/C Ratio) is a comparison between
benefits / benefits that have been present-value with the cost that has been
in-present value.
From this research, it is found that the selected project is worth Rp
1,296,050,611,000 where the total intangible benefits and intangible
benefits are Rp 8,281,018,856,509 while the value of benefit cost ratio is
6.4 which means that the construction of Sukorejo - Batu is worth it,
because its value is more than 1.
Keywords : project, benefit cost ratio, present value, effect
INTRODUCTION
Sukorejo - Batu Road is one of the efforts of East Java provincial government to build new road
access network which has a big impact on community activity and beneficial for economic
development, tourism, regional development, industry, services and agriculture in Malang, Kota
Batu and the surrounding area and in general in East Java (Bina Marga Service of East Java
Provinces, 2012). The development of the road will affect the spatial structure and regional
development in general. The objectives of this research are to predict the impact of increasing
Sukorejo - Batu road to economic benefits and trade activities for producers, traders and
consumers for agricultural commodities, fisheries, small businesses, handicrafts and industries.

The Fourth International Conference on Entrepreneurship | Book Three
216
In addition, Sukorejo - Batu passenger road will shorten the travel route so that there are savings
on travel expenses, increased local revenue, especially the potential increase in land and
building tax (PBB).
The Sukorejo - Batu development project has a significant investment value and is planned to be
funded by the regional budget, where land acquisition uses the district / city revenue budget and
the cost of construction and maintenance will be financed by the regional income budget of East
Java Province. Some emerging alternatives are related to financial analysis using an economic
engineering approach that will produce several alternatives where the best alternative is selected
by judging on certain criteria.
LITERATURE REVIEW
Existing Condition of Sukorejo and Batu Road
Sukorejo is Pasuruan Regency whereas Batu is a municipality of Batu. To go to Batu from the
direction of Sukorejo or vice versa required distance of approximately 56 Km with normal
travel time 1,5 hours. But if the trip is done during the holiday season or at the time of departure
and work hours home from work it can take 3 hours more. Traffic for Sukorejo Road - Simpang
Tiga Karanglo is relatively diverse and dense every day, while the traffic for Simpang Tiga
Karanglo - Batu is diverse and less crowded. On holidays the number of vehicles that travel on
these three road segments, and tend become very crowded and jammed, so need to be addressed.
Figure 1. Existing Condition of Sukorejo and Batu Road (www.petajatim.jatim.co.id)
Impact of Pass Road Sukorejo Batu Project
Direct Impact
The development of Sukorejo - Batu as a strategic mega project is the most appropriate solution
to overcome traffic jam in Surabaya - Malang - Batu vital lane. Ease of access will be able to
move the economic activities of agriculture, tourism, and services. So that can synergize the
development of East Java region with rapid growth. The objectives of regional governments to
promote and stimulate economic activity will be realized. The rapid growth and development in
East Java which has a lot of agricultural potential, manufacturing and service industries,
tourism, mining, marine and so on will make East Java economic actors make the area the main
target market, especially the marketing of agricultural products from Batu City region which is a
necessary commodity Community of East Java.
Indirect Impact
Construction of Sukorejo - Batu access road - This stone will provide easy access for economic
actors or farmer groups to market agricultural products. Indirectly will make the economy of

The Fourth International Conference on Entrepreneurship | Book Three
217
East Java in general and Malang, Surabaya and Batu in particular squirm, economic centers
with agricultural commodities and agro industry will be more enthusiastic and alive because
East Java is a potential market and easy to reach. Subjects that indirectly have a positive impact
are farmer groups and industrial business actors. Increase the stretching of community activities
which then impact on increasing income and community productivity. Activity structure will be
more solid, because of the ease of access between East Java Province. The output is the
improvement of people's quality of life as an estuary of income increase (Tourism Department
of East Java Province, 2015).
Benefit Cost Ratio (BCR)
BCA is the most common technique for calculating costs and benefits of a project. Basically,
the cost-benefit measurement and analysis method is based on management's way and
perspective in assessing project performance implemented (Indrajit, 2010).
……………. (1)
There are several criteria of BCR value associated with the above formulation, namely; First if
the BCR index value is greater than 1 (BCR> 1) then the project is said to be feasible to work,
second if the BCR index value <1 (BCR <1) then the project is not feasible to work considering
the cost is greater than the benefit Benefit) received. While the components of BCR, among
others, as follows:
1. Procurement Cost. Procurement costs are all costs incurred in relation to project
procurement. Among them are the cost of project material procurement consultation,
purchase cost or leasing of machinery and project support tools, project installation cost,
capital cost for procurement and project work, and expenses related to management and
staff for project work.
2. Start Up Cost. Is an operational cost that is all costs incurred in an effort to make the
project ready for operation. These costs include purchase costs, networking,
reorganization, management and personnel.
3. Project Related Cost. Is a cost associated with the cost of system development and its
application. Project costs include documentation costs, meeting fees, system cost
analysis, managerial and personnel.
4. Ongoing Cost. Is the operating cost of the system for the system to operate properly.
Including maintenance cost system. Costs that include ongoing costs include personnel
costs, overhead costs (telephone, electricity, etc.), project maintenance, managerial
costs in system operations. These costs occur routinely over the operational life of the
system.
Some of the tangible benefits gained from the construction of Sukorejo - Batu passage are:
1. Reduction of Vehicle Operating Cost (BOK)
a. Fuel consumption. The cost of fuel consumption is determined by calculating the
fuel used (liter / 1.000 Km) multiplied by the price of each liter.
Y = 0,05693 S2
– 6,42593 S + 269,18567 ...... (2)
b. Oil / lubricant usage. The use of oil / lubricant oil for the type of passenger car
according to the following equation:
Y = 0,00037 S2
– 0,04070 S + 2,20403 ........... (3)
c. Use of tires. The use of tires for the type of passenger car according to the
following equation:
Y = 0,0008848 S - 0,004533 ................... (4)
d. Cost of vehicle maintenance. The cost of vehicle maintenance consists of the cost
of parts and mechanics, according to the following equation:
(1) Spare parts

The Fourth International Conference on Entrepreneurship | Book Three
218
Y = 0,0000064 S + 0,0005567 ..................... (5)
(2) Vehicle Depreciation Cost
Y = 1 / (2,50 S + 125 ) .................................... (6)
(3) Assurance
Y = 38 / (500 S)...................................... (2.8)
(4) Capital Interest
Y = 150 / 500 S ...................................... (2.9)
2. Reduced Fee Charges
The delay is the time lost by being influenced by an element that can not be controlled by
the rider either within the traffic flow itself or from other traffic flows (Pignataro, 2003).
3. Accidents
Technically traffic accidents are defined as incidental events caused by many
unintentional factors (random multy factor events).
RESEARCH METHODS
In this study there are several stages of the methodology that will be described as follows:
1. Data Collection
a. Field Research. In this field research, interviews and questionnaires were conducted
on the concept of the Sukorejo - Batu project implementation of the Year 2017
implementation.
b. Library Research. Done by looking for references in journals, books, and previous
research on project management, ratios and financial aspects.
Figure 2. Research Methodology

The Fourth International Conference on Entrepreneurship | Book Three
219
2. Data Analysis Method
f. Conducting quantitative and qualitative analysis of project feasibility using capital
budgeting and sensitivity analysis method
g. Perform cost of capital calculation
h. Analyze the project based on benefit cost ratio method
3. Benefit Cost Ratio Analysis
Benefit-Cost Ratio (B / C Ratio) is a comparison between present-value benefits with
present-value costs. The larger the B / C Ratio, the greater the comparison between
benefit and cost, which means the project is relatively more profitable. A project will be
selected if B / C Ratio> 1, if B / C Ratio <1 then the project proposal will be rejected.
4. Stage of Withdrawal Conclusion and Suggestion
Conclusions are drawn to the results obtained that are tailored to the objectives of this
study. Furthermore, they try to give suggestions on the application of research results as
well as efforts to avoid project failures.
Result and Discussion
Alternate Route
1. Route Alternate 1
This route is through Desa Karangsono (Kecamatan Sukorejo), Desa Sumbersuko – Desa
Pager – Desa Sekarmojo – Desa Tejowangi (Kecamatan Purwosari), Desa Capang – Desa
Gajahrejo – Desa Parerejo – Desa Sentul (Kecamatan Purwodadi, Kabupaten Pasuruan),
Desa Turirejo – Desa Wonorejo – Desa Ketindan – Kelurahan Kalirejo – Desa Bedali
(Kecamatan Lawang), Desa Toyomarto – Desa Gunungrejo – Desa Klampok – Desa
Langlang (Kecamatan Singosari), Desa Girimoyo - Desa Ngenep – Desa Bocek – Desa
Donowarih – Desa Tawangargo (Kecamatan Karangploso, Kabupaten Malang), Desa
Giripurno (Kecamatan Bumiaji, Kota Batu).
2. Route Alternate 2
This route is through Desa Karangsono (Kecamatan Sukorejo) - Desa Pager - Desa
Sekarmojo - Desa Tejowangi (Kecamatan Purwosari), Desa Capang - Desa Gajahrejo -
Desa Parerejo - Desa Sentul (Kecamatan Purwodadi, Kabupaten Pasuruan) - Desa Turirejo
- Desa Ketindan - Desa Bedali (Kecamatan Lawang), Desa Toyomarto - Desa Klampok -
Desa Langlang (Kecamatan Singosari), Desa Ngenep - Desa Bocek - Desa Tawangargo
(Kecamatan Karangploso, Kabupaten Malang) - Desa Giripurno (Kecamatan Bumiaji,
Kota Batu).
3. Route Alternate 2
This route is through Desa Karangsono (Kecamatan Sukorejo) - Desa Pager - Desa
Sekarmojo - Desa Tejowangi (Kecamatan Purwosari), Desa Capang - Desa Gajahrejo -
Desa Parerejo - Desa Sentul (Kecamatan Purwodadi, Kabupaten Pasuruan) - Desa Turirejo
- Desa Ketindan - Desa Bedali (Kecamatan Lawang), Desa Toyomarto - Desa Klampok -
Desa Langlang (Kecamatan Singosari), Desa Ngenep - Desa Bocek - Desa Tawangargo
(Kecamatan Karangploso, Kabupaten Malang) - Desa Giripurno dan Desa Pandanrejo
(Kecamatan Bumiaji, Kota Batu).

The Fourth International Conference on Entrepreneurship | Book Three
220
Table 1. Description Alternative Route 1 of Pass Road Sukorejo – Batu (Mono Heksa,
2017)
Tabel 2. Description Alternative Route 2 of Pass Road Sukorejo – Batu (Mono Heksa,
2017)

The Fourth International Conference on Entrepreneurship | Book Three
221
Tabel 3. Description Alternative Route 3 of Pass Road Sukorejo – Batu (Mono Heksa,
2017)
Cost of Road Works Tembus Sukorejo – Batu
Table 4 Costs of Land Acquisition, Construction and Maintenance of Pass Road Sukorejo
- Batu for 2 Line Alternating 1

The Fourth International Conference on Entrepreneurship | Book Three
222
Table 5 Costs of Land Acquisition, Construction and Maintenance of Pass Road Sukorejo
- Batu for 2 Line Alternating 2
Table 6. Costs of Land Acquisition, Construction and Maintenance of Pass Road Sukorejo
- Batu for 2 Line Alternating 3

The Fourth International Conference on Entrepreneurship | Book Three
223
Table 7. Costs of Land Acquisition, Construction and Maintenance of Pass Road Sukorejo
- Batu for 4 Line Alternating 1
Table 8. Costs of Land Acquisition, Construction and Maintenance of Pass Road Sukorejo
- Batu for 4 Line Alternating 2

The Fourth International Conference on Entrepreneurship | Book Three
224
Table 9. Costs of Land Acquisition, Construction and Maintenance of Pass Road Sukorejo
- Batu for 4 Line Alternating 3
Benefit of Pass Road Sukorejo – Batu Project
Table 10. Tangible Benefit of Pass Road Sukorejo – Batu Project

The Fourth International Conference on Entrepreneurship | Book Three
225
Table 11. Intangible Benefit of Pass Road Sukorejo – Batu Project
BCR Analysis
Table 12. Benefit Cost Ratio Calculate of Pass Road Sukorejo – Batu Project 2 Line
Alternating 1

The Fourth International Conference on Entrepreneurship | Book Three
226
Table 13. Benefit Cost Ratio Calculate of Pass Road Sukorejo – Batu Project 2 Line
Alternating 2
Table 14. Benefit Cost Ratio Calculate of Pass Road Sukorejo – Batu Project 2 Line
Alternating 3

The Fourth International Conference on Entrepreneurship | Book Three
227
Table 15. Benefit Cost Ratio Calculate of Pass Road Sukorejo – Batu Project 4 Line
Alternating 1
Table 16. Benefit Cost Ratio Calculate of Pass Road Sukorejo – Batu Project 4 Line
Alternating 2

The Fourth International Conference on Entrepreneurship | Book Three
228
Table 17. Benefit Cost Ratio Calculate of Pass Road Sukorejo – Batu Project 4 Line
Alternating 3
From the above calculation it can be seen that the value of all benefit cost ratios on 6
alternativef is with the average value of BCR is the largest for the construction project of
Sukorejo - Batu with 2 lanes alternative 3 which has an average of 6.97 where the value of ratio
1 is obtained After the useful life of the road is used for 15 years, which is also the fastest time
of benefit associated with the ratio of BCR to a value of more than 1. This means that the
construction of the Sukorejo - Batu passage with 2 alternative lanes 3 is feasible to choose on
These factors are beyond the geographic and demographic conditions.
Managerial Implication
This research can have an impact on decision making for managerial related to decision making
in Sukorejo - Batu road development with Benefit Cost Analysis Method. The highest
consideration of the BCR ratio allows the project to have maximum benefits in the future and
the most immediate beneficiary considerations after the project is completed.
CONCLUSION AND SUGGEST
CONCLUSION
1. Selection of Sukorejo road construction - This stone has three alternatives and the chosen
one is the third alternative because of consideration: no crossing with railway, shorter route
distance, shorter travel time and fewer bends or climbs. In addition, the cost required is less
than the two other projects amounting to Rp 1,296,050,611,000.
2. The total tangible benefits consisting of the benefits of operating vehicle operating expenses,
reduction of deferred costs and accident reduction amounted to Rp 7,743,313,602,563. While
intangible benefits consist of new business growth, APBD increase and human resource

The Fourth International Conference on Entrepreneurship | Book Three
229
performance improvement is Rp 537,705,253,946. So the total intangible manfat and
intangible benefits of Rp 8.281.018.856.509.
3. The Sukorejo - Batu Strip construction project with 2 alternative lanes 3 being the best
choice with the highest average BCR compared to other alternatives of 6.97 where the ratio
value 1 was obtained after the useful life of the road was used for 15 years, This is also the
fastest benefit time associated with the BCR ratio for values over 1.
SUGGESTION
2. This study only looks at cash flows on investments, while profit and loss posts are not
overly discussed. Investors should be more strict in seeing the profit and loss of this
project because it will determine dividends.
3. This research does not include risk analysis on Sukorejo - Batu road investment. Risk
analysis of this investment to see how big the effect of risk on investment decisions.
4. The Sukorejo – Batu Road Construction Project- This stone should be careful in
spending, the actual cost of the project should not exceed the RAB, and if there is an
urgent fee that requires the cash outflow beyond the post in the RAB, then it should be
adjusted to anticipate Cost over run, one example is the adjustment of design and
quality of Sukorejo - Batu passage.
LIMITATION
1. This research is still using cost benefit analysis for Sukorejo - Batu toll road project
development using 2 lane, in next research it is expected to do research with 4 lane.
2. This research does not analyze Payback Ratio and Break Event Point value nor value of
Internal Rate of Return (IRR), so in other research it is possible to enter the variable.
3. This study incorporates the intangible benefits of three aspects of new business growth,
an increase in APBD and an increase in HR performance so that in other studies it is
possible to examine other aspects beyond those aspects.
REFERENCES
Akrahu, H. D. 2012. Analysis Investing for Taking Decision Investing In Development Golf
course. Business Education Journal, 8 (1), 192-205
Bernadett, J. L. 2010. Principle of Project Feasibility. Eleven Edition. Massachusetts. Addison-
Wesley Publishing Company
Cheung E, Yongjian K. 2009. Drivers for Adopting Public Private Partnerships - Empirical
Comparison between China and Hong Kong Special Administrative Region. Journal of
Construction Engineering & Management, Vol. 135 Issue 11, p1115-1124
Guofeng, et.al. 2013. Feasibility analysis Investment Fishing Vessel Traditional 30 GT in
Thailand International Journal of Distributed Sensor Networks, volume 2013, Article ID
631714
Hensker, Y.T; Gurlek, M; Erkek, M. 2010. Economic and environmental analysis of thermal
insulation thickness in buildings. Journal of thermal science and technology. Turkey
Jakfar and Kasmir. 2008. A 'What every top manager should know about organizational set ups
and policies for successful project management' Proceedings of the lOth Internet World
Congress on Project Management
Nuryadi, Maulana. 2014. Cost Benefit Analysis Antara Pembelian Alat CT-SCAN Dengan Alat
Laser Dioda Photocoagulator Di RSD Balung Jember. Program Studi Manajemen.
Universitas Jember. Jember
Rodels, K.B. 2009. Prospect Theory : An Analysis of Decision under Risk. Journal of
Econometrica, Vol. 47 (2), pp. 263-292
Suratman, D.H. 2010. Studi Kelayakan Pembangunan Jalan Tersier di Wilayah Jalur Lintas
Selatan Pacitan. Proseding Seminar Nasional Universitas Diponegoro. April 2015. ISBN
983211

The Fourth International Conference on Entrepreneurship | Book Three
230
Trieputra, S dan Kamil, H. 2013. Benefit-Cost Ratio Analysis Dalam Pemilihan Teknologi
Pengolahan Limbah Cair Domestik (Studi Kasus IPAL Kali Krukut). Jurusan Teknik
Industri. Fakultas Teknologi Industri. Universitas Gadjah Mada. Yogyakarta

The Fourth International Conference on Entrepreneurship | Book Three
231
FAMILY BUSINESS VIEWED FROM COMPLEXITY FAMILY
AND BUSINESS AND HOW TO MANAGE TO ACHIEVE
SUSTAINABILITY
1Tina Melinda♠
Ciputra University Surabaya
INDONESIA
Emails: [email protected]
ABSTRACT
The myth that family firms can not survive through three generations, is
supported by many facts in different parts of the world, that the number of
companies that can last up to three generations is small. From the data
also mentions that family companies contribute greatly to the Gross
Domestic Product of a country. So very unfortunate if this family business
can not last long. The purpose of this study is to explain the family business
in terms of business complexity, family complexity and how to manage it in
companies that are still held directly by the founder / first generation.
Family business has its own uniqueness because it combines business,
family and ownership, resulting in various roles of the people involved
such as only family members or family members who act as employees and
family members who are also as shareholders. The different roles will
result in family complexity and business complexity. When it reaches third
generation family complexity occurs more complicated than if it occurs in
the first generation, because in the third generation then involved in the
business has been involved in the relationship cousins while in the first
generation involved only founder. Likewise the three companies become
larger then it will have a heavier complexity than at the beginning of the
stand. For that family company can still survive and sustainable it needs a
good way of managing, and for each character of the company as in the
newly established business is certainly different ways to manage it with a
long-standing company, but also companies that are still held directly by
Founder will be different way of managing it compared to companies that
have reached third generation. In the first generation of companies need to
pay attention to managing business by way of professional operation, pay
attention to succession and managed family complexity.
Key words: Family Business, Business Complexity, Family Complexity
INTRODUCTION
The contribution of a family company to a country's economic growth is undoubtedly because it
contributes 50% of GDP in the United States (Shanker and Astrachan 1996), while in Indonesia
90% of the existing firms are households contributing 80% of GDP of the country (World Bank,
2017). According to Groysberg (2014), family business that can survive one generation is only
70%, so it can be said that this family company is difficult to sustain. Ward's argument, 1987,

The Fourth International Conference on Entrepreneurship | Book Three
232
states that the critical condition is due to the transition of leadership from the first generation to
the next generation that did not go well.
The difference between family business and non family business is that of family business there
is family involvement in it (Collins and O'Regan (2011). It is also supported by Chua (2003), so
there is a difference of interests between family demand and business demand (Carlock, 2001).
While Tagiuri and Davis (1982) stated that the family business has a three-circle model that
explains that there is overlapping between family, ownership and business that will affect the
condition of family business.
Based on its characteristics family business can be categorized into five models (Gimeno,
2010), starting from the newly-called Captain model to the Corporate model where the family
business is big with the characteristic that is involved in managing not only the nuclear family
but also involving Professionals in the company's operations.
In this study aims to describe Family Business in terms of complexity family and complexity
business and how to manage Family Business in the first generation company.
Issue Family Business
The three-circle model of Tagiuri and Davis (1982) in Figure 1 states that the family business
model has three circles consisting of family, ownership and business, resulting in overlapping of
the three parts that will affect the condition of the family business.
Figure. 1 Three Cycle Model (Tagiuri and Davis (1982)
This overlapping condition has many consequences, meaning that the role of a person can be
distinguished into seven different conditions causing complicated governance (Mustakallio et
al., 2002), meaning someone who acts only as a family member or family member who also
doubles as an employee or Family member who doubles as employee and also owner.
Differences from internal stakeholders involving these intergenerational differences result in a
family of complesity (Gersick, 1997). The complexity of family business (Gemino, 2010) is
distinguished by three dimensions or axes, ie business axis, family axis and owner axis, each of
which axis has different phases and will determine family complexity and business complexity.
Family Complexity
Family axis phase (Gemino, 2010) categorizes business into 4 categories: young business
family, entering the business, working together and passing the baton, whereas according to
(Churchill and Hatten, 1987) differentiate into owned-managed business, Founders, then at the
stage of training and development of the generation means starting to involve the second
generation into the business, in the partnership between the generation has involved wider
cousins and families, and the transfer of power stage means that the founder must start ready to
let go of leadership and divert on next generation. Every family business also has different life
cycles and each stage has different challenges. Companies that are still categorized as small
medium enterprises will have different challenges than those that have reached the corporate
scale (Cowling et al., 2015, Churchill and Lewis, 1983). This family axis phase discusses more

The Fourth International Conference on Entrepreneurship | Book Three
233
details about the life cycle of the family. Family Axis Phase differentiates the difficulty level of
young business family, entering the business, working together and passing the baton. The
stages in the young family are not too complicated because every decision to be taken does not
involve many parties because it involves only the founders alone compared to the conditions at
the time of passing the baton, which must involve between the first generation and the second
generation. This is related to family business life cycle.
This family axis phase will be associated with the Ownership Axis phase, as discussed tends to
family relations. Ownership Axis phase (Gemino, 2010) is divided into 3 conditions: controlling
owner, sibling partnership and cousin consortium. The condition of cousin consortium is more
difficult than when the company is only controlled by the owner, because with many people
involved it requires such good communication and interpersonal skills to maintain harmony of
the family and also the existence of different family backgrounds. Your relationship will be
related and affect the emotional, social and cognitive development of a brother (Dunn, 2002;
Karos et al., 2007; Pike et al., 2005), this is because the bond of brotherhood is a long-term
relationship. This brotherly relationship will also have an impact on social aspects such as
involving cooperation and conflict (Edwards et al., 2005, Punch, 2008)
Business Complexity
By using indicators such as business size, company location, diversification and business sector,
the business complexity of Axis phase is divided into 3 points; Start up, expansion-
formalization, and Maturity. Conditions at a company start up certainly has a different
complexity compared to companies that are doing expansion and mature.
The results of the study from Chua et al. (2012), suggests that large or small companies will also
cause variations in differences from family involvement such as social status and family
harmony. It is also triggered by business ownership that will affect corporate goals (Chrisman et
al., 2012; Jones et al., 2008). Small companies are usually easier to allocate resources than
larger companies (Chrisman et al., 2003; Kotlar, 2012).
Family business model
According to Gimeno (2010) based on complexity level and development structure, a family
company can be classified into 5 models: Captain Model, Model Emperor, Family Team Model,
Professional Family Model and Corporation Family Model
From the results of his research illustrates that Family business can be categorized into five
types based on family complexity, business complexity and structure development. For the
captain model is a family business that has the lowest level of complexity, business complexity
and development structure compared to other models, while the Corporation Model has the
highest complexity and development structure. This is explained because each model has
different characters. Table 1 shows the different characteristics of each model.
Table 1. Characteristic of Family Models
Family Business Model Characteristic
Captain Model SME managed by founder
Emperor Model Business and Families managed by leader
Family Team Model Extended family working in business
Professional Family Model Complex family governing a complex business
Corporation Model Family with varying complexities investing
together
Source: Gimeno (2010)

The Fourth International Conference on Entrepreneurship | Book Three
234
Management Family Business in the Captain Model
A company must be managed professionally as well as it should happen to the family business
that is in Captain Model, at this stage the company is still categorized in small medium
enterprise because usually new company stands and still under the leadership of the direct
founder so that when viewed from the family complexity can be said Is not there because only
the first generation that operates the company and he is also directly responsible for the
decisions taken. Family business with captain model also has a business complexity that is still
low because of the size of the business is still relatively small and usually also do not have many
branches or business lines, so it can be said that the level of business complexity is still low
compared with the already large companies. In the business family with the captain model
category, it is appropriate to the characteristics that are still managed directly by the founder
with a relatively small business scale, it is necessary to do some things (Gimeno, 2010), namely
(1) the company must be managed professionally, (2) Managing the succession process and (3)
managing well the family complexity
Professionalization of operation
Companies must be well managed to produce good performance, so also applies to family
business. In order for family business to survive and sustainably it is necessary to manage its
human resources well. This is related because family companies usually work is from family
members, it is necessary to note the competence, for family members who do not have the
knowledge, skill and attitude according to the required demands, it can be increased competence
by providing training (Gersick, et al., 1997).
In addition, the owners of the family company also need to establish the mission of the company
that should be described in the corporate strategy and planning as the mission is the foundation
for future plans (Harris et al., 1994). Based on the mission can be made a strategy in accordance
with the expectations of the owner, so the determination of the mission is the foundation for the
company (Leon-Guererro, 1998)
Succession Management
In the family enterprise, the critical condition that needs attention according to (Brockhaus,
2004) is on the succession process, supported by research from Beckhard and Dyer, 1983;
Which states that only 30% of family companies are successful in continuing to the second
generation. According to Sharma et al., 2001, succession is the process of shifting leadership
positions from one generation to the next. In this relay process it is necessary to have a good
plan for this succession process can run well.
Some factors that may hamper this process of succession are from the founders, such as
concerns about death, fear of loss of power, while the family is fear of loss of identity and
rivalry among brothers (Susanto, 2007), while opinions (Solomon et al., 2011 ) States that from
the incumbent there are four things to note are the conditions of marriage, the condition of the
child, the vision for pension and the position of the lifecycle of the individual. The obstacles of
this succession process are also triggered by concerns about the condition of future family
enterprises, as described by Sharma (2004) in Figure 1, that family business has conditions from
family dimensions and business dimensions, so that four parts are created, of course a founder
will want That the company will be in quadrant 1, namely the condition of high emotional and
high financial capital, because this is a condition where there is a harmonious family and the
company goes well.

The Fourth International Conference on Entrepreneurship | Book Three
235
Family Dimension
Positive Negative
Business
Dimension
Positive
I
Warm Hearts
Deep Pockets
High Emotional and
Financial Capital
II
Pain Hearts
Deep Pockets
High Financial and low
Emotional Capital
Negative
III
Warm Hearts
Empty Pockets
High Emotional but low
Financial Capital
IV
Pain Hearts
Empty Pockets
Low Financial and
Emotional Capital
Figure 1. Performance of Family firms (Sharma, 2004)
Preventing growth of Family complexity
The results of the study (Holland and Boulton, 1984), suggest that the relationship between
management and family will enhance the complexity of the organization. At the time the
company is still new and still small category then the business complexity is also still low level
compared with the company that has been big and long standing. For that in the family business
companies are still Captain Model category then the level komplesitasnya not as complicated
when it is at the position of the corporation model. In addition to the Captain model because the
company is still run by the founder then the level of family komplesitasnya also still low
compared to when it entered the third generation that involves not only the nuclear family but
already involving cousins in the management
CONCLUSION
Family business is a company that many established but few can survive beyond third
generation, it is because family business that have uniqueness because combine system family,
system business and system ownership. These three things will affect the family complexity and
business complexity. The newly established business and still managed by the direct founder
certainly has a lower family complexity than the business managed by the third genre. While the
new company / captain model certainly has a lower business complexity than the company that
has been long standing and growing like a corporation model.
To manage the business that is still managed directly by the founder, it requires more
professional management, because usually this business depends on the figure of the direct
owner. Another thing to note in order for the company to be sustainable is the process of
succession, because it involves the first generation and the second generation, the founder's
factor that can be a constraint such as worrying about death or fear of losing power, while from
the successor there are some things that It should be noted that the loss of identity or the
occurrence of rivalries between siblings. While the latter is to try to avoid family complesity by
managing the time well, because the main source of the Captain model is the founder,
everything is centered on the founder, so the founder must be aware that the future of the
company will move on to the next generation whose number of people involved more Many and
successors must be able to have the ability to deal with it.

The Fourth International Conference on Entrepreneurship | Book Three
236
REFERENCES
Beckhard, R. and Dyer, G. Jr (1983), “Managing continuity in the family-owned
business”,Organizational Dynamics, Vol. 12 No. 1, pp. 5-12.
Brockhaus, R.H. (2004), “Family business succession: suggestions for future research”,Family
Business Review, Vol. 17 No. 2, pp. 165-177.
Carlock, Randel S. and John L. Ward, (2001), Strategic Planning for the Family Business,
PALGRAVE Houndmills, Basingstoke, Hampshire, New York
Chrisman, J.J., Chua, J.H. and Zahra, S.A. (2003), “Creating wealth in family firms through
managing resources: comments and extensions”, Entrepreneurship Theory and Practice,
Vol. 27 No. 4, pp. 359-365.
Chrisman, J.J., Chua, J.H., Pearson, A.W. and Barnett, T. (2012), “Family involvement, family
influence, and family-centered non-economic goals in small firms”, Entrepreneurship
Theory and Practice, Vol. 36 No. 2, pp. 267-293.
Chua, J.H., Chrisman, J.J., Steier, L.P. and Rau, S.B. (2012), “Sources of heterogeneity in
family firms: an introduction”, Entrepreneurship Theory and Practice, Vol. 36 No. 6, pp.
1103-1113.
Chua, J.H., Chrisman, J.J. and Sharma, P. (2003a), “Succession and nonsuccession concerns of
family firms and agency relationship with nonfamily managers”, Family Business
Review, Vol. 16 No. 2, pp. 89-107.
Chua, J.H., Chrisman, J.J. and Steier, L.P. (2003b), “Extending the theoretical horizons of
family business research”, Entrepreneurship Theory and Practice, Vol. 27 No. 4, pp.
331-338.
Churchill, N.C. and Lewis, V.L. (1983), “The five stages of small business growth”, Harvard
Business Review, Vol. 61 No. 3, pp. 30-51.
Churchill, N.C. and Hatten, K.J, (1987), Non-Market-based transfer of wealth and power: a
research framework for family Business, American Journal of Small Business, winter
51-64.
Collins, L. and O’Regan, N. (2011), “Editorial: the evolving field of family business”, Journal
of Family Business Management, Vol. 1 No. 1, pp 5-13.
Cowling, M. (2006), “Early stage survival and growth”, in Parker, S. (Ed.), The Life Cycle of
Entrepreneurial Ventures, Springer, New York, NY, pp. 479-506.
Dunn, J. (2002), “Sibling relationships”, in Smith, P. and Hart, C. (Eds), Blackwell Handbook of
Childhood and Social Development, Blackwell, Oxford, pp. 223-237.
Edwards, R., Hadfield, L. and Mauthner, M. (2005), Children’s Understanding of Their Sibling
Relationships, National Children’s Bureau, London.
Gersick, K.E., Davis, J.A., Hampton, M.M. and Lansberg, I. (1997), Generation to Generation:
Life Cycles of the Family Business, Harvard Business School Press, Boston, MA.
Groysberg B., and Bell D.,(2014) Generation to Generation: How to save the Family Business;
Harvard Business Review
Harris,Dm Martinez, J.I. and Ward,J.l (1994) “Is Strategy different for rhe Family-owned
business?’, Family Business Review, Vol 7 No 2, pp 159-74
Holland,P.G. and Boulton, W.R. (1984) “Balancing The Family and the Business in Family
Business, Business Horizons, Vol 27, pp16-21
Jones, C.D., Makri, M. and Gomez-Mejia, L.R. (2008), “Affiliate directors and perceived risk
bearing in publicly traded, family-controlled firms: the case of diversification”,
Entrepreneurship Theory and Practice, Vol. 32 No. 6, pp. 1007-1026.
Karos, L.K., Howe, N. and Aquan-Assee, J. (2007), “Reciprocal and complementary sibling
interactions, relationship quality and socio-emotional problem solving”, Infant and
Child Development, Vol. 16 No. 6, pp. 577-596.

The Fourth International Conference on Entrepreneurship | Book Three
237
Kotlar, J. (2012), “State of the art of family business research”, in De Massis, A., Sharma, P.,
Chua, J.H. and Chrisman, J.J. (Eds), Family Business Studies: An Annotated
Bibliography, Edward Elgar, Cheltenham, pp. 10-46.
Leach, Peter. 2007. Family Business The Essential. Great Britain : Profile Books Ltd.
Leon-Guerrero, A.Y., McCann, J.E.III and Haley J.D. Jr (1998), “The Study of Practice
Utilization in Family Business” Family Business Review, Vol. 11 no 2 pp107-20
Pike, A., Coldwell, J. and Dunn, J.F. (2005), “Sibling relationships in early/middle childhood:
links with individual adjustment”, Journal of Family Psychology, Vol. 19 No. 4, pp.
523-532.
Punch, S. (2005), “The generationing of power: a comparison of child-parent and sibling
relations”, Sociological Studies of Children and Youth, Vol. 10 No. 1, pp. 169-188.
Sharma, P., Chrisman, J.J., Pablo, A.L. and Chua, J.H. (2001), “Determinants of initial
satisfaction with the succession process in family firms: a conceptual model”,
Entrepreneurship Theory and Practice, Vol. 25 No. 3, pp. 17-35.
Sharma, P., (2004), “An Overview of The Field of Family Business Studies Current Studies and
Directions for The Future”, Family Business Review, Vol. 17 No. 1, pp. 1-36.
Shanker, M.C., and Astrachan, J,H (1996), Myths and Realities; Family Business Contribution
to the US Economy; a Framework for assessing Family Business Statistic, Family
Business Review 9(2):107-23
Solomon, A., Breunlin, D., Panattoni, K., Gustafson, M., Ransburg, D., Ryan, C., Hammerman,
T.and Terrien, J. (2011), “ ‘Don’t Lock Me Out’: life‐story interviews of family
business owners facing succession”, Family Process, Vol. 50 No. 2, pp. 149-166.
Susanto,A.B., Himawan Wijanarko., Patricia susanto., Suwahjuhadi Mertosono., 2007, Family
Business, The Jakarta Consulting Group.
Ward, J.L. (1987), Keeping the Family Business Healthy: How to Plan for Continuing Growth,
Profitability, and Family Leadership, Jossey-Bass, San Francisco, CA.

The Fourth International Conference on Entrepreneurship | Book Three
238
PROFIT PLANNING MODEL USING THE COST-VOLUME-
PROFIT ANALYSIS APPROACH
(CASE STUDY IN CV TRANSTREK INDONESIA BATU MALANG)
1Soffia Pudji Estiasih, 2Endang Prihatiningsih, 3Handri Kartiono
1-2Universitas WR. Supratman Surabaya
3Akademi Pariwisata dan Perhotelan Ganesha Malang
INDONESIA
E-mail: [email protected]
ABSTRACT
CV. Transtrek Indonesia is a company engaged in human resources
development services especially Outwardboud Training. The company
realizes that there are potential markets for outwardboud activities which
can be targeted for business opportunity. This study aimed to help the
company management to design the sales and profit targets using cost-
volume-profit analysis for profit planning model.
This study is a qualitative study using case study and the data was collected
using direct observation, interview and document, especially referring to
Cost-Volume-Profit Analysis of the 2015. The results indicated that in order
to determine profit planning, company was able to perform Cost-Volume-
Profit analysis by simulating the sales level related to the price changes,
sales volumes, variable cost, as well as fixed cost to obtain target profit.
Keywords: Profit Planning Model, Cost-Volume-Profit Analysis Approach
INTRODUCTION
Nowadays the activities in the service sector in Human Resource Development, especially in
Outwardboud Training showed a lot of improvement. Outwardboud Traning is actually a series
of activities that can be useful to form individual characters through the training for the
corporate employees and other enthusiasts. Outwardboud becomes one of the interesting
products seriously considered in the service business. Each business certainly has own
advantages in triggering the competition. Competition and price are the factors of competitions.
With the variation of price offered, the companies pay less attention to the optimal profit. The
company concerned only the income without considering to expenditures, due to the poor plan.
Planning is one important factor in carrying out all the activities of the company. Hence,
company planning will be able to facilitate management tasks to achieve goals to determine the
profit. Obtaining optimal profit, management should be able to make various efforts, including:
determining sales price, increasing sales volume and efficiencing costs. These steps cannot be
separately taken because of the close relationship of costs, sales volume and sales price. The
sales price possibly affects the sales volume, where it will affect the production volume (cost)
which is resulted in the profit.
According to Verawati (2004) CVP analysis indicated the profitable or unprofitable sales extent
as well as became an important part in profit planning, as it is used to assist managers in
designing profit planning calculations and sales budgets accurately. Patni (2015) argued that
CVP analysis was an analysis of cost evolution models pointing out the relation of cost,

The Fourth International Conference on Entrepreneurship | Book Three
239
production volume and profit as well as a foresight of managerial control. The method includes
a set of problem solving based on understanding the characteristics of the company costs
evolution models.
CVP analysis has several advantages, as providing a variety of useful information to analyze the
factors affecting the expected profit planning (Hartanto, 2004). Profit planning is a target profit
considered to the expected sales and costs the following year in the long periods (Pelawiten,
2014). Kirlioglu and Baral (2012) stated that proper profit planning, correctly decided, depends
on realistic costs. Koraag and Ilat (2016) argued that CVP analysis helps to understand the
mutual relation of cost, sales volume, and profit. By conducting CVP analysis, management
possibly obtain the minimum level of sales information in order to avoid the loss.
CV. Transtrek Indonesia is a company engaged in human resources development services
especially in Outwardboud Training, the company viwed the big potential market for
outwardboud activities. Outwardboud Training organized by CV. Transtek Indonesia is divided
into various programs, namely: Outwardboud Team Building, Outwardboud & Rafting,
Outwardboud Team Building + Rafting and OB Team Building Program + Rafting + War Game
and Tailor made Program.
In order to obtain target profit, the company is focused on the results and not considered to the
operational loads which are impacted on the profit obtained, so management had difficulty in
formulating policies related to sales and profit planning. The problem of the study was whether
the conventional approach using cost-volume-profit analysis was an appropriate model for profit
planning. The study aimed to help the company's management to design the level of sales and
target profit using cost-volume-profit analysis model.
LITERATURE REVIEW
Profit Planning
Profit planning is the foresight to decide the action that should be done in order to achieve
certain goals (Hansen & Mowen, 2005). According to William and Usry (2006) profit planning
was accurate calculated work plan where the financial implications were expressed in form of
projected income, balance, cash and work for the long and short terms. This aspect is related to
the plan in sales of various loads thoroughly and the plan will be developed in detail and
integrated into a comprehensive entity.
A profit planning is possibly to be obtained when the management successfully runs the
company as measured by the total profit. Therefore, the profit planning is a management plan
covering all operation phases in the future to achieve company goals divided into short and long
term plans. Profit planning is useful as a guideline in running the company's operational
activities, although the preparation is difficult because of influence of the factors out of
management control which is difficult to predict, including the changes of consumer behavior,
information technology, social behavior, competitor strength, demography and politics.
According to Carter & Usry (2009), profit planning is useful for (1) providing disciplined
approach to identify and resolve problems, (2) providing direction at all levels of management,
(3) improving coordination, (4) acquiring ideas and cooperation of all levels of management,
and (5) evaluating actual performance as well as improving capabilities of each individual
related to efficient work planning.
Target Profit Procedure
According to Tunggal (2014), there are three target profit procedures applied in company
management:
a. A priori
b. A posteriori
c. Prematic

The Fourth International Conference on Entrepreneurship | Book Three
240
Cost-Volume-Profit Analysis
The cost-volume-profit analysis (CVP) analysis is a useful to design the profit planning and
decision making, since it emphasizes the cost linking, quantity sold, and price (Hansen &
Mowen, 2005). The CVP analysis is a common instrument used to provide information for
management to decide the policy, for examples setting the sales prices, selecting mixed sales,
and analyzing changes of variable cost and fixed cost to company's profitability Simamora,
2002).
Sipayung (2008) argued that cost-volume-profit analysis is a very useful to help management
carrying out its functions, as well as to help understanding the relationship among cost, volume,
and profit organization by focusing the relationship of 5 elements of product price, sales volume
or activity level, variable costs, total fixed costs, and product mixed sales. In decision-making
related to profit planning using cost-volume-profit analysis, the cost is classified according to
the behavior of fixed costs, variable costs and semi-variable costs. In order to make acurate
decision-making, the semi-variable cost should be separated into fixed costs and variable costs
(Satriani et al., 2015).
CVP Analysis Concept
Several concepts in cost-volume-profit (CVP) analysis related to profit planning are described
as:
a. Contribution Margin
Contribution margin is the balance of sales substracted variable cost which is used to
cover all fixed costs and becomes the profit (Garrisson et al., 2008).
Contribution margin (IDR) = Sales – Variable costs
b. Breakeven Point
Breakeven point is sales level where the profit is zero (Garrisson et al., 2008),
formulated as:
c. Target Profit Analysis
Target profit analysis is used to determine the amount of minimum sales that should be
obtained to determine the targeted profit, formulated as:
Sales (unit) = (fixed cost + Target profit)/Contribution Margin per unit, or;
Sales (IDR) = (fixed cost + Target profit)/Contribution Margin Ratio (Garrisson et al.,
2008).
d. Margin of Safety
Margin of safety is difference between sales planning and breakeven, formulated as:
Margin of safety = sales – breakeven point (Simamora, 2002)
e. Leverage Operation
According to Samryn (2012) leverage operation is used to understanding how the profit
changes, if there is sales increase or sales decrease, formulated as:

The Fourth International Conference on Entrepreneurship | Book Three
241
CVP Asumption
Assumptions in CVP analysis according to Hansen & Mowen (2005) are:
a. The analysis assumes the function of linear incomes and costs.
b. The analysis assumes that price, total fixed costs, and variable costs per unit are
identified accurately and constantly along with the range of relevant.
c. The analysis assumes that what is produced can be sold.
d. In multi-product analysis, the mixed sales presumably known.
e. Sales price and costare are presumably determined.
Whether the assumptions which underlie the CVP analysis according to Simamora (2002) are:
are sorted into variable and fixed variable elements. The function of the total costs is
linear in the relevant range of normal business activities.
the income is linear in the relevant range; sales price per unit is
considered constant in the range of production volume. The income changed is linear
to the change in product unit sales; and the average sales price per product unit is
constant.
duct anaysis or the various product mixed sales analysis is constant in the
relevant range. If the product has different sales prices and costs, the changes in
mixed sales will affect the results of cost-volume-profit analysis.
ver: product unit volume or sales (IDR).
the period are same, It implies that the unit numbers produced during the period are
equal to the units sold.
CVP Main Element
According to Samryn (2012), the main elements in cost-volume-profit are:
a. Product sale price
b. Sales volume or activity level
c. Variable costs per unit
d. Total fixed costs
e. Composition and product combination are sold
Relation between Profit Planning and CVP Analysis
Cost-volume-profit (CVP) analysis is managerial planning equipment which provides
information to the manager relating to operational level, costs, income level through breakeven
point of profit planning. These challenges require management to maximize one of its roles,
namely sales planning and profit planning (Two et al, 2015). Practically, the challenge faced by
most corporate managers is how to assess and to control the key variables in order to determine
the company performance from profit planning. The study conducted by Kipesha (2016)
showed that the company initially experienced some failures, but it was able to improve the
performance related to sales volume, cost control and profit planning using cost-volume-profit
model. Challenges often faced by small firms are managers unable to judge and control the
company and lack of financial statement knowledge needed to perform cost-volume-profit
analysis. A manager should be able to assess and control the key variables of company
performance. According to Carter & Usry (2009) preparing a profit plan related to the use of
cost-volume-profit model, management should be able to understand and to combine all factors

The Fourth International Conference on Entrepreneurship | Book Three
242
affecting the profit level. One of the concepts used to arrange the profit planning is Cost-
volume-profit analysis.
Thinking Framework
Figure 1.Thinking Framework
RESEARCH METHODS
This study was qualitative study using case study approach which was study using problem
characteristics with the current situation and the environment interaction as the background
(Indriantoro dan Supomo, 2013). The subject of the study was CV. Transtrek Indonesia, Batu
Malang. Data collection technique was literary study using observation, interviews, and
documents which were related to the cost-volume-profit analysis in 2015.
RESULT AND DISCUSSION
Volume and Total Sales
The volume dan total sales of CV. Transtrek Indonesia in 2015 for Outwardboud Team Building
+ Rafting+WarGame activites were seen in table 1
Table 1. Total Sales
No Outwardboud Activities Volume Selling Price
(IDR)
Total Sales
(IDR)
1 O.TeamBuilding+Rafting+War Game 32 990,000.00/team 31,680,000.00
2 O.Team Building + Rafting 100 950,000.00/team 95,000,000.00
3 O.Team Building + Rafting 125 900,000.00/team 112,500,000.00
4 O.Team Building + Rafting 24 850,000.00/team 20,400,000.00
5 O.Team Building + Rafting 40 400,000.00/orang 16,000,000.00
6 Rafting 96 200,000.00/orang 19,200,000.00
Total 294,780,000.00
Cost Classification
Cost classification is performed based on cost behaviors which are fixed cost and variable cost.
The cost classification data was seen in table 2.
Conventional approach using Cost-
Volume-Profit Analysis
Methods:
Contribution Margin
Breakeven point analysis
Margin of Safety
Target profit analysis
Profit planning

The Fourth International Conference on Entrepreneurship | Book Three
243
Table 2. Cost Classification
Accounts Variable Cost
(IDR)
Fixed Cost
(IDR)
Note
1. Electricity, water, and
telephone cost
6.035.300 420.000 Fixed Expenses
2. Salary 47.150.000
3. Administration and others 14.285.700
4. Transportion 1.070.000 Tol and parking of
OTBR
5. Rent Car 12.000.000
6. Depreciation of fixed assets 4.000.000 Equipment
Depreciation
7. Fuels 8.585.000 OTBR activities
8. Human Resource Development 15.000.000 Hiring Experts
9. Marketing Cost 7.250.000 Advertisement,
Brochures
10. Training Equipment 39.325.000 Indoor & outdoor
equipment
11. Trainer Fees 30.100.000 Trainers and instructors
12. Freelance Marketer 12.950.000 Salesmen fees
13. Task Force Fee 24.300.000 Fasilitator
14. Training Administration Fee 40.870.000 Hotel and meal for
trainees
15. Other expenses 1.961.000
Total 172.446.300 92.855.700
Contribution Margin
Contribution Margin is the balance of sales substracted variable cost which is used to cover all
fixed costs and becomes the profit (Garrisson et al., 2008).
Contribution margin (IDR) = Sales – Variable cost
Table 3. Contribution Margin
Note Total
(IDR)
Percentage
(%)
Selling 294,478,000.00 100
Variable Cost (172,446,300.00) (58.5)
Contribution Margin 122,333,700.00 41.5
Fixed cost (92,855,700.00)
Net profit 29,478,000.00
After calculating the contribution margin, the income statement was prepared using contribution
margin form as seen in table 3. It showed 41.5% meaning the company was able to cover all
fixed costs. The bigger the contribution margin is, the more possibilities company covers the
fixed cost to obtain profit.
Breakeven Point Analysis
Breakeven point is the sales where the profit is zero (Garrisson et al., 2008) formulated as:

The Fourth International Conference on Entrepreneurship | Book Three
244
223,748,675.00
It means that the breakeven sales were 223,748,675.00, so CV.Transtrek Indonesia was able to
cover all fixed and variable loads which made the company’s sales limit was categorized as
even (no profit, yet no loss, obtain the breakeven point).
Margin of Safety
Margin of safety is the difference between sales planning and breakeven sales determined using
the formula as:
Margin of safety = sales planning – break event sales (Simamora, 2002)
Margin of Safety = 294,780,000.00 – 223,748,675.00 = 71,031,325.00 IDR
Meaning that CV.Transtrek Indonesia should be able to maintain the sales in order to keep it
above 24.09% margin of Safety ratio, so the company obtained the breakeven point.
Target Profit Analysis
Target profit was used to determine the targeted minimum sales in obtain the profit using the
formula:
Sales (unit) = (Fixed cost + Target profit)/Contribution Margin per unit, or:
Sales (IDR) = (Fixed cost + Target profit)/Contribution Margin Ratio (Garrisson et al.,
2008).
Based on cost classification, contribution margin, breakeven point analysis, and margin ratio,
the target profit analysis can be alternatively determined from:
a. If CV. Transtrek Indonesia expected to increase the target profit as 15% from sales
assumed that fixed cost, variable cost, and sales were not changed, so the targeted
minimum sales obtained was:
Sales = 330,295,662.65 IDR
b. If the fixed cost increased as 5% assumed that the variable cost, target profit, sales
volume, and sales price were not changed, so the targeted minimum sales obtained
was:

The Fourth International Conference on Entrepreneurship | Book Three
245
Sales = 305,967,433.73 IDR
c. If the sales volume increased as 5%, target profit increased as 11.68% from starting
sales and variable cost increased as 5%, with the assumption the fixed cost and sales
price were not changed, so the minimum targeted sales obtained was:
Sales = 308,385,174.42 IDR
From the various assumptions and simulations related to profit planning, company management
is able to select the best alternative action to obtain the biggest profit. Cost-Volume-Profit
Analysis is not only able to figure the profit planning considering the changes of factors
affecting target profit but it is also used as reference in sales planning at targeted profit.
CONCLUSION A ND SUGGESTION
In conclusion, the management of CV. Transtrek Indonesia did not have budget and did not
clasify the costs based on cost behavior. The result of contribution margin showed 41.5%
meaning the company was able to cover fixed costs in order to obtain the profit. Breakeven
Point Analysis showed the sales of 223,748,675.00 IDR meaning the management was able to
cover all fixed and variable loads, so the sale limits can be said as no profit, yet no loss
(breakeven point). The result of security margin showed 24.09% meaning the management in
making sales should not lower 24.09% from the budgeted sales in order the company to obtain
the breakeven point. According to results of target profit analysis, the company was able to
determine the minimum level of sales achieved related to the changes of target profit as 15% of
sales price, 5% of fixed cost, and 5% of sales volume, as well as 5% of variable cost 5%.
Based on the conclusion, the study suggests that the management of CV. Transtrek Indonesia
should classify the costs according to the cost behavior in order to apply cost-volume-profit
analysis as the basis of sales and profit planning using contribution margin, breakeven analysis,
security margin, and target profit analysis.
REFERENCES
Carter, W.K. and Milton F. Usry. 2009. Cost Accounting, 14th edition. Soutth-Western Cengage
Learning
Dua, M. D, Sri Mangesti Rahayu and Zahroh ZA, 2015, Penerapan Cost-Volume-Profit
Analysis Sebagai Dasar Perencanaan Penjualan pada Tingkat Laba Yang Diharapkan,
Jurnal Administrasi Bisnis (JAB) Vol.27 No.1, Oktober 2015
Garrisson, R.H., E., W. Noreen and P.C.Brewer. 2008. Managerial Accounting, McGraw-Hill
Irwin.
Hartanto, Albert. 2004. Analisis Biaya-Volume-Laba sebagai Alat Perencanaan Laba,
Universitas Katholik, Semarang.
Hansen D.R. and M.M. Mowen. 2005. Management Accounting, 7 th edition, South-Western
Cengagen Learning
Indriantoro, Nur and Bambang Supomo. 2013. Metodologi Penelitian Bisnis: Untuk Akuntansi
dan Manajemen, Yogyakarta, BPFE.

The Fourth International Conference on Entrepreneurship | Book Three
246
Koraag, Jeriko Falentino and Ventje Ilat. 2016. Analisis Cost-Volume-Profit untuk Perencanaan
Laba. Jurnal Berkala Ilmiah Efisiensi, Volume 16, No.03 tahun 2016, Manado.
Kirlioglu Hilmi, and Gokhan Baral. 2012. In the Uncertainty Conditions Cost-Volume-Profit
Analysis which is Used Fuzzy Logic. 3rd Ed. International Symposium on Sustainable
Development Sarajevo, pg 156-166.
Kipesha , Erasmus, Fabian. 2016. Fincare LTD: Cost, Volume and Profit Analysis, Case Studies
Journal ISSN (2305-509X) – Volume 5, Issue 4–April-2016,
www.casestudiesjournal.com. Accessed on 17 March 2017
Pelawiten, Atika. 2014. Analisis Cost-Volume-Profit untuk Perencanaan Laba pada UD Gladys
Bakery. Jurnal EMBA ISSN 2303-1174 Vol.2 No.2, Manado.
Patni, Ms. Indu. 2015. Use of The Cost/Volume/Profit Analysis in Term of Earning, IJTEMT,
EISSN: 2321-5518; Vol.IV, Issue III, June 2015, www.ijtemj.org. Accessed on 27
December 2016.
Sipayung, M. Friska. 2008. Analisis Cost-Volume-Profit Sebagai Alat Perencanaan Laba Pada
PT. Ecogreen Oleochemicals, Medan, Universitas Sumatera Utara, Medan.
Satriani Saparida, Marheni and Lona Miranda. 2015. Jurnal Ilmiah Akuntansi Bisnis &
Keuangan (JIABK), Volume 3, Issue 2, November 2015, Pangkal Pinang
Simamora, Henry. 2002. Akuntansi Manajemen, Jakarta, Penerbit Salemba Empat.
Samryn L.M. 2012. Akuntansi Manajemen, Edisi Revisi, Jakarta, Penerbit Kencana
Prenadamedia Group.
Tunggal, Amin Widjaya. 2014. Akuntansi Biaya, Edisi Revisi, Jakarta, Harvarindo.
Verawati, Eti. 2004. Penerapan Metode Cost-Volume-Profit sebagai Alat Bantu Analisis
Perencanaan Laba pada UKM Visito Brownis, Universitas Dian Nuswantoro, Semarang.

The Fourth International Conference on Entrepreneurship | Book Three
247
INFORMATION TECHNOLOGY TO DEVELOP AND
IMPROVING SALES PRODUCT ON MIDDLE LOW BUSINESS
AT SERUNI SIDOARJO
1Suparjo, 2Gatot Setyono
Institut Teknologi Adhi Tama Surabaya
INDONESIA
Emails: [email protected]
ABSTRACT
Information technology is an important part in social life.Society can feel
benefits of information directly to ackonowledge world development,
including in shoes business. Location of Shoe Village at Seruni Sidoarjo is
a home industry of shoe. As shoe industry village, this area has potential to
develop into centre of shoe industry which someday becoming the icon of
Sidoarjo. When tourist goes to Sidoarjo they will visit the village to buy
features shoe of Sidoarjo. Production and sales conducting recently are
still individually and traditional. This research wants to develop marketing
strategy with Seruni Small Business Society (UKM) for shoes using
analysis SWOT method by utilizing information technology. The purpose is
to improving sales of UKM using information technology so that hopefully
UKM will grow and more develop.
Keyword : website, Marketing, UKM,.
INTRODUCTION Micro Business referred to Finance Ministerial Decision No.40/KMK.06/2003 dated January 29
2003, is productive business owned by family or Indonesian Citizen Individual and have sales
revenue maximal Rp 100.000.000,00 (one hundred millions rupiah) each year. According to UU
No. 20/2008, Small Business is a productive economical effort which is independent, conducted
by individual person or business entity which is not a subsidiary nor corporate branch which is
owned, controlled or be part directly or indirectly by medium or big company. Medium business
is an independent productive economic effort, conducted by individual person or business entity
which is not either a subsidiary nor corporate branch which is owned, controlled, become part
directly or indirectly by Small Business or Big Company with its total net assets or total annual
sales.
Reasearch location UKM GAGO at Seruni Sidoarjo shoes village which is a shoe production
home industry. As shoe production village, this area has potential to develop to become center
of shoe production which will be the icon of Sidoarjo. So tourist can come to Sidoarjo and visit
this village to buy signature shoes from Sidoarjo.

The Fourth International Conference on Entrepreneurship | Book Three
248
Table 1. Comparison of Sales data on Shoes UKM at Seruni Sidoarjo village in the last 5
years.
UKM NAME Year
2012 2013 2014 2015 2016
UD GAGO 72.000.000 60.000.000 65.000.000 62.000.000 79.000.000
UD LAZER 70.300.000 82.000.000 68.000.000 68.000.000 75.000.000
UD R3 55.000.000 37.000.000 36.000.000 42.000.000 50.000.000
UD MARLON 55.000.000 65.000.000 47.000.000 45.000.000 55.000.000
CV PETRIK 123.000.000 125.000.000 135.000.000 120.000.000 120.000.000
Sumber : UKM 2016
Figure 1. Shoe UKM Sales at Seruni Sidoarjo village from year 2012-2016
LITERATURE REVIEW
Information Technology is an important part in society. People can feel direct benefit from
direct information to acknowledge world development, including business development.
Information technology can create communication and solving indirect work without the need to
deal it face to face, so that industrial production can be more efficient and effective. If a
company do not own and apply information technology in its industry, it can be left behind by
its competitor. Getting information, a company needs to issue a significant amount of capital.
Nevertheless, a company still needs to do it because using information technology is one of
parameter excellence of a company. Those paid price have a comparable opportunity cost.
Using information technology upon business development is important, beside management
should also be improved.
Recently technology development has important role and can not be separable from company
business. Development of information technology can give many ease in running business
activities. On the other side, information technology can also be abused for bad and less
important. So its application must be done wisely without harming another.
Company can use technology to create e-Commerce which within it can do promotion, through
e-Commerce with tremendous scope. By information technology which is connected with global
internet network, give opportunity in marketing product and service. Internet network and
interesting web feature are one of good promotion media and cheaper especially ini service
business. In principle, technology role in marketing is a media to ease the process, beside that
human resource and marketing strategic holds main key element.
Information Technology Role in Marketing.
Technology in marketing has an important role to increase existency of a company or business
entity. Currently, marketing without back up of advance information technology development,
The Fourth International Conference on Entrepreneurship | Book Three
249
can not perform maximal. Technology role on marketing can support interconnected acitivities,
for planning, determine the price, also related by promotion, and goods distribution or service to
customer. So in marketing product it can perform maximal.
In marketing field this information technology is needed for marketing activity. Marketing
activity use information technology such as product promotion via internet, online goods sales,
and provide online customer service.
Muhammad Tajuddin, Abdul Manan, Ahmat Adil 2011 : UMKM is one of core competition that
is flexible on international market that can be prima dona in gain community purpose based on
science. In order for that it is necessary to create sustainable concept to get those purpose. The
implementation of e-commerce application is a media that can be use to ease access for UMKM
management to get consultant help and advocacy from various related parties (such as
researcher, banker, industry experts, trade experts, cooperation experts, and UMKM work
partners). Considering most of UMKM management operate internet as a new gig and never
doing this at all, then get them to be familiar with using internet network to help improving their
business performance, need a lot of training. Based on descriptive analysis motive factor can be
concluded that factor foundation which compelled UMKM to use e-commerce consists of six
factors which are being highest hope for companies while applying e-commerce: Access global
market, product promotion, brand building, make customer closer, help faster communication
with customer and satisfy them.
Information System and Promotion.
Information system according to Hendry C Lucas (Astuti, 2011), is a serial of activities consists
of organized procedures and executed to provide useful information for its user in making
decision and take control on organization. The purpose o this information system is to present
information for supporting decision making on planning, initiating, organizing, controlling
operation activity on sub system of a company, and presenting organization synergi at the
process (Fatta, 2007). Promotion itself according to Salahudin at (Rangkuti, 2009) is one of
unsure of marketing blend which is used to acknowledge, persuade, and remind about a
company product. The purpose of promotion itself is to strengthen image brand of a product and
marketing product (Halim, 2010).
Marketing Performance.
Fulford, H., & Rizzo, A. (2009). Marekting performance is an output of all efforts and strategy
and also marketing performance which have been conducted by the company. Market-based
performance approach is marketing performance assessment based on external condition and
market where the company operates. Fulford and Rizzo (2009) put organizational performance
in conceptual model that is strategic oriented on small business with a reason that performance
is output indicator of strategic management. Assessment of organizational performance is at two
areas which are financial performance and strategic performance. Financial performance is more
measureable so that it is used as performance indicator which is included sales growth, profit
growth, asset growth, and other indicator.
E‐Marketing Strategy
The increasing of internet user at all the time is not ignored by businessmen. Recently many
businessmen create website, blogs, and facebook or twitter accounts to marketing their products.
Many companies that use those social media can interact and create relationship with their
customer. These progresses felt very usefull to become one of business marketing strategy (Paul,
2006). Business marketing by internet is one of means to expand market range. By internet
marketing, company product information can reach available customer any where any time
without the need to involve directly to certain area to promote their products.
Internet marketing also known as digital marketing, web marketing, online marketing, e-
marketing, are product or service marketing by internet (Kandasaami dkk, 2000). New
improvement on new marketing technique which are created by e-tailers and supported by

The Fourth International Conference on Entrepreneurship | Book Three
250
internet runs very fast in creating new dimension which is known as e-Marketing (Peattie, 2007).
According to Kaiyanam dkk, e-Marketing is still controversial enough as subject to talk about,
because no one is succeeding in unify many theories around, but there is no doubt that e-
Marketing first appear in form of many technique which deploy by company to sell their
product by internet in 1990-ish era. According to Poon dkk (2007) stated that e-Marketing
strategy usually based on and build at principles that arrange traditional offline marketing which
have been very familiar and famously applied in business world that is known as Marketing Mix
(4P), which are Product, Price, Promotion and Distribution, that create classic marketing mix.
For service marketing there are extra points of 3P, which are People, Process and Phisical Proof.
Then Edy Herman, Rahmawati 2016, stated that internet support communication and global
cooperation within employees, costumer, trader, and other business partners. Internet enable
people from different organization and location to work together as a virtual team to develop,
produce, market, and maintain product or service. Because of internet, marketing of company,
product and service become an interactive process nowadays. Company website is not just a
tool to present product catalog and promotion media, but also for dialog, discuss, and consult
with customer by online, bulletin boards, electronic questioner, mailing lists, and electronic mail
delivery (Ernst dkk,2011). So that customer can be involved directly in planning, developing,
marketing, and selling product which later will improve this UKM performance. Until now,
business marketing by internet is very helpful for businessmen to improve their sales products.
Ratna Yuvita, Anik Andriani 2016 stated that to increase information delivery and fast
promotion and enlarge its scope, they can conduct applying internet use. Internet itself is part of
dramatic technology which has recreated market and business (Eva, 2007). One way to use
internet as media to delivery information and promotion is by using website. Website use for
product information and promotion can increase demand of public to see product sold by the
seller (Indah & Yulainto, 2011). Theferore website can be applied to deliver product
information and promotion well.
Eva, A. (2007). Perception of Internet Use Application for Marketing Small Business Product
RESEARCH METHODS The place of this research is in SME product of shoes in Seruni village, Gedangan Sub-district,
Sidoarjo Regency. This research is descriptive and quantitative. Descriptive analysis will be
done by giving questions in the form of questionnaires. The questions are related to the four
factors in the company that is about; Strengths, weaknesses, opportunities and threats.
Questionnaires will be given to the owners of SMEs to assess how the strengths, weaknesses,
opportunities and threats of SMEs held so far. Of course also by comparing with competitor
SMEs. Quantitative analysis is to find relationships between variables: the sex of consumers,
shelter, age, education, occupation, and income of respondents / consumers.
Realization of Problem Solving in an effort to realize the activities of Increasing penjualn UKM,
then the initial evaluation of the condition of SMEs in Seruni Sidoarjo obtained the additional
promotion of one of them made a website with the name pemasaranukm.com
RESULT AND DISCUSSION
Main Description of UD GAGO
UD GAGO is founded at year 2004. Its founder name is Juli Agus Suprianto who has
experiences in shoes business since 1987. UD GAGO is located at Seruni Kecamatan Gedangan
Kabupaten Sidoarjo on area of about 100 meter sq. This location is functioned as workshop. The
initial capital establishment of UD GAGO is Rp 500.000,- which came from private fund of the
founder. By this initial capital, UD GAGO can give employment opportunities for 9 workers. In
the beginning they were hired by other parties then they can establish on their own. Based on

The Fourth International Conference on Entrepreneurship | Book Three
251
number of workers qualification UD GAGO is classified as small business units. There are
Internal and External Strategic Factors Identification of UD GAGO such as:
STRENGHT WEAKNESS
1.The ease of getting raw material.
Having a social mind, responsible,
smart, high spirit and entrepreneur
leader.
2. Having an economical and highly
competitive products.
3. Having supportive tools with modern
technology
4. Have work atmosphere that is familial
and mutual cooperation between
workers and managerial team
5. Product price is affordable by many
level of costumer
6. Image is well known.
7. Job coordination is more efficient
because manage directly by the owner
1. UKM still conduct activity
independently by simple tools
2. Lack of educated human resources
3. Facility and infrastructure is still limited 4.
Financial system is still simple
5. Limited work capital
6. Production based on order, so there is
no stock
7. Dependence on capital by mass buyer
8. Selling price is dominated by wholesale
price.
OPPORTUNITY THREAT
1.Increasing state economy by UKM
program
2.There is government support at
improving non oil sector by program of
Ministry of Industrial and Trade
3. Availability of always developing shoe
market
4. Intertwining of good cooperation with
government in effort to develop
economic sector
5. Availability of descent raw material and
Technology Improvement.
6. Good relation with distributor and major
store as partners.
7. Change of people life style
1. Public buy power level is still low.
2. There are many common products from
competitor
3. Costumer taste is always changing
4. Supplier capacity.
5. New competitor
Website Marketing.
System design level is meant to apply entity and data that is needed by system, system
modelling with process description and occurring data flow. This design phase is meant for
developing in order to fulfil need that has been identified on analysis level by giving technical
details and applying boundary on the system.
Below this is explanation of web pages which has been implemented that consists of static and
dynamic pages (html and php).
1. Index, is front page of system.
2. About, is page that contain with informations abaout business incubator
3. Info & News are pages that presents news and information about marketing system
4. Product data are pages that presents list of UKM products.

The Fourth International Conference on Entrepreneurship | Book Three
252
5. Login is file that handle user authentication on system. If username/password match
database of industry user database then the scripts will choose small industry session. If
it matches center industry database then it will be directed to administrator page.
6. Industries are industries session which contains menus for industry users.
7. Product Contents are company profile products pages of industries. This file will
present product content which has been uploading.
8. Product are consists of content details of each products. On this page it will present list
of products, prices, product varian list, audio, video, virtual products, and on each
displayed products
9. Change of content and prices are pages to see prices that have been given by industries.
10. Input topics are pages to input content (upload file) of products in form of html files,
into directories at server. And after uploading products data into database, then we can
input prices, promotion and supporting files. These files can be accessed by industries
as the content given by producer.
Figure 2. Web design address : pemasaranukm.com
1. Make Logical User Flow Right, a website must have an appealing look, but also make it easy to browse by user is more
important. You have to make how user flow from your website. Easy user flow, will be good for
user experience amd SEO (Search Engine Optimization), because google assume content and
structure of website as an important matter to determine your website ranking. Make
wireframming website and show your friends, is it easy to understand? If your friends
understand, whether other people will understand and google bot will create ranking based on
that.
2. Important information for your business Biggest mistake of someone is when creating a website according to what they want, not based
on what they need. For example a restaurant website, everybody wants to have music and big
pages of about us, but they forget about basic things such as menu, contact information and
location direction.
Keep maintain text as minimum as possible on mission statement pages of your website, so that
people can understand the point easily. One tip to deliver information and your purpose is by
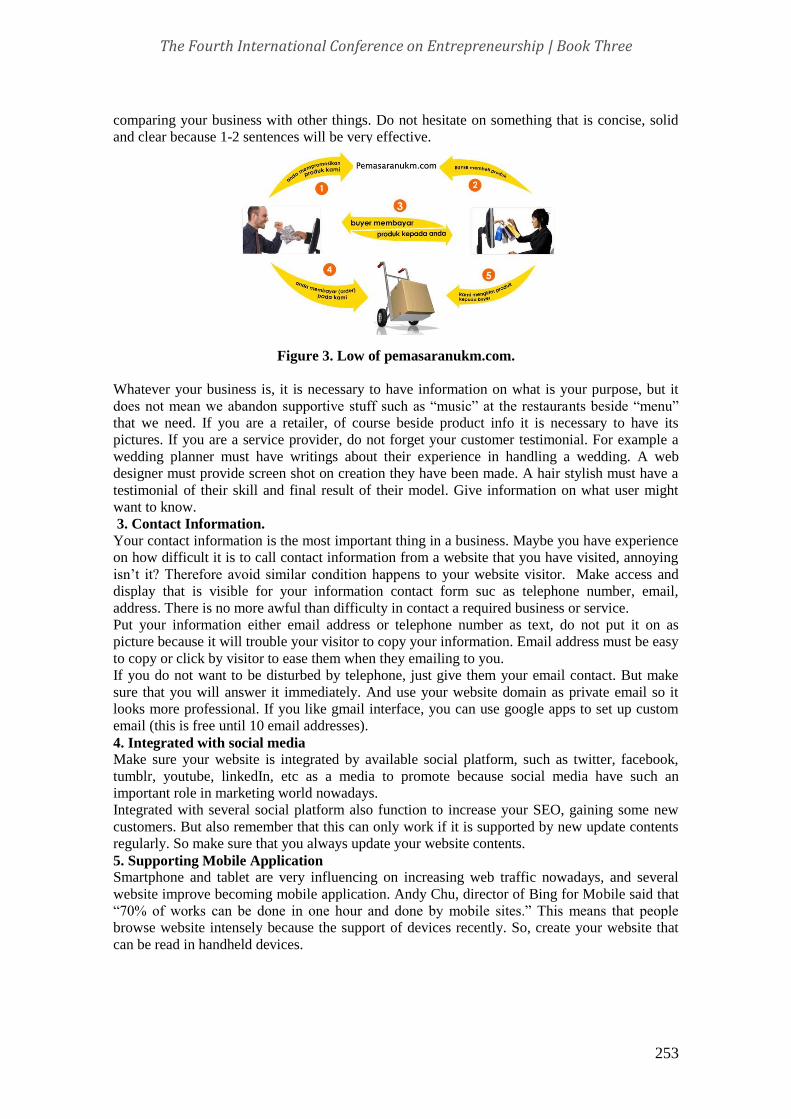
The Fourth International Conference on Entrepreneurship | Book Three
253
comparing your business with other things. Do not hesitate on something that is concise, solid
and clear because 1-2 sentences will be very effective.
Figure 3. Low of pemasaranukm.com.
Whatever your business is, it is necessary to have information on what is your purpose, but it
does not mean we abandon supportive stuff such as “music” at the restaurants beside “menu”
that we need. If you are a retailer, of course beside product info it is necessary to have its
pictures. If you are a service provider, do not forget your customer testimonial. For example a
wedding planner must have writings about their experience in handling a wedding. A web
designer must provide screen shot on creation they have been made. A hair stylish must have a
testimonial of their skill and final result of their model. Give information on what user might
want to know.
3. Contact Information.
Your contact information is the most important thing in a business. Maybe you have experience
on how difficult it is to call contact information from a website that you have visited, annoying
isn’t it? Therefore avoid similar condition happens to your website visitor. Make access and
display that is visible for your information contact form suc as telephone number, email,
address. There is no more awful than difficulty in contact a required business or service.
Put your information either email address or telephone number as text, do not put it on as
picture because it will trouble your visitor to copy your information. Email address must be easy
to copy or click by visitor to ease them when they emailing to you.
If you do not want to be disturbed by telephone, just give them your email contact. But make
sure that you will answer it immediately. And use your website domain as private email so it
looks more professional. If you like gmail interface, you can use google apps to set up custom
email (this is free until 10 email addresses).
4. Integrated with social media Make sure your website is integrated by available social platform, such as twitter, facebook,
tumblr, youtube, linkedIn, etc as a media to promote because social media have such an
important role in marketing world nowadays.
Integrated with several social platform also function to increase your SEO, gaining some new
customers. But also remember that this can only work if it is supported by new update contents
regularly. So make sure that you always update your website contents.
5. Supporting Mobile Application Smartphone and tablet are very influencing on increasing web traffic nowadays, and several
website improve becoming mobile application. Andy Chu, director of Bing for Mobile said that
“70% of works can be done in one hour and done by mobile sites.” This means that people
browse website intensely because the support of devices recently. So, create your website that
can be read in handheld devices.

The Fourth International Conference on Entrepreneurship | Book Three
254
Until 2 years ago, design a web means design to be read by a computer, but now means
designing for all devices that connected to internet. Such as laptop, tablets, smartphone and all
have different sizes. How to do that? Make a responsive design. A responsive website will ease
your website to adjust size of screen where the website be opened.
6. FAQ Many people ask question about anything on your website, then to ease you so that you do not
have to answer all visitor questions come into your email, make a summary of their question,
and make a list and its answer altogether. Question usually is about raw material that has been
used, how to deliver order, company history, sizes, delays, or return of damaged goods (depend
on website that you created).
7. Good Hosting Do not underestimate hosting problems. Your website needs good hosting, available on
mainstream provider, and can handle any damage at anytime 24/7, because if it is not, you can
have your website on low speed when it is browsed, difficult to be accessed, and make your
website on low rank at SEO.
8. Do not use to many features
Website must be simple! Exempt form less usefull features on your website, such as : Musik
1. Flash
2. Anything that is autoplay
3. Unnecessary information and media will make your website slow.
CONCLUSION
Based on description above then it can be concluded that: to market via online using website
address, proposed product must be explained in detail so the buyer will trust and interest in
purchase them. Development strategy must be done by craftsmen is: utilize website as
promotion and marketing media and also to increase sales. Increasing income will develop the
small medium business.
REFERENCES
Astuti, P. D. (2011). Sistem Informasi Penjualan Obat pada Apotek Jati Farma Arjosari. Journal
Speed, 34-39.
Fulford, H., & Rizzo, A. (2009). A Conceptual Model for The Strategic Orientation of Small
Firms. Journal of Enterprising Culture. 17(1): 25-54
Kaiyanam, Kirthi, et al. (2002). The E-Marketing Mix : A Contribution of The E-Tailing Wars,
Academy Of Marketing Science Journal, Fall 2002; 30, 4; Proquest.
Lalu Edy Herman1, Rahmawati (2016). e-MARKETING : Strategi Pemasaran Ukm Berbasis
Teknologi Informasi Untuk Menembus Pasar Global. Seminar Nasional IENACO –
2016
Muhammad Tajuddin, Abdul Manan, Ahmat Adil 2011 : Studi Kasus Model Strategi Pemasaran
Terintegrasi Berbasis Teknologi Informasi Di Nusa Tenggara Barat, Jurnal Ilmiah
Kursor Vol. 6, No. 2, Juli 2011
Paul, Pallab. (2006). Marketing on the Internet, Journal Of Consumer Marketing, 13 (4) :27-39.
Peattie, Ken. (2007). The Marketing Mix in the Third Age of Computing : Marketing
Intelligence dan Planning, 15 (3): 142-150.
Ratna Yufita, Anik Andriani ( 2016). Sistem Informasi Dan Promosi Berbasis Web Pada
Family
Mebel Magelang. IJNS – Indonesian Journal on Networking and Security - Volume 5 No 1 –
2016 – ijns.org
Rangkuti, F. (2009). Strategi Promosi yang Kreatif dan Analisis Kasus Integrated Marketing
Communication. Jakarta: Gramedia Pustaka.

The Fourth International Conference on Entrepreneurship | Book Three
255
LAUNCHING STRATEGY DELISH COFFESHOP DI KOTA
GRESIK
1Churin In, 2David Sukardi Kodrat♠
Ciputra University Surabaya
INDONESIA
ABSTRACT
Indonesia, dringking coffe is very common culture. Even though in
other countries also. Consumption of coffe get goot increase every
years. The increase can be good opportunity to establish coffeshop.
This step should arranged and plannedwell because preview
surveyfrom research institution in Amerika indicate a new brand that
launched 95% was failed. We have to identify key success factor and
formulize the best launching strategi to apply.
Keywords: strategy, coffeshop, gresik
INTRODUCTION
Gresik city known epithet with "1001 city of Warung Kopi (coffe shop)". That utterence not
too excessive if we see how the habit peoples use to drink coffe become a culture that cannot be
separate with those peoples who live in Gresik. That’s way many coffeshop can encountered in
every corner of the city. Situation, the growth trend, and scheme of consumption coffe all that as
encorege to open dellish coffeshop. This business created by innovations for satisfy demand of
market to enjoy coffe with more relaxed. This reserch used for resolve two case thait is:
(1)What is the Key Success Factor Launching of Delish Coffeshop? (2) How is the best
launching strategy for Delish Coffeshop?
While the Research purposes is (1) Determined what is the factors that be key success factor
durung the process of launching for Delish coffeshop. (2) Created the best launching strategy
for Delish Coffeshop.
This research consist of 2 benefit that is
1. theoretical
This research expected can give contribution for key succes factor concept and gave advice
about launching strategy for coffeshop.
2. practical
As guides for delish coffeshop and entrepreneur specially to give information about key succes
factor in caffeshop business to create the best launching strategy
On this case reseach should have limit to make easier, Limit of research comprised with things
that support launching process, this research only in Gresik city that analize about factors that
available in gresik city only
Previous research
Researched by Hwang, B dan Lu, T (2013) with title Analysis for e-SCM project
implementatition and a case study in semiconductor manufacturer. The result showing the top
level of strategy is most critic followed by organization process and technical. Key Succes
Factor is part of management strategy, Key Success Factor (KSFs)
LITERATURE REVIEW
Key success factor (KSFs) is the most important information that tent financial or nonfinancial
that different in company environment and influence about the success of company to achieve

The Fourth International Conference on Entrepreneurship | Book Three
256
the company goals we need the best strategic. Blocher in Kodrat (2009) to formulate of key
success factor(KSFs) needs 3 steps to do:
1. Doing analysis strategy for company with SWOT analyze
2. PEST analysis (Politic,Economic,Social,Technology)
3. Develop strategy information
Key success factor is determinant of company successness. Characteristics of key
success factor Antony,et.al. in Kodrat (2009) is:
1. It is importan in explaining the success of failure of the business unit
2. It is volatile and can charge quickly, often the reason not control label by the manager
3. A change in unpredictable
4. It is significant enough the prompt action is required when a change occurs
5. The variabel can be measured either directly or via a surrogate
Kuczmarski in kodrat (2009) sucessness of new produk supported by levels of inovation
that perceived as “new” by consument with used textual creteria, behavior, and symbolic. To
support of sucessness of new product, the first thing is the producer do verifying concept the
product. The concept test recommended as a tools to show the levels of product acceptance from
inovation corespondace to consumen inovation. That test can do with entrepreneur markeship.
Kodrat (2009) entrepreneur markeship concept is the combined of entrepreneurial concept with
marketing concept. This concept is important to determine success of launching new product.
Markeship consist from five steps terdiri dari lima that is marke insight, marke think, Marke Do,
marke thurt dan marke win. (Kodrat, 2009)
Framework
From the plan of estabilishment delish coffeshop, will held launching product. where before do
launching product have to do identification of key success factor as reference to establish
strategy for delish coffeshop.
Analysis model
Analysis of Key success faktor doing with establish internal indicator either IFAS that can
analyzed 5’s force analysis and EFAS indicator that can analyzed PEST analyze. Then the
indicators will determined by priority scale, to determine which one is the most important.
Research approch
Research approch in this case using applied research.
Determination of informants
The creteria of informant who choosed on this research is consumen or buyer, supplier, and
competitor in Gresik city.
Data Aggregate Data aggregate methode every aspect can exlained by means of kinds of data, and data sources.
Research Instrument
Interview guidlines
Observation guidlines
Dokument tools or document notes form
Research focus
This research in gresik only
Verify data
Yin (2009), have four kinds of test for checking validate of contruct, internal validiy, eksternal
validity, reliability.
Data analysis
1. Key Success Factor analysis
2. Five Force analysis on IFAS
3. IFAS (internal strategic factor analysis summary)
4. Analisis PEST

The Fourth International Conference on Entrepreneurship | Book Three
257
Economy
Politic
Social
Technology
5.EFAS (ekternal strategic factor analysis summary)
6. Important level
7. Analysis Entrepreneur Markeship to created Launching strategy
Marke insight
Step that have to do on marke insght is:
1. Change analysis
2. Competitif analysis
3. Trend comunity
4. Costumer potential
Marke think
Step that have to do on marke think is:
1. Segmentation as mapping strategi
2. Targeting
3. Uniqe selling
On this step will create a brand identity.
Marke Do
1. Promotion
2. Distribution
3. Product
4. price
On this step will created a brand awareness
Marke Truth
1. Repeat transtaction
On this fase that will happen brand trial and brand confiction
Marke Win
On this fase will happen Brand loyalty
Data analysis
The general description of Object research
Delish Cofeshop is one of coffeshop business that will establish in Gresik city.
Key Success Factor Analysis
Five Force analysis on IFAS
Tabel 1. Rangkuman Five Forces Porter Analysis Delish Coffeshop
Indicator average Condition
Threats of New Entrants 3 Medium
Bergaining Power of Supplier 2 Medium low
Bergaining Power of Buyer 3 Medium
Competitive Rivalry Within Industry 4 Medium High
Threats of Subtitute Products 3 Medium
Source : processed Data (2014)

The Fourth International Conference on Entrepreneurship | Book Three
258
Delish Coffeshop Five Force of Competition Model
Competitive rivaly within industry
Bargaining power Threat of subtitute
of buyer products
Bargaining power of
Supplier Threat of new entrants
Figure 1. The five forves of competition model delish coffeshop
Source : processed primer data (2014)
Strategy used
Based of analysis that did on analisis five force of competition, the strategy that used is The
differentiation strategy.
Table 2. Analysis IFAS (internal strategic factor analysis summary)
The determine Factors of
internal strategy
Quality Rating Quality Score
(BobotxRating)
Strength
A. Family Supplier
B.
C. Quality of coffe
D. Different concept
0.250
0.250
0.150
3
4
4
0.750
1.000
0.600
Total S 0.650 2.350
Weakness
A. Need major fund
B. competitor
0.200
0.150
2
4
0.400
0.600
JUMLAH W 0.450 1.000
TOTAL S+W 1.000 3.350
Source: processed primer data(2014)
Analisis PEST
Based from PEST analysis, obtained results show indicator that be opportunity and threat is:
Opportunity
1. The high of population income (UMK)

The Fourth International Conference on Entrepreneurship | Book Three
259
2. Life style
3. Technology
Threat
1. Trend that easy to change
2. Technology competition
EFAS (eksternal strategic factor analysis summary)
Table 3. quality of external company factor
Faktor-Faktor strategis
eksternal
quality Rating Quality score
(quality x Rating)
Opportunity
A. UMK penduduk tinggi
B. Life style
C. High technology
0.200
0.225
0.225
4
4
3
0.800
0.900
0..675
total O 0.650 2.375
Threat
D. Trend that easy to
change
E. Technology competition
0.225
0.125
3
3
0.675
0.375
total T 0.350 1.050
TOTAL O+T 1.000 3.425
Sumber: Data primer yang diolah (2014)
SWOT Matrix
If the quality factor marged with external company factor:
(S-W) the result S 2.350 - 1.000 = 1.350
(O-T) the result O 3.375 – 1.050 = 2.325
based from SWOT analysis delish coffeshop is at growth quadran where the strategy
that used in this business is used stable growth strategy.
Model Entrepreneur Markeship analysis for determine Launching strategy
1. Marke insight
1. Changed analysis
a. technology
high technology can help on business process on delish coffeshop.
b. economic growth
economic growth in Gresik city on good level.
c. The growth of polotic and law
The policy that made by goverment specially on bank fundingBanyaknya
kebijakan-kebijakan yang dibuat oleh pemerintahan terutama dalam hal pendanaan bank.
d. The friction of social and culture
the high income in gresik city can change they life style.
a. Market changes
Market for coffe in indonesia reached high market every year and always follow population
growth.
2. Competitif analysis
a. New comer
The citizens in gresik used to drink coffe, that will be opportunity make business.
And they have high income avarege.
b. Subtitution product.

The Fourth International Conference on Entrepreneurship | Book Three
260
To avoid of subtitution product delish coffeshop have to somtheng diference with the
competitor. Delish coffeshop sholbe be better then them. The differentiation is kuality and
sevice
3. Trend comunity analysis
a. Life style between group with other. The life style already changed be modern style.
4. Consumen potential analisys
There is way to determine petential consumen:
specify target
market target that choose by delish coffe is teeneger and adult.
Proaktif Contact with friends, co worker, family and many things
network
make a network can be strat from mouth to mouth, then rcomendation from costumers to
another cotumers is the most prosper. The other thing can make promotin with medial
social, because this is the new trend even we can make friend with new people by this.
Marke think
The step that have to do on marke think antara lain:
1. Segmentation as mapping strategi
a. Psikografic
More specify, the segment that choosed by citizens specially people on junior high
school, senior high school, worker that among 15 years old until 40 years old.
2. Targeting
Targeting from Delish coffeshop are teeneger and adult and segmentation that already
choosed are between 15 years old until 40 years old
3. Uniqe selling
a. Content delish coffeshop is selling many variant coffe that heve high quality with low
price.
Contects delish coffeshop do launching or grand opening, and make promotion by
wedsite, media social, like instragram, twitter, facebook, path.
b. Infrastructure is utilize technology as tools to help delish coffe shop production. The
tools are coffe maker as produce coffe drink with good taste and faster, cassier, internet,
media promotion.
Marke Do
1. Promotion
launching or grand opening, give discont, free product, member card, point
accumulation to get free drink. Use internet for promotion by website and another media social
that trend on that time
2. Distribution
Delish coffeshop more focus to sell coffe, the raw materials from coffe factory then
supplied to coffe shop, after that coffe will proccess be many variant of beverage and selling in
fotm of coffe powder too, that will pack and brand by delish coffeshop.
3. Product
sell many variant product
3. Price
The price between Rp. 10.000 hingga Rp.15.000
Marke Truth
Delish coffeshop will do active promote by media sosial
Marke Win
Loyal consumen will do repeat transaction because they like the product.
Implication Manajerial

The Fourth International Conference on Entrepreneurship | Book Three
261
Key success factor
1. Five Force analysis
Tabel 4. Implications Five Force
Indication Applied Target
Threats of new entrans Defferentiation product Loyal costumers
delish coffeshop
Bergaining power of
supplier Raw material from
family factory
Stock of raw
material
Quality produk
Bergaining power of
buyer Potential consumen High income
Competitive rivalry within
industry Inovative
product
Consumen prefer
delish coffeshop
then other else
Threats of subtitute
produk good service
quality
product
loyal costumers
Source: processed Primer data (2014)
2. PEST analysis
Tabel 5. Implication of PEST
Indicator Factor in fact Target
Politic business permit
Policy
Bank funding
Easy
Easy
Easy
Economy High UMK
Daya belinya tinggi
Social life style modern
choosing delish
coffe to be place
where can waste the
time, place for
meeting with
friends, relation etc
Technology high technology to help delish
coffeshop produce
coffe and make
everything easier.
Make costmers feel
more comfortable
with technology
facility for example
free wifi.
Source: processed primer data yang(2014)

The Fourth International Conference on Entrepreneurship | Book Three
262
CONCLUSION Based from this analysis, delish coffeshop can formulate various of key success factor. Key
succes factor compossed from strenght, weakness, opportunity dan threat. The company can
find crucial things to support successness the company. Key success factor on delish coffeshop
is:
Internal factor:
Supplier is own company with quality score 0.750
Coffe quality with quality score 1.000
Different concept with quality score 0.600
Major funding with quality score 0.400
Competitor who have loyal costumers with quality score 0.150
External factor:
High income (UMK) with quality score 0.800
Life style with quality score 0.900
High technology with quality score 0.675
The trand that easier to change with quality score 0.675
Technology competitor with quality score 0.375
REFERENCES
Ireland, R. Duane, Hoskisson, Robert E., Hitt, Michael A (2013) The Management of Strategy
Concepts Cases, 10th adition. Canada: Nelson Education, Ltd
Jakfar, dan Kasmir. (2010) Studi kelayakan Bisnis.Jakarta.Kencana Prenada Media Grup.
Kodrat, David Surakdi, (2010). Manajemen Eksekusi Bisnis. Yogyakarta: Garha Ilmu
Nurwahyudi (2011) Dalam Jurnal Pengaruh Kemampuan tenaga Penjualan Sistem Distribusi
dan Sistem Promosi Terhadap Kinerja Launching dalam Upayah menciptakan Brand
Awareness
Rangkuti, F.(2013) Teknik Membedah Kasus Bisnis Analisis SWOT (Edisi revisi). Jakarta; Pt
Grramedia Pustaka
Royan, M, Farns (2009). Distrubutorshop management. Jakarta: Gramedia Pustaka Utama
Sulisyanto (2010) Analisis Data dalam Aplikasi Pemasaran. Bogor: Ghalia Indonesia
Suderajat, Muhammad (2009). Jurnal Key Success Factor Pemasaran Sayur pada PT. Rodeo
Fresh Vegetable and Friuts Lawang Malang. Avalaible www.docstoc.com
Thompson, K.E., Artur., Jr.,A.J. Strickland dan John E. Camble. (2005). Crafting and Exciting
Strategy : The Quest for Competitive Advatage-Concept and Case, 14th ed. Boston:
McGraw Hill irwin
Tjiptono, Fandi (2008). Strategy Pemasaran Edisi ketiga. Yogyakarta: Penerbit Andi
Ward, John. Peppard, Joe. (2002). Strategic Planning for Information System, 3rd
Edition. John Wiley and Sons, Inc, New York.

The Fourth International Conference on Entrepreneurship | Book Three
263
STRATEGY DESIGN MARKETING WOOD FLOORING
PRODUCT IN PT. SRIKANDI MANDIRI SAKTI
1Ristanti Ayu Dian Permatasari, 2Tina Melinda♠
Ciputra University Surabaya
INDONESIA
Email: [email protected]
ABSTRACT
Strategies designing marketing wood flooring products aims to formulate
a marketing strategy based on the design of Five Porter and SWOT
Analysis in wood flooring products in PT. Srikandi Mandiri Sakti. The
unit of analysis used in this study are individuals (informants) were 7
informants.The design of this marketing strategy is analyzed through
some analysis of the data namely, SWOT analysis, marketing mix
analysis, analysis of the internal environment, external environment
analysis, Porter Five Analyisis, and SWOT matrix analysis. From the
analysis of the company SWOT matrix is in the first quadrant, a company
discount high growth market and have a strong competition, so
companies do market development and product development for the
integration of future products.
Keywords: Marketing Strategy Design, Flooring, Growth Markets,
Analysis
INTRODUCTION
In the development era, industrial competition will be more stringent. Characterized by many
establishment of industrial companies engaged in the same industry. In the domestic market
competition will provide opportunities and threats to local companies. The growing media
information will result in high competition that must be faced by a company. So it needs a
competitive strategy for the goal can be achieved as well as the company can still maintain
themselves and compete in a healthy manner. The need for timber increases considerably from
year to year as the population increases, technological advances, industry and science. In the
field of construction for example, wood still has significance in its use although it gets rivals
from other materials.
Wood has several advantages that are easily formed and worked on, as good heat insulators, and
have good decorative properties. Wood is one of the many materials used in building houses, as
wood building materials can be processed into door frames and windows and so forth. It also
provides an opportunity for entrepreneurs who want to engage in the processing of wood-based
products, see the development of the property market continues to move up, so the need for
wood continues to increase, especially for wood flooring or flooring products. Currently wood
flooring products in Indonesia compete very closely with the number of similar wood
processing companies. Wood floor market opportunities according to a survey in 2016
conducted by Perhutani will focus more on wood processing industry to work on flooring
products (flooring) which in 2016 is targeted to reach production volume of 8,895 m3 for the
Indonesian market. Based on Perhutani data from 2015 to 2016, Indonesia has requested export

The Fourth International Conference on Entrepreneurship | Book Three
264
activities of market expansion of flooring products in some countries that have potential for
product development.
The wood industry known to the community as in Bali, Jepara, Blora, Ngawi, Pasuruan and
Madura, is a wood industry whose products have grown rapidly and sales have reached national
and even international markets. The quality and product of each different region also provides a
characteristic that can provide its own selling point for the industry. One of them is PT. Srikandi
Mandiri Sakti located in Gresik which is also one of the many industrial enterprises in the field
of wood producing flooring. PT. Srikandi Mandiri Sakti is one of the industries engaged in the
service industry and production. PT. Srikandi Mandiri Sakti is a family company where in some
important part is managed by family side, while at other level managed by employees. PT.
Srikandi Mandiri Sakti is engaged in wood processing from upstream to downstream process,
from log to wood process to goods such as wooden floor, window frame, door, window,
furniture and so on, one of which is wood flooring. The company uses production by job by
order process, where the company produces goods according to consumer demand.
LITERATURE RIVIEW
Marketing Strategy
According Kotler (2012), marketing management is the analysis, implementation, and
supervision of programs intended to exchange with the intended market to achieve
organizational goals. It depends on the organization's offerings in meeting the needs and wants
of the market in pricing, effective communication and distribution to drive and serve the market.
Marketing Mix
According to Sumarni and Soeprihanto (2010) marketing mix is a combination of variables or
activities that are the core of the product marketing system, price, promotion and distribution. In
other words, marketing mix is a collection of variables that can be used by companies to
influence consumer responses.
Analysis External Environment
The elements present in this environment have an indirect effect on the company.
According to Mayadewi (2014) PEST analysis is an analysis of the external environmental
factors of business covering the fields of politics, economics, social, technology. PEST is used
to assess the market of a business unit or organizational unit. The direction of PEST analysis is a
framework for assessing a situation, and assessing a company's strategic direction or position,
marketing plan or idea. Where this analysis can be taken a new opportunities or threats for the
company.
Analysis Internal Environment
The company has its own internal environment. The internal environment that will bring out the
weaknesses and strengths of the company. Anything that belongs to the internal environment
should be more easily identified because it is inside the company. Yulianti (2014) aspects of
industrial environment will be more directed to the aspect of competition where the company's
business resides. The state of competition in an industry depends on the five core competitive
forces mentioned by Porter, including the threat posed by competitive competition, buyer
bargaining power, supplier bargaining power, potential new entrants, and replacement products.
Strength – Weakness – Opportunity – Threath (SWOT)
The SWOT analysis includes an effort to recognize the strengths, weaknesses, opportunities and
threats that determine the company's performance. External information about opportunities and
threats can be obtained from many sources, including customers, government documents,
suppliers, banking circles and partners in other companies. SWOT analysis is the systematic
identification of various factors to formulate the company's strategy. (Rangkuti, 2013). This
analysis is based on logic that can maximize strength, opportunity, but can simultaneously

The Fourth International Conference on Entrepreneurship | Book Three
265
minimize weakness, and threats. The strategy decision-making process is always related to the
development of mission, goals, strategies and company policies.
RESEARCH METHODS
Based on the background and problems in the company, companies need the right marketing
strategy to get out of the industry competition in increasing sales. Data analysis used in this
research by using analysis of internal and external environment, internal-external matrix (IE),
and SWOT matrix analysis. From the results of this data analysis is used to obtain the right
business strategy for the company. Furthermore, the results obtained will be directly applied to
the company. To know the appropriate business strategy to be applied so that it will help the
company to be able to compete with similar competitors. In general, this research will discuss
some matters related to the determination of the right business strategy and how to design the
right marketing strategy based on Five Forces Analysis and SWOT on flooring products.
The basis used in this study is theoretically from several authors' books related to business
strategy. The next step is to conduct interviews with informants followed by analysis of data
obtained using internal and external environment analysis, with internal-external matrix (IE) and
SWOT matrix analysis. This data analysis is used to obtain the right business strategy for the
company.
This research uses qualitative research methods by exposing the systematic review of scientific
information derived from the subject or object of research (Sugiyono, 2010). Qualitative
research is a research that is not based on numbers but based on logical and truth-based analysis
and comparing the existing theory with practice applied to PT. Srikandi Mandiri Sakti. The data
collected from qualitative research takes the form of words and deeds obtained by examining,
investigating, studying and studying carefully and informing hypotheses so as to obtain
something like reaching the truth and getting answers to problems or scientific development
(Siregar, 2013).
Qualitative research is descriptive, which means a study that describes phenomena or events in
accordance with facts. The data contained in qualitative research are presented in descriptive
form in the form of recording, interviews and photographs of reported research objects that fit
the actual situation.
RESULTS AND DISCUSSION
Marketing Mix
Products
Wood flooring products manufactured by PT. Srikandi Mandiri Sakti uses a dry clinical process,
where the product has wood quality with good wood fiber, so it is not easy to expand and
shrink, and able to withstand heavy loads.
Price
In the case of PT. Srikandi Mandiri Sakti sells to consumers with discount programs if
consumers buy in large quantities, it is done so that consumers can make price comparisons with
other companies.
Place
For the place where the company conducts product distribution directly and indirectly, it is
directly done with consumers coming to the company by looking at the product, indirectly done
by online system via email or messenger by sending photos of manufactured products.
Promotion
Promotion activities of PT. Srikandi Mandiri Sakti is done by maintaining networking
relationship with some consumers who become old customers by utilizing information from
mouth to mouth and also social media.
Internal Environment Analysis

The Fourth International Conference on Entrepreneurship | Book Three
266
Newcomer Threats
The results show that offering price and quality as well as building consumer confidence is a
factor to consider when new entrants in the timber industry begin to enter.
Product Substitution Threat
The results show that the timber industry has many kinds of materials used, especially for
flooring, and consumers usually use solid wood and laminate where each material has its own
advantages and disadvantages, of each demand for different prices.
Competition in Similar Industries
The results show that each wood company has its own characteristics to attract the attention of
consumers, but with one goal that is to provide added value to customers feel satisfied with
what the company gives and of course provide a competitive price.
Buyer's Bargaining Power
The results indicate that the bargaining power of buyers in the field of wood industry is
relatively high seen from the number of companies of the same kind inside and outside the area.
Supplier's Bargaining Power
The results show that the bargaining power of suppliers in the timber industry is relatively high,
as suppliers have the power to raise prices and lower prices, such as Perhutani in terms of wood
raw materials.
External Environmental Analysis
Politics
Influential government policies depend on the company itself how the company responds to the
policy by looking at what policy changes affect the company's production activities.
Economics
The decline in the pace of the Indonesian economy and the weakening economy of the rupiah
exchange rate against the US Dollar made the purchasing power of customers declining and
finally replacing wood products with substitution products.
Social
The stipulation of salary wages of employees of some companies only experience the impact,
and there are companies that have an effect and do not affect it.
Technology
With the development of technology in the current era is very influential on all lines of the
company, because with today's technology can facilitate the company to market its products,
other than that consumers can easily buy goods without having to come to the company.
SWOT Analysis
On SWOT analysis matrix conducted by timber company of PT. Srikandi Mandiri Sakti is in the
position of Quadrant 1. The SWOT analysis matrix is in position (SO Strategy) where general
strategy can be done by the company to take every advantage on the existing opportunities.
The company has the power of having a steady customer, and timely product delivery in
accordance with consumer demand. While the opportunity for the company is the opening of
wood floor products export through SVLK licensing. The company focuses on the development
of existing products and improves the quality of products in production, in addition to the future
companies will add human and machine resources for product finishing activities.
CONCLUSION Based on the results of analysis of PEST and Five Forces Porter apply SWOT analysis of the
strengths, weaknesses, opportunities and threats owned by PT. Srikandi Mandiri Sakti. The
results obtained by the company enter into the quadrant 1 where in the SO (SO Strength-
Weakness) where the company's strategy is to take advantage of existing opportunities, current
opportunities in wood flooring products is the possibility of export activities with the licensing
The Fourth International Conference on Entrepreneurship | Book Three
267
SVLK, With the current demand for wood flooring high enough in China, the company can take
advantage of opportunities for expansion of marketing activities in exports.
REFERENCES
Kotler, Philip. (2012) Marketing Management: Analysis Planning and
Control.Canada:Pearson Education.
Mayadewi, P. (2014). Perencanaan Kebutuhan Pengembangan Sistem Informasi. (Studi Kasus:
Perpustakaan Daerah Kota XYZ). 1-8
Rangkuti, Freddy. (2013). Analisis SWOT: Teknik Membedah Kasus Bisnis. Jakarta:PT.
Gramedia Pustaka Utama.
Siregar, Syofian. (2013). Statistik Parametik untuk Penelitian Kualitatif. Jakarta: PT.Bumi
Aksara.
Sugiyono. (2010). Metode Penelitian Pendidikan Pendekatan Kuantitatif Kualitatif dan
R&D. Bandung: Alfabeta.
Sumarni, M., & Suprihanto, J. (2010). Pengantar Bisnis (Dasar- Dasar Ekonomi Perusahaan)
(Edisi 5). Yogyakarta: Liberty

The Fourth International Conference on Entrepreneurship | Book Three
268
OPTIMALIZATION PROPERTY ASET OF VILLAGE
(STUDY IN DESA KETAJEN, KEC. GEDANGAN, KAB.
SIDOARJO)
1Sugiono, 2Tina Melinda♠
Ciputra University Surabaya
INDONESIA
Email : [email protected], [email protected]
ABSTRACT
The development of industry and commerce have always been
followed by warehousing and factory needs. Warehousing and factory
requires a considerable land area and a strategic location adequate
supporting infrastructure. On the other hand there is an area of land
the village treasury has not managed properly even neglected.
Constitution number 6 of 2014 about village mentions that the village
has the wealth and assets of the village that can be managed and
cooperated with investors to improve the welfare of the village
community. The potential is owned by Ketajen Village District
Gedangan of Sidoarjo Regency with land area ± 2,5 Ha in a very
convenient location. PT. Sarana Dwi Makmur as investors interested
to manage the land of the village treasury with rent system, because
it has a strong legal basis with the Cooperation of Operation (KSO)
Built Operation Transfer (BOT) method. Efforts to investigate the
optimum utilization of the land of the village treasury, this research
using the Highest and Best Use method (HBU). The HBU method
analyzing about the Legal Permisible (Law), Physical Possibility (the
location of land) Financial Feasibility and Maximum Profitability.
This research aims to analyze the optimum utilization of land the
village treasury in in Ketajen Village District Gedangan of Sidoarjo
Regency as well as to find out amoung home store / home offices and
warehousing, where property is the most optimal land utilization of
land the village treasury meant. The results of research the HBU
method can be called optimal, both in terms of Legal Permisible,
Physial Possibility, Financial Feasibility and Maximum Productivity
are included in the category deserves all. Potential profits and quick
returns on investment value of this research, can provide early
information to investors in the field of property. For beginner
businessman or start-up, this research could trigger or booster that
this pattern of cooperation with its potential still open wide in all
segments without having to pay a large capital.
Keywords: Precision, Opportunity, Regulation, Cooperation,
Creativity, Development, Profit, Sharing.
INTRODUCTION
The developing industry and trade are always followed by the needs of strategic areas to extend
factory and warehouse. However the vast and strategic areas are hard to find.

The Fourth International Conference on Entrepreneurship | Book Three
269
Any such land in an area, it is definitely its location in the territory of a village. On the other
hand, the village has an asset that one of them in the form of village land. Village land are not
managed optimally or abandoned by the village government due to the lack of human resources,
education, finance and public participation.
Law of the republic of Indonesia number 6 of 2014 concerning village (hereinafter referred to as
the Law No. 6 of 2014) part 1, article 1 reffered to herein as “Village shall be village and
traditional village or as referred to by other names, hereinafter referred to as Village, shall be a
unit of community that has boundaries with the authority to regulate and manage the affairs of
government, interests of the local communities based on the community’s initiatives, right of
origin, and / or traditional rights recognized and respected in the system of government of the
Republic of Indonesia”.
As a government, the village has the wealth and assets that must be managed for benefit of well-
being. Law number 6 of 2014, article 76, alinea 1 explained that “The Village Assets can be
Village land, communal land, Village markets, animal market, mooring, Village building, fish
auction, agricultural product auction, forest belonging to the Village, Village-owned springs,
public baths, and other assets belonging to the Village”. The statement in the article indicate that
village land is one of form of village assets. Further, Winarno (2003:197) revelead that the
ownership of village land is part of the village economic structure because land is the most
important rural community asset.
Therefore the management of village land must be done properly in accordance with the law
number 6 of 2014 article 77 alinea 1 and 2 which concerning in the village asset management.
Alinea 1 reffered “The management of Village assets shall be held by the principle of common
interests, functional, legal certainty, transparency, efficiency, effectiveness, accountability, and
the certainty of economic value”. Alinea 2 reffered “The Village asset management shall be
done to improve the welfare and living standards of the Village community as well as increase
Village revenue”.
Thus, it can be explained that the utilization of village land should be done properly due to
relate with the improvement of social welfare. Optimizing the efficiency and outcome of village
land should be done for the benefit of village community development and service. The most
problem in management of village land is poor management of village land, such as agriculture
land and abandoned land. Research of Setiawan (2015) showed that several factors that become
less optimal constraint of village management, that are the lack of human resources in knowing
their duties and performance as village government, village government initiative in utilizing
the village’s original incomes especially the village land, participation and responsibility of their
village community toward the village land and the low level of village community education.
One of villages which has village land but not be managed properly, is Ketajen village,
Gedangan district, Sidoarjo. Ketajan village has 2,5 hectares village land. This village land is
located in strategic industry and warehouse because being around Waru, Juanda, Sedati,
Gedangan, and Buduran.
Therefore, PT. Sarana Dwi Makmur interest to manage it in order to build shop and warehouse.
Certain considerations of PT. Sarana Dwi Makmur when deciding to choose managing the
village land is participating in the o ptimal utilization of village land, thereby PT. Sarana Dwi
Makmur can support the concept of village management for the benefit of village community of
Ketahen village and surrounding area in developing and improving prosperity, as well as to
achieve the benefits of investments made.
In order to achive this objectives, this study examines the optimum utilization of village land by
using Highest and Best Use (HBU) method. The HBU method is the method that determines the
most physically possible, appropriately justified, legally permissible, financially feasible, and
the highest-yielding, which the concept is centered on the market value base(Wyatt, 2013).

The Fourth International Conference on Entrepreneurship | Book Three
270
Based on the preliminary observation results, reviewed on the basis of financial feasibility, the
industrial estate will always generate business transactions, where the business transaction will
integrate well if there are shop and warehouse.
Therefore, in rough calculations, PT. Sarana Dwi Makmur has calculated the value of
investment and the level of sales that may be achieved.
Table 1. The Estimation Value of Investment and Sales Value
Description Quantity Return
First investation Land area 25.000 m2 Gross profit rate:
Rp. 48.400.000.000
(49,19%)
Gross refund rate:
196,80%
Rental Value/m2 Rp. 2.000.000
amount of rental Rp. 50.000.000.000
Estimation Shop area 2 lt 5 x 16 m2
Number of shop 20 unit
Shop sales Selling price per unit Rp. 720.000.000
Sales value Rp. 14.400.000.000
Estimation Warehouse area 15 x 50 m2
Warehouse sales Number of
warehouse
24 unit
Selling price per unit Rp.3.500.000.000
Sales value Rp. 84.000.000.000
Sales total estimation Rp. 98.400.000.000
Source: the initial estimate author (2016)
The following Background as intended, can be briefly illustrated as the flowchart image below :
Figure 1. Background
LITERATURE REVIEW
Previous Research
Mubbayinah & Utomo ( 2012 )
Analysis Highest and Best Use ( HBU ) on the grounds of X, X is located in Dr. Soetomo
street 79 – 81 Surabaya, alternative of hotels. The high value of the grouds Rp. 13.148.307 / m2.
Industry and trade
area
Expansion area for (factory and
warehouse), trade
abandoned
Village asset in the name
of village land
Investor
Potency
Cooperation of KSO & BOT
study
HBU Method
Analysis
Physically
Possible
Legally
Permisissible
Financially
Feasible
Maximum
Productivity

The Fourth International Conference on Entrepreneurship | Book Three
271
Akmaludin & Utomo ( 2013 )
Analisis Highest and Best Use ( HBU ) of the grounds in Gubeng Raya street 54 Surabaya,
alternative commercial property hotels that have the highest and best use, with land values Rp.
67.069.980,31 /m2
Setiawan ( 2015 )
Revenue optimization of land village, in Batang Botindih Village, Rumbio Jaya District
Kampar District 2009 - 2013. Not achieving revenue targets due to unresolved Village
Regulations, low-level village officials to understand its TUPOKSI, lack of village government
initiatives to increase village original revenues, lack of community participation, and low public
education
Utami dan Utomo (2015) Analysis Highest and Best Use on vacant land in Ubud Tourism Area. The use of alternative
mix used between villa 60% and spa center 40% produce the highest and best value with
productivity increase of 829% and the value of land obtained is Rp 10,263,207 per m2
The Village Land
1. Law Number 6 year 2014, About the Village Law 6/2014 Article 1 point 1 explains that the
village "unity of the legal community which has the boundaries of the territory authorized
to regulate and administer government affairs, the interests of local communities based on
community initiatives, rights of origin, and / or traditional rights recognized and respected
in the system The government of the Unitary State of the Republic of Indonesia.
2. Permendagri Number 4 year 2007,About the management of Village Cash Land.
Permendagri 4/2007 Article 2 paragraph (1), explained that the village has village wealth in
the form of "village cash land, Village market, Animal market, boat mooring, village
building, fish auctions managed by villages.
Management and The Village Land
The management and utilization of village cash lands are regulated in legislation, from the
central to the local level, including the rural areas. This is because the village treasury is the
wealth or assets of the village that must be managed and utilized for as much as the prosperity
and welfare of the community.
1. Law 6/2014 About the Village
2. Permendagri 4/2007, Management Procedures of TKD
3. Village Head Decision approved by BPD, and received written permission from the Regent /
Mayor and Governor.
4. Cooperation KSO & BOT, is a cooperation with the principle of mutually beneficial sharing
between the government and partners / investors.
In the BOT procedure, the selected investor or contractor performs the design, construction,
operation (operanalization), and maintains the facility for a certain period in accordance with
the agreement. Such an approach increases the incentive and high quality of the project, as
the contractor is responsible for the operational activities of the facility built after the
construction period. The owner, in this case, does not share financial risks and financial
compensation, because the contractor as the manager who handles the payment and
financing (Hussey and Hall, 2008: 21; Buxbaum and Ortiz, 2009: 8)

The Fourth International Conference on Entrepreneurship | Book Three
272
Tabel 2. Difference between Model BOT and BTO in KSO
Source: Gunawan, 2013
Highest and Best Use (HBU)
The HBU method is the method that determines the most physically possible, appropriately
justified, legally permissible, financially feasible, and the highest-yielding land use , Whereby
the concept is centered on the market value base (Wyatt, 2013). The HBU of a property is
independent of subjective analysis, who the owner, developer or property appraiser though, but
this HBU is created due to the power of competition in the market where the property is located
(Akmaluddin and Utomo, 2013).
Friedman and Lindeman (2010: 201) gives the definition of the highest and best use model
following four criteria that must be implemented in analyzing the HBU model on land use,
namely that the concept of HBU is a concept that considers the use of vacant land or properties
most likely to be used Physically and legally, where the use of the land or property must be able
to provide the highest value.
Walton (2011: ch.3) HBU is that market value should be a consideration for the company in
making decisions regarding the rate of return on assets under the control of the company.
Wyott (2013: ch.8) The HBU method is the method that determines the most important use of
physical land (Physically possible), Appropriately Justified is legally permissible, and is
financially viable. Which gives the highest value, in which the concept is centered on market
value.
The four criteria that must be met in this model (HBU) are legal permisibility, physical
possibility, financial teasibility, and maximum profitability.
Maximum Productivity
Analysis of the maximum productivity value is the last stage of analysis performed by
comparing all the analysis results of the three analyzes that have been proposed. This is because
in the analysis one may not be able to match the results of the other analysis (Bone, 2006: 69;
Munizzo and Musial, 2011: 189). Thus, by benchmarking between the results of physically
Pihak BOT BTO
Investor Building on assets and / or business rights. Building on assets and / or
business rights.
Manage assets and / or business rights and
pay revenue share to the owner of the
assets and / or business rights.
Submit what has been built to the
owner of the assets and / or
business rights.
Submit the asset to the owner of the asset
and / or business right at the end of the
concession period.
Receiving revenue share from the
owner of the assets and / or
business rights during the
concession period.
Owner of the
asset
Submit the assets and / or business rights
to be managed.
Submit an asset or business right.
Gain revenue sharing Managing what investors have
built and periodically dividing
revenue.
Obtain all assets and / or business rights in
accordance with the agreement of the
investor at the end of the concession
period
Obtain all assets and / or business
rights in accordance with the
agreement of the investor at the
end of the concession period..

The Fourth International Conference on Entrepreneurship | Book Three
273
possible, legally permissible, and financially feasible analysis, final analysis can be performed
as an evaluation to determine the highest value and best use of the land.
1. Legally Permissible
2. Physically Possible
3. Financially Feasible
-
-
-
-
-
RESEARCH METHODS
Framework
Village land as village asset shoudbe used effectively and efficient in order to support village
development and social welfare. The government regulation has regulated the management of
village lands, either self-managed or managed by other parties. In the case of the involvement of
other parties, there are several concepts of cooperation that can be built through an operating
cooperation agreement (KSO). The option of the possible KSO form is the BOT or the
cooperation of building the handover as an alternative option that benefits the village side and is
also based on the limited funds owned by the village to build and utilize the village land.
In order to achive this principle, this research use Highest and Best Use (HBU) method, which
is the method that determines the most physically possible, appropriately justified, legally
permissible, financially feasible, and the highest-yielding, to the best utilization. Highest and
Best Use method in this research using 4 analysis, which are analisis legally permissible,
physically possible, financially possible, dan maximum productivity.
Figure 2. Framewok

The Fourth International Conference on Entrepreneurship | Book Three
274
Figure 3. Analysis Method
Research Appoarch
In this Research approach use applied research. The Applied research is the research included
teory application to solve certain problems ( Kuncoro, 2009:7). This applied research is a type
of research development that aims to develop village land optimally in Ketajen village,
Gedangan district, Sidoarjo
Research Location and Time
This research was conducted atKetajen village, Gedangan district, Sidoarjo. Implementation of
this research were carried out from Februay untill April 2016.
Sampling Methods
In this research using purposive sampling (taking sample randomly with certain criteria). The
main sample as key informan are Village Heads, Trade Developers, Shop Developers, one trade
manager, mismanagement manager, and local community
Data Collection Methods
Data Collection Method is done by Using 3 ways, which are interview (Indepth Interview)
observation and documentation.
Hig
hest
and
Best
Use
Me
thod
Legally Permissible
Physically Possible
Financially Feasible
ZoningLaws
Environment-related regulations
Regulation village asset management procedures
Aspects of KSO agreement and BOT requirements
Net Present Value
Interest Rate Return
Payback Periods
Maximum productivity
Property value
Possibility Indeks
Highest Values
Best utilization
Size
Location
Accessibility and Utilities

The Fourth International Conference on Entrepreneurship | Book Three
275
Table 3. Data Collection Method
No Analysis Unit Data
Type
Data
Source
Data Collection Methods
1 Legally permissible
a. Zoning laws Nominal Secondary UU Agraria 1960
Primer Interview (Head Village; Society;
Developer; Staff)
b. Environmental laws Nominal Secondary UU dan PP LH
c. Pedomanpengelolaan
kekayaan desa
Nominal Secondary UU 6/2014; Permendagri 4/2007;
village rule)
Primer Interview (head village)
d. Perjanjian KSO Nominal Secondary Draf taggrement KSO)
Primer Interview (developer of
warehouse and shop)
e. Prinsip BOT Nominal Secondary Draft BOT
Primer Interview (developer of
warehouse and shop)
2 Physically possible
a. Area size Rasio Secondary Document (the goods of
ownership of village land)
b. location Nominal Secondary Document (map)
Primer Observation
c. Accessibility and Utilities
(accomodation,
transportation, public
facilities)
Nominal Primer Interview(Developer; staff)
Primer Observation
Secondary Document
3 Financially feasible
a. Investment cost Rasio Secondary Document
Primer Interview (Developer)
b. Interest rate Rasio Secondary Document
c. Estimated operational
cost
Rasio Secondary Document
Primer Interview (developer of
warehouse/shop; Staff of
warehouse/shop)
d. Cost Estimated Rasio Secondary Document
Primer Interview (developer of
warehouse/shop; Staff of
warehouse/shop)

The Fourth International Conference on Entrepreneurship | Book Three
276
Table 4. Data Management and Data Analysis Method
No Element Formulation Feasibility
1 NPV o
n
tt
Ik
CFt
1 )1(
NPV > 0, Project proposal
accepted
2 PP
PP <Investment Assessment
Period
3 IRR i1 + (i2-i1) x IRR >Required profit level
4 PI
PI > 1
5 NP
The highest NP
1. Data Management method
The data processing is done qualitatively and quantitatively. Qualitative process is used for
nominal data, while quantitative process is used for ratio data
2. Data Analysis
Data analysis performed sequentially on every aspect and facet element
RESULT AND DISCUSSION
Analilsis Highest and Best Use (HBU)
In the analysis of Highest and Best Use (HBU) there are four feasibility to be tested: Legally
Permissible Analysis, Physically Possible Analysis, Financially Feasible Analysis and
Maximum Productivity Analysis. Based on the results obtained by researchers in the field, the
test results of each criteria are summarized in Maximum Productivity Analysis and Financially
Feasible Analysis as follows:
Table 5
No Analysis Element Usefull Result Desicion
1 Legally
permissible
Zoning laws Warehouse Feasible - Land managemen in accordance
with UU Agraria No. 5 Th 1960.
- Rights of Commercial land
management in accordance with
Local Regulation of Sidoarjo
No. 4 Th 2003 village income.
- Approval of Head Village and
BPD as well as benefit for village
Home shop Feasible
Mixed
(warehouse
and Home
shop)
Feasible
Environmental
law
Warehouse Feasible - Enviromental license in
accordance with PP No. 27 Th.
2012.
- Building and architecturein
accordance with UU No. 28 Th.
2002.
- Preparation and licenceAmdal
UKL-UPL.
- Lay out preparation / Site plan
dan Design unit.
Home shop Feasible
Mixed
(warehouse
and Home
shop)
Feasible
Guidelines
management
Village wealth
Warehouse Feasible - In accordance with UU No. 6 Th.
2014.
- The utilization of village wealth
in accordance with Permendagri
No. 4 Th 2007.
- Management of regional goods
Home shop Feasible
Mixed
(warehouse
and Home
shop)
Feasible

The Fourth International Conference on Entrepreneurship | Book Three
277
Permendagri No. 17 Th 2009.
- Cooperation of KSO, BOT for 30
tahun.
2 Physical
Possibility
Land area and
Topography
Warehouse Feasible - 25.000 m2 , 19.600 m2 physical
building, 5.400 m2fasum.
- entering the strategic area part of
f the central part of Kab.Sidoarjo
(40.81%
- the height of 3-10 m from sea,
- The highest economic potential
of the region di Sidoarjo.
Home shop Feasible
Mixed
(warehouse
and Home
shop)
Feasible
Land location
Warehouse Feasible - Entering development SSWP I
area (central of development)
- The settlement, industry and
trade area (local, regional
daninternasional).
- The position located on the zero
road.
Home shop Feasible
Mixed
(warehouse
and Home
shop)
Feasible
Easy access
Transportation
Warehouse Feasible - Availability of public
transportation, strategic area,
close to highway, railway station,
etc
Home shop Feasible
Mixed
(warehouse
and Home
shop)
Feasible
Availability of
accommodation
Warehouse Feasible - Entering the territory of the
Order group K1 is the best
accessibility area
- Availability of market,
supermarket, settelement,
medical facilities, recreation
facilities/ sport station, school,
etc
Home shop Feasible
Mixed
(warehouse
and Home
shop)
Feasible
Availability of
public facilities
Warehouse Feasible - Availability of electricity,
telephone, water supply, gas
station, house of worship,
hospital, restaurant, etc
Home shop Feasible
Mixed
(warehouse
and Home
shop)
Feasible
3 Financial
Feasibility
NPV Mixed
(warehouse
and Home
shop)
Feasible - The value of NPV on both land
has been feasible because it has
positive value, which has Rp.
27.034.646.000
PP Mixed
(warehouse
and Home
shop)
Feasible - - The PP value on both land is 16
months and shorter than the
investment period for 24 months.
IRR Mixed
(warehouse
and Home
Feasible - IRR value of 16.8% greater than
the required interest rate.

The Fourth International Conference on Entrepreneurship | Book Three
278
shop)
PI Mixed
(warehouse
and Home
shop)
Feasible - The PI value of the two fields is
1.54 so feasible as more than 1.
NP Mixed
(warehouse
and Home
shop)
Feasible - The largest NP value is in the last
period of investment ie period 24,
which is
- Rp. 4,748,455,285
Table 6. Discussion of Financial Aspects Analysis
Discussion of the Most Optimum Property Analysis Results
Based on the calculation results obtained the most optimum properties in the Village Land Use
Ketajen, District Gedangan, Sidoarjo is warehousing. This reason is because the selling price
per unit is bigger than Ruko, that is @ Rp. 3.500.000.000, - = Rp. 84.000.000.000, -.
Meanwhile, Home store Selling price per unit @ Rp. 720.000.000, - = Rp. 14.400.000.000, -. To
that end, PT. Sarana Dwi Makmur uses the concept of sales with mixed or combined with the
ratio of land area of 8: 1 for warehouse and home store. This is done to attract buyers faster.
CONCLUSION
Based on the results of research and discussion of the study of management of Village Cash
Land using Highest and Best Use Desa Ketajen, Gedangan, Sidoarjo District can be summarized
as follows:
1. Management of Village Land existing in the Village Ketajen, District Gedangan,
Sidoarjo using Highest and Best Use method can be said optimally. This looks good in
terms of legal feasibility, physical feasibility, financial feasibility, and maximum
productivity in a decent category all well from warehousing and shop construction projects.
In other words, the return on investment is very reasonable because of the very fast rate of
return. This is very beneficial for the developer or investor.
2. Based on the calculation results obtained the most optimum property in the Village
Land Use Ketajen, District Gedangan, Sidoarjo is a complex of warehousing. This is
because the warehousing complex is the most potential and appropriate land use to be
Conditions Rule Value Analysis Result
NPV NPV > 0 Rp. 27.034.646.000,- NPV is positive,
investment is feasible
IRR IRR > Specified
interest rate
16,80% IRR is bigger than
interest rate, investment
is feasible
PP Payback Period <
optimum time
16 months at the
beginning of the 24
month period
PP is faster than project
time, investment is
feasible
PI PI > 1 1,54 PI is bigger than 1,
investment is feasible
NP The biggest NP Periode 24
Rp. 4.748.455.285,-
Biggest NP in period 24

The Fourth International Conference on Entrepreneurship | Book Three
279
implemented in the research location. This condition can happen because Sidoarjo region is
fishery industry area and Gedangan sub district has wide area of land for industrial sector
bigger than other sub-district, that is 122,906 Ha (± 10% from total area of industrial area
of Sidoarjo).
3. The profit potential and the rapid return of investment value from the results of this
research, can provide initial information for prospective investors or property business
developers to glance, respond and develop opportunities management of Village Land. For
beginner or start-up business, this research can be a triger, booster that the opportunity of
cooperation with such a model, is still wide open with all the potential segments that exist
without having to exit large capital costs.
4. In the investment concept, the main aspect to be considered is the aspect of financial
feasibility (a top priority of investment consideration).
REFERENCE
Akmaluddin & Christiono Utomo. 2013. Analisis Highest and Best Use (HBU) pada Lahan Jl.
Gubeng Raya No. 54 Surabaya. Jurnal Teknik Pomits Vol. 2, No. 1, (2013): C-6-C10.
Arifin, Johar. 2008. Aplikasi Excel Untuk Perencanaan Bisnis. Jakarta: Elex Media Komputindo.
Creswell, John W. 2010. Reseach Design: Pendekatan Kualitatif, Kuantitatif, dan Mixed., Edisi
ketiga. Yogyakarta: Pustaka Pelajar.
Gunawan, Johannes. 2013. Perjanjian Di Luar KUH.PerdataPerjanjian Kerjasama Operasi dan
Kontrak Karya. Makalah disampaikan pada Pelatihan Tematik Hukum Acara Perdata
Bagi Hakim di Lingkungan Peradilan Umum, Bogor, 13 Juni 2013. Komisi Yudisial
Republik Indonesia.
Husnan, Suad & Suwarsono Muhammad. 2014. Studi Kelayakan Proyek Bisnis. Yogyakarta :
UPS STIM YKPN.
Kuncoro, Mudrajad. 2009. Metode Riset untuk Bisnis dan Ekonomi. Edisi ketiga. Jakarta:
Erlangga.
Kuncoro, Wahyu. 2015. 97 Risiko Transaksi Jual Beli Properti. Jakarta: Raih Asa Sukses
(Penebar Swadaya Grup).
Mubayyinah, Miftahul& Christiono Utomo. 2012. Analisa Highest and Best Use(HBU) Lahan
“X” untuk Properti Komersial. Jurnal Teknik ITS Vol. 1, No. 1, (Sept. 2012): D-16 – D-
19.
Munizzo, Mark A. &Lisa Virruso Musial. 2009. General Market Analysis and Highest and Best
Use. Mason, OH: Cengage Learning.
Rangkuti, Freddy. 2012. Studi Kelayakan Bisnis & Investasi. Jakarta : Penerbit Gramedia
Pustaka Utama
Setiawan, Yoga. 2015. Optimalisasi Pendapatan Tanah Kas Desa di Desa Batang Batindih
Kecamatan Rumbio Jaya Kabupaten Kampar Tahun 2009-2013. JOM Fisip, Volume 2
No. 2 Oktober 2015: 1-15.
Sugiyono. 2012. Metode Penelitian Kuantitatif, Kualitatif, dan R & D. Bandung: Alfabeta.

The Fourth International Conference on Entrepreneurship | Book Three
280
THE EFFECT OF BRAND IMAGE AND SERVICE QUALITY ON
PERCEIVED VALUE AND BEHAVIORAL INTENTION
(EMPIRICAL STUDY IN CULINARY BUSINESS UNIVERSITAS
CIPUTRA)
1Azaria Anindita Pandu’u
INDONESIA
E-mail: [email protected]
ABSTRACT
This study aims to determine the relation of brand image, service quality, perceived
value, and behavioral intention in the concentration of Culinary Business of
Ciputra University, Surabaya. The object of this research is the Culinary Business
150 students of Ciputra University who have taken the lectures for at least one year
and have filled out the questionnaire. This research uses quantitative approach
with data collection technique of Structural Equation Model (SEM) based on
variant that is statistical technique of Partial Least Square (PLS). The results of
this study indicate that the variables of brand image and service quality give effect
on perceived value variable; And perceived value variable influences behavioral
intention variable. In contrast, brand image and service quality variables do not
directly affect behavioral intention variable, but indirectly affect behavioral
intention variable which is mediated by perceived value variable. The implications
of this research are: (1) planning and curriculum development in Culinary Business
of Ciputra University; (2) planning and marketing strategy in accordance with
perceived value received by students; (3) the performance of employees in order to
provide quality services; and (4) for educational institutions as well as companies
engaged in services in taking strategic policy.
Keywords: Brand image, service quality, perceived value, behavioral intention
INTRODUCTION The high demand of Human Resources by companies in Indonesia makes people compete to
pursue the highest level of formal education. A view of 'the higher formal education can
guarantee success is inherent in the mind of society mostly. This makes private and non-private
education institutions thrive, especially in big cities. Along with the high development of formal
education, especially universities, it makes competition among universities become more
competitive.
According to the Rector of Gadjah Mada University, Sofian Effendi, in an article entitled 'The
Management of Higher Education in Facing Global Challenges' (2003), universities have two
main tasks: to educate the nation's children to master the knowledge and the sophisticated
technology, as well as to educate them to become high-moral and democratic-culture leader
candidates. Each university is required to produce graduates who not only master the academic
field, but also have qualified skills. Therefore, University of Ciputra, as a university that teaches
entrepreneurship values in each department, also contributes to prepare the next generation of

The Fourth International Conference on Entrepreneurship | Book Three
281
the nation who also has a good skill so as to compete with graduates from other universities in
Indonesia.
Ciputra University has four faculties, including Faculty of Economics, Faculty of Engineering &
Design, Faculty of Psychology, and Faculty of Tourism. As the proof of Ciputra University's
awareness of culinary business progress, Ciputra University provides a major in Culinary
Business (CB). The department has been in existence since 2011, along with the establishment
of International Hospitality & Tourism Management majors. Both majors were under the
Faculty of Economics, and then in 2014, Faculty of Tourism was established, which now covers
these two majors. In the department of Culinary Business, the students not only master the
academic field, but also are equipped with qualified skill in the culinary industry. The mission
of entrepreneurship which was initiated by Ir. Ciputra also increasingly equips the ammunition
of students who study Culinary Business at Ciputra University. From its establishment until the
batch of 2015, Culinary Business has successfully taught 392 students. The successive increase
of the 2012, 2013, and 2014 indicating the interest of prospective students to the lectures that
raised the culinary industry is more growing. The department of Culinary Business also
contributes in generating public trust in this department. It is shown by the synergy between
lecturers and students which are very strong. Students who become the members of the Students
Association (HIMA) actively make interesting events to public, so that people can feel the
lectures in the department of Culinary Business.
According to the World Trade Organization, it is mentioned that one of 12 major categories of
services, schools, universities, training, and development is included in the education services.
Culinary Business, as an educational service provider, is obliged to pay attention to the quality
of service that has been given, whether it has fulfilled customers satisfaction or not, (Tjiptono &
Chandra, 2011). The intended customers are the students who have been or are currently
studying at Culinary Business.
In recent years, many culinary schools have sprung up in Surabaya. In fact, among the new
culinary schools, some are in the area of West Surabaya, which is the area of Culinary Business
of Ciputra University. One of the ways taken in order that a company's sales is better than to its
competitors is by providing quality and prime services that meet the level of consumers interest.
Culinary Business is required to meet the needs of the students as well as the students to-be. The
emergence of several new culinary schools makes Culinary Business, as one of the institutions
teaching the culinary business, should create a different service strategy. According to
marketing.co.id, good customer service is a competitive advantage and can increase sales,
improve customer loyalty, and provide a good image to potential customers. By providing
quality services; Culinary Business students feel satisfied that they have been educated in
Culinary Business, and student candidates can choose Culinary Business as their preferred
culinary institution.
In addition to quality of service, the researcher is interested in figuring out the brand of Culinary
Business. Brand is a name, term, sign or symbol, design, color, motion, or combination of other
attributes that are expected to give identity and differentiation to foreign products. (Tjiptono,
2011) Culinary Business builds its name under Ciputra University within six years since its
establishment. Culinary Business (CB), in Indonesian, means business of culinary. Culinary
Business offers an undergraduate program that teaches about the intricacies in the culinary field
coupled with business education.

The Fourth International Conference on Entrepreneurship | Book Three
282
Consumers who have a positive image of a brand will be more likely to make a purchase.
According to Kotler and Keller (2016), creating a positive brand image requires a strong,
profitable and unique marketing program in brand memories. Consumers know the
characteristics of the product or service they buy by looking at the image of the product. When
consumers capture a positive image, then consumers will not hesitate to buy it. Therefore,
brand image becomes very important for educational institutions because if the institution is
able to provide a positive image for consumers, the institution will be more easily selected for
the to-be students. Through a brand image, Culinary Business of Ciputra University is able to
communicate its trademark to the community.
From several statements aforementioned, the research problems can be taken which include: 1)
does the brand image of Culinary Business influence perceived value?; 2) does the service
quality of Culinary Business Ciputra University affect perceived value?; 3) does Culinary
Business brand image affect the behavioral intention?; 4) does service quality of Culinary
Business Ciputra University influence behavioral intention?; 5) does perceived value influence
behavioral intention?
The purposes of this research are 1) to examine the influence of Ciputra University Culinary
Business brand image towards perceived value, 2) to examine the influence of service quality of
Ciputra University Culinary Business towards perceived value, 3) to examine the influence of
Ciputra University Culinary Business brand image towards behavioral intention, 4) to examine
the influence of Ciputra University Culinary Business service quality towards behavioral
intention, 5) to examine the influence of perceived value on behavioral intention.
RESEARCH METHODS This research applies quantitative approach; that is a research method based on the nature of
positivism, usually used to examine the population or sample first. Data collection uses research
instruments; data analysis is quantitative/statistical, with the aim to examine the predefined
hypothesis (Sugiyono, 2016). The type of research used is explanatory research which will be
used to explain the causal relationship between the variables through hypothesis testing. In this
research, there are two kinds of variables used, namely independent variables that include brand
image and service quality; and dependent variables that include perceived quality and
behavioral intention. Furthermore, in the present study, the researcher analyzes the data that
have been collected by using Structural Equation Modeling (SEM) Partial Least Square program
with Smart PLS software. SEM-PLS is a multivariate statistical technique that performs the
comparison between multiple dependent variables and multiple independent variables. PLS is
one of the SEM statistical methods designed to solve multiple regression when specific data
problems occur, such as small sample size, missing values and multicolinearity (Abdillah, 2015).
The researcher uses this model because of the structure of tiered relationships between variables,
so Smart PLS software is the most appropriate for this research.
SEM-PLS analysis usually consists of two sub models: measurement models or often called
outer models and structural model (structural models) or often called inner model (Ghozali,
2015). In the outer part of the model, the researcher analyzes the indicators that represent the
latent variables that will be measured; while in the inner model, the researcher analyzes the
influence between latent variables or constructs. SEM has two kinds of relationships between
indicators and latent variables reflective models and formative models. The reflective model
reflects that each indicator is a measurement of the error imposed on the latent variable. The
causal direction is from the latent variable to the indicator; thus, the indicators are a reflection of
the variation of the latent variables. Besides, the model of formative relationship is a causal

The Fourth International Conference on Entrepreneurship | Book Three
283
relationship coming from the indicator to the latent variables (Sarwono, 2015). The steps of
using the PLS method can be seen in Figure 1.
Figure 1. Steps of the PLS method Source: (Kurnia, 2011)
RESULT AND DISCUSSION
Result
Hypothesis Testing Result The structural model of research can be seen in Figure 2.
Figure 2. Structural model
To see the effect of independent variables to dependent variable based on t-statistic, it can be
seen in Table 1 that shows the Path Coefficient.

The Fourth International Conference on Entrepreneurship | Book Three
284
Table 1. Path coefficient on structural model testing
Original
Sample
(O)
Sample
Mean
(M)
Standard
Deviation
(STDEV)
T Statistics
(|O/STDEV|)
P
Values
Brand Image ->
Behavioral Intention
0.045 0.038 0.075 0.600 0.275
Brand Image ->
Perceived Value
0.124 0.128 0.056 2.205 0.014
Perceived Value ->
Behavioral Intention
0.689 0.675 0.089 7.742 0.000
Service Quality ->
Behavioral Intention
0.112 0.131 0.098 1.143 0.127
Service Quality ->
Perceived Value
0.749 0.749 0.050 14.911 0.000
Based on the value of Beta Coefficient and T-statistic values above, then the test results for each
hypothesis are as follows:
Hypothesis 1: Stating that Ciputra University Culinary Business brand image significantly
influences perceived value. The calculation results show that Ciputra University
Culinary Business brand image has a significant positive effect on perceived
value with beta coefficient value of 0.124 and t-value of 2.205. The better the
brand image of Ciputra University Culinary Business, the better the perceived
value those consumers receive. This means that the first hypothesis is supported.
Hypothesis 2: Stating that service quality of Ciputra University Culinary Business significantly
influences perceived value. The calculation results show that service quality
variable of Ciputra University Culinary Business has positive significant effect
to perceived value with beta coefficient value of 0.749 and t-value of 14.911.
The better service quality of Ciputra University Culinary Business, the better
the perceived value the consumers receive. Therefore, the second hypothesis is
supported.
Hypothesis 3: Stating that brand image of Ciputra University Culinary Business has no
significant effect on behavioral intention. The calculation result of brand image
variable of Ciputra University Culinary Business reveals that behavioral
intention has coefficient value of 0.045, but the shown t-value does not reach
the required number which is 1.96, so brand image variable of Ciputra
University Culinary Business has no significant effect toward behavioral
intention. Meaning that, the third hypothesis is not supported.
Hypothesis 4: Stating that service quality of Ciputra University Culinary Business has no
significant effect on behavioral intention. The calculation result of service
quality variable of Ciputra University Culinary Business shows that behavioral
intention has coefficient value of 0.112 and t-value of 1.143. The indicated
value does not reach the desired number of 1.96, so service quality variable of
Ciputra University Culinary Business does not significantly influence
behavioral intention. It means that the fourth hypothesis is not supported.
Hypothesis 5: Stating that the perceived value of Ciputra University Culinary Business
significantly influences behavioral intention. The calculation result shows that
perceived value variable of Ciputra University Culinary Business has positive
significant effect toward behavioral intention with beta coefficient value of

The Fourth International Conference on Entrepreneurship | Book Three
285
0.689 and t-value of 7,742/ The better the perceived value of Ciputra University
Culinary Business, the better the behavioral intention of the consumers. It
indicates that the fifth hypothesis is supported.
Indirect Effect Testing
In this research, there is one variable that functions as a mediation variable, namely perceived
value. With mediation variable, the value of mediation will be obtained. The mediation relation
is obtained from the multiplication of direct relationship coefficient between the first variable
and the second variable. Here is the pattern of indirect relation, in this study, and its comparison
to direct effect:
Table 2. Indirect relation and its comparison to direct effect
Indirect
Relation
The Origin of
Coefficients Value
Indirect
Coefficients
Direct
Coefficients
Total of
Effect
Brand Image ->
Behavioral
Intention
Brand Image ->
Perceived Value ->
Behavioral
Intention
0.124 x 0.689 =
0.0854
0.045 0.1304
Service Quality
-> Behavioral
Intention
Service Quality ->
Perceived Value ->
Behavioral
Intention
0.749 x 0.689 =
0.5161
0.112 0.6281
Based on the comparison table between the direct and indirect relation above, the comparison
between direct and indirect coefficients is shown. The indirect relation is the total effect of the
sum of indirect coefficients with the direct coefficients. Indirect coefficient of brand image and
behavioral intention variables compared to direct coefficients is in fact higher than indirect
coefficients. Similarly, in the comparison between service quality and behavioral intention
variables, indirect coefficients have larger numbers than indirect coefficients.
Discussion
The Effect of Brand Image Variable towards Perceived Value Based on the description of data, after conducting some methods in SEM-PLS, it is found that
there is a significant effect between brand image variable to perceived value variable. This can
be seen based on the result of t-statistic value in the table of path coefficient (in Table 1),
indicating that there is a significant positive effect between the two variables. Based on the
image of path analysis, its effects can also be seen by obtaining the coefficient values the effect
of brand image to perceived value which is 0.124. It is also in accordance with some of the
previous studies conducted by Ryu et al. (2012) Lai and friends stated that the brand image of a
company strongly affects the perceived value received by consumers, as well as to customer
satisfaction so that it becomes a key of customer loyalty. Another study conducted by Yu et al.
(2013) found the same thing that the brand image of the company has a direct effect and greatly
affect perceived value received by consumers.
Based on the three indicators studied (in Table 1) in the brand image variable, it is found that
brand characteristic has the highest value of effect, that is with the coefficient value of 0.880.
The indicator of brand association also has a fairly high coefficient value which is 0.835. It can
be interpreted that the construct of brand image can be reflected through indicator of brand

The Fourth International Conference on Entrepreneurship | Book Three
286
characteristic and brand association. While, in this research, the indicator of brand value is not
valid, so the researcher must put away the indicator.
Brand image is a dimension that strongly affects the perceived value received by consumers, yet
it must be supported by the things that have been taught by Ciputra University-Culinary
Business to the students. According to Yu et al. (2013), a company must have a positive brand
image and focus on building long-term and mutually beneficial relationships with its consumers,
as well as make consumers’ loyalty as a competitive advantage value for the company. So far,
the constraints related to brand image of Ciputra University-Culinary Business is the absence of
a strong-enough image. It is seen from how Ciputra University-Culinary Business
communicates regarding the characteristics and associations of Ciputra University-Culinary
Business brand itself to the public. One of the things that are quite striking related to the brand
association is the color similarity between Culinary Business and Psychology Department of
Ciputra University. It does look trivial, but by having specificity, then the department of Ciputra
University-Culinary Business can be more easily remembered by its customers.
Another constraint is the existence of a large gap since Ciputra University-Culinary Business
stands; in which it happened between Ciputra University-Culinary Business team and the
marketing team. Actually, there have been many efforts done in the form of breakthroughs that
have been given by Ciputra University-Culinary Business team and marketing team in order to
strengthen the brand image and bridge the gap, such as by making a powtoon video containing
about learning in Ciputra University-Culinary Business, Instagram social media use controlled
directy by the department, and many other things. However, the perception of respondents who
have been studying for about one year (class of 2012, 2013, and 2014) in Ciputra University-
Culinary Business still feel that what the respondents have heard before entering Ciputra
University-Culinary Business is different from what they received in Ciputra University-
Culinary Business.
In this case, Ciputra University-Culinary Business is expected to communicate brand
characteristic and brand association best to avoid any gap between consumer perception before
entering Ciputra University-Culinary Business and perceived value that will be accepted by
consumers later. The name of Ciputra University-Culinary Business which is easy to remember,
the education which is known having good quality, brand color and learning system prioritizing
creativity becomes the components that reflect the indicators.
The Effect of Service Quality Variable towards Perceived Value Based on this research, it is found that service quality significantly influences perceived value. It
can be seen from the t-statistic result (on Table 1) revealing that service quality has significant
effect on perceived value. The same thing can be seen from the image of path analysis, in which
its coefficient value from the effect of service quality to perceived value is 0.749. The value is
the highest value of effect compared to the influence among other variables in this research
model.
In the variable of service quality itself, the researcher uses five SERVQUAL indicators found in
1988, (Zeithaml & Parasuraman, 2014). Numerous studies have used these indicators to assess
service quality in many industry sectors; so that the indicator of the service quality variable is a
formative variable, in which in order to reflect a quality service, then the five indicators should
be achieved well. In this research, in fact, it is found that there is one invalid indicator that is
indicator X2.2 empathy; but the researcher keeps these five formative indicators, and concludes
that the empathy does not significantly affect the service quality construct and still tests the

The Fourth International Conference on Entrepreneurship | Book Three
287
indicators in the structural model. The research conducted by Xu et al (2009) revealing that
SERVQUAL indicators were used as well as formative indicators. When looking at the validity
test results of these indicators, it was found that the weight and t-statistical significance of some
indicators, such as assurance, empathy, and tangible, were also invalid. Abdillah (2015: 225)
states that in the formative indicators, the invalid indicators are better not to be used. However,
if those can cause construct become meaningless and the research lose its research aim base,
then theoretically the construct still can be tested in structural model.
Although there are negative indicators, it does not affect the coefficient value of service quality
effect on perceived value. The findings in this study also support previous studies. Based on two
previous studies that examine and find the same result, it stated that there is a very significant
influence of service quality variables on perceived value received by consumers. The first study
was found in a journal written by Raza et al. (2012), who found that a good quality of service
extremely affected perceived value. The same thing is also found in other studies, that a
company should be able to manage the quality of service very well because it will affect the
perceived value received by consumers. (Yu et al , 2014) If the consumers already have a
certain expectation and the company has not been able to provide it, then perceived value
received by consumers will be negative. The problem of service quality from Ciputra
University-Culinary Business is related to kitchen facilities. Actually, Ciputra University-
Culinary Business has a complete kitchen facilities, but in order that the students can practice
hands-on freely, culinary studio is usually used (especially for batch which being researched).
Culinary studio itself has 12 stalls, where each stall is equipped with very-adequate kitchen
equipment.
The number of students in one batch is 60-100 students, so the lecturer usually has to divide the
culinary studio usage schedule into two to four in each batch; it all depends on the number of
students in the batch. One stall consists of 4-6 people, in which number is not ideal. The ideal
number for students in one stall is 2-3 people, so each student can share the assignment in mise
en place until the stall returns as clean as before. In one practice, the students need
approximately 4 - 5 hours; so that in 4 days of effective lecture (excluding Wednesday), kitchen
is used by 4 semesters with varying number of students. The addition of kitchen facilities is very
important because it directly affects the perceived value of students. Moreover, the use of
kitchen now must be divided by the specialization of International Hospitality & Tourism
Business of Ciputra University, so that Ciputra University-Culinary Business students’ needs for
kitchen facilities are in an urgent state.
The Effect of Brand Image Variable towards Behavioral Intention The result of t-statistic shows that brand image does not give direct effect on behavioral
intention. In addition, the result of the path analysis diagram is the same, that it obtained the
coefficient value from the effect of brand image on behavioral intention is only 0.045. It is
contrasting with previous studies which stated that there is a significant effect of brand image on
behavioral intention. The previous relevant research related to the effect of brand image on
behavioral intention conducted by Ryu et al. (2011) found that brand image indirectly affects
the behavioral intention in the culinary industry. However, he did not conduct a research about
the relationship between the effects of brand image towards behavioral intention directly. There
are several factors that make a difference in the results of research with previous studies. The
main factor is that previous research concerned on different industries with this research.
Previous research examines commercial firms, which are the hospitality industry and the
wireless communications industry. It is extremely different from the object of this study which
focuses on the effect of brand image on behavioral intention in education. The second factor that

The Fourth International Conference on Entrepreneurship | Book Three
288
leads to the difference of research is that in this study, the behavioral intention theory studied
focuses on the post purchase, so that it is different from previous studies that discuss about
behavioral intention in general. Thirdly, the thing that influences the difference of research is
that the sample of this research comes from a very heterogeneous background, so that the
possibility of perception of brand image in each student can be different as well. In the present
research, taking Culinary Business students as the research objects, who have different
backgrounds, would have an impact on many differences of perceptions had by each student in
perceiving Ciputra University-Culinary Business image. It is indicated by this research data that
brand image indirectly affects the variable of behavioral intention mediated by the variable of
perceived value.
For Ciputra University-Culinary Business students themselves who have attended Culinary
Business, they feel that the effect of brand image on behavioral intention is also less significant.
Different things happen if perceived value is there as a mediation variable, then the brand image
itself will have more effects on behavioral intention indirectly; because the students themselves
have obtained values from Ciputra University-Culinary Business directly, so it affects students’
behavioral intention.
The Effect of Service Quality Variable towards Behavioral Intention The findings of this study reveal that service quality variable does not directly affect behavioral
intention. It is shown by the quantity of the existing non-qualified t-statistic results and the path
analysis diagram also shows the same thing. The coefficient value is 0.112. However, the other
finding is that service quality indirectly affects behavioral intention. It can be seen that service
quality needs to be mediated with perceived value variable, so that it can have higher effect on
behavioral intention.
The findings of this study are in line with previous research conducted by Jankingthong &
Gonejanart (2012) stating that service quality has an indirect effect on behavioral intention;
while, the previous study found that not all service quality dimensions affect repurchase
intention (In this case it is an indicator of behavioral intention). Only three dimensions that
affect repurchase intention, namely the dimensions of reliability, empathy, and tangible. This
difference occurs because of industry differences of the researched objects. The second reason
that influences the difference of research is that the sample of this research is taken from a very
heterogeneous background, so that the perception possibility of service quality in each student
can be different as well.
The results of research on Ciputra University-Culinary Business students show that it will affect
student behavioral intention indirectly. The students obtain the values of service quality first in
perceived value, only then it can affect students’ behavioral intention; because service quality
itself is an evaluation of the service quality that students get during this time, while students are
able to determine their attitude in behavioral intention after perceiving values received by
students (perceived value). If compared to brand image, service quality is slightly more
influential on behavioral intention.
The Effect of Perceived Value Variable towards Behavioral Intention The findings got from t-statistic show that the perceived value variable significantly affects the
behavioral intention. Based on the path analysis diagram, coefficient value obtained from the
effect of perceived value on behavioral intention is 0.689. The perceived value variable in this
study is also a mediator variable that mediates the brand image and service quality variables
towards the behavioral intention variable. There are two indicators in the behavioral intention

The Fourth International Conference on Entrepreneurship | Book Three
289
that are not examined: firm switching and native word of mouth. It comes to the confusion of the
students, so that the results obtained are invalid. The students feel unable to do these negative
things because it is not easy for those who have entered Ciputra University-Culinary Business to
move to other universities or other educational institutions and also give negative testimony
about Ciputra University-Culinary Business, while the students themselves still study there.
The effects of these two variables support previous research which is the research conducted by
Chaohui et al. (2012). The research found that perceived value, received by the tourists who
come to Shanghai World Expo, affects significantly on behavioral intention of tourists in the
future. Ciputra University-Culinary Business should provide things that meet the needs of
consumers, and then it will affect the behavioral intention of consumers themselves. Another
study was conducted by Zhuang et al. (2010). In that research, the researchers divided perceived
value into two variables, namely acquisition utility and transaction utility. In the study, only
acquisition utility significantly affects behavioral intention. The acquisition utility is an
evaluation of what consumers receive and what consumers pay.
Based on the description of the perceived value variable itself, the lowest mean value is in the
Y1.4 indicator regarding functional value (price). Ciputra University-Culinary Business students
found that what they have received so far during their learning process in Ciputra University
greatly affects their behavioral intention. For students who are satisfied with what they get at
Ciputra University-Culinary Business, the students will do a positive behavioral intention,
which is by talking positive things about Ciputra University-Culinary Business to others, to be
loyal to CB-UC by recommending such partnership around him, and also invites his siblings to
study at CB-UC.
CONCLUSION
From the results of research conducted, the conclusions of this study include: 1) Variable of
brand image significantly affects the variable of perceived value received by students at Ciputra
University Culinary Business, 2) Variable of service quality significantly affects the perceived
value variable received by students in Ciputra University Culinary Business, 3) Variable of
brand image has no significant effect on behavioral intention variable; but it indirectly affects
the behavioral intention variable mediated by perceived value variable in Culinary Business of
Ciputra University, 4) Service quality variable has no significant effect on behavioral intention
variable; but it indirectly affects behavioral intention mediated by variable of perceived value at
Culinary Business of Ciputra University, 5) Variable of perceived value significantly affects
behavioral intention variable at Culinary Business of Ciputra University.
REFERENCES
Abdillah, W. & Jogiyanto. (2015). Partial Least Square – Alternatif Structural Equation
Modelling (SEM) dalam Penelitian Bisnis. Yogyakarta: Penerbit Andi.
Chaohui, W., et al. (2012). Impact of Tourists′ Perceived Value on Behavioral Intention for
Mega Events: Analysis of Inbound and Domestic Tourists at Shanghai World Expo.
Chinese Geographical Science, 22(6).
Ghozali, I. & Latan, H. (2015). Partial Least Squares: Konsep, Teknik dan Aplikasi
Menggunakan Program SmartPLS 3.0. Semarang: Badan Penerbit Universitas
Diponegoro.
Jankingthong, W. & Gonejanart, P. (2012). The Relationships of Factors Affecting Post-
purchase Behavioral Intentions in Tourism Sector. Silpakorn University of Journal
Sciences, Humanities, and Arts, 12(1), 72-90.

The Fourth International Conference on Entrepreneurship | Book Three
290
Kotler, P & Keller. (2016). Marketing Management. India: Pearson India Education Service Pvt.
Ltd.
Kurnia, N. (2011). Model Hubungan Tacit Knowledge dan Kinerja Individu pada Balai Riset
dan Standardisasi Industri. Depok: Universitas Indonesia.
Raza, M.A., et al. (2012). Relationship Between Service Quality, Perceived Value, Satisfaction
and Revisit Intention In Hotel Industry. Interdisciplinary Journal Of Contemporary
Research In Business, 4, 788-805.
Ryu, K., et al. (2011). The Influence Of The Quality Of The Physical Environment, Food, And
Service On Restaurant Image, Customer Perceived Value, Customer Satisfaction, And
Behavioral Intentions. International Journal of Contemporary Hospitality Management,
24(2), 200-223.
Sarwono, J & Nurimawati, U. (2015). Membuat Skripsi, Tesis, dan Desertasi dengan Pasrtial
Least Square SEM (PLS-SEM). Yogyakarta: Penerbit Andi.
Tjiptono, F. (2014). Pemasaran Jasa. Jakarta: PT. Gramedia Pustaka Utama.
Tjiptono, F & Chandra, G.(2011). Service, Quality & Satisfaction. Yogyakarta: Penerbit
Andi.
Xu, D.J., et al. (2009). The Effect of Perceived Service Quality, Perceived Sacrifice and
Perceived Service Outcome on Online Customer Loyalty. ICIS 2009 Proceedings. 175.
Yu, H. S., et al. (2014). Service Quality, Perceived Value, Customer Satisfaction, and
Behavioral Intention Among Fitness Center Members Aged 60 Years and Over. Social
Behavior and Personality, 42(5), 757-768.
Zeithaml, V. & Parasuraman, A. (2004). Service Quality. Massachusetts: Marketing Science
Intitute.

The Fourth International Conference on Entrepreneurship | Book Three
291
ANALYSIS OF CONSUMER BEHAVIOR IN CHOOSING RICE
PACKAGING OF BRANDS
“ALAMI, PAK TANI AND PADI” (COSE STUDY AT RAHMA
JAYA STORE MOJOKERTO CITY).
1Budi Utomo, 2Muri Hardiyanto, 3Sri Purwanti
1-2Faculty of Agriculture University Mayjen Sungkono Mojokerto
3Faculty of Agriculture University Merdeka Surabaya
INDONESIA
Emails: [email protected], [email protected], [email protected]
ABSTRACT
The general target policy as well as the specific direction of agricultural
development strategies developed through the modernization of agriculture,
with modernization expected to increase productivity and farmer income,
which in turn will reduce the gap between farmers. The modernization of
agriculture is manifested through the linkage of business, namely the
existence of big business cooperation (modern) and small (traditional)
business. The linkage of business in the agricultural sector is described in
the form of agroindustry and agribusiness. This research tries to do
emphasized on analysis of consumer behavior of rice packaging which is
liked and have high market share in mojokerto city and consumer tendency
to consume certain kind of rice in the future.
Research purpose: 1) Identifying the characteristic of end consumer
packaging rice includes the aspect of brands ( Alami, Pak tani and padi) in
Rahma Jaya store at Mojokerto city. 2) Analyzing the dominant factors
that affect the behavior of end consumers (price, quality, distance, service
and packaging) to buy rice packaging at Rahma Jaya store Mojokerto city.
The basic method of this research is Fishbein Model. The data presented in
the form of symbols that representing final consumer attitude buyers of a
product or brand products. Data Analysis used in this research is the
analysis of Fishbein Model. 1) Incorporate a scoring table on every
questioner drawn from respondents to be analyzed. 2) Analyzing the
attitude of each respondent per brand product. 3) Creating a marketing
strategy for the product after learning the value attitude of the analysis
results Fishbein method.
The results showed: The behavior of consumers towards the brand
packaging rice Alami, Pak Tani and Padi gain biggest selection portion of
100 (one hundred) respondents are trademarks Pak Tani are based on the
total attitude score (bi x ei) amounted to 48.59 with Intresprestsi brand
likes. Second Ranked is Padi brand with the total value (bi x ei) amounted
to 45.66 with Interpretation Regular, Alami brand followed by the total
value (bi x ei) amounted to 43.04 Interpretations is unfavorable.
Analysis model of Fishbein of the trust and evaluation of consumer
attitudes on packing rice produce several strategies to increase products
sales based on the results of research and discussion can be concluded as :

The Fourth International Conference on Entrepreneurship | Book Three
292
1) The product of Pak Tani packing rice obtained by total value based on
attitude toward object on the basis of Trust Value and its Evaluation is
equal to (48.59) with Interpretation of Very Likes, Padi Brand Product
obtained by total value (45.66) with Interprestasi Likes and followed by
Alami Brand Product with Total value of (43.04) with Average
Interpretation Only. Thus product Brand Pak Tani is the Brand of the most
in demand by Consumers compared with the Second Brand Other Rice
Packaging Products. 2) Consumer packaging rice Alami Brand, Pak Tani
and Padi, have different behavior based on attitudes toward the object
(consumer fanaticism), the dominant factor affecting End Consumer
Behavior on Packaging Rice Product First is Brand Pak Tani with
Interpretation Very Likes to Attribute of Quality (15.55), and Likes to Price
and Service respectively (9,98) and (8,33), Second order of Padi Brand
with Interprestasi Likes to attribute Quality, Price and Service,
respectively (12 , 02), (10,15) and (10,06) and followed by Alami Brand
with Interpretation of Very Likes to Price attribute (14,69), and Likes to
Quality attribute (11,18).
Keywords: Consumer behavior
INTRODUCTION
The general target policy as well as the specific direction of agricultural development strategies
developed through the modernization of agriculture, with modernization expected to increase
productivity and farmer income, which in turn will reduce the gap between farmers. The
modernization of agriculture is manifested through the linkage of business, namely the existence
of big business cooperation (modern) and small (traditional) business. The linkage of business
in the agricultural sector is described in the form of agroindustry and agribusiness (Rustiani,
1995).
Agribusiness systems are grouped into sub-systems of production facilities, sub-farming
systems, sub-processing systems, and marketing sub-systems. Successful development of
agribusiness system depends on the effort to integrate the linkage between agribusiness actors in
each sub-system.
Agribusiness actors in Indonesia can be structurally divided into 2 groups. First, the
agribusiness system is played by big companies, state-owned and private companies that have
characteristics of high technology use, large capital, and good managerial skills. Second, small-
scale agro-business actors dominated by small farmers characterized by various resource
constraints, including: nature, capital, the use of simple technology, and inadequate managerial
capabilities, and with limited access to markets and information technology.
In the era of globalization, Indonesia can not be separated from the influence of information,
culture and technology of developed countries, with increasing economic growth in Indonesia,
resulting in changes in consumption patterns, especially rice in big cities. Rice is the main food
commodity of the people of Indonesia, its needs in all regions will increase as the population
will increase annually.
Rice consumption is a potential market share, can be an indicator of the demand for rice
packaging market, both in terms of quality and diversity of products of interest. The tendency of
consumers to use products that are practical, inexpensive and have sufficient nutritional value
and fast service, now become the lifestyle of the community.
The importance of rice can not be denied as the main staple food in this country with the
participation rate of rice consumption reaches about 95% meaning 95% of households in
Indonesia consume rice, this participation rate certainly varies from one region to another
(Amang, 1995).

The Fourth International Conference on Entrepreneurship | Book Three
293
Various brands of rice are offered in the market, as well as various attributes attached to each
brand, resulting in the consumer rice packaging determines the attitude of choice, to buy the
brand of rice packaging. Rice packaging products in the city of Mojokerto have quite a lot of
variety and kinds, among others: Alami brands, Pak Tani, Semar Bagong, Padi, Putri Bulan,
Putri Biru, Tawo, Lele, Lumbung Padi and many other brands.
Consumer behavior is influenced by four main factors, namely 1) Cultural factors consist of
culture, class sausage, sub culture; 2) Social factors consist of reference group, family, role and
status; 3) Personality factors consist of age and life cycle, occupation, state of the economy,
lifestyle, personality and self-concept; 4) Psychological factors consist of motivation,
achievement, knowledge, belief and attitude (Kotler and Armstrong, 1997).
This research activity tries to do research which emphasized on analysis of consumer behavior
of rice packaging which is liked and have high market share in mojokerto city.
On the basis of this background, the research of Consumer Behavior Analysis in Selecting Rice
Packaging Brand "Alami, Pak Tani dan Padi" (Case study at Rahma Jaya Store Mojokerto City)
is important to do.
Problem formulation
Based on this background then the authors can formulate the formulation of research problems
as follows :
1. What are brands of merchandise most preferred by consumers (Brand "Alami, Pak Tani and
Padi") ?
2. What are the dominant factors that influence the behavior of end consumers to buy rice
packaging in Mojokerto City ?
Research purposes
The purpose of this research is to :
1. Identifying the characteristics of end-consumer rice packaging includes aspects of brands
(Alami, Pak Tani and Padi) in Rahma Jaya store Mojokerto city.
2. Analyzing the dominant factors that affect the behavior of the end consumer (price, quality,
packaging, service and distance) to buy rice packaging at Rahma Jaya Store Mojokerto City.
RESEARCH METHODS
This research was conducted in Rahma Jaya Store in Mojokerto City, which was chosen
purposively because, from several shops selling rice packaging in Mojokerto City, Rahma Jaya
Store is a store that is located very strategically and willing to be a place or object of research, It
sells rice packaging brand Alami, Pak Tani, and Padi.
Implementation Research conducted in June - July 2016, Determination of respondents done
randomly (random sampling), This study determines the number of Respondents limit is as
much as 100 respondents. The selected respondents are Consumers who are aiming to buy rice
packaging of Alami Brand, Pak Tani and Padi, in Rahma Jaya store to be consumed.
Respondents are not limited by age, sex, status and occupation, because all respondents who
actually buy rice packaging of Alami Brand, Pak Tani and Padi, will be given the questions that
have been prepared by the researchers.
The method used in this research is Fishbein Model research method. The data presented in the
form of symbols that represent the attitude of the end buyer consumer of a product or product
brand. Analysis of data used is Fishbein Model Analysis, with stages: 1) Include a table of
scores in each Questionnaire taken from the respondent to be analyzed to Model Fishbein, 2)
Analyze the attitude of each respondent per product brand. 3) Create a marketing strategy to the
product after knowing the value of Attitude from the analysis of Fishbein method (Engel et. al,
1993) in (Sudiyarto, 2009).

The Fourth International Conference on Entrepreneurship | Book Three
294
According to Engel et. al, (1993), the Fishbein model illustrates that consumer attitudes toward
a product or brand of a product are determined by two things: 1) Confidence in the attributes of
a product or brand (bi component) and 2) Evaluation of the importance of the attributes of the
product (Compound ei). This model is used to evaluate consumer attitudes toward products with
the following formula :
Where :
Ao = Attitude towards an object
Bi = Strength of confidence that the object has attribute i
Ei = Evaluation of attribute i
N = Number of attributes owned by the object (which stands out)
The attributes of rice packaging in this study are :
1. Price
2. Quality
3. Product attractiveness / Impression on (packaging)
4. Service
5. Mileage
From the results of the analysis is expected to provide a picture of consumer attitudes toward
packaging rice consumed and the factors taken into consideration to decide to buy the product.
Consumer attitudes and behaviors will provide an overview and characteristics of rice
packaging consumers, so it can be one of the considerations in determining the marketing
reference that includes the marketing mix in accordance with local environmental conditions,
and can be an important direction in determining alternative marketing policies.
1. Attribute Variables
The variables in this study are divided into 2 (two) variables, the first is the strength of the belief
that rice packaging products of Alami Brand, Pak Tani and Padi, have the five attributes. Each
respondent is asked to express the trust attitude to the question whether rice packaging of Alami
Brand, Pak Tani and Padi, has attribute 1) Price 2) Quality 3) Package 4) Service and 5)
Distance. In this study respondents were asked to express their belief in five points 1) Strongly
disagree, 2) Disagree, 3) Neutral, 4) Agree and 5) Strongly agree. The average score of each
variable will be used to calculate the Fishbein Multiattribute Attitude Model score. The table
scores are as follows :
bi = Strength of Confidence on packaged rice products, including:
Table 1. Score Strength of Faith Against Objects
NO RESPONDENT NAME SCORES FACTS
1 A 1 Strongly disagree
2 B 2 Disagree
3 C 3 Neutral
4 D 4 Agree
5 E 5 Strongly agree
Ao =

The Fourth International Conference on Entrepreneurship | Book Three
295
The variable for the second group is the evaluation variable of the five product attributes
(variable ei), which consists of five questions: 1) Price 2) Quality 3) Packaging 4) Service and
5) Distance. Each respondent is asked to state his or her evaluation attitude in 5-digit scale,
ranging from 1) Very Unimportant, 2) Unimportant, 3) Neutral, 4) Important and 5) Very
Important. Questions to measure : ei = The evaluation element of packaging rice products.
Table 2. Score Strength of Evaluation on Objects
NO RESPONDENT NAME SCORES FACTS
1 A 1 Very unimportant
2 B 2 Not important
3 C 3 Neutral
4 D 4 Important
5 E 5 Very important
RESULTS AND DISCUSSION
A. Characteristics of Consumer Rice Packaging in Mojokerto City
Based on the results of the consumer rice packaging survey of 100 respondents who are the final
consumers of the packaging rice of the Alami Brand, Pak Tani and Padi, will be able to provide
an overview of the packaging rice products of the prominent attributes possessed by the product
either the tangible form of the product Such as packaging, price, and quality, as well as the
unreal, such as impressions, consumers of price, quality, packaging, and convenience factor to
get goods, store service and consumer satisfaction when consuming rice packaging products
with a particular brand.
The result of the research on 100 respondents shows that the most popular rice packaging
product is Pak Tani packed rice. This is caused by rice packing Pak Tani brand is well known
by consumers of the attributes that are owned and also known as the quality in accordance with
the price.
More details of the order of rice packaging product brands favored by Respondents in Rahma
Jaya store can be seen in Table 3 below :
Table 3. Percentage of Rice Product Brand Consumed by Respondents at Rahma Jaya
store Mojokerto City.
NO BRAND AMOUNT PROSENTASE
1 ALAMI 24 24 %
2 PAK TANI 44 44 %
3 PADI 32 32 %
TOTAL 100 100 %
Data source : Primary data processed in 2016

The Fourth International Conference on Entrepreneurship | Book Three
296
Consumer Behavior of Rice Packaging at Rahma Jaya store Mojokerto City in consuming rice
packaging product gives priority to several things namely Price, Quality, Service Store,
Packaging and Ease / Distance to get the product. From 100 Respondents, the brands most
preferred by consumers are Pak Tani (44%), followed by Padi (32%) and the last is Alami
(24%), can be presented in Figure 1.
Figure 1. The percentage of selected rice packaging product brands consumer of Rahma
Jaya Store in Mojokerto City.
According to Swastha and Handoko (2000), Consumer decision making in purchasing a product
or product is influenced by three factors, that is consumer itself, environment and marketing
strategy which can be explained in Figure 2
Figure 2. Model of consumer decision making
Table 4. Percentage of preferred aspect in consuming rice based on product brand.
Brand Aspect Product (%)
Price Quality Mileage Service Packaging
Alami 14.69 11.18 3.66 7.78 5.74
Pak Tani 9.98 15.55 7.25 8.33 7.48
Padi 10.15 12.02 6.55 10.06 6.88
TOTAL 11.61 12.92 5.82 8.72 6.70
Data source : Primary data processed in 2016

The Fourth International Conference on Entrepreneurship | Book Three
297
In Table 4. It can be explained that from the three brands of products (Alami, Pak Tani and
Padi), it is found that the preferred aspect of consuming rice based on the distribution of rice
packaging product brands is the consumer of quality attribute aspect, with the total percentage
of (12.92) Then followed by price attribute, with the total percentage of (11.61), in consuming
the preferred rice is the quality of the rice itself, because with good quality will be produced
tasty rice in accordance with the tastes or expectations of consumers, resulting in consumers
Easily switch to other brands, because the suitability of the quality of the product. While the
price attribute selected by the consumer as a determinant of the second priority aspect because
the price is positively correlated with the quality. The service attributes, packaging, and mileage.
do not become a priority problem in influencing the purchase of certain brands of rice.
B. Consumer Attitudes to Rice Packaging
Based on the results of the analysis on consumer behavior of rice packaging products at Rahma
Jaya store in Mojokerto city which gives a response on the value of trust and evaluation product
of packaging rice attribute on consumer attitudes can be presented in Table 5 and 6. In this
Table can describe that consumer behavior for the attribute of rice packaging products Which
strikingly based on the highest value of the respondent's trust on product attributes is the Quality
factor becomes the first priority, while the Price becomes the second priority. Other factors such
as store service, packaging and mileage, received less attention from consumers. The product of
Pak Tani packing rice has the highest attitude (15.11) to the highest object (15.11) compared to
2 (two) other brands that are (Padi and Alami). While the brand of Alami has trust value to
attribute the most interest is Price factor (3,79), and brand of Pak Tani and Padi have trust value
to attribute the most interest is the Quality factor, respectively (3,91) and (3,38) .
In accordance the opinion of Richard Oliper and James G. Barnes, (2001) in Sudiyarto, (2009),
Stating that customer satisfaction is actually a response given by the customer for the fulfillment
of needs, to gain comfort.
Table 5. The Value of Trust and Attribute of Rice Packaging Product of Alami Brand,
Pak Tani and Padi at Rahma Jaya Store Mojokerto City.
Product Attribute Trust (bi)
Alami Pak Tani Padi
Price 3.79 3.11 3.09
Quality 3.08 3.91 3.38
Mileage 2.04 2.64 2.69
Service 2.67 2.84 3.13
Packaging 2.46 2.61 2.75
Attitude To Object (Ao) 14.04 15.11 15.03
Data source: Primary data processed in 2016
Table 6. Evaluation Value of Trust and Attribute of Rice Packaging Product of Alami
Brand, Pak Tani and Padi at Rahma Jaya Store Mojokerto City.
Product Attribute Evaluation (ei)
Alami Pak Tani Padi
Price 3.88 3.20 3.28
Quality 3.63 3.98 3.56
Mileage 1.79 2.75 2.44
Service 2.92 2.93 3.22
Packaging 2.33 2.86 2.50
Attitude To Object ( Ao ) 14.54 15.73 15.00
Data source: Primary data processed in 2016

The Fourth International Conference on Entrepreneurship | Book Three
298
The level of consumer confidence in the product attributes is the value of the consumer response
to the product where the attributes are viewed from one by one. Meanwhile, to see the overall
attitude of trust consumers in a product can use Fishbein model analysis which means consumer
attitude towards the object as a whole.
Attitudes toward the object of all respondents of rice packaging products indicate that the rice
packaging products of Pak Tani brands are more in demand by consumers seen from the
Attitude value toward Fishbein Model Object. Here are the Fishbein model calculations for the
entire Product per brand:
1. Attitude Analysis of Fishbein
The value of interpretation based on the attributes possessed by the product illustrates that the
importance of an attribute to influence the process of the occurrence of transactions by
consumers based on the value of trust and evaluation. Can be seen in tables 7, 8, and 9.
Table 7. The Value of Attitude Analysis and Interpretation of Alami Brand.
N
O
ATTRIBUTE
S TRUST (bi)
EVALUATIO
N (ei) bi x ei
INTERPRETATIO
N
1 Price 3.79 3.88 14.69 Very like
2 Quality 3.08 3.63 11.18 Likes
3 Mileage 2.04 1.79 3.66 Ordinary
4 Service 2.67 2.92 7.78 Ordinary
5 Packaging 2.46 2.33 5.74 Ordinary
TOTAL 43.04 Ordinary
Data source: Primary data processed in 2016
Table 8. Values of Attitudes and Intresprestasi of Pak Tani Brand.
N
O
ATTRIBUTE
S TRUST (bi)
EVALUATIO
N (ei) bi x ei
INTERPRETATIO
N
1 Price 3.11 3.20 9.98 Likes
2 Quality 3.91 3.98 15.55 Very like
3 Mileage 2.64 2.75 7.25 Ordinary
4 Service 2.84 2.93 8.33 Likes
5 Packaging 2.61 2.86 7.48 Ordinary
TOTAL 48.59 Very like
Data source: Primary data processed in 2016
Table 9. Values of Padi Attestation and Intractprestasi Analysis
N
O ATTRIBUTES TRUST (bi)
EVALUATIO
N (ei) bi x ei
INTERPRETATIO
N
1 Price 3.09 3.28 10.15 Likes
2 Quality 3.38 3.56 12.02 Likes
3 Mileage 2.69 2.44 6.55 Ordinary
4 Service 3.13 3.22 10.06 Likes
5 Packaging 2.75 2.50 6.88 Ordinary
TOTAL 45.66 Likes
Data source: Primary data processed in 2016

The Fourth International Conference on Entrepreneurship | Book Three
299
Description Ring score :
3.66 s / d 7.99 is Unusual
8.00 to 12.30 is Likes
12,40 s / d 16,00 is very like
Table 10. Attitude Value (Ao) Alami Brand, Pak Tani and Padi by Attribute.
Product
Attribute
Trust (bi) Evaluation ( ei ) Attitude (Ao)
Alami
Pak
Tani Padi Alami
Pak
Tani Padi Alami
Pak
Tani Padi
Price 3.79 3.11 3.09 3.88 3.20 3.28 14.69 9.98 10.15
Quality 3.08 3.91 3.38 3.63 3.98 3.56 11.18 15.55 12.02
Mileage 2.04 2.64 2.69 1.79 2.75 2.44 3.66 7.25 6.55
Service 2.67 2.84 3.13 2.92 2.93 3.22 7.78 8.33 10.06
Packaging 2.46 2.61 2.75 2.33 2.86 2.50 5.74 7.48 6.88
Attitude To
Object (Ao) 14.04 15.11 15.03 14.54 15.73 15 43.04 48.59 45.66
Data source: Primary data processed in 2016
Table 11. Interpretation Based on Alami Brand, Pak Tani and Padi.
NO ATTRIBUTE bi x ei Alami
Interpretations bi x ei
Pak
Tani
Interpretations bi x ei Padi
Interpretations
1 Price 14.69 Very Likes 9.98 Likes 10.15 Likes
2 Quality 11.18 Likes 15.55 Very Likes 12.02 Likes
3 Distance 3.66 Ordinary 7.25 Ordinary 6.55 Ordinary
4 Service 7.78 Ordinary 8.33 Likes 10.06 Likes
5 Packaging 5.74 Ordinary 7.48 Ordinary 6.88 Ordinary
Attitude To Object
( Ao ) 43.04 Ordinary 48.59 Very Likes 45.66 Likes
Data source: Primary data processed in 2016
Description Ring Score:
3.66 s / d 7.99 is Unusual
8.00 to 12.30 is Likes
12,4 s / d 16,00 is very like
Based on the results of Fishbein model analysis in Table 10 it can be explained that from the
three brands of packaged rice products (Alami brands, Pak Tani, and Padi), the brands most
preferred by consumers based on attitudes toward the object on the basis of trust and evaluation,
the first is Pak Tani With the value (48.59), the second brand of Padi with value (45.66), and
followed by Alami brand with value (43.04), can be shown in Figure 3.

The Fourth International Conference on Entrepreneurship | Book Three
300
Figure 3. Interprestasi Value by Brand.
According to Mowen and Minor in Lina Salim (2002), Defining that consumer attitude toward
the brand is studying consumer to evaluate the brand either it’s liked or not liked constantly. In
the other word consumers evaluating certain brand. From the worst to the best.
In Table 11 in terms of the order of attributes based on the brand it can be explained that the
first order is Pak Tani brand with Interprestasi is very fond of the quality attributes (15.55),
likes to price and service respectively (9,98) and (8, 33), second order of Padi brand with
Interprestasi likes to quality, price and service, respectively (12,02), (10,15) and (10,06) and
followed by Alami brand with Interprestasi very like to attribute price ( 14,69), and likes to the
quality attribute (11,18), can be shown in figure 4.
Figure 4. Graph of Trustworthiness (bi) and Consumer Evaluation (ei) Based on the
Alami Brand Attribute, Pak Tani and Padi.
CONCLUSIONS
Based on the results of research and discussion can be concluded as follows :
1. The product of Pak Tani packing rice obtained by total value based on attitude toward object
on the basis of Trust Value and its Evaluation is equal to (48.59) with Interpretation of Very
Likes, Rice Brand Product obtained by total value (45.66) with Interprestasi Likes and

The Fourth International Conference on Entrepreneurship | Book Three
301
followed by Alami Brand Product with Total value of (43.04) with Average Interpretation
Only. Thus Product Brand Pak Tani is the Brand of the most in demand by Consumers
compared with the Second Brand Other Rice Packaging Products.
2. Consumer packaging rice Alami Brand, Pak Tani and Padi, have different behavior based on
attitudes toward the object (consumer fanaticism), the dominant factor affecting End
Consumer Behavior on Packaging Rice Product First is Brand Pak Tani with Interpretation
Very Likes to Attribute of Quality (15.55), and Likes to Price and Service respectively (9,98)
and (8,33), Second order of Padi Brand with Interprestasi Likes to attribute Quality, Price
and Service, respectively (12 , 02), (10,15) and (10,06) and followed by Alami Brand with
Interpretation of Very Likes to Price attribute (14,69), and Likes to Quality attribute (11,18).
REFERENCES
Amang. 1995. National Food Policy, Dharma Karsa Utama, Jakarta.
Engel, James F., Roger D. Blackwell, and Paul W., Miniard, 1993. Consumer Behavior Sixth
Ed. The Dryden Press On Bina Lupa Aksara. Jakarta.
Engel dkk, 1993 in Sudiyarto, 2009. Agribusiness Consumer Behavior. UPN PRESS. Surabaya
Kolter and Amstrong. 1997. Marketing Analysis Introduction. Fourth Edition. Perentice-Hall.
New York.
Http://imamagus20.blogspot.co.id/2015/01/consider-consumer-services.html
Mowen and Minor in Lina Salim 2002, consumer behaviour. 5th edition. Translated. Erlangga
publisher. Jakarta.
Richard Oliper and James G. Barnes. 2001 in Sudiyarto. 2009, Agribusiness Consumer
Behavior. UPN PRESS. Surabaya
Rustiani. F. 1995. Farmers in Business Interrelationship; Sharpening Deferences and Potential
Dependency. Akatiga. Bandung.
Swastha and Handoko. 2000, Marketing Management, Consumer Behavior Analysis.
Yogyakarta K BPFE-Yogyakarta.
The Fourth International Conference on Entrepreneurship | Book Three
302
INFLUENCE RELATIONSHIP MARKETING TO CUSTOMER
SATISFACTION AND LOYALTY
1Lavencia Dean Ananda, 2Tina Melinda♠
Ciputra University Surabaya
INDONESIA
Email: [email protected]
ABSTRACT
This study aims to clarify the effect of relationship marketing on
satisfaction, and the influence of satisfaction on loyalty. This type of
research is explanatory research or explanatory research with
quantitative approach. The population of this study were all members of
the Ananda Shop Baking Ingredients. A sample of 100 respondents who
had been a member, and active during the last 6 months and taken by
using judgment sampling and data collection methods using
questionnaires. Analysis of the data used is descriptive analysis and sem -
pls. The results of this study found that: the variable relationship
marketin variables significantly influence customer satisfaction and
customer satisfaction variables significantly influence pelnggan loyalty
variables. Thus, Ananda Shop Baking Ingredients should be deeper and
more serious in a relationship with the customer in order to forged
increasingly close relationship and its longevity.
Keywords: Relationship Marketing, Customer Satisfaction, Customer
Loyalty
INTRODUCTION
In this period of free competition, every company has a tough competition. To win the
competition, the company must be able to give satisfaction to the customer. Various efforts are
made to satisfy the needs of consumers so that they are willing to come back to the companies.
Foodstuffs distributors also have had a lot of competitors since the free trade era in Indonesia.
Foodstuffs from other countries begin to come in with competitive prices and good quality.
While the companies have comparative advantages, the free trade policy will not affect them.
Every company should put customer satisfaction orientation into their main goal to win the
competition. Competition favoring customers’ demand has also been made through one of the
local flour products in Semarang. This has been done by opening a training ground for its food
product users. Competition with food distribution companies also began to occur, not only with
quality products and competitive prices but also with giving the best service for their customers

The Fourth International Conference on Entrepreneurship | Book Three
303
Table 1. Competitor data
COMPETITOR STRENGHT WEAKNESS
Sari Murni Cake
Material Shop
Complete product
Strategic location
Provide a discount
Customer relationship
Harapan Jaya Cake
Material Shop
Competitive price
Strategic location
Do not have enough
stock
Kartika Cake Material
Shop
Cheap price Non-strategic
location
Ananda Cake Shop is located in one of big roads in Semarang city. This company has target
customers running bakery business. This pastry shop which used to be a very small has been run
since 1979. Today, this shop has a great location. Ananda store has many customers. It has
comparative advantages by prioritizing good relations with customers and offering the best
services for customers. But with the already tight competition, the impact on the sale of cake
materials at Ananda store has decreased.
Table 2. Sale Data per month
No. Month Sale Customers
1 April 2014 285,046,976 2,553
2 May 2014 275,756,886 2,450
3 June 2014 220,765,468 2,412
4 July 2014 239,213,450 2,405
5 August 2014 253,141,750 2,330
6 September 2015 210,674,800 2,300
7 November 2015 208,540,950 2,295
8 December 2015 205,745,756 2,275
9 January 2015 200,659,765 2,150
Source: Company's Internal Data 2014-2015
Table 2 shows competition with competitors has been increasingly tight. This condition makes
companies do various efforts to keep their customers and get more new customers. The way
they build marketing relationships is to hold a training place where customers can directly see
the process of foodstuff making. This training place becomes a place for customers and
companies to establish good relationships. The companies can directly listen to what customers
expect from them. According to Kotler and Keller (2009: 134) "Creating loyal customers is at
the core of every business."

The Fourth International Conference on Entrepreneurship | Book Three
304
Problem Formulation
The research problems of this present study are formulated as follows
• Does Relationship Marketing affect customer satisfaction?
• Does Relationship Marketing affect customer loyalty?
• Does customer satisfaction affect customer loyalty?
Research Objectives
The purposes of this research are to investigate if:
• marketing relationship provides customers’ satisfaction.
• marketing relationship provides customers’ loyalty.
• customers’ satisfaction affects customers’ loyalty.
Research Benefits
1. Theoretical benefits: it is to offer insight about the importance of customers’ marketing
relationship in maintaining customer satisfaction to gain their loyalty.
2. Practical benefits: It is to develop marketing relationships and to serve a reference to other
researchers in the future. This study concerns which dominant factors affect customers’
satisfaction to get customer loyalty. As owners are able to identify weaknesses and advantages
of their company, they begin to improve their employees’ performance to maximize, develop
relationships with their customers
LITERATURE REVIEW
Ardeliasari (Darema Journal Management Vol.9 No. 1, May 2014) mentions the implementation
of Marketing Relationship has covered some dimensions such as Understanding a Customers’
Expectation variable, building Service Partnership, empowering Employees, and conducting
Total Quality Management. They have a positive and significant relationship with customers’
loyalty. The dimension of Relationship Marketing that has the highest level of relationship with
Customers’ Loyalty is Building Service Partnership (BSP) or Kd2. This research has been
conducted by Dr. Velnampy (Global Journal of Management and Business Research Volume 12
Issue 18 Version 1.0 Year 2012) aims to know
A marketing relationship is a major paradigm shift in marketing theory and its practice in the
existing world. According to Ndubisi in his journal entitled "marketing relationship and
customer loyalty" have big impacts on four fundamentals of marketing relationships-trust,
commitment, communication, and conflict management - to customers’ loyalty in Malaysia.
According Heruswato (Business Management Indonesia Vol.42 No. 2/April-June 2013)
customers’ loyalty is belief to have a strong influence on business success. The meaning of
loyalty is not only limited to the relationship between consumers and brands, but to social
relation aspects, especially in the form of relationship. The consumer's attachment to the brand
will increase the people’s good perception about certain products or brands. Conscientious
consumers will get stronger if the product/brand is to provide their satisfaction consistently and
continuously.
Relationship marketing is a process of creating, maintaining and enhancing strong relationships
with customers and other stakeholders (Kotler and Armstrong, 2010: 789). Sivesan (2012) says
that relationship marketing is a very important concept to attract and retain customers within an
organization. In Saputra (2014), relationship marketing has important variables of trust,
commitment, and communication.
Understanding customer satisfaction, according to Kotler and to Tse and Wilton as cited by
Tawakkal (2013), has something to do with customers’ satisfaction (expectations and
performance or perceived results). In determining the level of customer satisfaction, five main

The Fourth International Conference on Entrepreneurship | Book Three
305
factors need to consider such as product quality, service quality, emotional, price, and cost
(Riadi, 2013).
According to Kertajaya in Luthviellah (2015) loyalty is obtained through the fulfilment of
humans’ need to have, support, and get a sense of security and comfort. Meanwhile, according
to Oliver in Luthviellah (2015), the definition of customer loyalty is the commitment of
customers to survive to re-subscribe or re-purchase products or services selected consistently in
the future. The indicators of customer loyalty according to Kotler & Keller in Saputri (2013) are
repeated purchase, retention, and referrals.
Philosophically, the customer is a king (Kotler, et al., 2010: 4). The business that favour
influencing and satisfying consumers becomes the top priority in almost all business activities.
Companies that excel in competition can influence consumers’ purchase decisions. As
customers are satisfied, companies can survive and develop their business. In Stevanus (2012),
one way to provide customer satisfaction is to build marketing relationship strategy. In this era
of globalization, technology and information systems are widely used by companies to support
all business activities. The effort in getting loyal customers is done by applying customer’s
relationship. Customers’ loyalty and relationship are indispensable (Rinaldi, 2015). Jones and
Sasser state customers’ loyalty is an endogenous variable caused by a combination of
satisfaction. In so doing, customers’ loyalty is to favour customers’ satisfaction. If the
relationship between satisfaction and customers’ loyalty is positive, high satisfaction will
increase customer loyalty.
Previous Studies 1. The results of Mayang Azka Ardeliasari (Darema Journal Management Vol. 9 No. 1,
May 2014) marketing relationship has a positive and significant relationship with
customer loyalty.
2. Research conducted by dr.T. Vacnampy & S. Sivesan (Global Journal of Management
and Business Research Volume 12 Issue 18 Version 1.0 Year 2012) shows Relationship
relationship marketing has an interest, to develop and retain customers.
3. According to Ign. Heruswato (Business Management Indonesia Vol. 42 No. 2/April-
June 2013) in his research customer loyalty is believed to have a strong influence on
business success.
According to Nelson Oly Ndubisi relationship marketing is important to test the relationship
with loyalty.
RESEARCH FRAMEWORK
Theories
1. Relationship marketing is a process for creating, maintaining and enhancing strong
relationships with customers and other stakeholders (Kotler and Armstrong, 2010: 789)
2. Customer satisfaction is the feeling of pleasure or disappointment of someone who
emerged after comparing the perception / impression to the performance (or outcome) of a
product and its expectations Tawakkal (2013)
Loyalty is "a strong feeling of support and allegiance; Aperson showing firm and costant
support (Lutviellah, 2015)

The Fourth International Conference on Entrepreneurship | Book Three
306
ANALISIS MODEL
Figure 1. Model Analysis
Figure 1. shows marketing relationship has an effect on customers’ satisfaction, and customers’
satisfaction influences customers’ loyalty.
HYPOTHESES
From the above theoretical framework, the hypothesis are formulated as follows:
H1: relationship marketing will have a positive effect on customers
H2: customer satisfaction will affect customers’ loyalty
RESEARCH METHODS
Research Approach
The samples are drawn randomly. The data are obtained through questionnaires. The data
analysis is intended to test the hypothesis: to investigate if marketing relationship affects
customers’ satisfaction and loyalty (Sugiyono, 2012: 7). The researcher has used a quantitative
method because the data are in the form of numbers.
To complete the research data, this study has used Partial Least Square (PLS). PLS is one of the
ways to analyze Structural Equation Modelling (SEM). One of SEM's advantages is the ability
to construct models as latent variables or variables not directly measured. However, they are
estimated and assumed to be related to latent variable. In PLS - SEM, there are two models:
inner model (structural model) and outer model (measurement model).
Place and time of research
The research site is at Ananda Cake Shop in Semarang. In this location the researchers have
distributed questionnaires to customers who had made a purchase at Ananda Soup Shop.
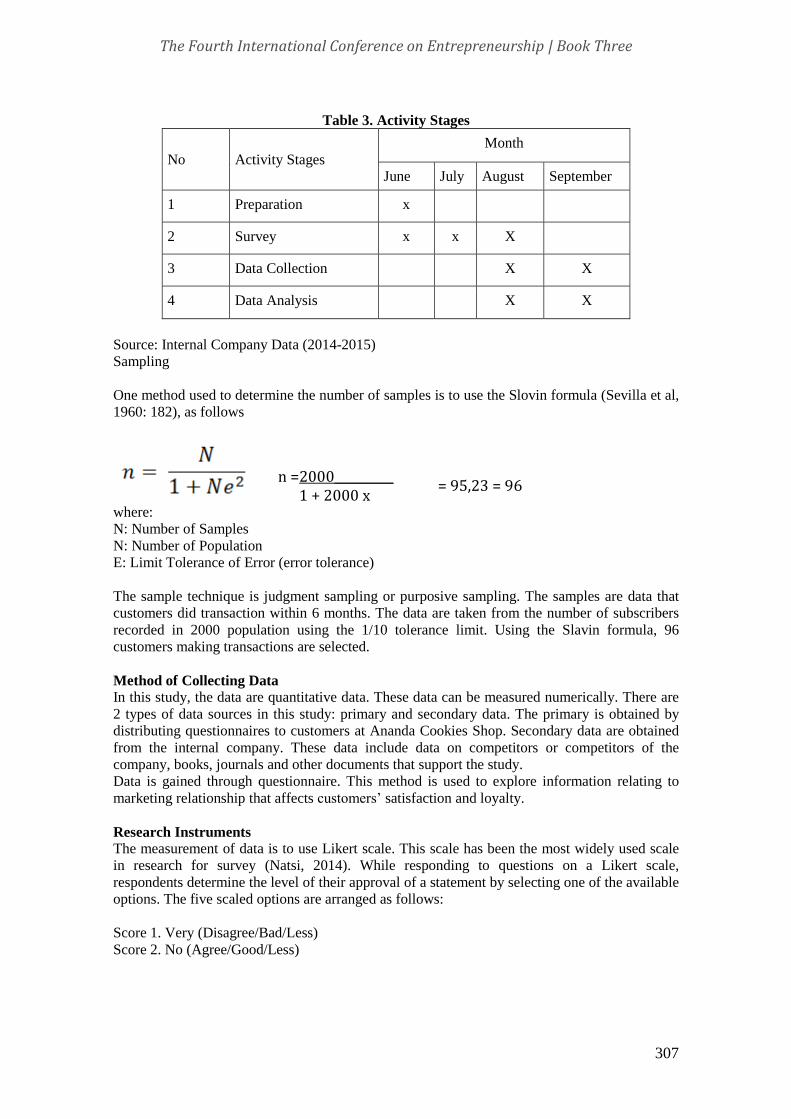
The Fourth International Conference on Entrepreneurship | Book Three
307
Table 3. Activity Stages
No
Activity Stages
Month
June July August September
1 Preparation x
2 Survey x x X
3 Data Collection X X
4 Data Analysis X X
Source: Internal Company Data (2014-2015)
Sampling
One method used to determine the number of samples is to use the Slovin formula (Sevilla et al,
1960: 182), as follows
where:
N: Number of Samples
N: Number of Population
E: Limit Tolerance of Error (error tolerance)
The sample technique is judgment sampling or purposive sampling. The samples are data that
customers did transaction within 6 months. The data are taken from the number of subscribers
recorded in 2000 population using the 1/10 tolerance limit. Using the Slavin formula, 96
customers making transactions are selected.
Method of Collecting Data
In this study, the data are quantitative data. These data can be measured numerically. There are
2 types of data sources in this study: primary and secondary data. The primary is obtained by
distributing questionnaires to customers at Ananda Cookies Shop. Secondary data are obtained
from the internal company. These data include data on competitors or competitors of the
company, books, journals and other documents that support the study.
Data is gained through questionnaire. This method is used to explore information relating to
marketing relationship that affects customers’ satisfaction and loyalty.
Research Instruments
The measurement of data is to use Likert scale. This scale has been the most widely used scale
in research for survey (Natsi, 2014). While responding to questions on a Likert scale,
respondents determine the level of their approval of a statement by selecting one of the available
options. The five scaled options are arranged as follows:
Score 1. Very (Disagree/Bad/Less)
Score 2. No (Agree/Good/Less)
n =2000__________ 1 + 2000 x
= 95,23 = 96

The Fourth International Conference on Entrepreneurship | Book Three
308
Score 3. Neutral/Enough
Score 4. (Agree/Good/Like)
Score 5. Very (Agree/Good/Like)
Variables and Operational Definition
The variables in this study are relationship marketing (X), Customer Satisfaction (Y1) and
Customer Loyalty (Y2). In Table 4.2 will be shown in detail about the operational definition in
this study
Tabel 4. Variable Insdicators
Variabel Definisi Indikator Sumber
Relationship
Marketing
(X)
Reflective
Relationship marketing is a
process for creating,
maintaining and enhancing
strong relationships with
customers and other
stakeholders
a) Trust
b) Commitment
c) Communication
(Kotler and
Amstrong, 2010:
789)
Saputra (2014)
Customers’
satisfaction
(Y1)
Reflective
Customer satisfaction is feeling
happy or disappointed someone
who emerged after comparing
the perception/impression of the
performance (or result) of a
product and hope-hope
a) Product quality
b) Service quality
c) Emotional
d) Price
e) Cost
Tawakkal (2013)
Riadi (2013)
Customers’
Loyality (Y2)
Reflective
Loyalty is “a strong feeling of
support and allegiance; a
person showing firm and
constant support
a) Repeat Purchase
b) Retention
c) Referrals
Luthviellah (2015)
Saputri (2013
Data analysis technique
This study uses SEM-PLS (partial least squares path modelling) method of SEM-PLS. This
method is used to test the predictive relationship among constructs: to see if there is any
relationship or influence among constructs. The numbers of samples in this study are 96

The Fourth International Conference on Entrepreneurship | Book Three
309
respondents. This study use SmartPLS 2.0 M3. According Ghozali (2012: 47-88), there are
some stages of analysis in using the PLS-SEM.
Figure 2. Stages of SEM-PLS Analysis
Source: Ghozali, 2012: 47-55
The conceptualization of the model is the first step in the PLS, at this stage the researcher
defines the conceptually constructed concept and determines its dimension. And the
conceptualization of the model is divided into 2 stages, namely designing the measurement
model (outer model) and Designing the structural model (inner model). Ghozali (2012) revealed
that after the model conceptualization, the next step is the determination of algorithmic analysis
method that will be used for model estimation, while resampling is used to estimate the value of
statistical significance that cannot be done by PLS which can only estimate the value of the
regression coefficient. The next step is to draw the path diagram of the research model
performed. The provisions in model drawings are theoretical constructs that show latent
variables drawn with circles or ovals, Indicators in drawings with box shapes, and asymmetric
relationships depicted with a single arrow direction. For inner and outer results the model is
expressed in the form of a path diagram to make it easier to understand, here is a path diagram
of the inner and outer model
Line Channel Construction
Konseptualisasi Model (inner and outer models Model Conceptualizati)
Determining Algorithm and Resampling Analysis Method
Conversion of path diagram into the system of equations
Estimation: Weight, Path Coefficient, and Loading
Goodness of Fit
Hypothesis Testing

The Fourth International Conference on Entrepreneurship | Book Three
310
Converting the Path Diagram into the system of equations:
A. Outer Model
Exogenous Latent Variable
Variable x, Relationship Marketing (reflective)
X1.1 = λx1x1 + ε9
X1.2 = λx2x2 + ε10
X1.3 = λx3x3 + ε11
Endogen Latent Variable
Variable y1, Customer Satisfaction (reflective)
Y1.1 = λy1Y1 + ε1
Y1.2 = λy2Y2 + ε2
Y1.3 = λy3Y3 + ε3
Y1.4 = λy4Y4 + ε4
Y1.5 = λy5Y5 + ε5
Variable y2, Customer Loyalty (reflective)
Y2.1 = λy6Y2 + ε6
Y2.2 = λy7Y2 + ε7
Y2.3 = λy8Y2 + ε8
B. Inner model
The system of inner model equations as follows:
Y1 = g1 X1 + ξ1
Y2 = g2 Y1 + ξ2
With description:

The Fourth International Conference on Entrepreneurship | Book Three
311
Lx = Lamnda (small), loading factor of exogenous latent variable
Ly = Lamnda (small), loading variable factor latent endogen
G = Gamma (small), the coefficient of influence of exogenous variable on endogen
Ξ = Zeta (minor), model error
D = Delta (small), measurement error on exogenous latent variable
E = Epsilon (small), measurement error on endogenous latent variable
Weight Estimation, Line Coefficient and Loading
The estimation method is a small square method. This includes three things: weight estimation
used to calculate latent variable data, path estimation connecting among latent variables, and
loading estimation among latent variables depicting indicators and means for indicators and
latent variables.
Evaluation of the Goodness of Fit
Outer Model (measurement model)
The outer model is a model that tests each latent variable and the indicator. The measurements
of formative and reflective models are different (Anwar, 2015: 9).
Outer reflective model
Validity
Table 5. Rule of Thumb Validity of Outer Reflective Model
Validity Parameter Rule of Thumb
Convergent
Validity
Loading Factor > 0.5
AVE > 0.5
Communality > 0.5
Discriminant
Validity
Cross Loading > 0.7
Source: Partial Least Square "Technical Concepts, and SmartPLS 2.0 applications" (Ghozali,
2012:
81)
Reliability
Table 6. Rule of Thumb Reliability of Outer Reflective Model
Parameter Rule of Thumb
Cronbach’s Alpha > 0.7
Composite Reliability >0.7
Source: Partial Least Square (Ghozali, 2012:81)
The reliability of the reflective outer model follows the following rule: the Cronbach's Alpha
value must be greater than 0.7 and the composite (ρc) is a perfectly acceptable within the limit
value of > 0.7 by looking at Cronbach's Alpha. The value of Cronbach's specified Alpha is
greater than 0.7 (Ghozali, 2012: 81).

The Fourth International Conference on Entrepreneurship | Book Three
312
Inner Model (Structural Model)
Tabel 7. Rule of Thumb Inner Model
Criteria Rule of Thumb
R – Square 0.75 (strong) , 0.5 (moderate), and 0.25
(weak)
Q2 Predictive
relevance
0.35 (strong) , 0.15 (moderate), 0.22
(weak)
Source: Partial Least Square (Ghozali, 2012: 85)
Hypothesis Testing
Tabel 8. Rule of Thumb Hypothesis Test
Criteria Rule of Thumb
Significance (2-failed) t-value > 1,65 (significance level 10%), > 1.96
(significance level 5%), >2,58 (significance level 1%)
Source: Partial Least Square (Ghozali, 2012: 85)
Statistical hypothesis for outer model:
H0 : λi = 0 towards
H1 : λi ≠ 0
Statistical hypothesis for inner model: Exogenous latent variable towards endogenous:
H0 : γi = 0 towards
H1 : γi ≠ 0
RESULTS AND DISCUSSION
Characteristics of Respondents
The numbers of samples are 100 people.
1. Gender

The Fourth International Conference on Entrepreneurship | Book Three
313
Figure 3. Gender of Respondents
Source: Processed Results with Excel
2. Age
Figure 4. Age of Respondents
Source: processed products with Excel

The Fourth International Conference on Entrepreneurship | Book Three
314
Descriptive Statistics Relationship Marketing
Table 9.
Latent Variable Questions Mean Standard
deviation
Marketing Relationship
of Ananda Cake Shop
Ananda Cake Shop gains trusts from
Customers (x1)
3.21 0.409
Ananda Cake Shop get customers’
commitment (x2)
3.19 0.394
Ananda Cake Shop establishes
relationships with customers’
communities (x3)
3.24 0.429
Descriptive statistics above show the cake ingredients Ananda has a commitment to the
customer (X2), the value of which has the smallest standard deviation. While the
indicator (X2) has a mean value of 3.19, this indicates the respondent's answer to
customer commitment (X2) is more homogeneous when compared with the
respondent's answer on other indicators.
Descriptive Statistics of Customers’ Satisfaction
Table 10.
Latent Variable Questions Mean Standard
deviation
Customers’ Satisfaction
to Ananda Cookies Store
Ananda store has good product quality
(y1.1)
3.39 0.490
Ananda has good product service (y1.2) 3.43 0.517
The Customer of Ananda Cake Shop is
proud of buying from Ananda's cake
shop (y1.3)
3.32 0.548
Ananda Cake Shop Shop has competitive
prices (y1.4)
3.22 0.504
Ananda Cake Shop provides bonus fee
for delivery service (y1.5)
3.12 0.456
Descriptive statistics above show that the ingredients of Ananda cake store provides
bonus cost for delivery service, the value of which has the lowest standard deviation.
While the indicator (y1.5) has a mean value of 3.12 this indicates the respondent's
answer to Ananda cake ingredients giving bonus cost for delivery service (y1.5) is more
homogeneous when compared with the respondent's answer to other indicators.

The Fourth International Conference on Entrepreneurship | Book Three
315
Descriptive Statistics Customer Loyalty
Table 11.
Latent Variable Questions Mean Standard
deviation
Customer Loyalty to
Ananda Cake Materials
store
Ananda Cake Shop provides bonus fee
for delivery service (y2.1)
3.33 0.493
Customers remain loyal to the Ananda
Cake Shop even though it is a competitor
(y2.2)
3.31 0.465
Customers positively recommend
Ananda Cake Shop to others (y2.3)
3.31 0.465
Descriptive statistics above show customers remain faithful to the cake shop despite the
existence of competitors (y2.2). Moreover, the customers have positively recommended poster
cake shop to others (y2.3), the value of which has the same deviation value. While the indicators
(y2.3) and (y2.2) have the same means of 3.31, this finding indicates the customers remain loyal
to the cake shop in spite of the existing other competitors. They even give their positive
recommendation about Ananda cake shop to others. This is more homogeneous when compared
with the respondent's answer on other indicators.
Data Processing with SEM - PLS
By using smartPLS software then model structure can be seen in Figure 5
Gambar 5.3 Struktur Model SEM
Figure 5.

The Fourth International Conference on Entrepreneurship | Book Three
316
Reflective Outer Model
Validity
The validity test is performed on the reflective model contained in the analysis model, i.e.
Relationship Marketing (X1), Customer Satisfaction (Y1) and Customer Loyalty (Y2). For
reflective variables, researchers discuss the convergent validity that includes three things:, the
loading factor, AVE, and communality. Next discriminant validity is discussed by looking at
cross loading. The reliability is seen through cronbach's alpha value and composite reliability.
Table 12.
Original Sample (O)
X1 <- Relationship 0.886
X2 <- Relationship 0.866
X3 <- Relationship 0.778
Y1.1 <- Satisfaction 0.844
Y1.2 <- Satisfaction 0.892
Y1.3 <- Satisfaction 0.846
Y1.4 <- Satisfaction 0.757
Y1.5 <- Satisfaction 0.575
Y2.1 <- Satisfaction 0.884
Y2.2 <- Satisfaction 0.934
Y2.3 <- Satisfaction 0.868
Table 5.3.1 states that factor loading values for each indicator X1, X2, X3, Y1.1, Y1.2,
Y1.3, Y1.4,
Y1.5, Y2.1, Y2.2, Y3.3 are greater than critical value of 0.5. This can concluded that the
indicators are
valid.
Average Variance Extracted (AVE)
The AVE value is used to measure the number of variants that the construct can capture
as compared to the variance caused by measurement error (Yamin and Kurniawan, 2011)
Table 13.
Average Variance Extracted (AVE)
Relationship 0.713
Satisfaction 0.625
Loyalty 0.803
Source: Processed Results with SmartPLS

The Fourth International Conference on Entrepreneurship | Book Three
317
Based on the value of loading factor and AVE it can be seen that the convergent validity has
been met. This takes place because the value of factor loading and AVE are greater than 0.5.
ii. Discriminant Validity
In testing the validity of discriminant is measured by using cross loading. Discriminant validity
is evaluated by cross loading. The value of cross loading is shown in Table 5.7.
Regarding the cross loading value in Table 5.3.3, there is no high correlation on indicators that
are not latent variables. The loading value for each construct is greater than those of the cross
loading.
Cronbach's Alpha
Table 5.3.4
Test results of reliability can be seen in table 5.3.4. The value of Cronbach's Alpha for each
reflective indicator can be said to be in accordance with the explanatory research requirements
that is ≥ 0.6.
Composite Reliability
Table 14.
Composite Reliability
Relationship 0.881
Satisfaction 0.891
Loyalty 0.924
Table 5.3.5 shows the reliability test value of the composite reliability of each reflective
indicator in the study can be said to be good and in accordance with the terms and
conditions that is ≥ 0.7.
Outer loading Hypothesis Testing
Table 15. The Results of Outer Loading
Original
Sample
(O)
Sample
Mean
(M)
Standard
Deviation
(STDEV)
T Statistics
(|O/STDEV|
)
X1 <- Relationship 0.886 0.881 0.043 20.590
X2 <- Relationship 0.866 0.865 0.042 20.739
X3 <- Relationship 0.778 0.772 0.065 11.927
Y11 <- Satisfaction 0.844 0.838 0.040 20.998
Y12 <- Satisfaction 0.892 0.892 0.025 36.388

The Fourth International Conference on Entrepreneurship | Book Three
318
Y13 <- Satisfaction 0.846 0.846 0.033 25.875
Y14 <- Satisfaction 0.757 0.754 0.060 12.719
Y15 <- Satisfaction 0.575 0.575 0.093 6.203
Y21 <- Loyalty 0.884 0.882 0.041 21.816
Y22 <- Loyalty 0.934 0.934 0.019 50.344
Y23 <- Loyalty 0.868 0.866 0.040 21.578
Source: Processed Results with SmartPLS
The outer model test for reflective variables includes relationship marketing, customer
satisfaction and customer loyalty. This is shown in in table 5.3.6. The test is done by looking
outer weight with t count more than 1.65. This value indicates that X1, X2, X3, Y.1.1, Y1.2,
Y1.3, Y1.4, Y1.5, Y2.1, Y2.2, Y2.3 are eligible.
Evaluation of Structural Model (Inner Model)
Evaluation of the inner model is done by calculating the values of R2 and Q2.
R-Square value
The value of R2 can be seen in Table 5.9
Table 16. R square value
R Square
Satisfaction 0.238
Loyalty 0.125
Source: Processed Results with SmartPLS
The value of R-Square for the variable of satisfaction that is equal to 0,238 means that the
percentage of the diversity of satisfaction variable can be explained by relationship marketing
variable equal to 23,8%. Meanwhile, the rest 76.2% is explained by other variable. It can be
concluded that 76.2% relationship marketing affects customer satisfaction. Based on R2 value,
the coefficient of determination of endogenous variable is still weak.
Q - Square values
Then calculated the value of Q2 by the formula
Q2 = 1 - (1-R12) (1-R22)
Q2 = 1 - (1 - 0.238) (1 - 0.125)
Q2 = 1 - 0.762 x 0.875
Q2 = 1 - 0.66675
Q2 = 0.33325
Based on the value of Q2, the prediction capability with pinfolding is considered good

The Fourth International Conference on Entrepreneurship | Book Three
319
Path Coeficient
Table 17.
Original
Sample
(O)
Sample
Mean
(M)
Standard
Deviation
(STDEV)
T Statistics
(|O/STDEV|
)
Relationship -> Satisfaction 0.488 0.502 0.075 6.542
Relationship -> Loyalty 0.172 0.188 0.062 2.791
Satisfaction -> Loyalty 0.354 0.368 0.080 4.407
The result of coefficient path showed that the direct influence between latent relationship
variable to satisfaction and satisfaction toward loyalty was significant with t-statistic ≥ 1.65.
These results mean that satisfaction is influenced by loyalty and relationship influenced by
satisfaction. While the indirect influence among latent variable relationship with loyalty is
significant with t - statistic ≥ 1.65, this means that loyalty is also influenced by relationship.
5.5 Discussion
5.5.1 Influence of Relationship Marketing to Customer Satisfaction
Based on Table 5.4 it can be seen that the value of t comparing relationship marketing to
customer satisfaction of 6.542 is greater than the value of table t that is ≥ 2.58. Therefore
relationship marketing (X1) significantly influences customers’ satisfaction (Y1) about the
shops.
Before Research After Research
1. Broadcast SMS to all members
Holding a gathering event to all
members
Telephone/telemarketing to customers
as a reminder
2. Trust to customers of products sold Provide sample products for free
Provide education for purchased
products

The Fourth International Conference on Entrepreneurship | Book Three
320
3. Giving gifts to members Give members timeframe to collect
points
Provide direct rewards to members at
the time of shopping
The Effect of Customers’ Satisfaction on Loyalty
Based on Table 5.4 it can be seen that the value of t hits relationship marketing to customer
satisfaction of 4.407 is greater than the value of table t that is ≥ 2.58.Therefore customer
satisfaction (Y1) has a significant influence on customer loyalty (Y2) in baking shop.
This research is in agreement with previous research, Heruswato (Business Management
Indonesia Vol.42 No. 2/April-June 2013) Customer loyalty is believed to have a strong
influence on business success. The impact of customers’ satisfaction on current loyalty Ananda
cake shop is to provide good product quality. The companies should favour customers to select
while giving different prices for certain products.
Based on the findings, researchers make managerial implications for customers’ satisfaction
variables on customer loyalty. It is intended to improve the deficiencies.
Before Research After Research
1. Provide free postage in the city with
minimal spending
• Provide free shipping for members
• Provide bonus on postage on certain days
2. The product offered has been tested its
quality
• Provide product demos
• Demonstrate the superiority of the product
3. Provide a diverse price with the quantity of
purchase
• Provide special pricing to members
• Provide special discounts on store
birthdays
4. Provide quality product selection • View products to be sold that are
acceptable to customers

The Fourth International Conference on Entrepreneurship | Book Three
321
REFERENCES
Anonim, 2013 Customer First itu Penting. http://komunitas.yellowpages.co.id/ customer-
first-itu-penting/ (diakses pada tanggal 22 Juni 2015)
Riskawati, 2013 Uji Validitas dan Realibilitas, http://statistikapendidikan.com/wp-
content/uploads/2013/05/Uji ValiditasRealibilitas.Riskawati.pdf (diakses pada tanggal
22 Juni 2015)
Navel, 2011 Varibel-variabel dalam Penelitian https://navelmangelep.
wordpress.com/2011/12/30/variable-variabel-dalam-penelitian/ (diakses pada tanggal
23 Juni 2015)
Ghozali, Imam. 2012. Partial Least square : Konsep Teknik, dan Aplikasi SmartPLS 2.0 M3.
Semarang: Badan Penerbit Universitas Diponegoro
Heruswanto,Ign 2013 Manajemen Usaha Indonesia Vol 42 no 2/April-Juni 2013
Velnampy, 2012 ‘Customer Relationship Marketing and Customer Satisfaction A Study on
Mobile Servis Providing Copanies in Srilanka’ Global Journal of Management and
Busniess Research Volume 12 issue 18 Version 1.0
Rachmawati, Rina, 2010 Pengaruh Kepuasan Terhadap Loyalitas Pelanggan (sebuah kajian
terhadap bisnis makanan) Teknubuga Volume 2 No. 2-April 2010
Rinaldi, Udin, 2015 Jurnal Socioscienta Kopertis Wilayah XI Kalimantan Februari 2015,
volume 7 nomor 1
Luthviellah, 2013 ‘Loyalitas
Konsumen’ http://luthviellahberkata.blogspot.com2013/06/loyalitas-
konsumen.html (diakses pada 23 Juni 2015)
Saputri, Marheni Eka, 2013 Pengaruh Brand Image Terhadap Kesetiaan Pengguna Smartphone
Iphone
Ersi, Dzikiryati Yuni, 2014, Analysis CRM, ‘Kepuasan Pelanggan dan Loyalitas Produk
UKM Berbasis Bahan Baku Terigu di Jawa Timur’ Jurnal Manajemen Pemasaran, Vol
8, No 1, April 2014 ISSN 1907-235X
Apriliani, Fitri 2014 ‘Pengaruh Relationship Marketing Terhadap Kepuasan dan Loyalitas
Nasabah’ Jurnal Administrasi Bisnis (JAB) / Vol 17 No. 1 Desember 2014

The Fourth International Conference on Entrepreneurship | Book Three
322
MARKETING STRATEGY'S FULLFREEDOM
1Ryan Rizki Herdianto, 2Tina Melinda♠
Ciputra University Surabaya
INDONESIA
Email: [email protected]
ABSTRACT
Along with the development of the times and population growth, clothing is
a status symbol, a person's expression and also used to support daily
activities. So the need of clothes or fashion is increasingly growing day by
day. Therefore, the true clothing is a body cover made from textile material
or fiber these days become the basic necessities of every individual other
than food and also become one of the key of increasing the economic
growth and become the mainstay of Indonesia. Therefore, by conducting
research on FullFreedom company which is a company engaged in fashion
or clothing, to research and analyze marketing strategy FullFreedom shirts
using 4 methods of prduction aspects, price aspects, aspects of the place
and aspects of promotion. The result of each aspect shows that there is a
new application to marketing strategy that will be done by FullFreedom.
Analysis of the marketing strategy from the product aspect shows the
results of a more diverse product.
In conclusion, marketing strategy in FullFreedom has emerged and can be
realized from the aspect of product, price aspect, place aspect and
promotion aspect so that it can grow a good marketing pace.
Keywords: Strategy, marketing FullFreedom
INTRODUCTION
The clothing that has become a symbol of status and also the basic human needs in Indonesia,
makes many big companies interested to cultivate this business as a businessman. This has led
to the growth of growing companies based on growing beliefs In big cities to the regions. Which
makes clothing company ranks third after food and textile and in the end Clothing become one
of the key of increasing economic growth and become Indonesia's mainstay sector.Associated
with the clothing industry there is one company that pursue this field is FullFreedom. This
company is a garment manufacturer established in 2013 which has the theme of writing and
drawing. Every year the enthusiasts are increasing to make the work in visualize through
apparel. Focus on meaningful images and writings, to personalize the personality of each person
and group and his or her preferences for a particular field to support the existence of being
social with others. Target segment aged 20-35 years who can adjust the design style changes or
already have a sense of the design style. In the human mindset there needs to be a balance
between aesthetics, ethics and logic. Therefore FullFreedom exist as a balancing mindset that
needs to be managed and appreciated through apparel.
From the research that has been made for 3 years each this wulan behind, FullFreedom sales
have increased and decreased. FullFreedom apparel sales mostly occur in 2015 because
consumer interest in the shirt is increasing in balance with increasing demand. But in the year
2016 FullFreedom sales decline caused by the sluggish world economy and consumers are

The Fourth International Conference on Entrepreneurship | Book Three
323
reluctant to buy clothing and reduce purchases. The decline in product purchases is also due to
the presence of new products of the same kind that began to compete.
FullFreedom using 30s discarst shirts that have a soft texture and easy to absorb sweat and use
the system of color removal that is screen printing, selling price is also affordable with a
nominal Rp. 135,000 per shirt. Sales of T-shirts offline and domicile in Surabaya and use
facebook as media promotion easy to interact on society.
The main tool used in this process is a marketing strategy that serves to ensure that the company
can win the competition so as to obtain adequate levels of sales and profit in accordance with
the risks faced. Strategy seeks to overcome limitations and be able to utilize a variety of
resources possessed optimally (Adisaputro, 2014). Based on the above background, researchers
analyzed the factors that influenced FullFreedom's marketing t-shirt strategy, in order to survive
in competition with other competitors and can increase the number of sales.
LITERATURE REVIEW In this FullFreedom Marketing Strategy research is the object of research by using the same
theory with the theory used by the researcher that is 4P (Product, Price, Place, Promotion) so as
to clarify the marketing strategy of a company.
1. Product (product)
The definition of product (product) is as everything that can be offered to the
market to attract attention, acquisition, use, or consumption that can satisfy a desire
or need. Products include more than tangible goods. In a broad sense, the product
includes physical objects, services, events, people, places, organizations, ideas, or
mix of all, Kotler and Armstrong (2010: 266).
2. Price (price) In a narrow sense, the price is the amount charged to a product. When further
extended the meaning of the word price is the sum of all values given by the
customer to profit from owning or using a product. Throughout history, prices have
been a major factor influencing buyers' choices.
3. Promotion (promotion) Promotion comes from promoting words in English which means developing or
improving.
4. Place (place) The most important thing in marketing is to determine how a product can be
available in the marketplace. Places that deal directly with consumers and
marketing intermediaries are stores and supermarkets rather than producers.
According to Morissan (2010), the marketing channel decision covers the activities
of selecting, managing and motivating distributors, wholesalers, brokers and
retailers who will help companies provide goods and services to consumers. In this
study used place indicators as follows: stores and resellers.
RESEARCH METODS
A. Research Approach
According to Moleong (2012: 4) qualitative method is a research that produces descriptive
data that is in the form of written words of people and observed behavior. Thus, in this case
it should not isolate an individual or an organization into variables or hypotheses, but need
to see it as a part of something wholeness. The data required in this study is obtained
through interviews, observations, and documentation. Collecting data in the form of images,
words, and not numbers is the cirri of this study.
So as to cause using the conceptual framework and research methods as follows:

The Fourth International Conference on Entrepreneurship | Book Three
324
RESEARCH METHODS
DISCUSSION:
A. Product Knowledge of the product for fullfreedom is teen shirts purchased for teenagers, needed
basic products as supporting the core benefits and hospitality and good service quality
can be met so that all can support all aspects of the product and put the quality of good
service in order to increase the value of product sales
In fullfreedom products create shirts dominated by quality black, prioritizing details in
all the accuracy of the product good pieces, stitches and the results of quality screen
printing. Added with logo labels and information how to wash t-shirts to stay good so
buyers get complete information when buying fullfreedom products.
B. Price Knowledge of the price for fullfreedom is the determination of the price in accordance
with the market that is supported by the dimensions of discounts or discounts given to
the buyer as well as special deductions at the time of events made from the seller to the
buyer. So to create a good price need to decrease the price in order to support the
product in the market.
In fullfreedom the price fixes the price of 135,000 thousand rupiahs by considering the
limited number of products, high production value, plus the price of the design is quite
expensive and the cost of offline promotion and employee wage payment and monthly
expenses for the rental of premises and pay for basic necessities such as electricity and
water as well Communication costs.

The Fourth International Conference on Entrepreneurship | Book Three
325
NO Prior Research After Research
1 The sale price is
Rp.135.000.
1.1 The undertaking of price reductions due to adjustments to
market prices is Rp 100,000. In order to optimize the product
that can be sold in the market.
2 Discounts between 50%
and 70%.
2.1 Keep discounts with a fair limit of 10% to 15% in the first
6 months.
2.2 After running 3 months later the holding back discount of
20% - 30%.
2.3 If the period of t-shirts is still left to run 1 year then
discounted up to 50% at the end of the stock of existing goods.
3 Give discounts on certain
events even for free.
3.1 Provide a minimum discount between 5 thousand to 7
thousand
3.2 Giving when purchasing large quantities between at least 3
pieces to 12 pieces.
C. Place Knowledge of the place for fullfreedom is indicated through the shop or offlinestore
where the place to sell as a place of marketing of fullfreedom products and the presence
of resellers acts as a resell party that supports the success of marketing strategies that
run. Therefore, to get a place that can easily be found in places frequented by many
people such as malls and access roads in the city center strategically and supported in
terms of cleanliness and comfort of the place.
NO Prior Research After Research
1 Just focus on temporary
stores and not cooperate
with other distributors.
1.1 Open a store in a crowded place like a mall.
1.2 cooperate with other distributors by using profit sharing
system
2 Have a place at home that is
difficult in the know
people.
2.1 Choosing a place that is easily known to people.
2.2 located in the center of the city or strategically.
3 Having an uncertain reseller
makes it difficult to
monitor.
3.1 Make the customer as well as reseller of fullfreedom
products.

The Fourth International Conference on Entrepreneurship | Book Three
326
D. Promotion Knowledge of promotions for fullfreedom is indicated through advertising that all forms
of nonpersonal presentations and promotions paid by advertisers such as advertisements
on the internet using social media, then direct sales with direct targets to consumers, as
well as word of mouth marketing which means a customer recommends His friends.
Therefore the right promotion is to use social media such as instagram and create a
webside by maintaining the advantages that have been run. There are several ways to do
fullfreedom to promote the product information to the buyer that is by using social
media facebook as a social networking application that many in demand by the buyers,
then more importantly is the direct sales system to the customer to know directly who
the buyer The product so that from there also appear in word of mouth marketing
promotion where the buyer will menginfokan fullfreedom t-shirt products to others
CONCLUSION: Research conducted in thesis entitled marketing strategy of fullfreedom in order to increase
sales and can compete in market have Using qualitative research method, this research
concentrated to discuss 4P (Product, Price, Place, Promotion) to determine marketing strategy
which can be realized well in improving The amount of sales fullfreedom.Berdasarkan research
described earlier, it can be deduced as follows:
Product In fullfreedom products create shirts dominated by quality black, prioritizing
NO Prior Research After Research
1 Promotion only through facebook
with promotional time at 12 noon,
5 pm and 7 pm promo materials
using product photos and daily
activities conducted fullfreedom
both indoors and outdoors that are
informative and update the latest
news around the word and image
that will be Published next while
the contents of the word content
using the Indonesian and English
language that are promoting
products and calls on things -
things that are building the image
of the shirt products.
1.1 Conducting promotional development
through instagram with promotional
time at 8 am, 3 pm and 8 pm promo
material using daily product photos and
daily activities done fullfreedom both
indoors and outdoors that is informative
and update the latest news around word
and picture Which will be published
next while the contents of the word
content using the Indonesian and
English language that are promoting
products and appeals about things -
things that are building a product image
of the shirt.
1.2 1.2 create an informative webside that
contains interesting articles.
2 Doing direct sales to consumers 2.1 Keep doing direct sales to consumers by giving
word again when the latest t-shirts are
published.
3 Do not consider promotion of
word of mouth marketing well.
3.1 Promoting word of mouth marketing well to
have a wide network.

The Fourth International Conference on Entrepreneurship | Book Three
327
details in all the accuracy of the product good pieces, stitches and screen printing
quality. Added with logo labels and information how to wash t-shirts to stay good
so buyers get complete information when buying a fullfreedom product. There
should be an addition of finished product variant by using embroidery elements to
add varied impressions and latest innovations simply, then provide products that
combine shapes to suit buyers' needs, while maintaining quality and size variants of
size and simple design optimizers and images that represent buyers.
Price In fullfreedom prices fix the price of 135,000 rupiahs by considering the limited
number of products, high production value, coupled with expensive design prices
and offline promotional fees and employee wage payments as well as monthly
expenses for rental of premises and pay for basic utilities such as electricity and
water and costs communication. There should be a price optimization seen from
various aspects that exist until good discounts when there are important events and
momentum so there is no big loss. Make the price that can be reached by the people
and in accordance with the market price of 100,000 rupiah srta supported by the
normal nominal of discount when the promo period of 10% to 15% and also
provide a special discount for buyers who buy with a certain amount to establish a
relationship sell Buy good so on.
Place When the place is there, fullfreedom choose two optional by using the shelter
house as the parent of the place where the shirts are available and then rent the shop
with the assumption of being another alternative place that can be made jelajah
where the purchase of fullfreedom products, but also take advantage of existing
resellers either the individual Or shop that already has a good cooperation. The fore
should consider the aspect in a crowded place like a mall so that many buyers can
easily know where to sell and supported by the selection of a strategic store
location and choose the right reseller in order to increase the growth of a good
purchase. The need for a searchable place to be easily accessible becomes a major
consideration when the marketing strategy will also be implemented appropriately
so that the level of comfort and customer satisfaction also increases as well. No less
important is the existence of loyal customers who can be useful as a seller of goods
in others so as to create optimal employment and give blessing also for bnyak
people.
Promotion There are several ways to do fullfreedom to promote the product information to the
buyer that is by using social media facebook as a social networking applications
that are in great demand by the buyers, then more importantly is the direct sales
system to the customer to know directly who the buyer The product so that from
there also appear in word of mouth marketing promotion where the buyer will
menginfokan fullfreedom t-shirt product to others. Future promotion through
instagram and create an informative webside is a good means of promotion with
shooting system using a good model and an attractive two-way communication
facet produce a media campaign that can grow the rate of turnover of goods that
exist, in addition to promoting sales directly and using the promotion Word of
mouth marketing appropriately. Optimization of the campaign is easy to use and
highly profitable for the company so that the creation of promotional efforts that
cause talks that can benefit the promotion process.

The Fourth International Conference on Entrepreneurship | Book Three
328
REFERENCES
Adisaputro, G. (2014) Manajemen Pemasaran Analisis Untuk Perancangan Strategi Pemasaran.
Yogyakarta: Unit Penerbit Dan Percetakan Sekolah Tinggi Ilmu Manajemen YKPN.
Assauri, Sofjan. (2013). Strategic Management: Sustainable Compatitive Advantages. Jakarta:
Cetakan Pertama, Rajawali Persada.
Bangun, W. (2012). Manajemen Sumber Daya Manusia. Jakarta: Erlangga.
Gheorghe Epuran. (2015) From 4P's to 4 E's – How to Avoid the Risk of Unbalancing the
Marketing Mix in Today Hotel Businesses. Jurnal Fascicle I. Economics and Applied
Informatics, Annals of “Dunarea de Jos” University of Galati.
Grewal, D dan Levy, M. (2013). Marketing. New York: McGraw-Hill/Irwin.
Handoko, T.H, dkk. (2012) Manajemen Dalam Berbagai Perspektif. Jakarta: Erlangga.
Hasan, Ali. (2013). Marketing dan Kasus-Kasus Pilihan. Yogyakarta: CAPS
Hermawan, A. (2012). Komunikasi Pemasaran. Jakarta: Erlangga.
http://www.ilmusipil.com/owner-atau-pemilik-proyek-konstruksi (Accessed: 29 April 2016).
http://www.psychologymania.com/2013/01/pengertian-customer.html (Accessed: 29 April
2016).
http:/desapagerluyung.wordpress.com/69-2/ (Accessed: 1 Juni 2017).
https://id-id.facebook.com/notes/jilbab-meidiani/bedanya-distributor-suplier-agen-
resellerdropshipper/659977124057351/ (Accessed: 29 April 2016).
https://jatim.bps.go.id/linkTabelStatis/view/id/330 (Accessed: 11 Juni 2017).
Kotler, P. and Armstrong, G. (2010). Principles Of Marketing, Twelefth Edition, Maulana, A,
Barnadi, D, dan Hardani, W. (editor) (2010) Sabran, B (penterjemah) (2010) Prinsip –
Prinsip Pemasaran, Edisi Ke-12. Jakarta: Erlangga.
Kotler, P. and Armstrong, G. (2012). Principles of Marketing. New Jersey: Pearson Education
Limited.
Kristamuljana, S, dkk. (2011). Pijar Pijar Manajemen Bisnis Indonesia. Jakarta: Prasetya Mulya
Publishing.
Manday, J. (2013). Promosi. Distribusi, Harga, Pengaruhnya Terhadap Keputusan Pembelian
Rokok Surya Promild. Fakultas Ekonomi dan Bisnis, Jurusan Manajemen Universitas
Sam Ratulangi Manado.
Moleong, L.J. (2012). Metodologi Penelitian Kualitatif. Bandung: PT Remaja Rosdakarya.
Morissan, M.A. (2010) Periklanan Komunikasi Pemasaran Terpadu. Jakarta: Kencana Prenada
Media Group
Noor, S. (2014). Penerapan Analisis SWOT Dalam Menentukan Strategi Pemasaran Daihatsu
Luxio di Malang (Studi Kasus pada PT.Astra International Tbk. – Daihatsu Malang).
Jurnal INTEKNA, Tahun XIV No.2 Edisi Nopember 2014, 102-109.
Rangkuti, F. (2015). Analisis SWOT: Teknik Membedah Kasus Bisnis. Jakarta: PT. Gramedia
Pustaka Utama.
Satit.. et al. (2012) The Relationship Between Marketing Mix And Customer Decision-Making
Over Travel Agents: An Empirical Study. International Journal of Academic Research
in Business and Social Sciences, HR Mars, Vol. 2, No. 6.
Sugiyono, (2012). Metode Penelitian Manajemen. Bandung. Alfabeta.
Sugiyono, (2013). Metode Penelitian Kuantitatif, Kualitatif, dan R&D. Bandung: Alfabeta.
Sugiyono, (2014). Metode Penelitian Pendidikan (Pendekatan Kuantitatif, Kualitatif, dan
R&D). Bandung: Alfabeta
Usman, Y. V., & Yaren, W. (2013). Analisis Strategi Pemasaran Perumahan Bekasi Timur
Regensi 3. Jurnal Sistem Industri Vol.7 No.1,83-98.
Wahana et al. (2014). Analisis Penerepan Social Media Sebagai Strategi Bisnis oleh Pelaku
Bisnis Online.

The Fourth International Conference on Entrepreneurship | Book Three
329
Note: --------------------------------------------------------------------------------------------------------------------
----------------------------------------------------------------------------------------------------------------------------------------------------------------------------------------------------------------------------------------------------------------------------------------------------------------------------------------------------------------------------------------------------------------------------------------------------------------------------------------------------------------------------------------------------------------------------------------------------------------------------------------------------------------------------------------------------------------------------------------------------------------------------------------------------------------------------------------------------------------------------------------------------------------------------------------------------------------------------------------------------------------------------------------------------------------------------------------------------------------------------------------------------------------------------------------------------------------------------------------------------------------------------------------------------------------------------------------------------------------------------------------------------------------------------------------------------------------------------------------------------------------------------------------------------------------------------------------------------------------------------------------------------------------------------------------------------------------------------------------------------------------------------------------------------------------------------------------------------------------------------------------------------------------------------------------------------------------------------------------------------------------------------------------------------------------------------------------------------------------------------------------------------------------------------------------------------------------------------------------------------------------------------------------------------------------------------------------------------------------------------------------------------------------------------------------------------------------------------------------------------------------------------------------------------------------------------------------------------------------------------------------------------------------------------------------------------------------------------------------------------------------------------------------------------------------------------------------------------------------------------------------------------------------------------------------------------------------------------------------------------------------------------------------------------------------------------------------------------------------------------------------------------------------------------------------------------------------------------------------------------------------------------------------------------------------------------------------------------------------------------------------------------------------------------------------------------------------------------------------------------------------------------------------------------------------------------------------------------------------------------------------------------------------------------------------------------------------------------------------------------------------------------------------------------------------------------------------------------- ----------------------------------------------------------------------------------------------------------------------------------------------------------------------------------------------------------------------------------------------------------------------------------------------------------------------------------------------------------------------------------------------------------------------------------------------------------------------------------------------------------------------------------------------------------------------------------------------------------------------------------------------------------------------------------------------------------------------- ----------------------------------------------------------------------------------------------------------------------------------------------------------------------------------------------------------------------------------------------------------------------------------------------------------------------------------------------------------------------------------------------------------------------------------------------------------------------------------------------------------------------------------------------------------------------------------------------------------------------------------------------------------------------------------------------------------------------------------------------------------------------------------------------------------------------------------------------------------------------------------------------------------------------------------------------------------------------------------------------------------------------------------------------------------------------------------------------------------------------------------------------------------------------------------------

The Fourth International Conference on Entrepreneurship | Book Three
330
Note: --------------------------------------------------------------------------------------------------------------------
----------------------------------------------------------------------------------------------------------------------------------------------------------------------------------------------------------------------------------------------------------------------------------------------------------------------------------------------------------------------------------------------------------------------------------------------------------------------------------------------------------------------------------------------------------------------------------------------------------------------------------------------------------------------------------------------------------------------------------------------------------------------------------------------------------------------------------------------------------------------------------------------------------------------------------------------------------------------------------------------------------------------------------------------------------------------------------------------------------------------------------------------------------------------------------------------------------------------------------------------------------------------------------------------------------------------------------------------------------------------------------------------------------------------------------------------------------------------------------------------------------------------------------------------------------------------------------------------------------------------------------------------------------------------------------------------------------------------------------------------------------------------------------------------------------------------------------------------------------------------------------------------------------------------------------------------------------------------------------------------------------------------------------------------------------------------------------------------------------------------------------------------------------------------------------------------------------------------------------------------------------------------------------------------------------------------------------------------------------------------------------------------------------------------------------------------------------------------------------------------------------------------------------------------------------------------------------------------------------------------------------------------------------------------------------------------------------------------------------------------------------------------------------------------------------------------------------------------------------------------------------------------------------------------------------------------------------------------------------------------------------------------------------------------------------------------------------------------------------------------------------------------------------------------------------------------------------------------------------------------------------------------------------------------------------------------------------------------------------------------------------------------------------------------------------------------------------------------------------------------------------------------------------------------------------------------------------------------------------------------------------------------------------------------------------------------------------------------------------------------------------------------------------------------------------------------------------------------------- ----------------------------------------------------------------------------------------------------------------------------------------------------------------------------------------------------------------------------------------------------------------------------------------------------------------------------------------------------------------------------------------------------------------------------------------------------------------------------------------------------------------------------------------------------------------------------------------------------------------------------------------------------------------------------------------------------------------------- ----------------------------------------------------------------------------------------------------------------------------------------------------------------------------------------------------------------------------------------------------------------------------------------------------------------------------------------------------------------------------------------------------------------------------------------------------------------------------------------------------------------------------------------------------------------------------------------------------------------------------------------------------------------------------------------------------------------------------------------------------------------------------------------------------------------------------------------------------------------------------------------------------------------------------------------------------------------------------------------------------------------------------------------------------------------------------------------------------------------------------------------------------------------------------------------

The Fourth International Conference on Entrepreneurship | Book Three
331
Note: --------------------------------------------------------------------------------------------------------------------
------------------------------------------------------------------------------------------------------------------------------------------------------------------------------------------------------------------------------------------------------------------------------------------------------------------------------------------------------------------------------------------------------------------------------------------------------------------------------------------------------------------------------------------------------------------------------------------------------------------------------------------------------------------------------------------------------------------------------------------------------------------------------------------------------------------------------------------------------------------------------------------------------------------------------------------------------------------------------------------------------------------------------------------------------------------------------------------------------------------------------------------------------------------------------------------------------------------------------------------------------------------------------------------------------------------------------------------------------------------------------------------------------------------------------------------------------------------------------------------------------------------------------------------------------------------------------------------------------------------------------------------------------------------------------------------------------------------------------------------------------------------------------------------------------------------------------------------------------------------------------------------------------------------------------------------------------------------------------------------------------------------------------------------------------------------------------------------------------------------------------------------------------------------------------------------------------------------------------------------------------------------------------------------------------------------------------------------------------------------------------------------------------------------------------------------------------------------------------------------------------------------------------------------------------------------------------------------------------------------------------------------------------------------------------------------------------------------------------------------------------------------------------------------------------------------------------------------------------------------------------------------------------------------------------------------------------------------------------------------------------------------------------------------------------------------------------------------------------------------------------------------------------------------------------------------------------------------------------------------------------------------------------------------------------------------------------------------------------------------------------------------------------------------------------------------------------------------------------------------------------------------------------------------------------------------------------------------------------------------------------------------------------------------------------------------------------------------------------------------------------------------------------------------------------------------------------------------------------------------------------------------------------------------------------------------------------------------------------------------------------------------------------------------------------------------------------------------------------------------------------------------------------------------------------------------------------------------------------------------------------------------------------------------------------------------------------------------------------------------------------------------------------------------------------------------------------------------------------------------------------------------------------------------------------------------------------------------------------------------------------------------------------------------------------------------------------------------------------------------------------------------------------------------------------------------------------------------------------------------------------------------------------------------------------------------------------------------------------------------------------------------------------------------------------------------------------------------------------------------------------------------------------------------------------------------------------------------------------------------------------------------------------------------------------------------------------------------------------------------------------------------------------------------------------------------------------------------------------------------------------------------------------------------------------------------------------------------------------------------------------------------

The Fourth International Conference on Entrepreneurship | Book Three
332
Note: ----------------------------------------------------------------------------------------------------------
--------------------------------------------------------------------------------------------------------------------
--------------------------------------------------------------------------------------------------------------------
--------------------------------------------------------------------------------------------------------------------
--------------------------------------------------------------------------------------------------------------------
--------------------------------------------------------------------------------------------------------------------
--------------------------------------------------------------------------------------------------------------------
--------------------------------------------------------------------------------------------------------------------
--------------------------------------------------------------------------------------------------------------------
--------------------------------------------------------------------------------------------------------------------
--------------------------------------------------------------------------------------------------------------------
--------------------------------------------------------------------------------------------------------------------
--------------------------------------------------------------------------------------------------------------------
--------------------------------------------------------------------------------------------------------------------
--------------------------------------------------------------------------------------------------------------------
--------------------------------------------------------------------------------------------------------------------
--------------------------------------------------------------------------------------------------------------------
--------------------------------------------------------------------------------------------------------------------
--------------------------------------------------------------------------------------------------------------------
--------------------------------------------------------------------------------------------------------------------
--------------------------------------------------------------------------------------------------------------------
--------------------------------------------------------------------------------------------------------------------
--------------------------------------------------------------------------------------------------------------------
--------------------------------------------------------------------------------------------------------------------
--------------------------------------------------------------------------------------------------------------------
--------------------------------------------------------------------------------------------------------------------
--------------------------------------------------------------------------------------------------------------------
--------------------------------------------------------------------------------------------------------------------
--------------------------------------------------------------------------------------------------------------------
--------------------------------------------------------------------------------------------------------------------
--------------------------------------------------------------------------------------------------------------------
--------------------------------------------------------------------------------------------------------------------
--------------------------------------------------------------------------------------------------------------------
--------------------------------------------------------------------------------------------------------------------
--------------------------------------------------------------------------------------------------------------------
--------------------------------------------------------------------------------------------------------------------
--------------------------------------------------------------------------------------------------------------------
--------------------------------------------------------------------------------------------------------------------
--------------------------------------------------------------------------------------------------------------------
--------------------------------------------------------------------------------------------------------------------
--------------------------------------------------------------------------------------------------------------------
--------------------------------------------------------------------------------------------------------------------
--------------------------------------------------------------------------------------------------------------------
--------------------------------------------------------------------------------------------------------------------
--------------------------------------------------------------------------------------------------------------------
--------------------------------------------------------------------------------------------------------------------
--------------------------------------------------------------------------------------------------------------------

The Fourth International Conference on Entrepreneurship | Book Three
333
Note: ----------------------------------------------------------------------------------------------------------
--------------------------------------------------------------------------------------------------------------------
--------------------------------------------------------------------------------------------------------------------
--------------------------------------------------------------------------------------------------------------------
--------------------------------------------------------------------------------------------------------------------
--------------------------------------------------------------------------------------------------------------------
--------------------------------------------------------------------------------------------------------------------
--------------------------------------------------------------------------------------------------------------------
--------------------------------------------------------------------------------------------------------------------
--------------------------------------------------------------------------------------------------------------------
--------------------------------------------------------------------------------------------------------------------
--------------------------------------------------------------------------------------------------------------------
--------------------------------------------------------------------------------------------------------------------
--------------------------------------------------------------------------------------------------------------------
--------------------------------------------------------------------------------------------------------------------
--------------------------------------------------------------------------------------------------------------------
--------------------------------------------------------------------------------------------------------------------
--------------------------------------------------------------------------------------------------------------------
--------------------------------------------------------------------------------------------------------------------
--------------------------------------------------------------------------------------------------------------------
--------------------------------------------------------------------------------------------------------------------
--------------------------------------------------------------------------------------------------------------------
--------------------------------------------------------------------------------------------------------------------
--------------------------------------------------------------------------------------------------------------------
--------------------------------------------------------------------------------------------------------------------
--------------------------------------------------------------------------------------------------------------------
--------------------------------------------------------------------------------------------------------------------
--------------------------------------------------------------------------------------------------------------------
--------------------------------------------------------------------------------------------------------------------
--------------------------------------------------------------------------------------------------------------------
--------------------------------------------------------------------------------------------------------------------
--------------------------------------------------------------------------------------------------------------------
--------------------------------------------------------------------------------------------------------------------
--------------------------------------------------------------------------------------------------------------------
--------------------------------------------------------------------------------------------------------------------
--------------------------------------------------------------------------------------------------------------------
--------------------------------------------------------------------------------------------------------------------
--------------------------------------------------------------------------------------------------------------------
--------------------------------------------------------------------------------------------------------------------
--------------------------------------------------------------------------------------------------------------------
--------------------------------------------------------------------------------------------------------------------
--------------------------------------------------------------------------------------------------------------------
--------------------------------------------------------------------------------------------------------------------
--------------------------------------------------------------------------------------------------------------------