fortum a leading power and heat company in the nordic area
TRANSCRIPT

FORTUM A leading power and heat company
in the Nordic area
Investor/Analyst materialJune 2010

2
Disclaimer
This presentation does not constitute an invitation to underwrite, subscribe for, or otherwise acquire or dispose of any Fortum shares.
Past performance is no guide to future performance, and persons needing advice should consult an independent financial adviser.
Fortum today
European power markets
Russia
Financials and outlook
Content
4
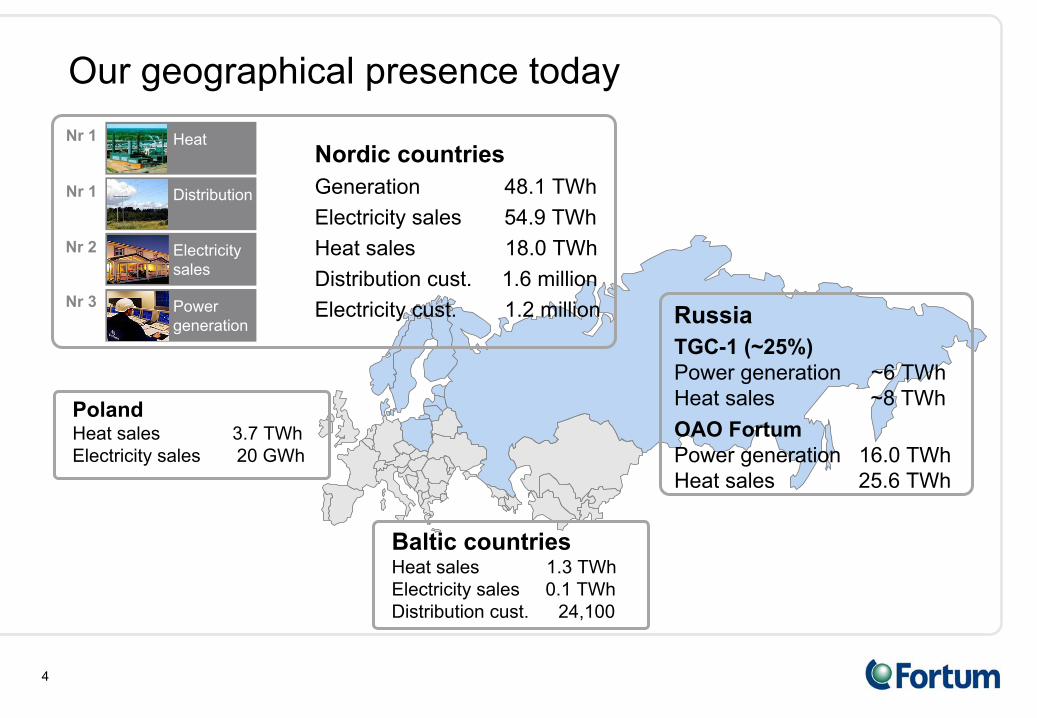
TGC-1 (~25%)Power generation ~6 TWhHeat sales ~8 TWhOAO Fortum Power generation 16.0 TWhHeat sales 25.6 TWh
Russia
PolandHeat sales 3.7 TWh
Electricity sales 20 GWh
Baltic countriesHeat sales 1.3 TWhElectricity
sales
0.1 TWhDistribution cust.
24,100
Our geographical presence today
Nordic countriesGeneration 48.1 TWhElectricity sales 54.9 TWhHeat sales 18.0 TWhDistribution cust. 1.6 millionElectricity cust. 1.2 million
Nr 1
Nr 3
Heat
Electricity sales
Distribution
Power generation
Nr 1
Nr 2

5
Total ~ 6,853 MEUR
1999 2001 20032000 2002 2004
0.18 0.23 0.26 0.310.42
0.58
2005
1.12
Dividend per shareEUR
0.13
1998
0.58
0.54
2006
1.26
0.73
0.53
•
Dividend 2009 EUR 1.00 per share, in total ~EUR 0.9 billion
•
Dividend policy of 50-60% payout of previous year's results on the average
2007
1.35
0.77
0.58
2008
1.00
Capital returns
72% 103% 78% 58%
1.00
2009
68%

6
Fortum’s strategic route
Stockholm
Energi
Gullspång
Birka
Energi50% Fortum
50% Stockholm
Länsivoima→100% E.ON Finland
Separation of oil businesses
Gullspång
Skandinaviska
Elverk
Birka
Energi50% → 100%
StoraKraft
Länsivoima45% → 65%
Elnova50% → 100%
1996 20071997 1998 1999 2000 2001 2002 2003 2004 20062005 2008
IVO
Neste
Østfold
Shares in Hafslund
Shares in Lenenergo
Starting TGC-1
District heat in Poland
2003 →
Divestment of Lenenergo
shares
TGC-10

7
Organisational structure as of 1 October 2009
President and CEOTapio Kuula
Corporate Strategy and R&DSenior Vice President
Maria Paatero-Kaarnakari
Electricity Solutions and Distribution (Espoo)
Executive Vice PresidentTimo Karttinen
Power (Espoo)Executive Vice President
Matti Ruotsala
Heat (Stockholm) Executive Vice President
Per Langer
Russia (Chelyabinsk)Executive
Vice
PresidentAlexander Chuvaev
FinanceExecutive Vice President and
Chief Financial OfficerJuha
Laaksonen
Corporate Relations and Sustainability
Executive Vice PresidentAnne Brunila
Corporate Human ResourcesSenior Vice President
Mikael Frisk
Business Divisions
Staff Functions
Country responsibles: Timo Karttinen / Finland, Norway; Per Langer
/ Sweden, Poland, Baltics; Alexander Chuvaev
/ Russia
Improved
efficiency, accountability, simplicity

8
Foreign investors 30.0%Finnish State 50.8%
Other Finnish investors 9.1%
Households 7.4% Financial and insurance institutions 2.7%
• Leading power and heat company in Nordic countries• Listed at the Helsinki Stock Exchange 1998• Approximately 95,000 shareholders• Among the most traded shares in Helsinki stock exchange• Market cap ~17 billion euros
A leading Nordic power and heat company
31 May 2010

9
Fortum in the Nordic electricity value chain
Fortum Markets
Large customers
Small customers
Other retail companies
Fortum Distribution
Transmission and system services
Nordic wholesale
market
Nordic wholesale
market
Nord Pool and bilateral
FortumPower
Deregulated
Regulated

10
Fortum mid-sized European power generation player, Global #4 in heat
* incl. TGC-5, TGC-6, TGC-7, TGC-9, *** incl. TGC-12, TGC-13Source
Company information, Fortum analyses, 2008 figures
pro forma, ** 2007
Largest producers in Europe and Russia, 2008 TWh
0 100 200 300 400 500 600
Iberdrola
RusHydroFortum
EnBW
Vattenfall+Nuon
CEZ
GDF SUEZ
RWE+Essent
DEI
Edison
PGE
Scottish&Southern
Statkraft
Rosenergoatom
Irkutskenergo
WGC-1
Gazprom
IES
NNEGC Energoat.
EnelE.ONEDF
Power generation
0 20 40 60 80 100 120 140
*) IES
Minsk EnergoKievenergo
Irkutskenergo
Bashkirenergo
RAO ES East
Onexim
TGC-11
TGC-2
Fortum
DongKDHC, Korea
Beijing
DHTGC-14
Lukoil
DalkiaGazprom
Tatenergo
ELCEN, Rom.
**)
Vattenfall
SUEK***)
Heat productionLargest global producers, 2008 TWh

11
Fortum's European power and heat production
Hydro
power 45%
Peat
1%
Coal
4%
Other 2%
Nuclear power 43%
Biomass
2%
European generation 49.3 TWh (Generation capacity 11,155 MW)
Fortum's European power generation in 2009
Natural
gas
3%
European production 23.2 TWh (Production capacity 10,534 MW)
Fortum's European heat production in 2009
Oil
5%Peat
4%
Heat pumps,electricity
14%
Waste 6%
Biomass
fuels22%
Natural
gas20%Other 7%
Coal
22%

12
Fortum's carbon exposure among the lowest in Europe
Source: PWC & Enerpresse, 2009Changement climatique et Électricité
0
200
400
600
800
1000
1200D
EI
Dra
x
RW
E
CEZ
Nuo
n
EDP
Sco
ttish
&S
outh
ern
Vat
tenf
all
Ene
l
Uni
on F
enos
a
E.O
N
Don
g En
ergy
GD
F S
uez
Eur
ope
Iber
drol
a
PVO
Brit
ish
Ene
rgy
EDF
Verb
und
Fortu
m
Sta
tkra
ft
g CO2/kWh electricity, 2008
Average 350 g/kWh
41

13
Fortum’s investment programme –
Nordic region, Poland and Baltic countries
Electricity capacity over 900 MW~95% CO2
-free
Project Electricity, MW Heat, MW Commissioned
Olkiluoto 3, Finland 400 2012Swedish nuclear upgrades 260 by 2013- Forsmark 3 upgrade (to be decided) 30 post 2013Refurbishing of hydro power 20-30 annuallyCzęstochowa, Poland 65 120 Q3/2010(coal/biomass CHP)Pärnu, Estonia 20 45 Q4/2010(coal/biomass CHP)Brista, Sweden (to be decided) 20 60 2013?(waste CHP)Klaipeda, Lithuania 20 50 2013(biofuel/waste CHP)
Total by ~2013 >900 ~300

Fortum today
European power markets
Russia
Financials and outlook

15
Competitiveness Sustainability
Security of supply
•
Implementation of internal energy markets
•
Energy efficiency +20% (2020)
•
Increased resources for technology development
•
Development of cross-border transmission•
Increase in own production•
Enhancement of external energy relations
•
Minimum reduction of EU CO2
emissions 20% (2020)•
Renewables
20% (2020)•
Development of CO2
capture and storage
Key EU objectives by 2020

16
New capacity, except nuclear, will require over 60 EUR/MWh
power price
Other costs ( variation)CO2
cost
Coal Gas Nuclear Hydro Wind Cleancoal
EUR/MWh
Estimated lifetime average cost in nominal 2014 terms.Large variations in cost of new hydro and wind due to location and conditions.
0102030405060708090
100110
0102030405060708090
100110
Source: Nord Pool
EUR/MWh
Futures27 May 2010
1995 -97 -99 -01 -05 -07 -09 -11 -13-03 -15

17
2006
2010
Nov2009
2011
2010-
2013
Market coupling milestones
•
Market coupling between Netherlands (APX), Belgium (Belpex) and France (Powernext) since 2006
•
Market coupling Germany (EPEX Spot) –
Denmark (Nord Pool) started on 9 November 2009. Baltic Cable (Germany –
Sweden) and NorNed
(Norway –
NL) will possibly be included later. •
Market coupling for Central Western Europe (DE, FR, BeNeLux) due to start during spring 2010
•
CWE and Nordic
TSOs
agreed
in October
2009 to develop
a single market
coupling
mechanism
across
their
whole
area•
NL-UK coupling planned trough the BritNed
cable from 2011•
Estonian price area to Nord Pool to be set up in April 2010 with
full integration of the Baltic States during 2011-2013
•
EU’s European Target Model for cross-border power trading
sets 2015 as deadline for an EU-wide market coupling

18
700
2100 600 600
350
Current transmission capacity from Nordic area to Continental Europe is ~4000 MW
CountriesTransmissioncapacity MW
From Nordel To Nordel
Denmark -
Germany 2 100 1 550
Sweden -
Germany 600 600
Sweden -
Poland 600 600
Norway -
Netherlands 700 700
Total 4 000 3 450
•
Theoretical maximum in transmission capacity ~35 TWh per annum
•
Net export from Nordic area to Continental Europe in 2008 was ~15 TWh and in 2009 ~5 TWh
•
Approximately 20 TWh net export fairly easily reachable

19
New interconnections could double the capacity to over
8000 MW by 2020
Nordic and Continental markets are integrating – interconnection capacity could double by 2020
Additional 700 MW cable NO-NL, as well 1400 MW
NO-DE links studied
EU financial support for 700 MW DK-NL link to
connect offshore wind, too
EU support to connect Kriegers
Flak offshore wind area to DK&DE; new 400 kV
AC cable SE-DK by 2017
Jylland
–
DE capacity to be increased by 500 MW in 2012
and by further 500 MW by 2018 LitPol
Link of 1000 MW to connect the Baltic market to Poland by
2015/18. It would open a new transmission
route from the Nordic market to the Continent
New internal Nordic grid investments provide for
increased available capacity for export to the
Continent and Baltics
EU’s European Energy Programme for Recovery to cofinance
to Estlink
2 and NordBalt
1400 MW link to the UK could connect offshore wind, too; North Seas Countries’
Offshore Grid Initiative launched for supergrid
development
In the EU's Second Strategic Energy Review the Commission focuses
strongly on interconnecting the Baltic states and Poland to form an electricity
market around the Baltic Sea

20
Nordic water reservoirs
Source: Nord Pool
Q1 Q2 Q3 Q4
2003 2008 reference level2009 2010
0
20
40
60
80
100
120
rese
rvoi
r con
tent
(TW
h)

21
Demand picking up
Q1/10 consumption increased +7%in the Nordic area(Year-on-year)
Q1/10 consumption increased +6% in Russia(Year-on-year)Tyumen +2%, Chelyabinsk +13%
• Fortum currently expects Nordic power demand to recover back to the 2008 level by 2012-2014
-20 %
-15 %
-10 %
-5 %
0 %
5 %
10 %
15 %
Finl
and
Swed
en
Nor
way
Den
mar
k
Nor
dic
Q2 2009 vs
Q2 2008Q3 2009 vs
Q3 2008Q4 2009 vs
Q4 2008Q1 2010 vs
Q1 2009-20 %
-15 %
-10 %
-5 %
0 %
5 %
10 %
15 %
Tyum
en
Che
lyab
insk
Rus
sia
Ura
lsar
ea
Rus
sia
Q2 2009 vs
Q2 2008Q3 2009 vs
Q3 2008Q4 2009 vs
Q4 2008Q1 2010 vs
Q1 2009

22
0
10
20
30
40
50
60
70
80
90
100
110
1995 1997 1999 2001 2003 2005 2007 2009 2011 2013 2015
Wholesale price for electricity
EUR/MWh Nord Pool
System
Price Forwards
27 May 2010
Source: Nord Pool

23
Nord Pool year forwards
Year 15Year 07 Year 08 Year 09 Year 10 Year 11 Year 12 Year 13 Year 14€/MWh
05
1015202530354045505560657075 27 May 2010
2006Q1 Q2 Q3 Q4 Q1
2007Q2 Q3 Q4 Q1
2008Q2 Q3 Q4 Q1
2009Q2 Q3 Q4 Q1
2010Q2

24
Wholesale prices for electricity
Source: , ATS
Dutch
German
Nordic
Russian*
* Including capacity tariff estimate. E.g
9.4 €/MWh
for 2009 and 2010.
2007 2008 2009 2010 2011
26 May 2010
Spot prices Forward pricesEUR/MWh
0
10
20
30
40
50
60
70
80
90
100
110

25
Fuel and CO2
allowance prices
Source: ICE, Nord Pool
Market prices 27 May 2010 ; 2010-2011 future quotations
Crude oil price (ICE Brent)
020406080
100120140160
USD
/ bb
l
2006 2007 20102008 2009 2011
CO2 price (NP EUA)
05
101520253035
EUR
/ tC
O2
2006 2007 20102008 2009 2011
Coal price (ICE Rotterdam)
04080
120160200240
USD
/ t
2006 2007 20102008 2009 2011
Gas price (ICE NBP)
0
20
40
60
80
100
GB
p / t
herm
2006 2007 20102008 2009 2011

26
Nordic power generation mix
0
20
40
60
80
100
120
140
160
Denmark Norway Sweden Finland
Fossil fuels
Nuclear
Waste
Biomass
Wind
Hydro *
Source: Nordel
TWh/a
Total Nordic generation 398 TWh in 2008
4
20
10
226
54
83
TWh
1
5
3
57
13
21
%
Net import in 2008: -1.5 TWh
*) Normal annual Nordic hydro generation 200 TWh, variation +/-
40 TWh.

27
Current market shares based on 2008 figures.
Still a highly fragmented Nordic power market
Power generation398 TWh
>350 companies
Fortum
Vattenfall
Dong
Energy
Others
Statkraft
30%
E.ONPVO
E-CO
Energi
Agder
EnergiNorsk
Hydro
Helsinki
Electricity
distribution14 million customers~500 companies
SEAS-NVE
Fortum
Vattenfall
Others
Hafslund
E.ON50%
HelsinkiStatkraft
GöteborgSyd
Energi
Dong
Energy
Electricity
retail14 million customers~350 companies
Helsinki
Dong
Energy
Fortum
VattenfallOthers
E.ON52%
Hafslund
SEAS-NVEStatkraft
ÖresundskraftSyd
Energi

Fortum today
European power markets
Russia
Financials and outlook

29
South
KoreaUS
China
Japa
nRuss
iaInd
ia
Canad
a
German
y
France
Nordic UK
Brazil
0500
1,000
1,5002,000
2,500
3,0003,500
4,0004,500
TWh
Data 2008 based on gross output.Source: BP Statistical Review of World Energy June 2009
Russia is the World’s 4th largest power market
30
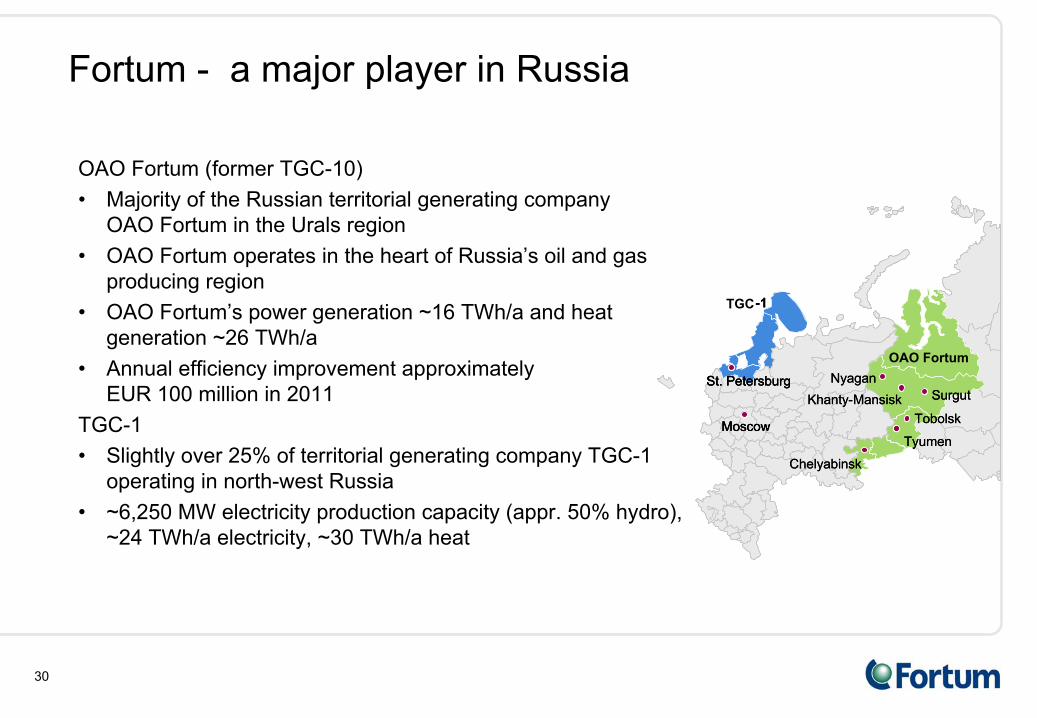
Fortum - a major player in Russia
TGC-10
Surgut
Tyumen
TobolskMoscow
St. Petersburg
Chelyabinsk
NyaganKhanty-Mansisk
TGC-1
OAO Fortum
SurgutSurgut
TyumenTyumen
TobolskTobolskMoscow
St. Petersburg
MoscowMoscow
St. PetersburgSt. Petersburg
ChelyabinskChelyabinsk
NyaganNyaganKhanty-MansiskKhanty-Mansisk
-1
OAO Fortum (former
TGC-10)•
Majority of the Russian territorial generating company
OAO Fortum
in the Urals region•
OAO Fortum
operates in the heart of Russia’s oil and gas producing region
•
OAO Fortum’s power generation ~16 TWh/a and heat generation ~26 TWh/a
•
Annual efficiency improvement approximately
EUR 100 million in 2011
TGC-1•
Slightly over 25% of territorial generating company TGC-1 operating in north-west Russia
•
~6,250 MW electricity production capacity (appr. 50% hydro), ~24 TWh/a electricity, ~30 TWh/a heat

31
"Power industry law" approved
2003Establishment of Russian power exchange (ATS) 2001Launch of the free-trade sector of the wholesale market
in European & Urals
2003in Siberia
2005Launch of balancing power segment
2006Launch of new wholesale market model
2006Restructuring of regional "energos" (P&H companies)
completeFormation of new companies
completeCapacity market –
transitional model
2008Long term capacity market model 2010Competitive market of ancillary services
2010Financial derivatives market
2010Full liberalisation of the wholesale market 2011 onwards
Key steps in the reform Time
Russian power industry reform has progressed well

32
Power market liberalisation – two markets
Capacity market Day ahead (spot) wholesale market
•
Capacity market is the intended mechanism for earning a (reasonable) return on invested capital•
Capacity prices are a big part of a power generator’s income– a typical CHP plant ~35%, CCGT ~55% of revenues
•
In the day ahead (spot) market, the price mechanism is a day ahead hourly auction, variable costs (fuel) a key driver
•
Financial market planned to start in 2010
Capacity price- Capacity auctions (first in Oct 2010)-
A higher, fixed capacity price for new capacity (CSA agreements, >2007)- Lower capacity price for old capacity
Day ahead spot market price- Day ahead spot market auction- 100% liberalised
from 1 Jan 2011- S/D and fuel price key drivers

33
•
Further liberalisation of energy market increased to 60% in January 2010
•
80% in 1 July 2010
•
100% in 1 January 2011
•
The sales to households will remain regulated still after 2011
Share of liberalised trade for existing capacity
5 %10 %
15 %25 %
30 %
50 %60 %
80 %100 %
0 %
10 %
20 %
30 %
40 %
50 %
60 %
70 %
80 %
90 %
100 %
Jan 2007
100 %
July 2007
Jan 2008
July 2008
Jan 2009
July 2009
Jan 2010
July 2010
Jan2011
Power market liberalisation –
wholesale power market will be 100% liberalised in 8 months

34
Day ahead wholesale market prices –
increase driven by recovering demand and gas price
•
Demand back to pre-crisis levels in the overall Russia, Chelyabinsk and Tyumen regions
•
Regulated gas price 24% higher than the average in 2009
–
15% up from Q4/09–
Planned to be increased by 15% in 2011
•
Q1/2010 spark spreads (Urals) above 2009 levels 0
5
10
15
20
25
30
1 5 9 13 17 21 25 29 33 37 41 45 49 1 5 9 13 17 21 25 29 33 37 41 45 49 1 5 9 13
EUR/MWh
20102008 2009
Day ahead market prices for Urals (weekly average)

35
Power market liberalisation – Capacity market
•
Long term rules and price parameters approved•
All kinds of capacity participate in capacity auctions•
“Old”
capacity (pre 2007) and new capacity priced differently–
Old capacity is priced by capacity auctions; first auction for 2011 in October 2010
–
New capacity under capacity supply agreements to receive guaranteed payments
•
The payments for new capacity are based on approved pricing formulas–
Vary according to plant size, fuel, geographic location, capital
costs, …–
Allow the recovery of capital costs and include return on invested capital–
After three years (2014), the regulator will review the earnings
from the electricity-only market and can revise the payments
•
“Old”
capacity prices will depend on auction outcomes, but likely remain relatively low
•
“New”
capacity prices can be 2-3 times the “old”
capacity prices

36
New capacity will receive clearly higher payments than the old
Estimated capacity price for new capacity*, RUB/MW/monthGas condensing (CCGT) Coal condensing
Region >250 MW 150-250 MW <150 MW >225 MW <225 MWSouth 500,000 617,000 771,000 1,048,000 1,130,000Center 524,000 647,000 810,000 1,100,000 1,187,000Urals 554,000 685,000 858,000 1,165,000 1,257,000Siberia 845,000 996,000 1,194,000 1,680,000 1,815,000
Estimated capacity price for new capacity**, EUR/MWGas condensing (CCGT) Coal condensing
Region >250 MW 150-250 MW <150 MW >225 MW <225 MWSouth 17 21 26 35 38Center 18 22 27 37 40Urals 19 23 29 39 42Siberia 28 33 40 56 61
Estimated capacity price for new capacity**, EUR/MWh with a 65% load rateGas condensing (CCGT) Coal condensing
Region >250 MW 150-250 MW <150 MW >225 MW <225 MWSouth 26 32 40 54 58Center 27 33 42 57 61Urals 29 35 44 60 65Siberia 44 51 62 87 94
Source: Market Council, Troika, Fortum*Rate of return 14%, payback period 15 years. YTM of 8.5% for local government bonds (now ~7%)** RUB/EUR at 40, a month with 31 days

37
Capacity payments currently ~1/3 of total revenues for Fortum Russia
•
Last twelve months, Fortum Russia’s revenues were equally split between three components
•
Regulated power sales not relevant post 2010
•
Higher share of capacity payments from new capacity to be commissioned starting 2010
0
5
10
15
20
25
30
Q2 Q3 Q4 Q1 Q2 Q3 Q4 Q1
power sales, liberalised spot power sales regulated capacity revenues
2008 2009 2010
EUR/MWh
Achieved total power price, Russia Division*
22
25
21
18
2122
24
21
6
6
8 9 78
9
7
* Based on realised, disclosed power revenues and volumes; disclosed power and capacity prices

38
• Purchasing
• Portfolio Management and Trading (PMT)
• Heat regulation
• Heat -
technical and business improvements
• Generation -
technical improvements
• Others
Efficiency improvement programme on track in Russia: ~100 MEUR EBIT effect in 2011
•
The programme started in April 2008•
After two years, on track –
about halfway towards the goal

39
Improvement through all key earnings drivers targeted
Development of Heat business
Potential margin increase(power price vs. gas price)
Increased income from new volume sold
Increased income from new capacity(higher payments for new capacity)
Efficiency improvement programme
New capacity and volume through investment programme;appr. 2,270 MW new capacity

40
Over 80% increase in power generation capacity by 2015 through the investment programme
Power generation capacity (MW)
Plant Fuel type Existing Planned Total
Tyumen CHP-2 Gas 755 450 1,205Tyumen CHP-1, Q3/2010 Gas 472 190 662Tobolsk
CHP, Q3/2010 Gas 452 210 662Chelyabinsk CHP-3, Q4/2010 Gas 360 220 580Chelyabinsk CHP-2 Coal, gas 320 320Argayash
CHP Coal, gas 195 195Chelyabinsk CHP-1 Coal, gas 149 149Chelyabinsk GRES Gas 82 82Nyagan
GRES Gas 3x400 1,200Boilers -
Total 2,785 2,270 5,055
(CHP/Condensing)
(CHP/Condensing)(Condensing)
(Condensing)
(Condensing)2007 2015
MW
+82%+2,270 MW
2,785
0
1,000
2,000
3,000
4,000
5,000
6,000
5,055
Fortum today
European power markets
Russia
Financials and outlook

42
Income statement
MEUR I/2010 I/2009 2009 LTM
Sales 1 947 1 632 5 435 5 750Expenses -1 223 -1 033 -3 653 -3 843
Operating profit 724 599 1 782 1 907Share of profit of associates and jv's 16 -33 21 70Financial expenses, net -27 -32 -167 -162
Profit before taxes 713 534 1 636 1 815Income tax expense -130 -111 -285 -304
Net profit for the period 583 423 1 351 1 511Non-controlling interests 24 17 39 46
EPS, basic (EUR) 0.63 0.46 1.48 1.65EPS, diluted (EUR) 0.63 0.46 1.48 1.65
43
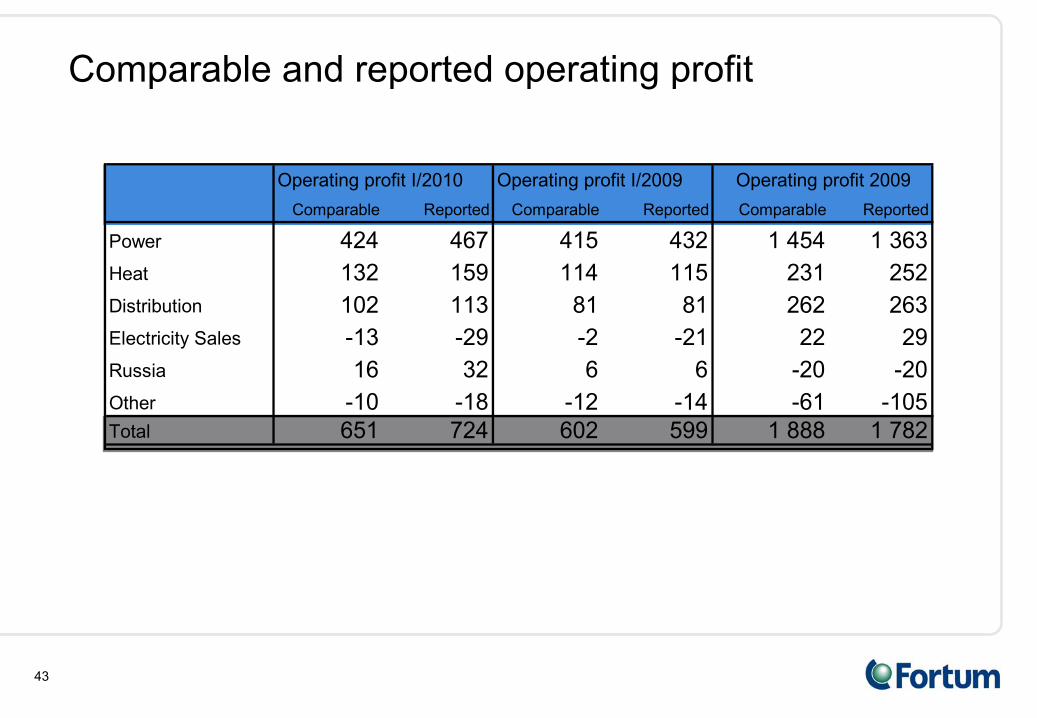
Comparable and reported operating profit
Operating profit I/2010 Operating profit I/2009Comparable Reported Comparable Reported Comparable Reported
Power 424 467 415 432 1 454 1 363Heat 132 159 114 115 231 252Distribution 102 113 81 81 262 263Electricity Sales -13 -29 -2 -21 22 29Russia 16 32 6 6 -20 -20Other -10 -18 -12 -14 -61 -105Total 651 724 602 599 1 888 1 782
Operating profit 2009

44
Cash flow statement
MEUR I/2010 I/2009 2009 LTM
Operating profit before depreciations 861 721 2 292 2 432
Non-cash flow items and divesting activities -67 1 46 -22
Financial items and fx gains/losses -177 139 146 -170
Taxes -82 -14 -239 -307
Funds from operations (FFO) 535 847 2 245 1 933
Change in working capital -14 -25 19 30
Total net cash from operating activities 521 822 2 264 1 963
Paid capital expenditures -223 -180 -845 -888
Acquisition of shares 0 -50 -85 -35
Other investing activities 88 -7 -44 51
Cash flow before financing activities 386 585 1 290 1 091

45
Current Fortum Group financial targets
•
Return on capital employed
12%
•
Return on shareholder's equity
14%
•
Net debt/EBITDA
3.0–3.5
46
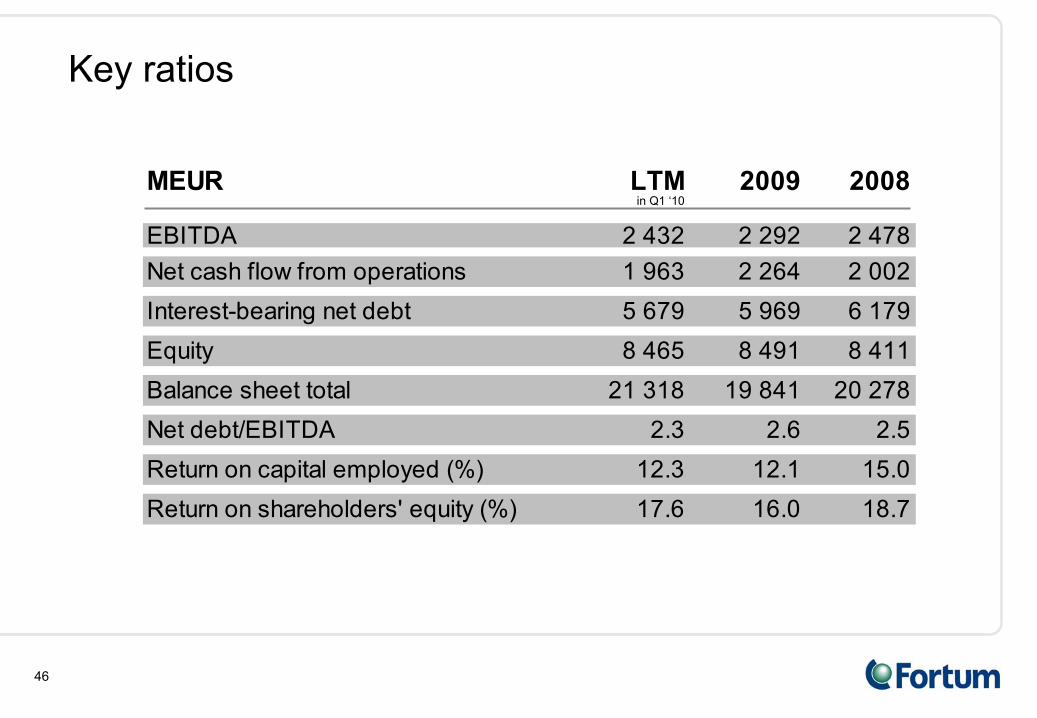
MEUR LTM 2009 2008
EBITDA 2 432 2 292 2 478Net cash flow from operations 1 963 2 264 2 002Interest-bearing net debt 5 679 5 969 6 179Equity 8 465 8 491 8 411Balance sheet total 21 318 19 841 20 278Net debt/EBITDA 2.3 2.6 2.5Return on capital employed (%) 12.3 12.1 15.0Return on shareholders' equity (%) 17.6 16.0 18.7
Key ratiosKey ratios
in Q1 ‘10

47
Capital expenditures, 2010 vs. 2009
•
Original plan and guidance:–
EUR 0.8-1.2 billion for the next 4-5 years
–
2009 and 2010 likely to be closer to the upper end of the range
•
2009 capex
was EUR 862 million
•
2010 capex
is expected to exceed the original EUR 1.2 billion upper end of the capex
range
–
Capex
shifting from 200996 88
358 350
188 181
215 285
0
200
400
600
800
1000
1200
1400
1600
2009
Power Heat Distribution Russia
2010
Planned for 2009, not realised
Capex
planned for 2009
Last twelve months
EUR million

48
Capital expenditures post 2010
•
Annual capital expenditures EUR 0.8-1.2 billion
•
Maintenance/productivity EUR 300–500 million p.a.
•
Growth in Nordic and Baltic rim countries EUR 200-400 million p.a.
•
Investments in Russian growth on average EUR 300 million per annum –
but more in near future
Maintenance
Growth
Russian growth
~ EUR 300–500 m
~ EUR 300 m
~ EUR 200–400 m
Estimated annual Capex
2011-2013

49
Debt maturity profile
per 31 March, 2010 per 31 December, 2009Duration
(years)
1.8
1.8Average
interest
rate
(incl. swaps
and forwards)
3.0 %
3.4 %Portion
of floating
/ fixed
debt
63 / 37 %
62 / 38 %
MEUR
2010 980
2011 645
2012 525
2013 560
2014 1,172
2015 322
2016 858
2017 220
2018 78
2019 799
2020+ 1,0180
250
500
750
1000
1250
2010 2011 2012 2013 2014 2015 2016 2017 2018 2019 2020+
Bonds Financial institutions Other long-term debt CPs Other short-term debt

50
Liquidity at the end of Q1/2010
MEUR Available Outstanding Total amountSHORT TERM FINANCING
Commercial Paper ProgrammesFinnish CP Programme 364 136 500SEK 5.000 M Swedish CP Programme 241 274 515
604 410 1 015LIQUID FUNDS AND COMMITTED CREDIT LINES
Committed Credit Lines Short Term 214 0 214Long Term 2 700 0 2 700
2 914 0 2 914Liquid FundsCash and cash equivalents 1 103Bank Deposits over 3 months 395
1 498of which in Russia 583Total Available Cash and Committed Financing 4 412

51
Hedging of Power division's Nordic sales
Hedge ratio Hedge price
rest of 2010 ~ 75% ~ EUR 44 per MWh
Status at the end of March 2010(Status at the end of Dec 2009)
(~70%) (~ EUR 44 per MWh)
2011 ~ 45% ~ EUR 43 per MWh(~40%) (~ EUR 42 per MWh)

52
A strong platform for future
•
The market driven production company –
growing in Power, #4 in Heat globally
•
The fundamental drivers for the European power markets still in place: the need for new capacity, market integration, CO2
mitigation
•
Carbon exposure among the lowest among European power utilities
•
Significant growth in Russia through the investment and efficiency improvement programmes
•
Efficiency, accountability and simplicity –
the new organisation
with new potential
•
Strong financial performance and financial headroom