forty-seventh progress report of the cooperative forest
TRANSCRIPT

FORTY-SEVENTH
PROGRESS REPORT
OF THE
COOPERATIVE
FOREST TREE IMPROVEMENT
PROGRAM
By
T. D. Byram, F. E. Bridgwater,G. D. Gooding, and W. J. Lowe
Circular 306
December 1999
TEXAS FOREST SERVICEa Member of
The Texas A&M University System
An Equal Opportunity Employer

2

3
TABLE OF CONTENTS
INTRODUCTION..................................................................................................................................................... 5WESTERN GULF FOREST TREE IMPROVEMENT PROGRAM......................................................................... 6
Highlights............................................................................................................................................................6Seed Orchards.....................................................................................................................................................6
Orchard Establishment and Roguing.......................................................................................................6Orchard Yields........................................................................................................................................8Genetic Fingerprinting............................................................................................................................8Super-Breeding Groups...........................................................................................................................8
Timing of Bag Application and Removal in Controlled Mass Pollination.............................................................9Risk Analysis of Controlled Mass Pollination.....................................................................................................10Top Grafting......................................................................................................................................................11Wood Quality.....................................................................................................................................................12First-Generation Breeding and Progeny Testing.................................................................................................12
Slash Pine.............................................................................................................................................13Genetic Mechanisms for Disease Resistance............................................................................13Slash Pine Demonstration Plantings........................................................................................14
Loblolly Pine.........................................................................................................................................14Lower Gulf Elite Breeding Population.....................................................................................15
Test Measurement and Second-Generation Selection Activity.............................................................................16Second-Generation Breeding and Testing...........................................................................................................16Additional Activities...........................................................................................................................................16
Contact Representatives’ Meeting.........................................................................................................16Web Sites...............................................................................................................................................17Western Gulf Tree Improvement Short Course.......................................................................................17Seed Orchard Pest Management Subcommittee.....................................................................................18Formal Reviews....................................................................................................................................19Forest Genetics Research at Texas A&M University..............................................................................19
HARDWOOD TREE IMPROVEMENT PROGRAM............................................................................................. 19Highlights..........................................................................................................................................................19Tree Improvement..............................................................................................................................................19
Progeny Testing.....................................................................................................................................19Selections and Seed Orchards...............................................................................................................21
Natural Regeneration........................................................................................................................................22PERSONNEL.......................................................................................................................................................... 23PUBLICATIONS..................................................................................................................................................... 24COOPERATIVE TREE IMPROVEMENT PROGRAM MEMBERS.................................................................... .24
Western Gulf Forest Tree Improvement Program Membership............................................................................24Pine Program........................................................................................................................................24Hardwood Program..............................................................................................................................24
Urban Tree Improvement Program.....................................................................................................................24FINANCIAL SUPPORT.......................................................................................................................................... 24

4

5
The Western Gulf Region of the United States has expe-rienced two consecutive years of drought. While the 1999weather was not as severe as the drought of 1998, these dryyears have had a cumulative effect on the tree improvementprograms in the region. The drought has contributed to a short-term increase in demand for operational seedlings. Most of theregion’s nurseries are operating at near capacity and are pro-jected to do so for the next few years. This is reducing seedinventories and placing greater pressure on seed orchards toincrease seed production.
Demand for seed is increasing as the cooperative shiftsfrom a dependence on older, rogued first-generation orchardsto younger, advancing-front orchards. These younger orchards,while of higher genetic value, have more variable seed crops.The variability of the seed crop has also been exacerbated bythe weather. Seed harvests were at record highs in 1996 andvery good in 1998. However, the crop failed almost completelyin 1997 and appears to be less than normal in 1999.
Drought related mortality resulted in the loss of somecritical progeny tests, which delayed the completion of the first-generation breeding and testing program for some members.Despite this setback, five members have now completed loblollypine first-generation field test establishment. Three moremembers will conclude this phase of the program if the 1999 fallplanting season is successful. Diallel breeding in the slash pineprogram is also progressing rapidly. More slash pine selectionswere established in control-pollinated field plantings in 1999than in any other single year. First-generation breeding has beencompleted in 90 percent of the loblolly pine diallels and 70percent of the slash pine diallels. In many of the remaininggroups, only a few crosses were uncompleted.
The drought also delayed orchard establishment in someprograms because of poor rootstock development. This has beendisappointing, as maximizing the genetic gain in an advancing-front orchard requires that older orchard blocks be replaced ina timely manner with genetically advanced material. Of the tenmembers with plans to graft new orchard blocks in 1999, fivewere able to do so. Six members have orchard expansion orreplacement plans for 2000.
Orchard replacement efforts will take advantage of therecord number of progeny tests evaluated in 1999. These testsare making continued gains possible in the orchard program bysupplying information on previously untested parents. Becauseof renewed interest in wood quality and increased emphasis onmill profitability as a selection criteria, identifying individualsthat combine both excellent volume growth and high wooddensity is becoming more important. Since these traits are poorlycorrelated, selecting parents with improvement in both charac-teristics requires screening a large number of individuals. Thisrecord amount of new data is valuable in designing new seedorchards with combinations of desirable traits.
The cooperative identified a total of 127 loblolly pine andsix slash pine second-generation selections in 1999. This wasthe largest number of second-generation selections ever iden-tified in a single season. Fourteen of the cooperative’s sixteenmembers contributed to this endeavor by measuring and evalu-
ating a record number of progeny tests. Almost all selectionswere identified during the test measurement season, and mostwere immediately top grafted to promote early flowering foradvanced-generation breeding.
The cooperative continued to investigate the genetic rela-tionships between growth, wood specific gravity, and microfibrilangle. Preliminary results have suggested that microfibril angleis under genetic control. The cooperative has an excellent setof wood samples from several older control-pollinated progenytests that can be used to investigate this trait and its relationshipto other characteristics. This long-term study will be completedin stages and may have important implications for improvingsolid wood products as well as pulp mill profitability.
Several organizations are currently evaluating controlledmass pollination (CMP) programs with pilot scale studies anda few programs are beginning to supply seed in sufficientquantities for operational regeneration programs. However, themagnitude of losses from pollen contamination and poor polli-nation success is still uncertain. Two studies designed to answerthese questions are described in this report. The first found thatthe level of pollen contamination could be minimized even whenthe installation and the removal of isolation bags were less thanoptimal. The second study examined the variation in seed costwith variable pollination success. This study found that theinexpensive seed produced in good years more than offsets thecost of expensive seed produced in years with crop failures.
The first Tree Improvement Short Course organized by thecooperative in 10 years was held in 1999. In the past, this typeof training session was designed for new employees. However,as tree improvement changes from first-generation to advanced-generation breeding, breeding objectives and types of popula-tions are proliferating. These changes made this year’s sessiontimely for tree improvement veterans as well as new workers.
The members of the Hardwood Tree Improvement programwere active in natural stand management research in additionto the traditional tree improvement program in 1999. TempleInland Forest collected first-year data on its intensive hardwoodmanagement program while Potlatch Corporation collected 15-year data from its hardwood natural regeneration study.
Activities in the traditional tree improvement program in-cluded test measurement and establishment. The membersmeasured 25 progeny tests, which were either Nuttall oak orcherrybark oak with one exception. Two of the six Nuttall oakprogeny tests planted during the 1997/98 planting season werelost because of the extended drought in 1998. The remainingtests will be used to determine which selections will be graftedinto future seed orchards. The cherrybark oak tests measuredthis year were 15 and 20 years old. As with previously mea-sured tests, outstanding families at younger ages continued toperform well in later measurements.
The last series of Nuttall oak progeny tests was planted infive locations in 1998/99. This brings the total number ofactive tests for this species to 22 with a total of 216 familiesrepresented. During the summer of 1999, the ArkansasForestry Commission and Temple-Inland Forest also grewseedlings for the first second-generation sweetgum progeny
INTRODUCTION

6
tests in the cooperative. These tests are a collaborative projectwith the N. C. State University – Industry Hardwood ResearchProgram and contain selections from both programs.
Data from the natural regeneration study collected byPotlatch Corporation indicated that site-preparation treatment
grafting in 2001. Only one member removed an orchard fromproduction in 1999. The number of orchard acres within thecooperative increased slightly in 1999 and should continue toincrease slowly over the next few years. This is the result ofshortening the economic rotation age of orchards, increasingseed demands in some programs, and uncertainty surroundingcone and seed insect control methods.
Genetic fingerprinting using microsatellite DNA markerswas used for the first time in the seed orchard program in 1999.By using these markers, it was possible to verify that rametswith different growth habits and appearance were, in fact, fromthe same ortet. This confirmed the correct composition of anadvanced-generation seed orchard block and authenticated acontrol-pollinated seed lot.
One of the most significant events for the seed orchardprogram in 1999 occurred outside the cooperative. The federalpesticide use registration for Guthion®,1 the standard for coneand seed insect control for many years, was temporarily lost.Without Guthion®, cone and seed insect control programswould be forced to depend solely on synthetic pyrethroids, aclass of chemicals known to cause secondary insect problemsin seed orchards. The registration for Guthion® was restoredwith a significant reduction in application rates and improvedworker safety standards. This negotiation and other activitiesof the Seed Orchard Pest Management Subcommittee aredescribed later in this report.
Orchard Establishment and Roguing
Five organizations grafted a total of 74 acres of new loblollypine seed orchard blocks in 1999. This included 24 acres ofadvanced-generation loblolly pine seed orchard established byLouisiana Pacific Corporation, the cooperative’s newestmember (Figure 1). The Louisiana Pacific Corporation’s firstattempt at grafting was extremely successful, establishing 95percent of the seed orchard with minimal transplanting. This wasdespite an attack of coneworms that occurred immediately aftergrafting. This insect, which had not been previously observedon new grafts, tunneled through the stems close to the graft unioncausing most of the early mortality.2 Louisiana Pacific Corpo-ration also established an additional 24 acres of rootstock forgrafting in 2000. This accelerated orchard establishmentprogram will make the company self-sufficient for improved seedas quickly as possible.
The Mississippi Forestry Commission grafted the first blockof advanced-generation orchard for North Mississippi (Figure2). Establishment of this orchard had been delayed until it couldbe designed using the results from regional progeny tests. The
Highlights
Five members grafted 74 acres of new loblolly pine seedorchard blocks in 1999. These included LouisianaPacific Corporation’s first orchard and the first advanced-generation orchard designed specifically for NorthMississippi.
The 1998 seed harvest was the second largest on record,behind only the excellent 1996 crop. These two outstand-ing years flanked the poorest harvest on record in 1997.
Preliminary results from three unrelated families suggeststhat microfibril angle may be under genetic control. Thesefamilies are part of a larger study to examine therelationships among growth rate, wood specific gravity,and microfibril angle.
First-generation loblolly pine breeding is approachingcompletion: eight members have established all of therequired field tests and breeding is completed for 90percent of the diallels.
A total of 127 loblolly pine and six slash pine second-generation selections were identified in 1999. Mostof these selections were immediately top grafted topromote early flower production in support of thecooperative’s commitment to shorten the next generation’sbreeding cycle.
A Tree Improvement Short Course designed as anintroduction to genetics, applied tree breeding, and seedorchard management was attended by more than 60people. Excellent presentations from invited speakers wereaugmented by an outstanding field trip hosted by Inter-national Paper Company at their Nacogdoches Forest TreeSeed Laboratory and Seed Orchard Complex.
Seed Orchards
Ten organizations planned seed orchard expansions in1999. However, poor rootstock development caused by thedrought resulted in only five organizations grafting new seedorchards in 1999. Six members, including the five that had todelay their 1999 plans, will expand or replace orchard blocksin 2000. Four more members have planted rootstock for
significantly impacted the amount of oak stocking after15 years. Any site-preparation treatment increased the amountof oak present in the new stand; however, the high sheartreatment resulted in the largest amount of oak stocking.
WESTERN GULF FOREST TREE IMPROVEMENT PROGRAM
•
•
•
•
•
•
1 Mention of trade names is solely to identify material and does not imply endorsement by the Texas Forest Service or the Western Gulf Forest Tree Improvement Program, nor does it implythat the discussed uses have been registered.2 The cooperative is grateful to Don Grosman for the quick diagnosis of this problem.

7
Mississippi Forestry Commission is the only member testing inthis region; however, this orchard also includes the best selec-tions from central Mississippi, North Louisiana, and Arkansas.
Other members grafting new orchard blocks in 1999included Oklahoma Forestry Services, WeyerhaeuserCompany, and The Timber Company. Genetic gain for the mostrecently established orchard blocks averaged 29.9 percentabove the unimproved local checklot (Figure 3). Continuedgenetic improvement in the production population was possiblebecause of the quick incorporation of new information fromthe record number of five-year-old progeny tests measuredduring the 1998/99 season.
Boise Cascade and Champion International rogued first-generation and advanced-generation orchards in 1999. TheLouisiana Department of Agriculture and Forestry also rogued alongleaf pine seedling seed orchard. The unplanned thinningcaused by Hurricane Georges in one of the other longleaf pine seedorchards was highlighted in the 46th Progress Report of the Co-operative Forest Tree Improvement Program (p. 8). This orchard,at the Mississippi Forestry Commission’s Craig Seed Orchard,continued its recovery (Figure 4). Genetic data from the long-termprogeny tests will be used for the next scheduled roguing.
Only one orchard in the cooperative was removed fromproduction in 1999. This was a 18.2 acre drought-hardyloblolly pine seed orchard maintained by the Texas Forest Ser-vice at their Magnolia Springs Seed Orchard Complex. Seedfrom this orchard had not been collected for several years, andthe land was needed to expand the East Texas advancing-frontseed orchard. Irrigation has been installed on ten acres of thisarea for rootstock establishment this fall with grafting plannedfor 2001. Currently, the cooperative manages a total of 2,158acres of seed orchard (Figure 5). Of this number, 903 acres, or42 percent, are advanced-generation orchards.
Orchard Acres
0
500
1000
1500
2000
2500
73 75 77 79 81 83 85 87 89 91 93 95 97 99Year
Acr
es
First Advanced Total
Figure 5. Seed orchard acres managed by the cooperative.
Figure 1.Greg Garciaand one ofLouisiana PacificCorporation’sgrafts in theirnew 24 acreorchard block.
Figure 2. RobertStewart examinesthe excellent first-year growth for theMississippi ForestryCommission’s firstblock of advanced-generation NorthMississippi loblollypine orchard.
Figure 4.The MississippiForestryCommission’slongleaf pineseedling seedorchard one yearafter HurricaneGeorges.
18
20
22
24
26
28
30
32
Bre
edin
g V
alue
94 95 96 97 99Year
Gain For New Loblolly Pine Orchards
Figure 3. Gain in breeding value for volume growth averagedover new loblolly pine seed orchards by year of establishment.

8
Orchard Yields
Seed orchard yields have been extremely variable over thelast few years. The nearby complete failure of 1997 wasfollowed by the second largest harvest on record in 1998 (Fig-ure 6). The harvest totaled 53,761 pounds of loblolly pine seedand 5,063 pounds of slash pine seed. The excellent seedharvest in 1998 resulted from a very large cone crop, as seedyields were only moderate. The cooperative averaged 1.19pounds of seed per bushel for loblolly pine and 1.08 pounds ofseed per bushel for slash pine. Despite the average seed yields,excellent results were obtained in some orchards. One of theArkansas Forestry Commission’s orchards had the highestyield in the cooperative with 1.63 pounds of seed extracted perbushel. The Timber Company followed closely with an orchardyielding 1.57 pounds of seed per bushel. In all, eight orchardshad yields in excess of 1.3 pounds of seed per bushel.
Over 20,000 pounds of seed, nearly half the 1998 crop,were harvested from advanced-generation orchards. The ad-vancing-front orchard program has progressed to the pointwhere four organizations were able to collect their entire cropfrom these orchards. Most other programs harvested from bothadvanced-generation orchards and rogued first-generation or-chards. The older, first-generation orchards are increasinglyrelegated to supplying seed from only selected open-pollinatedfamilies or for controlled mass pollination programs.
The 1999 cone harvest totaled 25,882 bushels of loblollypine cones and 2,325 bushels of slash pine cones. Smallamounts of shortleaf pine and Virginia pine were also harvested.Harvests of loblolly and slash pine were below expectationsbased on midsummer cone inventories due to a combination offactors. Contract labor and equipment used by the majority ofour members for cone harvest were in short supply. The collec-tion season was shorter than normal due to dry fall weather.However, the main reason for the disappointing crop was late-season damage to a significant number of this year’s cones. Aportion of this damage could be attributed to an August outbreakof coneworms. However, not all of the damage was clearly dueto insects and other factors may have also been important. Earlyreports of seed extraction efforts from across the region indicatethat seed yields may also be below normal.
Genetic Fingerprinting
Several members of the cooperative have providedDr. Claire Williams’ laboratory with foliage samples to aid inthe development of DNA markers. These markers were putto practical use in the seed orchard program in 1999. Differ-ences were reported in growth habit, needle color, and overallvigor among ramets of LSG-191 in several seed orchards.To determine if some of the ramets were mislabeled, fourteenfoliage samples were collected by seven organizations. Fourorganizations each sent two foliage samples representing twomorphological types of LSG-191. Two organizations sent onlyone foliage sample because all the ramets of LSG-191 intheir orchards appeared to be from the same clone. Oneorganization collected four samples, two each from twodifferent morphological types of LSG-191. Unfortunately, itwas impossible to sample the ortet as the original selection nolonger existed.
DNA was extracted from the needles and microsatellitefragments were amplified using a technique similar to that usedin human forensics. These techniques reveal differences inDNA sequences that vary widely even among closely relatedindividuals. Six different highly variable markers were used,so the odds of different clones having the same markergenotypes would be infinitesimal. The results of the DNAfingerprinting indicated that all 14 samples were geneticallyidentical and could only be ramets of the same ortet. Therefore,the apparent morphological differences must be attributedto environmental causes such as the early signs of graftincompatibility.
DNA fingerprinting is a powerful tool that will be usedfor tree improvement applications more frequently in thefuture. Isozymes and other biochemical methods havebeen used in the past to verify the genetic identity of clones inproduction orchards and the integrity of crosses in thebreeding program. DNA markers will likely be used in thefuture for these applications because they are faster, lessexpensive, and less ambiguous. They also have other potentialuses. Pedigree verification will become more important inadvanced-generation breeding where the selection of acontaminating seedling in an inbred family would be a majorliability. Fingerprinting deployment populations may alsobecome more important because of the increased productioncosts associated with controlled mass pollination andvegetative propagation programs.
Super-Breeding Groups
Four more super-breeding groups, including the first forthe Oklahoma Forestry Services, were designed in 1999 tobring the total number of these elite populations to 12. Becausesuper-breeding groups use a backward selection procedure,their formation must be delayed until progeny test informationis available for a majority of the parents in at least twobreeding groups. Six members are now actively breeding tosupport this program, and two members have established blockplots in which selections will be made.
The performance of super-breeding group selections willbe compared to that of forward selections made simultaneously
Harvest
0
10000
20000
30000
40000
50000
60000
70000
86 87 88 89 90 91 92 93 94 95 96 97 98
Year
Pou
nds
of S
eed
Loblolly Slash
Figure 6. Pounds of seed harvested by the cooperative from1986 to 1998.

9
in the mainline breeding program. This will be accomplishedby including polymix progeny from these selections in theadvanced-generation polymix tests. This is another example ofthe important contribution that top grafting is making to treeimprovement. The ability to substantially shorten the breedingcycle makes it possible to evaluate new breeding strategies sothey can be appropriately integrated into the program.
Timing of Bag Application and Removal inControlled Mass Pollination3
Controlled mass pollination (CMP) among outstandingparents is one way to increase genetic gains from traditionalwind-pollinated seed orchards, but the economic success ofCMP depends on both genetic gains and costs. CMP has beenshown to be cost-effective even when costs were adjusted forrisk.4 These studies assumed that CMP was completelyeffective. That is, there was no pollen contamination during theCMP process that would reduce the expected gains frommating outstanding parents. This assumption is not always metunder operational conditions due to variable strobilusdevelopment and the limited amount of time to conduct CMP.Therefore, it is important for producers of CMP seeds to knowhow much contaminated seed might be produced underoperational conditions.
Eleven treatment combinations were applied to rametsof two female parents in Weyerhaeuser’s grafted loblolly pineseed orchard in Lyons, GA. The first group of three treatmentsexamined the effects of applying pollination bags at differentfemale strobilus developmental stages. In this group oftreatments, the bags were applied when female strobili were instages 2, 3, and 4, respectively; no pollen was applied; and bagswere removed ten days after maximum female receptivity.Thus, any seeds produced from these treatments could haveoccurred only from contaminating pollen. The second groupof three treatments was the same, except that controlled masspollination was performed twice while female strobili werein stages 4.5 to 5.5. In this group of treatments, pollen fromthe desired parents competed with contaminating pollen thatmay have entered pollen chambers before bagging. A thirdgroup of treatments examined the effects of removing bags atdifferent intervals following pollination. In the first, bags were
applied at female strobilus stage 2, pollen was applied twiceat stages 4.5 to 5.5, and bags were removed at one of threeintervals: immediately, two, or eight days following the secondpollination. A fourth group of two treatments was examinedto test various operationally efficient combinations of thevariables under study. In each of these treatments, the bagswere applied at female strobilus stage 3 and removed two daysafter the last pollination. In one of these, a single pollinationwas made at maximum female strobilus receptivity (stage 5.0).In the other, two pollinations were made as before. Pollen fromthree different male parents was applied to each treatmentcombination that received artificial pollinations.
Cone and filled seed counts were made for each treatment.Selected treatments for two crosses (81069 x 81056 and 81069x 71022) that produced sufficient numbers of filled seedswere sent to the National Forest Genetics ElectrophoresisLaboratory (NFGEL) in California for paternity analysis todetermine the level of contamination for each treatment.Seeds were genotyped at 22 isozyme loci for 1,013 megagame-tophyte/embryo pairs. Both unambiguous and cryptic contami-nation levels were estimated. Cryptic contamination levels(ambiguous genotypes with regard to male parentage) wereextremely low (less than 1 percent) and are not reported here.
The level of contamination in one cross (81069 x 71022)was so high (all treatments had 30 to 50 percent contamina-tion) we concluded that the pollen source was not pure.Therefore, the results from the electophoretic analysis arereported only for a single cross (81069 x 81056).
Examination of the first group of treatments, whichreceived no artificial pollinations, showed that pollen contami-nation occurred if female strobili were bagged after stage 2(Table 1). This group of treatments is useful only to illustratethat pollen contamination can occur if bagging is delayed.Since artificial pollinations were not made, contaminatingpollen did not have to compete for space in pollen chamberswith applied pollen.
Even though contaminating pollen may be present beforebags are applied, adequate and timely artificial pollination mayreduce the number of seeds produced from contamination toacceptable levels. Paternity analysis revealed that there wereno seeds produced from contaminating pollen with two artifi-cial pollinations even when bags were applied at female stro-
Table 1. Numbers of cones / filled seeds per cone after bagging at strobilus stages 2, 3, and 4 with no pollen applied.Bags were removed 10 days after maximum receptivity.
Strobilus Developmental Stage When Bagged
Female Male 2 3 4
81028 71037 0 0 2 / 3081069 0 0 5 / 2181077 0 1 / 0 8 / 18
81069 71022 0 0 081056 0 1 / 26 091039 0 0 0
3 Submitted by F.E. Bridgwater, D. L. Bramlett, and V. D. Hipkins. We wish to thank Weyerhaeuser Co. and their Lyons, GA seed orchard staff for their contribution to this study.4 Bridgwater, F.E., D.L. Bramlett, T. D. Byram and W. J. Lowe. 1988. Controlled mass-pollination in loblolly pine to increase genetic gains. The Forestry Chronicle. 74(2): 185-189 andByram, T.D. and F.E. Bridgwater. 1999. Risk analysis of loblolly pine controlled mass pollination programs. Proc. 25th Southern Forest Tree Impr. Conf. New Orleans, LA. In press. Also seethe next section ‘Risk Analysis of Controlled Mass Pollination’.
Timing of Bag Application and Removal inControlled Mass Pollination3
Table 1. Numbers of cones / filled seeds per cone after bagging at strobilus stages 2, 3, and 4 with no pollen applied.Bags were removed 10 days after maximum receptivity.

10
bilus stage 4 (Table 2). When bags were removed two days afterthe second pollination (Treatment 3*), rather than ten days asin the other treatments, a small amount (2 percent) of contami-nant seed was produced.
The results from the remaining treatments (Table 3) showthat it is unwise to remove bags immediately following artifi-cial pollination at maximum receptivity (Treatment 0) or to pol-linate only once (Treatment 2*). Although these two optionswould be operationally desirable, they resulted in 41 and 66percent seeds from contaminating pollen, respectively.
Although pollen contamination can occur when femalestrobili are bagged after developmental stage 3, adequate andtimely artificial pollinations can reduce the proportion ofcontaminant seeds to inconsequential levels. High proportionsof seed produced from contaminant pollen resulted fromremoving pollination bags sooner than two days followingpollination at maximum female strobilus receptivity ormaking only one pollination.
Risk Analysis of Controlled Mass Pollination
The average production cost for controlled mass pollinated(CMP) programs has been estimated to be approximately $0.05
per seed. The cost per seed is influenced by several factorsincluding the number of female strobili per isolation bag, thecost of CMP per bag, and the number of seed recovered fromeach flower pollinated. These factors may vary widely amongcrosses and years and are only partly under operator control.An assessment of risk can be made by determining the prob-ability of exceeding internal break-even costs.
The number of female strobili per isolation bag andthe cost of CMP per bag, which includes the cost of pollencollection, the installation and removal of the isolation bag, andthe pollen application, are all under operator control and canbe estimated from pilot-scale programs. Pollination success, thenumber of seed obtained per flower pollinated, is a complextrait that depends on the weather, clonal selection, pollenviability, the timing of pollination, and insect predation. Theeffect of each of these factors on seed cost can be estimated byevaluating pollination success based on past experience withcontrolled pollination for the production of progeny test seed.
Cost data and estimates of strobili per bag from twopilot-scale CMP programs combined with estimates of seedproduction per strobilus from three different controlled polli-nation programs were used to estimate CMP production costs.
Table 3. Numbers of cones / filled seeds per cone for bag removal 0, 2, or 8 days after the last pollination. Twopollinations were made at stages 4.5 and 5.5. Numbers in parentheses for cross 81069 x 81056 are percentages ofseeds produced from contaminating pollen.
Strobilus stage at bagging
2 3
Days after last pollination to bag removal
Female Male 0 2 8 2 2 *
81028 71037 1 / 70 0 1 / 65 8 / 84 4 / 7281069 0 0 2 / 45 13 / 52 3 / 981077 2 / 0 0 1 / 2 9 / 3 2 / 6
81069 71022 2 / 58 6 / 100 8 / 64 4 / 84 5 / 10481056 5 / 79 (41%) 1 / 24 (0 %) 1 / 36 7 / 122 6 / 185 (66%)91039 4 / 40 - 8 / 57 6 / 47 -
* Same treatment as 2, but only one pollination at strobilus stage 5.0.
Table 2. Numbers of cones / filled seeds per cone after bagging strobili at stages 2, 3, and 4. Two pollinations weremade at stages 4.5 and 5.5 and bags were removed 10 days after the first pollination. Numbers inparentheses for cross 81069 x 81056 are the percentage of seeds produced from contaminating pollen.
Strobilus Developmental Stage When Bagged
Female Male 2 3 4 3*
81028 71037 1 / 34 7 / 78 4 / 50 8 / 6781069 5 / 34 14 / 34 7 / 40 2 / 3381077 0 7 / 0.3 6 / 55 5 / 12
81069 71022 1 / 62 4 / 119 9 / 88 11 / 5981056 6 / 62 (0 %) 5 / 57 (0 %) 8 / 43 (0 %) 10 / 65 (2%)91039 4 / 45 5 / 41 3 / 66 5 / 106
* Same treatment as 3, but bag was removed 2 days after the second pollination.
Table 3. Numbers of cones / filled seeds per cone for bag removal 0, 2, or 8 days after the last pollination. Twopollinations were made at stages 4.5 and 5.5. Numbers in parentheses for cross 81069 x 81056 are percentages ofseeds produced from contaminating pollen.
Table 2. Numbers of cones / filled seeds per cone after bagging strobili at stages 2, 3, and 4. Two pollinations weremade at stages 4.5 and 5.5 and bags were removed 10 days after the first pollination. Numbers inparentheses for cross 81069 x 81056 are the percentage of seeds produced from contaminating pollen.
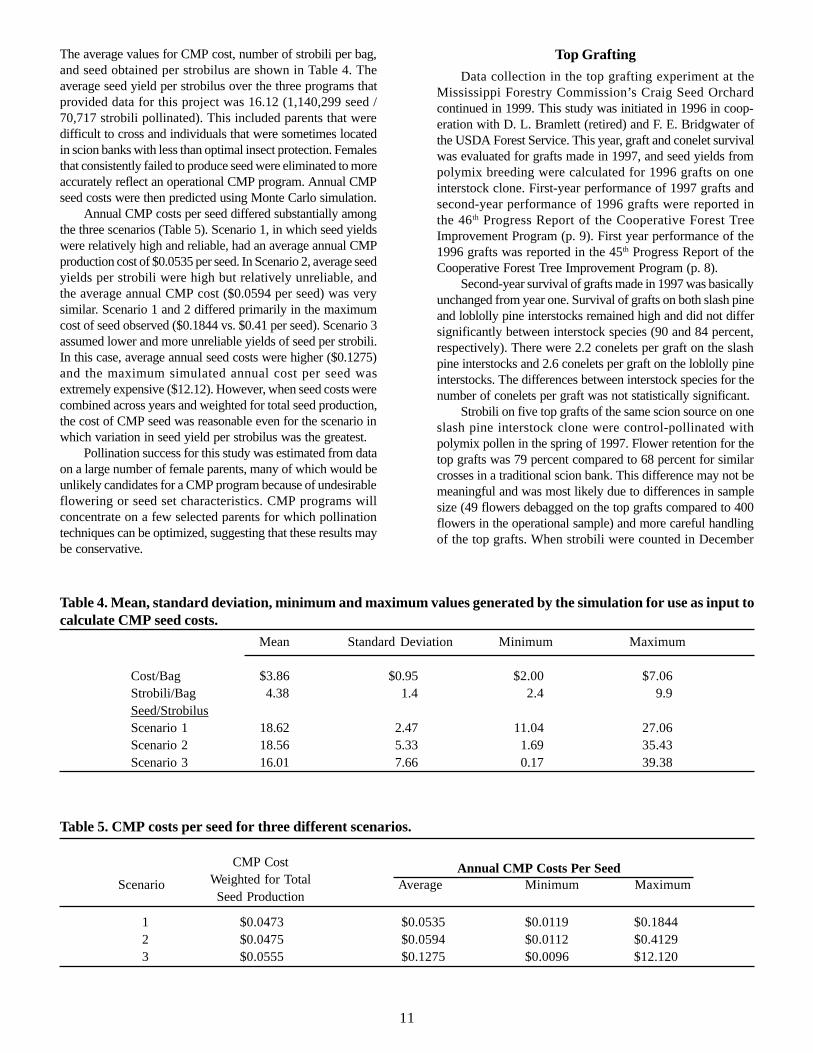
11
The average values for CMP cost, number of strobili per bag,and seed obtained per strobilus are shown in Table 4. Theaverage seed yield per strobilus over the three programs thatprovided data for this project was 16.12 (1,140,299 seed /70,717 strobili pollinated). This included parents that weredifficult to cross and individuals that were sometimes locatedin scion banks with less than optimal insect protection. Femalesthat consistently failed to produce seed were eliminated to moreaccurately reflect an operational CMP program. Annual CMPseed costs were then predicted using Monte Carlo simulation.
Annual CMP costs per seed differed substantially amongthe three scenarios (Table 5). Scenario 1, in which seed yieldswere relatively high and reliable, had an average annual CMPproduction cost of $0.0535 per seed. In Scenario 2, average seedyields per strobili were high but relatively unreliable, andthe average annual CMP cost ($0.0594 per seed) was verysimilar. Scenario 1 and 2 differed primarily in the maximumcost of seed observed ($0.1844 vs. $0.41 per seed). Scenario 3assumed lower and more unreliable yields of seed per strobili.In this case, average annual seed costs were higher ($0.1275)and the maximum simulated annual cost per seed wasextremely expensive ($12.12). However, when seed costs werecombined across years and weighted for total seed production,the cost of CMP seed was reasonable even for the scenario inwhich variation in seed yield per strobilus was the greatest.
Pollination success for this study was estimated from dataon a large number of female parents, many of which would beunlikely candidates for a CMP program because of undesirableflowering or seed set characteristics. CMP programs willconcentrate on a few selected parents for which pollinationtechniques can be optimized, suggesting that these results maybe conservative.
Top Grafting
Data collection in the top grafting experiment at theMississippi Forestry Commission’s Craig Seed Orchardcontinued in 1999. This study was initiated in 1996 in coop-eration with D. L. Bramlett (retired) and F. E. Bridgwater ofthe USDA Forest Service. This year, graft and conelet survivalwas evaluated for grafts made in 1997, and seed yields frompolymix breeding were calculated for 1996 grafts on oneinterstock clone. First-year performance of 1997 grafts andsecond-year performance of 1996 grafts were reported inthe 46th Progress Report of the Cooperative Forest TreeImprovement Program (p. 9). First year performance of the1996 grafts was reported in the 45th Progress Report of theCooperative Forest Tree Improvement Program (p. 8).
Second-year survival of grafts made in 1997 was basicallyunchanged from year one. Survival of grafts on both slash pineand loblolly pine interstocks remained high and did not differsignificantly between interstock species (90 and 84 percent,respectively). There were 2.2 conelets per graft on the slashpine interstocks and 2.6 conelets per graft on the loblolly pineinterstocks. The differences between interstock species for thenumber of conelets per graft was not statistically significant.
Strobili on five top grafts of the same scion source on oneslash pine interstock clone were control-pollinated withpolymix pollen in the spring of 1997. Flower retention for thetop grafts was 79 percent compared to 68 percent for similarcrosses in a traditional scion bank. This difference may not bemeaningful and was most likely due to differences in samplesize (49 flowers debagged on the top grafts compared to 400flowers in the operational sample) and more careful handlingof the top grafts. When strobili were counted in December
Table 4. Mean, standard deviation, minimum and maximum values generated by the simulation for use as input tocalculate CMP seed costs.
Mean Standard Deviation Minimum Maximum
Cost/Bag $3.86 $0.95 $2.00 $7.06Strobili/Bag 4.38 1.4 2.4 9.9Seed/StrobilusScenario 1 18.62 2.47 11.04 27.06Scenario 2 18.56 5.33 1.69 35.43Scenario 3 16.01 7.66 0.17 39.38
Table 5. CMP costs per seed for three different scenarios.
Scenario Average Minimum Maximum
1 $0.0473 $0.0535 $0.0119 $0.18442 $0.0475 $0.0594 $0.0112 $0.41293 $0.0555 $0.1275 $0.0096 $12.120
Annual CMP Costs Per SeedCMP CostWeighted for TotalSeed Production
Table 5. CMP costs per seed for three different scenarios.
Table 4. Mean, standard deviation, minimum and maximum values generated by the simulation for use as input tocalculate CMP seed costs.

12
Table 6. Microfibril angle (degrees from vertical) for three unrelated crosses in a progeny test. 1
Microfibril Angle (º)
Cross Juvenile 2 Mature 3
Early - Late - Early - Late -
Wood Wood Wood WoodA 41a 44a 26 b 23aB 39a 42a 29a 24aC 37 b 39 b 22 c 19a
1 Means followed by the same letter are not significantly different at the 10 percent level by Duncan’s New Multiple Range Test.2 Juvenile wood-rings four and five from the pith.3 Mature wood-rings 19 and 20 from the pith.
1997, 46 of the original 49 flowers on the top grafts remained.In the fall of 1998, 39 cones were collected which yielded anaverage of 60.3 sound seed per cone. This compared favorablyto the 61.9 sound seed per cone from the cones collected fromthe same cross in the traditional scion bank.
Based on the results of this study, the members of theWestern Gulf Forest Tree Improvement Program have aggres-sively incorporated top grafting into their standard breedingstrategy. While all of the loblolly pine second-generationselections identified in 1998/99 were grafted into traditionalscion banks for preservation, most were also top grafted foraccelerated flower production. Top grafting should significantlyshorten the length of the second-generation breeding cyclecompared to that of the first generation.
Wood Quality
Improvement of wood quality traits has been a secondarypriority in the breeding and deployment populations ofthe program compared to the major emphasis placed onvolume growth. However, some improvements have been madein wood quality because of selection for improved formcharacteristics, such as straightness.
In the last few years, increased attention has been givento wood quality traits and their relationships to other impor-tant characteristics. Most of the emphasis has been on specificgravity and its relationship to growth and straightness.Economic weights have also been developed to optimize pulpmill profitability by selecting for both volume growth andspecific gravity simultaneously. These weights are combinedin an index to design deployment populations for pulp mills.These developments were discussed in the 46th ProgressReport of the Cooperative Forest Tree Improvement Program(pp. 11-12).
The cooperative is expanding its wood quality research toinvestigate microfibril angle. Microfibril angle is an importanttrait in determining the strength and stability of solid woodproducts. A challenge cost-share grant was obtained from theUSDA Forest Service to evaluate this characteristic in twocontrol-pollinated progeny tests. Boise Cascade Company,Champion International Company, International PaperCompany, Temple-Inland Forest, and The Timber Companycontributed additional funding to complete the project. The
staff is preparing the samples for Dr. Robert Megraw(Weyerhaeuser Company) who is using X-ray diffraction todetermine the microfibril angle.
In this project, microfibril angle is determined on bothearlywood and latewood samples from juvenile and maturewood. Rings four and five from the pith represent the juvenilewood sample and rings 19 and 20 from the pith represent themature wood sample. The analysis for three unrelated crosseshas been completed (Table 6). Significant differences amongcrosses were detected for the earlywood and latewood samplesfrom the juvenile wood and in the earlywood samples of themature wood. The analysis of the remaining samples will becompleted next year. This data set will also provide an oppor-tunity to study the genetic relationships between microfibrilangle and other traits of importance to the cooperative.
First-Generation Breeding and Progeny Testing
The six members of the slash pine tree improvement pro-gram dramatically increased the number of partial-diallel prog-eny tests established in 1999. Breeding has been completed in70 percent of the cooperative’s first-generation slash pinediallels, leaving only fourteen unfinished. The LouisianaDepartment of Agriculture and Forestry was the first memberto complete first-generation slash pine breeding. TheTexas Forest Service and Weyerhaeuser Company each havebreeding efforts to complete in only one diallel. Regionalcooperation has proved advantageous for establishing fieldplantings of this species. Because several members have hadone or two diallels ready for field planting simultaneously, afew large joint plantings have been established, rather thanmany smaller and less efficient field tests.
The first-generation breeding and progeny testing effortsare approaching completion for loblolly pine at the same timeefforts are increasing for slash pine. If the 1999 fall plantingseason is successful, eight of the cooperative’s sixteen mem-bers will have established all of their required first-generationloblolly pine progeny tests. Breeding has been completed in 90percent of the loblolly pine diallels, and there are only a handfulof unfinished crosses left in most of the remaining groups.Because the single-tree plot field design has made it possibleto include many families in each test, members are workingtogether to complete progeny test establishment. Generally, this
Table 6. Microfibril angle (degrees from vertical) for three unrelated crosses in a progeny test. 1
Microfibril Angle (º)
Cross Juvenile 2 Mature 3
Early - Late - Early - Late -
Wood Wood Wood WoodA 41a 44a 26 b 23aB 39a 42a 29a 24aC 37 b 39 b 22 c 19a
Table 6. Microfibril angle (degrees from vertical) for three unrelated crosses in a progeny test. 1

13
cooperation takes the form of pooling crosses from severaldiallels, one organization growing the seedlings, and severalmembers establishing field tests.
Slash Pine
In 1998/99, a record 100 slash pine parents were estab-lished in control-pollinated progeny tests. All of these parentshave shown increased resistance to fusiform rust infection ingreenhouse screenings at the USDA Forest Service - ResistanceScreening Center. Significant gains for field resistance areanticipated for crosses among these parents as well. Four of thesix members active in the slash pine tree improvement programestablished eight field plantings (Table 7). These tests weredesigned with 50 replications of single-tree plots and eachincluded selections from three or four different diallels. Atotal of 29 diallel by location combinations were represented.
A severe outbreak of the pine colaspis beetle was observedin a Texas Forest Service slash pine progeny test this year (Figure 7). This beetle has only one generation per year anddoes minimal long-term damage. However, the damagesymptoms include brown and curling needles, which closelyresemble herbicide damage and can cause momentary concernover the possible misapplication of chemicals.
Genetic Mechanisms for Disease Resistance. Understandingthe genetic basis for disease resistance is crucial toensure a successful breeding and deployment strategy for slashpine. One type of resistance in several plant species results froma major gene effect that causes resistance to specific pathogenstrains but not to others. Some of these genes are at differentlocations within the genome and can be differentiated throughgenetic mapping. Other resistance genes are closely clusteredand can be distinguished only through their interaction withdifferent disease strains. If this model applies to slash pine, it
will be important to identify a panel of disease strains that canbe used to screen candidates for new resistance genes. It willbe equally important to identify a panel of slash pine parentsthat can be used to monitor the pathogen population for newstrains of the disease.
A cooperative project to screen for host-pathogen interac-tions is being conducted with Hank Steltzer (formerly USDAForest Service, now with Champion International) and RobDoudrick (USDA Forest Service). Seedlots obtained bycrossing 28 parents with rust-susceptible polymix pollen weresubjected to artificial inoculation with four strains of fusiformrust. Fourteen seedlots were chosen because they exhibitedhigh levels of disease resistance in previous greenhousescreenings with bulked inoculum while the other 14 had shownsusceptibility.
The genetic interactions within this experiment arecomplex. Each maternal parent can be either homozygous orheterozygous for any disease resistance genes present. The
Figure 7.Pine colaspisbeetle damagein a Texas ForestService slashpine progeny test.
Table 7. Progeny tests established during the 1998/1999 planting season.
Cooperator Number of Number ofTests Diallels
First-Generation Loblolly Pine Tests
Boise Cascade 2 6Bosch Nurseries 3 12Oklahoma Forestry Services 2 3The Timber Company 3 11Willamette Industries 1 2
Loblolly Pine Total: 11 34
First-Generation Slash Pine Tests
Louisiana Department of Ag and Forestry 3 9Mississippi Forestry Commission 1 4Temple-Inland Forest 3 12Weyerhaeuser 1 4
Slash Pine Total: 8 29
Table 7. Progeny tests established during the 1998/1999 planting season.

14
pathogen can also segregate for virulence genes, as the sporescollected to start the disease strains are diploid (dikaryon) butthe infectious form is haploid. However, if the major genemodel is valid, there should be some slash pine parents previ-ously judged as resistant which are susceptible to some strainsof the pathogen. Conversely, some susceptible slash pineparents should be resistant to pathogens that are virulent onother slash pine parents.
When the complete data set was analyzed, there were nosignificant slash pine family by inoculum interactions.However, when individual families were examined, the type ofinteraction predicted by the major gene model of resistance wasobserved (Table 8). A-2-54, classified as a resistant parent, wassusceptible to infection with rust strain 8-7 while D-2-4, asusceptible parent, showed resistance to this strain. MFCS-111was susceptible to inoculum 8-7 but almost completely immuneto infection with rust strain LT3, which was highly viruleneton slash pine parent D-2-4.
The effort to understand the resistance/virulence geneinteractions suggested by this data is just beginning. However,developing methods of classifying resistance in the host andmonitoring changes in pathogen virulence will affect the breed-ing program for this species and have important uses inplanning deployment strategies. This could be especiallyimportant if vegetative propagation is used to deploy slashpine clones.
Slash Pine Demonstration Plantings. Five-yearmeasurements were taken on four slash pine demonstrationplantings in 1999. These plantings were the second in a seriesof plantings designed to demonstrate differences in fusiformrust resistance among three different sources of slash pine,including WGFTIP improved slash pine and unimprovedcommercial checklots from South Mississippi and Georgia.The WGFTIP improved slash pine source consisted of tenfamilies selected for high rust resistance. The Mississippisource was the slash pine checklot used in all WGFTIP slashpine progeny tests. The Georgia source represented materialthat was widely planted in the Western Gulf region before seedfrom local seed orchards became available.
Boise Cascade Company maintained one location inBeauregard Parish, LA, the Louisiana Department of Agricul-ture and Forestry maintained one location in East FelicianaParish, LA, and Temple-Inland Forest maintained one locationin Hardin County, TX and one location in Vernon Parish, LA.All four of these demonstrations were repeats of plantingsestablished in the spring of 1993 and measured last year. Five-year data from the older plantings were reported in the 46th
Progress Report of the Cooperative Forest Tree Improvement
Program (p. 14). Each planting consisted of two replicationsof large block plots (80 or 100 trees) for each source.
Five-year data from all eight locations were analyzedtogether. Significant differences among sources were found forvolume growth, incidence of fusiform rust and height, but notfor survival (Figure 8). Volume growth was highest for theimproved slash pine source (6.2 dm3/planted tree), followed bythe WG slash and GA slash checklots at 5.2 and 4.4 dm3/planted tree, respectively. The gains made by selection for rustresistance are evident when comparing the improved slashsource to either of the unimproved sources. Fusiform rustinfection for the ten families included in the improved sourceaveraged 20.8 percent, approximately half that of the infectionlevel in the WG slash checklot (40.5 percent) and the GA slashchecklot (40.0 percent). The improved slash source had thehighest average height (4.8 m) which was significantly greaterthan both the WG slash checklot (4.5 m) and GA Slashchecklot (4.4 m), which were not significantly different fromone another. Survival over all locations averaged 80 percentand was similar for all sources. Survival is likely to change:previous experience has shown that a great deal of rust relatedmortality occurs between five and 10 years of age.
These plantings were established as demonstrationplantings, not as replicated trials designed to allow inferenceand the detection of statistically significant differences.Nevertheless, these plantings clearly demonstrate the benefitsof selection for rust resistance achieved in only one round ofselection and testing. These plantings will be measured againat ten years of age.
Loblolly Pine
A sufficient number of first-generation loblolly pineprogeny tests were established in 1999 to evaluate 142 parents,111 for the first time (Figure 9). A total of 2,261 loblolly pine
Table 8. Percent of seedlings infected when artificially inoculated with four different strains of fusiform rust.RSC Classification is based on previous trials with a bulked inoculum.
Inoculum
Slash Pine Parent RSC Classification 8-7 CCA-2 LT3 WLP10-2
A-2-54 Resistant 62 28 14 28D-2-4 Susceptible 15 38 60 40
MFCS-111 Resistant 62 43 5 33
Volume Growth
0
1
2
3
4
5
6
7
Improved Slash
Western Gulf Checklot
Georgia Checklot
Vol
ume
(dm
3)
a cb
Fusiform Rust
0
10
20
30
40
50
Improved Slash
Western Gulf Checklot
Georgia Checklot
Fus
iform
Rus
t (%
)
a b b
Height
0
1
2
3
4
5
6
Improved Slash
Western Gulf Checklot
Georgia Checklot
Hei
ght (
m)
a b b
Survival
0
20
40
60
80
100
Improved Slash
Western Gulf Checklot
Georgia Checklot
Sur
viva
l (%
)
a aa
Figure 8. Results from the slash pine demonstrationplantings averaged over 8 locations. Bars with the sameletters are not significantly different at the 10 percent levelby a Duncan’s New Multiple Range Test.
Table 8. Percent of seedlings infected when artificially inoculated with four different strains of fusiform rust.RSC Classification is based on previous trials with a bulked inoculum.

15
parents have now been planted in balanced control-pollinatedprogeny tests designed to estimate parental general combiningabilities, and an additional 693 parents have been evaluated inopen-pollinated progeny tests. First-generation loblolly pinebreeding efforts are coming to a close as shown graphicallyin Figure 9. There has been a steady decrease in the numberof parents established in progeny tests since the 1994/95planting season.
Testing Progress
0
200
400
600
800
1000
1200
1400
1600
1800
2000
94/95 95/96 96/97 97/98 98/99Establishment Year
Num
ber
New Parents Total Parents Cross*Location
Figure 9. The number of loblolly pine crosses (total numberof cross by location combinations), the total number ofparents, and the number of parents established in tests forthe first time in each of the last five years.
Figure 10. One of two sites Louisiana Pacific Corporationprepared for planting of their first progeny tests.
Figure 11. Mike Lee of the Mississippi Forestry Commissionstanding between thinned and unthinned portions of an 11-year-old loblolly pine progeny test located in Lauderdale Co.,MS. A 50 percent thinning removed 27.8 cords per acre.
Figure 12.Jim Phillips inthe MississippiForestryCommission’stwo-year-oldplanting of theLower GulfElite BreedingPopulationpolymix test.
Five members collectively planted a total of 11 progenytests prior to the 1999 growing season (Table 7) and anadditional 10 progeny tests are scheduled to be planted this fall.If the 1999/00 planting season is successful, Boise CascadeCompany, Louisiana Department of Agriculture and Forestry,and Oklahoma Forestry Services will be the most recentmembers to complete the establishment of all of their first-generation field tests. Louisiana Pacific Corporation, the newestmember of the cooperative, has assumed responsibility fortesting four loblolly pine breeding groups bred by othermembers of the cooperative. Because others have been willingto transfer the control-pollinated seed from these groups,the Louisiana Pacific Corporation has been able to move intothe progeny testing program simultaneously with orchardestablishment (Figure 10).
The cooperative now has a large number of ten-year-oldtests, planted at a 6 by 8 foot spacing, approaching 10 years ofage (Figure 11). After the 10-year measurements are taken inthese tests, two of the three duplicate plantings will be abandoned
and the third location will be thinned. However, reducedspacing to minimize replication size, combined with increasedemphasis on site preparation and better herbaceous weedcontrol, has resulted in unanticipated growth rates. Some of theseplantings are requiring a considerable effort to thin in amanner that will maintain the integrity of the planting as agenetic test. Despite these difficulties, the improved efficiencyof the progeny testing program resulting from smaller replica-tion sizes and better maintenance has been well worth the effort.
Lower Gulf Elite Breeding Population. The cooperativeestablished five polymix tests of the Lower Gulf EliteBreeding Population in 1998. This population is acollaborative effort among the three southern tree improvementcooperatives intended to combine the best selections for theLower Gulf Region of the U.S. This collaboration is possiblebecause the three tree improvement cooperatives haveconsiderable overlap in their deployment populations for thisregion. Three of the five tests established by WGFTIP wereplanted in East Texas and southwest Louisiana and wereintended to evaluate the western movement of this seed source.Unfortunately, two of these tests did not survive the summerdrought of 1998 and were re-sown for fall planting in 1999. Thethree tests that did survive the first year had an average survivalof 97.4 percent and excellent initial growth (Figure 12).

16
Test Measurement and Second-GenerationSelection Activity
The record number of crosses established in progeny testsin 1994/95 (Figure 9) translated into a record number of teststo measure and evaluate in 1998/99. In the loblolly pineprogram, the cooperative measured 45 five-year-old tests (Fig-ure 13) and 15 older plantings. The five-year-old tests providedinformation on 515 parents, 225 for the first time. These testscontained 1,847 cross by location combinations, all potentialcandidates for second-generation selections. Five slashpine progeny tests were also measured in 1998/99. The rapidincorporation of this new data into the cooperative database wasa major factor in obtaining continued improvement in theproduction population as well as the source for new advanced-generation selections for the breeding program. included three second-generation selections identified by
Willamette Industries in their first progeny test to reach agefive. Willamette will contribute to the North Louisianaadvanced-generation breeding population with the 11 diallelsthey now have in the field, each of which is planted in threelocations. Six second-generation slash pine selections were alsoidentified in 1999. This year’s selection effort was followed bya concerted effort to top graft all of the loblolly pine selections.The cooperative has now identified a total of 1,004 loblolly pineselections and 115 slash pine selections. (Figure 15).
Second-Generation Breeding and Testing
Twelve of the cooperative’s sixteen members are activelybreeding to produce polymix seed for evaluating second-generation selections. The remaining members have eitherelected to concentrate on the completion of first-generationbreeding or are just now beginning to identify second-generation selections. Four members, the Arkansas ForestryCommission, International Paper Company, the MississippiForestry Commission and Weyerhaeuser Company, have usedtop grafts in their breeding programs. Seven members are alsoproducing controlled pedigree crosses that will serve as thesource for third-generation selections.
No second-generation progeny tests were field plantedin the 1998/99 season. However, four loblolly pine polymixtests were grown in the greenhouse for field planting in thefall of 1999. These plantings will evaluate a total of 140selections from East Texas. Three plantings were grown as acollaborative effort and contained second-generation selectionsfrom three members. Temple-Inland Forest grew the test seed-lings. The Texas Forest Service, Temple-Inland Forest, andChampion International provided the seed and each plantedone location.
Additional Activities
Contact Representatives’ Meeting
The 1999 Contact Representatives’ Meeting was held inPineville, LA, and co-hosted by representatives from the USDAForest Service - Alexandria Forestry Center. James Barnett(Project Leader – Ecology and Management of Even-agedSouthern Pine Forests) welcomed the members and providedan overview of USDA Forest Service research at Pineville. Les
The cooperative is making the transition to advanced-generation breeding by identifying new selections, recon-stituting breeding groups, and using top grafting to shortenthe breeding cycle. In 1999, twelve members of the coopera-tive identified a total of 127 loblolly pine second-generationselections in 29 different breeding groups (Figure 14). This
Figure 13.Tim Bosch in afive-year-oldprogeny testmeasured in 1999.
Figure 14. A second-generation selection identified in 1998before a 50 percent thinning was performed at age twelve in1999. This test is maintained by the Mississippi ForestryCommission in Lauderdale County, Mississippi.
Second Generation Selections
0
200
400
600
800
1000
1200
90 91 92 93 94 95 96 97 98 99Year
Num
ber
Loblolly Slash
Figure 15. The number of second-generation selections inthe cooperative.

17
Groom (Wood Technologist - Utilization of Southern ForestResources) introduced the forest product research program atthe Center. Highlights of the field trip hosted by Dr. Barnettand Dr. Groom included a tour of the wood technology researchfacilities and silvicultural research plots maintained by theUSFS Southern Research Station. (Figure 16).
The cooperative has always had an interest in the role oftree improvement in the supply of raw material for solid woodproducts. This interest has only increased as the industrybecomes more dependent on small logs. Bob Megraw(Weyerhaeuser Company) contributed to the discussion of woodproperties by describing the measurement and impact ofmicrofibril angle. Les Groom expanded on the solid woodproducts theme by giving an overview of the types ofmanufactured solid wood products and panels now available.Solid wood properties are difficult to measure, and theireconomic value is not always defined in a market with manydiverse needs. However, the cooperative will continue todevote time and effort to this topic because improving woodproperties may be an important future breeding objective.
One possible method to exploit genetic variation in woodproperties and growth rate is clonal forestry. Barry Goldfarb(NC State University) addressed this topic by describing recentprogress in the production of rooted cuttings. Other possibletechnologies that may be used in the future include DNAmarkers and accelerated breeding. Claire Williams (TexasA&M University) described her work in developingmicrosatellite markers and outlined some practical applica-tions. George Rheinhardt (Arkansas Forestry Commission),Mike Lee and Robert Stewart (both of the Mississippi ForestryCommission) discussed their experiences with top grafting foraccelerated breeding.
John Taylor and Alex Mangini (both of the USDA ForestService) completed the program by providing updates on theFood Quality Protection Act and on insecticides for control ofcone and seed insects and tipmoth. The areas of pesticide regu-lation and registration are changing so rapidly that these up-dates have become a vital and regular feature of the ContactRepresentative’s Meeting.
Web Sites
Information on the Western Gulf Forest Tree ImprovementProgram is now available on two different web sites. A briefdescription of the program and a list of members are availableat http://txforestservice.tamu.edu/tfshome/aboutus/forscila.htm. The 46th and 47th Progress Reports of the Coop-erative Forest Tree Improvement Program and the recentlypublished brochure entitled “Tree Improvement and GeneticDiversity of Loblolly Pine” can also be downloaded from thissite in Adobe Acrobat Reader (pdf) format.
The cooperative’s listing on the National GermplasmResource Information Network can be accessed at http://www.ars-grin.gov/misc/wgftip/index.html. This site lists all ofthe first-generation loblolly pine selections currently preservedby the cooperative. The county and state of origin and infor-mation about the type of stand in which the selections wereoriginally identified are provided. This listing is intended tomake the status of the cooperative’s ex situ gene preservationefforts available to a wide audience interested in geneticdiversity and conservation. This effort has recently beendescribed in an article “Western Gulf Forest Tree ImprovementProgram Gene Conservation Plan for Loblolly Pine” in theFAO publication Forest Genetic Resources (see Publications).
Western Gulf Tree Improvement Short Course
A Tree Improvement Short Course, attended by more thansixty people, was held in Nacogdoches, TX, in August(Figure 17). The objective of this training session was to be anintroduction for new staff members and a refresher course forlong time employees on topics ranging from basic genetics toapplied tree improvement programs. Several organizationshave recently added new staff members. Additionally, allprograms are in the transition from first-generation toadvanced-generation breeding. This has resulted in changes tobreeding and progeny testing programs, including theadoption of complementary mating, single-tree plots, large regional progeny tests, and block plots for selection. Produc-tion populations are also changing. Controlled crosses are nowsupporting the production population, through the creation ofsuper-breeding groups and controlled mass pollination
Figure 16.Dr. James Barnettlooks on asDr. Jamie Tangfrom LSU explainsgrowth andenvironmentalmonitoring in aUSDA ForestService researchplot to the attendees of the1999 ContactRepresentativesMeeting.
Figure 17. Randy O’Neal of the Arkansas Forestry Commis-sion examining a subsoiler on display during the TreeImprovement Short Course.

18
programs. Rapidly changing technology is also adding to thecomplexity of the tree improvement programs. These changesrange from simple innovations, such as top grafting, to morecomplex operations like vegetative propagation.
All of these innovations have been discussed at previousContact Representative Meetings. However, the Tree Improve-ment Short Course was the first time that the cooperative hadthe opportunity to discuss all of these changes at one meeting.As with most of our training sessions, we relied on a mixtureof invited speakers and contributions from our members. Guestspeakers and their subjects included Jimmie Yeiser, geneticprinciples; J. P. van Buijtenen, geographic variation andtree improvement populations; Jerry Tuskan, selection,heritability and application of biotechnology; and Bill Dvorak,biodiversity and germplasm conservation. Practical treeimprovement topics were addressed by Lee Allen, fertilization;Alex Mangini, insect protection; and Dave Bramlett, pollenhandling and top-grafting. We were also able to utilize theconsiderable expertise of our members. Members contributingtalks on orchard management included Larry Miller, orchardsite selection; Bill Jacobs, grafting; I.N. Brown, cone harvest-ing; Joe Weber, controlled mass pollination; and John McRae,seed extraction and seedling production. Breeding andprogeny testing topics were discussed by Bob Purnell,controlled pollination; Richard Bryant, progeny test siteselection and preparation; Ron Campbell, test establishment;and George Rheinhardt, test maintenance and measurement.
The quality of the shortcourse was considerably enhancedby the excellent field trip hosted by Jim Tule, Kay McCuller,and the staff at the International Paper Company Forest SeedCenter (Figure 18). Attendees were divided into small groupsand were able to see and discuss operations ranging fromseed handling to orchard management and progeny testmeasurement. The degree to which tree improvement hasalways been a cooperative effort was certainly evident at thisyear’s training session.
Seed Orchard Pest Management Subcommittee
The Seed Orchard Pest Management Subcommittee(SOPM) continued to be an important source of informationand ideas on the biology and regulatory issues surrounding the
control of cone and seed insects. By providing an informalforum, seed orchard managers, entomologists, and policyexperts have been able to effectively leverage their individualefforts to support tree improvement programs and to furtherresearch. The tree improvement community has benefited fromthis cooperation by making significant progress toward the useof chemical controls as part of integrated pest managementsystems. The importance of this collaboration was certainlyapparent in 1999.
The Environmental Protection Agency (EPA), underthe auspices of the Food Quality Protection Act, is currentlyreviewing the status of most pesticides used in the UnitedStates. Seed orchards are especially vulnerable because of thelimited number of chemicals labeled for cone and seed insectcontrol, the high application rates necessary to protect largetrees, and the small size of the market compared to agriculturalcrops. In 1999 the status of Guthion®, which has been thestandard for cone and seed insect control since its introductioninto seed orchards, was reviewed. Initially, the manufacturerdecided to delete conifer seed orchard use from the label toprotect larger, more profitable markets. This would haverequired seed orchards to depend on synthetic pyrethroids,a class of chemicals known to cause buildups of secondaryinsects.
Because of the Guthion® rate study organized by theSOPM subcommittee and conducted in seed orchards acrossthe South, John Taylor (USDA Forest Service – Forest HealthProtection) and others were able to respond rapidly to the con-cerns of the manufacturer and the EPA. Because there wasevidence that Guthion® can be effective at lower rates than themaximum rates previously allowed and applied in ways thatlimit worker exposure, the seed orchard registration was main-tained. The near loss of this important chemical dramaticallyunderscores the need for continued support of regional researchon cone and seed insect control.
The SOPM subcommittee is taking several steps toprepare for future pesticide reviews. The committee is compil-ing the results of a pesticide use survey intended to cover thelast three management years. This empirical evidence is neededbecause the EPA calculates risk from exposure based on themaximum allowable application rates if actual use data is notavailable. To support this documentation, a crop profile is alsoneeded to outline typical worker exposure patterns to thoseresponsible for regulating pesticide use. Pesticide labels mustbe periodically reviewed to identify application rates that areexcessive when compared to other crops.
All of this activity highlights two important needs. Thefirst is to use good management practices when applyingcurrently registered products. The tree improvement commu-nity has too few available chemicals to risk losing a controloption as a result of a preventable accident. The second needis to continue the development of efficacy and rate informationbased on operational application methods. To this end, asouthwide rate study for Asana® is planned in 2000. Theseregional studies are expensive both in terms of labor and seedlost due to inadequate protection in some treatment blocks. Thetree improvement community must make this investment orrisk losing cone and seed insect control options as chemicals
Figure 18.Willie J. Brownof the InternationalPaper ForestSeed Centerdemonstratingsome of the stepsin seed processingto the attendeesof the TreeImprovementShort Course.

19
are scheduled for regulatory review.There were several other developments in the SOPM
subcommittee this year. Larry Barber (USDA Forest Service)retired in 1999. He will be greatly missed by the treeimprovement community. The USDA Forest Service,in response to the SOPM subcommittee policy statementpublished in the Journal of Forestry and the participation ofcommittee members in the Southern Research Station’sTechnical Assistance Visits, appointed Dan Miller as a researchentomologist. He is stationed at Athens, GA, and his jobduties include continuing USDA Forest Service cone and seedinsect research.
The SOPM subcommittee is supporting registration effortsfor two new chemicals, Imidan® and Warrior T®. Imidan®is an organophosphate pesticide that Gary DeBarr (USDAForest Service) and others have shown to be nearly aseffective as Guthion® in control of coneworms and seedbugs.Warrior T® is a third generation synthetic pyrethroid. DeBarrand Alex Mangini (USDA Forest Service) are just completingefficacy studies on single tree treatments using this chemeical.Early data indicates that Warrior T® may offer exceptionallevels of control. Manufactures of both chemicals haveindicated a willingness to pursue seed orchard registration.
Formal Reviews
The cooperative conducted five formal reviews in 1999.These program assessments consist of a field review of prog-eny tests, seed orchards, and facilities followed by an officeevaluation of long range objectives. One of the major benefitsof this process has been increased interaction between thosewithin an organization responsible for shaping strategic objec-tives and those responsible for implementing the program. The
formal reviews have proved equally valuable to the coopera-tive staff by providing regular input from the members on howwell the cooperative is meeting their needs. The three-yearcycle for these reviews has proven to be very useful given thecurrent rate of change in the forest industry, natural resourcemanagement, and tree improvement.
Forest Genetics Research at Texas A&M University5
Two novel protocols for construction of low-copy DNAlibraries are being used to search for microsatellite markers ingene-rich regions of the pine genome. Libraries, lines of bac-terial cells into which a segment of foreign DNA has been in-serted, can be propagated to preserve and greatly increase theamount of foreign DNA available for study. Because the pinegenome is so massive, cloning random fragments of pine DNAis likely to be ineffective. To overcome this problem, two tech-niques that enrich the DNA fragments for low copy sequencesprior to cloning have been developed. These techniques arebased on reassociation kinetics and isolation of under-methy-lated DNA.
Microsatellite markers isolated from these libraries haveproved to be highly variable and useful for a number of pur-poses. Some microsatellite DNA sequences are currently avail-able at http://forestry.tamu.edu/genetics and others will be re-leased as they are validated. To date, these markers have beenused to estimate genetic diversity, allele numbers, genetic dif-ferentiation, and possible founder effects in a rangewide sur-vey of loblolly pine. They have been used to detect genes con-tributing to reduced genetic fitness in loblolly pine. The mark-ers are also being placed on genetic maps so they can be usedfor QTL detection and candidate gene detection.
5 Submitted by Dr. C. G. Williams
HARDWOOD TREE IMPROVEMENT PROGRAM
Highlights
· The last series of Nuttall oak progeny tests wasestablished in 1999. Currently, the members maintain 22Nuttall oak progeny tests that include seedlings from 216selections.
· The Arkansas Forestry Commission and Temple-InlandForest, in a collaborative project with the North CarolinaHardwood Cooperative, grew the first second-generationsweetgum progeny tests with a total of 130 families.
Potlatch Corporation collected 15-year data from theirhardwood natural regeneration study. Shearing signifi-cantly increased the oak stocking as compared to the rollerchop, injection, and control treatments.
Tree Improvement
Progeny Testing
The members of the Hardwood Cooperative have beenactive in developing improved genetic varieties of selected
hardwood species. The first species selected for testing weresycamore, sweetgum, and green ash. Progeny testing forcherrybark oak, water/willow oak and yellow-poplar wasinitiated at a later time. Recently, the members began atesting program for Nuttall oak. To accomplish their goal, themembers have established a total of 189 progeny tests. The testsare abandoned after 20-year data have been obtained. In 1999,the members maintained 40 progeny tests (Table 9). Thenewest species selected for study, Nuttall oak, comprised themajority of these tests (22).
Table 9. Active progeny tests in the Hardwood TreeImprovement Program.
Species Number ofTests
Cherrybark oak 9Green ash 1Nuttall oak 22Sweetgum 1Sycamore 4Water/Willow oak 3
•
•
•

20
Table 10. Twenty-year data summary for cherrybark oak progeny tests.
Location Plantation Average Pct.1
(Co./Par., State) Survival Height Diameter Volume Vol.
(%) (m) (cm) (dm3) Imp.Angelina Co., TX 71 13.8 16 81.6 19.5Clark Co., AR 79 16.9 21 165.5 9.9Montgomery Co., TX 69 7.4 9 23.5 20.4Sabine Par., LA 79 16.2 16 98.3 15.0St. Landry Par., LA 70 11.4 9 32.4 11.6Tyler Co., TX 75 14.9 17 98.3 22.31 Percent volume improvement is the mean of the selected open-pollinated families compared to the plantation average.
Temple-Inland Forest collected first-year data on theirsecond-generation sycamore progeny test established in coop-eration with the N. C. State University –Industry CooperativeHardwood Research Program (Figure 19). This test includes40 open-pollinated families from both cooperatives. Survivalafter the first growing season averaged 98 percent. Heightranged from 1.4 m to 1.8 m with an average of 1.6 m. Third-year data from this study will be used to determine which seedorchard clones will be used for operational seed collection. Thisdata will also be shared with the North Carolina HardwoodCooperative to evaluate the importance of a genotype byenvironment interaction for planted sycamore in the lowercoastal plain.
Fifth- and first-year data were collected from the oldest andyoungest series of Nuttall oak progeny tests. The oldesttest series includes 42 open-pollinated families collected inArkansas, Mississippi, and Texas and was planted by theArkansas Forestry Commission, the Louisiana Department ofAgriculture and Forestry, the Mississippi Forestry Commission,and Potlatch Corporation. Average survival ranged from 75 to96 percent among the four tests. Height growth averaged 1.8m and ranged from 1.4 m to 2.5 m. The best growth wasobtained in the test maintained by the Arkansas ForestryCommission (Figure 20). At age five, there were no differencesindicating that seed collected from any state performed betterthan seed collected from any other state. Families collectedfrom each of the three states were represented in the best
Figure 19. Matt Lowe, Temple-Inland Forest, with theirsecond-generation sycamore progeny test in the secondgrowing season.
performing 20 percent of all families in each test. The ten-yeardata from these plantings will be used to select clones for seedorchard establishment.
Six Nuttall oak progeny tests were established during the1997/98 planting season. The 1998 drought caused severemortality in two of the tests, which had to be abandoned. Thetests established by the Arkansas Forestry Commission, theLouisiana Department of Agriculture and Forestry, the Missis-sippi Forestry Commission, and Temple-Inland Forest survivedthe drought and had an average first-year survival of 88 per-cent. Survival varied from 77 to 97 percent among the tests.
The last test series for Nuttall oak was planted at five lo-cations during the 1998/99 planting season. Even though an-other drought occurred in 1999, survival appears to be adequatein all of these tests. This series completed the selection of thegenetic base for this species. The members are maintaining 22Nuttall oak progeny tests that contain 216 selections fromArkansas, Louisiana, Mississippi, and Texas.
Fifteen- and twenty-year data were collected from eightcherrybark oak progeny tests. The average plantation perfor-mance for the 20-year tests is shown in Table 10. The test inClark County, Arkansas, had the best growth. This test wasmaintained by International Paper Company and had anaverage height of 17 m. Family performance ranged from16 m to 18 m in height. As with the past tests, families inwhich second-generation selections were made at earlier agescontinued to perform well. Average volume for these families
Figure 20.GeorgeRheinhardt inthe Nuttall oakprogeny testmaintained bythe ArkansasForestryCommissionduring the sixthgrowing season.
Location Plantation Average Pct.1
(Co./Par., State) Survival Height Diameter Volume Vol.
(%) (m) (cm) (dm3) Imp.Angelina Co., TX 71 13.8 16 81.6 19.5Clark Co., AR 79 16.9 21 165.5 9.9Montgomery Co., TX 69 7.4 9 23.5 20.4Sabine Par., LA 79 16.2 16 98.3 15.0St. Landry Par., LA 70 11.4 9 32.4 11.6Tyler Co., TX 75 14.9 17 98.3 22.3

21
was 16 percent greater than the test means at age 20. Similarresults were obtained for the 15-year tests. Because second-generation selections had previously been identified in the bestfamilies in these tests, no additional selections were made thisyear. The 20-year tests have been released to the cooperatorsand will not be measured in the future.
Temple-Inland Forest obtained first-year data from theirproject to evaluate the performance of selected hardwoodspecies grown under intensive management for fiber produc-tion. Pure blocks (100 trees) of cottonwood, sycamore, andsweetgum were planted in a replicated field design. Ten-treerows of either ten clones (cottonwood) or ten families (sycamoreand sweetgum) were established in each plot. A blockcomparing the performance of several other species was alsoestablished. The entire study was intensively managed withfertilization and irrigation (Figure 21).
Table 11 presents the first-year data for the pure blocks.Survival was excellent for the three species ranging from 92percent for cottonwood to 98 percent for sycamore andsweetgum. Cottonwood had the best growth of the three spe-cies, and sycamore had the second fastest growth. Survival andheight growth did not differ among the cottonwood clones orsycamore families included in the test; however, significantdifferences in diameter were detected among families withinboth species. Significant differences in height were also de-tected among the sweetgum families included in the study.
In a cooperative project with the North Carolina Hard-wood Cooperative, second-generation sweetgum progeny testswill be established with selections from both programs. The Ar-kansas Forestry Commission and Temple-Inland Forest grewtests in 1999 that will be planted in Arkansas and Texas (Fig-ure 22). These tests contain 130 families of which 37 are fromthe Western Gulf Program. Members of the North CarolinaHardwood Cooperative will establish tests east of theMississippi River, and the data will be shared between bothprograms. Plant material will also be exchanged for usein future seed orchards.
Table 11. Species comparisons at one year for Temple-Inland Forest’s intensive management hardwoodspecies trial. 1
Species Survival Height Diameter(Percent) (m) (cm)
Cottonwood 92 b 2.2a 1.3aSycamore 98a 1.4 b 0.7 bSweetgum 98a 1.0 c 0.4 c1 Means followed by the same letter are not significantlydifferent at the 10 percent level by Duncan’s New MultipleRange Test.
Selections and Seed Orchards
The members have made a total of 334 second-generationhardwood selections among the six species shown in Table 12.Five new water oak second-generation selections wereidentified in two progeny tests during the past year. All of theseselections have been preserved by grafting into scion banks.Seed orchards for selected species continue to be establishedby the state agencies. The Arkansas Forestry Commission, theMississippi Forestry Commission, and the Texas ForestService are grafting cherrybark oak seed orchards (Figure 23).Because of the increased demand for cherrybark oak seed, theMississippi Forestry Commission is planning a seed orchardexpansion for this species.
The Texas Forest Service continued grafting first-generation Nuttall oak selections in 1999. Grafting has beensuccessful for Nuttall oak with an average 85 percent graft takein 1999. To date, the Mississippi Forestry Commission and theTexas Forest Service have preserved 185 of the 216 first-
Figure 21.The hardwoodintensive manage-ment projectshown byMatt Lowe ismaintained byTemple-InlandForest.
Figure 22. A second-generation sweetgum progeny testgrown by Temple-Inland Forest.
Table 12. Number of second-generation selections inthe Hardwood Tree Improvement Program.
Species Number ofSelections
Cherrybark oak 62Green ash 61Sweetgum 84Sycamore 70Water/Willow oak 45Yellow poplar 12

22
Natural Regeneration
Potlatch Corporation collected 15-year data on theirhardwood natural regeneration study. Four site preparationtreatments (control—no treatment, high shear, roller chop, andinject) were established in a randomized-complete-blockdesign with three replications. The study was installed in 1983following an operational clearcut. Within the study, 192permanent 0.1-acre circular plots were established. Diameterat breast height (DBH) and species class were determined onall stems greater than two inches DBH in each plot. Height wasalso measured on the tallest two trees (excluding residuals) ineach plot for the following species classes: 1) cherrybark oak,2) water/willow oak, 3) sweetgum, 4) miscellaneous desirablespecies and 5) undesirable species.
At age 15, site-preparation treatment had a significanteffect on stocking (Table 13). Average stocking in the study was398 trees per acre. The control treatment had fewer new treesgreater than two inches diameter than any of the other treat-ments. The effect of site-preparation treatment was mostpronounced for the amount of oak regeneration present in thestudy. The shear treatment averaged 125 oak trees per acre.This was significantly greater than any of the other site-preparation treatments. The inject and chop treatmentsaveraged 82 oak trees per acre, which was significantly greater
generation Nuttall oak selections in scion banks (Figure 24).These scion banks will produce the scion for seed orchardestablishment after progeny tests have identified the bestselections. Grafting efforts will be continued in 2000 tocomplete the preservation of the selections for this species.
The expanded bottomland hardwood reforestationprograms have created an increased demand for hardwoodseedlings. Many of the older seed orchards are producingsufficient quantities of seed to help meet this demand inthe members’ nurseries (Figure 25). To ensure that only thehighest genetic quality seed is used in the nurseries, themembers are considering establishing open-pollinated progenytests to evaluate the selections in the seed orchards. The datafrom these tests will be used to rogue seed orchards and deter-mine which clones will be used for seed collection. The TexasForest Service started open-pollinated seed collection byfamily for this purpose from their sycamore, sweetgum, andgreen ash seed orchards in 1999 (Figure 26). The membershipwill determine which species will be evaluated in progeny testsat the Executive Committee Meeting in 2000.
Figure 23. The cherrybark oak seed orchard established bythe Arkansas Forestry Commission.
Figure 24.A Nuttalloak graft inthe TexasForestService scionbank.
Figure 25. The Texas Forest Service sweetgum seed orchardat Hudson, TX.
Figure 26. Green ash seed collected by open-pollinatedfamily from the Texas Forest Service seed orchard.

23
than the control treatment which averaged 49 oak trees peracre. The site-preparation treatment did not have a significanteffect on the stocking of any of the other species classes.
Site-preparation treatment did not have a significantimpact on average DBH (10 cm), height (13.0 m), or basal area(40.4 square feet per acre) when all of the species wereconsidered. Site-preparation treatment did have a significanteffect on the diameter growth of the undesirable species class.The undesirable trees in the control treatment had a largerdiameter (9 cm) than any of the other treatments (7 cm).
The control treatment averaged 44 residual trees per acrewith a basal area of 33.5 square feet. The other treatmentsaveraged 5 residual trees per acre with 4.6 square feet of basalarea. When the residuals were included in the analysis, thecontrol treatment had the largest average DBH and the mostbasal area (Table 14). The frequency of the residual trees wasnot sufficient to have a significant effect upon stocking, so thecontrol treatment still had the fewest number of trees per acre.No stem quality measurements were taken at age 15. Theimpact of the residual stems on overall stem quality will beevaluated in later measurements.
Table 13. Data summary at age 15 by site-preparation treatment for all species (excluding residuals) in PotlatchCorporation’s hardwood natural regeneration study. 1
Treatment Trees/ DBH Height Basal AreaAcre (cm) (m) (feet2/acre)
Control 260 b 11a 13.6a 35.9aInsect 423a 9a 12.5a 37.3aChop 430a 10a 13.2a 40.2aShear 481a 10a 12.8a 48.3a
1 Means followed by the same letter are not significantly different at the 10 percent level by Duncan’s New Multiple Range Test.
Table 14. Data summary at age 15 by treatment for all species (including residuals) in Potlatch Corporation’shardwood natural regeneration study. 1
Treatment Trees/ DBH Height Basal AreaAcre (cm) (m) (feet2/acre)
Control 304a 13.7a 13.7a 69.4aInsect 431 b 9.6 b 12.0a 41.6 bChop 436 b 10.4 b 12.5a 49.4 bShear 482 b 9.7 b 12.5a 48.6 b
1 Means followed by the same letter are not significantly different at the 10 percent level by Duncan’s New Multiple Range Test.
Jennifer Myszewski joined the College Station staff in1999 as a graduate student pursuing a doctoral degree.Support for her assistantship is provided by the USDA ForestService, and she is working for both the USDA Forest Serviceand the WGFTIP programs. Myszewski has an MS degreefrom the University of Idaho and a strong interest in appliedtree improvement. Mary Trejo, who served as the cooperative’ssecretary for the last year, left the cooperative to pursue otheropportunities within the Texas Forest Service. There were noother changes in the Western Gulf Forest Tree ImprovementProgram or the Texas Forest Service tree improvement staffsin 1999.
The staff now includes the following:
W. J. Lowe.............................................WGFTIP GeneticistT. D. Byram............................Assistant WGFTIP GeneticistG. D. Gooding........................Assistant WGFTIP GeneticistJ. G. Hernandez......................................Research SpecialistJ. H. McLemore.........................................Aide to SpecialistJ. H. Myszewski........................................ Graduate StudentG. R. Lively............................................Research SpecialistI. N. Brown ............................................Research SpecialistD. M. Travis, Jr.........................................Aide to SpecialistG. F. Fountain...........................................Aide to Specialist
PERSONNEL

24
Bridgwater, F.E., D.L. Bramlett, and V.D. Hipkins. 1999.Timing of bag application and removal in controlled masspollination. Proc. 25th Southern Forest Tree ImprovementConference, New Orleans, LA. July 12-14 (in press).
Byram, T.D. and F.E. Bridgwater. 1999. Risk analysis ofloblolly pine controlled mass pollination programs. Proc.25th Southern Forest Tree Improvement Conference, NewOrleans, LA. July 12-14 (in press).
Byram, T.D. and W.J. Lowe. 1998. Seed orchard production:Its potential and its limitations. National Proceedings:Forest and Conservation Nursery Associations. LaFayette,LA. July 13-15. pp. 10-13.
Byram, T.D., W. J. Lowe, and G.D. Gooding. Western GulfForest Tree Improvement Program gene conservation planfor loblolly pine. Forest Genetic Resources (in press).
Byram, T.D., J.W. Richardson, and W.J. Lowe. 1999. Predict-ing seed yields from loblolly pine seed orchards: Asimulation approach using TImpSim. Southern Journal ofApplied Forestry 23(2): 117-123.
Elsik, C.G., V.T. Minihan, S.E. Hall, A.M. Scarpa and C.G.Williams. Low-copy microsatellite markers for Pinustaeda L. Genome (in press).
Gooding, G.D., F.E. Bridgwater, D.L. Bramlett and W.J. Lowe.1999. Top grafting loblolly pine in the Western Gulfregion. Proc. 25th Southern Forest Tree ImprovementConference, New Orleans, LA. July 12-14 (in press).
PUBLICATIONS
Gwaze, D.P., F.E. Bridgwater, T.D. Byram, J.A. Woolliams andC.G. Williams. Predicting age-age genetic correlations: acase study with Pinus taeda L. Theoretical and AppliedGenetics (in press).
Ji, Y.-F., D.M. Stelly, M. De Donato, M.M. Goodman and C.G.Williams. 1999. A candidate recombination modifier genefor Zea mays L. Genetics 151(2):821-830.
La Farge, T., F.E. Bridgwater and M. N. Baez. 1999.Performance of loblolly pine seed sources in Argentina.Proc. 25th Southern Forest Tree Improvement Conference,New Orleans, LA. July 12-14 (in press).
Lowe, W.J., T.D. Byram and F.E. Bridgwater. 1999. Selectingloblolly pine parents for seed orchards to minimize the costof producing pulp. Forest Science 45(2): 213-216.
Myszewski, J.H., L. Fins, J.A. Moore, W.C. Rember, M. Rust,and P. Mika. 1999. Variation in root bark chemistry ofDouglas-fir. Proc. 25th Southern Forest Tree ImprovementConference, New Orleans, LA. July 12-14 (in press).
van Buijtenen, J.P. 1999. Genomics and quantitative genetics.Paper presented at the Gene Namkoong Symposium,Vancouver, BC. July 23-24.
Williams, C.G., R.D. Barnes and I. Nyoka. 1999. Embryoniclethal load for a neotropical conifer, Pinus patula Schiedeand Deppe. Journal of Heredity 90(3): 394-398.
Williams, C.G., C.G. Elsik and R.D. Barnes. Microsatelliteanalysis of Pinus taeda L. in Zimbabwe. Journal ofHeredity (in press).
COOPERATIVE TREE IMPROVEMENT PROGRAM MEMBERS
Western Gulf Forest Tree Improvement Program
Pine ProgramFull members of the Western Gulf Forest Tree
Improvement Pine Program include the Arkansas ForestryCommission, Boise Cascade Company, The Bosch Nursery,Inc., Champion International Corporation, Deltic TimberCompany, Inc., International Paper Company, LouisianaDepartment of Agriculture and Forestry, Louisiana-PacificCorporation, Mississippi Forestry Commission, OklahomaForestry Services, Potlatch Corporation, Temple-Inland Forest,Texas Forest Service, The Timber Company, Inc.,Weyerhaeuser Company, and Willamette Industries, Inc.
Associate members include International Forest SeedCompany, Louisiana Forest Seed Company, Pacific Millen-nium Corporation, and Robbins Association.
Hardwood Program
The WGFTIP Hardwood Program includes the ArkansasForestry Commission, Champion International Corporation,Louisiana Department of Agriculture and Forestry, MississippiForestry Commission, Potlatch Corporation, Temple-InlandForest, and the Texas Forest Service.
Urban Tree Improvement Program
Membership in the Urban Tree Improvement Programincludes the following municipalities and nurseries: AldridgeNurseries (Von Ormy), Altex Nurseries (Alvin), Baytown,Burleson, Carrollton, Dallas, Dallas Nurseries (Lewisville),Fort Worth, Garland, Houston, LMS Landscape (Dallas),Plano, Rennerwood (Tennessee Colony), Richardson,Robertson’s Tree Farm (Whitehouse), and Superior TreeFoliage (Tomball).
FINANCIAL SUPPORT
Financial support was provided by members of theWestern Gulf Forest Tree Improvement Program, the membersof the Urban Tree Improvement Program, The Texas Agricul-tural Experiment Station, the Texas Forest Service, the TexasChristmas Tree Growers Association, and the USDA ForestService.

25