forum energy technologies - jefferies · forum energy technologies strategy themes 3 . 4 markets...
TRANSCRIPT
Smart Solutions. Powerful Products. Smart Solutions. Powerful Products.
Forum Energy Technologies

Smart Solutions. Powerful Products. Confidential
Forward Looking Statements
The statements made during this presentation, including the answers to your questions, include
information that the Company believes to be forward-looking statements within the meaning of
the Private Securities Litigation Reform Act. Forward-looking statements involve risk and
uncertainties that may cause actual results or events to differ materially from those expressed
or implied in such statements. Those risks include, among other things, matters that the
Company has described in its earnings release and in its filings with the Securities and
Exchange Commission. The Company does not undertake any ongoing obligation, other than
that imposed by law, to publicly update or revise any forward-looking statements to reflect
future events, information, or circumstances that arise after this presentation. In addition, this
presentation contains time sensitive information that reflects management's best judgment only
as of the date of this presentation. This presentation may contain Non-GAAP financial
measures. A reconciliation to the most directly comparable GAAP measure is included at the
end of this presentation. A copy of this presentation will be available on our website at www.f-e-
t.com for 30 days following the conference.
2
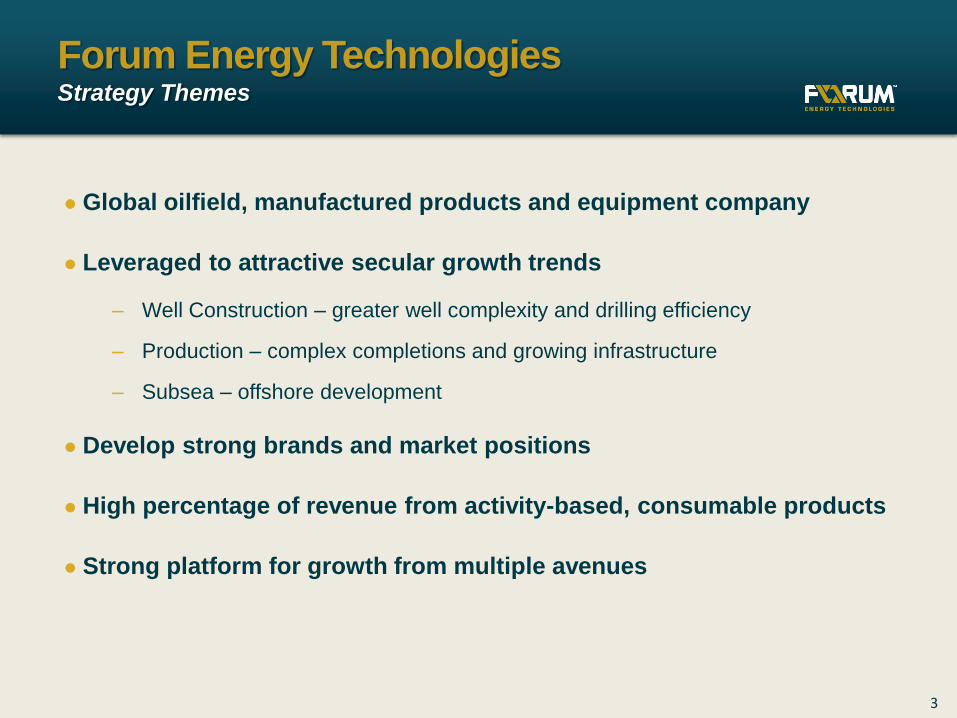
Global oilfield, manufactured products and equipment company
Leveraged to attractive secular growth trends
‒ Well Construction – greater well complexity and drilling efficiency
‒ Production – complex completions and growing infrastructure
‒ Subsea – offshore development
Develop strong brands and market positions
High percentage of revenue from activity-based, consumable products
Strong platform for growth from multiple avenues
Forum Energy Technologies Strategy Themes
3

4
Markets & Customers Full Well Cycle Exposure
Offshore Construction
Midstream & Downstream
Business Drivers
Subsea Activity 20%
Valves 15%
Drilling Contractors
Rig Count 30%
Oilfield Service Companies E&P Operators
Well Count and Well Construction 35%
E&P Operators
Subsea Construction & Development
Drilling Well Construction & Completion
Stimulation & Intervention
Production Infrastructure
Key Customers

High percentage of revenue from activity-based, consumable products
Purchases often associated with our customers’ operating expense budgets
5
Weighted Towards Consumables Activity-based Revenue Drivers
Consumable Products
53%
Other 3%
Capital Equipment
44%
Percent of 2013 Revenue
Downhole
Technologies
Flow Equipment
Valve Solutions
Drilling
Technologies
Subsea
Technologies
Production
Equipment
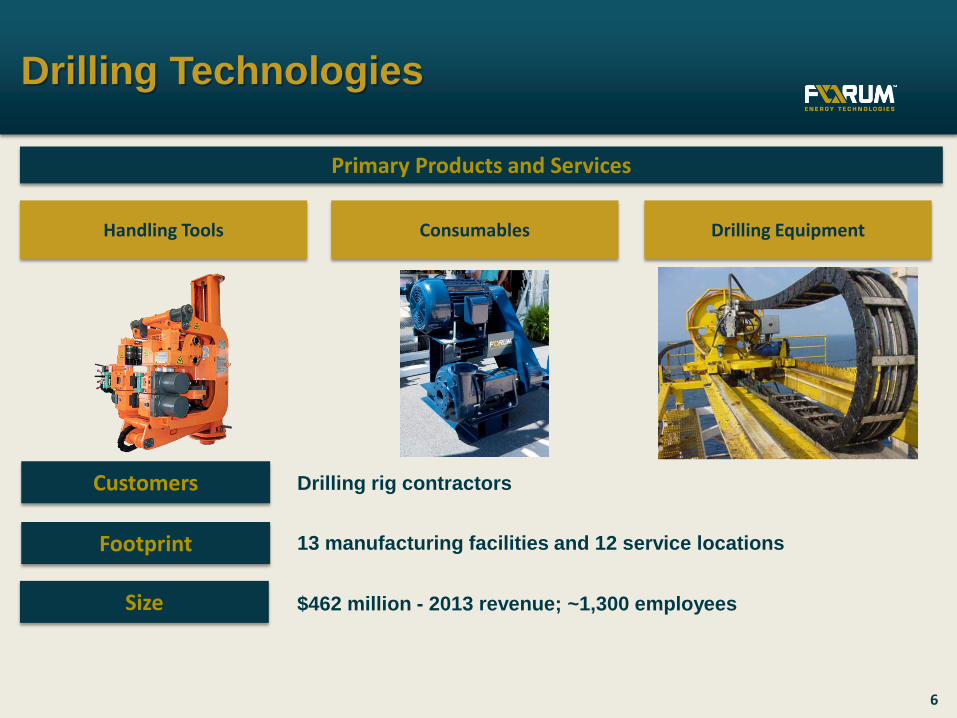
Drilling Technologies
6
Drilling rig contractors
Primary Products and Services
Customers
Footprint
Size
13 manufacturing facilities and 12 service locations
$462 million - 2013 revenue; ~1,300 employees
Handling Tools Consumables Drilling Equipment
7
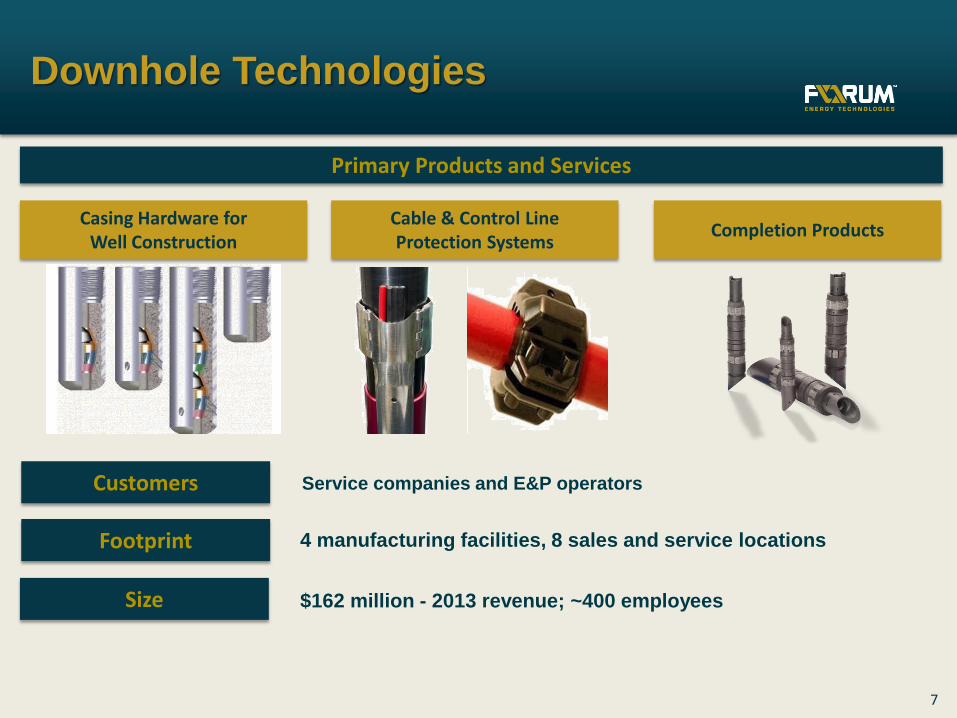
Service companies and E&P operators
Primary Products and Services
Customers
Footprint
Size
4 manufacturing facilities, 8 sales and service locations
$162 million - 2013 revenue; ~400 employees
Casing Hardware for Well Construction
Cable & Control Line Protection Systems
Completion Products
Downhole Technologies

8
Service companies
Primary Products and Services
Customers
Footprint
Size
3 manufacturing facilities, 9 sales and service locations
$123 million - 2013 revenue; ~275 employees
Treating Iron Fluid End Recertification
[insert picture]
Flow Equipment

Building a well intervention product offering for the service companies
Critical consumable products – coiled tubing and wireline
Capital items with aftermarket – pressure control
9
Primary Products and Services
Well Intervention Product Family
Coiled Tubing Wireline Cable Pressure Control

10
Subsea Capital Expenditures & Subsea Trees
Source: Quest Offshore
Subsea equipment installation
Subsea well intervention
Inspection, repair & maintenance of
installed base
-
200
400
600
800
$-
$5,000
$10,000
$15,000
$20,000
2004 2005 2006 2007 2008 2009 2010 2011 2012 2013E 2014E 2015E
No
. of
Sub
sea
Tre
e S
tart
up
s
CA
PEX
($
MM
)
Subsea Trees Tree Control Pkg Manifolds / SPUs No. of Subsea Trees

11
Current Objectives
Revenue enhancements
‒ Market share gains – international and offshore
‒ New product commercialization
‒ Leveraged to service company growth
‒ Aftermarket services
Margin improvement / operational excellence
‒ Manufacturing processes
‒ Supply chain efficiencies
‒ Quality management systems
‒ Forecasting accuracy
Organizational development
‒ Strengthen management team
‒ Increase physical capacity
Complementary acquisitions program

Westhill Campus - Aberdeen
Fallbrook Central Campus - Houston
Manufacturing
‒ Flow Equipment - TX
‒ Drilling - LA
‒ Production Equipment - OK
‒ Dynacon Subsea - TX
Distribution
‒ Flow Equipment - San Antonio
‒ Flow Equipment - Grand Prairie
‒ Multi-Product Line - Singapore & Dubai
‒ Davis-Lynch - Houston
12
Integration and Manufacturing Efficiency
Flow Equipment Manufacturing Fallbrook Campus

Focused Acquisition Strategy
13
Global oilfield, manufactured products
Leveraged to attractive secular growth trends
Strong brand and market position
Activity-based, consumable products
High growth
International expansion

3rd Quarter 2014 Results (unaudited) ($ millions)
Quarterly Revenue & Adj. EBITDA Margin %
Note: EBITDA is a non-GAAP financial measure. See reconciliation of EBITDA to Net Income at the end of this presentation.
14
$373 $368
$390 $394
$404
$428
$469
16.9% 17.3%
20.3%
19.2% 19.4% 19.4%
20.2%
16%
17%
18%
19%
20%
21%
22%
23%
24%
25%
$300
$325
$350
$375
$400
$425
$450
$475
Q1 2013 Q2 2013 Q3 2013 Q4 2013 Q1 2014 Q2 2014 Q3 2014

Capitalization Strong balance sheet to support growth initiatives
Free cash flow of $152 million in 2013 and $142 million YTD Q3 2014
$150 million share repurchase program
15
($ millions) 9/30/14 12/31/13
Capitalization
6.25% Senior unsecured notes due October 2021 403$ 403$
Senior secured revolving credit facility ($600mm) 17 108 Other debt 1 2
Total debt 421$ 513$
Total equity 1,468$ 1,331$
Total capitalization 1,889$ 1,844$
Less: cash & cash equivalents 74$ 40$
Total net capitalization 1,815$ 1,804$
Credit Statistics
Credit rating (S&P / Moody's) BB / Ba3 BB / Ba3
Net debt 347$ 473$
Net Debt / Capitalization 18% 26%
Net debt / EBITDA PF 1.0x 1.7x

Growth company – organic and M&A
Leverage to service, offshore and drilling contractors
Consumable, activity-based products
Attractive margins – ~20% EBITDA
Substantial free cash flow – $152M
Low CAPEX requirements – $60M
Conservative balance sheet and disciplined M&A
Consolidated markets and strong brands
Experienced management team
16
Summary Large cap capabilities, small cap growth

Smart Solutions. Powerful Products. Smart Solutions. Powerful Products.
Questions?

Subsea 21%
Drilling 30%
Well Construction
& Completion 10%
Stimulation & Intervention
8%
Production 17%
Infrastructure 14%
United States 60%
Europe Africa 15%
Asia Pacific 10%
Canada 7%
Latin America 4%
Middle East 4%
Consumable Products
53%
Capital Equipment
44%
Other 3%
Onshore 72%
Offshore 28%
Sources of Revenue As a percent of 2013 sales
Purchase Cycle
Well Cycle Onshore / Offshore
Geography
18

Drilling & Subsea Segment Drilling Technologies
XL Backsaver
P-Quip™ mud
pump liner
retention system
1,000 ton hydraulic elevator
125 ton air spider
Casing slip
Drill pipe
float valve
Mousehole tool
Blohm + Voss Oil Tools
FLOORHAND™
Wrangler™ Catwalk
AMC™ torque machines Offline Activity Crane
Merrimac
Mud Pump
Fluid End
Coiled Tubing
BOP 19
Drilling Consumable Product Suite Mission Critical Drilling Capital Equipment

ROV Components
Drilling & Subsea Segment Subsea Technologies
Launch & Recovery Systems
Tether
Management
Systems
Largest range of
ROVs in industry
Perry™ and Sub-Atlantic™
ROV Technology
VMax™ Simulation Systems
Source: Quest Offshore
20
Subsea Capex ($MM) & Subsea Tree Start-ups
-
200
400
600
800
$-
$5,000
$10,000
$15,000
$20,000
No
. of
Sub
sea
Tre
e S
tart
up
s
CA
PEX
($
MM
)
Subsea Trees Tree Control Pkg Manifolds / SPUs No. of Subsea Trees

Subsea Technologies Deployment of the T-1200 Trencher
21

Davis-Lynch™ Casing & Cementing Technology
Drilling & Subsea Segment Downhole Technologies
1) Spears & Associates – 2012 “Oilfield Market Report,” casing hardware market by revenue.
Weatherford 39%
Halliburton 17%
Forum (Davis-Lynch)
11%
Top-Co 8%
Varel 3%
Others 22%
22
Downhole Completion Tools Cannon™ Protection Systems Wireline Composite Frac Plugs
Trusted Name in a Consolidated Market1

Production & Infrastructure Segment Production Equipment
23
Heater Treater
Separators
Well Manifold
Tanks

Two piece trunnion valves for the shale markets
Production & Infrastructure Segment Valve Solutions
Specified ball valve of choice for the US Strategic Petroleum Reserve
Preferred valve supplier to leading Canadian oil sands producers 24

25
Production & Infrastructure Segment Flow Equipment
25

Production & Infrastructure Segment Global Tubing JV
26

Cris Gaut, Chairman & CEO
President (Drilling & Evaluation), CFO – Halliburton
Co-COO & CFO – ENSCO
Prady Iyyanki, COO
President & CEO – GE Turbomachinery Equipment
President & CEO – GE Gas Engines
Wendell Brooks, President of Production and Infrastructure
President & CEO – Allied Technology
Group Director Well Support – Wood Group
James Harris, Chief Financial Officer
CFO – Forum Oilfield Technologies
Controller – Baker Hughes
Jim McCulloch, General Counsel
General Counsel – GlobalSantaFe
Senior Management Executive team has an average of 30+ yrs of industry experience
27

Cris Gaut, FET Chairman & CEO
‒ President (Drilling & Evaluation),
CFO – Halliburton
‒ ENSCO
Franklin Myers
‒ Chief Financial Officer, Cameron
‒ General Counsel, Baker Hughes
Evelyn Angelle, Halliburton
‒ SVP – Supply Chain, Halliburton
‒ Ernst & Young
Terence O’Toole, Tinicum
‒ Managing Member, Tinicum
Partnership
‒ Goldman, Sachs & Co.
David Baldwin, SCF Partners
‒ Managing Director, SCF Partners
‒ Union Pacific Drilling
Louis A. Raspino
‒ President & CEO, Pride International
‒ CFO, Grant Prideco
John A. Carrig
‒ President & COO, ConocoPhillips
‒ CFO, Conoco Phillips
John Schmitz, Select Energy Services
‒ Chairman & CEO, Select Energy
Services
‒ HEP Oil Company
Mike McShane, Advent International
‒ President & CEO, Grant Prideco
‒ BJ Services Company
Andrew L. Waite, SCF Partners
‒ Managing Director, SCF Partners
‒ Simmons & Company
‒ Royal Dutch Shell
Board of Directors
28

29
Reconciliation of Non-GAAP Measures
Forum Energy Technologies, Inc.
Reconciliation of GAAP to non-GAAP financial information
(Unaudited)
Actual
($ millions) Q1 2013 Q2 2013 Q3 2013 Q4 2013 Q1 2014 Q2 2014 Q3 2014
EBITDA Reconciliation
Net Income attributable to common stockholders 32$ 30$ 33$ 35$ 36$ 40$ 52$
Interest expense 3 3 4 8 8 8 8
Depreciation and amortization 14 14 16 17 16 16 17
Income tax expense 15 14 14 14 16 15 21
Contingent consideration expense (benefit) - - - - - - -
Impairment of intangible assets - - - - - - -
Transaction expenses - 2 1 - - 1 2
Restructuring charges - - 9 1 - 1 -
Loss on sale of business - - - - 1 - -
Loss / (gain) on FX, net (1) 1 2 1 1 3 (5)
Adj. EBITDA 63$ 64$ 79$ 76$ 78$ 83$ 95$