four steps to application performance - bradal.com · four steps to application performance ......
TRANSCRIPT
Technical Product Overview
Four Steps to Application Performance Across the Network
With Packeteer’s PacketShaper®
September 2002
Packeteer, Inc. Cupertino, CA 95014 408.873.4400 [email protected] www.packeteer.com
Company and product names are trademarks or registered trademarks of their respective companies. Copyright 2002 Packeteer, Inc. All rights reserved. No part of this publication may be reproduced, photocopied, stored on a retrieval system, transmitted, or
translated into another language without the express written consent of Packeteer, Inc.
P/N 1600.B
Table of Contents Four Steps to Application Performance ..........................................................................3
What Is PacketShaper? .................................................................................................3
Ease of Deployment and Use........................................................................................4
A Four-Step Snapshot...................................................................................................4
Step One: Classifying Network Traffic............................................................................5 Applications and Protocols — Automatically ..............................................................5
Classification, a Step Above.........................................................................................6
Common Classification Approaches ............................................................................8
Step Two: Analyzing Traffic.............................................................................................9
Utilization Analysis ......................................................................................................9
Performance Analysis.................................................................................................14
Raw Metrics................................................................................................................18
Step Three: Controlling Traffic......................................................................................19 Partitioning Bandwidth...............................................................................................19
Per-Session Rate Policies ...........................................................................................21
Other Policies..............................................................................................................22
Rate-Control Features.................................................................................................22
Universal Translator ...................................................................................................24
Detecting and Avoiding Attacks.................................................................................24
Step Four: Generating Reports ......................................................................................24
Following a Typical Investigation...................................................................................26
Deployment — When and Where...................................................................................27 Most Appropriate Situations.......................................................................................27
Choosing a Deployment Strategy ...............................................................................28
Feature Sets .........................................................................................................28
Locations .............................................................................................................28
Topology Pictures................................................................................................29
Story of a Deployment Progression.....................................................................30
Questions to Ponder ............................................................................................30
For More Information .....................................................................................................30
Packeteer, Inc. 2
Four Steps to Application Performance Sluggish mission-critical applications are bad for business. Unfortunately, non-critical or less urgent applications tend to dominate when applications battle for bandwidth on congested WAN access links. Large email attachments or high-capacity file transfers consume more than their share of bandwidth, while Oracle, SAP, Citrix, and other critical applications struggle. Do any of these problems sound familiar to you? • A user downloads a large file and SAP performance lags. • An employee synchronizes his laptop with the message server and clogs the branch office’s
WAN link for 15 minutes. • Music enthusiasts’ MP3 downloads cause more urgent, interactive applications to struggle. • Intranet applications served from a central site offer employees easy access but poor
performance. • Repeated bandwidth upgrades fail to address performance problems but do increase costs
substantially.
Today’s enterprises require performance, predictability, and consistency from their networks and the applications that traverse them. And that’s precisely what PacketShaper® from Packeteer delivers.
This paper describes a process to avoid problems like those described in the examples above and serves as a technical product overview for the PacketShaper product line. The paper is intended for system and network administrators in organizations that manage their own applications and network performance.
What Is PacketShaper? In enterprise networks that are overwhelmed by increasing amounts of traffic, unmanaged congestion at WAN-access links and Internet links undermines application performance, resulting in impaired employee and company productivity. Network managers spend increasing portions of the budget on bandwidth upgrades in attempts to solve the performance problems, only to find that the problems persist.
PacketShaper is the bandwidth-management solution that brings predictable, efficient performance to applications running over enterprise wide-area networks (WANs) and the Internet. It balances traffic’s demands, giving each type of traffic the bandwidth it needs to perform. PacketShaper protects critical traffic, paces bandwidth-greedy traffic, and prevents any single type of traffic from monopolizing resources. It provisions bandwidth to applications, sessions, branch offices, and/or users.
PacketShaper’s four-step approach safeguards application performance and maximizes return on network capacity. It provides insight into and control over network usage. PacketShaper discovers and classifies applications, analyzes their performance, enforces policy-based bandwidth allocation, and generates reports on the results. With PacketShaper, you can control application performance to suit business priorities, make efficient use of a limited-capacity link, increase throughput, and protect critical applications.
Packeteer, Inc. 3
Ease of Deployment and Use PacketShaper sits behind WAN-link routers and/or Internet-link routers at main sites and at branch offices. PacketShaper must be positioned so that it sees all traffic you intend it to manage. You can choose to deploy PacketShaper comprehensively throughout many or all offices, or you can start more slowly and follow a phased deployment strategy by starting with a main site first. Benefits vary with topology and deployment strategy. PacketShaper is available in a variety of models based on capacity and features. For more detail, see Deployment — When and Where later in this paper.
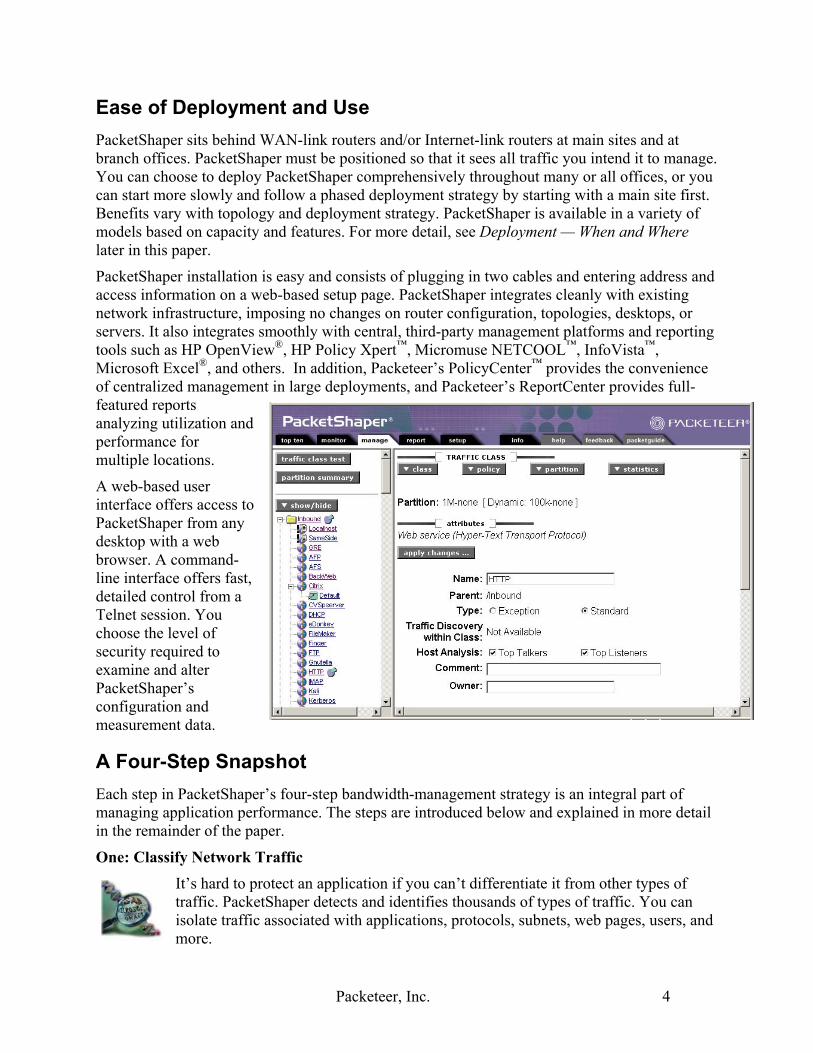
PacketShaper installation is easy and consists of plugging in two cables and entering address and access information on a web-based setup page. PacketShaper integrates cleanly with existing network infrastructure, imposing no changes on router configuration, topologies, desktops, or servers. It also integrates smoothly with central, third-party management platforms and reporting tools such as HP OpenView®, HP Policy Xpert™, Micromuse NETCOOL™, InfoVista™, Microsoft Excel®, and others. In addition, Packeteer’s PolicyCenter™ provides the convenience of centralized management in large deployments, and Packeteer’s ReportCenter provides full-featured reports analyzing utilization and performance for multiple locations.
A web-based user interface offers access to PacketShaper from any desktop with a web browser. A command-line interface offers fast, detailed control from a Telnet session. You choose the level of security required to examine and alter PacketShaper’s configuration and measurement data.
A Four-Step Snapshot Each step in PacketShaper’s four-step bandwidth-management strategy is an integral part of managing application performance. The steps are introduced below and explained in more detail in the remainder of the paper.
One: Classify Network Traffic It’s hard to protect an application if you can’t differentiate it from other types of traffic. PacketShaper detects and identifies thousands of types of traffic. You can isolate traffic associated with applications, protocols, subnets, web pages, users, and more.
Packeteer, Inc. 4
Two: Analyze Behavior
How is limited bandwidth consumed? Why do critical applications move so slowly? PacketShaper provides detailed analysis of network and application behavior. It tracks traffic levels, detects network trends, measures response time, and calculates network efficiency.
Three: Control Performance Managing application performance is a matter of precisely allocating bandwidth according to business requirements and the needs of the applications themselves. PacketShaper enables the control of all types of traffic: steady rates for voice or video streams; immediate passage for small, delay-sensitive traffic such as Telnet; and a balance of consistent access and a bandwidth limit for applications such as Microsoft Exchange that are both bandwidth-hungry and critically important.
Four: Report Results Comprehensive reports, graphs, and tables provide easy insight into historical performance, load, efficiency, and application-based service-level compliance. If performance is not suitable, control policies can be modified to bring response times within range and keep new traffic and applications from unintended impact. Reports offer proof that applications continue to perform as desired, even during network growth.
Step One: Classifying Network Traffic Identifying and categorizing the types of network traffic that compete for limited bandwidth is the first step toward solving performance problems. Packeteer calls this process classification. Rich traffic classification is crucial — bandwidth controls are useful only if you can apply them to the precise traffic you have in mind. In addition, administrators are usually surprised to see the diversity of their network applications.
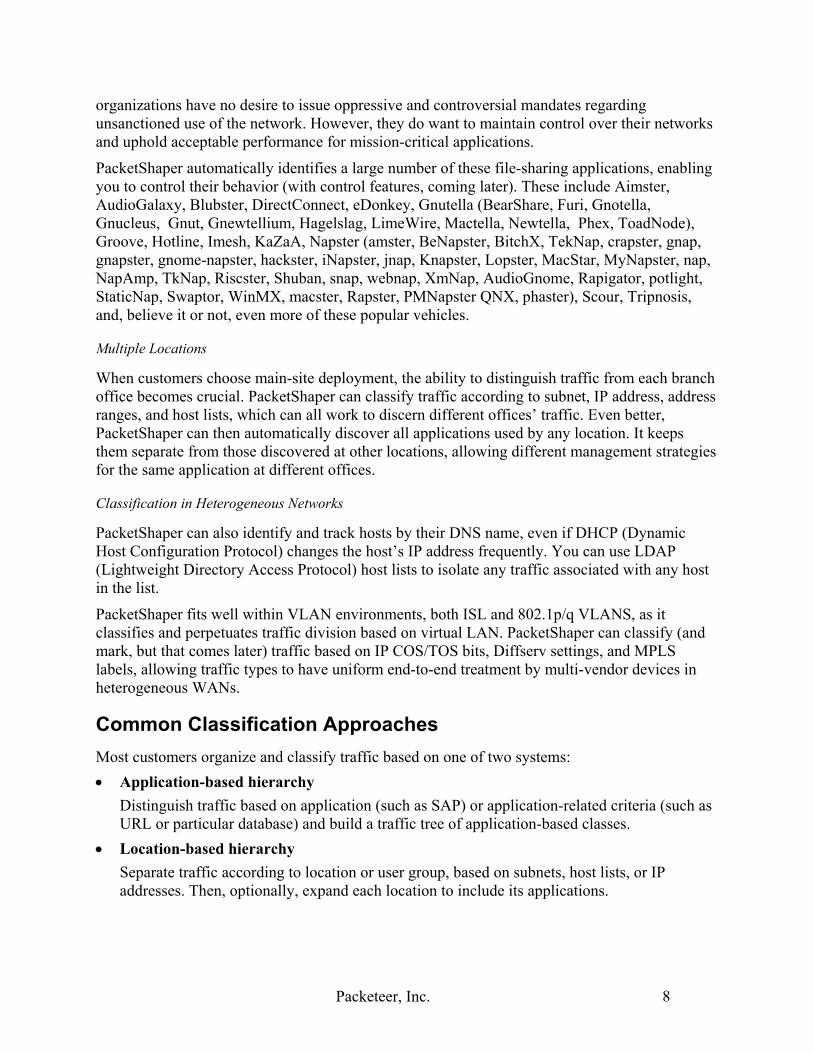
You can classify traffic by application, protocol, port number, URL or wildcard, host name, LDAP host lists, Diffserv setting, MPLS labels, IP precedence bits, IP or MAC address, subnet, travel direction (inbound/outbound), source, destination, host speed range, Mime type, web browser, Oracle database, Citrix published application, Citrix ICA priority tagging, VLAN varieties, and more. PacketShaper builds a hierarchical traffic-classification tree, inserting an entry for every distinct traffic type it
observes. Each traffic category is called a traffic class.
While most products can differentiate traffic based on layers two through four of the standard OSI networking model, PacketShaper classifies traffic based on layers two through seven, telling you precisely which applications are in use.
Applications and Protocols — Automatically Packeteer continually adds to the list of protocols and applications PacketShaper classifies automatically. A recent list includes the following services:
Packeteer, Inc. 5
Client/Server CORBA CVS Folding@Home FIX (Finance) Java Rmt Mthd MATIP (Airline) MeetingMaker NetIQ AppMngr OpenConnect JCP SunRPC (dyn port)
Content Delivery Backweb Chaincast EntryPoint Kontiki Marimba PointCast
ERP Baan JavaClient JD Edwards Oracle (7,8,9i) SAP
Internet ActiveX FTP, Passive FTP Gopher IP, IPIP, UDP, TCP IPv6 IRC Mime type NNTP SSHTCP SSL TFTP UUCP URL Web browser
Database FileMaker Pro MS SQL Oracle 7/8i Progress
Directory Services CRS DHCP DNS DPA Finger Ident Kerberos LDAP RADIUS TACACS WINS whois
E-mail, Collaboration Biff cc:MAIL IMAP LotusNotes MSSQ Microsoft DCOM (MS Exchange) Novell GroupWise POP3 SMTP
File Server AFS CVSup Lockd Microsoft-ds NetBIOS-IP NFS Novell NetWare5
Games Asheron’s Call Battle.net Diablo II Doom EverQuest Kali Half-Life LucasArts (Jedi*) MSN Zone Mythic Quake I, II, & III SonyOnline Tribes I,II Unreal Warcraft III Yahoo! Games
Host Access ATSTCP Attachmate SHARESUDP Persoft Persona SMTBF TN3270 TN5250
Legacy LAN and Non-IP AFP AppleTalk DECnet IPX FNA LAT NetBEUI MOP-DL/RC PPPoE SNA
Messaging AOL Instant Msging ICQ Chat MSN Messenger Yahoo! Messenger Internet Relay Chat
Misc CiscoCTI Date-Time DICOM HL7 NewsStand Time Server WebShots
MultiMedia Multi-cast NetShow NetMeeting QuickTime RTP Real Audio Streamworks RTSP MPEG ST2 SHOUTcast WebEx WindowsMedia
Music P2P Aimster AudioGalaxy Blubster DirectConnect eDonkey FileRogue Gnutella Groove Hotline iMesh KaZaA Napster Scour Tripnosis
Network Management Cisco Discovery ICMP by packet type Microsoft SMS NTP RSVP SNMP SYSLOG
Print LPR IPP TN5250p TN3287
Routing AURP BGP CBT DRP EGP EIGRP IGMP IGP MPLS (+tag, +app) OSPF PIM RARP RIP Spanning Tree VLAN (802.1p/q)
Security Protocol DLS DPA GRE IPSEC ISAKMP/IKE key exchange L2TP PPTP SOCKS Proxy
Session REXEC rlogin rsh Telnet Timbuktu VNC Xwindows
Thin Client or Server Based Citrix Published Apps and VideoFrame RDP/Terminal Server
Voice over IP Clarent CUSeeMe Dialpad H.323 I-Phone MCK Commun. Micom VIP Net2Phone RTP RTCP T.120 VDOPhone
New applications come along at quite a pace these days. Packeteer makes new application classification features available to customers between software releases with an easy plug-in feature. When the next obtrusive or critical application comes along, a small download enables your PacketShaper to automatically detect it.
Classification, a Step Above The number of applications is growing, and many of them are extremely bandwidth intensive. Limited bandwidth and shrinking or flat-line budgets are placing a further strain on networks. The growing complexities associated with network traffic make sophisticated classification techniques a necessity. Simple IP-address or static-port schemes fall short. PacketShaper detects dynamic port assignments, tracks transactions with migrating port assignments, differentiates among different applications using the same port, and uses layer-seven indicators to identify applications.
Web Classification
Sometimes it seems that two-thirds of network traffic is web traffic — from web browsing to web-based clients for mission-critical applications to XML-based e-commerce. But not all web
Packeteer, Inc. 6
traffic requires or deserves the same treatment. Web traffic can vary in urgency, sensitivity to latency, and performance requirements. PacketShaper can differentiate between different types of web traffic so that you can manage each with an appropriate strategy.
For example, PacketShaper can use travel direction, server location, and/or URLs to distinguish employee browsing from your own (potentially profitable) customers’ shopping. It can separate critical HTTP XML from recreational HTTP MPEGs, preventing someone’s enthusiasm for Madonna or Metallica from interfering with e-business. Some very thin web-based clients, such as Oracle’s WebForms™ and web-based S390/AS400 host access, can look like normal HTTP traffic, but PacketShaper can classify them separately.
Citrix and Oracle Classification
PacketShaper can automatically isolate each published application running within a Citrix environment. For example, it can distinguish Microsoft Word from PeopleSoft, and it can distinguish interactive PeopleSoft traffic from its print traffic.
PacketShaper differentiates many types of Oracle traffic, allowing you to tailor your analysis or management strategies. For example, PacketShaper can separate Oracle traffic accessing the “sales” database from Oracle traffic accessing the “accounting” database. PacketShaper identifies Oracle8i/9i and netv2 protocols using a multi-threaded server as well as the older Oracle 7 (or before) and netv1 protocols using a dedicated server.
Intricate Port Classification
When multiple applications use the same port, it is usually difficult to apply different management or analysis strategies because they appear as one application. Not so for PacketShaper. For example, PacketShaper can distinguish TN3270 and TN5250 sessions from other Telnet sessions even though all use well-known port 23.
In addition, an application that hops from port to port can be a challenge to identify, because it looks like different applications. But, as before, not so for PacketShaper. For example, AOL instant messaging and passive FTP both hop ports frequently, but PacketShaper tracks them both throughout their journeys.
File-Sharing Protocols
Although specific peer-to-peer applications come and go with political and legal battles, there are now whole genres of peer-to-peer applications that facilitate file sharing. These favorites of music lovers have taken a heavy toll on network performance. Schools, businesses, and other
Packeteer, Inc. 7
organizations have no desire to issue oppressive and controversial mandates regarding unsanctioned use of the network. However, they do want to maintain control over their networks and uphold acceptable performance for mission-critical applications.
PacketShaper automatically identifies a large number of these file-sharing applications, enabling you to control their behavior (with control features, coming later). These include Aimster, AudioGalaxy, Blubster, DirectConnect, eDonkey, Gnutella (BearShare, Furi, Gnotella, Gnucleus, Gnut, Gnewtellium, Hagelslag, LimeWire, Mactella, Newtella, Phex, ToadNode), Groove, Hotline, Imesh, KaZaA, Napster (amster, BeNapster, BitchX, TekNap, crapster, gnap, gnapster, gnome-napster, hackster, iNapster, jnap, Knapster, Lopster, MacStar, MyNapster, nap, NapAmp, TkNap, Riscster, Shuban, snap, webnap, XmNap, AudioGnome, Rapigator, potlight, StaticNap, Swaptor, WinMX, macster, Rapster, PMNapster QNX, phaster), Scour, Tripnosis, and, believe it or not, even more of these popular vehicles.
Multiple Locations
When customers choose main-site deployment, the ability to distinguish traffic from each branch office becomes crucial. PacketShaper can classify traffic according to subnet, IP address, address ranges, and host lists, which can all work to discern different offices’ traffic. Even better, PacketShaper can then automatically discover all applications used by any location. It keeps them separate from those discovered at other locations, allowing different management strategies for the same application at different offices.
Classification in Heterogeneous Networks
PacketShaper can also identify and track hosts by their DNS name, even if DHCP (Dynamic Host Configuration Protocol) changes the host’s IP address frequently. You can use LDAP (Lightweight Directory Access Protocol) host lists to isolate any traffic associated with any host in the list.
PacketShaper fits well within VLAN environments, both ISL and 802.1p/q VLANS, as it classifies and perpetuates traffic division based on virtual LAN. PacketShaper can classify (and mark, but that comes later) traffic based on IP COS/TOS bits, Diffserv settings, and MPLS labels, allowing traffic types to have uniform end-to-end treatment by multi-vendor devices in heterogeneous WANs.
Common Classification Approaches Most customers organize and classify traffic based on one of two systems: • Application-based hierarchy
Distinguish traffic based on application (such as SAP) or application-related criteria (such as URL or particular database) and build a traffic tree of application-based classes.
• Location-based hierarchy Separate traffic according to location or user group, based on subnets, host lists, or IP addresses. Then, optionally, expand each location to include its applications.
Packeteer, Inc. 8
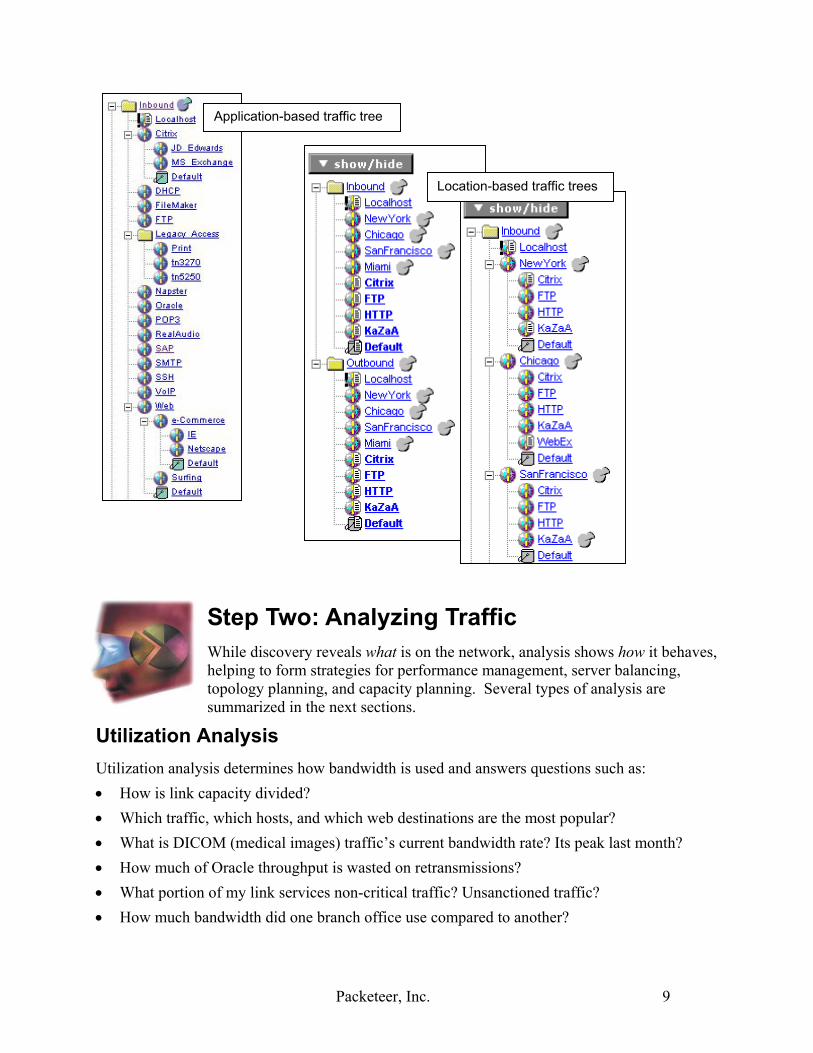
Application-based traffic tree
Location-based traffic trees
Step Two: Analyzing Traffic While discovery reveals what is on the network, analysis shows how it behaves, helping to form strategies for performance management, server balancing, topology planning, and capacity planning. Several types of analysis are summarized in the next sections.
Utilization Analysis Utilization analysis determines how bandwidth is used and answers questions such as: • How is link capacity divided? • Which traffic, which hosts, and which web destinations are the most popular? • What is DICOM (medical images) traffic’s current bandwidth rate? Its peak last month? • How much of Oracle throughput is wasted on retransmissions? • What portion of my link services non-critical traffic? Unsanctioned traffic? • How much bandwidth did one branch office use compared to another?
Packeteer, Inc. 9
PacketShaper tracks average and peak traffic levels, identifies top users and applications, evaluates network efficiency, and more. PacketShaper gives you an automatic breakdown of usage statistics for each traffic class and, if you want it, even for each user.
Several graphs and analysis techniques are described below. For a more comprehensive list of PacketShaper graphs, consult PacketGuide’s Reference section and look for Graphs. For a more comprehensive description of analysis techniques, consult PacketGuide’s Solution section and look for Analysis. (PacketGuide is available at support.packeteer.com/documentation.)
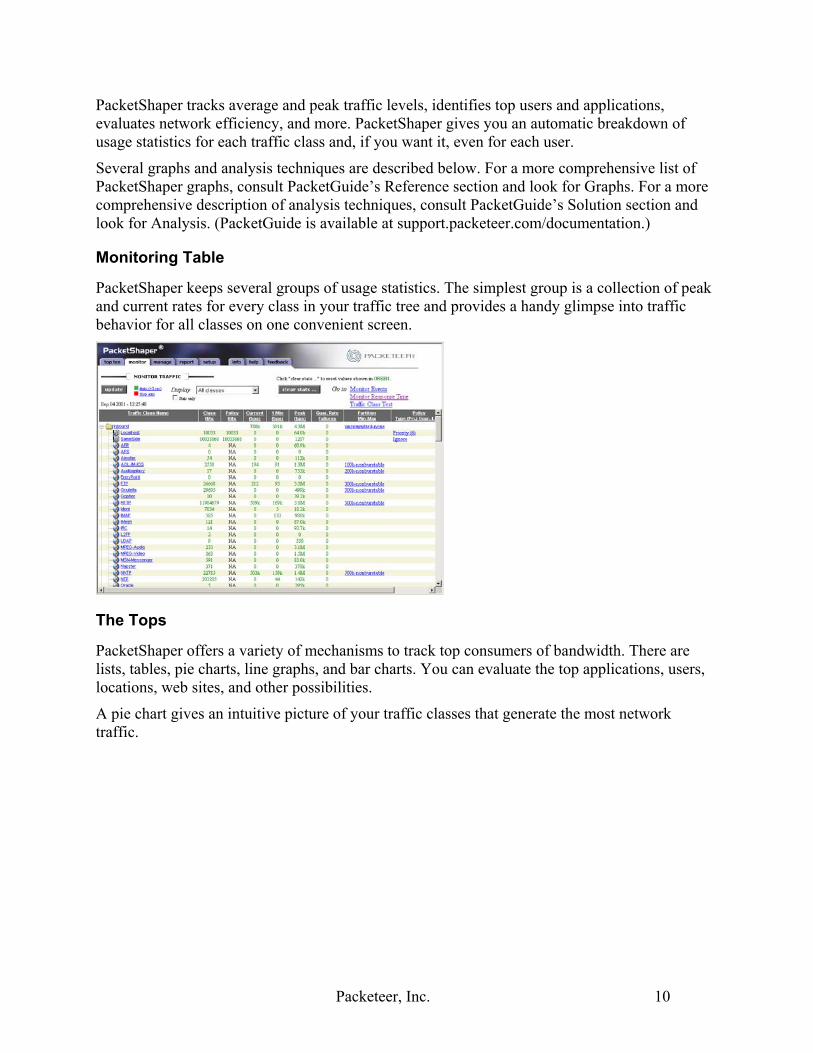
Monitoring Table
PacketShaper keeps several groups of usage statistics. The simplest group is a collection of peak and current rates for every class in your traffic tree and provides a handy glimpse into traffic behavior for all classes on one convenient screen.
The Tops
PacketShaper offers a variety of mechanisms to track top consumers of bandwidth. There are lists, tables, pie charts, line graphs, and bar charts. You can evaluate the top applications, users, locations, web sites, and other possibilities.
A pie chart gives an intuitive picture of your traffic classes that generate the most network traffic.
Packeteer, Inc. 10
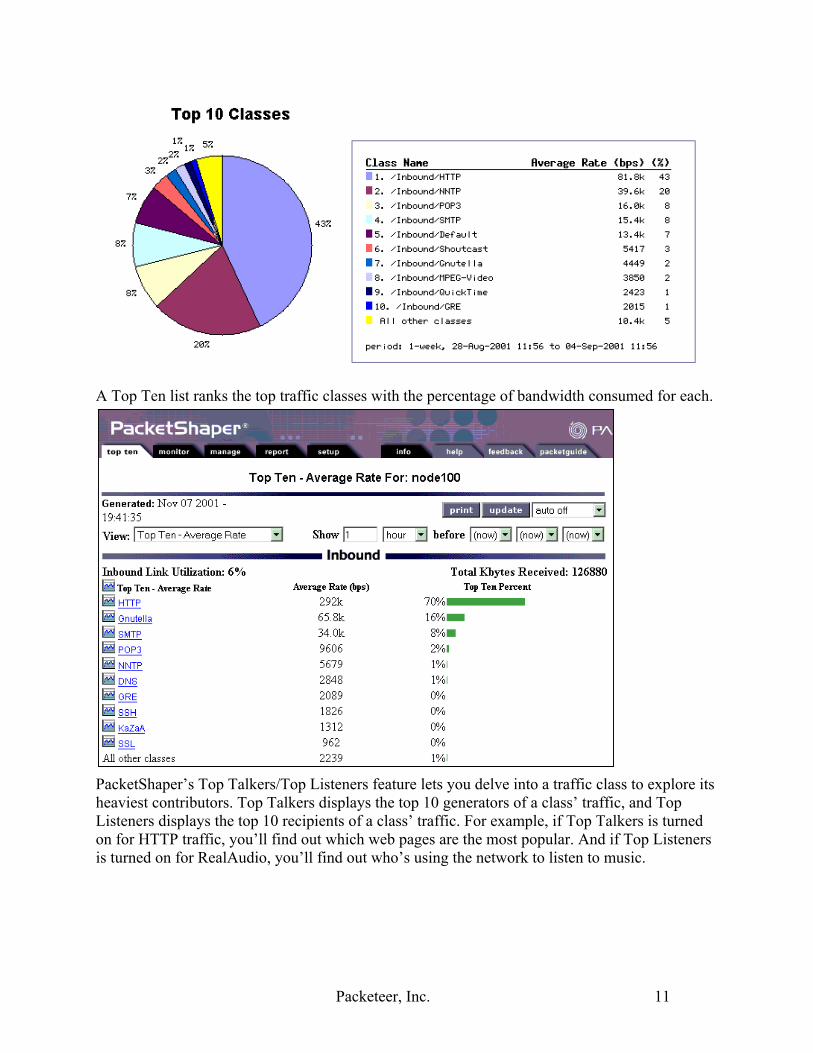
A Top Ten list ranks the top traffic classes with the percentage of bandwidth consumed for each.
PacketShaper’s Top Talkers/Top Listeners feature lets you delve into a traffic class to explore its heaviest contributors. Top Talkers displays the top 10 generators of a class’ traffic, and Top Listeners displays the top 10 recipients of a class’ traffic. For example, if Top Talkers is turned on for HTTP traffic, you’ll find out which web pages are the most popular. And if Top Listeners is turned on for RealAudio, you’ll find out who’s using the network to listen to music.
Packeteer, Inc. 11
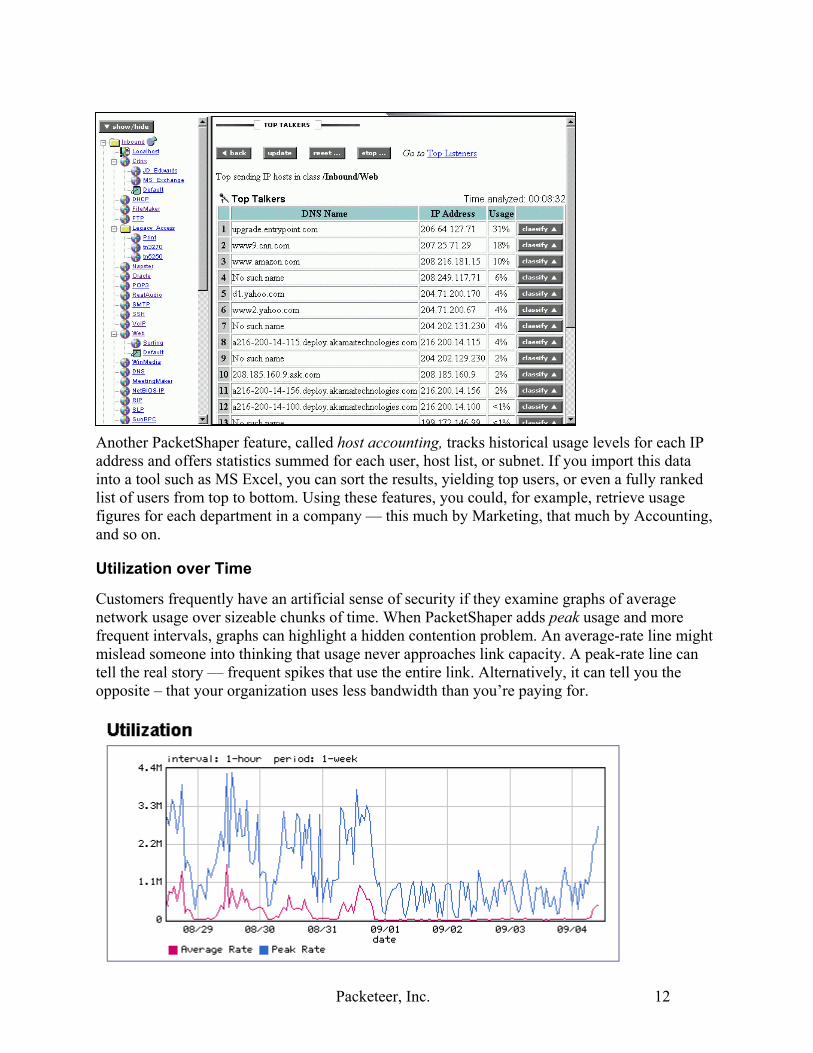
Another PacketShaper feature, called host accounting, tracks historical usage levels for each IP address and offers statistics summed for each user, host list, or subnet. If you import this data into a tool such as MS Excel, you can sort the results, yielding top users, or even a fully ranked list of users from top to bottom. Using these features, you could, for example, retrieve usage figures for each department in a company — this much by Marketing, that much by Accounting, and so on.
Utilization over Time
Customers frequently have an artificial sense of security if they examine graphs of average network usage over sizeable chunks of time. When PacketShaper adds peak usage and more frequent intervals, graphs can highlight a hidden contention problem. An average-rate line might mislead someone into thinking that usage never approaches link capacity. A peak-rate line can tell the real story — frequent spikes that use the entire link. Alternatively, it can tell you the opposite – that your organization uses less bandwidth than you’re paying for.
Packeteer, Inc. 12
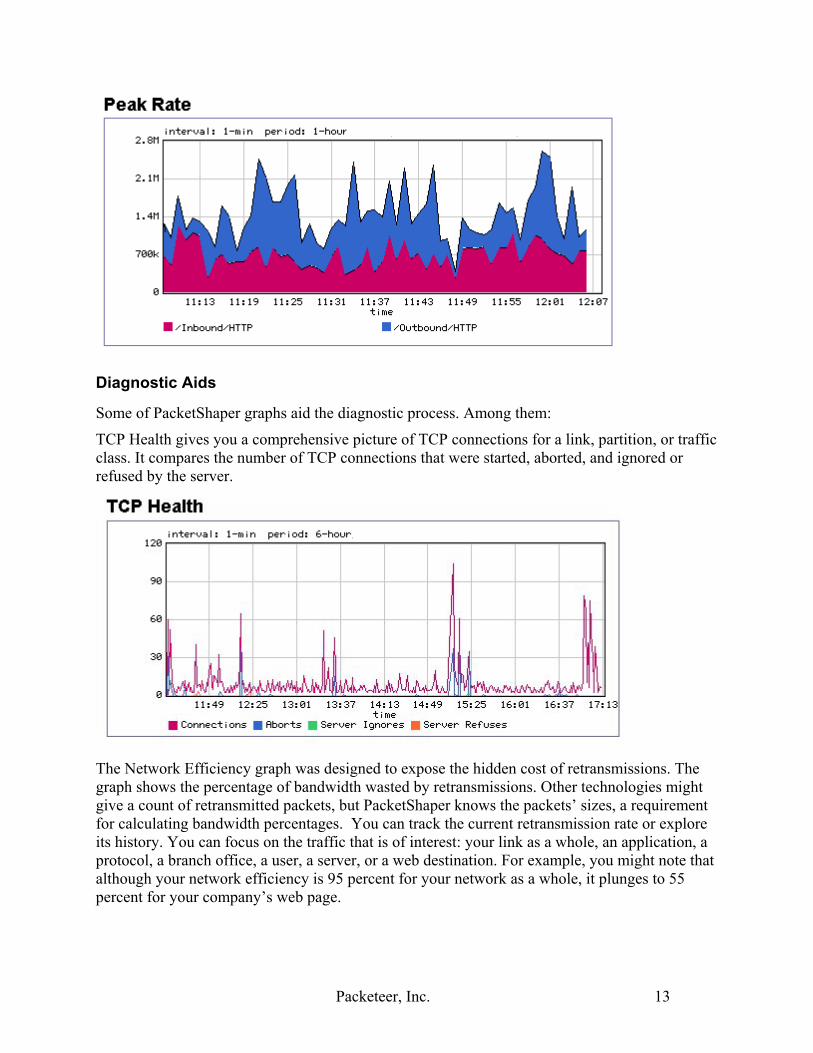
Diagnostic Aids
Some of PacketShaper graphs aid the diagnostic process. Among them:
TCP Health gives you a comprehensive picture of TCP connections for a link, partition, or traffic class. It compares the number of TCP connections that were started, aborted, and ignored or refused by the server.
The Network Efficiency graph was designed to expose the hidden cost of retransmissions. The graph shows the percentage of bandwidth wasted by retransmissions. Other technologies might give a count of retransmitted packets, but PacketShaper knows the packets’ sizes, a requirement for calculating bandwidth percentages. You can track the current retransmission rate or explore its history. You can focus on the traffic that is of interest: your link as a whole, an application, a protocol, a branch office, a user, a server, or a web destination. For example, you might note that although your network efficiency is 95 percent for your network as a whole, it plunges to 55 percent for your company’s web page.
Packeteer, Inc. 13
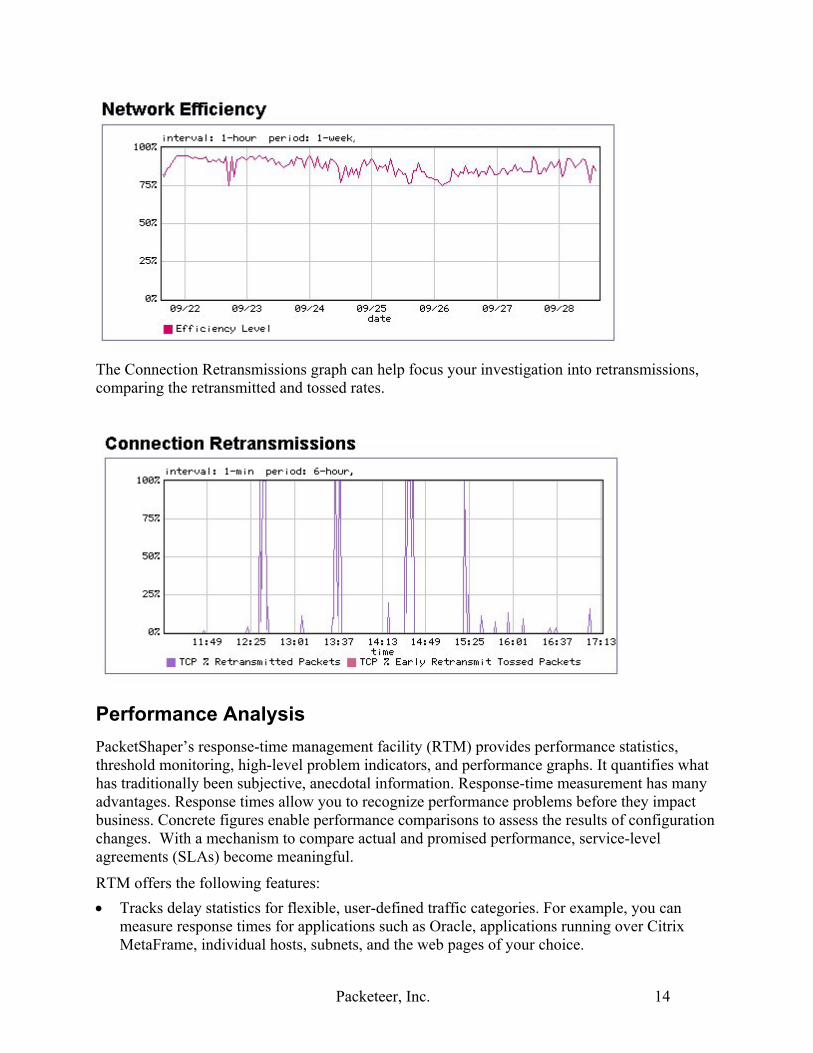
The Connection Retransmissions graph can help focus your investigation into retransmissions, comparing the retransmitted and tossed rates.
Performance Analysis PacketShaper’s response-time management facility (RTM) provides performance statistics, threshold monitoring, high-level problem indicators, and performance graphs. It quantifies what has traditionally been subjective, anecdotal information. Response-time measurement has many advantages. Response times allow you to recognize performance problems before they impact business. Concrete figures enable performance comparisons to assess the results of configuration changes. With a mechanism to compare actual and promised performance, service-level agreements (SLAs) become meaningful.
RTM offers the following features: • Tracks delay statistics for flexible, user-defined traffic categories. For example, you can
measure response times for applications such as Oracle, applications running over Citrix MetaFrame, individual hosts, subnets, and the web pages of your choice.
Packeteer, Inc. 14

• Breaks each response-time measurement into network delay (time spent in transit) and server delay (time the server used to process the request).
• Identifies the users and servers with the slowest performance, called Worst Clients and Worst Servers.
• Allows users to set acceptability standards and track whether performance adheres to the standards. You can set the speed that divides good response from bad (900 ms, for example). And you can set the percentage of transactions that should be within your performance goal (such as 95 percent).
• Offers current and historical performance data in intuitive tables and graphs, in a MIB (management information base), or as raw data. SNMP management tools, such as HP OpenView, and third-party reporting tools, such as InfoVista, integrate smoothly.
PacketShaper’s position in the corporate network — monitoring and controlling all the traffic that passes — gives it a unique opportunity to provide accurate response-time measurements at a very low cost. Because it already classifies every packet, PacketShaper can easily calculate the time traffic spends traveling between a client and a server and the time used by the server itself. Rather than perform extra steps to collect response data, PacketShaper notes response times as traffic passes. PacketShaper generates accurate performance measurements at a low operational cost and with low network overhead.
A few of PacketShaper’s screens for performance analysis are on the next few pages.
The Monitor Response Time window displays all performance-related statistics for each measured class on one screen.
Packeteer, Inc. 15
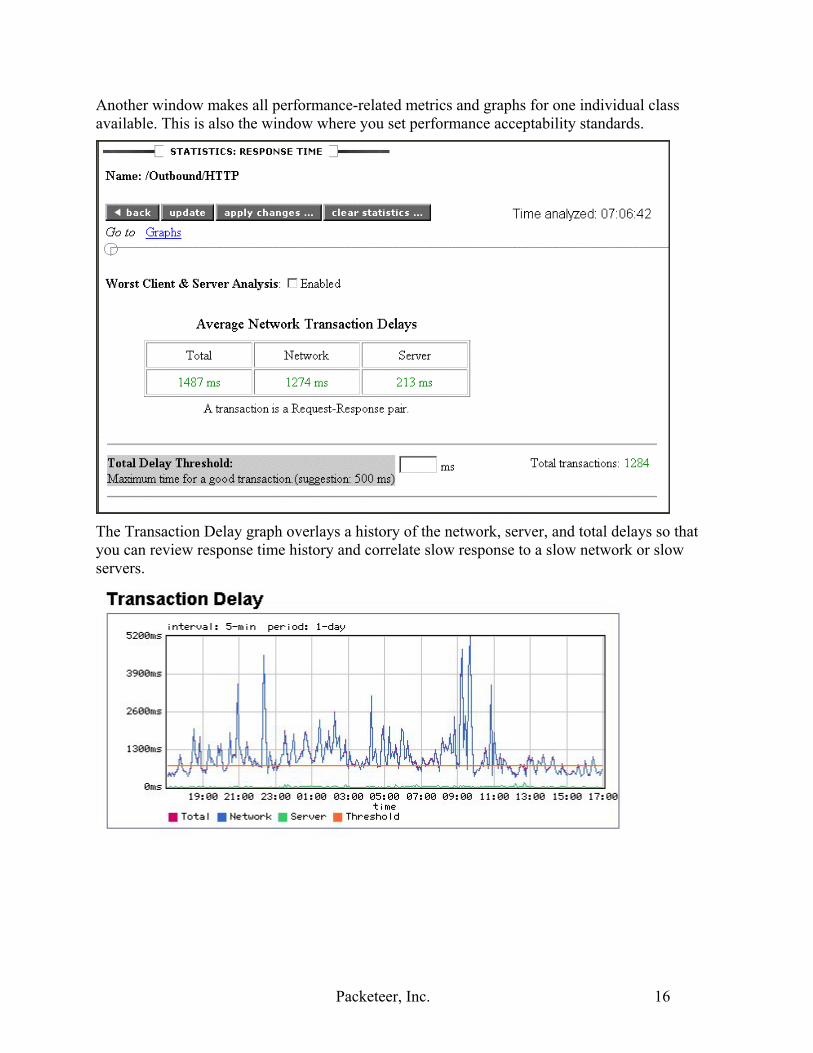
Another window makes all performance-related metrics and graphs for one individual class available. This is also the window where you set performance acceptability standards.
The Transaction Delay graph overlays a history of the network, server, and total delays so that you can review response time history and correlate slow response to a slow network or slow servers.
Packeteer, Inc. 16
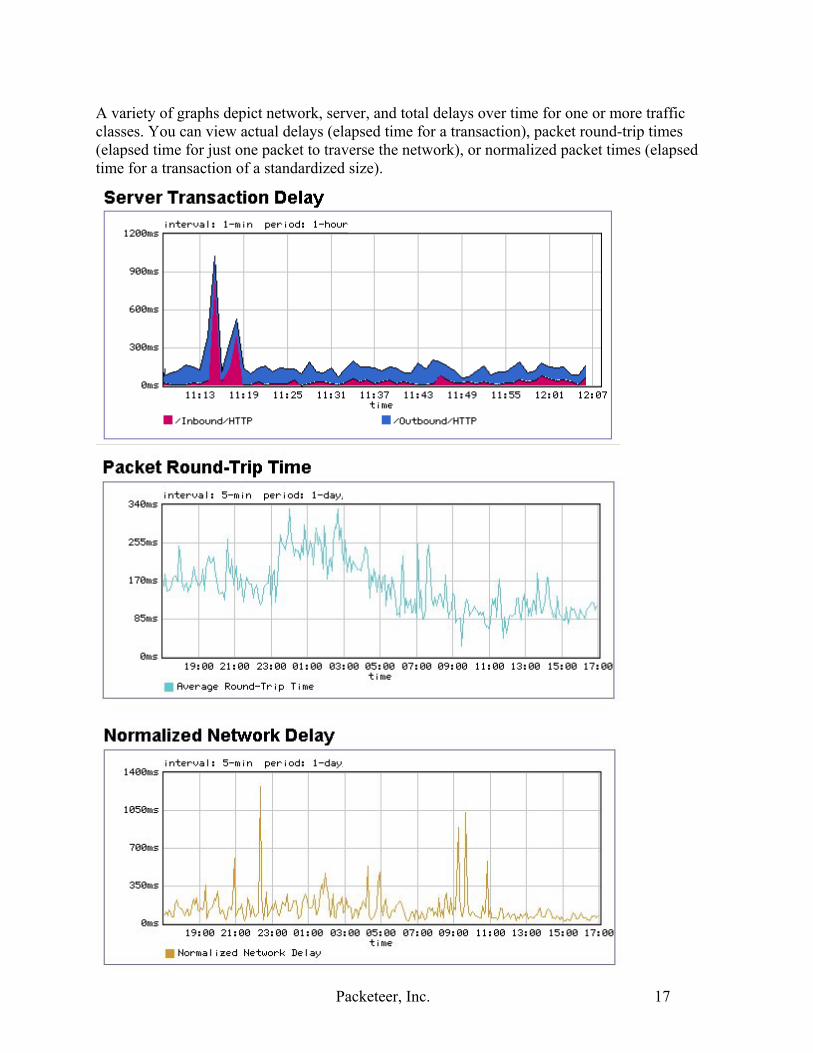
A variety of graphs depict network, server, and total delays over time for one or more traffic classes. You can view actual delays (elapsed time for a transaction), packet round-trip times (elapsed time for just one packet to traverse the network), or normalized packet times (elapsed time for a transaction of a standardized size).
Pa
cketeer, Inc. 17
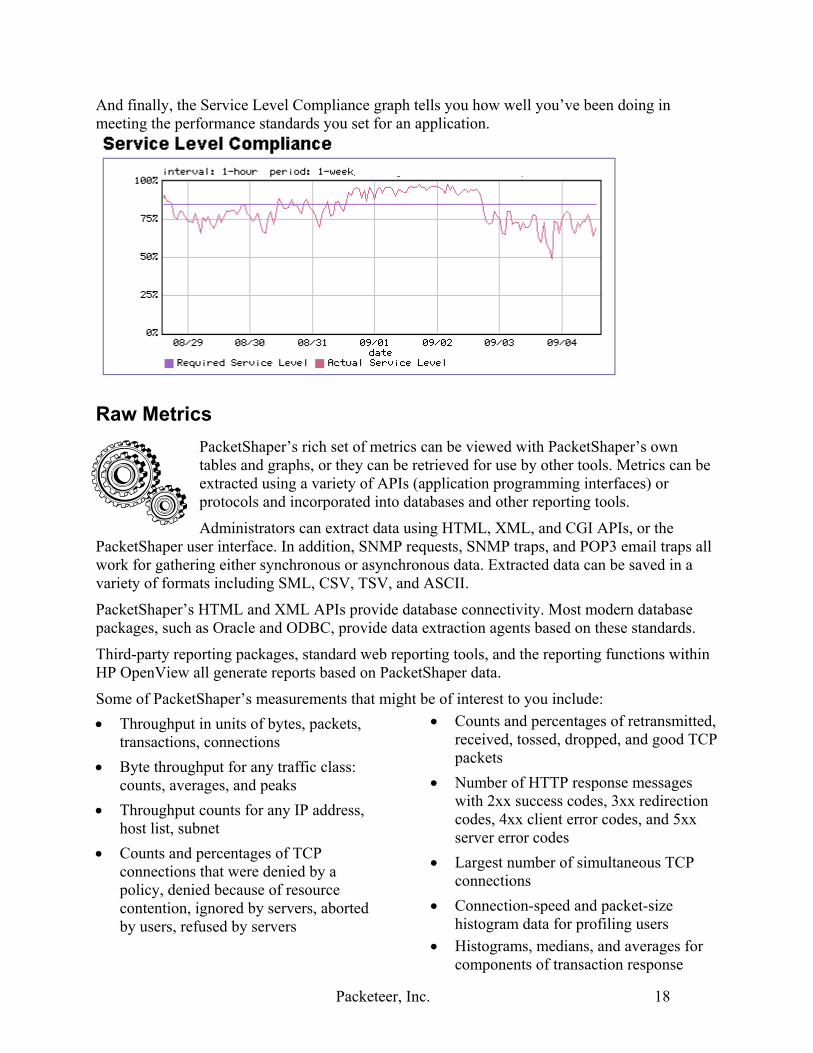
And finally, the Service Level Compliance graph tells you how well you’ve been doing in meeting the performance standards you set for an application.
Raw Metrics PacketShaper’s rich set of metrics can be viewed with PacketShaper’s own tables and graphs, or they can be retrieved for use by other tools. Metrics can be extracted using a variety of APIs (application programming interfaces) or protocols and incorporated into databases and other reporting tools.
Administrators can extract data using HTML, XML, and CGI APIs, or the PacketShaper user interface. In addition, SNMP requests, SNMP traps, and POP3 email traps all work for gathering either synchronous or asynchronous data. Extracted data can be saved in a variety of formats including SML, CSV, TSV, and ASCII.
PacketShaper’s HTML and XML APIs provide database connectivity. Most modern database packages, such as Oracle and ODBC, provide data extraction agents based on these standards.
Third-party reporting packages, standard web reporting tools, and the reporting functions within HP OpenView all generate reports based on PacketShaper data.
Some of PacketShaper’s measurements that might be of interest to you include: • Throughput in units of bytes, packets,
transactions, connections • Byte throughput for any traffic class:
counts, averages, and peaks • Throughput counts for any IP address,
host list, subnet • Counts and percentages of TCP
connections that were denied by a policy, denied because of resource contention, ignored by servers, aborted by users, refused by servers
• Counts and percentages of retransmitted, received, tossed, dropped, and good TCP packets
• Number of HTTP response messages with 2xx success codes, 3xx redirection codes, 4xx client error codes, and 5xx server error codes
• Largest number of simultaneous TCP connections
• Connection-speed and packet-size histogram data for profiling users
• Histograms, medians, and averages for components of transaction response
Packeteer, Inc. 18
time: network delay, server delay, total delay, round-trip time, and normalized network delay
• Counts and percentages of transactions that satisfied (or did not satisfy) performance requirements
• Time intervals within service-level compliance
• Time intervals that a service was unavailable
• Top applications, URLs, users; worst performing clients and servers
• Number of users per dynamic partition, using dynamic partitions, and denied access to dynamic partitions
• Counts of traffic flows that were blocked after exceeding a configurable flow limit (suspected DoS attack involvement)
• Numbers of software licenses allowed and in use
Step Three: Controlling Traffic
Abundant data, elastic protocols that swell to use any available bandwidth, speed-conversion bottlenecks, and new, popular, and bandwidth-hungry applications seem to conspire against application performance. Mission-critical applications suffer while less important traffic dominates a link. Unfortunately, most network-management tools stop after identifying performance problems. But that’s not enough. PacketShaper’s third step — control — gives you the ability to solve those problems.
PacketShaper controls bandwidth allocation with a tremendous amount of flexibility and power. It can protect, pace, or contain application performance by applying appropriate bandwidth controls. It can provision bandwidth on a per-user, per-session, per-stream, or per-application basis. Each traffic class maps to a specific bandwidth-allocation policy ensuring that each type of traffic receives an appropriate bandwidth slice.
Partitioning Bandwidth Suppose an insurance firm posts a new file to be downloaded by interested parties. Although these file transfers are critically important, they are not time sensitive. When too many users grab the file, interactive applications grind to a halt — including urgent applications such as those needed for claim and sales processing. If performance is unmanaged, or even monitored but not controlled, the company’s network and application performance does not support the company’s business goals.
What’s needed? After all, the file transfers are necessary, just not at the expense of urgent applications. The company needs to be able to divide its link into multiple, unequal portions. Downloads should have some bandwidth but should be capped. And urgent applications need to be protected. PacketShaper’s partitions do just that.
Partition Description
A partition creates a virtual separate pipe for a traffic class. You specify the size of the reserved link, designate whether it can expand, and optionally cap its growth. Partitions function
Packeteer, Inc. 19
similarly to frame-relay PVCs, but with the added important benefit of sharing their unused excess bandwidth with other traffic.
With PacketShaper, the administrator at the insurance firm can create an FTP traffic class and assign it to its own partition. When someone initiates a file transfer, bandwidth is available, no matter what other traffic is present. But the transfers are contained to a maximum amount of bandwidth. It’s unlikely that transfers taking three minutes instead of two would impact users.
When there’s less FTP demand, other traffic can lay claim to the FTP partition’s unused bandwidth. Similarly, another partition can reserve an appropriate amount of bandwidth for claim-processing applications. If unused, the bandwidth goes to others. But if needed, no amount of FTP, web surfing, or large emails can infringe.
A partition is also an appropriate solution for managing Microsoft Exchange traffic. You might define a partition to ensure that during periods of network congestion, Exchange always receives at least 25 percent of the available bandwidth and never uses more than 50 percent. The partition safeguards Exchange traffic while at the same time keeps it from consuming the whole link.
When does a partition make sense? It’s for situations where you don’t need to be concerned about each individual flow or session of traffic, but just with an aggregate total. For example, the partition for Exchange did nothing to prevent one Exchange user from impacting another.
Variations on the Partition Theme
Two variations on the partition theme are of particular interest: hierarchical partitions and dynamic partitions.
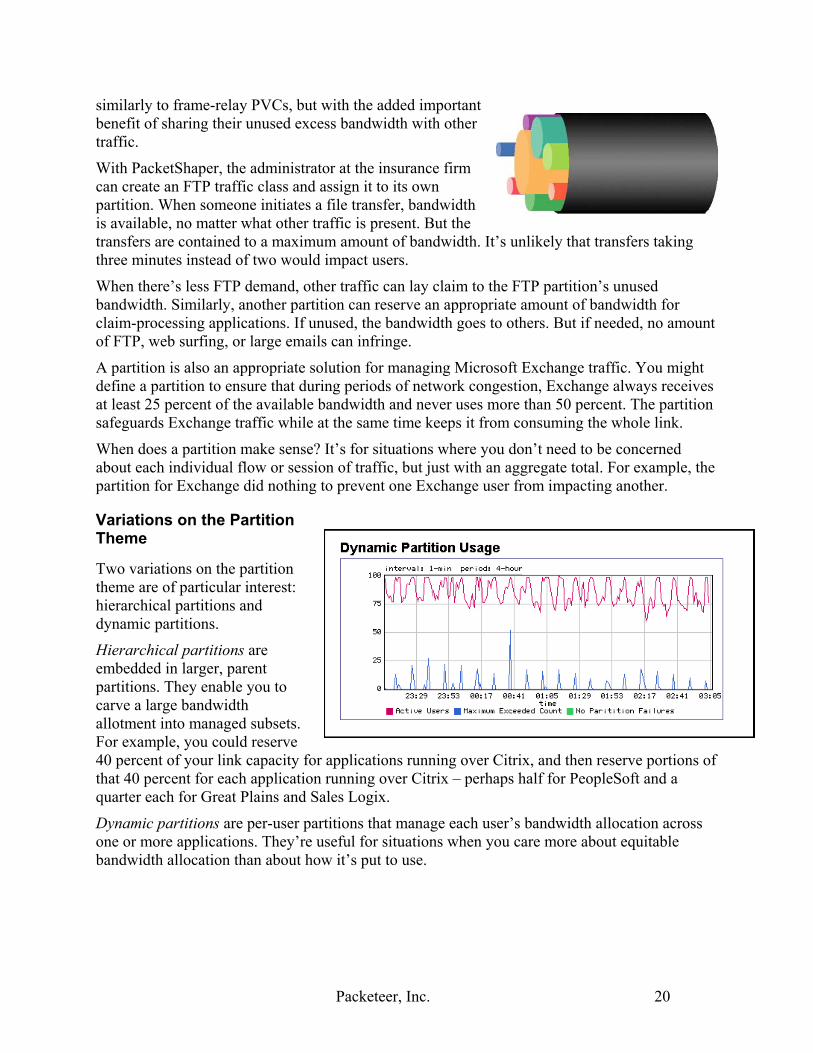
Hierarchical partitions are embedded in larger, parent partitions. They enable you to carve a large bandwidth allotment into managed subsets. For example, you could reserve 40 percent of your link capacity for applications running over Citrix, and then reserve portions of that 40 percent for each application running over Citrix – perhaps half for PeopleSoft and a quarter each for Great Plains and Sales Logix.
Dynamic partitions are per-user partitions that manage each user’s bandwidth allocation across one or more applications. They’re useful for situations when you care more about equitable bandwidth allocation than about how it’s put to use.
Packeteer, Inc. 20
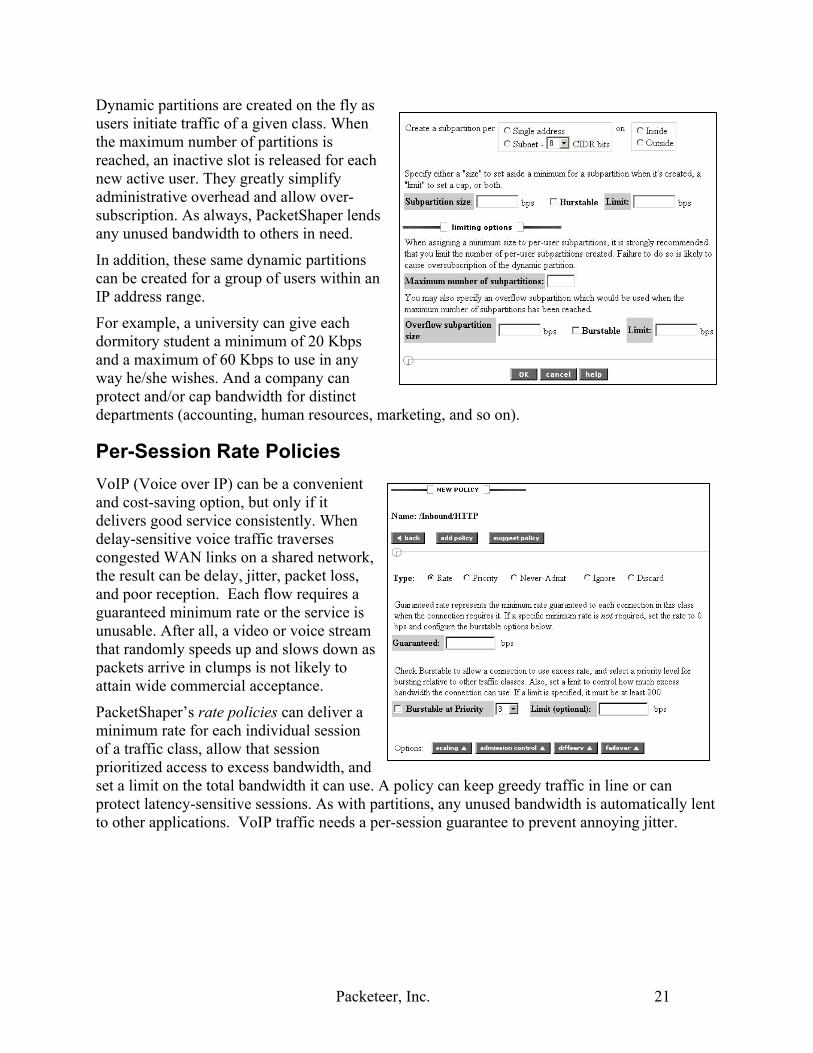
Dynamic partitions are created on the fly as users initiate traffic of a given class. When the maximum number of partitions is reached, an inactive slot is released for each new active user. They greatly simplify administrative overhead and allow over-subscription. As always, PacketShaper lends any unused bandwidth to others in need.
In addition, these same dynamic partitions can be created for a group of users within an IP address range.
For example, a university can give each dormitory student a minimum of 20 Kbps and a maximum of 60 Kbps to use in any way he/she wishes. And a company can protect and/or cap bandwidth for distinct departments (accounting, human resources, marketing, and so on).
Per-Session Rate Policies VoIP (Voice over IP) can be a convenient and cost-saving option, but only if it delivers good service consistently. When delay-sensitive voice traffic traverses congested WAN links on a shared network, the result can be delay, jitter, packet loss, and poor reception. Each flow requires a guaranteed minimum rate or the service is unusable. After all, a video or voice stream that randomly speeds up and slows down as packets arrive in clumps is not likely to attain wide commercial acceptance.
PacketShaper’s rate policies can deliver a minimum rate for each individual session of a traffic class, allow that session prioritized access to excess bandwidth, and set a limit on the total bandwidth it can use. A policy can keep greedy traffic in line or can protect latency-sensitive sessions. As with partitions, any unused bandwidth is automatically lent to other applications. VoIP traffic needs a per-session guarantee to prevent annoying jitter.
Packeteer, Inc. 21
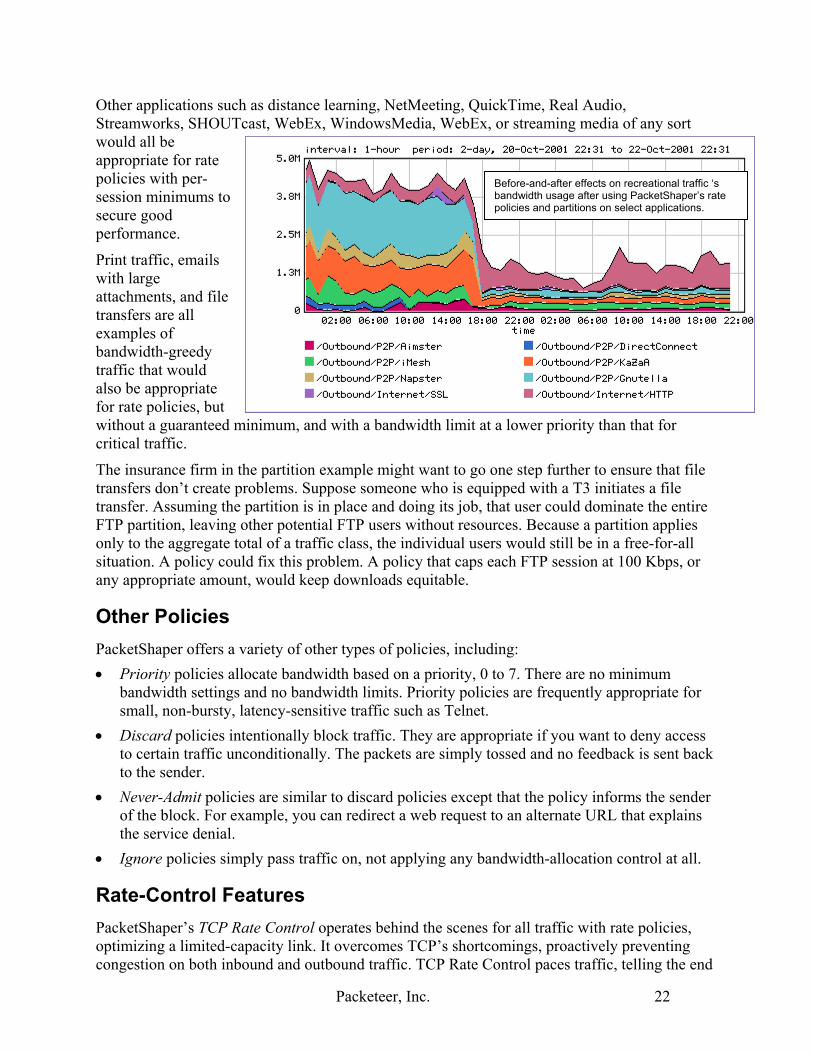
Other applications such as distance learning, NetMeeting, QuickTime, Real Audio, Streamworks, SHOUTcast, WebEx, WindowsMedia, WebEx, or streaming media of any sort would all be appropriate for rate policies with per-session minimums to secure good performance.
Print traffic, emails with large attachments, and file transfers are all examples of bandwidth-greedtraffic that woulalso be approprifor rate policies,without a guarancritical traffic.
Before-and-after effects on recreational traffic ‘s bandwidth usage after using PacketShaper’s rate policies and partitions on select applications.
The insurance fitransfers don’t ctransfer. AssumiFTP partition, leonly to the aggresituation. A poliany appropriate
Other PolicPacketShaper of• Priority poli
bandwidth ssmall, non-b
• Discard polito certain trato the sender
• Never-Admiof the block.the service d
• Ignore polic
Rate-ContrPacketShaper’s optimizing a limcongestion on bo
y d ate but teed minimum, and with a bandwidth limit at a lower priority than that for
rm in the partition example might want to go one step further to ensure that file reate problems. Suppose someone who is equipped with a T3 initiates a file ng the partition is in place and doing its job, that user could dominate the entire aving other potential FTP users without resources. Because a partition applies gate total of a traffic class, the individual users would still be in a free-for-all
cy could fix this problem. A policy that caps each FTP session at 100 Kbps, or amount, would keep downloads equitable.
ies fers a variety of other types of policies, including: cies allocate bandwidth based on a priority, 0 to 7. There are no minimum ettings and no bandwidth limits. Priority policies are frequently appropriate for ursty, latency-sensitive traffic such as Telnet. cies intentionally block traffic. They are appropriate if you want to deny access ffic unconditionally. The packets are simply tossed and no feedback is sent back .
t policies are similar to discard policies except that the policy informs the sender For example, you can redirect a web request to an alternate URL that explains enial. ies simply pass traffic on, not applying any bandwidth-allocation control at all.
ol Features TCP Rate Control operates behind the scenes for all traffic with rate policies, ited-capacity link. It overcomes TCP’s shortcomings, proactively preventing th inbound and outbound traffic. TCP Rate Control paces traffic, telling the end
Packeteer, Inc. 22
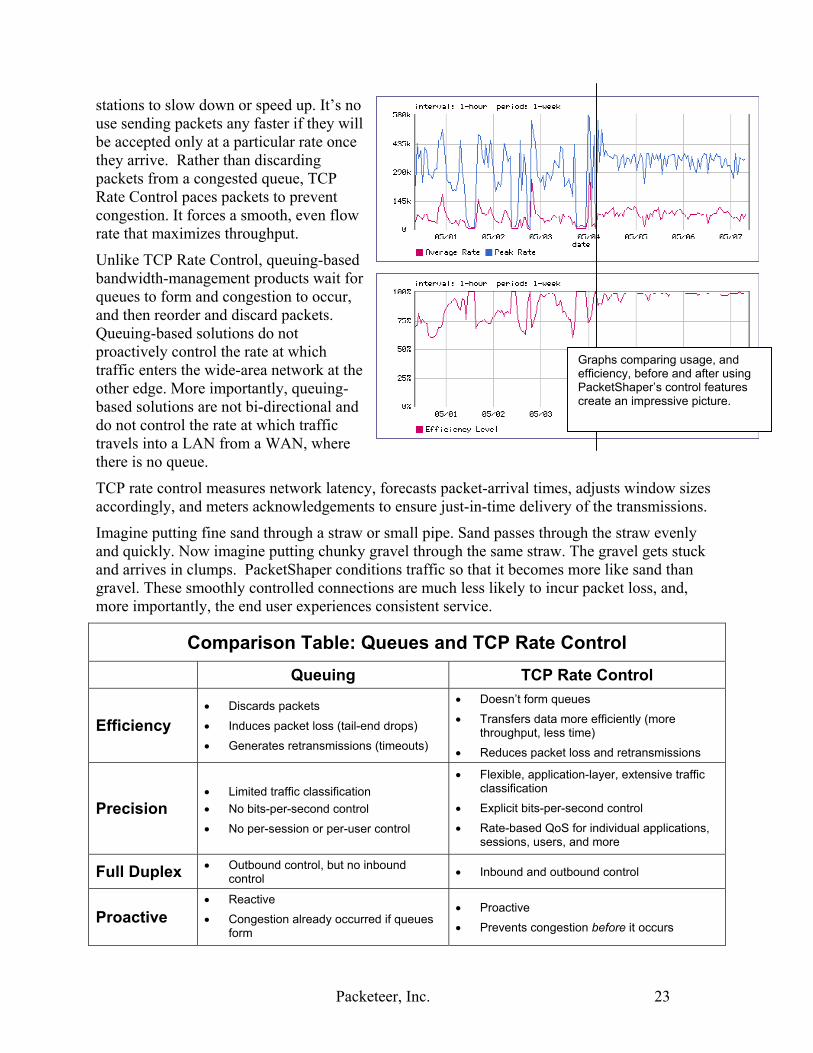
stations to slow down or speed up. It’s no use sending packets any faster if they will be accepted only at a particular rate once they arrive. Rather than discarding packets from a congested queue, TCP Rate Control paces packets to prevent congestion. It forces a smooth, even flow rate that maximizes throughput.
Unlike TCP Rate Control, queuing-based bandwidth-management products wait for queues to form and congestion to occur, and then reorder and discard packets. Queuing-based solutions do not proactively control the rate at which traffic enters the wide-area network at the other edge. More importantly, queuing-based solutions are not bi-directional and do not control the rate at which traffic travels into a LAN from a WAN, where there is no queue.
Graphs comparing usage, and efficiency, before and after using PacketShaper’s control features create an impressive picture.
TCP rate control measures network latency, forecasts packet-arrival times, adjusts window sizes accordingly, and meters acknowledgements to ensure just-in-time delivery of the transmissions.
Imagine putting fine sand through a straw or small pipe. Sand passes through the straw evenly and quickly. Now imagine putting chunky gravel through the same straw. The gravel gets stuck and arrives in clumps. PacketShaper conditions traffic so that it becomes more like sand than gravel. These smoothly controlled connections are much less likely to incur packet loss, and, more importantly, the end user experiences consistent service.
Comparison Table: Queues and TCP Rate Control Queuing TCP Rate Control
Efficiency • Discards packets • Induces packet loss (tail-end drops) • Generates retransmissions (timeouts)
• Doesn’t form queues • Transfers data more efficiently (more
throughput, less time) • Reduces packet loss and retransmissions
Precision • Limited traffic classification • No bits-per-second control • No per-session or per-user control
• Flexible, application-layer, extensive traffic classification
• Explicit bits-per-second control • Rate-based QoS for individual applications,
sessions, users, and more
Full Duplex • Outbound control, but no inbound control • Inbound and outbound control
Proactive • Reactive • Congestion already occurred if queues
form
• Proactive • Prevents congestion before it occurs
Packeteer, Inc. 23
Universal Translator Packet marking is a growing trend to ensure speedy treatment across the WAN and across heterogeneous network devices. First, CoS/ToS (class and type of service bits) were incorporated into IP. Then, Diffserv became the newer marking protocol for uniform quality of service, essentially the same as ToS bits, just more of them. And more recently, MPLS has emerged as the newest standard, integrating the ability to specify a network path with class of service for consistent QoS.
PacketShaper can classify, mark, and remark traffic based on IP COS/TOS bits, Diffserv settings, and MPLS labels, allowing traffic types to have uniform end-to-end treatment by multi-vendor devices in heterogeneous WANs. In attending to marking and remarking, PacketShaper acts as a type of universal translator, detecting intentions in one protocol and perpetuating those intentions with a different protocol as it forwards the packets.
For example, in an organization that has an MPLS core network but non-MPLS LANs, PacketShaper can assign an MPLS label to an outbound business-critical application that ensures a speedy path through the MPLS core. PacketShaper adds its layer-7 application awareness to MPLS capabilities and eases bandwidth bottlenecks, adding significant performance gains to those possible with MPLS alone.
Detecting and Avoiding Attacks Although PacketShaper is not a firewall, it can help detect and avoid DoS (denial of service) nightmares. DoS attacks against popular websites have raised consciousness about vulnerability.
These insidious attacks employ a variety of mechanisms to wreak havoc. For example, flood-type attacks initiate a large number of illegitimate connections that consume bandwidth and overwhelm receiving hosts.
PacketShaper employs a variety of methods to deal with the attacks. It can limit the number of connections from or to any host. Or limit the amount of ICMP traffic (a frequent attack vehicle that normally contributes just a small percentage of traffic). Or limit the number of flows in one application or traffic class. Or detect and block CodeRed, Nimda, and similar worms. Or block traffic that’s only pretending to come from a trusted source.
Some ideas for extra protection against DoS involvement include: • Limit the rate of new flows to or from a unique host. • Place a limit on the number of concurrent flows for a traffic class. • Limit ICMP to a maximum of 5 percent of the link size.
• Block traffic carrying the telltale signs of current worms.
Step Four: Generating Reports PacketShaper’s comprehensive reports, graphs, and tables provide clear insight into historical performance, load, and efficiency. Measuring historical data and formatting results into reports is usually associated with confirming a configuration change,
Packeteer, Inc. 24
justifying a purchase, evaluating service-level compliance, or searching for historical trends.
Examples of questions that can be answered by generating the appropriate report include: • Is my JD Edwards partition size overly
generous or not generous enough? • What percentage of my link was wasted
on retransmissions? • Is my SAP response time within its two-
second goal? • Were there sufficient dynamic partitions
for all interested users?
• What caused slow response yesterday — a slow network or a sluggish server?
• Even if I optimize my WAN link with an effective bandwidth-management strategy, when will I have to upgrade capacity?
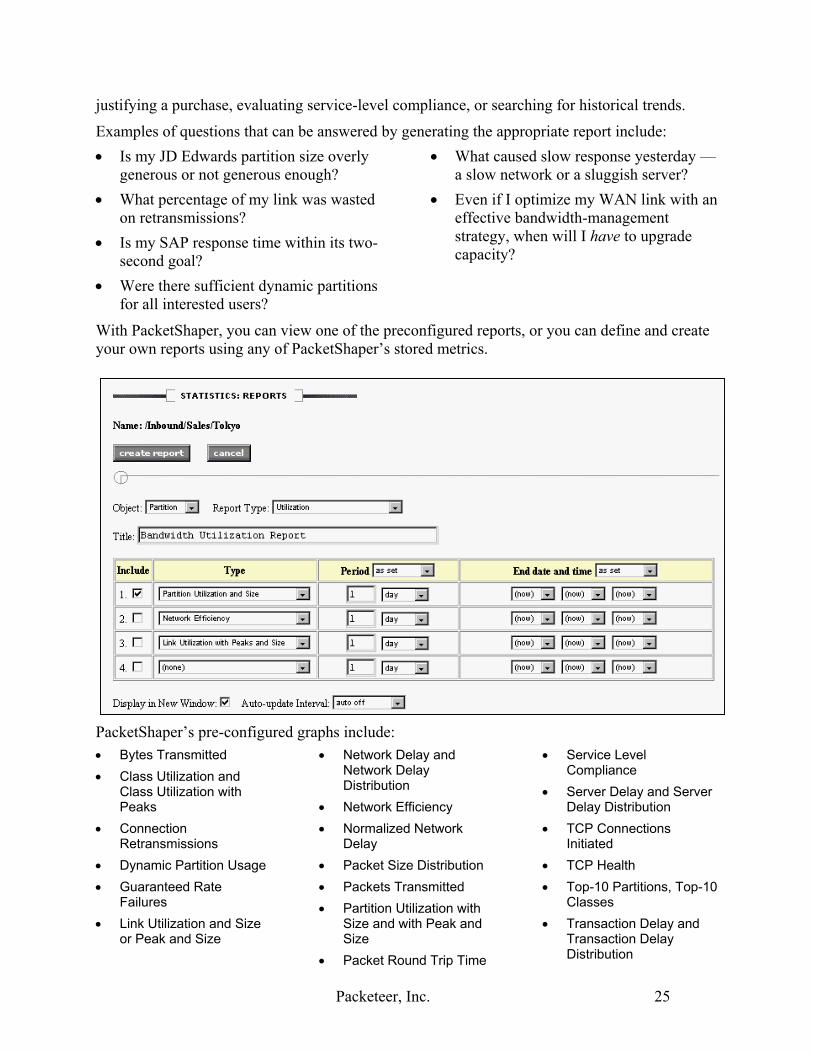
With PacketShaper, you can view one of the preconfigured reports, or you can define and create your own reports using any of PacketShaper’s stored metrics.
PacketShaper’s pre-configured graphs include: • Bytes Transmitted • Class Utilization and
Class Utilization with Peaks
• Connection Retransmissions
• Dynamic Partition Usage • Guaranteed Rate
Failures • Link Utilization and Size
or Peak and Size
• Network Delay and Network Delay Distribution
• Network Efficiency • Normalized Network
Delay • Packet Size Distribution • Packets Transmitted • Partition Utilization with
Size and with Peak and Size
• Packet Round Trip Time
• Service Level Compliance
• Server Delay and Server Delay Distribution
• TCP Connections Initiated
• TCP Health • Top-10 Partitions, Top-10
Classes • Transaction Delay and
Transaction Delay Distribution
Packeteer, Inc. 25

These two pie charts demonstrate a before-and-after PacketShaper story. Before policies and partitions, bandwidth went to the most demanding applications. After, bandwidth allocation is aligned with company goals.
Following a Typical Investigation Suppose you’re a network administrator in a large, worldwide corporation. You have Intranet servers in several different locations. You’ve defined a traffic class called OurSites to monitor Intranet traffic. OurSites’ definition includes all HTTP traffic to any Intranet server. As you’re perusing the Response Time Summary page, you notice that OurSites’ summary says only 60 percent of its transactions have acceptable performance. Users are noticing it too; a few phone calls have started. What’s next?
1. You view OurSites’ response-time page and notice that the percentage of acceptable transactions has declined to 50.
2. Examining the time-series graph of delay times, you notice that although the server delay has increased only a small amount, the network delay took a sudden and dramatic increase yesterday.
This tells you that although the servers might be a small bit overloaded, the network path to the servers is experiencing more major problems.
3. The Service Level Compliance graph, showing a time series of performance acceptability, confirms that performance crossed the line to unacceptable starting yesterday.
4. Next, you look at the Worst Clients list. Nothing stands out to you. If all the worst clients were, for example, on the first floor of the headquarters building, that could have helped narrow your search. But no such luck.
5. The Worst Servers list shows something interesting. One Intranet server shows only 17 percent good transactions. The others show percentages in the high 80s or better. The problem is becoming clear. The network path leading to one Intranet server has a problem.
6. You get another viewpoint on the servers by displaying the TCP Health graph on OurSites. TCP Health compares the number of TCP connections that were started, aborted, refused by the server, and not serviced by the server. It shows a high number of connections were started with an unusually high rate of aborted connections. The numbers of connections that were refused or ignored are fairly low. The statistics make sense with rest of your investigations. Users are attempting to access the Intranet (number of connections), but getting frustrated by slow response and clicking the Stop button on their browsers (high rate of aborted connections). But once the servers get the requests, they’re serviced.
7. You consult usage statistics in PacketShaper’s Monitor Traffic page. FTP shows an increase. FTP’s Top Talkers list shows a very active FTP server. Switching to a graph of FTP’s usage, you see that FTP has been bursting to 80 percent of the link the past two days. It seems that a particularly large and popular file was posted two days ago. The affected Intranet and FTP servers are located together and share a link.
8. You solve the problem by creating a PacketShaper rate policy that allows FTP traffic to burst only if there are no other consumers. Otherwise, it’s contained to a slower usage rate. Then you create a rate policy for OurSites that safeguards its performance.
9. OurSites’ performance returns to normal. Users are happy. You take a well-earned break.
Deployment — When and Where PacketShaper adds value in almost any network with the possible exception of an isolated LAN with more than ample bandwidth and no WAN connection. The next two sections give you an idea of the situations when and locations where PacketShaper is most appropriate.
Most Appropriate Situations The environments where PacketShapers have been especially valuable include: • Networks that support expensive, business-critical applications (SAP installations, for
example) together with bursty, less urgent traffic such as web surfing. • IP networks that carry critical legacy applications with TN3270 or TN5250 protocols or with
web-enabled host access.
Packeteer, Inc. 27
• Thin-client environments where small interactive packets are very delay sensitive but get overrun by large, bandwidth-hungry applications.
• Businesses or organizations that provide streaming audio or video (VoIP or distance-learning applications, for example).
• Environments where building facilities (HVAC, for example) share the network with other applications.
• Branch offices that must go to or through a main site via a corporate WAN for applications or the Internet.
• Environments using messaging and collaboration applications (Microsoft Exchange or Lotus Notes, for example) where a performance balance is needed between messaging and other critical applications.
• Organizations whose networks support recreational use in addition to officially sanctioned applications.
Choosing a Deployment Strategy With PacketShaper, you can choose a deployment strategy that suits you. You choose combinations of PacketShaper locations and features that offer the benefits you need. Then you can add units over time, or not, as you wish.
Feature Sets PacketShaper features are packaged in two ways: • Monitor-only PacketShaper: provides
features to explore application and network behavior, including all features covered in Step One: Classifying Network Traffic, Step Two: Analyzing Traffic, and Step Four: Generating Reports.
• Full-featured PacketShaper: provides features to explore and control application and network behavior, including all features covered in this paper.
Locations The most common topological locations for PacketShaper are: • Main site’s WAN link: connects main
site to branches across a private corporate WAN
• Main site’s Internet link: connects a main site to branches across VPN and/or is simply a link to the web
• Branch site WAN/Internet link: connects a branch to elsewhere
Packeteer, Inc. 28
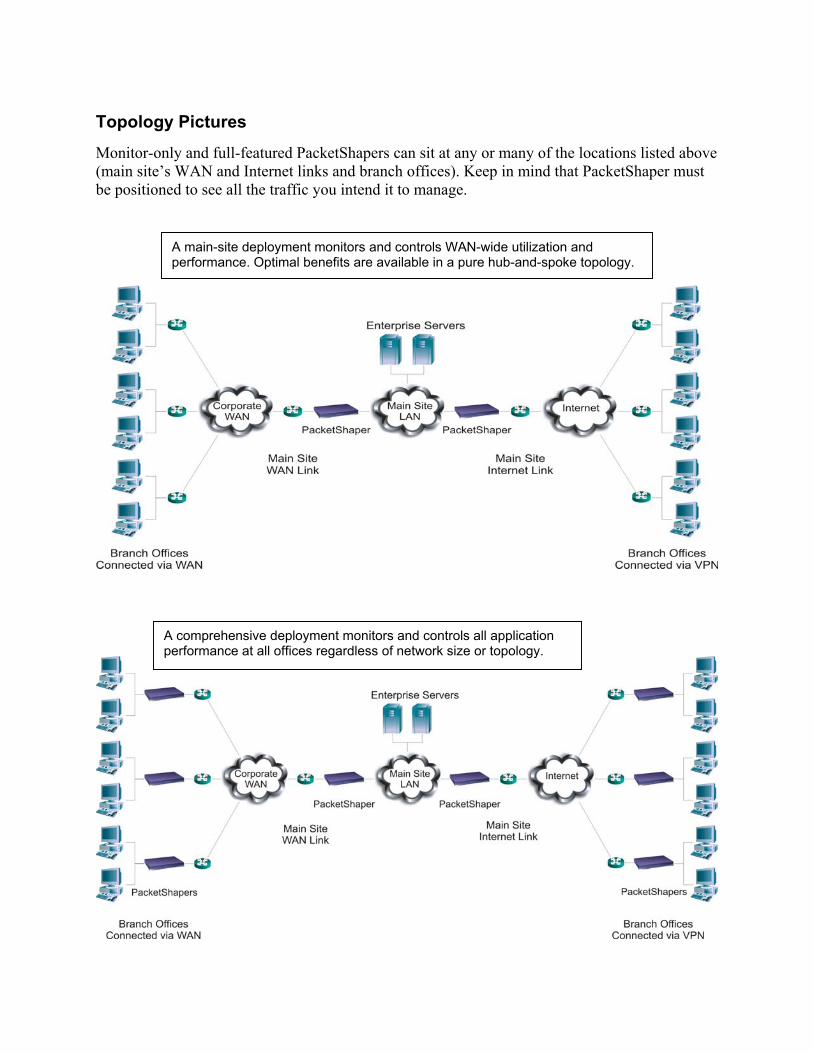
Topology Pictures Monitor-only and full-featured PacketShapers can sit at any or many of the locations listed above (main site’s WAN and Internet links and branch offices). Keep in mind that PacketShaper must be positioned to see all the traffic you intend it to manage.
A main-site deployment monitors and controls WAN-wide utilization and performance. Optimal benefits are available in a pure hub-and-spoke topology.
A comprehensive deployment monitors and controls all application performance at all offices regardless of network size or topology.
Story of a Deployment Progression Suppose an organization has 20 branch offices connected with a hub-and-spoke topology to a main site over a private WAN. Employees throughout the company use client-server applications with servers at the main site’s datacenter. In addition, the branch offices access the web through the main site’s Internet link. This organization, which we’ll call Corp, chooses a phased PacketShaper deployment approach. Corp:
1. Deploys a monitor-only PacketShaper at the main site’s WAN link. Corp finds answers to questions such as: What applications travel the WAN? Which branches use most of the WAN? Does each branch use similar applications? What are average response times for a specific application at the various branches?
2. Notes sluggish response times and inappropriate amounts of bandwidth going to non-urgent applications. Upgrades PacketShaper from monitor-only to full control. Corp is able to protect Telnet, Citrix-based applications, Oracle, and Intranet traffic; pace FTP, email, and general web traffic; contain music downloads and other recreational traffic. Performance improves.
3. Deploys smaller capacity, monitor-only PacketShapers at two branches that continue to have performance problems. Corp discovers that these two branches send only a small portion of their traffic through the main site. Most traffic goes elsewhere, so the central PacketShaper can’t see and manage that portion of traffic.
4. Upgrades the two branches’ monitoring-only PacketShapers to full control. Application performance at the two branches recovers.
Questions to Ponder Answering these questions can help you determine your deployment strategy. More information on choosing the right PacketShaper topology and model is available in other sources on Packeteer’s web site. • Am I interested only in identifying my applications and analyzing their behavior? (Consider
monitor-only Packetshaper) • Do I want to be able to fix many of the performance problems that PacketShaper identifies?
(Consider full-featured PacketShaper or a combination of some of each) • Does a main site host an Intranet and/or organization-wide applications? (Consider a main-
site deployment) • Do my branch offices send traffic to destinations without going through the main site?
(Consider a branch deployment)
For More Information If you’d like more information about PacketShaper or to order PacketShaper, consult Packeteer’s web site or call (408) 873-4400 or (800) 697-2253.
Packeteer, Inc. 30