fracture toughness of the tensile and compressive fibre ... · fracture toughness of the tensile...
TRANSCRIPT

Fracture toughness of the tensile and
compressive fibre failure modes in laminated
composites
S T Pinho a, P Robinson a, L Iannucci a
aDepartment of Aeronautics, South Kensington Campus, Imperial College London,
SW7 2AZ, London, U.K.
Abstract
The fracture toughnesses associated with fibre tensile failure and compressive fi-
bre kinking in a T300/913 carbon-epoxy laminated composite are measured using
compact tension and ‘compact compression’ tests respectively. The specimen strain
fields were monitored using a digital speckle photogrammetry system during the
tests. The damage present in the specimens after the tests was investigated using
C-scan and optical and scanning electron microscopy. The initiation and propaga-
tion values of the tensile fibre failure critical energy release rate were determined
as 91.6 kJ/m2 and 133 kJ/m2 respectively. For fibre compressive kinking, an ini-
tiation value of 79.9 kJ/m2 was obtained, but no meaningful propagation values
could be determined. In both cases, the test results showed low scatter.
Key words: B Fracture toughness, Fibre failure
Email addresses: [email protected] (S T Pinho),
[email protected] (P Robinson), [email protected] (L
Preprint submitted to Elsevier Science 15 December 2005

1 Introduction
Fibre breaking can take place during longitudinal tension or compression and,
for carbon/epoxy systems, the energy consumed by these failure processes is
much larger than for failures involving any matrix or matrix-fibre bond failure.
In compression, fibre breaking usually occurs as a result of the kinking process.
Experimental determination of the fracture toughness associated with both
these fibre failure modes (tensile failure and compressive kinking) is important
for material characterization and for numerical modelling. Currently, there are
no standards to determine these properties.
Leach and Moore [1] used three-point bend specimens with a (0)40 layup to
measure the fracture toughness of the tensile fibre failure mode of a car-
bon/ PEEK composite, and reported a mode I critical energy release rate of
26 kJ/m2. The technique used to introduce a pre-crack in the specimen was
not discussed by the authors. Jose et al. [2] used Compact Tension (CT) speci-
mens (see Fig. 1(a)) made of M55J/ M18 carbon/epoxy with layup (0, 90)15, to
determine the fracture toughness associated with tensile failure of the (0, 90)15
laminate. They created the pre-crack in two steps: a notch was cut with a disc
cutter and a razor blade was then used to give a sharp starter, but the authors
did not specify whether the blade was tapped or used in a sawing motion. The
mode I critical energy release rate reported by Jose et al. for the laminate is
15.94 kJ/m2. This value corresponds to the mode I critical energy release rate
for fibre fracture in the 0 ◦ layers combined with matrix crack propagation in
the 90 ◦ layers. Assuming that those energies are additive (which is to say, ne-
glecting the interactions between the different layers that are failing in different
Iannucci).
2

failure modes), and that the matrix tensile toughness is similar in magnitude
to the (interlaminar) mode I critical energy release rate (≈ 0.2 kJ/m2), the
critical energy release rate for the fibre tensile failure mode of M55J/ M18
carbon/epoxy is about 31.7 kJ/m2.
Soutis et al. [3,4] carried out a kink-band propagation test using a centre-
notched compression specimen. Different lengths for the notch were used but
similar values of fracture toughness were observed, which was interpreted as
supporting the concept of compressive fracture toughness. For a T800/924C
laminate with (0, 902, 0)3S layup, the critical energy release rate for the lami-
nate was reported [5] as 38.8 kJ/m2. Proceeding as before, the value measured
corresponds to the mode I critical energy release rate for kink-band propaga-
tion in the 0 ◦ layers, plus the critical energy release rate for matrix cracking
in the 90 ◦ layers. Assuming that those energies are additive, and making the
simplification that the matrix failure in the 90 ◦ layers can be represented by
a single mode II matrix crack (with critical energy release rate ≈ 1 kJ/m2),
the critical energy release rate for kink-band formation and for T800/924C is
derived from Soutis et al. [5] as about 76 kJ/m2.
Ratcliffe et al. [6] and Jackson and Ratcliffe [7] described the use of Compact
Compression (CC) specimens (CC specimens are similar to CT specimens,
but used in compression) to measure the compressive toughness of sandwich
panels with unidirectional carbon-epoxy facings and honeycomb nomex core.
The kink-band length was measured using Shadow Moire Interferometry. The
critical energy release rate for kinking, derived from the tests using the area
method, was reported as 36.1 kJ/m2 [6].
In the work presented in this paper, CT and CC tests were performed with
3

Table 1
Mechanical properties of T300/913 unidirectional laminae.
Modulus ( GPa) Major Poisson’s ratio
Longitudinal Transverse Shear
131.7 8.8 4.6 0.32
the aim of determining (i) the fracture toughness associated with tensile fibre
failure and (ii) the fracture toughness associated with kink-band failure for a
carbon-epoxy system.
2 Material system used
Carbon epoxy T300/913 unidirectional prepreg was used for the tests. The ma-
terial properties needed for the data reduction were obtained using standard
tests and are presented in Table 1 in the principal material axes.
3 Test method and data reduction
The geometry of the compact specimens used for the tension and compression
toughness tests are shown in Fig. 1(a) and (b) respectively. The notch of the
CC specimen, Fig. 1(b), has been widened at the left edge to avoid contact
of the notch faces during compression. (Jackson and Ratcliffe [7] found that
the stress intensity factor is not affected significantly by the morphology of
the opening.) The layup used is (90, 0)8S with the 0 ◦-direction the direction
parallel to the loading, as shown in Fig. 1.
4

������������ ��� �������������������������������������� �
�� = 26
� = 51
14
28 60
φ8
� = 4
�� = 20
� = 51
14
28 60
φ8
� = 4
0º
≈4
≈20 ≈10
≈4 0º
≈10
����
����
Fig. 1. Test specimen nominal dimensions (in mm ) for the (a) tensile and (b)
compression fibre-breaking fracture toughness tests
The data reduction for CT or CC specimens made of an orthotropic material
requires particular attention. Other researchers have used the stress intensity
factor approach [2,8,9], often citing the ASTM standard E399 [10] for the
determination of the fracture toughness in metals using CT tests [2,8].
According to ASTM standard E399 [10], valid for an isotropic material, the
critical stress intensity factor for a fracture load P , is given by
KIc =P
h√
wf (a/w) (1)
with
f (a/w) =2 + a/w
(1− a/w)1.5 [0.886 + 4.64 (a/w)−
−13.32 (a/w)2 + 14.72 (a/w)3 − 5.6 (a/w)4]
(2)
where h is the thickness of the specimen, w is the dimension from the load
line to the right hand edge of the specimen, as indicated in Fig. 1 and a is
the crack length, whose initial value ao is also indicated in Fig. 1. The critical
5

energy release rate of the laminate can be calculated from KIc as [11]
GIc|lam =K2
Ic√2ExEy
√√√√√
Ex
Ey
+Ex
2Gxy
− νxy (3)
where Ex, Ey, Gxy and νxy are the Young’s moduli in the x and y directions (see
Fig. 1), the shear modulus and the Poisson’s ratio of the laminate, respectively
(note that these properties are obtained from the laminae values given in Table
1 using lamination theory).
Jose et al. [2] carried out Finite Element (FE) analyses of laminate CT spec-
imens, and compared the stress intensity factor obtained from Eq. 1 with the
one obtained from FE. They concluded that the difference was small even
though, when expressed in terms of energy release rate, the difference ranged
from 16% to 27%, depending on the layup. The difference was attributed to
the FE analysis being linear, but Eq. 1 also assumes linear elasticity and so
the difference is more likely to be due to the isotropy assumption in Eq. 1.
Given the difference observed by Jose et al., an FE analysis was carried in
Abaqus [12] to obtain a more accurate equation for the energy release rate.
As a first step, three different models of half a CT/CC specimen were created
(taking advantage of the symmetry), with different levels of mesh refinement.
The three meshes have uniform square 8-noded elements (S8R5), with side
l = 1 mm for the coarse (C) mesh, l = 0.5 mm for the intermediate (I)
mesh and l = 0.2 mm for the refined (R) mesh. Mesh C is presented in Fig.
2, where it can be noted that the shape of the notch is not modelled; as
mentioned before, earlier work by Jackson and Ratcliffe [7] showed that the
stress intensity factor is not significantly affected by the morphology of the
opening. The material properties were obtained from Table 1 using lamination
theory for a (90, 0)8S layup. All the models were assigned a unit thickness
6
(1 mm ), and were subjected to a unit load (1 N ). For a crack length a =
26 mm , each model was run to obtain the J-integral around the crack tip.
Taking the J-integral for mesh R as a reference, the J-integral for mesh I
differs in 0.014% and for mesh C in 0.026%. The application of the one-step
Virtual Crack Closure Technique (VCCT) for mesh R matches the J-integral
for the same mesh within less than 0.004%. Therefore, all three meshes (C,
I and R) provide an accurate value of the energy release rate. The difference
between the energy release rate obtained by the use of FE (J-integral, mesh R)
and by the use of Eqs. 1 and 3 is 11.02%. This non-trivial difference indicates
that the KIc formula of Eq. 1 which is used for isotropic materials is not always
accurate for orthotropic composites.
Several models with mesh I and different values of initial crack length were
run. The normalized energy release rate f (a), obtained from the J-integral
(J), and defined as
f (a) = J ·(
1 mm
1 N
)2
(4)
is presented in Table 2. The function f (a) can be approximated by the poly-
nomial
f (a) = c3a3 + c2a
2 + c1a + c0 (5)
where the coefficients ci are presented in Table 3 for a number of different
crack length ranges together with the associated interpolation error. Finally,
the critical energy release rate for each test can be obtained as
GIc|lam =(
P
h
)2
f (a) . (6)
For the CT tests, Eq. 6 can be used to obtain GIc as a function of crack
length during propagation, provided that completely unstable propagation
does not occur immediately after initiation of crack growth. For fibre kinking
7

a
Fig. 2. Coarse FE mesh of half a CT specimen
Table 2
Normalised energy release rate f (a) ( m2/kJ ) for different values of crack length a
( mm), obtained from FE
a 19 20 21 22 23 24
f (a) 3.4003E-5 3.6753E-5 3.9839E-5 4.3320E-5 4.7272E-5 5.1788E-5
a 25 26 27 28 29 30
f (a) 5.6984E-5 6.3007E-5 7.0043E-5 7.8332E-5 8.8187E-5 1.0001E-4
a 31 32 33 34 35 36
f (a) 1.1436E-4 1.3196E-4 1.5381E-4 1.8132E-4 2.1646E-4 2.6207E-4
a 37 38 39 40 41 42
f (a) 3.2238E-4 4.0374E-4 5.1609E-4 6.7539E-4 9.0839E-4 1.2619E-3
a 43 44
f (a) 1.8229E-3 2.7642E-3
8

Table 3
Coefficients for the interpolation of f (a) ( m2/kJ ) for different ranges of crack
length a ( mm ), and associated maximum error
c3 c2 c1 c0 error
19 ≤ a < 24 1.1250E-8 -5.088214E-7 9.7590E-6 -4.4897E-5 < 0.01%
24 ≤ a < 29 4.0880E-8 -2.6721E-6 6.2522E-5 -4.7474E-4 < 0.01%
29 ≤ a < 34 1.7282E-7 -1.4396E-5 4.1001E-4 -3.9105E-3 < 0.08%
34 ≤ a < 39 1.1264E-6 –1.1389E-4 3.8722E-3 -4.4084E-2 < 0.14%
39 ≤ a < 44 1.6611E-5 -1.9748E-3 7.8429E-2 -1.0399E0 < 0.80%
however, Eq. 6 has limited meaning during propagation, because the contact
stresses between the ‘faces’ of the kink band are not accounted for in the FE
analysis, and neither is the damage that might propagate from the kink band.
An alternative method for data reduction during propagation consists of the
use of the area method in which the energy consumed during crack growth
(determined from the area under the load vs. displacement curve) is divided
by the area swept out by the crack front. However, the application of this
method requires stable crack growth, and, in the case of the CC specimens,
the calculated energy release rate will still include energy consumed by other
damage modes which are also developing as the kink band advances. This
results in an artificial positive trend on the R-curves as verified by Jackson
and Ratcliffe [7].
Once the critical energy release rate for the laminate is obtained, the critical
energy release rate corresponding to fibre tensile failure or fibre kinking is
obtained by subtracting the term corresponding to matrix cracking in the 90 ◦
9

layers. This procedure neglects the other damage modes such as delamination,
as well as any interaction between matrix cracking and the fibre-dominated
failure modes, and assumes that a single matrix crack parallel to the pre-
crack occurs in the 90 ◦ layers. As before, matrix cracking in the 90 ◦ layers is
assumed to occur as a single crack in mode I for the CT tests, and in mode
II for the CC tests. These approximations seem reasonable, since the critical
energy release rate of the fibre-dominated failure modes is much higher than
that of the matrix-dominated ones. For the laminate layup used for these tests,
the critical energy release rate for the fibre-dominated failure modes is thus
expressed as
GIc|fibre tensile = 2 GIc|lam tensile − GIc|matrix intra (7)
GIc|fibre kinking = 2 GIc|lam compr − GIIc|matrix intra (8)
where GIc|lam tensile and GIc|lam compr are the critical energy release rate for
the laminate, as obtained from the tensile and compressive tests respectively,
GIc|matrix intra and GIIc|matrix intra are the mode I and mode II matrix-cracking
intralaminar fracture toughnesses, and GIc|fibre tensile and GIc|fibre kinking are
the fracture toughnesses for the fibre tensile and fibre-kinking failure modes.
The mode I intralaminar critical energy release rate for through-the-thickness
crack growth was found to be very similar to the interlaminar toughness be-
tween 0 ◦ plies [13], so that, for materials where the matrix-cracking intralam-
inar critical energy release rate is unknown, the interlaminar critical energy
release rate is expected to be a good approximation of the intralaminar criti-
cal energy release rate. As noted above, in carbon/epoxy systems, the matrix
failure mode toughnesses are much lower than the fibre failure toughnesses
and so the last term in Eqs. 7 and 8 could be omitted without a significant
loss in accuracy.
10

(a) (b)
Scale for moni-toring crack growth
Notch cut with disk saw
Notch cut with razor saw
Fig. 3. Photograph of the specimens obtained for the (a) tensile and (b) compression
fibre fracture toughness tests
4 Manufacture
4.1 Manufacture of the test specimens
Panels with dimensions 300 × 150 mm2 were manufactured by laying up 32
layers of prepreg (each of 0.125 mm nominal thickness), with a layup (90, 0)8S
and cured according to the prepreg manufacturer’s instructions. A wet saw was
used to cut the rectangular plates to form the specimens shown in Fig. 3. The
8 mm diameter holes were produced by drilling the specimen, with it held in
between two sacrificial pieces of similar composite.
For the tensile specimens, a 3-step procedure was followed to obtain the re-
quired sharp crack tip. First, a 4 mm wide notch was cut with a diamond-
coated disk saw, to a total approximate length of 30 mm . Then, a 0.2 mm
thick razor saw was used to obtain a thin and relatively sharp extension of
the pre-crack, with a length of approximately 10 mm . Finally, a 0.1 mm thick
razor blade was used to sharpen the crack tip further using a sawing action.
11

(a) (b )
(c ) (d )
0.5mm
62.5µµµµm
0.125mm
25µµµµm
1
2
1
3
2
3
1 Tw o d i f f e r e n t p l i e s e x p o s e d d u e t o p o l i s h i n g R az o r s aw c u t Ti p s h ar p e n e d b y r az o r b l ad e
Fig. 4. Different magnifications of the pre-crack tip for the CT specimens
Micrographs of the crack tip are presented in Fig. 4. For the compression
specimens, a notch as shown in Fig. 3(b) was obtained with the disk saw.
A speckle pattern was created on one face of each specimen using white and
black ink sprays. Two different types of pattern were tried: black spots on a
white background and white spots on a black background. The former was
obtained by painting one side of the specimen in white and then using the
black-ink spray to obtain the speckle pattern. This process led to a maximum
contrast which is beneficial for the photogrammetry system software moni-
toring each point of the specimen. However, in the tensile tests, the white
ink tended to peel at the crack tip during crack propagation. For these cases,
the reverse pattern was used (white spots on a black background), by simply
using the white spray to create the white spots on the black surface of the
composite. The contrast is in this case not as good as the previous one, but
12

no peeling occurs at the crack tip during propagation.
Finally, a 1 mm increment scale was drawn onto each specimen to monitor
the crack length during the test, and the actual dimensions of each specimen
were measured individually.
5 Experimental setup
Six CT and six CC tests were carried out in an Instron machine, with a 10 kN
load cell. Two strong light sources were used to illuminate the surface of the
specimen.
A CCD camera was used to view a magnified image of the area of the specimen
containing the crack-growth scale on a TV. This magnified image was used
together with an event-marker connected to the data logger, to monitor the
crack growth.
The photogrammetry system (Aramis) was positioned to examine the surface
of the specimen. This system allowed the strain field in the specimens to be
recorded during the tests and was used to check for damage not readily visible
in the specimens, and to help locate the tip of the crack/kink-band. The CT
and CC specimens were loaded at a displacement-rate of 0.5 mm/min .
13

�����
� � � � ���� � � �� � ��� ����� �����
����� ��� �� !� "$# � �� � ��� � %�&�' (�) *�+!,
-./012
- . / 03!4 5 6�7 '�8 9 :�9 ;�<�) :�:�,
=>= 5 6 9 8 4 :�9 ;
( a ) ( b )
Fig. 5. Typical load vs. displacement curves for a (a) CT and (b) CC specimens
6 Results
6.1 Tensile tests
For the CT specimens tested, crack growth was not smooth nor continuous:
instead, several crack jumps of a few millimeters each time were observed,
Fig. 5(a). The TV monitor and event marker permitted the recording of the
propagation load for each value of crack length where the crack had stopped.
The first specimen tested had a black speckle pattern on a white background.
As the crack proceeded, the white ink peeled from the specimen on the vicinity
of the crack, and the photogrammetry system thus failed to map the strains
on the area of most interest, Fig. 6(a) and (b). For all other tensile specimens,
a white speckle on the natural black surface of the composite was used. This
speckle had a lower contrast, but still allowed the identification of the crack
tip as no peeling occurred, Fig. 6(c) and (d).
The R-curves obtained from the tensile tests are shown in Fig. 7. The average
14

(a) (b )
No data from Photogrammetry system in this area
White paint has peeled off the specimen in this area
Pre-crack tip
Crack tip
(c ) (d )
Crack tip
Pre-crack tip
Crack tip
Pre-crack tip
Fig. 6. (a) CT specimen painted white with black speckle pattern; the paint peels off
at the crack tip; (b) strain map corresponding to (a) fails to give information close
to the crack tip, due to peeling of the paint; (c) CT specimen with white speckle
pattern; no peeling is observed at the crack tip; (d) strain map corresponding to
(c) allows the identification of the crack tip and does not reveal any other form of
damage in the specimen
critical energy release rate obtained for initiation is 91.6 kJ/m2 with a stan-
dard deviation of 6.7%. Since the R-curves seem to converge after a ≈ 34 mm ,
a propagation value for the critical energy release rate can be defined. The av-
erage propagation critical energy release rate is 133 kJ/m2 with a standard
deviation of 15.7%.
15

05 0
1 001 5 02 002 5 0
2 4 2 9 3 4 3 9a ( m m )
GIc ( k J / m 2)
Fig. 7. R-curve for the tensile fracture toughness tests; each symbol-type corresponds
to a different specimen
6.2 Compressive tests
For all but one of the CC specimens tested, the kink band grew smoothly
during the whole test (approximately 20 mm of kink-band growth). In order to
use the area method to determine the critical energy release rate, the unloading
curve was recorded after kink-band growth. Since no peeling of the white ink
occurred in compression, a black speckle on white background was used for
all tests.
The TV monitor, providing a magnified view of the region where the kink
band was growing, proved to be ineffective in locating the tip of the damaged
area. In fact, the tip of the kink band was barely recognizable on a still image,
as shown in Figs. 8(a)-(c) of successive pictures taken by the photogrammetric
system. Using the photogrammetric system, the strain gradient proved useful
to identify the existence of the kink band, but the identification of the kink-
band tip was not trivial, as shown in Fig. 8(d). However, the identification of
16

the tip of the damaged area was possible using the photogrammetric system
in a different way. A picture was taken automatically by the system every
5 s and the event marker was used to identify the load corresponding to that
picture. The tip of the damaged area could then be identified by switching
repeatedly between two successive images taken by the system. This dynamic
viewing process showed the tip of the damaged area very clearly, since the
human eye has evolved to easily identify movement and thus the difference
between two pictures. As shown in Figs. 8(e) and (f), this difference can also
be obtained digitally, by subtracting two consecutive pictures taken by the
photogrammetric system.
The R-curves obtained from the compressive tests are shown in Fig. 9. The
average critical energy release rate obtained for initiation is 79.9 kJ/m2 with
a standard deviation of 7.7%. Using the area method, the average propagation
critical energy release rate is 143 kJ/m2 with a standard deviation of 10.5%.
However, as detailed in the next section, this propagation value is not a reliable
measure of critical energy release rate for kink-band propagation.
7 Discussion
7.1 Data reduction
The difference in the critical energy release rate obtained using the data re-
duction from ASTM standard E399 [10] for metals (isotropic material) and
the FE approach is found to be significant (11.0% for the material, layup and
geometry considered here), even though Ex and Ey were equal for the laminate
layup used in these tests. Therefore, the use of this standard for orthotropic
17

( d ) ( e ) ( f )
t = t � t = t � + 5 s t = t � + 1 0 s
( a ) ( b ) ( c )
Kink-band length
( b ) -( a )
Kink-band length
( c ) -( b )
Notch tip
Fig. 8. (a) CC specimen during kink-band propagation at time t = to, (b) at time
t = to + 5 s , (c) at time t = to + 10 s ; (d) strain map corresponding to (b); (e)
difference between pictures (a) and (b); (f) difference between pictures (b) and (c)
composite materials is not recommended.
7.2 Tensile tests
The specimen R-curves shown in Fig. 7 present the same trend even though
the pre-crack lengths vary. The GIc initiation values show good agreement
and then the curves all exhibit a positive trend over the next 4 − 8 mm of
crack growth. Fig. 10(a) shows a Scanning Electron Microscope (SEM) image
of the typical fracture surface. It is not an entirely planar fracture surface,
18

0
1 00
2 00
300
4 00
5 00
1 8 2 3 2 8 33 38a ( m m )
GIc ( k J / m 2)
Values obtained by the ar ea m ethod f or 2 0 m m of k ink band g r ow th f r om initial c r ac k
Fig. 9. R-curve for the compressive fracture toughness tests; each symbol-type cor-
responds to a different specimen
as it exhibits a limited amount of fibre-pullout in the 0◦ plies. This pullout
process could have created a fibre-bridged zone in the wake of the advancing
crack tip and the growth and eventual stabilization of this bridged zone could
account for the trend observed in the R-curves.
The higher magnification image shown in Fig. 10(b) indicates that the 0◦ fibres
immediately adjacent to the 90◦ ply interface are fractured without pullout.
The 0◦ fibres further away from the 90◦ ply interface have undergone pullout
with the fibre fracture occurring at some distance from the fracture surface in
the 90◦ ply. The fracture features on the surface in the interface between the
90◦ and 0◦ plies shown in Fig. 10(b) indicate that the fracture occurred first
in the 90◦ ply and then propagated into the 0◦ ply.
Even though there is no visible damage away from the crack plane, as shown
by the C-scan in Fig. 11(a), the interaction of the 90◦ and 0◦ plies may signif-
icantly affect the fracture process during propagation and so the propagation
19
value of fracture toughness is likely to be layup dependent.
It may well be that the lower initiation value of GIc is associated with an
initial planar fracture from the pre-crack plane without any significant fibre
pullout—and if this is the case, then the initiation value would be layup in-
dependent. The mechanisms associated with the initiation and propagation
fracture processes need further investigation to fully establish their layup de-
pendence.
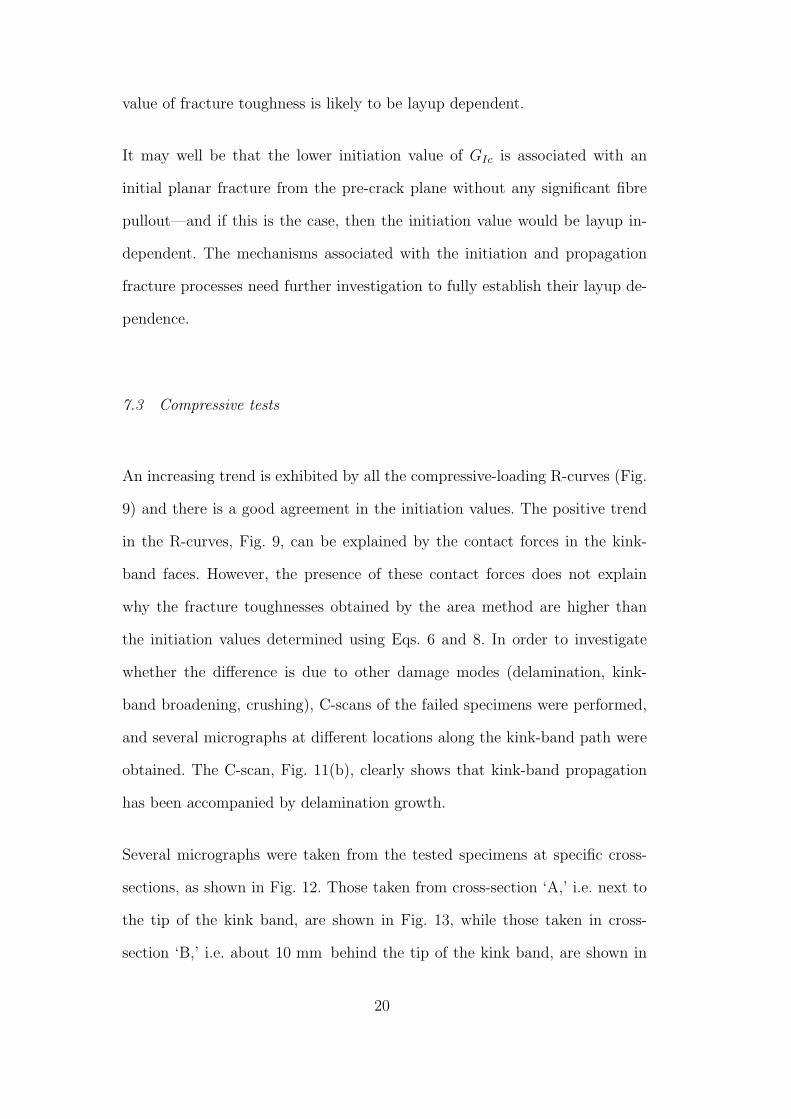
7.3 Compressive tests
An increasing trend is exhibited by all the compressive-loading R-curves (Fig.
9) and there is a good agreement in the initiation values. The positive trend
in the R-curves, Fig. 9, can be explained by the contact forces in the kink-
band faces. However, the presence of these contact forces does not explain
why the fracture toughnesses obtained by the area method are higher than
the initiation values determined using Eqs. 6 and 8. In order to investigate
whether the difference is due to other damage modes (delamination, kink-
band broadening, crushing), C-scans of the failed specimens were performed,
and several micrographs at different locations along the kink-band path were
obtained. The C-scan, Fig. 11(b), clearly shows that kink-band propagation
has been accompanied by delamination growth.
Several micrographs were taken from the tested specimens at specific cross-
sections, as shown in Fig. 12. Those taken from cross-section ‘A,’ i.e. next to
the tip of the kink band, are shown in Fig. 13, while those taken in cross-
section ‘B,’ i.e. about 10 mm behind the tip of the kink band, are shown in
20

(b)
Fibre pullout
Limited or no fibre pullout
Shear cusps
(a )
Limited amount of fibre pullout in the 0° plies
Fig. 10. (a) SEM micrograph of the CT specimen’s fracture surface; (b) the magni-
tude of fibre pull out depends on the distance to the 90◦ layers
21

(a) (b)
Fig. 11. C-scan of a (a) CT specimen and (b) CC specimen
0º
B A
Fig. 12. Cross-sections ‘A’ and ‘B’ for the micrographs shown in Figs. 13 (‘A’) and
14 (‘B’)
Fig. 14. Fig. 13(a) shows a 0◦ ply in which the kink band has not yet fully
developed. Matrix cracking in the adjacent 90◦ plies and fracture in some of
the 0◦ fibres can be seen and these will ultimately develop into an out-of-plane
kink band similar to those shown in Fig. 13(b) and in magnified detail in Fig.
13(c). Fig. 13(d) shows the matrix cracking and delamination which occurs in
the 90◦ plies between neighboring kink bands.
Turning to Fig. 14, it is clear that the scale of the fibre and matrix damage
is now more extensive than that close to the kink-band tip shown in Fig. 13.
In Fig. 14(a), the 0◦ plies clearly bent and in Fig. 14(b) the bending has
caused failure in the 0◦ fibres, i.e. the damage zone is broadening beyond
22

that associated with the initial kink-band formation. Figs. 14(c) and (d) show
delaminations which have been wedge opened by damaged material. These
delaminations grow significantly beyond the kink-band region, as detected by
the C-scan image shown in Fig. 11(b).
These findings, from analysis of the micrographs and C-scan images, imply
that the values of critical energy release rate obtained by the area method
do not describe accurately the energy absorbed in kink-band formation, since
other significant failure modes have taken place. The initiation values seem to
be the best measure of the critical energy release rate associated with kink-
band formation.
8 Conclusions
This paper has investigated an experimental procedure to obtain the fracture
toughness associated with the fibre-dominated failure modes, using CT and
CC tests. It has been shown that the data reduction process based on the
stress intensity factor for isotropic materials should not be used, and FE was
found to be a valid alternative. Initiation toughness values for both tensile
fibre failure and for kink-band formation were obtained. For the tensile mode,
propagation toughness values were also measured. For kink-band formation,
propagation values cannot be obtained directly from a stress intensity factor
approach because the contact stresses in the faces of the kink band cannot be
easily accounted for; the area method also failed to produce meaningful results
due to kink band broadening and delamination. The toughness measured for
both the tensile and compressive modes may well be layup dependent and
further investigation is required.
23

62.5µµµµm (a)
1
2
1
0.125mm(b )
3
3
1
25µµµµm (d ) 4
3
1
0.125mm(c )
2
2
3
F i b r e b r e ak i n g 2
D e l am i n at i o n 4
M at r i x c r ac k i n g 1
K i n k b an d 3
Fig. 13. Micrographs of the kink band in a CC specimen taken at section ‘A’, see
Fig. 12
Acknowledgements
The funding of this research from the Portuguese Foundation for Science and
Technology is greatfully acknowledged, as well as the help of Dr. Emile Green-
halgh and Ms. Victoria Bloodworth with the SEM.
24

(b)
5
3
0.25mm (a )
3
2
1
4
0.25mm
3
(d )
1
0.25mm (c )
6
6
7
0.25mm
K i n k ba n d br o a d e n i n g 2
B e n t f i br e s 4
O r i g i n a l k i n k ba n d 1
C r u s h e d m a t e r i a l 3
D e l a m i n a t i o n 6 B e n t f i br e s br e a k i n g 5
W e d g e e f f e c t 7
Fig. 14. Micrographs of the kink band in a CC specimen taken at section ‘B’, see
Fig. 12
References
[1] D. R. Leach, J. C. Seferis, Intrinsic characterization of continuous fibre
reinforced thermoplastic composites—1: Toughness characterization of carbon
fibre/ polyether ether ketone (CF/PEEK) laminates, Pure and Applied
Chemestry 63 (11) (1991) 1609–1625.
[2] S. Jose, R. K. Kuma, M. K. Jana, G. V. Rao, Intralaminar fracture toughness
25

of a cross-ply laminate and its constituent sub-laminates, Composites Science
and Technology 61 (8) (2001) 1115–1122.
[3] C. Soutis, N. A. Fleck, P. A. Smith, Failure prediction technique for compression
loaded carbon fibre-epoxy laminate with an open hole, Journal of Composite
Materials 25 (1991) 1476–1498.
[4] C. Soutis, P. T. Curtis, N. A. Fleck, Compressive failure of notched carbon fibre
composites, Proceedings of the Royal Society London A 440 (1993) 241–256.
[5] C. Soutis, P. T. Curtis, A method for predicting the fracture toughness of CFRP
laminates failing by fibre microbuckling, Composites Part A 31 (2000) 733–740.
[6] J. Ratcliffe, W. Jackson, J. Schaff, Compression strength prediction of impact-
damaged composite sandwich panels, in: American Helicopter Society 60th
Annual Forum, Baltimore, MD, 2004.
[7] W. C. Jackson, J. G. Ratcliffe, Measurement of fracture energy for kink-band
growth in sandwich specimens (paper no. 24), in: Composites Testing and Model
Identification, CompTest2004, University of Bristol, Bristol, UK, 2004.
[8] K. D. Cowley, P. W. R. Beaumont, The interlaminar and intralaminar fracture
toughness of carbon-fibre/polymer composites: The effect of temperature,
Composite Science and Technology 57 (1997) 1433–1444.
[9] A. C. Garg, Intralaminar and interlaminar fracture in graphite/epoxy laminate,
Engineering fracture mechanics 23 (4) (1986) 719–733.
[10] Standard Test Method for Plane-Strain Fracture Toughness of Metallic
Materials, ASTM E399-90, Annual Book of ASTM Standards 03.01 (1993) 407–
528.
[11] P. C. Paris, G. C. Sih, Stress analysis of cracks, fracture toughness and
applications, STP-381, ASTM (1969) 30–83.
26

[12] Abaqus, Inc., 1080 Main Street, Pawtucket, R. I. 02860, Abaqus 6.4-1 (2003).
[13] S. T. Pinho, P. Robinson, L. Iannucci, Developing a four point bend specimen to
measure the mode i intralaminar fracture toughnessof unidirectional laminated
composites, Submitted to Composites Science and Technology.
27