framing the futureaztotalrewards.com/images/meeting/091015/20150810_atra... · 10/8/2015 ·...
TRANSCRIPT

H E A L T H W E A L T H C A R E E R
F R A M I N G T H E F U T U R EU . S . C O M P E N S A T I O N T R E N D SA N D C R I T I C A L P R I O R I T I E S F O R 2 0 1 6
A T R A – A R I Z O N A T O T A L R E W A R D S A S S O C I A T I O N
S e p t e m b e r 1 0 , 2 0 1 5
C a t h e r i n e A. S h e p a r d , C C P2 1 3 3 4 6 2 4 9 5c a t h y. s h e p a r d @ m e r c e r. c o m
L o s An g e l e s

© MERCER 2015 2
T O D AY ’ S S P E A K E R
CATHY SHEPARD, CCPPRINCIPAL, REWARDS & TALENTSR. CONSULTANT
MERCER
M y e x p e r t i s e i n g l o b a l r e w a r d s c e n t e r s o n t h e d e v e l o p m e n t o f t o t a lr e w a r d s p r o g r a m s a n d p r a c t i c e s a l i g n e d w i t h a n o r g a n i z a t i o n ’ sb u s i n e s s s t r a t e g y , m a r k e t d e m a n d s a n d d e m o g r a p h i c s , t h es p e c i f i c s o f w h i c h i n c l u d e o r g a n i z a t i o n a l a r c h i t e c t u r ed e v e l o p m e n t , c o m p e t i t i v e c o m p e n s a t i o n a s s e s s m e n t s , a n d j o be v a l u a t i o n , t i t l i n g a n d c l a s s i f i c a t i o n s .
35+ YEARSOF EX PERIENCE

© MERCER 2015 3
O V E R V I E W
External Factors
Looking Back
Looking Ahead
Call to Action
Discussion
Next Steps
QUESTIONS? • Please feel free to ask throughout and at the end
Note: Some of these study results are still in the final stages of validation which is expected next week,
© MERCER 2015 4© MERCER 2015 4
EXTERNAL FACTORSWhat’s inf luencing compensation?
© MERCER 2015 5
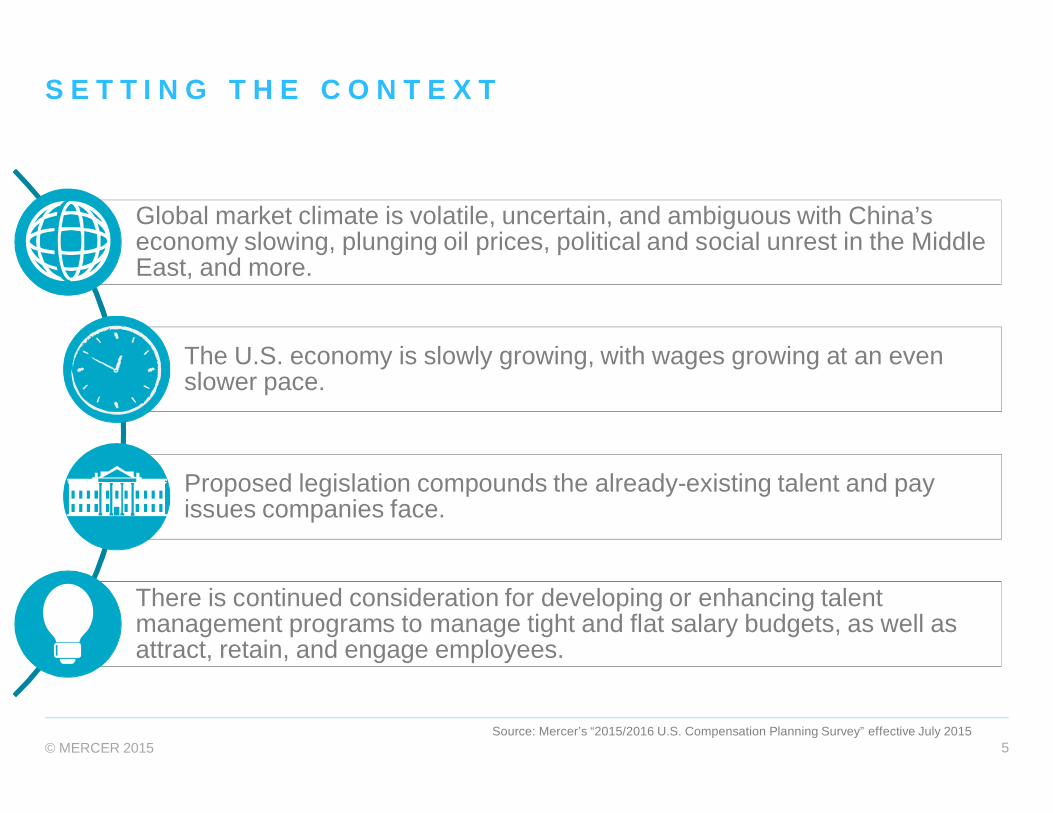
S E T T I N G T H E C O N T E X T
Source: Mercer’s “2015/2016 U.S. Compensation Planning Survey” effective July 2015
Global market climate is volatile, uncertain, and ambiguous with China’seconomy slowing, plunging oil prices, political and social unrest in the MiddleEast, and more.
The U.S. economy is slowly growing, with wages growing at an evenslower pace.
Proposed legislation compounds the already-existing talent and payissues companies face.
There is continued consideration for developing or enhancing talentmanagement programs to manage tight and flat salary budgets, as well asattract, retain, and engage employees.

© MERCER 2015 6
E C O N O M I C A N D M A R K E T C O N T E X T
Sources: Economist Intelligence Unit 2015,“RBC Economics Economic and Financial Market Outlook” June 2015,
U.S. Bureau of Labor Statistics 2015
5.4%
Unemploymentis at 5.4% for 2015.
$ vs. €
The US dollar isexpected to
strengthen againstthe Euro.
GDP
World GDP isexpected to grow
by 3.5%.
2015
The ConsumerConfidence Indexremains high, andinflation will slow.
Uncertain, volatile, and ambiguous U.S. economy is slowly rebounding after sluggish Q1.
S I GN S OF E C ON OM I C IM P R OV E M E N T
© MERCER 2015 7
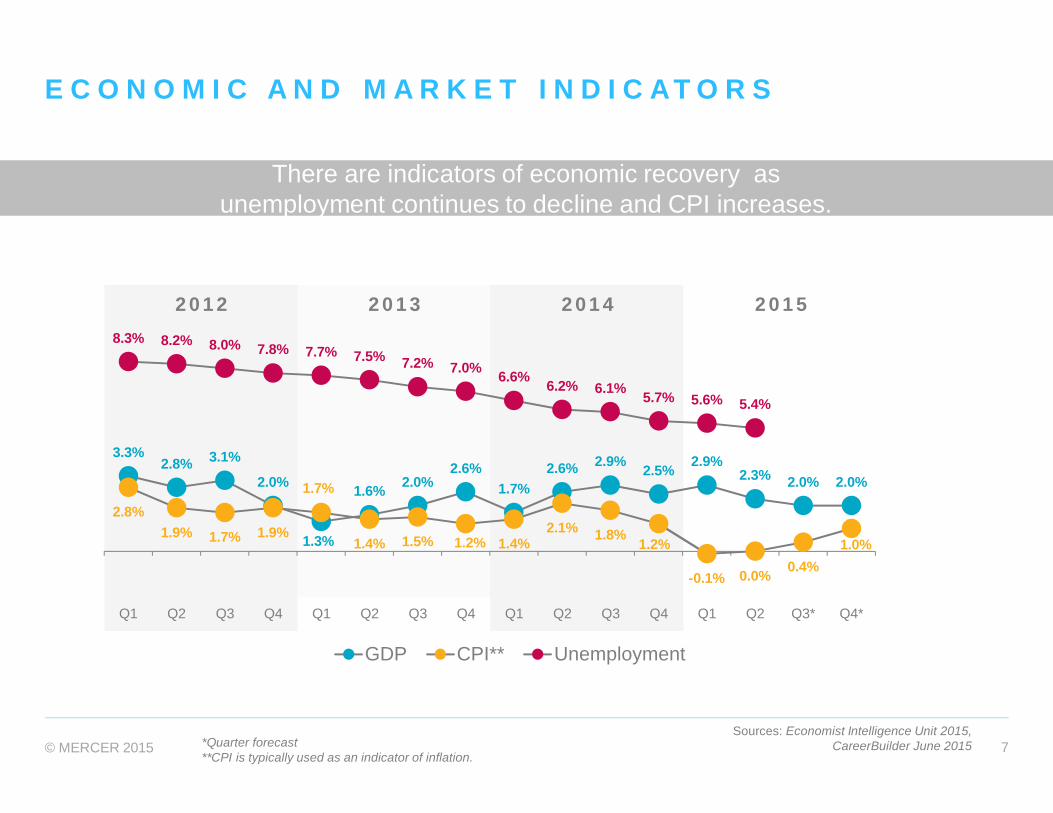
E C O N O M I C A N D M A R K E T I N D I C AT O R S
2 0 1 2 2 0 1 3 2 0 1 4 2 0 1 5
Sources: Economist Intelligence Unit 2015,CareerBuilder June 2015
There are indicators of economic recovery asunemployment continues to decline and CPI increases.
*Quarter forecast**CPI is typically used as an indicator of inflation.
3.3%2.8% 3.1%
2.0%
1.3%
1.6% 2.0%2.6%
1.7%2.6% 2.9% 2.5% 2.9%
2.3% 2.0% 2.0%
2.8%1.9% 1.7% 1.9%
1.7%
1.4% 1.5% 1.2% 1.4%2.1% 1.8% 1.2%
-0.1% 0.0% 0.4%1.0%
8.3% 8.2% 8.0% 7.8% 7.7% 7.5% 7.2% 7.0% 6.6% 6.2% 6.1% 5.7% 5.6% 5.4%
Q1 Q2 Q3 Q4 Q1 Q2 Q3 Q4 Q1 Q2 Q3 Q4 Q1 Q2 Q3* Q4*
GDP CPI** Unemployment
© MERCER 2015 8
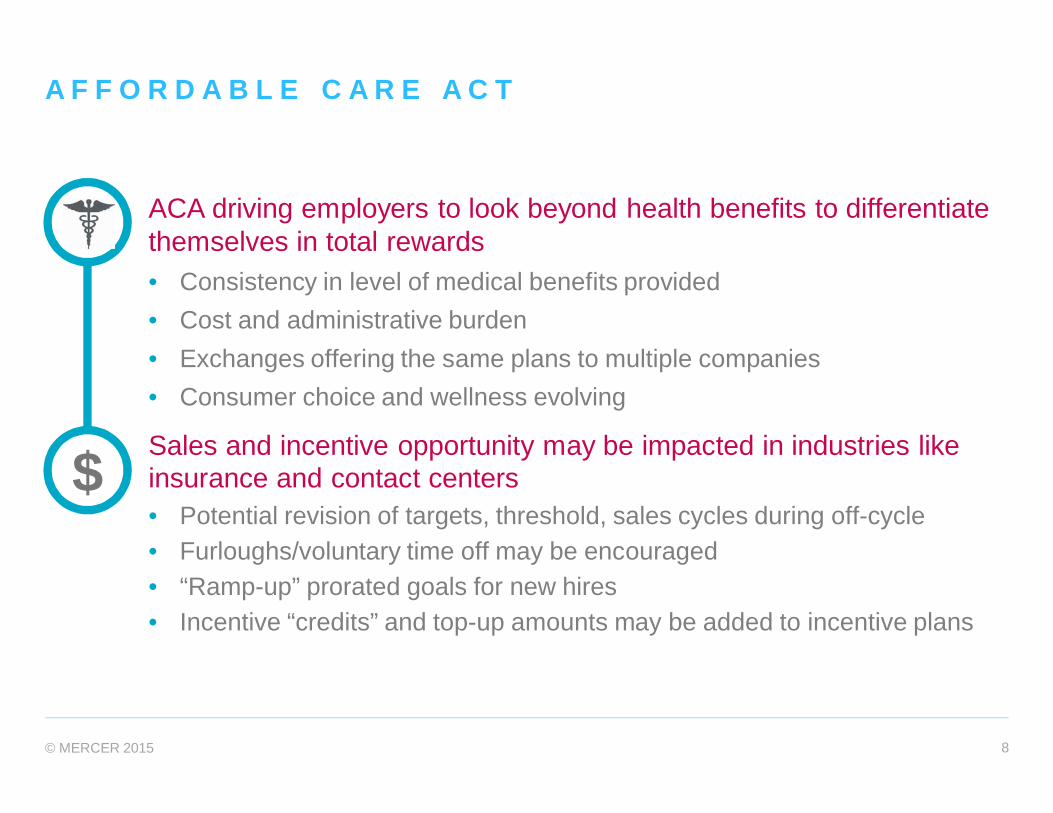
ACA driving employers to look beyond health benefits to differentiatethemselves in total rewards• Consistency in level of medical benefits provided• Cost and administrative burden• Exchanges offering the same plans to multiple companies• Consumer choice and wellness evolving
Sales and incentive opportunity may be impacted in industries likeinsurance and contact centers• Potential revision of targets, threshold, sales cycles during off-cycle• Furloughs/voluntary time off may be encouraged• “Ramp-up” prorated goals for new hires• Incentive “credits” and top-up amounts may be added to incentive plans
$
A F F O R D A B L E C A R E A C T

© MERCER 2015 9
A D D I T I O N A L H O T T O P I C S
40 percent of organizations indicated that they currently have a careerframework to manage talent programs.
An additional 30% of organizations do not currently have a career framework inplace but are planning to implement one. A majority of organizations reported“better defined jobs within the organization” as a primary driver for developing acareer framework. The two most prevalent programs connected to anorganization’s career pathing and succession planning.
80 percent of organizations have a pay-for-performance philosophy aspart of their compensation program.
Only 22% of those organizations measure the effectiveness of their pay-for-performance philosophy.Of the organizations that do measure their program, 67% indicated that it is somewhat effective and30 % indicated that it is very effective.
Pay-for-Performance
Career Frameworks
Planning for 2016
71 percent of organizations report that the concern for retention and losing good employees arethe primary factors that influences their compensation planning decisions.
63 % of organizations are concerned about meeting the challenges of buying talent from theexternal labor market.
© MERCER 2015 10
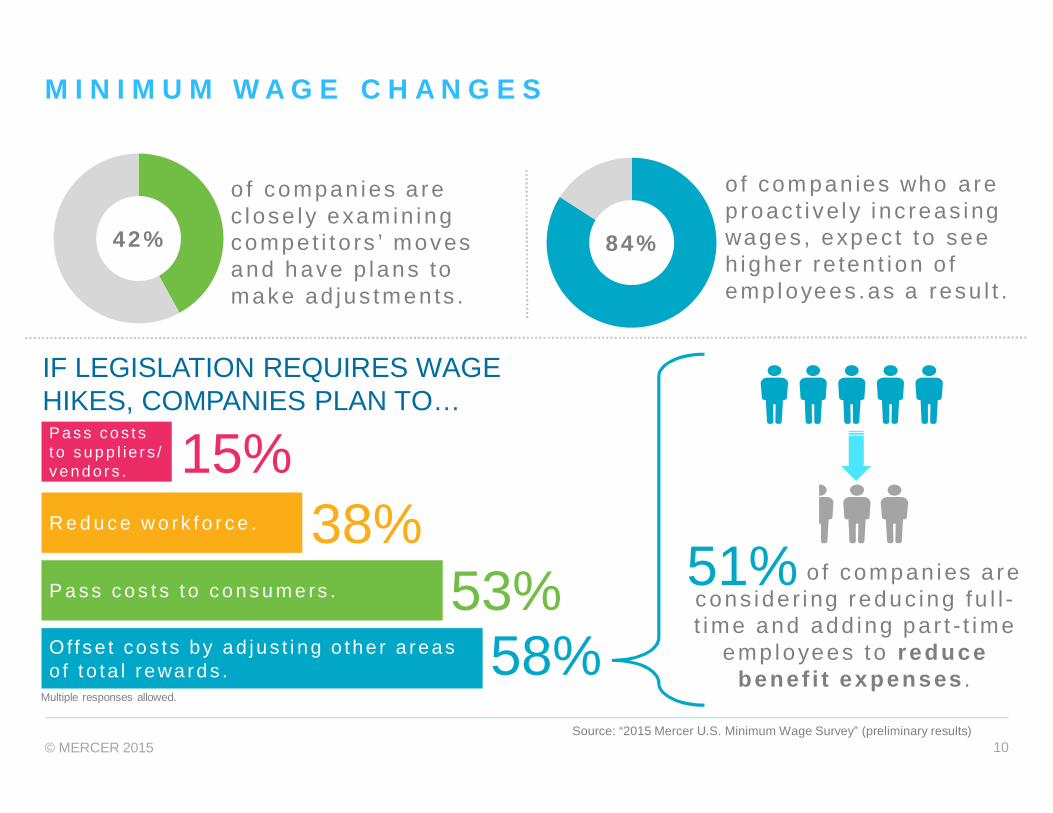
M I N I M U M W A G E C H A N G E S
o f com pan ies who a rep roac t i ve l y i nc reas ingwages , expec t t o seeh igher re ten t i on o femp l oyees .as a resu l t .
Source: “2015 Mercer U.S. Minimum Wage Survey” (preliminary results)
84%
IF LEGISLATION REQUIRES WAGEHIKES, COMPANIES PLAN TO…
53%P a s s c o s t s t o c o n s u m e rs .
O f f se t cos ts by ad jus t i ng o the r a reaso f t o ta l r ewards . 58%
38%R e d u c e w o rk f o r c e .
P a s s c o s t st o s u p p l ie r s /v e n d o r s . 15%
Multiple responses allowed.
o f compan ies a recons ide r ing reduc ing fu l l -t ime and add ing pa r t - t ime
emp loyees to reducebenef i t expenses .
51%
o f compan ies a rec lose ly examin ingcompet i t o rs ’ movesand h ave p lans tomake ad jus tmen ts .
42%
© MERCER 2015 11
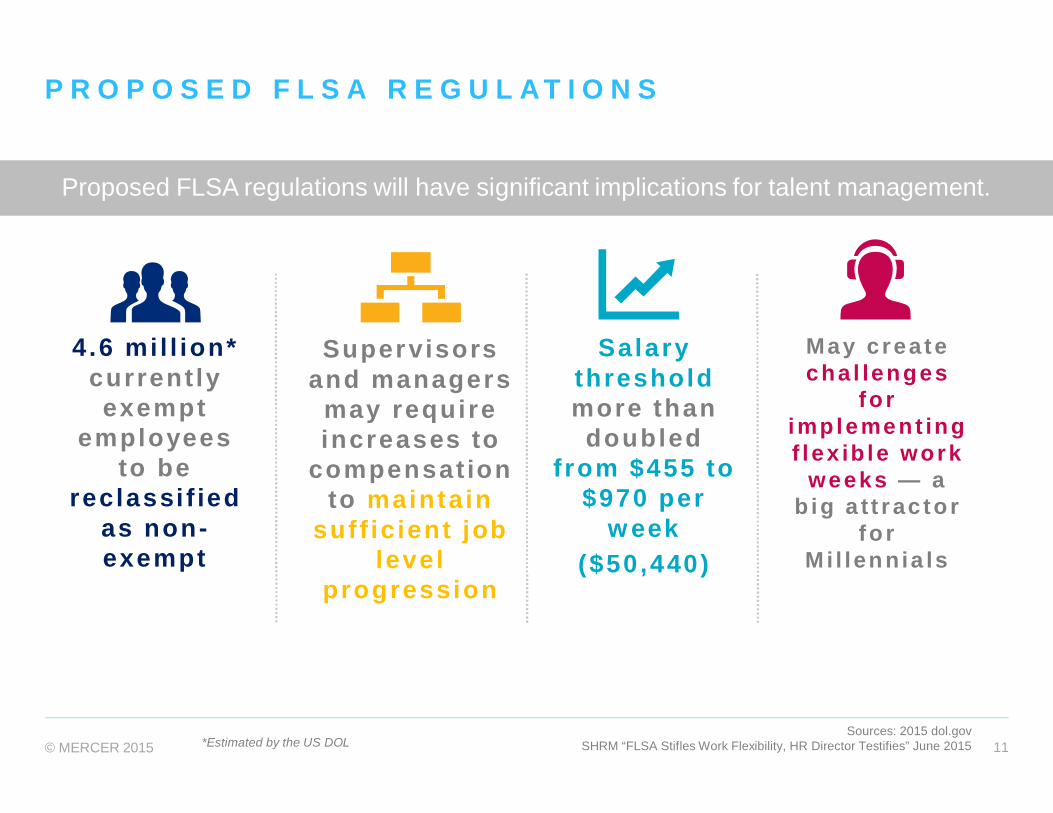
P R O P O S E D F L S A R E G U L A T I O N S
Sources: 2015 dol.govSHRM “FLSA Stifles Work Flexibility, HR Director Testifies” June 2015
Proposed FLSA regulations will have significant implications for talent management.
May createcha l lenges
forimplement ingf lex ib le work
weeks — abig a t t rac tor
forMi l lennia ls
*Estimated by the US DOL
4.6 mi l l ion*current lyexempt
employeesto be
reclassi f iedas non-exempt
Supervisorsand managers
may requireincreases to
compensat ionto maintain
suff ic ient joblevel
progression
Salarythresholdmore than
doubledfrom $455 to
$970 perw eek
($50,440)

© MERCER 2015 12© MERCER 2015 12
LOOKING BACKWhat we learned from Mercer ’s U.S.compensation survey
© MERCER 2015 13
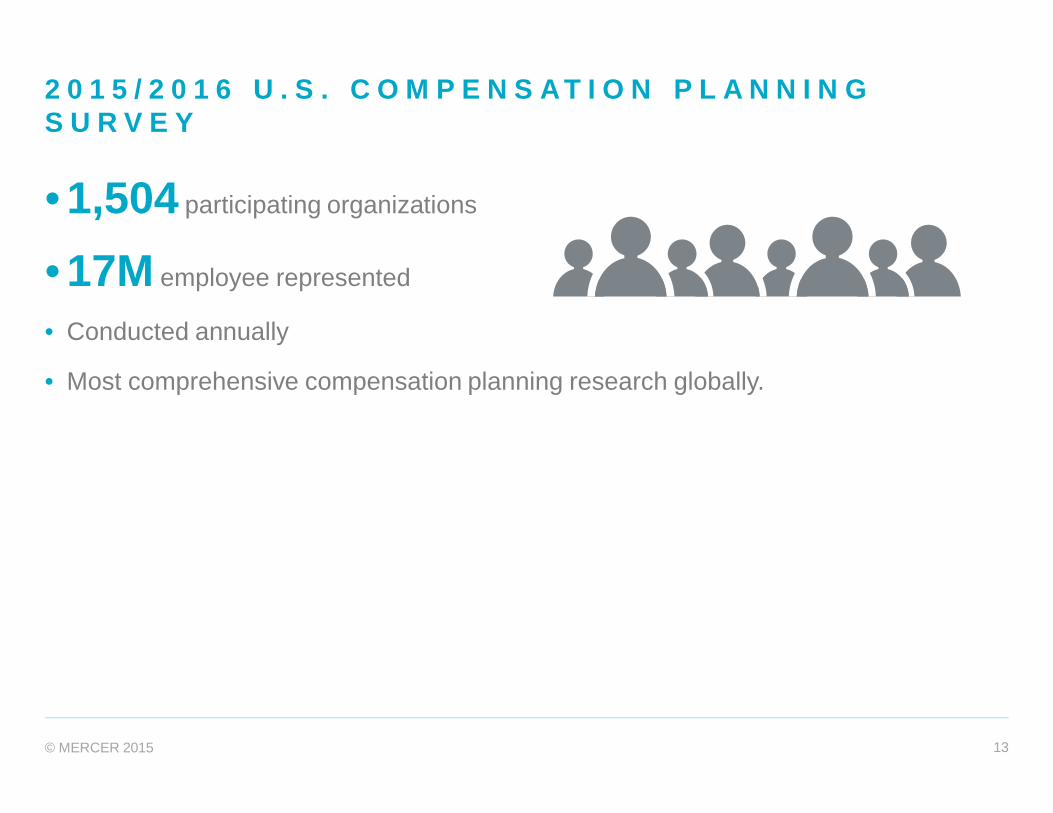
2 0 1 5 / 2 0 1 6 U . S . C O M P E N S A T I O N P L A N N I N GS U R V E Y
• 1,504 participating organizations
• 17M employee represented
• Conducted annually
• Most comprehensive compensation planning research globally.
© MERCER 2015 14
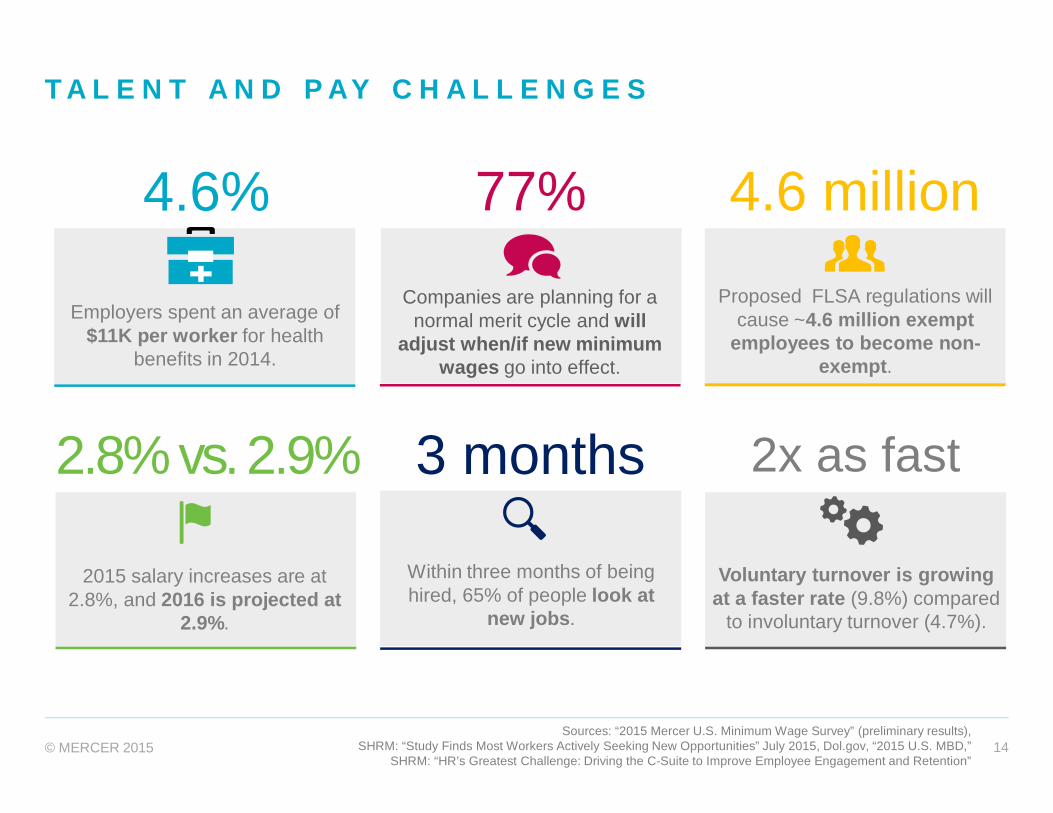
T A L E N T A N D P AY C H A L L E N G E S
2x as fast
Voluntary turnover is growingat a faster rate (9.8%) compared
to involuntary turnover (4.7%).
4.6%
Employers spent an average of$11K per worker for health
benefits in 2014.
77%
Companies are planning for anormal merit cycle and will
adjust when/if new minimumwages go into effect.
4.6 millionProposed FLSA regulations will
cause ~4.6 million exemptemployees to become non-
exempt.
2.8% vs. 2.9%
2015 salary increases are at2.8%, and 2016 is projected at
2.9%.
Sources: “2015 Mercer U.S. Minimum Wage Survey” (preliminary results),SHRM: “Study Finds Most Workers Actively Seeking New Opportunities” July 2015, Dol.gov, “2015 U.S. MBD,”
SHRM: “HR’s Greatest Challenge: Driving the C-Suite to Improve Employee Engagement and Retention”
3 months
Within three months of beinghired, 65% of people look at
new jobs.

© MERCER 2015 15
Q U E S T I O N : I N Y O U R O R G A N I Z A T I O N , I N 2 0 1 5D I D S A L A R Y I N C R E A S E B U D G E T S
S T AY T HE S AM E
I N C R E AS E
D E C RE AS E
D O N ’ T K N OW

© MERCER 2015 16
S A L A R Y I N C R E A S E B U D G E T S
• 98% of participating organizations awarding salary increases
• 2.8% average base salary increase
• High performers get 1.8 x the salary increase of an average performer
• 2015 salary increases remain consistent with last five years
• 2.9% average 2016 base salary increase budget

© MERCER 2015 17
YEAR ALLEMPLOYEES EXEC MGMT PROFESSIONAL CLERICAL TRADES/
PRODUCTION
2016(projected) 3.0% 3.0% 3.0% 3.0% 2.9% 2.9%
2015(actual) 2.9% 3.0% 2.9% 2.9% 2.9% 2.8%
2014(actual) 3.0% 3.0% 3.0% 3.0% 3.0% 3.0%
2013(actual) 2.9% 3.0% 2.9% 2.9% 2.9% 2.9%
2012(actual) 2.9% 3.0% 2.9% 2.9% 2.9% 2.8%
2011(actual) 2.9% 3.0% 2.9% 2.8% 2.8% 2.8%
S A L A R Y I N C R E A S E B U D G E T S C O N S I S T E N T
Source: Mercer 2015/2016 US Compensation Planning Survey Report. All industries, all locations, excluding zeros.
© MERCER 2015 18
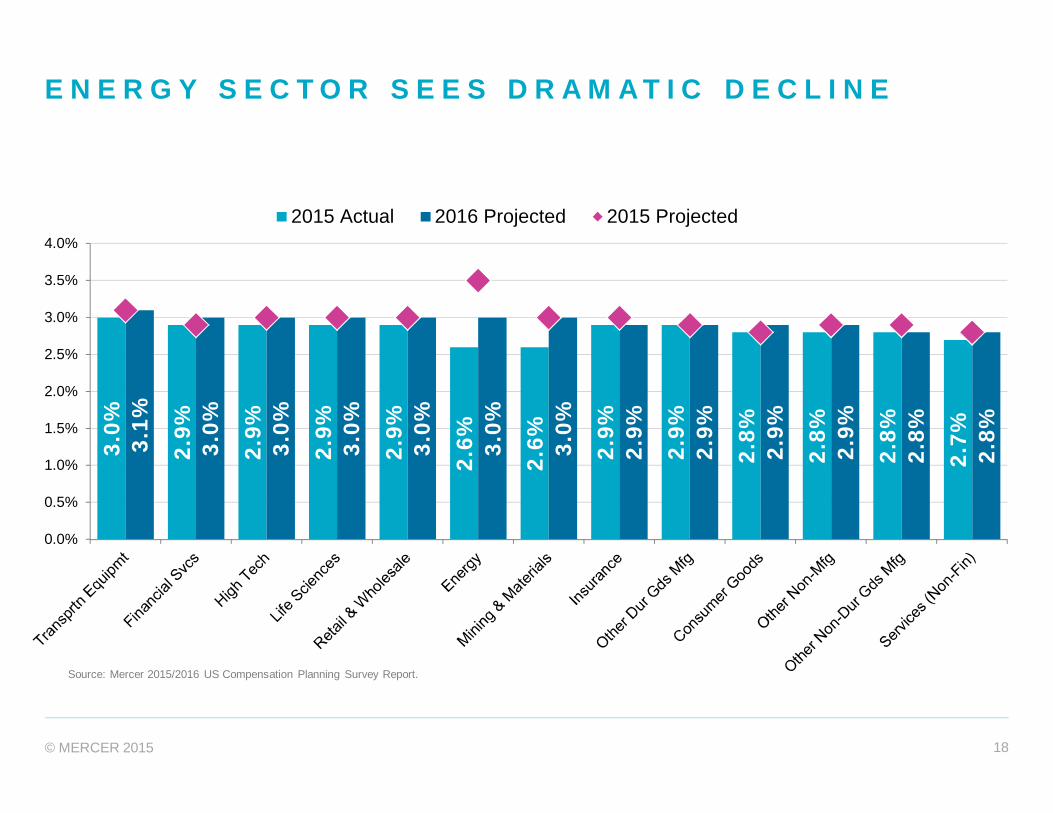
E N E R G Y S E C T O R S E E S D R A M A T I C D E C L I N E
Source: Mercer 2015/2016 US Compensation Planning Survey Report.
3.0%
2.9%
2.9%
2.9%
2.9%
2.6%
2.6% 2.9%
2.9%
2.8%
2.8%
2.8%
2.7%3.
1%
3.0%
3.0%
3.0%
3.0%
3.0%
3.0%
2.9%
2.9%
2.9%
2.9%
2.8%
2.8%
0.0%
0.5%
1.0%
1.5%
2.0%
2.5%
3.0%
3.5%
4.0%
2015 Actual 2016 Projected 2015 Projected

© MERCER 2015 19
P R O M O T I O N A L I N C R E A S E S O N T H E R I S E
5.0%
5.5%
6.0%
6.5%
7.0%
7.5%
8.0%
8.5%
9.0%
9.5%
2011 2012 2013 2014 2015
Executive
Management
Professional(Sales & Non-Sales)
Office/Clerical/Technician
Trades/Production/Service
F IV E Y E A R T R E N D – P R OM O T IO NA L IN C RE A S E S A S A P E R C E N T O F B A S E S A L A R Y
Source: Mercer 2015/2016 US Compensation Planning Survey Report.

© MERCER 2015 20
C O M P A N I E S U S E F O R M A L S T R U C T U R E S W I T HT R A D I T I O N A L G R A D E S
2.4% 2.2%
2.5% 2.3%
2.4% 2.2%
2.4% 2.3%
2.3% 2.2%
2.4% 2.2%
2015ACTUAL
2016PROJECTED
A L L E M P L O Y E E S
E X E C U T I V E
M A N A G E M E N T
P R O F E S S I O N A LS a l e s a n d N o n -
s a l e s
O F F I C E / C L E R I C A L /T E C H N I C A L
T R A D E / P R O D U C T I O N /S E R V I C E
STRUCTUREADJUSTMENTS
Excludes 0s
O F PA R T I C I PAT I N GO R G A N I Z AT I O N S P L A N TO
A D J U S T T H E I R S A L A R YS T R U C T U R E I N 2 0 1 6
72%
Source: Mercer 2015/2016 US Compensation Planning Survey Report.
© MERCER 2015 21
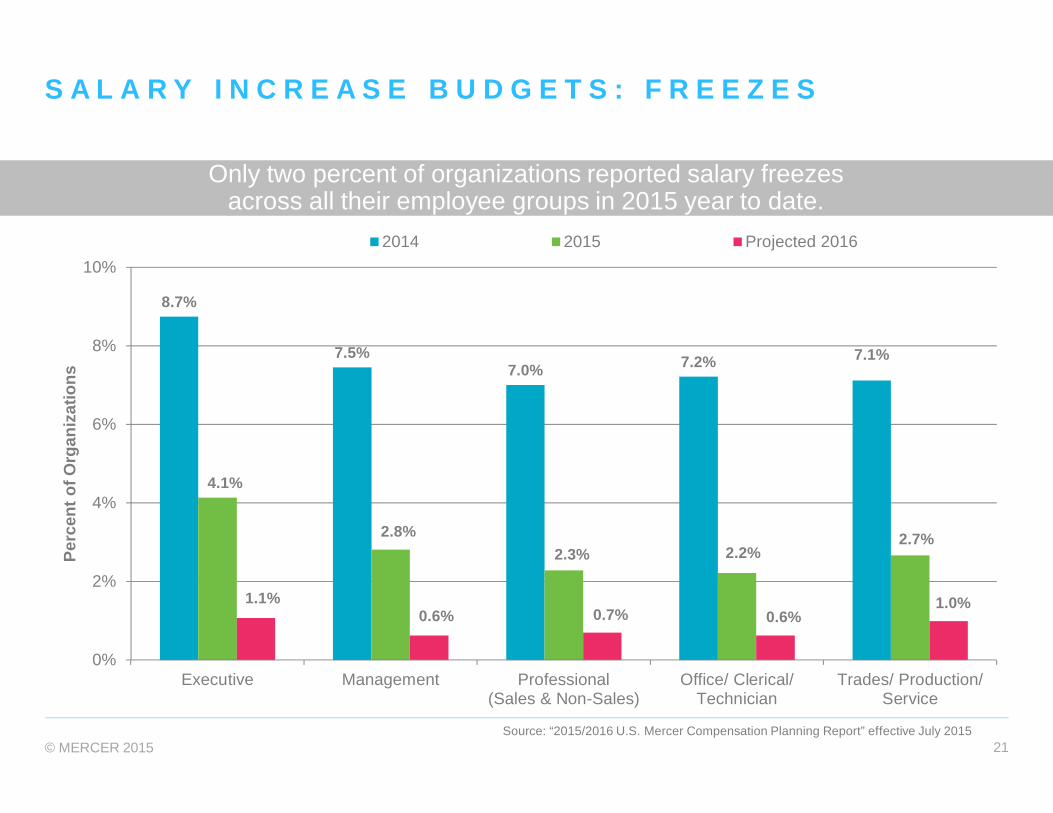
8.7%
7.5%7.0% 7.2% 7.1%
4.1%
2.8%2.3% 2.2%
2.7%
1.1%0.6% 0.7% 0.6%
1.0%
0%
2%
4%
6%
8%
10%
Executive Management Professional(Sales & Non-Sales)
Office/ Clerical/Technician
Trades/ Production/Service
Perc
ento
fOrg
aniz
atio
ns
2014 2015 Projected 2016
S A L A R Y I N C R E A S E B U D G E T S : F R E E Z E S
Source: “2015/2016 U.S. Mercer Compensation Planning Report” effective July 2015
Only two percent of organizations reported salary freezesacross all their employee groups in 2015 year to date.

© MERCER 2015 22
L U M P S U M P AY M E N T SB A S I S F O R D E T E R M I N I N G L U M P S U M A M O U N T S
Lump sum payments are most commonly used when an employee’s salary is abovetheir salary range (red circled) as indicated by 94 percent of organizations.
Fifty-six percent of participating organizations award lump sum payments in lieu of allor a portion of salary increases primarily when pay is above the salary maximum.
For 55 percent of participants, the determination of the lump sum amount is based ona combination of individual performance and the employee’s positioning within theirsalary structure range.

© MERCER 2015 23
S H O R T - T E R M I N C E N T I V E SE I G H T Y - F O U R P E R C E N T O F P A R T I C I P A T I N GO R G A N I Z A T I O N S H A V E I N C E N T I V E P L A N S F O RA T L E A S T O N E S E G M E N T O F T H E I R E M P L O Y E EP O P U L AT I O N
Organizations were asked about changes they havemade to the eligibility and opportunity in their short-termincentive plans. While most organizations did not make achange to their plan, approximately 10 percent of allorganizations increased eligibility and opportunity.
Management incentives and individual non-management incentives are the most widelyused form of incentives. On average, incentivepayouts in 2015 (for performance in 2014)were paid at or close to target level for allemployee groups across all participatingorganizations.
© MERCER 2015 24
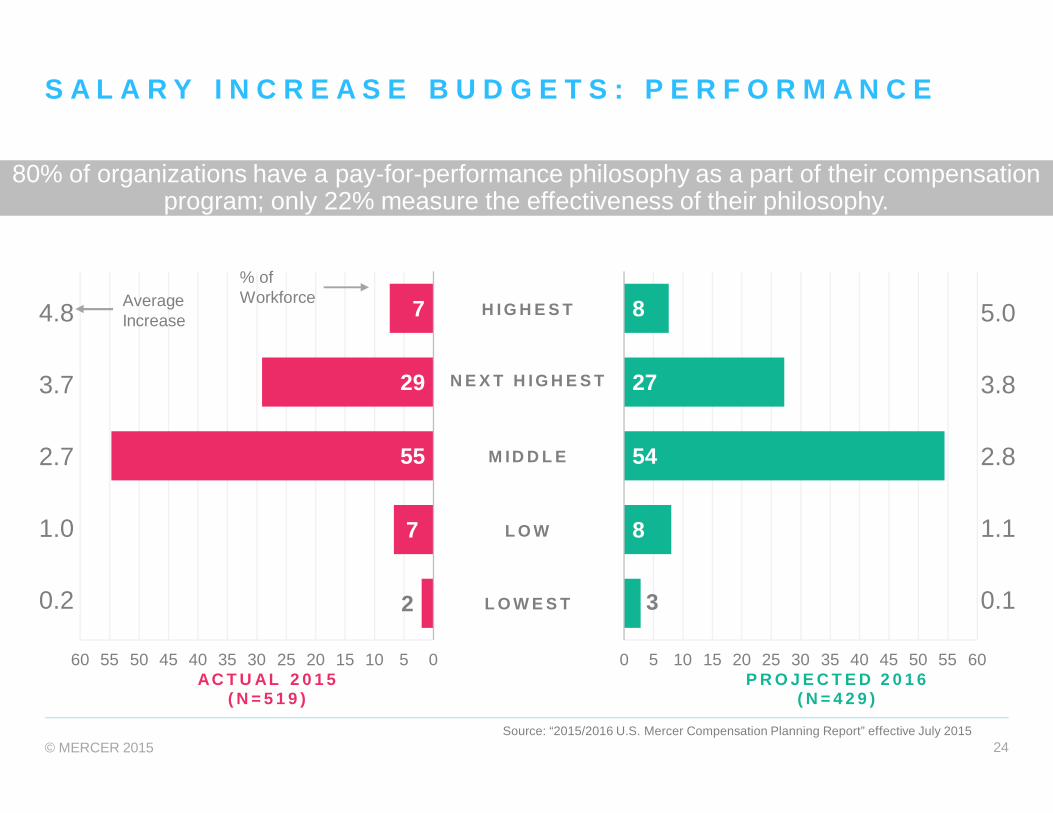
S A L A R Y I N C R E A S E B U D G E T S : P E R F O R M A N C E
80% of organizations have a pay-for-performance philosophy as a part of their compensationprogram; only 22% measure the effectiveness of their philosophy.
Source: “2015/2016 U.S. Mercer Compensation Planning Report” effective July 2015
7
29
55
7
2
051015202530354045505560AC T U AL 2 0 1 5
( N = 5 1 9 )
8
27
54
8
3
0 5 10 15 20 25 30 35 40 45 50 55 60P R O J E C T E D 2 0 1 6
( N = 4 2 9 )
H I G H E S T
N E X T H I G H E S T
M ID D L E
L O W
L O W E S T
5.0
3.8
2.8
1.1
0.1
4.8
3.7
2.7
1.0
0.2
% ofWorkforceAverage
Increase
© MERCER 2015 25
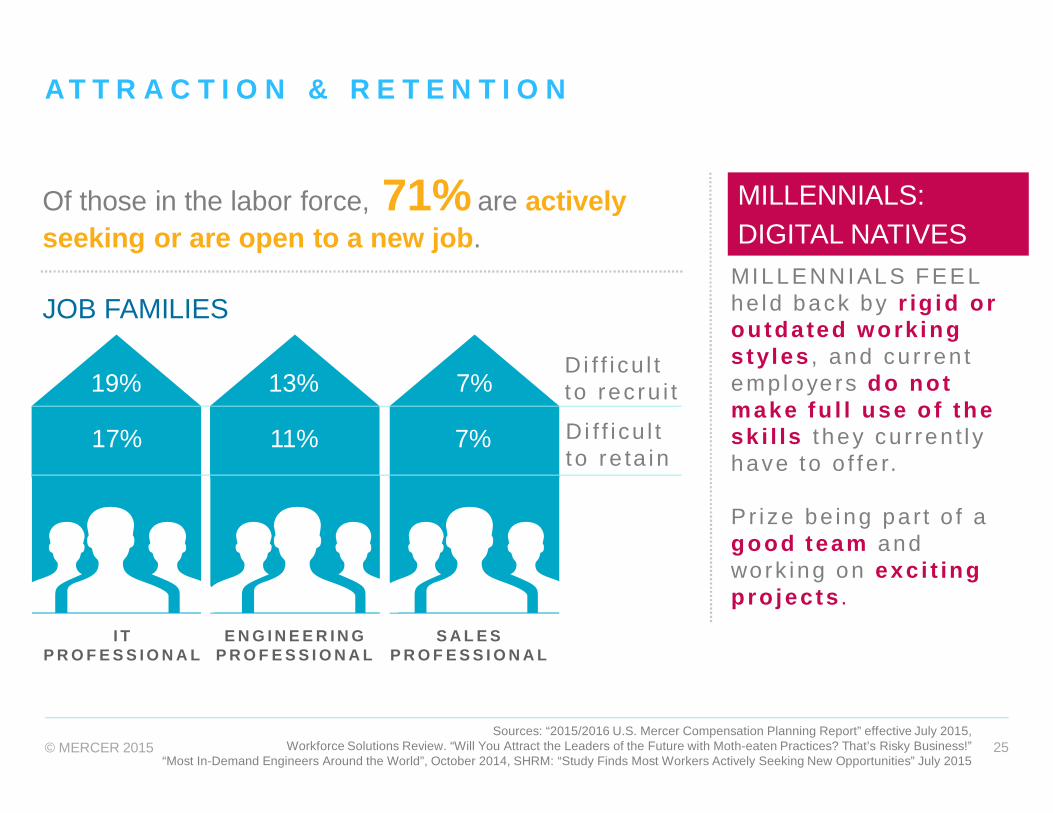
A T T R A C T I O N & R E T E N T I O N
Sources: “2015/2016 U.S. Mercer Compensation Planning Report” effective July 2015,Workforce Solutions Review. “Will You Attract the Leaders of the Future with Moth-eaten Practices? That’s Risky Business!”
“Most In-Demand Engineers Around the World”, October 2014, SHRM: “Study Finds Most Workers Actively Seeking New Opportunities” July 2015
MILLENNIALS:DIGITAL NATIVES
MILLENNIALS FEELhe ld back by r ig id oroutda ted workingstyles , and cu r ren temp l oyers do notmake fu l l use o f thesk i l ls t hey cu r ren t l yhave to o f fe r.
P r i ze be ing pa r t o f agood team andwork ing on exc i t ingpro jec ts .
7%
Di f f i cu l tto rec ru i t
D i f f i cu l tt o re ta in
I TP R O F E S S I O N A L
E N G I N E E R I N GP R O F E S S I O N A L
S A L E SP R O F E S S I O N A L
19% 13% 7%
17% 11% 7%
JOB FAMILIES
Of those in the labor force, 71% are activelyseeking or are open to a new job.
© MERCER 2015 26
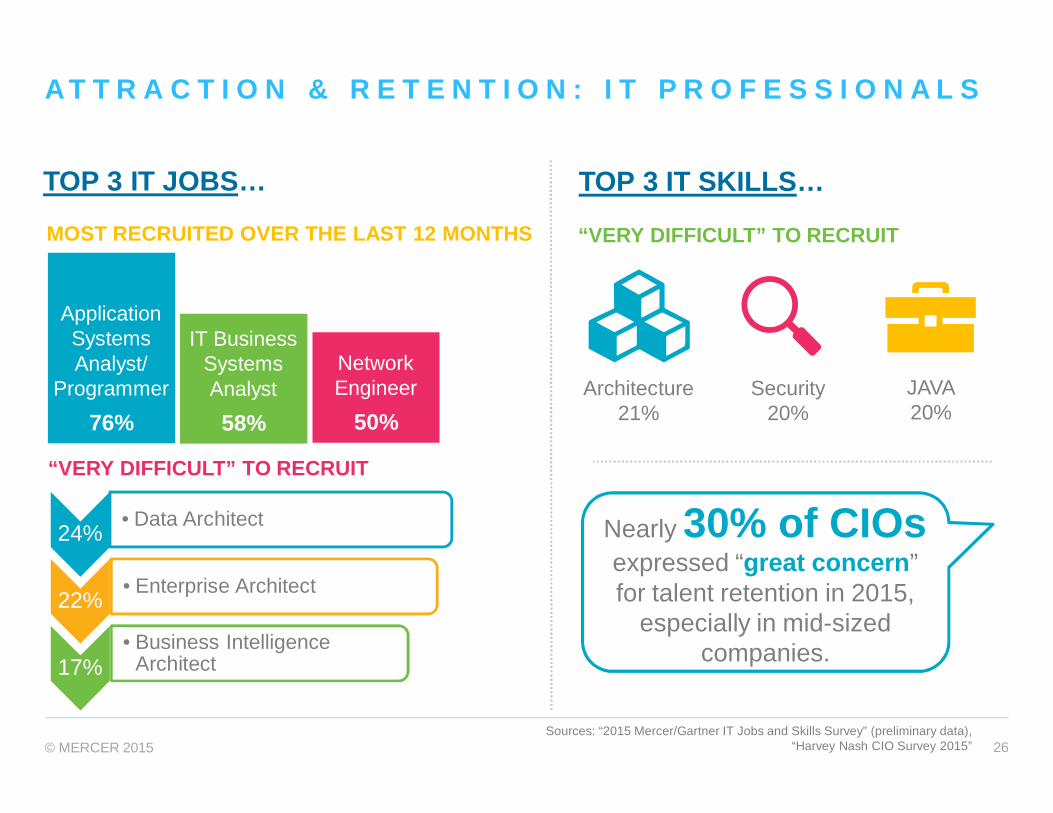
“VERY DIFFICULT” TO RECRUIT
24%• Data Architect
22%• Enterprise Architect
17%• Business Intelligence
Architect
A T T R A C T I O N & R E T E N T I O N : I T P R O F E S S I O N A L S
Sources: “2015 Mercer/Gartner IT Jobs and Skills Survey” (preliminary data),“Harvey Nash CIO Survey 2015”
TOP 3 IT JOBS…
ApplicationSystemsAnalyst/
Programmer
76%
IT BusinessSystemsAnalyst
58%
NetworkEngineer
50%
MOST RECRUITED OVER THE LAST 12 MONTHS “VERY DIFFICULT” TO RECRUIT
TOP 3 IT SKILLS…
Architecture21%
Security20%
JAVA20%
Nearly 30% of CIOsexpressed “great concern”for talent retention in 2015,
especially in mid-sizedcompanies.
© MERCER 2015 27
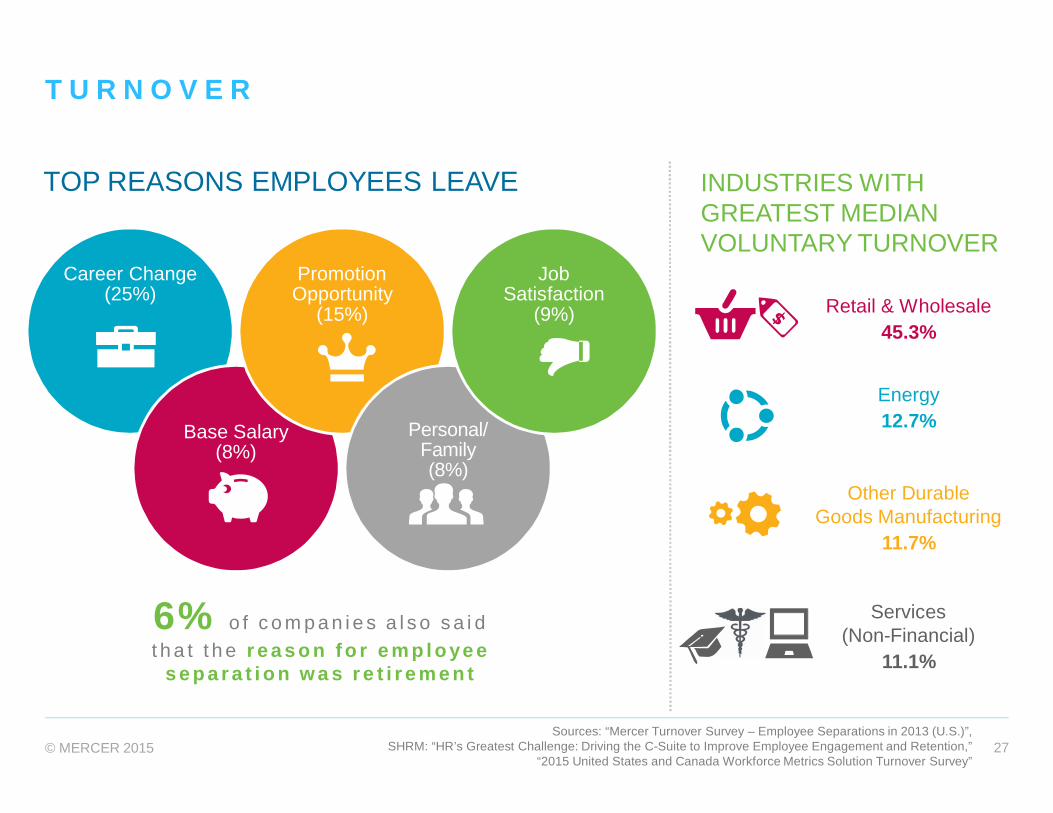
T U R N O V E R
Sources: “Mercer Turnover Survey – Employee Separations in 2013 (U.S.)”,SHRM: “HR’s Greatest Challenge: Driving the C-Suite to Improve Employee Engagement and Retention,”
“2015 United States and Canada Workforce Metrics Solution Turnover Survey”
Career Change(25%)
Base Salary(8%)
PromotionOpportunity
(15%)
Personal/Family(8%)
JobSatisfaction
(9%)
TOP REASONS EMPLOYEES LEAVE INDUSTRIES WITHGREATEST MEDIANVOLUNTARY TURNOVER
Retail & Wholesale45.3%
Energy12.7%
Other DurableGoods Manufacturing
11.7%
Services(Non-Financial)
11.1%
6% o f c o m p a n i e s a l s o s a i dt h a t t h e r e a s o n f o r e m p l o ye e
s e p a r a t i o n w a s r e t i r e m e n t
© MERCER 2015 28© MERCER 2015 28
LOOKING FO RWARDHow do organizat ions need to respond?
© MERCER 2015 29
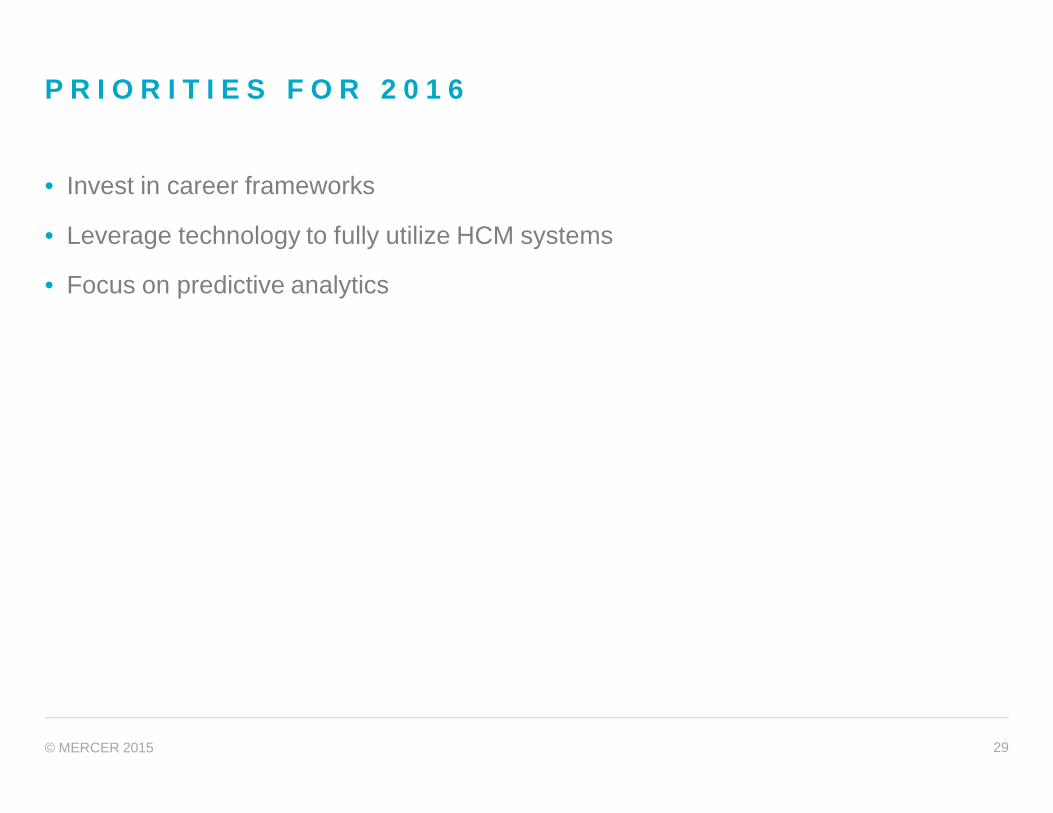
P R I O R I T I E S F O R 2 0 1 6
• Invest in career frameworks
• Leverage technology to fully utilize HCM systems
• Focus on predictive analytics

© MERCER 2015 30
P R I O R I T I E S F O R 2 0 1 6C A R E E R D E V E L O P M E N T: C A R E E R F R A M E W O R K S
Have acareerframework
Don't have, butplanningto implement
Don't have, andnot planningto implement
%28
Sources: Mercer’s “2014 U.S. Compensation Policies and Practices Survey,”“2015/2016 U.S. Mercer Compensation Planning Report” effective July 2015
Succession planning
Training and development
Performance management
Career pathing (verticaland/or horizontal movement)
Rewards (base salary andincentive management)
Recruitment and selection
Job titling
68%
65%
62%
57%
56%
46%
32%
PREVALENCEOF
CONNECTINGCAREER
FRAMEWORKSTO OTHER
TALENTMANAGEMENTPROCESSES
%32
%40

© MERCER 2015 31
N e w C a r e e r V i e w A p pA career framework canhelp employees explorethe different directionstheir careers can take,articulate thecompetencies they needto develop to get to acareer goal,and provide the learningideas to help themdevelop thosecompetencies.
One third ofemployees arestuck in a job,not a career
© M E R C E R 2 0 1 5
Mercer’s research found that
EMPLOYEES WANT TO BETTERUNDERSTAND HOW TO GROW
THEIR CAREERS
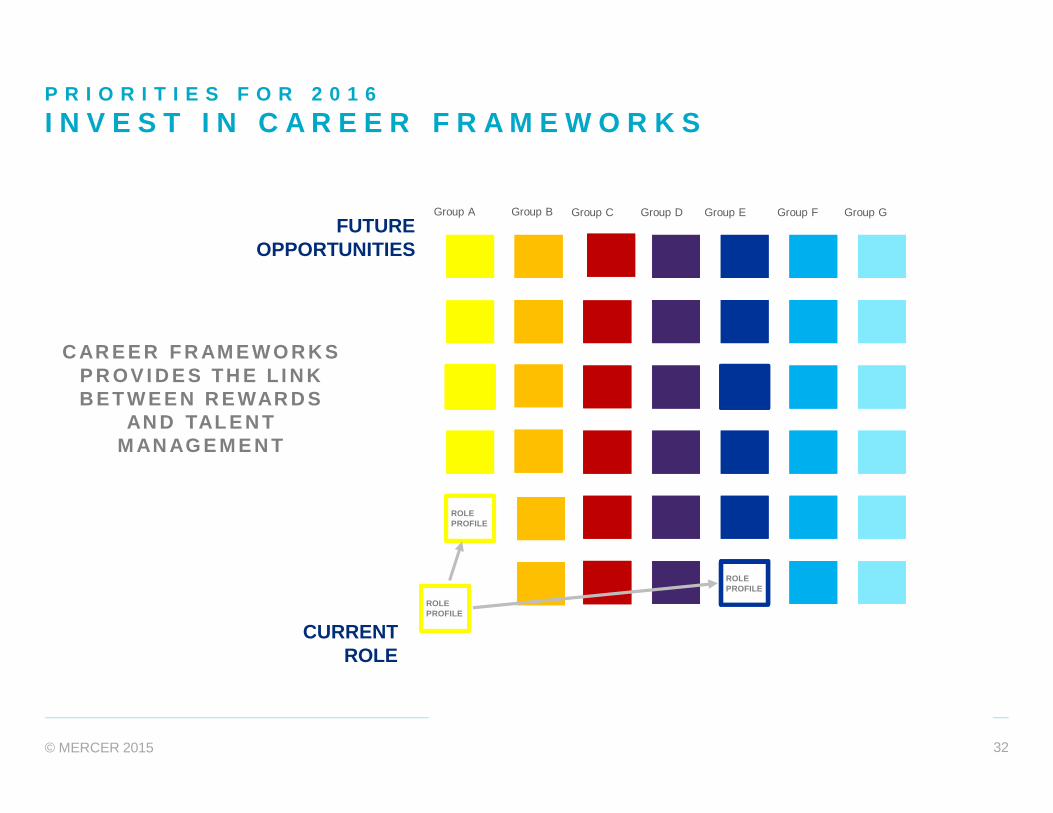
P R I O R I T I E S F O R 2 0 1 6I N V E S T I N C A R E E R F R A M E W O R K S
© MERCER 2015 32
FUTUREOPPORTUNITIES
CURRENTROLE
ROLEPROFILE
Group A Group B Group C Group D Group E Group F Group G
ROLEPROFILE
ROLEPROFILE
P R I O R I T I E S F O R 2 0 1 6I N V E S T I N C A R E E R F R A M E W O R K S
C AR E E R F R AM E W O R K SP R OV I D E S TH E L I N KB E T W E E N R E WAR D S
AN D TAL E N TM AN AG E M E N T

© MERCER 2015 33
TECHNOLOGYPLATFORM
J o b a n d e m p l o y e e d a t a a r e k e yt o e n a b l i n g t h e t e c h n o l o g yp l a t f o r m a n d u n l o c k i n g b i g d a t ai n s i g h t s
EMPLOYEEDATA
LEVELINGANDHIERARCHY
JOBDATA
Better Workforce InsightsBetter Information
Mercer’ Internal LaborMarket Analysis (ILM)
P R I O R I T I E S F O R 2 0 1 6L E V E R A G E T E C H N O L O G Y

© MERCER 2015 34
C o m p e n s a t i o n i s a t t h e h e a r t o f b e t t e r j o ba n d e m p l o y e e i n f o r m a t i o n
Job title Career levels
Job coding Organized familiesof work
COMPENSATIONPROFESSIONAL
$
P R I O R I T I E S F O R 2 0 1 6L E V E R A G E T E C H N O L O G Y

© MERCER 2015 35
Measurement ContinuumLess Powerful More Powerful
ReactiveChecks
Predictive/CausalModeling
Correlations
Benchmarks
OngoingReports
SimulationsandForecasting
Anecdotes
P R I O R I T I E S F O R 2 0 1 6F O C U S O N P R E D I C T I V E A N A L Y T I C S
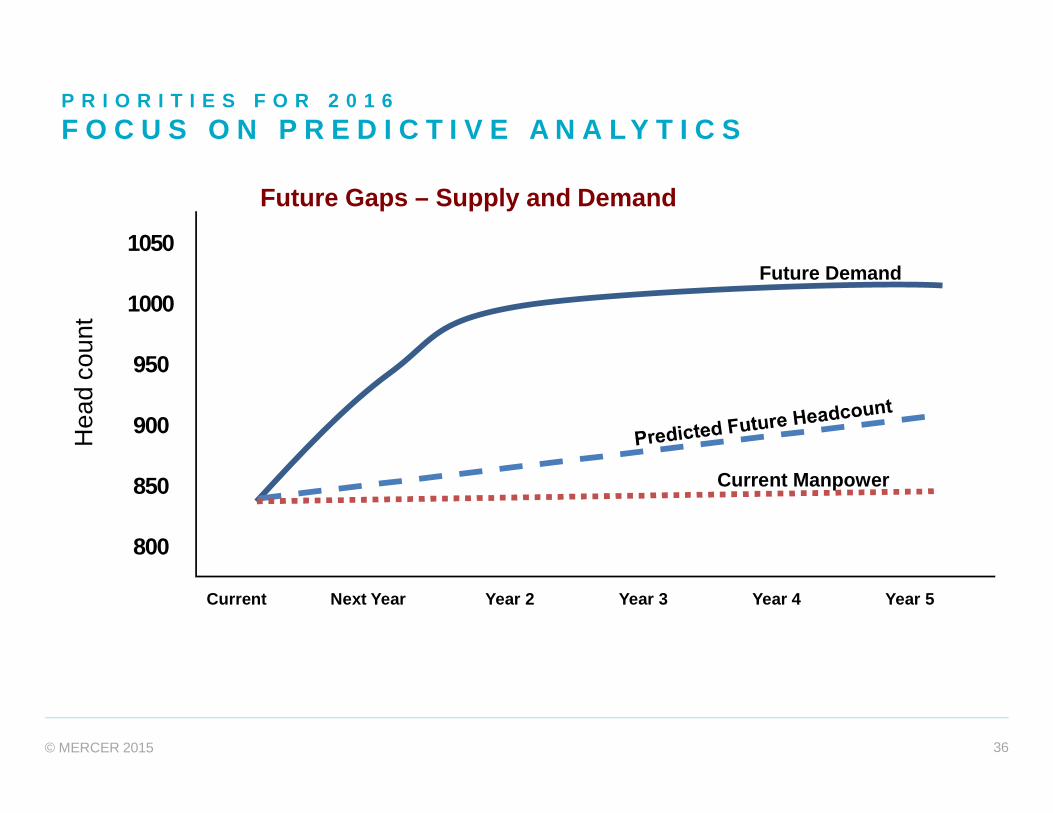
© MERCER 2015 36
Current Next Year Year 2 Year 3 Year 4 Year 5
1050
1000
950
900
850
800
Hea
dco
unt
Current Manpower
Future Demand
Future Gaps – Supply and Demand
Current Next Year Year 2 Year 3 Year 4 Year 5
P R I O R I T I E S F O R 2 0 1 6F O C U S O N P R E D I C T I V E A N A L Y T I C S
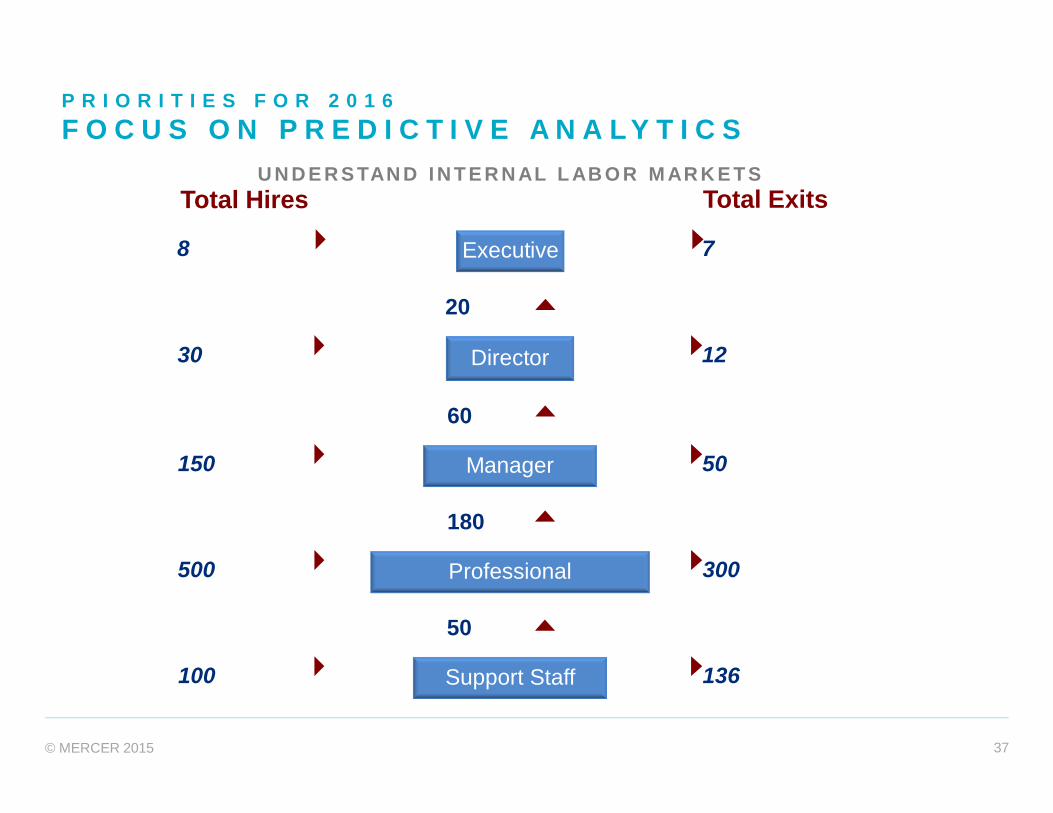
© MERCER 2015 37
Total Hires Total Exits
100 136Support Staff
500 300Professional
150 50Manager
30 12Director
8 7Executive
20
60
180
50
U N D E R S TAN D I N T E R N AL L AB O R M AR K E T S
P R I O R I T I E S F O R 2 0 1 6F O C U S O N P R E D I C T I V E A N A L Y T I C S
© MERCER 2015 38
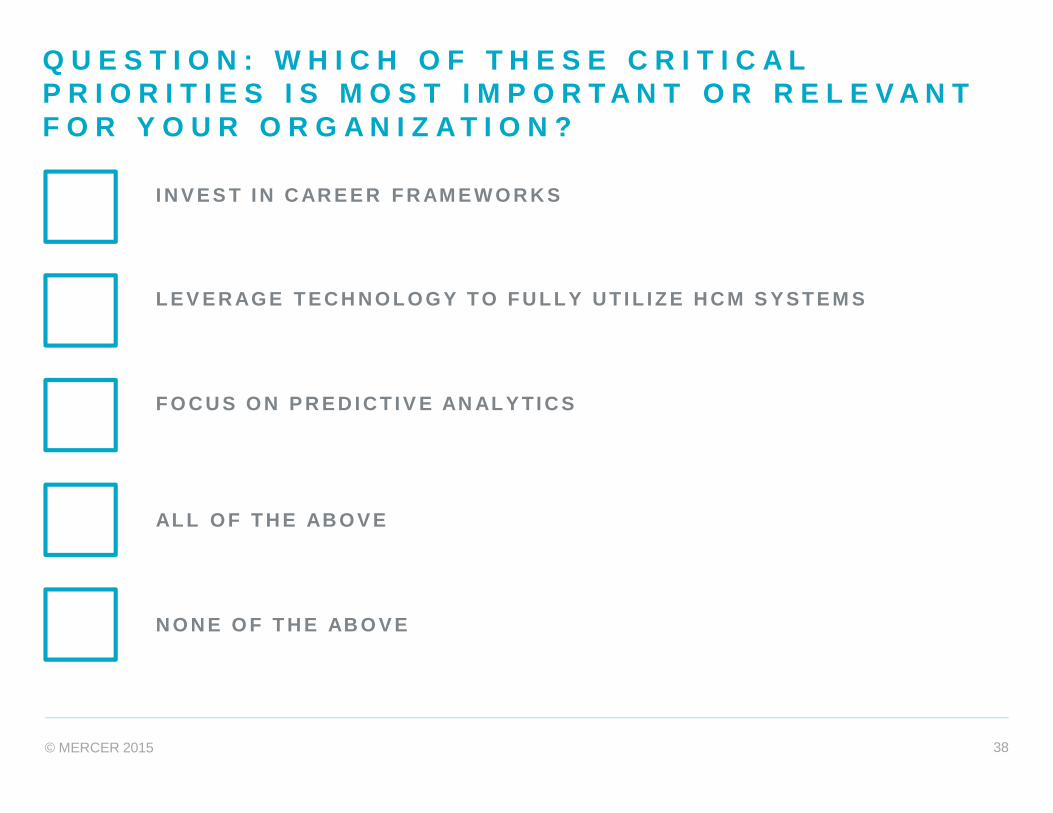
Q U E S T I O N : W H I C H O F T H E S E C R I T I C A LP R I O R I T I E S I S M O S T I M P O R T A N T O R R E L E V A N TF O R Y O U R O R G A N I Z A T I O N ?
I N V E S T I N C AR E E R F R AM E W O R K S
L E V E R AG E T E C H N O L O G Y T O F U L L Y U T I L I Z E H C M S Y S T E M S
F O C U S O N P R E D I C T I V E AN AL Y TI C S
AL L O F T H E AB O V E
N O N E O F T H E AB O V E

© MERCER 2015 39
C AL L T O AC T I O NW h a t s h o u ld yo u p r e p a re fo ri n 2 0 1 6?

© MERCER 2015 40
L O O K I N G A H E A D T O 2 0 1 6W H A T T O P R E P A R E F O R
Compensation and rewards programs will beexpressly designed and delivered to securedesired workforce outcomes.
Managing talent will become increasinglyindividualized, with investments in careerframeworks paying off by providing line of site intocareer progression opportunities aiding retention andengagement.
Employers will continue to struggle with the valueof incentives as they hone in on what best drivesemployee performance and overall profitability.
© MERCER 2015 41
Q U E S T I O N S
THANK YOU FOR YOUR TIME AND ATTENTION!
ANY QUESTIONS, THOUGHTS, FEEDBACK?

© MERCER 2015 42
N E X T S T E P S
– Download the Executive Summary on “2015/2016 U.S.Compensation Planning Survey Report.”
– Purchase the detailed research of Mercer’s total rewardsbenchmarking resources - Mercer’s 2015 US CompensationPlanning Report
Mercer’s 2015 US Compensation Planning Report1-800-333-3070 or www.imercer.com/cps
Mercer’s Incentive Plan Design Survey1-800-333-3070 or www.imercer.com/ipd
Mercer Benchmark Database Survey1-800-333-3070 or www.imercer.com/mbd
Mercer’s Global Compensation Planning Report1-800-333-3070 or www.imercer.com/gcpr

© MERCER 2015 43