frequently asked questions - partekpartek.com/tutorials/docs/frequentlyaskedquestions.pdfpartek –...
TRANSCRIPT
Partek – Frequently Asked Questions 1
Frequently Asked Questions
These Frequently Asked Questions are some of the more common questions our
customers ask. Questions are divided into several categories for ease of use. If you
do not find the answer you are looking for, please contact our Technical Support
Team by phone at +1-314-878-2329 (between 8 am – 5 pm U.S. Central Time), or
by email ([email protected]) at any time. We strive to answer all support
requests within 24 business hours.
Select a category from the list below:
Import
Interplatform Comparison
Batch Remover
Hierarchical Clustering
Genomics
o Copy Number
o Allele Ratio
o Exon
o Gene Expression
o Tiling
Next Generation Sequencing
o Import Criteria
o ChIP-seq
o RNA-Seq
Visualization
Computer Specifications
Statistics
Project
Partek – Frequently Asked Questions 2
Import
Question: I am having problems getting my data into Partek, what steps
should I take?
Answer: Choose File > Import, choose the appropriate format of your data, and
follow the import wizard. Please see Help > Online Help > Chapter 4 for detailed
information.
Question: How do I import Affymetrix library files?
Answer: Partek automatically downloads the appropriate library files and
annotation files if you are importing Affymetrix CEL files.
Question: How do I import annotation files?
Answer: Partek automatically downloads the appropriate annotation files when you
import Affymetrix CEL files. Annotation information will be automatically
associated with genomic data. ILMN annotations are automatically handled and
associated with using the Partek BeadStudio plug-in. Generally, to associate a
specific annotation file to a spreadsheet, choose File > Properties of the current
spreadsheet, use the Browse button to select the annotation file in the Choose chips
and annotation files panel. Detailed information can be found at the following
link:http://www.partek.com/Tutorials/microarray/User_Guides/AddAnnotation.pdf.
Question: I am having difficulty importing my sample information, what does
the Add Column do?
Answer: Add column will insert a column into the current spreadsheet. Typically,
users should define the type as “categorical” and the attribute as “factor” when
applying sample information into a genomic experiment. Detailed information can
be found at the following link:
http://www.partek.com/Tutorials/microarray/User_Guides/CreatingSampleInfoFile.
pdf.
Question: Is GC correction the same as GC RMA?
Answer: No. Partek’s GC adjustment uses a model fit on all imported probes to
remove the effects of GC content on probe-level intensities. If a user desires GC-
RMA, then they may simply select that algorithm during import.
Question: What aligners does Partek support?
Answer: ELAND, SOAP, SOLiD Whole Transcriptome Analysis Pipeline (WTAP
- produces "max" files), MAQ, SHRiMP, BOWTIE, TOPHAT
Other: Any tab delimited files containing Chromosome, Start Position, Strand, and
Sequence. (i.e. chr1 100 + actgtactaactaga)
Partek – Frequently Asked Questions 3
Question: Can I import and analyze my raw sequencing data in Partek?
Answer: Partek can align reads to the genome from fasta and fastq formats. Partek
uses the Bowtie program, which is one of the fastest short read aligners available.
Question: During import, Partek asks me “does reverse reads match forward
strand?” How should I make the choice?
Answer: The sequencing read can be written as it was read by the sequencer, or be
reverse complemented so that reads from the reverse strand match the forward
strand sequence. How the read is written depends on the aligner. Partek will
automatically make the correct choice if you specify the common aligners that we
support. If you want to specify it yourself or you are using other format of aligned
files, manually choose “yes” or “no” based on your knowledge.
Question: Do I need to set any filter to the aligned reads if I only want to
analyze uniquely mapped reads?
Answer: No filtering is necessary because Partek only deals with those reads that
are uniquely mapped.
Question: I used both Partek and Affymetrix Expression Console to import the
same .CEL files with the same RMA algorithm, I got different results. Why is
that?
Answer: there could be several possible causes:
If the results match 6-7 significant digits, that might be computer floating
point precision issue
Expression Console might be using sketch, which is an approximation of
quantile normalization. While Partek always uses the full quantile
normalization.
Expression Console and Partek might use different library and/or annotation
files, which may have different number of probes. Different number of
probes will result different answers in RMA.
For Exon arrays, to import core/extended/full probe sets, Express Console
uses .ps file. While Partek uses .mps file in order to perform Alt-splicing
Anova. That might result in different number of probe sets and different
signal numbers.
Question: How to import Expression Console results in Partek?
Answer: Expression Console generates .CHP files, which can be imported in
Partek.
Question: After import, Partek’s QC box plot is different from Affymetrix®
Express Console™ box plot. Why is that?
Answer: Partek box plot shows the 0th
, 25th
, 50th
, 75th
, and 100th
percentile, which
correspond to min, Q1, median, Q3, and max. While Affymetrix box plot shows
Lower Extreme, Lower Quartile, Median, Upper Quartile, and Upper Extreme.
Partek – Frequently Asked Questions 4
Question: Why Partek GCRMA output is different from Bioconductor’s?
Answer: If you run the following 4 steps in R, it should reproduce Partek’s values:
1.Sys.setlocale("LC_COLLATE", "C")
2.data.bgadj <- bg.adjust.gcrma(data,affinity.source="local")
3.data.expr <- rma(data.bgadj,background=FALSE)
4.the values in exprs(data.expr) should be the same as Partek’s
There are other possible causes, for example:
1. The order of the CEL files are different. E.g. 1.CEL, 2.CEL, and 3.CEL will
produce different numbers than 3.CEL, 2.CEL, and 1.CEL
2. Sys.setlocale("LC_COLLATE", "C") was not set in R
3. Bioconductor and Partek are using different library files. E.g. if the CDF file or
the chip sequence file are different, the result will be different.
Interplatform Comparison
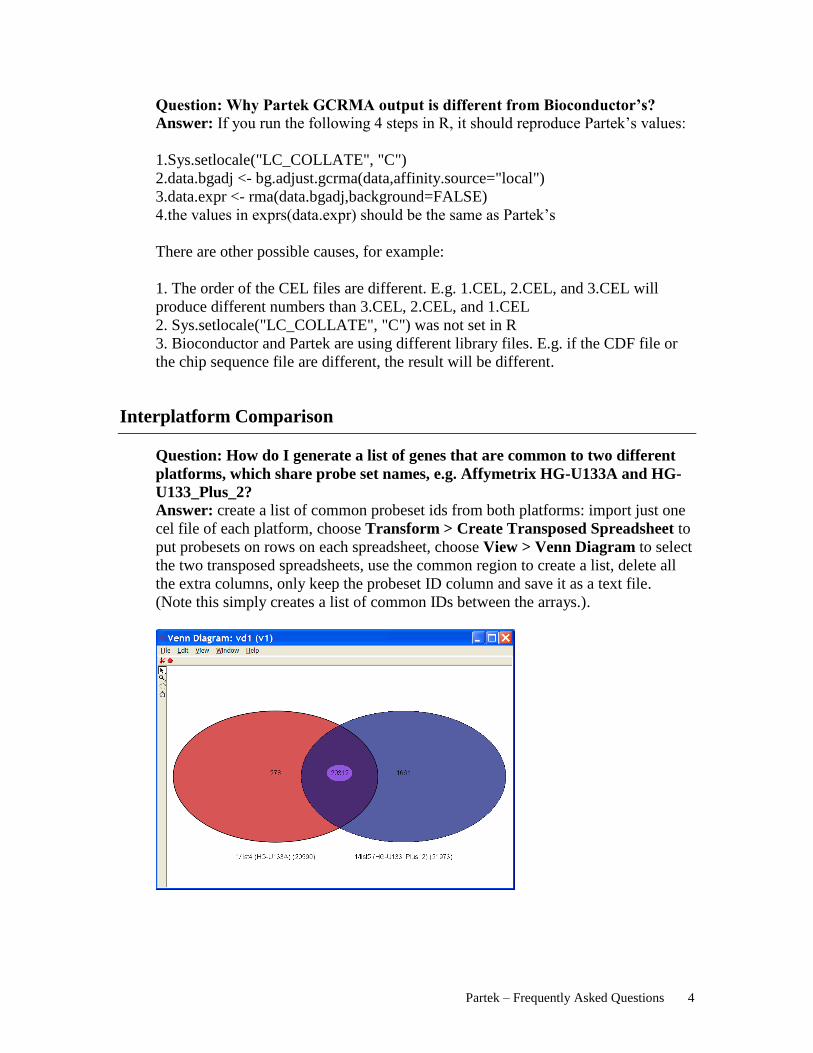
Question: How do I generate a list of genes that are common to two different
platforms, which share probe set names, e.g. Affymetrix HG-U133A and HG-
U133_Plus_2?
Answer: create a list of common probeset ids from both platforms: import just one
cel file of each platform, choose Transform > Create Transposed Spreadsheet to
put probesets on rows on each spreadsheet, choose View > Venn Diagram to select
the two transposed spreadsheets, use the common region to create a list, delete all
the extra columns, only keep the probeset ID column and save it as a text file.
(Note this simply creates a list of common IDs between the arrays.).

Partek – Frequently Asked Questions 5
Question: How do I import data from two different platforms, e.g. Affymetrix
HG-U133A and HG-U133_Plus_2, using the same probe model for a model-
based algorithm (e.g.,GCRMA)?
Answer: 1) First, create a list of common probeset ID of the two platforms.
2) Import the data from the array with greater density (more genes). On the
Advanced Import Options page, choose the Include From File option for Probe
Filtering at the top of the dialog to include the list created.
3) Choose GCRMA Background Correction option for Background Correction
4) Choose Quantile Normalization-Save Distribution in the Quantile
Normalization drop-down list, and specify a name for the file.
5) Import this data in a spreadsheet
6) Import the second less dense data set, by choosing the same setting for Probe
Filtering and Background Correction.
7) Choose Quantile Normalization -Load Distribution and specify the saved
distribution file.
8) The data will be imported into the second spreadsheet.
The two spreadsheets should have same number of columns, since they both are
using the same gene list to filter during import, the order of the gene column should
be the same.
9) Choose File > Merge spreadsheet > Append Row
Batch Remover
Question: At a high level, what is the batch remover doing? Answer: Removing the biases due to unwanted effects due to factors such as
processing batches.
Question: What analytical processes should I use with batch removed data? Answer: Batch remover is primarily designed for the visualization of data where
the biological patterns might otherwise be obscured by unwanted batch effects.
Question: After I remove a batch effect from the data, is it OK to perform a
simpler statistical test, which omits the batch factor (e.g. a simpler ANOVA
model or t-test). Answer: No. ANOVA already adjusts for batch effects and does not need the data
to be adjusted. Performing statistical tests on batch effect adjusted data will result in
p-values that are too small, due to the failure to account for the degrees of freedom
consumed during batch effect removal.
Question: Is it OK to perform exploratory analysis such as PCA or cluster
analysis on batch effect adjusted data? Answer: Yes. Since these methods do not produce formal p-values, and cannot
account for batch effects like ANOVA, true biological effects will be more evident
after unwanted (batch) effects are removed.
Partek – Frequently Asked Questions 6
Question: Does the batch remover actually change the expression values? Answer: Yes. The values are adjusted to what they would have been had there been
no batch effect. Other signals and noise remain in the data.
Hierarchical Clustering
Question: How do I make a quick Hierarchical Cluster visualization?
Answer: Use the “Cluster based on significant genes” function in the gene
expression workflow. If you’d like to cluster using different parameters, you can
use the tmp spreadsheet generated from the workflow as input, while selecting
Tools > Discover > Hierarchical Clustering.
Question: How do I adjust the view, add labels, or standardize my clustering
data?
Answer: In the cluster viewer, choose Edit > Plot Properties. On the Style page,
you can configure the viewer; on the Rows & Columns page, change the Axis Labels
from off to any other options to add labels for row or column dendrograms.
To standardize the clustering only on the viewer, you can choose Edit >
Standardize Intensity Plot from the menu of the viewer to make the mean as 0 and
standard deviation as 1 for all the columns.
Question: Why do I run out of memory on >~30k elements?
Answer: To do hierarchical clustering on 30K elements requires at least ~3G of
RAM just for itself, if you don’t have enough RAM, you can choose to do 2 pass
option for the Clustering method on the dialog.
Genomics
Copy Number
Question: Why is quantile normalization not selected as a default option
during import CEL files on copy number workflow?
Answer: Quantile normalization does not work well when the assumption of
identical distributions is violated. We do not recommend using quantile
normalization on any samples that are expected to have any significant amount of
variation from true biological signal (cancer samples for example). In addition, we
have not seen large improvements in performance when using quantile
normalization.
Question: Should I smooth my copy number data?
Answer: Smoothing is not necessary for many analysis algorithms. Visual
smoothing is applied in the chromosome view by a median sub-sampling. Region
detection algorithms such as HMM or genomic segmentation have models that
expect a level of noise in the data. Smoothing may be useful for some analysis such
as clustering.

Partek – Frequently Asked Questions 7
Question: What do the gray & colored dots on the Copy Number Summary
mean?
Answer: The gray dots represent the raw copy number estimate at each marker.
These are represented as the values on the copy number spreadsheet. The colored
dots are the smoothed value of a variable number of copy number estimates across a
given stretch of linear chromosome. The sampling rate is disclosed in the
visualization and is dependent on the size of the window and the resolution of the
computer monitor.
Question: How do I get cytobands on the Chromosome View?
Answer: Please download the cytoband.txt file from UCSC at
http://hgdownload.cse.ucsc.edu/downloads.html
On a copy number spreadsheet in Partek, choose File > Properties, click on the
Edit Genome button, browse to the cytoBand.txt file you downloaded for the
Cytoband file entry.
Question: How do I monitor the density of genetic markers from a segment
result? I would like to filter out segments that are close to the centromere.
Answer: Right click on the # Markers column header, and insert a new column.
Right click on the # Marker column header and copy, paste to the new inserted
column, and rename the label as Density.
Select the Density column and go to Transform > Normalization & Scaling,
choose to perform on selected column, and select the Add/Mul/Sub/Div page,
choose Divide by Column of the length(bps), and select OK. The resulting column
is Marker/Region length, and you can filter regions based on this column to exclude
small numbers, e.g. 0.0002 for SNP5, which would indicate a centromere region.
Question: Does Partek software use both CNV and SNP probes on SNP5 and
SNP6?
Answer: Yes, Partek uses both CNV and SNP probes for copy number analysis.
However, two separate annotations files are required and automatically
downloaded.
Question: How do I visually combine or compare different array platforms
within Partek (e.g. 500K/SNP6, Affymetrix/Illumina/Agilent)?
Answer: Import the data from different platforms into different spreadsheets and
draw a chromosome view. In the Plot Properties dialog, choose the Profiles page to
add a profile of each data from each platform.
Question: Why allele ratio spreadsheet contains fewer number SNPs than
assayed on the array?
Answer: When Partek creates an allele ratio baseline from a reference population,
we only consider the SNP informative if it satisfies some quality criteria. The most
restrictive is that for each SNP, 2 samples are required for each possible genotype.
Partek – Frequently Asked Questions 8
This means that to cover the three possible genotypes in at least 6 samples are
needed. Only for those few SNPs for which each genotype is represented at least
twice will allele ratio be calculated. Omitted SNPs may also not display confident
segregation clusters in the baseline files and were consequently omitted.
Question: What is allelic imbalance?
Answer: Allelic imbalance is a measure of how disproportionate the allele specific
copy number (AsCN) estimates are relative to each other. This is expressed in
Partek as a proportion calculation where the proportion equals the difference of A
and B over the sum of A and B. For example, if the alleles are present in equivalent
abundance (A=1 and B=1), the alleles are balanced and the proportion would be
near zero. If the alleles are in disproportionate abundance relative to each other,
then the proportion calculation would move close to 1. A and B alleles can also be
referred to as max and min alleles.
Question: How does Partek calculate whether a segmentation is considered
within normal bounds?
Answer: After determining the segmentation result, two one-sided t-tests are
performed on probes in each region detected. Specifically, the population of
probesets within each region is compared to the upper and lower bounds set in the
segmentation parameters. You may set the minimum number of probes for each
detected region as a parameter on the segmentation dialog.
Question: Why are the max and min track of allele specific copy number
estimates not both at one in normal regions?
Answer: Observed allele number lies on a distribution. Since one allele is always
observed to be greater than the other, in regions of equal allele expression two close
parallel lines are seen. As the copy number estimates of each allele grow farther
apart, the assignments are affected less significantly by the noise of observed allele
expression.
Question: When should I use Allele Specific Copy Number (AsCN) vs. Total
Copy Number?
Answer: AsCN was designed to analyze experiments using primary tumor
samples. We generally recommend that you perform both analyses if appropriate.
The AsCN workflow gives additional information, but it may not create informative
data depending on your experiment design. Generally, if you have paired
tumor/normal types of designs, AsCN gives good estimates. If you have unpaired,
mixed tissue tumors, AsCN gives reasonably useful information. If you have an
unpaired analysis examining germ line changes (pure tissue, no heterozygosity in
regions of interest), AsCN does not produce useful information. Only heterozygous
calls are used for AsCN. In paired analysis, the genotypes from the normal are used.
For unpaired samples, AsCN uses genotype calls of the study sample to determine
when data is available. If the study samples have pure deletions, they will not have
heterozygous calls, leading to large stretches of missing data.

Partek – Frequently Asked Questions 9
Question: When should I use HMM vs. Genomic Segmentation?
Answer: HMM is very efficient as far as speed; however, it is not very accurate in
terms of sensitivity or specificity. HMM may be capable of detecting smaller
regions than the segmentation algorithm; however, this comes at a cost of more
false positives. Generally, genomic segmentation is easier to configure, provides a
p-value to sort the resulting table, and is easier to describe the regions of interest.
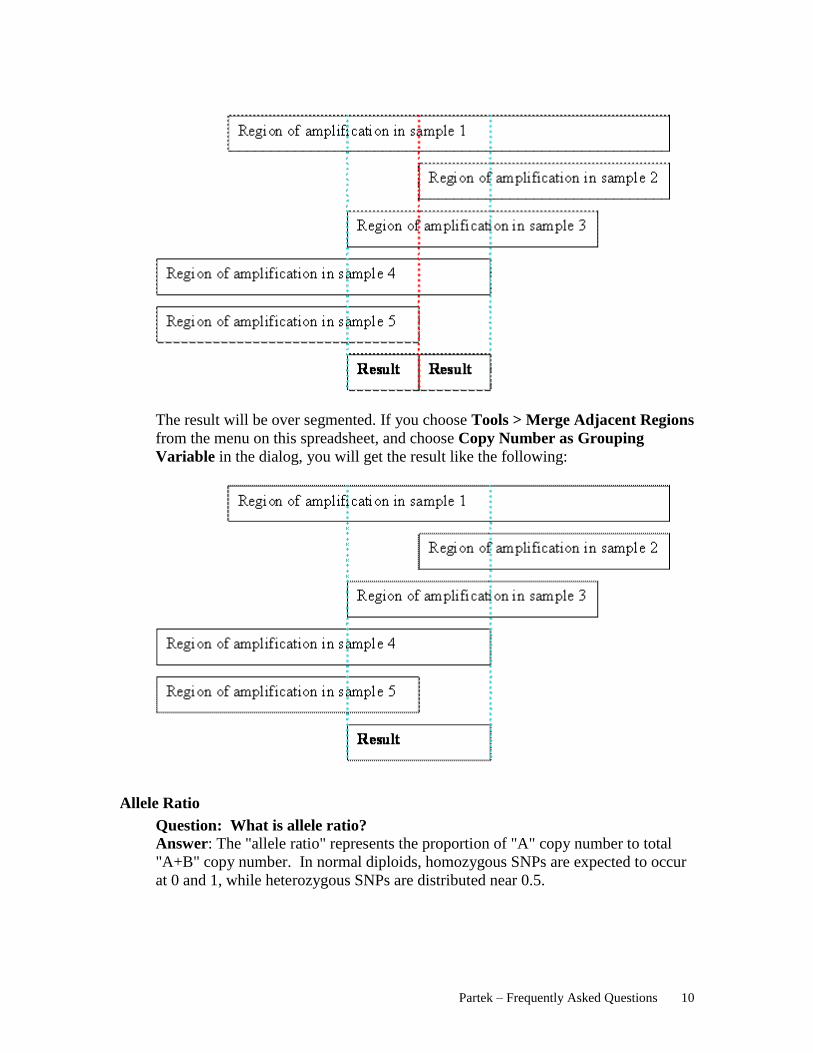
Question: When I perform “Find Regions in Multiple Samples”, why are some
of the regions shorter in length than specified?
Answer: In short, it’s due to how segments with differing overlaps are combined.
Here is an example of finding a region meet the criteria in 5 samples:
When you find regions in multiple samples, Partek will combine all the segment
breakpoints from all the samples:
When you find regions in at least 4 samples, the result will look like the following
graph:
Partek – Frequently Asked Questions 10
The result will be over segmented. If you choose Tools > Merge Adjacent Regions
from the menu on this spreadsheet, and choose Copy Number as Grouping
Variable in the dialog, you will get the result like the following:
Allele Ratio
Question: What is allele ratio?
Answer: The "allele ratio" represents the proportion of "A" copy number to total
"A+B" copy number. In normal diploids, homozygous SNPs are expected to occur
at 0 and 1, while heterozygous SNPs are distributed near 0.5.

Partek – Frequently Asked Questions 11
Question: Why are intensities used as input and not allele calls? Isn’t this a
single sample calculation based on genotype calls?
Answer: The genotype call will not give the information necessary to calculate
allele ratio. The intensities of individual genomic markers are required.
Question: Why does Partek use a baseline file for allele ratio calculation?
Answer: Historical baseline data (e.g. 270 HapMap samples) allow Partek GS to
estimate bias in A and B intensities that is used to reduce noise.
Question: How does allele ratio change in regions of abnormal ploidy?
Answer: In deleted or amplified tissue, the balance of alleles causes distributions
to deviate from these values. For example, an allele ratio of .33 in the presence of 3
total copies indicates ABB, and an allele ratio of .67 in the presence of 3 total
copies indicates AAB.
Question: How do I interpret allele ratio in context of total copy number data?
Answer: Using allele ratio in combination with total copy number can help
researchers have higher confidence in regions of amplification or deletion. Allele
ratio provides the best supporting evidence when changes tend to be clean integer
changes of 2 to 3 or 2 to 1. The normal diploid tri-mode distribution with peaks at
0, 0.5 and 1.0 will change to a quad-mode distribution (0, 0.33, 0.67, & 1.0) with a
gain to three copies or to a bi-mode distribution (0 & 1.0) with a loss to one copy.
Question: What reference can I use for my publication?
Answer: While the intensity normalization is performed differently, the
calculations are based on the following reference:
High-resolution genomic profiling of chromosomal aberrations using Infinium
whole-genome genotyping. Peiffer et. al. Genome Res. 2006 Sep;16(9):1136-48.
Epub 2006 Aug 9.
Question: I’m using the Illumina platform, how should I calculate allele ratio
in Partek?
Answer: Partek recommends that you import the B allele frequency from
BeadStudio using the Partek plug-in module to extract data from BeadStudio into
Partek
Genomics Suite™.
Exon
Question: Within an exon data table, how do I get a gene symbol from a
gene_assignment?
Answer: Right click on the gene-assignment column header to choose Split
Column. Use “ // ” as a delimiter to split the column; the second field contains the
gene symbol.
Note: Partek 6.4 and newer will automatically parse this information out.
Partek – Frequently Asked Questions 12
Question: How can I tell if an exon has been omitted from the analysis due to
low intensity? Note: use must specify the option to exclude an exon due to low
intensity.
Answer: On the Alt-splicing result spreadsheet, right click on a row header (a gene)
to draw a Gene View. The exons that are translucent are the ones skipped during the
computation.
Question: Why are some probesets on my Exon/Gene array not imported?
Answer: Partek uses a meta-probeset file (.mps) to filter probesets, which include
only core, extended or full. By default, only the core probesets are imported. This
can be changed in the Advanced dialogue during import. Partek also does not
import control probesets, which do not have a cluster ID. Some probesets are
marked core/extended/full, but they are not included in the core/extended/full .mps
file because they are more likely to splice abnormally though there are other
possible reasons. You might want to contact Affymetrix support for more detailed
information.
Question: While the actual expression levels between the two groups are
strongly overlapped, the error bars shown in the AS graph somehow indicate a
significant difference between the two groups, which is not true. Moreover, we
note that the heights of the error bars are the same across all transcripts.
Answer: The error bars on the AS graph are the standard errors of the Least Square
Means (LS Means) for each probeset, which are dependent on all the factors in the
ANOVA model. Due to the complexity of the ANOVA model and the least square
estimates used to detect alternative splicing, the standard error is estimated to be
very small and consistent across probes. The standard error may not be a good
representation of the confidence of your data.
Gene Expression
Question: How do I create a gene list?
Answer: Select Tools > List Manager, specify the criteria, such as p-value and
fold change etc. Select items to be included in the list, name the list, specify the
location, and select OK.
Tiling
Question: How does the annotation work in tiling datasets?
Answer: Tiling probe ID represents its genomic location.
Question: My tiling data analysis seems to be taking a long time, what is
happening?
Answer: Tiling array analysis tends to be a computationally intensive task.

Partek – Frequently Asked Questions 13
Next Generation Sequencing
Import Criteria
Question: What is the criteria Partek uses to import my sequencing reads?
Answer: Partek imports all reads that have been aligned. A read is counted once,
even if it has multiple alignments. Currently, Partek only supports paired-end
reads that contain at most one alignment per end. If both ends of a paired-end
read map to the same sequence, then the ends are imported as one paired-end
read. If the ends map to different sequences or if one of the reads is unmapped,
then the ends are imported independently (if mapped) as single-end reads.
Question: How does Partek count the number of alignments?
Answer: Reads can be aligned to more than one location. Since Partek only
imports aligned reads, the number of alignments will always be greater than or
equal to the number of reads. If the number of reads equals the number of
alignments, then each imported read is aligned to exactly one location. A paired-
end read with both ends mapped to the same sequence is counted as one
alignment. If the ends are mapped to different sequences, the ends are counted as
two separated alignments. If one end is unmapped, the mapped end is counted as
one single-end alignment.
ChIP-Seq
Question: How does Partek detect peaks in the CHIP-seq work flow?
Answer: Partek traverses the reads in order and locates coverage that is above the
use-defined threshold. It then finds the endpoints of the regions by taking the
median of the forward reads (left endpoint) and the median of the reverse strands
(right endpoint). The reason that we refine the boundaries of the region from the
median of the forward reads to the median of the reverse reads is because we are
really interested in the region between the two peaks rather than between the
trailing edges of the peaks.
Question: In CHIP-seq workflow, I set up the threshold of peak detection as
10. Why sometimes I see numbers smaller than 10 showed up in the
spreadsheet column 8 “number of reads that begin in the region for each
sample”?
Answer: This is because you set “directionally extend tags” in your peak detection
dialogue. The peaks come from the extended reads and the read counts come from
the original reads.
Question: Will “peak threshold” setting affect the result? How should I set up
a proper threshold?
Answer: You can always set the threshold conservative (low) and filter later based
on p-value. An often used threshold is 10.
Partek – Frequently Asked Questions 14
Question: In the “detecting motifs” dialog, should the “number of motifs”
always set to one?
Answer: Because any given DNA binding protein has only one core binding motif,
one is probably a good choice. If you are looking for two half-sites, then you would
choose two.
Question: In the “detect motifs” dialog, the changes of “minimum motif
length” and “maximum motif length” have great impact on the motif
prediction. Any recommendations to these two settings?
Answer: Most binding sites are between 6 and 16 bases long. The Partek default
setting is 6 to 16. We don’t recommend trying something less than 6, but more than
16 should be fine.
Question: When using a known database it asks you to specify a 2 bit file but
there is no dialogue box to input it into.
Answer: Partek should automatically download the 2bit file. However, if it is not
working, you can also manually download the hg18.2bit file from
http://hgdownload.cse.ucsc.edu/goldenPath/hg18/bigZips/. Within Partek, go to
Tools > File Manager. Where it says Please Specify Files For:, select Homo
sapiens (assuming you are running an experiment on human samples). In the tab
where it says Genome Sequence .2bit, specify the location of your 2bit file.
RNA-Seq
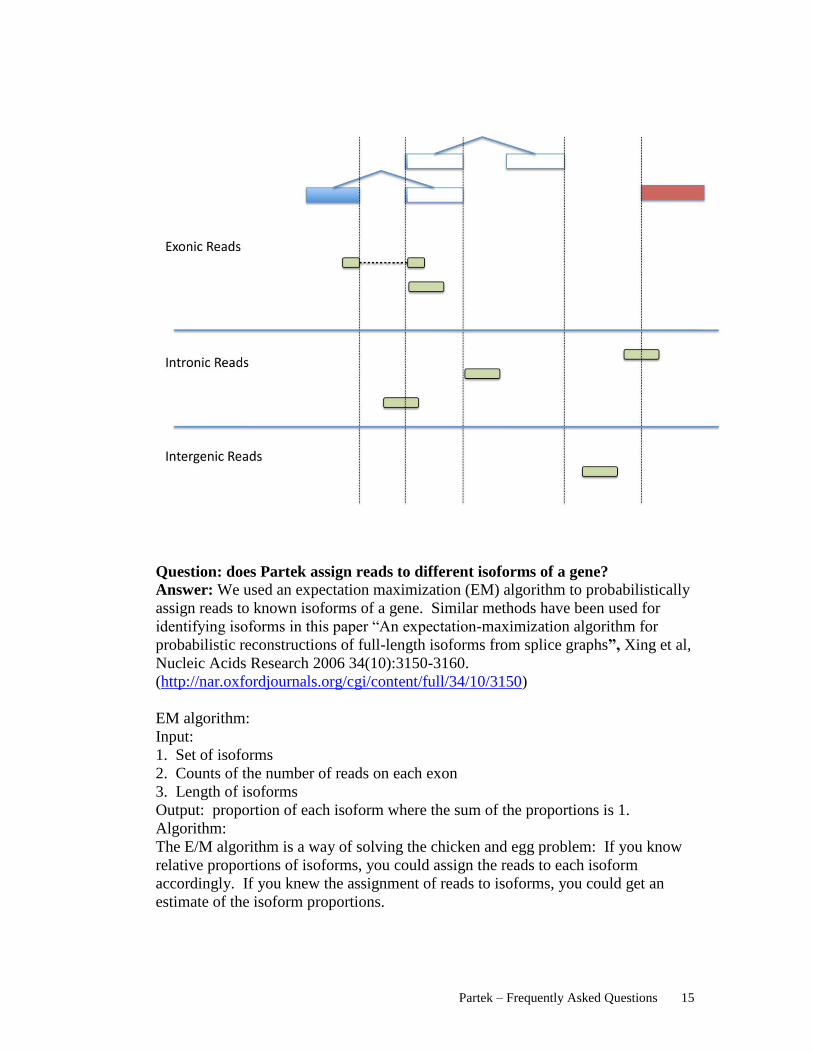
Question: How does Partek assign reads to Exonic, Intronic or Intergenic regions?
Answer: Given a list of transcripts, each read can be assigned to one of three classes:
Exonic, Intronic, or Intergenic. Exonic means the read came from the transcriptome.
Intronic means the read overlaps a gene but includes bases outside of the transcriptome.
Intergenic means the read came from a region outside of any gene. The criteria to assign
the reads are as follows:
Exonic
A read is labeled exonic if any one of its alignments is completely contained
within a transcript. If the alignments are strand-specific, then the strand of
the alignment must also agree with the strand of the transcript.
Intronic
A read is labeled intronic if any one of its alignments overlaps a gene, but
none of the alignments are exonic. If the alignments are strand-specific,
then the strand of the alignment must also agree with the strand of the
transcript.
Intergenic
A read is labeled intergenic if none of its alignments overlap a gene.
See figure below for examples of exonic, intronic, and intergenic reads.
Partek – Frequently Asked Questions 15
Question: does Partek assign reads to different isoforms of a gene?
Answer: We used an expectation maximization (EM) algorithm to probabilistically
assign reads to known isoforms of a gene. Similar methods have been used for
identifying isoforms in this paper “An expectation-maximization algorithm for
probabilistic reconstructions of full-length isoforms from splice graphs”, Xing et al,
Nucleic Acids Research 2006 34(10):3150-3160.
(http://nar.oxfordjournals.org/cgi/content/full/34/10/3150)
EM algorithm:
Input:
1. Set of isoforms
2. Counts of the number of reads on each exon
3. Length of isoforms
Output: proportion of each isoform where the sum of the proportions is 1.
Algorithm:
The E/M algorithm is a way of solving the chicken and egg problem: If you know
relative proportions of isoforms, you could assign the reads to each isoform
accordingly. If you knew the assignment of reads to isoforms, you could get an
estimate of the isoform proportions.
Partek – Frequently Asked Questions 16
The algorithm works by first guessing the isoform proportions (say 1/n where n is
the number of isoforms). Then, reads are assigned to each isoform based on the
proportions. The reads mapped to the isoforms are then used to estimate the
isoform proportions.
Question: What is RPKM value?
Answer: RPKM value is reads per 1k bases of exon model per million mapped
reads. It is defined in the paper “Mapping and quantifying mammalian
transcriptomes by RNA-Seq” Mortazavi et al, Nature Methods, 2008.
(http://www.nature.com/nmeth/journal/v5/n7/abs/nmeth.1226.html)
Question: How does Partek calculate differentially expressed transcripts?
Answer: Partek uses Log-likelihood ratio test to identify genes with different
relative abundances of isoforms across samples (In-house method), similar to the
one discussed in the paper “RNA-seq: An assessment of technical reproducibility
and comparison with gene expression arrays”, Marioni et al, Genome Research,
2008. (http://genome.cshlp.org/content/18/9/1509.full)
Question: How does Partek calculate fold change of two transcripts between
two contrast groups?
Answer: The fold change was calculated as the ratio of RPKM values between two
contrast groups.
Question: What are paired-end reads? Does Partek support them? If so,
where do we tell the software that these samples used paired end reads?
Answer: When prepare samples for sequencing, standard paired-end libraries (200–
500 bp) or long-insert (2-5kb) mate pair libraries can be prepared to detect large and
small insertions, deletions, inversions, and other rearrangements. The term 'paired
ends' refers to the two ends of the same DNA molecule in the library when you
sequence one end, then turn it around and sequence the other end. Partek will
support paired end reads in the next beta version. The software will automatically
recognize the set of files that contains the paired end reads and import them.
Question: What is paired-gap?
Answer: In Partek visualization, we name the gap between a paired-end reads as
paired-gap. This is to distinguish from the splice junction between exons.
Question: What source does Partek use for transcript annotation?
Answer: Partek uses UCSC ref-seq ID for transcript annotation.
Question: Does Partek handle non-human species sequencing data?
Answer: Yes, Partek handle human and non-human species in next-gen sequencing
data analysis. As long as the genome sequence data and the annotation file is
available.
Partek – Frequently Asked Questions 17
Question: At the RNA seq dialogue at finding differentially expressed
transcript, we can choose if assay recognize sense strand or antisense. What
are the outcomes we can expect if we choose yes or no on this dialogue?
Answer: It is depends on the sample preparation. Some preparations will preserve
strand information of the original transcript, like Illumina’s directional RNA-seq, or
the SOLiD™ Whole Transcriptome Analysis Kit. When cDNA was prepared from
the RNA sample, only 1st strand cDNA was synthesized. On the other hand, some
preparation will reverse transcribe the mRNA into double stranded cDNA. In this
case, the sequence was read from both sense and antisense strand, and was not
discriminated between them. The biologists who prepare the sample should know
that information from the kit they are using. If you select yes, on the genome
browser you can see all the reads from a single transcript is either on sense or on
antisense strand (as indicated by two different colors), comparing to choice “no”,
you can see mixed reads from both strand on the same transcript.
Question: I’ve noticed that Partek can display positive strand reads on one
track and negative strand reads on another track. How do I enable this in my
analysis?
Answer: As long as you make the right choice on the question of “Can assay
discriminate between sense and antisense strand?”, Partek has the ability to
automatically detect the reads that come from the positive strand or the negative
strand, and display and analyze strand-specific sequencing result.
Question: Are the unexplained peaks mapped reads? How do we map the
reads to the unexplained regions?
Answer: Yes, unexplained peaks are absolutely mapped reads. They are mapping
to the genome, but not the transcriptome. This shouldn't be confused with junction
reads as that actually won't map into genome sequence. And we don't map these
reads to unexplained regions, we run a peak finding algorithm to find a "pile" of
reads in genomic space which does not map to any known transcripts, and then
visualize them on a track next to your predicted transcript.
Question: It seems that the unexplained regions can come from a far away
gene from where is currently located. Can we know where this unexplained
region was originally from?
Answer: No, that's the "unexplained" part. It simply signifies that some RNA is
being transcribed from this genomic location.
Question: Can Partek detect fusion genes?
Answer: Currently the system is designed to count reads into a predefined
transcript space. So Partek does not have an obvious mechanism to count the
enormous possible combination of fusion genes that are possible.

Partek – Frequently Asked Questions 18
Visualization
Question: How do I create a Venn diagram?
Answer: Select View > Venn Diagram and browse to the folder that contains the
lists you want to include in the Venn diagram. Select 2 or 3 list in the folder and
click on the Venn diagram button. Alternatively, invoke a Venn diagram from the
List Manager when selecting 2 or 3 lists. You cannot create a Venn diagram from 4
or more lists, but you can perform a union or intersection between multiple lists.
Question: Partek is crashing when invoking a scatter plot (or histogram,
chromosome view, etc). What can I do?
Answer: The most common cause of this type of crash is out-of-date drivers.
Updating your graphics card drivers will usually solve this problem. To get
information on your current drivers select Help > Graphics Information. An
information box similar to the one shown in Figure 1 will appear.
Figure 1: Graphics Information for an ATI card
For desktop computers you should check for updated drivers on the website of the
manufacturer of the graphics card.
If the vendor is ATI Technologies Inc., check:
http://ati.amd.com/support/driver.html
If the vendor is NVIDIA Corporation, check:
http://www.nvidia.com/content/drivers/drivers.asp
For laptop computers you should check the site of the manufacturer of the laptop.
Computer Specifications
Question: What single hardware investment will give the biggest performance
boost to Partek?
Answer: Faster hard drives.
Question: What kind of computer should I buy to run Partek?
Answer: For high density arrays, we recommend a 2 gigahertz CPU and 2
gigabytes or RAM. At Partek, we use a machine with similar specs to benchmark
most of our tutorial data. It is likely a computer less powerful will still work,
especially if not using high density arrays.
Question: What operating systems does Partek support?
Answer: Partek will run on Windows, Macintosh, and Linux. Linux seems to have
a slight edge in performance, particularly during import.
Partek – Frequently Asked Questions 19
Question: Does Partek leverage the benefits of multi-core processors?
Answer: Partek is a single threaded process; it cannot take advantage of multi-core
CPUs. While there may be a slight boost to performance in a quad core processor,
the benefits might not outweigh the expense.
Question: How much RAM can Partek handle in 32 bit Windows XP/Vista?
Answer: 3-4 gigs of RAM. Partek is a 32 bit application, though we are planning
to make it 64 bit in the future. As of right now, somewhere around 3.5 gigs is the
most Partek and 32bit windows can use by default.
Question: Do you have any recommendations for video cards?
Answer: Partek recommends Nvidia video cards. Partek is not a graphics intensive
application, a powerful video card is not necessary. NVidia has the best support for
OpenGL and right now, has been the most stable with Partek.
Question: Any thoughts on hard drive specifications?
Answer: Import and certain other parts of analysis can become very hard drive
bound as the large files are being read. To increase speed at these steps Partek
recommends that you get either a fast 10k RPM hard drive like the Western Digital
Raptor or a similarly fast SCSI drive which you use for only your current project.
Or you can setup a RAID-0 array which will give you access to large amounts of
fast hard drive space, but at the cost of reliability. Partek will run without issue on
current standard issue hard drives. These recommendations are only for researchers
looking for high-performance computing.
Statistics
Question: Why did we get question marks for the p-values of treatment
combination and so did for the contrasts in the ANOVA result spreadsheet?
Answer: There are two reasons could result in the question marks in the ANOVA
result. One is that there are missing treatment combinations when designing the
experiment. The other is there is no replicate for each treatment combination when
conducting the experiment.
Question: What does the question mark mean for LSMean? Answer: It means the LSMean is not estimable. Let L as LSMean matrix.
If 410)( CLHLABS , then L is declared nonestimable. H is the (X'X)-X'X
matrix, and C is ABS(L).
Question: When doing a statistical test like ANOVA, why doesn’t my factor
show up in the candidate list?
Answer: Make sure the sample information column property has the attribute status
defined as “factor”. Right click on the column header, choose Properties, change
the Type to categorical, or it can be numeric, such as scaling factor or age etc, the
attribute is factor, click OK.

Partek – Frequently Asked Questions 20
Question: How do I get the mean of groups (e.g. Tumor vs. Normal)?
Answer: The column of the groups should be categorical, choose Stat >
Descriptive > Column Statistics, select the Group By check button on the dialog,
choose the groups column, and move Mean to the Selected Measures panel and
select OK.
Question: What is the difference between ratio and fold change?
Answer: When comparing two groups, A and B, if A>B, the ratio and fold change
are both A/B; if A<B, the ratio is still A/B, but fold change is –B/A. In less
mathematical terms, increases in gene expression are described as a fold change or
a ratio of +2. But decreases are expressed as a fold change of -2, but a ratio of 0.5.
A negative fold change is a ratio less than one.
Question: How does Partek GS calculate fold change? Why do my fold changes
look unusual?
Answer: Partek’s ANOVA uses LS means to calculate fold-change. When the data
is logged (such as by RMA), the resulting LS means are anti-logged, producing
geometric means. See Chapter 11 of the Partek User Manual for more detail on LS
means and fold-change calculations.
Question: What is the best ANOVA model? What factors should I include?
Answer: It depends on the experiment, you can look at the adjusted R square, the
bigger it is, the better the model fits the data. In general, the factors should be
included are the factors you are interested in; factors contribute big variation, etc. If
an experiment is being run with two categorical variables, like time and dose, it is
often helpful to include the interaction between these factors in the ANOVA model.
Remember for paired designs to include the subject ID which matches paired
samples together to avoid violating the assumption of independence in ANOVA.
For detailed information about your specific data, you might want to ask for a
statistician’s advice.
Question: How do I filter out low expressed genes?
Answer: Select Filter > Filter Columns > Column Filter Manager and choose to
Filter Exclude based on a Max that is less than a certain value.
Question: If I had a parameter TYPE which could be A, B, C, or a D, and if I
did an ANOVA on Type to compare against A and B, I get a p-value (Type)
and p-value (A vs. B). I’m assuming I should look at the p-value(A vs. B)
column to identify differentially expressed genes between Type A and Type B.
Is this right?
Answer: That is correct. The overall p-value tests H0: A = B = C = D. So a small p-
value for type could indicate a difference between A vs. D, C vs. D, etc.
The p-value for (A vs. B) only tests H0: A=B, so it is the p-value you should use to
find the genes specifically different between Type A and Type B.

Partek – Frequently Asked Questions 21
Question: Is there a way to get more detailed information on the linear
contrasts, specifically standard error, t or F statistic, degree freedom? For the
contrast, are they comparing the LSMeans? Answer: Yes, a linear contrast compares the LSMeans. The calculations of standard
error, t or F statistic or degree freedom are the same as LSMean except that L is the
contrast coefficient matrix (See Q2). For example,
Let
L1 = lsmean coefficient matrix of group1
L2 = lsmean coefficient matrix of group2
Then the contrast coefficient matrix L = L1 – L2
Question: How does Partek calculate the LSMean standard errors for both the
REML and method of moments options?
Answer: Model y = Xβ + Zγ + ε,
where y is response variable;
X is fixed effect design matrix;
Z is random effect design matrix;
β is fixed effect parameter;
γ is random effect parameter;
ε is error;
REML
Let L = contrast or LSMean coefficient matrix.
G = variance of random effect parameter - γ
R = variance of residual effect parameter -ε
G = estimate of G
R = estimate of R
C = Cov( ˆ , ˆ ) =
XRZ
XRX
1
1
ˆ
ˆ
11
1
ˆˆ
ˆ
GZRZ
ZRX
Thus,
Standard error = 'ˆLCL
F =)(
ˆ
ˆ)ˆ(
ˆ
ˆ1
Lrank
LLCLL
,
where
N - Rank(X Z) as denominator degrees of freedom, N is the number of
observations; rank (L) as numerator degrees of freedom.
Method Moment
It estimates the sum square as:
222
22
2
110000 )()(...)()()( skkL LrankCSSQCSSQCSSQCCSSE

Partek – Frequently Asked Questions 22
where C = ML, M is the inverse of the lower triangular Cholesky decomposition
matrix of LXZZXL 1)( ; SSQ(C) = trace( CC ).
For each effect in the model, method moment determines the combination of these
expected mean squares that produce an expectation that includes all the terms in the
expected mean square of the effect of interest except the one corresponding to the
effect of interest. For example, if the expected mean square of an effect A*B is
Var(Error) + 3 × Var(A) + Var(A * B).
Method Moment determines the combination of other expected mean squares in the
model that has expectation
)(3)(2 AVarErrorVars
Standard error is 2)'( sLXZXZL
If )(2 ErrorVars (as is often the case in balanced designs), the F test is formed
directly. In this case, the mean square of the effect of interest is used as the
numerator, the mean square of Error is used as the denominator, and the degrees of
freedom for the test are simply the usual model degrees of freedom. When more
than one mean square must be combined to achieve the appropriate expectation, an
approximation is employed to determine the appropriate degrees of freedom
(Satterthwaite, 1946). Refer to Hocking (1985) for further theoretical discussion.
Project
Question: How do I save and open project?
Answer: To save a partek project, go to File > Save Project…, specify a project file.
Partek project manager will go through each spreadsheet and save them into a single
project file with the file extension .ppjx. To open a partek project, go to File > Open
Project…, select the project file in the file browser.
Question: What is the scope of Partek project? What will be saved and what will not
be save to a project?
Answer: Partek project saves the tree structure of your spreadsheets and all spreadsheet
data. Original sample data files (e.g. Affymetrix .CEL files), annotation files, library
files, images, and visualization graphics are not saved.
Copyright 2011 by Partek Incorporated. All Rights Reserved. Reproduction of this material without express written
consent from Partek Incorporated is strictly prohibited.