from automobiles to alternatives: applying attitude theory
TRANSCRIPT

The University of MaineDigitalCommons@UMaine
Electronic Theses and Dissertations Fogler Library
5-2012
From Automobiles to Alternatives: ApplyingAttitude Theory and Information Technologies toIncrease Shuttle Use at Rocky Mountain NationalParkKourtney Kristen Collum
Follow this and additional works at: http://digitalcommons.library.umaine.edu/etd
Part of the Natural Resources Management and Policy Commons
This Open-Access Thesis is brought to you for free and open access by DigitalCommons@UMaine. It has been accepted for inclusion in ElectronicTheses and Dissertations by an authorized administrator of DigitalCommons@UMaine.
Recommended CitationCollum, Kourtney Kristen, "From Automobiles to Alternatives: Applying Attitude Theory and Information Technologies to IncreaseShuttle Use at Rocky Mountain National Park" (2012). Electronic Theses and Dissertations. 1739.http://digitalcommons.library.umaine.edu/etd/1739
FROM AUTOMOBILES TO ALTERNATIVES: APPLYING ATTITUDE
THEORY AND INFORMATION TECHNOLOGIES TO INCREASE
SHUTTLE USE AT ROCKY MOUNTAIN NATIONAL PARK
By
Kourtney Kristen Collum
B.S. Western Michigan University, 2009
A THESIS
Submitted in Partial Fulfillment of the
Requirements for the Degree of
Master of Science
(in Forest Resources)
The Graduate School
The University of Maine
May, 2012
Advisory Committee:
John Daigle, Associate Professor of Forest Resources, Advisor
Laura Lindenfeld, Associate Professor of Communication & Journalism
Mario Teisl, Director, School of Policy & International Affairs

ii
THESIS ACCEPTANCE STATEMENT
On behalf of the Graduate Committee for Kourtney Kristen Collum I affirm that
this manuscript is the final and accepted Thesis. Signatures of all committee members
are on file with the Graduate School at the University of Maine, 42 Stodder Hall, Orono,
Maine.
____________________________________________________________________
Dr. John Daigle, Associate Professor of Forest Resources, April 17, 2012

LIBRARY RIGHTS STATEMENT
In presenting this thesis in partial fulfillment of the requirements for an advanced
degree at the University of Maine, I agree that the Library shall make it freely available
for inspection. I further agree that permission for ―fair use‖ copying of this thesis for
scholarly purposes may be granted by the Librarian. It is understood that any copying or
publication of this thesis for financial gain shall not be allowed without my written
permission.
Signature:
Date:

FROM AUTOMOBILES TO ALTERNATIVES: APPLYING ATTITUDE
THEORY AND INFORMATION TECHNOLOGIES TO INCREASE
SHUTTLE USE AT ROCKY MOUNTAIN NATIONAL PARK
By Kourtney Kristen Collum
Thesis Advisor: Dr. John Daigle
An Abstract of the Thesis Presented
in Partial Fulfillment of the Requirements for the
Master of Science
(in Forest Resources)
May, 2012
This thesis examines potential strategies for increasing voluntary shuttle use at
Rocky Mountain National Park (ROMO) and the gateway community of Estes Park,
Colorado. The first chapter of this two-part study evaluates the impact of a pilot
intelligent transportation system (ITS) on visitor awareness and use of shuttles during the
summer of 2011. Two forms of ITS, dynamic message signs (DMS) and highway
advisory radio (HAR), were evaluated. Specifically, the ITS was meant to influence day-
visitors to park at a new park-and-ride lot just east of Estes Park where they could then
board a connector shuttle and transfer to any of four shuttle routes servicing the town and
park. Surveys were administered onboard the park-and-ride shuttle (N = 68) and at two
locations in downtown Estes Park (N = 490). Our analysis revealed that the DMS
contributed to increased awareness of the shuttles. However, the HAR did not contribute
substantially to awareness or use of the visitor shuttles. Our analysis offers additional
recommendations for increasing voluntary shuttle use, such as providing direct routes

between the park-and-ride and popular park attractions. The results of this study
demonstrate the utility of ITS as a transportation management tool in a national park
setting, but also highlight the importance of selecting appropriate technologies that meet
the needs of park visitors.
The second chapter explores strategies for optimizing the use of ITS by applying
the theory of planned behavior (Ajzen, 1991) to identify the beliefs that inform choice of
travel mode among ROMO and Estes Park visitors. Using results of a mail survey (N =
222), the theory of planned behavior was applied to the prediction of intention and use of
visitor shuttles. Perceived behavioral control was found to have a significant influence on
intention to use shuttles. Past experience with park shuttles was tested as an additional
predictor of behavior and shown to significantly improve the prediction of shuttle use.
Past experience with public transit was also added to the model, but with no significant
contribution, thereby demonstrating the inherent difference between travel behaviors in
everyday settings as opposed to recreation settings. These results were then coupled
with segmentation analysis to identify unique segments of visitors. The segments were
statistically similar in terms of demographic characteristics, yet heterogeneous in their
attitudes, subjective norms, and perceived control regarding shuttle use. Of the three
segments identified, Bus Backers were found to hold the most positive beliefs about
shuttles and Potential Mode-shifters were identified as the segment offering the most
potential for mode change due to their neutral attitudes and beliefs. Strategies were
identified to maintain and improve use of shuttles among these segments. Our study
broadens the application of segmentation analysis to transportation in a park setting and
demonstrates its important contribution.
iii
ACKNOWLEDGMENTS
I would like to thank my advisor, Dr. John Daigle, for guiding me in my graduate
studies and for empowering me to grow from a student to a colleague. His
encouragement and faith in my ability afforded me an exceptional level of professional
involvement while at UMaine. I would like to thank my other committee members, Dr.
Laura Lindenfeld and Dr. Mario Teisl, for offering me their knowledge, insight and
advocacy. Their optimism never failed to give me a renewed sense of confidence in my
abilities. Additional thanks to Dr. Jessica Leahy for her advice throughout my studies
and for helping me with analysis for my second chapter. Also, thank you to Dr. Robert
Wagner for writing me countless letters of recommendation.
I must also thank the staff at the Paul S. Sarbanes Transit in Parks Technical
Assistance Center (TRIPTAC) for giving me the opportunity to work with federal land
management agencies throughout the country, particularly Natalie Villwock-Witte for her
leadership on the ROMO ITS pilot study. Also, thank you to the great people at ROMO
and the Town of Estes Park and to all the volunteers who helped with the project.
I would like to thank the graduate students of Nutting Hall for offering their eyes,
ears and hands on numerous projects, as well as their friendship.
Most of all, I want to thank my family. They have taught me to live with passion
and purpose. Their love and support continually gives me the strength to pursue my
goals. And finally, I must thank Patrick, my unanticipated reward of graduate school.
Your friendship and humor keep me happy and healthy. You are my best love.

iv
TABLE OF CONTENTS
ACKNOWLEDGMENTS ................................................................................................. iii
LIST OF TABLES ............................................................................................................ vii
LIST OF FIGURES ......................................................................................................... viii
LIST OF ABBREVIATIONS ............................................................................................ ix
Chapter
1. EXPLORING THE UTILITY OF AN INTELLIGENT TRANSPORTATION
SYSTEM TO ENCOURAGE SHUTTLE USE AT ROCKY MOUTNAIN
NATIONAL PARK ......................................................................................................1
Introduction ..............................................................................................................1
Literature Review.....................................................................................................3
Historical Context of Automobiles in Parks ................................................3
Legislation in Support of Alternatives .........................................................5
Research on Alternative Transportation Systems ........................................6
Emergence of Intelligent Transportation Systems .......................................9
Methodology ..........................................................................................................12
Study Site ...................................................................................................12
The ITS ......................................................................................................13
Study Design and Sampling Procedures ....................................................15
Questionnaires............................................................................................16
Data Analysis .............................................................................................18
v
Results ....................................................................................................................18
Response Rate and Bias .............................................................................18
Characteristics of Respondents ..................................................................19
Awareness and Use of ITS Components ...................................................21
Evaluation of the Highway Advisory Radio ..............................................23
Evaluation of the Silver Route Shuttle.......................................................25
Sources of Information about Shuttles .......................................................27
Effect of Shuttle Use on Visitor Experience ..............................................28
Effect of Past Use on Future Use of Shuttles .............................................29
Discussion ..............................................................................................................30
Conclusions ............................................................................................................38
2. INTELLIGENT TRANSPORTATION AND THE THEORY OF
PLANNED BEHAVIOR: TARGETING POTENTIAL MODE-
SHIFTERS TO INCREASE VOLUNTARY SHUTTLE USE WHILE
RECREATING ...........................................................................................................40
Introduction ............................................................................................................40
Study Context.............................................................................................42
Conceptual Framework ..........................................................................................45
Mode Choice and the Theory of Planned Behavior ...................................45
Building on the Theory of Planned Behavior ............................................48
Segmentation Analysis...............................................................................51
Methodology ..........................................................................................................53
Sampling Procedure ...................................................................................53
Questionnaire .............................................................................................54
TPB Constructs ..............................................................................55
Behavioral Beliefs ..........................................................................56
Behavior and Past Behavior ...........................................................57
Use of Travel Information Sources ................................................57
Data Analysis .............................................................................................58

vi
Results ....................................................................................................................59
Survey Response Rate and Demographics ................................................59
Preliminary Analysis ..................................................................................61
Segmentation Analysis...............................................................................62
Regression Analysis ...................................................................................69
Discussion ..............................................................................................................72
Conclusions ............................................................................................................79
REFERENCES ..................................................................................................................80
APPENDICES ...................................................................................................................86
APPENDIX A. HIGHWAY ADVISORY RADIO MESSAGE SETS .................86
APPENDIX B. SHUTTLE ROUTES ....................................................................88
APPENDIX C. DYNAMIC MESSAGE SIGNS ...................................................90
APPENDIX D. ONSITE SHUTTLE SURVEY ....................................................91
APPENDIX E. ONSITE VISITOR SURVEY ......................................................95
APPENDIX F. MAIL SURVEY ...........................................................................99
APPENDIX G. SURVEY MAILINGS ...............................................................106
APPENDIX H. INTERVIEW PROTOCOL FOR VISITOR SURVEY .............109
APPENDIX I. INTERVIEW PROTOCOL FOR SHUTTLE SURVEY ............111
BIOGRAPHY OF THE AUTHOR ..................................................................................113
vii
LIST OF TABLES
Table 1.1. Dynamic Message Sign Message Sets ......................................................14
Table 1.2. Characteristics of Shuttle Survey Respondents ........................................20
Table 1.3. Characteristics of Visitor Survey Respondents .........................................21
Table 1.4. Route Used to Arrive to Estes Park/ROMO .............................................22
Table 1.5. Influence of the Highway Advisory Radio ...............................................23
Table 1.6. Evaluation of the Highway Advisory Radio .............................................24
Table 1.7. Evaluation of the Silver Route Shuttle ......................................................26
Table 1.8. Sources of Information about Shuttles ......................................................27
Table 2.1. Demographic Characteristics of Survey Participants ...............................60
Table 2.2. Visitor Segments .......................................................................................63
Table 2.3. Means and Standard Deviations for Aggregate TPB
Constructs Related to Shuttle Use .............................................................65
Table 2.4. Desirability of Outcomes Associated with Shuttle Use ............................66
Table 2.5. Belief Strength for Outcomes Associated with Shuttle Use .....................67
Table 2.6. Mean Responses for Usefulness of Travel Information Sources ..............68
Table 2.7. Influence of Potential Scenarios on Future Use of Shuttles .....................69
Table 2.8. Hierarchical Logistic Regression of Shuttle Behavior and Intention .......71
Table A.1. HAR Messages without Insider‘s Tip .......................................................86
Table A.2. HAR Messages with Insider‘s Tip ............................................................87
viii
LIST OF FIGURES
Figure 2.1. Theory of Planned Behavior Conceptual Model ......................................47
Figure B.1. Hiker Shuttle Route ...................................................................................88
Figure B.2. Estes Park Shuttle Routes .........................................................................89
Figure C.1. Locations of Dynamic Message Signs ......................................................90
Figure C.2. Dynamic Message Sign .............................................................................90

ix
LIST OF ABBREVIATIONS
ATS Alternative Transportation System
CVB Estes Park Convention and Visitor‘s Bureau
DMS Dynamic Message Sign
HAR Highway Advisory Radio
ITS Intelligent Transportation System
NPS National Park Service
ROMO Rocky Mountain National Park
1
CHAPTER 1
EXPLORING THE UTILITY OF AN INTELLIGENT TRANSPORTATION
SYSTEM TO ENCOURAGE SHUTTLE USE AT ROCKY
MOUNTAIN NATIONAL PARK
Introduction
―Transportation is an integral, defining feature of the national park
experience, and a means by which the park mission of protecting resources
for the enjoyment of future generations can be realized.‖ – The National
Park Service Transportation Planning Guidebook (1999)
Transportation management has emerged as a premier issue facing land managers
in America‘s national parks, wildlife refuges, national forests, and other public lands
(Daigle, 2008; Dilsaver & Wyckoff, 1999; White, 2007). Public lands are experiencing
substantial increases in visitation which has led to increased traffic congestion, wildlife
habitat degradation and air and noise pollution. Traffic congestion and continual
infrastructural development for automobile traffic are two of the most critical issues
presently challenging federal land managers. (Dilsaver & Wyckoff, 1999).
Without transportation systems sufficient to support a growing user population,
many recreation areas are experiencing not only diminished resources, but declining
visitor satisfaction. Included in the mission of the National Park Service (NPS) is the
directive to manage resources so as to provide enjoyment while meeting the needs of
2
future generations of Americans. This directive is not only a key component of the
agency‘s mission, but vital to the survival of federal lands, as it is the passion of
Americans and their connections to these areas that creates a national incentive to
manage and protect them (Louter, 2006).
Over the last four decades several parks, wildlife refuges and national forests have
attempted to address crowding, congestion and resource degradation by implementing
alternative transportation systems (ATS) which combine various travel modes such as
bicycles, buses and hiking trails in order to reduce visitor reliance on private automobiles.
ATS have been successfully implemented at parks across the nation, but there is a need to
promote these systems and convince visitors to switch from the car to other available
modes. An emerging strategy is to employ intelligent transportation systems (ITS), an
approach to transportation management that uses information technologies to provide
visitors with relevant and real-time traffic information.
This study explores the utility of two forms of ITS, dynamic message signs and
highway advisory radio, as tools for encouraging shuttle use at Rocky Mountain
National Park and the gateway community of Estes Park, Colorado. The objectives of this
study are to:
1. Examine the individual utility of DMS and HAR as components of an ITS
at Rocky Mountain National Park and Estes Park.
2. Determine the extent to which the combined ITS influenced visitors‘
choice of travel mode at Rocky Mountain National Park and Estes Park
during the summer of 2011.
3
The United States has seen a shift in both public and private sector transportation
over the last century, from infrastructure growth to infrastructure management. ITS that
provide real-time traveler information will help bring transit specific to federal lands one
step further, moving it into the realm of management that focuses on visitor satisfaction.
Transit systems that are designed with visitor needs and preferences in mind will not only
provide for more enjoyable recreation experiences, but will offer a competitive product in
the global economy and ensure that federally managed tourism remains a viable industry.
Literature Review
Historical Context of Automobiles in Parks
The modern day national park, and particularly the national park ‗experience,‘ is
inextricably linked to the automobile (Louter, 2006; Sutter, 2002). In 1908, Mount
Rainier National Park became the first park in the United States to officially admit
automobiles (Louter, 2006). This event occurred eight years before the National Park
Service (NPS) was officially established by congress (Dilsaver & Wyckoff, 1999).
As nature tourism began to flourish in the United States in the early part of the
twentieth century, visitors flooded to parks such as Yellowstone, Yosemite and Mount
Rainier by way of railroad, wagons, and travel by horse and foot (Louter, 2006; Youngs,
White, & Wodrich, 2008). But these modes of transportation were relatively short lived.
The construction of the interstate highway system and the growing affordability of the
automobile moved auto tourism from the realm of the wealthy to the realm of the middle

4
class (Shaffer, 2001). The freedom and control afforded by the automobile had powerful
implications for nature tourism; specifically, it gave strength to grassroots movements
dedicated to establishing more national parks and protected lands, initiated the rise of
auto tourism and the joining of government and private industry to meet public demand
for recreation opportunities, and launched the rapid movement of highways into the heart
of America‘s most sublime landscapes (Louter, 2006; Shaffer, 2001; Sutter, 2002).
Several researchers have examined the impact of the automobile on the national
park experience, emphasizing the influence on park design and infrastructure (Colten &
Dilsaver, 2005; Dilsaver & Wyckoff, 1999; Hallo & Manning, 2009; Louter, 2006;
Youngs, et al., 2008). Dilsaver and Wyckoff (1999) exposed the deleterious ramifications
of automobile infrastructure, describing the NPS approach to transportation management
as a ―process of cumulative causation,‖ a type of positive feedback loop where each
infrastructural addition encourages additional use which in turn requires additional
infrastructure. Louter (2006) documented the changing aesthetics of national parks since
the beginning of the twentieth century as a result of shifting attitudes toward automobiles.
Using case studies of Mt. Rainier, Olympic, and North Cascades National Parks, he
highlighted three distinct phases of landscape design employed by the National Park
Service; roads running through, roads designed to travel around, and roads built
completely outside of designated wilderness areas.
Currently, we are seeing a further shift in transportation management from
infrastructure growth to infrastructure management. This current approach places
emphasis on providing alternatives to travel by private automobile. The goal of this new

5
paradigm is to reduce the harmful effects of automobiles on park resources while
maintaining or improving the level of visitor satisfaction.
Legislation in Support of Alternatives
Several pieces of legislation have been enacted to address transportation issues in
and around public lands beginning in 1991 with the Intermodal Surface Transportation
Efficiency Act (ISTEA; 1991) which served as a catalyst for transportation research,
planning, and implementation (Daigle, 2008). In 1997, the Departments of
Transportation and Interior (the parent organization of the NPS) signed a Memorandum
of Understanding, a formal agreement to jointly assess and address transportation needs
in parks and other public lands (Daigle & Zimmerman, 2004a; G. Dilworth & Shafer,
2004). The following year, the Transportation Equity Act for the 21st Century (TEA-21)
was passed which called for the formation of the Alternative Transportation Program
within the NPS (Daigle, 2008).
More recently, the Safe, Accountable, Flexible, Efficient Transportation Equity
Act: A Legacy for Users (SAFETEA-LU; 2005) was introduced. This legislation
promotes more efficient and effective federal surface transportation programs and
addresses transportation challenges such as improving safety, reducing traffic congestion,
increasing intermodal connectivity and protecting natural resources (Daigle, 2008).
As demonstrated by the increase in legislation, the study of transportation within
recreation and leisure settings is growing exponentially, with 1.2 billion federal dollars

6
dedicated to federal transit research and implementation via the SAFETEA-LU
legislation in the first five years alone (Daigle, 2008). Moreover, included in the
SAFETEA-LU legislation was the formation of the Paul S. Sarbanes Transit in Parks
program (formerly the Alternative Transportation in Parks and Public Lands Program)
(Turnbull, 2010). The Transit in Parks program provides technical assistance and funding
for transportation planning and implementation projects in parks, wilderness areas,
wildlife reserves and historic sites. In January of 2012, the Federal Transit Administration
secured an additional 40.8 million dollars for 58 planning and implementation projects to
be awarded by way of the Transit in Parks program (U.S. Department of Transportation,
2012). An implementation grant was awarded by the Transit in Parks program to fund the
2011 ITS pilot project at Rocky Mountain National Park, on which this study focuses.
Research on Alternative Transportation Systems
Alternative transportation refers to all modes of travel other than the private
automobile, including bicycles, buses, trains, trams and hiking (White, 2007). For the
purpose of this study, ATS refers to systems of transportation to, in and around public
lands that combine alternatives in order to reduce visitor reliance on private automobiles.
The 2001-2005 NPS Strategic Plan lists ATS as a key strategy for protecting park
resources while maintaining positive visitor experiences (National Park Service, 2000).
This and other guidelines and legislation, as outlined above, have prompted federal land
management agencies to design and implement ATS and subsequently researchers have
7
begun to explore the various components of the recreation experience that are affected by
these transportation systems.
The majority of these studies have focused on visitor attitudes towards changes in
existing transportation systems. Harrison (1975) was one of the first to do this by
surveying visitors at Denali National Park regarding newly implemented restrictions on
private automobiles. Cars were banned in certain areas within the park and a fare free
shuttle bus was introduced. Contrary to expectations, 84% of those surveyed approved of
the new policy. Though support for the new policy was relatively high across the board,
respondents who utilized the bus service indicated stronger support of the policy than
those who used a private automobile (Harrison, 1975). This suggests that if visitors can
be influenced to try a shuttle, they may find it less of an inconvenience than previously
anticipated and therefore show more support for such systems. Harrison stresses,
however, that shuttles must offer amenities equal to those available via a private
automobile or offer a unique service if they are to succeed as a competitive alternative.
By modeling visitor acceptance of a proposed shuttle system at Cades Cove in
Great Smoky Mountains National Park, Sims et al. (2005) were able to explore the
assumption that based on a historic perception of automobiles as the primary and best
way to experience national parks, ―the establishment of shuttle systems could potentially
result in greater impact on visitor experience than that resulting from the increase in
traffic congestion.‖ The results of the study, however, revealed higher support for a
mandatory shuttle system than managers had anticipated and showed that the value of
8
reduced traffic congestion to visitors was significant (Sims, Hodges, Fly, & Stephens,
2005).
White (2007) conducted an interpretive study of visitor attitudes towards the
shuttle system at Yosemite National Park and concluded that visitors primarily value
convenience and freedom when considering travel modes. White also observed that
visitors using private automobiles at Yosemite used rationalization as a cognitive coping
mechanism when confronted by congestion and crowding. In contrast, visitors using
alternative transportation praised the alternatives for allowing them to ―take their time,
focus on their immediate surroundings, move at their own pace, and connect with the
park and its natural and cultural surroundings in an environmentally-friendly way‖. These
results suggest that visitors have similar values, such as freedom and convenience, though
often disagree on what travel modes best suit these values (White, 2007).
A recent study used qualitative and quantitative methods to determine incentives
and disincentives for day visitors to use a new park-and-ride facility at Acadia National
Park (Holly, Hallo, Baldwin, & Mainella, 2010). The study found that the most important
factors influencing visitors‘ use of shuttles were the length of wait for and frequency of
shuttles. A management focus on increasing the frequency of shuttles was recommended,
as well as focusing promotional efforts on first-time, out-of-state visitors. Advertisement
of the environmental benefits of shuttle use was also suggested as a strategy for
increasing ridership.
Given the complexity of the study of transportation systems as related to outdoor
recreation, numerous information gaps exist (Daigle, 2008; Chris Strong, 1999; Turnbull,
9
2010). Researchers and managers generally agree that visitor experience is affected
negatively by congestion, however, Young et al. (2008) suggests that ―rather than being
seen as an intrusion, visitors and park managers have come to view transportation
systems as embedded components of the landscape that allow visitors to view wilderness
while driving.‖ Many studies corroborate this observation (Bishop, 1996; Featherstone,
2004; Louter, 2006; Waitt & Lane, 2007). This research suggests that motorized
transportation is an essential component of the recreation experience, but it does not
provide solutions for the crowding, congestion and resource degradation caused by
excessive automobile use.
The current trend in the field is towards exploring the utility of information
technologies to improve transit systems, thereby providing sustainable transportation
options that enhance, rather than detract from, the park experience. It is widely
understood that this shift to alternative transportation requires a ―reorientation‖ of the
way visitor‘s access and experience national parks (Dilsaver & Wyckoff, 1999; Sims, et
al., 2005; White, 2007). While this is no easy task, the key to the solution may lie in
intelligent transportation systems.
Emergence of Intelligent Transportation Systems
It has been argued that our mass cultural acceptance of automobiles in parks is
rooted in the belief that technology and nature can be mutually beneficial (Louter, 2006),
though until recently this belief has not often come to fruition. Intelligent transportation
systems (ITS) are an attempt to make this belief a reality, by using information
10
technologies to reduce the negative impact of automobiles through dissemination of
traveler information. Technology is an ever-growing part of society and it is likely that
technological tools such as ITS will continue to gain popularity in national parks and
public land settings (Dilworth & Shafer, 2004).
ITS technologies are designed to provide traveler information to visitors by
applying information technologies to transportation management (Sheldon, 1997). There
are a wide array of information technologies now associated with ITS. The most common
technologies used for discretionary tourism purposes include route guidance systems,
highway advisory radio, electronic message signs, global positioning systems, automated
onboard annunciators, and two-way voice communication (Daigle & Zimmerman, 2004b;
Sheldon, 1997).
Transportation experts and national park managers have identified four ITS
applications that offer the most valuable solutions to auto-related problems: 1) provide
traveler information about road conditions so as to reduce congestion; 2) provide relevant
information about transit options so that visitors can make informed decisions; 3) provide
real-time information on weather, traffic and parking lot conditions; and 4) direct visitors
to areas with less congestion (G. Dilworth & Shafer, 2004).
Technologies designed to address these key areas have been tested at Acadia,
Kings Canyon, Sequoia, Grand Canyon and Arches National Parks, among others (Daigle
& Zimmerman, 2004a, 2004b; G. Dilworth & Shafer, 2004; Lawson, Manning, Valliere,
& Wang, 2003; Christopher Strong, Eidswick, & Turner, 2007). A study of two park
units in California showed that visitors reported willingness to use two ITS technologies,

11
electronic message signs (EMS) and highway advisory radio (HAR), to access
information about road closures and parking and weather conditions (G. Dilworth &
Shafer, 2004). At Grand Canyon National Park, EMS and HAR were also evaluated.
Support vector regression analysis suggested that the two ITS technologies were
responsible for a 30% increase in shuttle ridership (Ye, Albert, Eidswick, & Law, 2010).
ITS have also been tested in urban park settings. In an effort to improve visitor
safety and inform motorists‘ decision-making, portable changeable message signs
(PCMS) were installed at Golden Gate National Recreation Area in California. Using a
combination of qualitative and quantitative methods, researchers were able to evaluate
the influence of the signs. While visitor surveys indicated only small influences, traffic
counts indicated a 12-14% reduction in traffic volumes on weekdays, and up to 19% on
weekends. Overall, the PCMS appeared to have some positive influence on shuttle
ridership, notwithstanding operations and maintenance challenges (Western
Transportation Institute, 2007).
Despite these studies, park and recreation researchers have stated the need for
additional transportation focused research (Daigle, 2008; Daigle & Zimmerman, 2004a;
Dilsaver & Wyckoff, 1999; Sims, et al., 2005; White, 2007). While preliminary research
reveals that ITS technologies are viable, further research is needed to determine what
specific technologies are most effective for shifting visitors from private automobiles to
alternatives. Research is also needed to identify the effectiveness of ITS given specific
geographic areas, user groups, levels-of-use, and capital and resource constraints. The
best technologies must be identified so that a switch in travel mode does not necessitate a

12
decrease in visitor experience. In a survey conducted at Acadia National Park, visitors
reported that maintaining or improving the visitor experience should be seen ―as the most
important gauge of success for travel information technologies (Daigle & Zimmerman,
2004a).‖ Our research explores the utility of an ITS to increase shuttle ridership between
and within Rocky Mountain National Park and seeks to identify potential strategies for
increasing awareness and use of shuttles.
Methodology
Study Site
Rocky Mountain National Park (ROMO) is the most visited park in Colorado and
is challenged by consistently high visitation concentrated within the peak summer season.
The months of June, July and August alone see more than half of ROMO‘s three million
annual visitors (National Park Service). In the 1970‘s a fare-free visitor transportation
system was established to help manage the influx of visitors. The shuttle service has since
grown, with nearly half a million rides provided in 2010 (Villwock-Witte & Collum,
2012). Despite this, private automobiles remain the preferred mode choice by the
majority of visitors. Symptoms of this high visitation rate include parking lots filled to
capacity early in the day, traffic congestion within the park and pressure on natural and
managerial resources. The issue is further exacerbated by bottlenecking at the parks
primary access point, where two US highways and one state highway converge at one
major intersection in downtown Estes Park (Rocky Mountain National Park, 2008).
13
The majority of the visitors that access ROMO via Estes Park are drawn to the
Glacier Gorge and Bear Lake Trailheads. On the weekends during the peak summer
season, the parking lots at these trailheads reach capacity by 8am and 10am respectively.
Additional parking is located at the Bear Lake park-and-ride lot, where visitors can leave
their car and take a free shuttle to Glacier Gorge or Bear Lake; however, this lot also
reaches capacity on summer weekends by as early as 11:30am (Villwock-Witte, Ye,
Eidswick, & Albert, 2011).
To address these issues, a planning study was funded through a 2010 Paul S.
Sarbanes Transit in Parks Program grant to explore potential mitigation strategies. The
proposed solution was to implement a pilot ITS to direct day visitors to a new park-and-
ride lot located just east of downtown Estes Park by the community fairgrounds, where
visitors then boarded a shuttle (the Silver Route) which provided a five minute ride to the
Estes Park Convention and Visitors Bureau (CVB). Once at the CVB, visitors could
gather information for their trip and transfer to any of four shuttle routes servicing Estes
Park and ROMO. The Silver Route made the trip between the park-and-ride and the CVB
every 15 minutes from 10am until 10pm daily from June 25th
through September 11th
.
The ITS
The ITS was comprised of highway advisory radio (HAR) and dynamic message
signs (DMS) and was pilot tested from July 15th
until August 30th
, 2011. DMS are meant
to display short, concise messages to passing motorists, while the HAR can broadcast
longer messages on a continuous loop. Four DMS were strategically positioned along
14
U.S. Highway 36 on the approach to Estes Park. Preapproved messages were developed
by the Transit in Parks technical liaison staff and appeared on the DMS to warn
approaching visitors of the status of parking within ROMO. On a daily basis, once
parking lots reached capacity, messages were displayed to inform visitors that the Bear
Lake lot was full and to recommend use of the eastern park-and-ride lot and the Silver
Route shuttle. The DMS also displayed the station number for the HAR, which contained
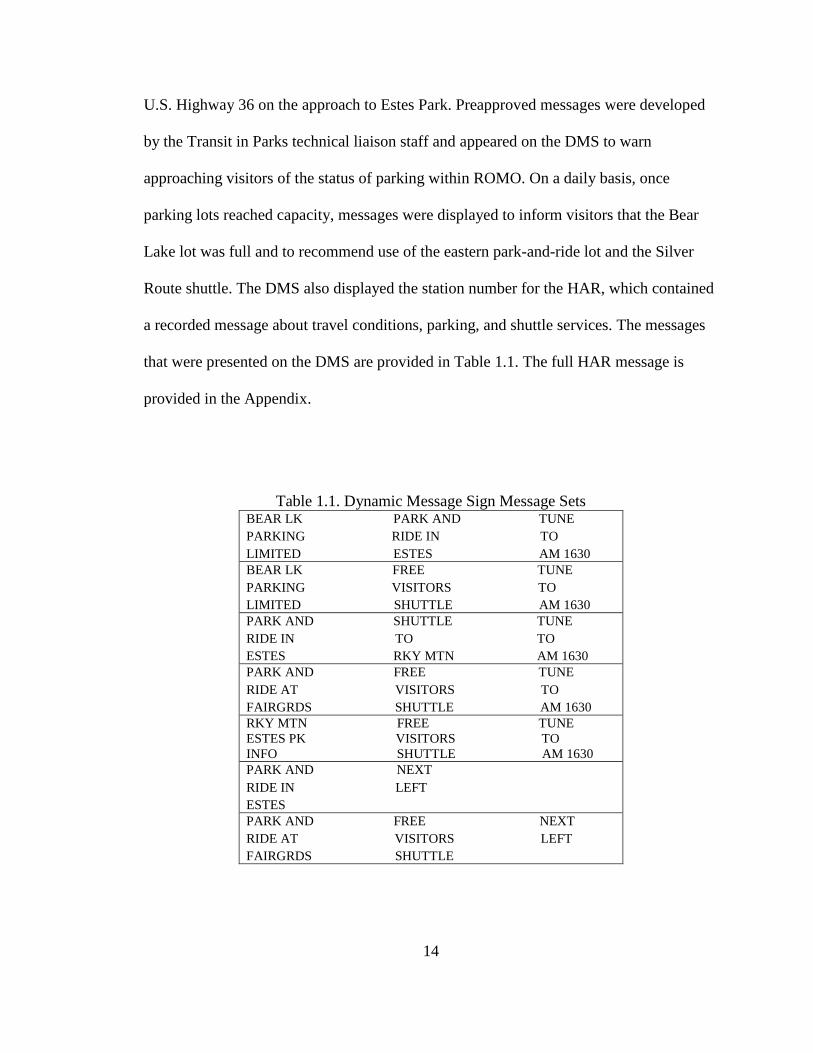
a recorded message about travel conditions, parking, and shuttle services. The messages
that were presented on the DMS are provided in Table 1.1. The full HAR message is
provided in the Appendix.
Table 1.1. Dynamic Message Sign Message Sets BEAR LK PARK AND TUNE
PARKING RIDE IN TO
LIMITED ESTES AM 1630
BEAR LK FREE TUNE
PARKING VISITORS TO
LIMITED SHUTTLE AM 1630
PARK AND SHUTTLE TUNE
RIDE IN TO TO
ESTES RKY MTN AM 1630
PARK AND FREE TUNE
RIDE AT VISITORS TO
FAIRGRDS SHUTTLE AM 1630
RKY MTN FREE TUNE
ESTES PK VISITORS TO
INFO SHUTTLE AM 1630
PARK AND NEXT
RIDE IN LEFT
ESTES
PARK AND FREE NEXT
RIDE AT VISITORS LEFT
FAIRGRDS SHUTTLE

15
Study Design and Sampling Procedures
On-site surveys were conducted on fourteen consecutive days between July and
August 2011. These dates were selected to overlap with peak visitation and ITS
operations. It is customary in recreation research to use multi-stage cluster sampling to
assign the day of week and time of day for data collection. However, due to the nature of
the pilot study and given time and resource constraints, data were collected for the
entirety of the fourteen day period so as to obtain as much data as possible.
Two questionnaires were developed for this study in collaboration with the Paul
S. Sarbanes Transit in Parks Technical Assistance Center (TRIPTAC) and project
stakeholders provided iterative feedback during the design process. The two
questionnaire versions included a shuttle survey and an intercept visitor survey. The
shuttle survey was distributed onboard the Silver Route shuttle as it returned to the park-
and-ride lot from the CVB. Several people rode the shuttles on multiple days but were
only allowed to complete the survey once during the survey period.
The visitor survey was used to capture visitors who did not use the Silver Route
shuttle, including non-riders and visitors who were influenced by the ITS to use visitor
shuttles but who chose to board at the CVB rather than the park-and-ride lot. The visitor
survey was distributed at two locations: the CVB and Bond Park, a small community
park located in downtown Estes Park. Random assignment was used to determine where
surveying would occur on each day of the surveying period, with the intention of
collecting surveys from each location equally. However, due to weather conditions,

16
surveying had to be moved to the CVB mid-day on five occasions because Bond Park
lacked rain cover.
For both the shuttle and visitor survey, data collection personnel followed a script
approved by the University of Maine Institutional Review Board for the Protection of
Human Subjects. Data collection personnel approached every nth
group at the CVB and
Bond Park, and every group onboard the shuttle, and briefly introduced the study. Groups
were told that participation was voluntary and all responses confidential. One adult (18
or older) from each party was then invited to complete a survey and return it to the data
collection team member when finished. Data collection personnel recorded observational
information for parties that refused to participate including gender, party size, and
presence of children.
The surveys were designed to be completed in 5 minutes or less so as to limit the
burden on visitors. All respondents were provided with a laminated photograph of the
DMS, as well as a map of the locations of the DMS and HAR, to ensure that they
understood all questions pertaining to the ITS.
Questionnaires
The shuttle and visitor survey questionnaires consisted of fourteen fixed scale and
close-ended questions, many of which were multi-part. These two surveys were identical
with the exception of one question. For the shuttle survey, this question asked
respondents to evaluate twelve positive and negative statements related to the shuttle

17
service, including ‗the shuttle is easy to use‘ and ‗the shuttle does not have sufficient
room for my gear.‘ For the visitor survey, this question asked visitors to evaluate nine
statements which represented possible reasons why they did not use the Silver Route
shuttle, such as ‗I was not aware of the shuttle‘ and ‗the shuttle does not run frequently
enough for my needs.‘ These questions were derived from a review of previous
transportation studies (Daigle & Zimmerman, 2004b; Holly, et al., 2010) and measured
on a 5-point bipolar Likert scale from strongly agree to strongly disagree.
The other thirteen questions on the surveys pertained to overall experience, travel
experience, route used to arrive to the area, awareness and use of the DMS and HAR,
evaluation of the HAR, and information about other shuttles used and sources of
information about those shuttles. Demographic information including gender, zip code,
country of origin and number of people in party was gathered to help determine the
representativeness of those sampled.
The questionnaires were pilot tested in Estes Park on one day in June of 2011,
both on-board the Silver Route shuttle and at the CVB. Based on feedback and
observations from the pilot test, it was determined that far more local residents and
seasonal employees were using the Silver Route than anticipated. Therefore, a question
was added to the shuttle survey questionnaire which asked respondents to indicate
whether they were visitors, seasonal residents, or fulltime residents.
18
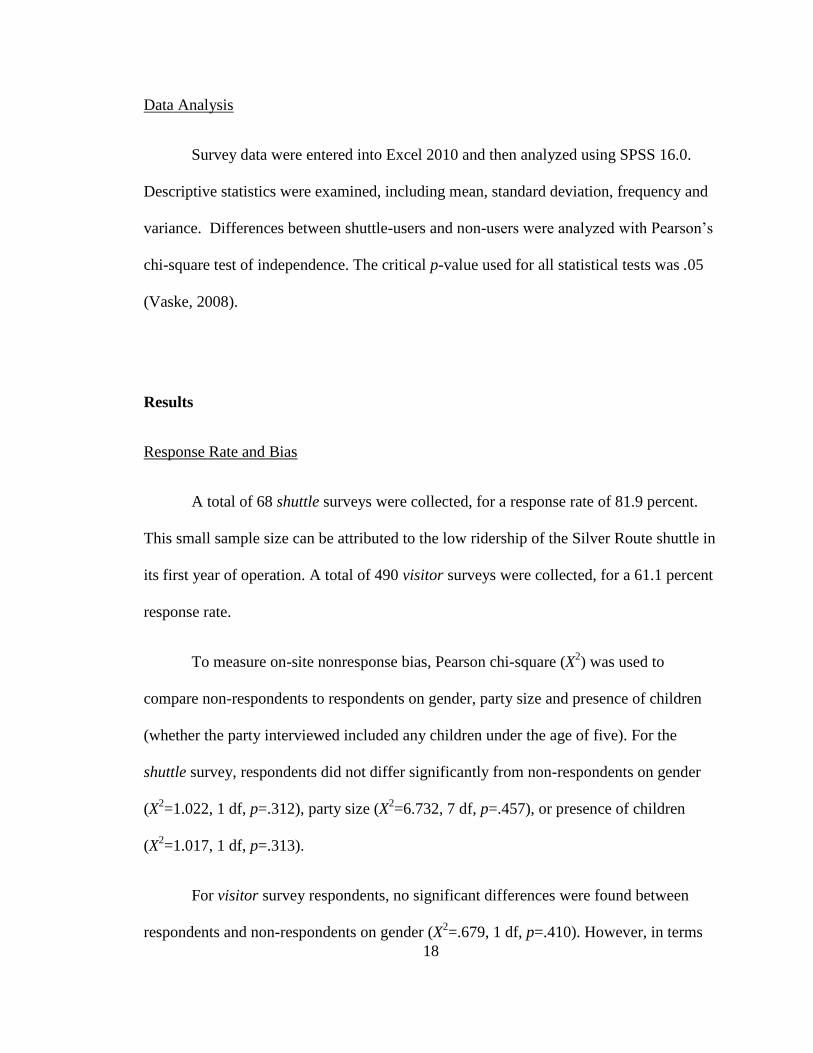
Data Analysis
Survey data were entered into Excel 2010 and then analyzed using SPSS 16.0.
Descriptive statistics were examined, including mean, standard deviation, frequency and
variance. Differences between shuttle-users and non-users were analyzed with Pearson‘s
chi-square test of independence. The critical p-value used for all statistical tests was .05
(Vaske, 2008).
Results
Response Rate and Bias
A total of 68 shuttle surveys were collected, for a response rate of 81.9 percent.
This small sample size can be attributed to the low ridership of the Silver Route shuttle in
its first year of operation. A total of 490 visitor surveys were collected, for a 61.1 percent
response rate.
To measure on-site nonresponse bias, Pearson chi-square (X2) was used to
compare non-respondents to respondents on gender, party size and presence of children
(whether the party interviewed included any children under the age of five). For the
shuttle survey, respondents did not differ significantly from non-respondents on gender
(X2=1.022, 1 df, p=.312), party size (X
2=6.732, 7 df, p=.457), or presence of children
(X2=1.017, 1 df, p=.313).
For visitor survey respondents, no significant differences were found between
respondents and non-respondents on gender (X2=.679, 1 df, p=.410). However, in terms

19
of group size, a significantly higher proportion of non-respondents were traveling alone
or as a couple (X2=33.271, 20 df, p =.032). Also, individuals traveling with children
under the age of five were less likely to participate in the study (X2=27.347, 1 df, p <.01).
Non-response bias was also considered by sample location, as the visitor survey was
administered in two different locations in Estes Park (the CVB and Bond Park). Location
was found to have no significant impact on visitors willingness to participate in the study
(X2=3.587, 1 df, p=.058).
Characteristics of Respondents
Shuttle survey respondents were predominately return visitors (62%). Day
visitors and overnight visitors accounted for 38% and 27% respectively, while 13% were
seasonal residents (staying more than 45 days) and 22% were fulltime residents. The
percentage of seasonal and fulltime residents was much higher than anticipated, as it was
assumed that primarily day visitors would use the Silver Route shuttle. However, a
number of local employees utilized the shuttle to get to work. For day visitors, the mean
length of stay was 6.4 hours, while overnight visitors stayed an average of 6.4 days.
Approximately half (49%) of the respondents were visiting from in-state, while 34%
were out-of-state visitors and 16% were international visitors. The higher percentage of
international visitors can be attributed to use of the shuttle by international students who
were working in the area for the summer. A slightly higher proportion of males (54%)
responded than females (46%), and the mean group size was 2.4 people (Table 1.2).

20
Table 1.2. Characteristics of Shuttle Survey Respondents Characteristics N %
Gender
Male 37 54.4
Female 31 45.6
Experience
First time visitor
Return visitor
Number of people in party
26
42
38.2
61.8
Mean 2.4
Origin
In-state 33 49.3
Out-of-state 23 34.3
International 11 16.4
Length of stay
Day visitor 26 38.2
Overnight visitor 18 26.5
Seasonal resident 9 13.2
Fulltime resident 15 22.1
Among visitor survey respondents, 57% were return visitors and 51% were males.
Respondents were predominately overnight visitors (62%) and less than five percent were
seasonal residents (1%) or fulltime residents (2%). The mean length of stay for day
visitors was 5.9 hours. For overnight visitors, the mean length of stay was 4.5 days. Out-
of-state visitors (64%) accounted for a higher proportion of respondents than among
shuttle survey respondents, while the proportion of in-state (32%) and international (4%)
visitors was much lower. The mean group size was 3.7 (Table 1.3).

21
Table 1.3. Characteristics of Visitor Survey Respondents Characteristics N %
Gender
Male 247 51.2
Female 235 48.8
Experience
First time visitor
Return visitor
Number of people in party
212
276
43.4
56.6
Mean 3.7
Origin
In-state 151 31.5
Out-of-state 308 64.1
International 21 4.4
Length of stay
Day visitor 166 34.9
Overnight visitor 292 61.5
Seasonal resident 6 1.3
Fulltime resident 11 2.3
Awareness and Use of ITS Components
Two U.S. highways and one state highway approach Estes Park from the east,
however, for the purpose of the pilot study, the dynamic message signs (DMS) and
highway advisory radio (HAR) were only placed on one highway: U.S. Highway 36. The
project partners selected this highway for the pilot study because of its accessibility to the
newly constructed park-and-ride lot. To ensure that our evaluation of the ITS considers
only those respondents who had the opportunity to see the DMS and tune-in to the HAR,
all respondents were asked to indicate which route they used to arrive to the area at the
time they completed the survey. In total, 73% of shuttle survey respondents and 61% of
visitor survey respondents reported that they arrived to the area via U.S. Highway 36
(Table 1.4).

22
Table 1.4. Route Used to Arrive in Estes Park/ROMO Shuttle Survey
Respondents
Visitor Survey
Respondents
Route N % N %
U.S. Highway 36 46 73.0 295 60.6
U.S. Highway 34 7 11.1 143 29.4
Colorado State Highway 7 1 1.6 21 4.3
Other 9 14.3 28 5.7
Note: Respondents who listed ―other‖ indicated that they accessed ROMO
from the west entrance or lived near the shuttle stop.
Of the shuttle survey respondents who arrived to the area via U.S. Highway 36,
80% (N=35) indicated that they saw a DMS. Of those who saw a DMS, the majority
(86%, N=30) reported that the DMS displayed a message prompting them to tune to the
HAR, and 67% (N=20) of those prompted indicated that they did tune to the HAR (44%
of those who approached on U.S. Highway 36).
In contrast, among the visitor survey respondents who arrived to the area by way
of U.S. Highway 36, 65% (N=189) stated that they saw a DMS, and of those, 68%
(N=120) reported that the DMS displayed a message prompting them to tune to the HAR.
Of those who reported seeing a prompt for the HAR, 28% (N=34) indicated that they
actually tuned to the HAR (12% of those who approached on U.S. Highway 36).
To evaluate the effect of the HAR on use of the park-and-ride and subsequently
the Silver Route shuttle, respondents were asked to indicate their level of agreement with
the statements ―the information influenced me to use the park-and-ride‖. Among shuttle
survey respondents who tuned to the HAR, 95% somewhat agreed or strongly agreed that
the information influenced them to use the park-and-ride. Slightly more than half (57%)
of the visitor survey respondents who tuned to the HAR agreed with this statement (Table

23
1.5). Caution should be used when interpreting these results, as such a small proportion
of visitor survey respondents actually tuned to the HAR.
Table 1.5. Influence of the Highway Advisory Radio
Shuttle Survey Respondents Visitor Survey Respondents
Mean SD Agree
(N)
Agree
(%)
Mean SD Agree
(N)
Agree
(%)
The information on the HAR
influenced me to use the
park-and-ride
4.65 0.93 19
95.0 3.50 1.41 17 56.6
Note: Mean based on 5-point Likert scale ranging from 1 (strongly disagree) to 5 (strongly agree).
Responses of 4 and 5 were collapsed into the category ―agree.‖
Evaluation of the Highway Advisory Radio
Visitors rated the HAR on a number of criteria, such as how accurate and useful
the information was, whether the information saved them time and helped them get
around or avoid traffic congestion, and whether they would use the information again.
Overall, shuttle survey respondents indicated high levels of satisfaction with the HAR.
All respondents (100%) who used and evaluated the highway advisory radio strongly
agreed or somewhat agreed that the information was accurate. When asked if the
information saved them time, 65% agreed, and 72% indicated that they were able to get
around easier with the information. Similarly, 75% agreed that the information helped
them avoid traffic congestion. A high proportion of users (89%) agreed that the
information was useful to them, and 85% agreed that they planned to use the information
if visiting again. Interestingly, 79% agreed that they needed more information, despite the

24
high levels of satisfaction with the information. Unfortunately, respondents provided little
to no information in regards to the type of information they needed (Table 1.6).
Table 1.6. Evaluation of the Highway Advisory Radio
Shuttle Survey Respondents Visitor Survey Respondents
Mean SD Agree
(N)
Agree
(%)
Mean SD Agree
(N)
Agree
(%)
The information was accurate 4.74 0.45 19 100 4.34 0.72 25 86.2
The information saved me time 3.90 1.33 13 65.0 3.56 0.80 12 44.4
I was able to get around easier
with the information
4.11 1.08 13 72.2 3.86 0.85 18 64.3
I would plan to use the
information if visiting again
4.20 1.11 17 85.0 4.25 0.84 23 82.1
The information was useful to
me
4.32 1.00 17 89.4 3.96 1.17 21 75.0
The information helped me
avoid traffic congestion
4.00 1.21 15 75.0 3.52 0.85 12 44.4
I needed more information 3.93 1.21 11 78.6 3.76 1.26 11 52.4
Note: Mean based on 5-point Likert scale ranging from 1 (strongly disagree) to 5 (strongly agree).
Responses of 4 and 5 were collapsed into the category ―agree.‖
Satisfaction with the HAR among visitor survey respondents was much lower.
Though a high proportion of respondents (86%) agreed that the information was accurate,
less than half (44%) agreed that the information saved them time and helped them avoid
traffic congestion. A slightly high proportion (64%) agreed that they were able to get
around easier with the information, and 75% agreed that the information was useful to
them. Despite the lower satisfaction among respondents in some areas, 82% agreed that
they would plan to use the information again. Just over half (52%) agreed that they
needed more information (Table 1.6).
25
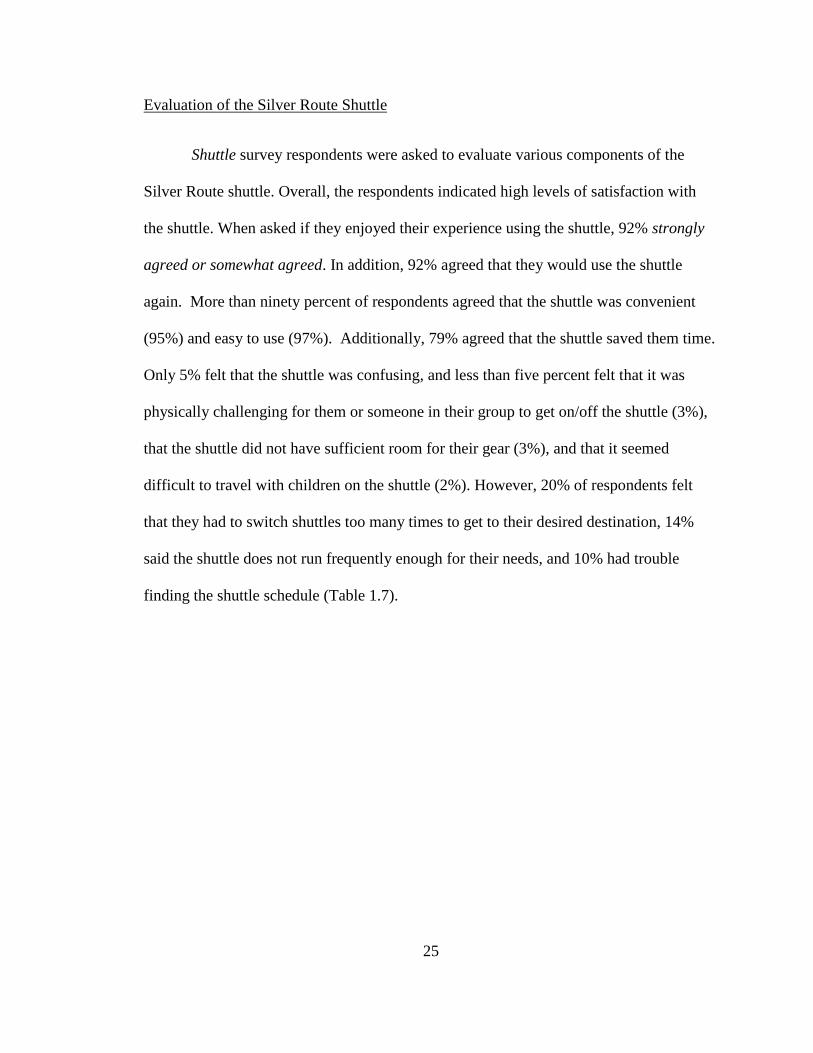
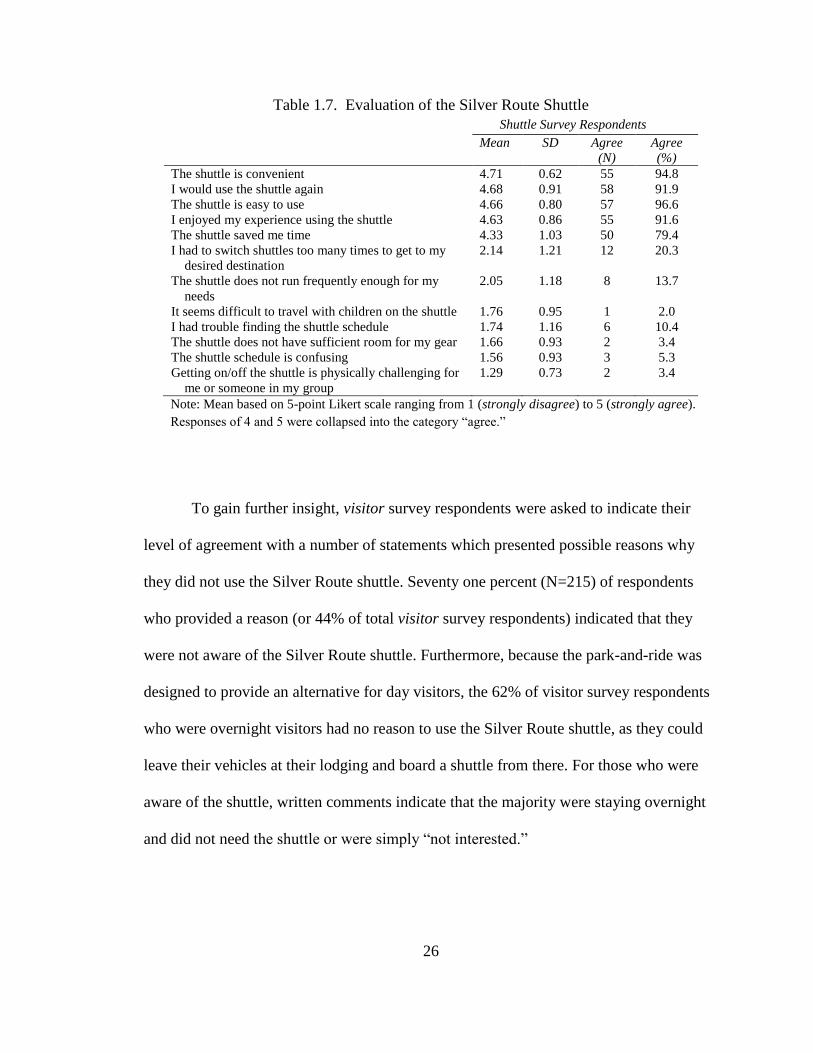
Evaluation of the Silver Route Shuttle
Shuttle survey respondents were asked to evaluate various components of the
Silver Route shuttle. Overall, the respondents indicated high levels of satisfaction with
the shuttle. When asked if they enjoyed their experience using the shuttle, 92% strongly
agreed or somewhat agreed. In addition, 92% agreed that they would use the shuttle
again. More than ninety percent of respondents agreed that the shuttle was convenient
(95%) and easy to use (97%). Additionally, 79% agreed that the shuttle saved them time.
Only 5% felt that the shuttle was confusing, and less than five percent felt that it was
physically challenging for them or someone in their group to get on/off the shuttle (3%),
that the shuttle did not have sufficient room for their gear (3%), and that it seemed
difficult to travel with children on the shuttle (2%). However, 20% of respondents felt
that they had to switch shuttles too many times to get to their desired destination, 14%
said the shuttle does not run frequently enough for their needs, and 10% had trouble
finding the shuttle schedule (Table 1.7).
26
Table 1.7. Evaluation of the Silver Route Shuttle
Shuttle Survey Respondents
Mean SD Agree
(N)
Agree
(%)
The shuttle is convenient 4.71 0.62 55 94.8
I would use the shuttle again 4.68 0.91 58 91.9
The shuttle is easy to use 4.66 0.80 57 96.6
I enjoyed my experience using the shuttle 4.63 0.86 55 91.6
The shuttle saved me time 4.33 1.03 50 79.4
I had to switch shuttles too many times to get to my
desired destination
2.14 1.21 12 20.3
The shuttle does not run frequently enough for my
needs
2.05 1.18 8 13.7
It seems difficult to travel with children on the shuttle 1.76 0.95 1 2.0
I had trouble finding the shuttle schedule 1.74 1.16 6 10.4
The shuttle does not have sufficient room for my gear 1.66 0.93 2 3.4
The shuttle schedule is confusing 1.56 0.93 3 5.3
Getting on/off the shuttle is physically challenging for
me or someone in my group
1.29 0.73 2 3.4
Note: Mean based on 5-point Likert scale ranging from 1 (strongly disagree) to 5 (strongly agree).
Responses of 4 and 5 were collapsed into the category ―agree.‖
To gain further insight, visitor survey respondents were asked to indicate their
level of agreement with a number of statements which presented possible reasons why
they did not use the Silver Route shuttle. Seventy one percent (N=215) of respondents
who provided a reason (or 44% of total visitor survey respondents) indicated that they
were not aware of the Silver Route shuttle. Furthermore, because the park-and-ride was
designed to provide an alternative for day visitors, the 62% of visitor survey respondents
who were overnight visitors had no reason to use the Silver Route shuttle, as they could
leave their vehicles at their lodging and board a shuttle from there. For those who were
aware of the shuttle, written comments indicate that the majority were staying overnight
and did not need the shuttle or were simply ―not interested.‖

27
Sources of Information about Shuttles
Although the primary goal of the ITS was to encourage day visitors to use the
new park-and-ride lot and subsequently the Silver Route shuttle, it was also expected that
the ITS would increase awareness of all shuttle options among day visitors and overnight
visitors alike. To evaluate this, respondents were asked to indicate how they learned
about the shuttles. The most frequent source of information cited by shuttle survey
respondents was the DMS; 41% indicated that they learned about the shuttles from this
source. At 22%, the HAR was cited the second most frequently. Four information sources
were used by less than five percent of shuttle survey respondents: hotel/lodge/campsite
staff (5%), the Town of Estes Park website (3%), through employment with ROMO (2%)
and through employment with a business in Estes Park (3%). No shuttle survey
respondents reported that they learned about the shuttles from the ROMO website (Table
1.8).
Table 1.8. Sources of Information about Shuttles Shuttle Survey
Respondents
Visitor Survey
Respondents
Information source N % N %
Dynamic message signs 27 41.5 85 20.1
Highway advisory radio 14 21.5 14 4.0
Family or friends 9 13.8 54 12.8
Visitor center staff 8 12.3 103 24.4
A newspaper articles 7 10.8 15 3.5
Previous visits 4 6.2 72 17.0
Hotel/lodge/campsite staff 3 4.6 35 8.3
The Town of Estes park website 2 3.1 16 3.8
Through employment with a
business in Estes Park
2 3.1 6 1.4
Through my employment with
ROMO
1 1.5 4 0.9
The ROMO website 0 0.0 43 10.2
Note: Totals amount to more than 100% as respondents were instructed to
indicate all sources of information used.
28
Among visitor survey respondents, the most frequently cited source of information
was visitor center staff, with 24% indicating that they learned about the shuttles for this
source. The second most cited information source was the DMS (20%), followed closely
by ―previous visits‖ (17%). Less than five percent of visitor survey respondents indicated
that they learned about the shuttles from the HAR (4%), a newspaper article (4%), the
Town of Estes Park website (4%), through employment with ROMO (1%), and through
employment with a business in Estes Park (1%) (Table 1.8).
Effect of Shuttle Use on Visitor Experience
Respondents of both the shuttle and visitor survey were asked to rate their overall
experience visiting Estes Park and ROMO, as well as their overall travel experience (i.e.
driving, navigating, and parking). Overall experience and travel experience were rated
quite high by both survey groups.
Among shuttle survey respondents, 96% rated their overall experience good or
very good, and 85% rated their travel experience good or very good. Similarly, 97% of
visitor survey respondents rated their overall experience as good or very good, and 82%
gave a good or very good rating for their travel experience.
In all, 32% (N=154) of visitor survey respondents used one or more of the seven
shuttles routes within Estes Park and ROMO, and 42% used the ITS (defined here as all
respondents who, at a minimum, saw a DMS). Pearson‘s chi-square was used to measure
the effect of shuttle use and ITS use on overall experience visiting Estes Park and

29
ROMO, and on overall travel experience. Shuttle-users did not rate their overall
experience (X2=.832, 1 df, p=.362) or travel experience (X
2=.600, 1 df, p=.439)
significantly higher than respondents who did not use shuttles. Furthermore, respondents
who used ITS did not rate their overall experience (X2=.564, 1 df, p=.453) or travel
experience (X2=.243, 1 df, p=.622) significantly higher than respondents who did not use
ITS.
Effect of Past Use on Future Use of Shuttles
Pearson‘s chi-square was used to determine if past use of shuttles at Estes Park
and ROMO had an effect on visitors use or planned use of shuttles on their most recent
visit. Due to the nature of our survey, this analysis could only be performed for visitor
survey respondents. The proportion of visitor survey respondents who indicated that they
had used or planned to use shuttles on their current visit was significantly higher for
visitors that had previous experience using shuttles at Estes Park/ROMO, as compared to
respondents who had no experience using the shuttles (X2=98.732, 1 df, p <.01). In
percentages, 92% of respondents who indicated that they had prior experience using the
Estes Park/ROMO shuttles also indicated that they had already used or planned to use
shuttles on their current visit. In contrast, only 29% of respondents who lacked prior
experience had already used or planned to use shuttles on their trip. In Chapter 2, we
explore the influence of past shuttle use on future shuttle use in depth.

30
Discussion
As alternative transportation becomes more common in park and recreation
settings, ITS is gaining recognition as a tool for promoting and enhancing alternative
travel modes, thereby decreasing reliance on automobiles. Especially in the face of
economic uncertainty and tightening federal budgets, it is important to find innovative
solutions to the myriad challenges public lands face. Our study sought to evaluate the
utility of an ITS at Rocky Mountain National Park and Estes Park as a means for
increasing awareness and use of visitor shuttles. Moreover, we aimed to determine
additional ways to reach visitors and promote alternative modes of travel. Although the
findings of this study are based solely on a one season pilot study, they nonetheless
provide insight into the benefits of ITS for the areas visitors, managers, and local
residents.
Our first objective was to examine the individual utility of DMS and HAR as
components of an ITS at Rocky Mountain National Park and Estes Park. The results
indicate that 80% of shuttle survey respondents who approached the area from U.S.
Highway 36 saw one or more DMS. Additionally, 42% of shuttle survey respondents
reported that they learned about the Silver Route shuttle from the DMS. It was originally
anticipated that the DMS would simply encourage visitors to tune to the HAR, and the
HAR would then influence visitors to use the park-and-ride and Silver Route shuttle.
However, 43% of the visitors who used the Silver Route shuttle saw a DMS but did not
tune to the HAR. This suggests that the information on the DMS was enough for many
31
visitors to decide to use the park-and-ride, without needing to tune to the HAR for
additional information.
In addition, 65% of visitor survey respondents who approached the area from U.S.
Highway 36 reported seeing a DMS, and 20% indicated that they learned about the town
and park shuttles from this source. This shows that the DMS also contributed
substantially to shuttle awareness among visitor survey respondents. Thus, the DMS
appears to have successfully increased awareness of the various town and park shuttles.
The utility of the HAR is not as evident. Only 12% of visitor survey respondents
who approached from U.S. Highway 36 reported using the HAR, and less than half of
those visitors felt that the information saved them time or helped them avoid traffic
congestion. However, use of the HAR was much higher (44%) among shuttle survey
respondents, and the effect of the information on visitor mobility much greater. Sixty five
percent or more of those who used the HAR felt it saved them time and helped them
avoid traffic congestion and nearly 90% found the information useful. With more than
80% of shuttle and visitor survey respondents indicating that they would use the
information again, it is clear that for this segment of visitors, the HAR provided a much
desired service.
Though satisfaction was fairly high among users of the HAR, the fact remains that
few people chose to use it. When choosing appropriate technologies for an ITS, managers
must not only consider visitor satisfaction with the technologies, but also the appeal of
these technologies to a broad user base, as well as the cost of operating and maintaining
the devices. Our results show that while the HAR did contribute to awareness and use of

32
the park-and-ride and Silver Route shuttle, it was not widely used by other visitors.
Additionally, the HAR failed to transmit as far as had been anticipated, and several
visitors indicated that the channel was overpowered by static at times and difficult to
hear. The geography of the area presented considerable challenges for transmission of
the radio signal. Further research is necessary to determine whether the DMS alone can
increase awareness and use of shuttles, or if the HAR is a vital component for a
significant number of visitors.
We also explored the impact of the combined ITS on visitor experience. While
use of the ITS technologies did not result in a significant increase in visitor experience,
visitor evaluations of the ITS were nonetheless positive. It appears that the ITS provided
a desired service to many visitors. Although the ITS did not significantly improve visitors
travel experience, it may prove crucial to maintaining current levels of satisfaction as
visitation continues to increase. Furthermore, previous studies have shown that global
measures of experience in recreation settings tend to be consistently high (Manning,
1999), thus, it is difficult to measure a significant increase. Qualitative research could be
useful to determine the specific ways ITS impact the experience of park visitors.
The second objective of our study was to determine the extent to which the pilot
ITS influenced visitors‘ choice of travel mode. Examining the two survey groups
individually, we find that 95% of shuttle survey respondents who tuned to the HAR, or
41% of total shuttle survey respondents who approached the area from U.S. Highway 36,
indicated that the information on the HAR influenced them to use the park-and-ride. This
is substantial, especially considering that such a large proportion (35%) of shuttle survey
33
respondents were seasonal and fulltime residents who had no occasion to use the ITS.
Despite this, it is important to remember that due to low ridership on the Silver Route
shuttle, only 68 people participated in the shuttle survey. Although the HAR appears to
have been of great value to this segment of visitors, it terms of sheer numbers, the affect
is negligible. Furthermore, the HAR had a small impact on visitor survey respondents.
Only 57% of those who tuned to the HAR, or less than 6% of total visitor survey
respondents who approached from U.S. Highway 36, agreed that the information
influenced their mode choice.
It is not clear, however, how the DMS alone influenced mode choice. Findings
from a 2012 technical report which evaluated additional aspects of the ROMO pilot study
reported large increases in Hiker Shuttle ridership. The Hiker Shuttle transports visitors
from the CVB directly into ROMO, and is one of the most important routes in terms of
reducing crowding and congestion. The Hiker Shuttle saw increases in ridership in June,
July and August 2011 ranging from 50-68%, as compared to the same months in 2010
(Villwock-Witte & Collum, 2012). While there is no direct causal link between the
increase in ridership and the application of the ITS, it seems that the ITS was at least
partially responsible for this increase, as such a large percentage of visitors indicated that
they learned about the shuttles from the DMS and HAR. Future research should explore
the direct effect of the DMS on shuttle use.
Overall, our results show the ITS had a substantial effect on awareness of travel
alternatives, and for some visitors this translated to actual use of shuttles. In terms of
broad impact, the DMS was very effective. Although those who used the HAR were
34
satisfied and indicated that they would plan to use it again, the HAR failed to appeal to a
broad user base during the pilot study.
Although the HAR failed to have broad impact, the DMS cannot be expected to
serve as the sole technology of an ITS. These technologies are meant to work in tandem,
especially considering the limited text which can be communicated via the DMS. If
managers determine that the HAR is not worth the cost to ROMO, other technologies
must be implemented or expanded in order to provide visitors with enough information to
make informed travel decisions. Electronic signs that display real-time departure time for
shuttles have been successfully demonstrated at other parks (Daigle & Zimmerman,
2004b) and could be tested as a component of an ITS at ROMO and Estes Park. Our
study findings reveal other information sources that can be used to increase awareness
and use of shuttles.
The results show that visitor center staff is currently serving as one of the primary
sources of information about shuttles. Park and town managers should take full advantage
of this already existing information source and work with visitor center staff to ensure
that they are promoting a consistent message about the benefits associated with shuttle
use. Staff should use specific talking points, for example, that the shuttles are free,
convenient and easy to use, help alleviate the stress related to finding parking, and offer
full access to a number of popular recreation areas. Based on our findings, staff should
not promote the shuttles as a way to save time or avoid congestion. Staff should only
promote benefits that are sure to be realized, as satisfaction is determined by the
congruence between visitors expectations and actual experience (Manning, 1999). The

35
promotion of desirable but realistic expectations will help visitors build trust in the
system, which ideally will lead to continued use of shuttles.
Although visitor center staff is a great source of information, many return visitors
are comfortable enough with the area that they bypass the visitor center. Additional
sources of information must be available for this segment of visitors, as they account for
57% to 62% of the visitor population, according to our results. The 2012 technical report
associated with the pilot study presented results from a mail survey of area visitors,
which showed that visitors found the internet and the ROMO website to be the two most
useful travel information sources (Villwock-Witte & Collum, 2012). This is an
interesting finding, as results from the shuttle and visitor surveys show that 10% or less
of survey respondents listed the Estes Park and ROMO websites as their source of
information about shuttles. These websites should provide direct links to shuttle
information and schedules, as the data show that visitors prefer to use these information
sources, but are not currently finding adequate information about the shuttles.
Other findings from our study are worth additional discussion. Although we had
not anticipated that such a large portion of Silver Route users would be seasonal and
fulltime residents, this finding nonetheless reveals an area that requires further attention.
The crowding and congestion occurring in downtown Estes Park is intensified by
concentrated visitation in the summer months, but the problem encompasses more than
just visitors. Traffic congestion is largely caused by people slowing and circling to find
one of the limited parking spaces in downtown Estes Park, and these spaces are largely
filled by employees of the local shops and restaurants. This also causes delays for visitors

36
who are trying to get to the park but must pass through downtown en route (Villwock-
Witte & Collum, 2012). The fact that employees and residents are beginning to use the
shuttles is of great value to the community as a whole, as this has potential to keep many
cars out of downtown, thereby opening up more parking spaces. Furthermore, while
employees might stay parked for up to eight hours or more based on the length of their
shift, visitors tend to stay parked for only a couple of hours. By encouraging local
employees and residents to park at the eastern park-and-ride, or access a shuttle from
another part of town closer to their home, the turnover of parking spots in town can be
greatly increased, helping to assuage congestion. Acadia National Park has experienced
similar unanticipated benefits from their shuttle system, where many youth and
employees have been found to use the system (Zimmerman, Coleman, & Daigle, 2003).
Although ridership onboard the Silver Route shuttle was low during the pilot
season, the shuttle did receive high evaluative marks. Users found the shuttle to be easy
to use and convenient, indicated high levels of enjoyment, and expressed that they would
use the shuttle again. We also asked if the shuttle provided enough room for gear or made
it difficult to travel with children, as previous studies have found that automobile users
often cite space and ease with children as advantages of cars over shuttles (White, 2007;
Youngs, et al., 2008). Our results show that the Silver Route shuttle offered these
amenities. Less than 4% of shuttle survey respondents felt they did not have sufficient
room for their gear or that it seemed difficult to travel with children on the shuttles. Thus,
the Silver Route appears to be performing at a high level. This level of performance must
be maintained, especially as ITS and other travel information sources are expanded to
help increase shuttle use.
37
It is worth noting that 20% of shuttle survey respondents agreed with the
statement ―I had to switch shuttles too many times to get to my desired destination.‖ If a
day visitor wished to visit Bear Lake and decided to use the eastern park-and-ride, they
would have had to transfer shuttles twice to make it from the park-and-ride lot to Bear
Lake. This is an unacceptable number of transfers, especially for a user population that
has little to no experience using public transportation at home (Villwock-Witte &
Collum, 2012). Researchers have stressed that for park transit systems to be competitive,
they must offer a service that is equal or better than that provided by private automobile
(Harrison, 1975). Therefore, we recommend that a stop be added at the eastern park-and-
ride lot along the Hiker Shuttle route, offering a direct route for visitors from the park-
and-ride to ROMO.
The findings from our study reveal the initial impact of the ITS, as well as the
potential of such technologies to contribute to effective management of transportation at
ROMO and Estes Park. It is particularly encouraging that past shuttle use was found to
have such a significant influence on future use of shuttles. By designing and
implementing a truly ―intelligent‖ ITS that offers frequent and direct routes, and by
maintaining and improving the high levels of current shuttle service, visitors can be
influenced to switch travel modes. With the strong correlation between past and future
shuttle use, visitors need only be convinced to give shuttles a chance and these auto-
addicts can be converted to shuttle supporters. Our findings have implications for other
parks that are exploring potential ITS technologies, as well as units that are incorporating
park-and-ride lots into their transportation systems, such as at Acadia National Park in
Maine.
38
Conclusions
Alternative travel modes must account for a larger percentage of visitor
transportation at parks and other public lands that are experiencing increasing crowding
and congestion. ITS offer a valuable tool for travel management in that they can provide
relevant information to help visitors make informed travel decisions. This study
demonstrated the utility of an ITS to increase awareness and use of shuttles at ROMO
and Estes Park. DMS were found to be particularly effective, while the usefulness of the
HAR was less notable. Other findings revealed the potential of the town and park
websites as valuable conduits for travel information, although these tools have yet to be
fully realized. The study also identified the need for direct routes between parking and
popular park attractions in order to make shuttles more attractive to visitors. These
findings and recommendations encompass a number of incentives that can be used to
improve the appeal of shuttles. It remains uncertain, however, if these incentives will be
enough to result in a significant mode shift. In a growing number of parks, shuttles have
been made compulsory at the most popular and congested areas (Harrison, 1975; Sims, et
al., 2005). Without a combination of ITS and other powerful incentives, mandatory
shuttle use may be necessary for certain parts of ROMO.
Despite the utility of the information gleaned from our analysis, our study was
limited in a number of ways. First, because the DMS and HAR were only placed on one
highway for the pilot study, we were only able to measure the influence of the ITS on a
limited portion of the visitor population. Additionally, ridership on the Silver Route
shuttle was very low in its first year of operation and we could therefore only reach a
small number of visitors via the shuttle survey. Based on our results and on anecdotal

39
information from our data collectors, we believe that many people may have been
influenced by the ITS to park at the CVB and access shuttles, or to drive into ROMO and
use the Bear Lake park-and-ride. Unfortunately, our survey design did not enable us to
measure the impact of the ITS on these visitors. Future research should involve surveying
on the Hiker Shuttle which connects to the Bear Lake park-and-ride, as well as on the
other shuttles located within ROMO.
There is also a need to understand who is likely to use shuttles in park and
recreation settings, and how these visitors can be influenced to shift travel modes (Holly,
et al., 2010). Attitude theory, specifically the theory of planned behavior (Ajzen, 1991),
provides an ideal framework for examining the beliefs that influence travel behavior. The
theory may be used to identify interventions for improving visitors‘ attitudes towards and
perceptions of alternative transportation, as well as improve the prediction of shuttle use
(Daigle & Zimmerman, 2004b; Fishbein & Ajzen, 2010). In the next chapter, we apply
the theory of planned behavior in an attempt to explore its potential contribution to
transportation research in recreation settings.

40
CHAPTER 2
INTELLIGENT TRANSPORTATION AND THE THEORY OF PLANNED
BEHAVIOR: TARGETING POTENTIAL MODE-SHIFTERS TO INCREASE
VOLUNTARY SHUTTLE USE WHILE RECREATING
Introduction
―As parks and protected areas continue to implement alternative transportation
strategies, it is important to understand both who is likely to use public
transportation in parks and why visitors are making these decisions.‖ – Holly et
al. (2010)
It is widely acknowledged that excessive use of private automobiles is one of the
most critical threats to the natural and cultural wellbeing of America‘s parks and public
lands. Since as early as 1908, automobiles have been linked to the park experience
(Louter, 2006) and have required ever expanding infrastructure to accommodate their
presence (Dilsaver & Wyckoff, 1999). Consequences of this car-dominant transportation
culture include congestion and crowding at popular park attractions, air and noise
pollution, erosion caused by cars parked outside of designated areas, and threats to the
safety of visitors and wildlife alike (Hallo & Manning, 2009; Sims, et al., 2005; Youngs,
et al., 2008).
In an effort to alleviate some of these transportation issues, several parks and
public lands have implemented alternative transportation systems (ATS). The National
Park Service (NPS) in particular has made the choice not to build new roads, but rather to
41
invest in ATS. Alternative transportation includes any alternative to the private
automobile, such as buses, trains, trams, ferries and hiking and biking trails (White,
2007). ATS refers to systems of transportation to, in and around public lands that
combine alternatives in order to reduce visitor reliance on private automobiles. The NPS
now has 110 alternative transportation systems in 81 park units throughout the United
States (National Park Service).
Visitor shuttles are the most popular alternative and shuttle systems can now be
found at parks, wildlife refuges and national forests throughout the country. Some parks,
such as Denali, Great Smoky Mountains and Zion National Parks, have implemented
mandatory shuttle systems at the most popular areas within the parks. Studies of these
mandatory shuttles have revealed higher support for these systems than anticipated
(Harrison, 1975; Sims, et al., 2005). Despite this, researchers have stressed visitors‘
preferences for incentives, such as free shuttles, over disincentives, like policies
restricting automobile access (Anable, 2005; Holly, et al., 2010). Owing to the strong
influence of public opinion in park management, the majority of ATS are optional to
visitors. This makes it all the more important that visitors are aware of ATS and that the
services provided by shuttles are comparable to those afforded by private automobiles.
Thus, many researchers have applied qualitative and quantitative methods to identify the
most effective ways of promoting alternatives and encouraging voluntary use of ATS
(Holly, et al., 2010; Shiftan, Vary, & Geyer, 2006; White, 2007).
Presently, managers are looking to intelligent transportation systems (ITS) as a
tool for increasing shuttle awareness. ITS are an approach to transportation management

42
that use information technologies to provide pertinent travel information to visitors
(Sheldon, 1997). This information serves to attract potential ATS users. Various ITS
technologies exist and can be combined according to specific needs and preferences. For
example, route guidance systems are used to keep shuttles on schedule, highway advisory
radio is used to provide shuttle information as well as traffic and weather conditions, and
electronic message signs can be placed along approach roads to display short, concise
messages informing motorists of parking conditions and alternate travel modes. Other
technologies include global positioning systems, electronic signs that display real-time
arrival and departure of shuttles, and two-way voice communication which allows drivers
to communicate between buses (Daigle & Zimmerman, 2004a; Sheldon, 1997).
ITS technologies have been tested at Acadia, Arches, Grand Canyon, and Sequoia
and Kings Canyon National Parks, among others (Daigle & Zimmerman, 2004a, 2004b;
G. Dilworth & Shafer, 2004; Lawson, et al., 2003; Christopher Strong, et al., 2007).
These studies have made a strong case for ITS as an effective tool for travel management.
Nevertheless, a better understanding of visitor attitudes towards alternative transportation
is necessary to reap the full benefits of ITS. By understanding the factors that influence
mode choice, appropriate technologies can be implemented and smart messaging can be
employed to attract more users to ATS.
Study Context
More than three million visitors a year travel to Rocky Mountain National Park
(ROMO) and the majority accesses the park via the eastern gateway community of Estes
43
Park, Colorado. Over half of the annual visitation is concentrated within the summer
months of June, July and August, resulting in bottlenecking in downtown Estes Park
(National Park Service).
In the 1970‘s, a visitor transportation system was implemented inside ROMO to
help mitigate the crowding and congestion caused by the profusion of private
automobiles. The transit system has since gained popularity, evolving into a regional
transportation system. Seven routes now exist to provide visitors with free, frequent
access to lodging, shops and restaurants within Estes Park, and many of the most popular
areas within ROMO. Overnight visitors can leave their cars at their lodging and day-
visitors can park at one of several park-and-ride lots located in town and within the park.
Nearly half a million rides were provided by the transit system in 2010 (Villwock-Witte
& Collum, 2012), but even with the shuttles‘ growing popularity, cars remain the
preferred mode by the overwhelming majority.
The parking lots of two of the most popular recreation areas within the park,
Glacier Gorge and Bear Lake, reach capacity as early as 8am and 10am respectively
(Villwock-Witte, et al., 2011). Congestion within Estes Park causes traffic delays, and
shuttle drivers struggle to stay on schedule. ROMO and Estes Park managers have
recognized that the status quo is not sustainable and are taking strides to improve the
transportation system, thereby increasing ridership and improving the overall visitor
experience.
In the summer of 2011, a pilot study was conducted to explore the potential of an
ITS consisting of dynamic message signs (DMS) and highway advisory radio (HAR) to

44
increase awareness and use of the shuttle system. The DMS were placed along a major
route on the approach to Estes Park from the east. Messages were displayed on the signs
informing motorists of parking conditions within the park and recommending the use of a
newly constructed park-and-ride located just before downtown Estes Park. The DMS also
displayed the station number for the HAR, where motorists could tune-in and listen to a
recorded message detailing parking and transportation options, as well as directions to the
park-and-ride. Once at the lot, visitors could board a free shuttle to the Estes Park
Convention and Visitors Bureau, where they could then connect to any of various shuttle
routes servicing the town and the park.
This chapter details the results of a survey that applied the theory of planned
behavior in an attempt to understand the motivations behind mode-choice at ROMO and
Estes Park. By understanding the factors that influence mode choice, we can determine
who is likely to use shuttles and how those people can best be motivated. This knowledge
will enable managers to maximize the value of ITS technologies. The objectives of this
study are to:
1. Examine the utility of the theory of planned behavior to predict choice of
travel mode in a recreation setting.
2. Determine if past behavior can be added to our model to improve the
predictive power of the theory of planned behavior.

45
3. Apply the theory of planned behavior to determine distinct segments of
visitors in regard to their beliefs about transportation, so as to determine
the best methods for promoting shuttles in Estes Park and ROMO.
Conceptual Framework
Mode Choice and the Theory of Planned Behavior
ATS can now be found at public lands across the United States, but the issue
remains of how to encourage visitors to leave their private automobiles behind and opt
for alternative transportation instead. Historically, the most commonly used predictors of
public transit use have been sociodemographic variables such as age, gender and income
(Heath & Gifford, 2002). However, a number of studies have shown that psychological
variables are often more powerful predictors of behavior, and consequently attitude
theory is commonly used in transportation studies.
The theory of planned behavior (Ajzen, 1991; Fishbein & Ajzen, 2010) is perhaps
the most commonly used theory for exploring the factors that influence mode choice.
According to the theory, human behavior, so long as it is under a person‘s volitional
control, is guided by reason, and people reason using three kinds of beliefs. First, people
hold beliefs about the positive and negative outcomes associated with performing a
behavior. These beliefs are referred to as behavior beliefs, and they are assumed to
influence people‘s attitudes towards a given behavior. Second, people form normative
beliefs, which are beliefs about whether important individuals and groups in their life will

46
approve or disapprove of their performing the behavior in question, and whether those
important individuals/groups would perform the behavior themselves. Normative beliefs
produce subjective norms, which are the perceived social pressures to perform or not
perform a behavior. Finally, people form control beliefs about the internal and external
factors that will aid or inhibit them from performing a behavior. This results in perceived
behavioral control (PBC), or the perceived ease or difficulty of performing the behavior.
Once formed, attitude, subjective norm, and PBC influence people‘s intention to perform
a behavior. The more favorable the attitude, subjective norm and PBC, the stronger the
intention to perform the behavior. Intention is therefore the immediate antecedent of
behavior. Given a strong degree of actual control, intention serves as a strong predictor of
behavior. According to the theory, it is then possible to influence intention and thereby
behavior by introducing a structural intervention designed to effect attitude, subjective
norm, and/or PBC toward a given behavior (Fishbein & Ajzen, 2010).
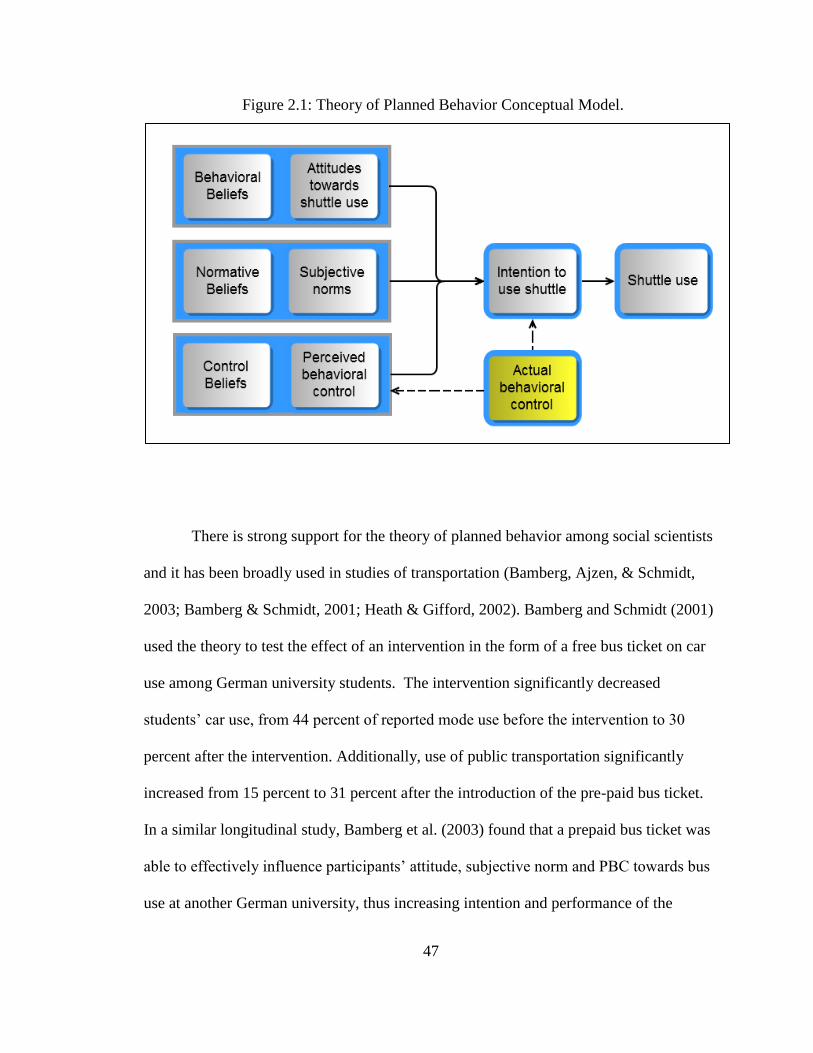
47
Figure 2.1: Theory of Planned Behavior Conceptual Model.
There is strong support for the theory of planned behavior among social scientists
and it has been broadly used in studies of transportation (Bamberg, Ajzen, & Schmidt,
2003; Bamberg & Schmidt, 2001; Heath & Gifford, 2002). Bamberg and Schmidt (2001)
used the theory to test the effect of an intervention in the form of a free bus ticket on car
use among German university students. The intervention significantly decreased
students‘ car use, from 44 percent of reported mode use before the intervention to 30
percent after the intervention. Additionally, use of public transportation significantly
increased from 15 percent to 31 percent after the introduction of the pre-paid bus ticket.
In a similar longitudinal study, Bamberg et al. (2003) found that a prepaid bus ticket was
able to effectively influence participants‘ attitude, subjective norm and PBC towards bus
use at another German university, thus increasing intention and performance of the

48
behavior. The intervention resulted in an impressive mode shift, more than doubling the
number of students who rode the bus to campus. Similar results were found in a study at a
Canadian university, where the introduction of an unlimited regional transit pass was
used as a structural intervention (Heath & Gifford, 2002).
Building on the Theory of Planned Behavior
Fishbein and Ajzen (2010) have invited research that proposes additional
constructs to the theory of planned behavior in order to increase its predictive power.
Several transportation studies have attempted to do so, such as Heath and Gifford (2002),
who proposed the addition of descriptive norms, moral (or personal) norms,
environmental values, perceived responsibility for and awareness of problems caused by
car use, and an interaction effect between PBC and intention. Of these constructs, the
addition of descriptive norm (i.e. what most people would do in a given situation) and an
interaction effect between PBC and intention significantly improved the prediction of
mode choice. The existence of an interaction effect was acknowledged in earlier studies
(Ajzen, 1991; Terry & Oleary, 1995), which recognized that if a person perceives strong
control over a behavior, intention should serve as a more powerful predictor of behavior,
while if PBC is weak, performance of the behavior is unlikely regardless of intention.
Past behavior has been suggested as an additional predictor by several
researchers. Though Fishbein and Ajzen (2010) have argued that past behavior cannot be
used in casual models of human behavior, Ouellette and Wood (1998) rebutted that no
theory has attained enough success at predicting behavior as to dismiss past behavior as
49
simply ―error variance.‖ In a meta-analysis of 64 studies, the authors examined other
predictors of intention and behavior in order to surmise the independent effects of past
behavior after controlling for attitudes, subjective norms and PBC (Ouellette & Wood,
1998). Of the 13 studies that included past behavior in the regression models predicting
behavior, 11 revealed a statistically significant relationship between past and future
behavior. The authors concluded that there is a strong correlation between the
performance of a behavior and the stability of the context within which it is performed.
Past behavior was a weaker predictor in unstable contexts and for behaviors which are
performed only once or twice annually, while it was a strong predictor for behaviors that
are performed on a daily or weekly basis.
Despite this and other research, Fishbein and Ajzen (2010) argue that only
attitude, subjective norm, PBC and intention meet the criterion of causality and can be
used to explain later action. While past behavior has been found to explain up to ten
percent of additional variance when added with the four main constructs of the theory,
the authors hold that past behavior overlaps with the existing constructs and is not
conceptually independent. Instead, the authors contend that past behavior can be used as
a measure of habit strength. Bamberg et al. (2003) tested the frequency of past behavior
as an independent measure of habit strength using a fast-response index adapted from a
previous study (Verplanken, Aarts, Vanknippenberg, & Vanknippenberg, 1994).
Participants were presented with a set of alternative transportation choices (car, bus, train
or bike) and asked to select their preferred travel mode as quickly as possible for a
number of hypothetical situations. In the context of habit strength, past behavior was
found to have a significant impact on later behavior, though following the intervention

50
past behavior declined in predictive ability. The authors concluded that as long as
conditions remain stable, past experience retains predicative power, but once conditions
change, as with the introduction of an intervention, past behavior and habit become less
powerful predictors and behavior is based primarily on reason.
In an urban study of mode preference in the United Kingdom, additional
constructs were proposed: environmental concern and control, descriptive and personal
norms concerning mode choice, and attitudes, norms and PBC concerning non-car
transportation modes. Environmental concern and control proved weak predictors, while
descriptive and personal norms accounted for a significant increase in explained variance
(Gardner & Abraham, 2010). This corroborates with the findings of Heath and Gifford
(2002) and others (Devries, Backbier, Kok, & Dijkstra, 1995).
A recent study by Haustein and Hunecke (2007) added perceived mobility
necessities (PMN) as a new predictor for the theory of planned behavior. PMN is defined
as the perceived need to be flexible and spontaneous in one‘s mobility, and is defined by
socioeconomic variables like employment and household structure. Using an initial
survey of 1,545 participants and in-depth interviews with 82 participants, PMN was
found to moderate the relationship between attitude and intention directly, though PBC
had both a direct and indirect effect on intention (Haustein & Hunecke, 2007). Further
research will be necessary to reveal the usefulness of PMN as a predictor of mode choice.
Though the theory of planned behavior has been applied to urban transit studies as
well as recreation studies ranging from leisure choice (Ajzen & Driver, 1992) to hunting
and wildlife viewing (Daigle, Hrubes, & Ajzen, 2002; Hrubes, Ajen, & Daigle, 2001),

51
few studies have applied the theory to a study of transportation within a recreation
setting. Dilworth (2003) used the theory in a study of attitudes toward transportation at
two national parks in California and found that attitudes regarding the appropriateness of
ITS technologies were predictive of intentions to use the DMS and HAR. The author also
found that higher prior experience with public transportation was a significant predictor
of intention to use shuttles at the parks (V. A. Dilworth, 2003). However, these parks are
located near urban areas where exposure to public transportation is much higher than in
rural park settings. It still remains unclear if past experience with public transportation
can serve as a good predictor of transit use in recreation settings. Our study adds to the
literature by using the theory of planned behavior as a conceptual framework for
predicting voluntary shuttle use at ROMO and Estes Park. Despite the debate among
researchers, past behavior has been shown to significantly contribute to behavior
prediction in stable settings. Therefore, previous experience with shuttles in urban and
recreation settings is explored as an additional predictor of mode choice.
Segmentation Analysis
Segmentation, or the act of defining meaningful sub-groups of individuals, has
been widely used in consumer studies to identify homogenous groups in order to tailor
specific marketing campaigns and policies (Wedel & Kamakura, 2000). For a given
behavior, individuals are grouped into specific segments using sociodemographic
characteristics or by using multivariate statistical analysis to categorize unique clusters
based on psychological factors (Anable, 2005). While a multitude of literature exists on

52
the psychological determinants of mode choice, few transportation studies have
combined segmentation and attitude-theory.
Early studies almost exclusively used sociodemographic variables to assign
segmentation, but over the last two decades researchers have demonstrated the value of
segmenting based on attitude (Hunecke, Haustein, Bohler, & Grischkat, 2010; Jensen,
1999; Pas & Huber, 1992; Redmond, 2000). In a study of potential rail travelers in the
United States, Pas and Huber (1992) identified five distinct groups from a sample of 333
survey participants based on attitudes towards various transport services. Jensen (1990)
used qualitative interviews to determine segments and their differing attitudes and
motivations for using cars, bicycles and other public transport. This research revealed the
efficacy of segmentation for simplifying the complex structure of travel markets.
Redmond (2010) used cluster analysis to segment mobility behavior based on
lifestyle and personality traits, and these variables were also found to be superior in
predictive ability than sociodemographic variables such as age, gender, and income.
More recently, Hunecke et al. (2010) used an expanded version of the theory of planned
behavior to show that segmentation based on psychological variables has more predictive
power than segmentation based on sociodemographic variables.
Few studies, however, have combined segmentation and attitude-theory in the
context of recreation. In a study on National Trust lands in the United Kingdom, Anable
(2005) used an expanded version of the theory of planned behavior to categorize 666
mail-survey participants into six distinct segments. The groups ranged from ―Die Hard
Drivers‖ to ―Car-less Crusaders,‖ and the individual members varied widely in terms of
53
sociodemographic characteristics. One segment referred to as ―Complacent Car Addicts‖
felt that they had the ability to switch from cars to alternative travel modes, but felt no
moral obligation to do so. On the other hand, the segment ―Aspiring Environmentalists‖
had already reduced their car use for environmental reasons, but were reluctant to give up
their cars entirely. This study demonstrated the utility of cluster analysis for identifying
specific groups for targeted marketing campaigns.
Our study builds on this research, combining the theory of planned behavior and
segmentation analysis to identify unique segments of travelers so as to determine the
factors effecting mode choice for these specific groups. By doing so, empirically sound
strategies can be devised to effectively promote and encourage the use of alternative
travel modes. Information technologies such as ITS are becoming common tools for
encouraging mode shifting in parks, but only by determining the psychological factors
behind mode choice will managers be able to implement the most effective and
persuasive messaging via ITS.
Methodology
Sampling Procedure
The data used for this analysis were collected as part of a larger effort to evaluate
the effectiveness of the pilot ITS at ROMO and Estes Park during the summer of 2011.
Visitors to the area were asked to participate in an on-site survey designed to evaluate
their awareness and use of the ITS. Sampling for this survey took place on-board a newly
54
designed shuttle route, as well as at a local visitor center and a small community park
located in downtown Estes Park. After completing the on-site survey, all respondents
were invited to participate in a mail survey which was designed to yield indepth
information regarding visitor attitudes and beliefs about various travel modes and travel
information sources. For the purpose of this evaluation, we focus only on the results of
the mail survey.
Those who agreed to participate in the mail survey provided their name and
mailing address on a card and a survey was sent to them within three weeks. The survey
was administered using the Dillman Tailored Design Method (Dillman, Smyth, &
Christian, 2008). A four-wave treatment was implemented over a seven week period,
consisting of 1) an invitation letter, survey, and postage-paid return envelope to all
participants, 2) a post-card reminder and thank you, 3) a replacement questionnaire for
participants that had not yet completed surveys, and 4) a final appeal to non-respondent.
In total, 558 people completed an on-site survey and of those, 233 people, or 41.8
percent, agreed to participate in the extended study.
Questionnaire
The questionnaire was divided into four sections: 1) About your use of visitor
shuttles, 2) About your opinions towards shuttle use, 3) About how you plan for trips, and
4) About you. The questions in the first three sections were designed to measure the
components of the theory of planned behavior (TPB): attitude, subjective norm, PBC,
intention and behavioral beliefs. These questions were adapted from Bamberg (2003) and
55
the variables used to measure the components were developed using previous TPB
studies (Bamberg, et al., 2003; Hrubes, et al., 2001). Questions were also asked regarding
past experience using shuttles at home and in recreation settings. In the final section
respondents provided demographic information including age, gender, education, number
of previous visits, type of travel group, and accommodations used.
To explore potential interventions, respondents were asked to indicate how their
future use of visitor shuttles would be influenced by eleven hypothetical scenarios.
Respondents used a 4-point categorical scale (not at all increase my use, somewhat
increase my use, strongly increase my use, not sure) to evaluate such scenarios as rising
gas prices, vouchers for discounts at shops in downtown Estes Park, and extended hours
on all shuttle routes. These data are used in our analysis to evaluate potential strategies
for increasing shuttle use, as well as to recommend interventions that could be tested as
part of a future study.
TPB Constructs
To measure the four TPB constructs, questions were adopted from Bamberg et al.
(2003). Two questions were used to measure each construct on a 5-point Likert scale. For
attitudes towards shuttle use, respondents were asked to evaluate whether taking the
visitor shuttle on their next visit to Estes Park/ROMO would be extremely pleasant-
extremely unpleasant and extremely good-extremely bad. For subjective norms,
respondents indicated on a scale from extremely likely-extremely unlikely their agreement
that most people who are important to them would support their decision to take a visitor
56
shuttle next time, and most people who are important to them think they should take the
visitor shuttle next time. To measure PBC, respondents rated their ability to take the
visitor shuttle next time (extremely high-extremely low) and the difficulty of taking the
visitor shuttle next time (extremely easy-extremely difficult). In measuring behavioral
intention, respondents indicated the strength of their intention to take the visitor shuttle
next time (extremely strong-extremely weak) and the likelihood of their taking the visitor
shuttle next time (extremely likely-extremely unlikely).
Behavioral Beliefs
Behavioral beliefs were measured by having respondents assess the likelihood of
different outcomes that could potentially result from using visitor shuttles at Estes Park
and ROMO. Ten outcomes, both positive and negative, were rated on a 5-point scale
(extremely likely-extremely unlikely). Outcomes included reducing tension and stress
caused by driving, feeling crowded and touristy, saving money by not using gas, and
feeling rushed or short on time. Respondents also evaluated the ten outcomes by
indicating the desirability of each on a 5-point scale (extremely desirable-extremely
undesirable).

57
Behavior and Past Behavior
The following yes/no question was used to measure behavior: during your most
recent visit to Estes Park/ROMO, did you use a visitor shuttle? As a measure of past
behavior, two questions were asked using a 5-point bipolar response scale. The first
asked respondents to indicate how often they used five various modes of transportation
(car, visitor shuttle, bicycle, walking, group tour bus) when visiting parks and recreation
areas (never-always). The second question asked how often they use public transportation
at home (never-almost every day). For the regression analysis, past visitor shuttle use
when visiting a park or recreation area is referred to as VS experience, and past public
transportation use at home is referred to as PT experience.
Use of Travel Information Sources
Three questions were used to evaluate visitor use of travel information. First,
respondents rated the usefulness of thirteen travel information sources on a 5-point
bipolar scale (very useful-not at all useful). Information sources included various
websites, printed material, electronic technologies, and human resources. Next,
respondent were asked to indicate which mode(s) of transportation they planned to use
and which mode(s) they actually used on their most recent visit to Estes Park/ROMO.
Five transportation modes were evaluated: car, visitor shuttle, bicycle, walking and group
tour bus. Respondents were given a score of 1 for each mode used and a score of 0 for
each mode they did not use. We focus on planned and actual use of cars and visitor
shuttles to evaluate the potential for ITS.
58
Data Analysis
The data from our survey were compiled into Excel 2010 and analyzed using
SPSS 16.0. Descriptive statistics examined include mean, standard deviation, frequency
and variance. K-means cluster analysis was used for segmentation analysis. Differences
between visitor segments were analyzed with Pearson‘s chi-square test for categorical
data and one- way ANOVA. For all analyses using ANOVA, post hoc comparisons were
made using Tukey‘s honestly significant difference (HSD) test. Hierarchical logistic
regression was used to measure the influence of the TPB constructs on the dichotomous
dependent variables of behavior and intention in regards to shuttle use. The acceptable
probability level for rejecting the null hypothesis for all statistical tests was set at p <.05
(Vaske, 2008).
Cronbach‘s alpha was used to estimate the internal consistency of the item-pairs
used to measure attitude, subjective norm, PBC, and intention regarding shuttle use. The
resulting alpha for each item-pair was quite high (.85, .80, .82, and .96 for attitude,
subjective norm, PBC and intention, respectively). By convention, .80 or higher
constitutes a ―good scale‖ (Vaske, 2008). The item pairs for each of the four constructs
were therefore summated to form an aggregate index which is used for the regression
portion of our analysis.
As a measure of reliability, Pearson‘s chi-square (X2) test of independence was
used to measure non-response bias. It has been shown that later respondents have a
tendency to be like non-respondents (Armstrong & Overton, 1977), therefore, survey
respondents were divided between first and last wave respondents and comparisons were

59
made for five variables of interest. These comparisons revealed no significant difference
between first and last wave respondents on age (X2=49.1, 56 df, p=.731), gender
(X2=.371, 1 df, p=.543), education (X
2=.259, 3 df, p=.968) , first time or return visitors
( X2=.256, 1 df, p=.613), and use of shuttles at Estes Park/ROMO (X
2=.043, 1 df,
p=.835).
Results
Survey Response Rate and Demographics
The survey was administered by mail to 222 ROMO and Estes Park visitors. The
survey had a response rate of 72.4 percent (N=155), with 8 surveys returned as
undeliverable. Eleven respondents requested to complete the survey on-site rather than
have the survey mailed to their home, resulting in a total of 166 completed surveys.
Our sample was approximately evenly divided between males and females, with
an average age of 48.1 years old. Respondents were predominately overnight visitors (67
percent) and highly educated, with more than 70 percent reporting a Bachelor‘s degree or
higher and less than five percent reporting a high school diploma or less (Table 2.1). This
high level of education is consistent with the findings of a previous study of ROMO
visitors (Blotkamp, 2010).

60
Table 2.1. Demographic Characteristics of Survey Participants Demographic Characteristics N %
Gender
Male 83 50.6
Female 81 49.4
Age in years
Mean 48.1
Education
High school or less 8 4.8
Some college 41 24.8
Bachelor‘s degree
Graduate degree
Length of stay
Day-visitor
Overnight visitor
Local resident
Used Shuttles
Yes
58
58
48
111
6
78
35.2
35.2
29.1
67.3
3.6
47.0
Approximately 30 percent (N=51) of respondents were first time visitors, while
15 percent (N=25) had visited the area once before, 15 percent (N=24) had visited two or
three times, and 40 percent (N=66) had visited 4 times or more. The majority (65 percent,
N=107) was traveling with family, 11 percent (N=19) were traveling with friends, 13
percent (N=21) were traveling in a mixed party of friends and family, and 5 percent
(N=9) were traveling alone. Only 2 percent (N=3) of respondents were traveling as
members of a group or club.
Forty seven percent (N=78) of respondents reported that they used a visitor shuttle
on their most recent visit to Estes Park/ROMO. Respondents were then asked to indicate
to what degree the price of gasoline influenced their decision to use a visitor shuttle. The
idea was that if the price of gasoline had a noteworthy effect on visitors‘ decisions to use
shuttles, the cost savings associated with shuttle versus automobile use could be used as
an effective marketing tool. However, 78 percent (N=59) of those who used shuttles
indicated that the price of gasoline did not influence their decision to use a shuttle.
61
Twenty-one percent (N=16) said that it somewhat influenced their decisions, and only
1% (N=1) indicated that it completely influenced their decision.
Preliminary Analysis
Before we move to the primary analyses of our study, it is important to have some
indication that ITS can be successfully implemented at ROMO and Estes Park. ITS
provide visitors with traveler information so that they can make informed travel
decisions, but this often requires visitors to change plans that they have already made for
their trip. Therefore, we wanted to compare planned and actual mode use to see if visitors
were willing to change their plans when given useful travel information.
Respondents were instructed to indicate each mode of transportation they planned
to use and each mode they actually used on their most recent visit to the area. Ninety four
percent (N=156) of respondents reported that they planned to use a car, and 24 percent
(N=39) planned to use a visitor shuttle. However, 91 percent (N=151) reported that they
actually used a car, and 44 percent (N=73) reported that they ended up using a visitor
shuttle. Although car use remained high, there was an 83 percent increase in actual
shuttle use as compared to planned shuttle use. Respondents provided written
explanations if their actual mode use differed from their planned use. The most common
responses provided were a variation of ―we did not know about the shuttle before we
came,‖ and ―parking was limited.‖ This shows that given relevant travel information,
such as information about alternative travel options and updates on parking lot
conditions, some segments of visitors are willing to switch travel modes.
62
Segmentation Analysis
To determine unique segments of respondents, K-means cluster analysis was run
using the eight TPB questions addressing visitor attitudes, subjective norms, PBC and
intentions towards shuttle use. Cluster analysis yields statistically significant and distinct
segments of respondents in terms of the heterogeneity of responses toward the questions
included in the analysis. The K-means clustering assigned the survey participants
(N=164) to their respective groups based on their responses to the TPB questions on a 5-
point Likert scale. Two-, three-, and four-cluster solutions were analyzed, ultimately
settling on a three-cluster solution based on the effectiveness of the solution and ease of
interpretation for our purposes. The three-cluster solution was then used with analysis of
variance (ANOVA) and Pearson‘s chi-square to explore how segments differed in their
demographics, use of various modes of transportation, perceptions of shuttles, and
information source preferences.

63
Table 2.2. Visitor Segments
TPB Constructs
Shuttle Shunners
(N=24)
Potential Mode-
shifters (N=47)
Bus Backers
(N=93)
Attitude 1 2.75 3.40 4.40
Attitude 2 2.58 3.53 4.56
Subjective norm 1 2.38 3.60 4.61
Subjective norm 2 1.96 2.96 3.86
PBC 1 1.75 3.38 4.55
PBC 2 2.42 3.33 4.51
Intention 1 1.57 2.93 4.37
Intention 2 1.48 3.11 4.46
Note: Items measured on a 5-point Likert scale with 5 indicating a more positive response.
Demographics
Shuttle
Shunners
Potential
Mode-shifters
Bus
Backers
Female (%) 56.5 46.8 49.5
Age 51.1a 46.0
a 48.4
a
First visit (%) 25.0 23.4 35.5
Day visitor (%) 30.4 40.4 23.7
Bachelor‘s Degree or higher (%) 70.8 60.9 76.3
Used shuttles (%) 12.5 25.5 67.7*
*p-value >.05 a
=statistically similar
Shuttle Shunners was the label chosen for the smallest segment. Members of this
segment have the most negative attitudes towards shuttles, believe that it is unlikely that
friends or loved ones feel they should use shuttles or would support their decision to use
shuttles, and feel they have little control over their ability to use shuttles. Overall,
members of this segment have the significantly lowest intent to use visitor shuttles on
their next visit to Estes Park/ROMO.
In contrast, members of the group Bus Backers have the significantly highest
intent to use visitor shuttles on their next trip. True to their name, members of this group
have positive attitudes toward shuttles and find them to be pleasant. Members of this
segment believed it likely that people who are important to them would support their
decision to use shuttles, though they were slightly less confident that these important

64
people felt they should use shuttles. It is important to note that this group also reported
the highest perceived behavioral control in regard to shuttle use, indicating that they have
high ability to use shuttles and that engaging in the behavior would be easy.
The third segment, Potential Mode-shifters, contains respondents who are more
neutral in their beliefs about and intentions to use shuttles. These respondents lack strong
attitudes toward shuttles. Likewise, they are uncertain of how important people in their
life would feel about their using shuttles, or believe those people lack an opinion about
the matter. The Potential Mode-shifters appear to be indifferent to using shuttles on their
next visit, either because they simply do not care to or perhaps because of their limited
experience with shuttles. Whatever the reason, this group contains the best hope for mode
change, as they lack strong opinions one way or the other. As this group is so neutral in
their attitude, subjective norm and PBC concerning shuttle use, they are the most
susceptible to interventions designed to encourage shuttle use.
As previously discussed, market segmentation has historically relied on
sociodemographic traits, but recent research has shown that ―attitudes and opinions
largely cut uniformly across demographic characteristics (Anable, 2005).‖ Our analysis
supports this conclusion. While all three segments were significantly unique, there were
no significant differences in demographic characteristics including gender, age,
education, whether they were first time visitors, or whether they were day visitors. The
only significant difference between the segments was the use of shuttles at ROMO and
Estes Park. A significantly higher percentage of Bus Backers reported that they used
shuttles on their most recent visit (Table 2.2).

65
The questions pertaining to the TPB constructs were summated to create an
aggregate measure for each construct, which is used later for the hierarchical regression
analysis. Table 2.3 shows the aggregate measures by segment. The three segments are
statistically different on all TPB measures. However, all three groups are statistically
similar in that they all ―never‖ or ―hardly ever‖ use public transportation at home. Bus
Backers are significantly different from Shuttle Shunners and Potential Mode-shifters in
that they reported higher use of shuttles when visiting national parks or other recreation
areas.
Table 2.3. Means and Standard Deviations for Aggregate TPB Constructs
Related to Shuttle Use Shuttle
Shunners
Potential Mode-
shifters
Bus
Backers
Attitudes 2.67 (0.73) 3.47 (0.48) 4.48 (0.48)
Subjective norm 2.20 (0.73) 3.28 (0.62) 4.23 (0.53)
Perceived behavioral control
Intention
Use of public transportation at home
Use of shuttles when visiting
a national park or recreation area
2.08 (0.65)
1.52 (0.49)
1.92 (1.21)
1.53 (0.74)
3.38 (0.45)
3.02 (0.65)
1.72 (0.85)
1.89 (0.89)
4.53 (0.45)
4.42 (0.53)
1.87 (1.01)
2.95 (0.99)
Note: Standard deviations in parentheses. All variables measured on a scale from 1 to 5 with higher
numbers indicating more positive attitudes and norms, higher perceptions of control and intentions,
and more frequent use of public transportation.
Next, we compared the mean desirability strength for outcomes associated with
shuttle use to the mean belief strength for each of the outcomes, by segment. The three
segments were statistically similar in their levels of desire for outcomes resulting from
shuttle use, with only two exceptions. Bus Backers rated the desirability of reducing the
tension and stress caused by driving and of alleviating the stress related to finding
parking significantly higher than Shuttle Shunners and Potential Mode-shifters (Table
2.4).
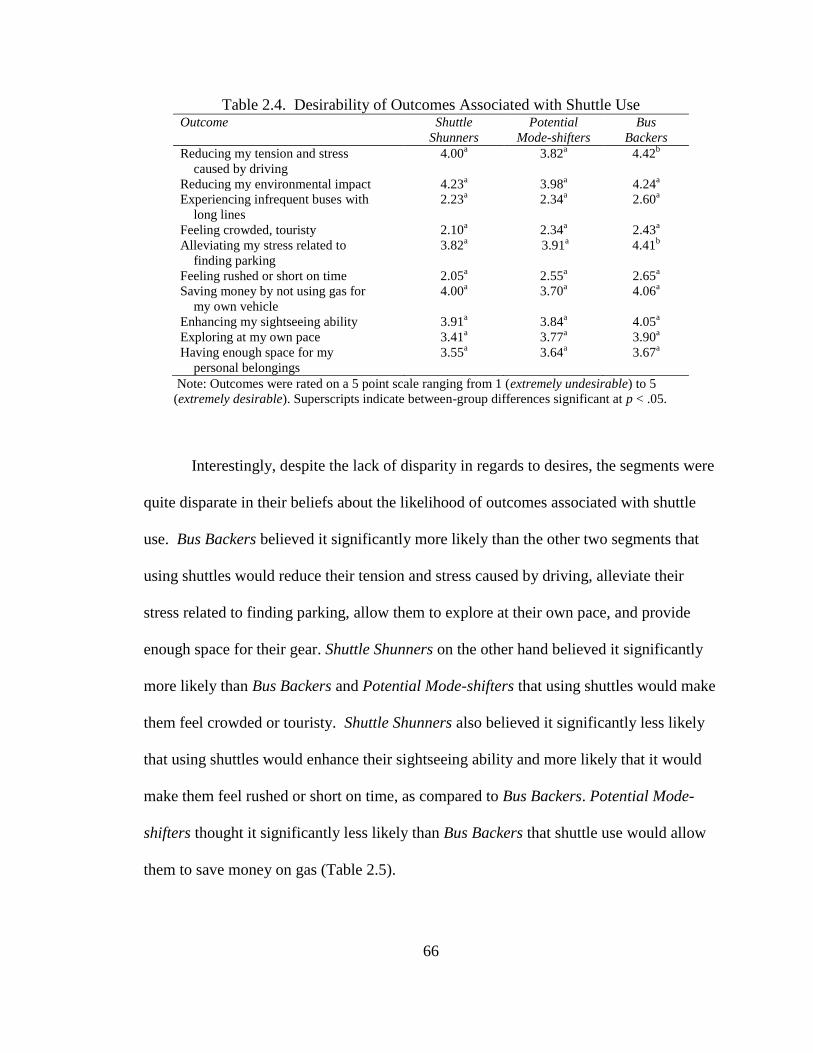
66
Table 2.4. Desirability of Outcomes Associated with Shuttle Use Outcome Shuttle
Shunners
Potential
Mode-shifters
Bus
Backers
Reducing my tension and stress
caused by driving
4.00a 3.82
a 4.42
b
Reducing my environmental impact 4.23a 3.98
a 4.24
a
Experiencing infrequent buses with
long lines
2.23a 2.34
a 2.60
a
Feeling crowded, touristy 2.10a 2.34
a 2.43
a
Alleviating my stress related to
finding parking
3.82a 3.91
a 4.41
b
Feeling rushed or short on time 2.05a 2.55
a 2.65
a
Saving money by not using gas for
my own vehicle
4.00a 3.70
a 4.06
a
Enhancing my sightseeing ability
Exploring at my own pace
Having enough space for my
personal belongings
3.91a
3.41a
3.55a
3.84a
3.77a
3.64a
4.05a
3.90a
3.67a
Note: Outcomes were rated on a 5 point scale ranging from 1 (extremely undesirable) to 5
(extremely desirable). Superscripts indicate between-group differences significant at p < .05.
Interestingly, despite the lack of disparity in regards to desires, the segments were
quite disparate in their beliefs about the likelihood of outcomes associated with shuttle
use. Bus Backers believed it significantly more likely than the other two segments that
using shuttles would reduce their tension and stress caused by driving, alleviate their
stress related to finding parking, allow them to explore at their own pace, and provide
enough space for their gear. Shuttle Shunners on the other hand believed it significantly
more likely than Bus Backers and Potential Mode-shifters that using shuttles would make
them feel crowded or touristy. Shuttle Shunners also believed it significantly less likely
that using shuttles would enhance their sightseeing ability and more likely that it would
make them feel rushed or short on time, as compared to Bus Backers. Potential Mode-
shifters thought it significantly less likely than Bus Backers that shuttle use would allow
them to save money on gas (Table 2.5).

67
Table 2.5. Belief Strength for Outcomes Associated with Shuttle Use Outcome Shuttle
Shunners
Potential
Mode-shifters
Bus
Backers
Reduce my tension and stress caused
by driving
3.22a 3.28
a 4.21
b
Allow me to reduce my
environmental impact
3.83a 3.68
a 4.15
a
Make me experience infrequent
buses with long lines
3.52a 3.47
a 3.22
a
Make me feel crowded, touristy 4.09a 3.32
b 2.96
b
Alleviate my stress related to finding
parking
3.09a 3.48
a 4.49
b
Make me feel rushed or short on
time
3.70a 3.21
a,b 2.77
b
Allow me to save money on gas 3.52a,b
3.28a 3.99
b
Enhance my sightseeing ability
Allow me to explore at my own pace
Provide enough space for my
personal belongings
3.00a
2.26a
2.65a
3.34a,b
2.68a
2.98a
3.78b
3.39b
3.56b
Note: Outcomes were rated on a 5 point scale ranging from 1 (extremely unlikely) to 5 (extremely
likely). Superscripts indicate between-group differences significant at p < .05.
This shows that while the segments largely desire the same outcomes, they differ
in their beliefs about whether using shuttles will allow them to realize these outcomes.
The task then must be to convince visitors that shuttles can help them achieve their
desired outcomes.
The three segments were statistically similar in their evaluations regarding the
majority of travel information sources. ―Online‖ and the ―ROMO website‖ were given
the highest usefulness ratings by all three segments. ―Park brochure or map‖ was also
rated as a somewhat to very useful information source by all segments, though this source
was rated significantly higher by Bus Backers. Bus Backers also found the ―park
newspaper‖ to be significantly more useful than did Shuttle Shunners. The same is true
for the highway advisory radio (HAR), though this information source was not rated as
very useful by any of the three segments. The information sources given the lowest
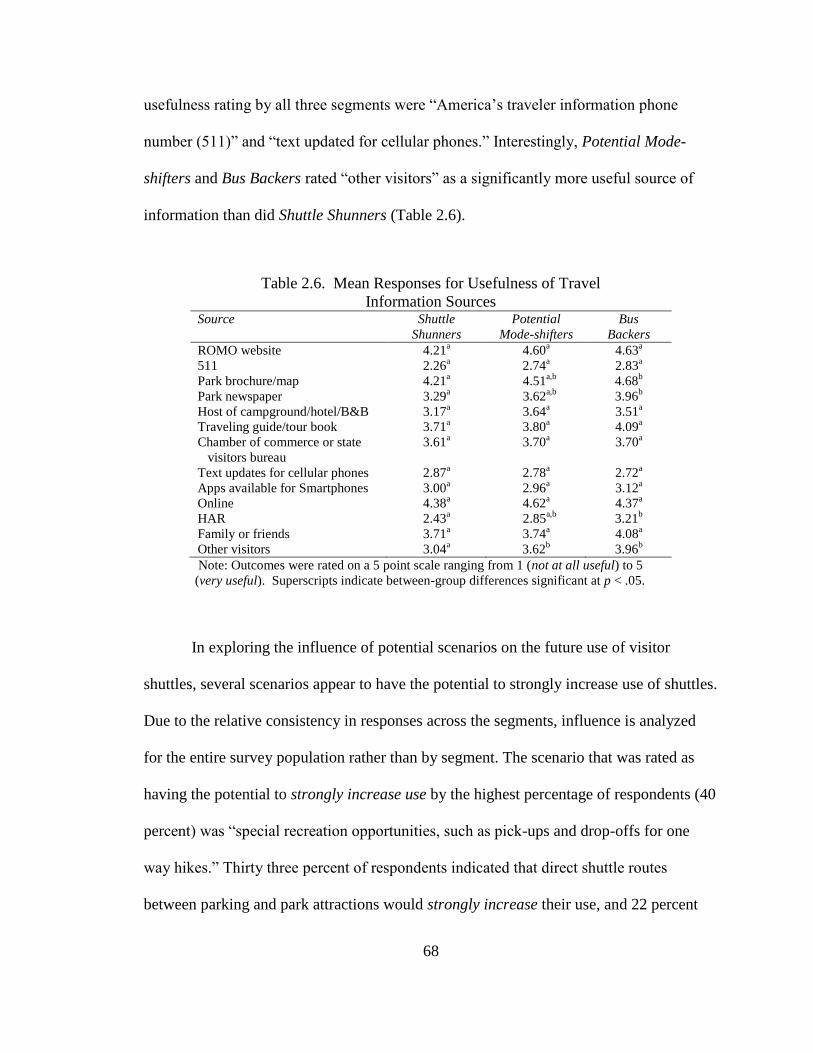
68
usefulness rating by all three segments were ―America‘s traveler information phone
number (511)‖ and ―text updated for cellular phones.‖ Interestingly, Potential Mode-
shifters and Bus Backers rated ―other visitors‖ as a significantly more useful source of
information than did Shuttle Shunners (Table 2.6).
Table 2.6. Mean Responses for Usefulness of Travel
Information Sources Source Shuttle
Shunners
Potential
Mode-shifters
Bus
Backers
ROMO website 4.21a 4.60
a 4.63
a
511 2.26a 2.74
a 2.83
a
Park brochure/map 4.21a 4.51
a,b 4.68
b
Park newspaper 3.29a 3.62
a,b 3.96
b
Host of campground/hotel/B&B 3.17a 3.64
a 3.51
a
Traveling guide/tour book 3.71a 3.80
a 4.09
a
Chamber of commerce or state
visitors bureau
3.61a 3.70
a 3.70
a
Text updates for cellular phones 2.87a 2.78
a 2.72
a
Apps available for Smartphones 3.00a 2.96
a 3.12
a
Online 4.38a 4.62
a 4.37
a
HAR 2.43a 2.85
a,b 3.21
b
Family or friends 3.71a 3.74
a 4.08
a
Other visitors 3.04a
3.62b
3.96b
Note: Outcomes were rated on a 5 point scale ranging from 1 (not at all useful) to 5
(very useful). Superscripts indicate between-group differences significant at p < .05.
In exploring the influence of potential scenarios on the future use of visitor
shuttles, several scenarios appear to have the potential to strongly increase use of shuttles.
Due to the relative consistency in responses across the segments, influence is analyzed
for the entire survey population rather than by segment. The scenario that was rated as
having the potential to strongly increase use by the highest percentage of respondents (40
percent) was ―special recreation opportunities, such as pick-ups and drop-offs for one
way hikes.‖ Thirty three percent of respondents indicated that direct shuttle routes
between parking and park attractions would strongly increase their use, and 22 percent
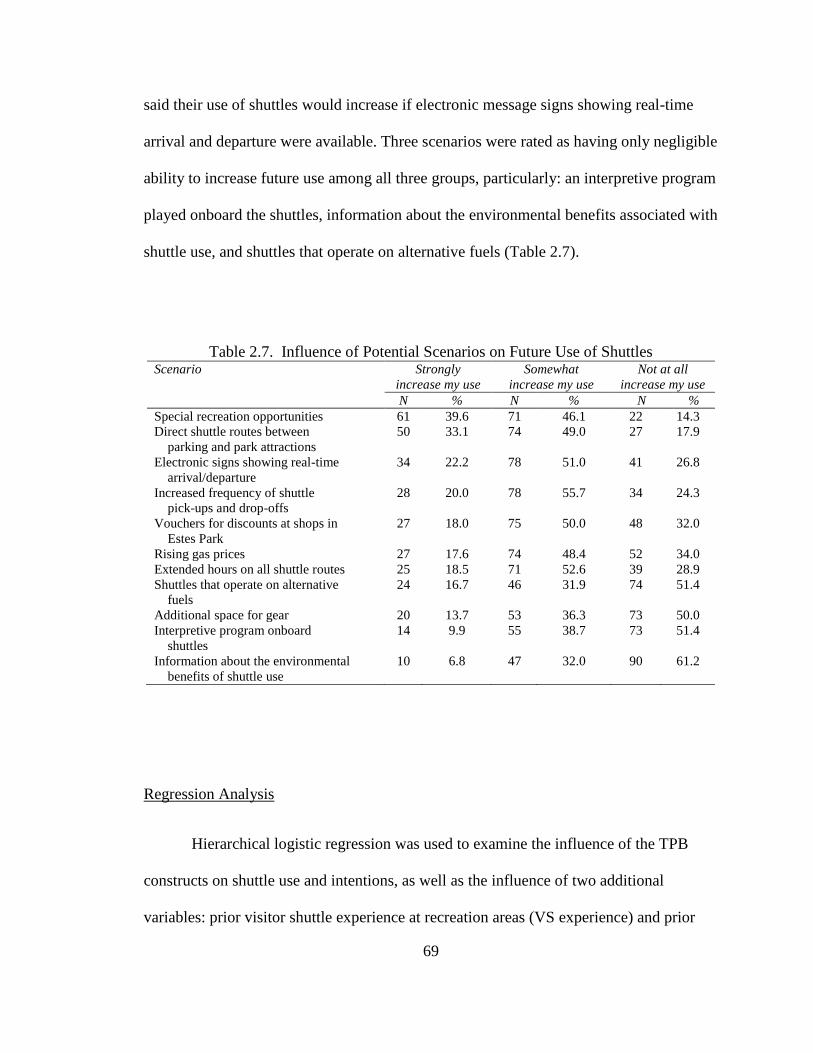
69
said their use of shuttles would increase if electronic message signs showing real-time
arrival and departure were available. Three scenarios were rated as having only negligible
ability to increase future use among all three groups, particularly: an interpretive program
played onboard the shuttles, information about the environmental benefits associated with
shuttle use, and shuttles that operate on alternative fuels (Table 2.7).
Table 2.7. Influence of Potential Scenarios on Future Use of Shuttles Scenario Strongly
increase my use
Somewhat
increase my use
Not at all
increase my use
N % N % N %
Special recreation opportunities 61 39.6 71 46.1 22 14.3
Direct shuttle routes between
parking and park attractions
50 33.1 74 49.0 27 17.9
Electronic signs showing real-time
arrival/departure
34 22.2 78 51.0 41 26.8
Increased frequency of shuttle
pick-ups and drop-offs
28 20.0 78 55.7 34 24.3
Vouchers for discounts at shops in
Estes Park
27 18.0 75 50.0 48 32.0
Rising gas prices 27 17.6 74 48.4 52 34.0
Extended hours on all shuttle routes 25 18.5 71 52.6 39 28.9
Shuttles that operate on alternative
fuels
24 16.7 46 31.9 74 51.4
Additional space for gear 20 13.7 53 36.3 73 50.0
Interpretive program onboard
shuttles
14 9.9 55 38.7 73 51.4
Information about the environmental
benefits of shuttle use
10 6.8 47 32.0 90 61.2
Regression Analysis
Hierarchical logistic regression was used to examine the influence of the TPB
constructs on shuttle use and intentions, as well as the influence of two additional
variables: prior visitor shuttle experience at recreation areas (VS experience) and prior

70
public transportation experience at home (PT experience). The first analysis examined the
influence of the relevant constructs of the TPB on intention to use shuttles at Estes Park
and ROMO. In the first step, the relevant TPB constructs were entered, followed by
visitor shuttle experience in the second step, and public transit experience in the final
step. The model had high accuracy in predicting intention in every step (between 92 and
94 percent), however, neither visitor shuttle experience nor public transport experience
contributed significantly to the model. Interestingly, only perceived behavioral control
contributed significantly to the prediction of intention, in all three steps (Table 2.8). A
possible explanation for this is the level of experience using visitor shuttles among our
sample. The segments with the least shuttle experience (Shuttle Shunners and Potential
Mode-shifters) had the lowest mean scores for behavioral control. Bus Backers on the
other hand, the segment with the most experience using visitor shuttles, had the highest
mean score for behavioral control. The lack of experience using public transportation at
home among all segments results in relatively infrequent use of shuttles across our entire
population, as visits to national parks tend to occur on an annual as opposed to daily
basis. This could explain why perceived control serves as such an important factor in
deciding whether to use shuttles.

Table 2.8. Hierarchical Logistic Regression of Shuttle Behavior and Intention
Dependent variable
Coefficient Standard
Error
Significance Marginal
Effect
LnL % Correct AIC
Intention (N = 130)
Step 1: Attitude 1.274 (0.743) 0.086 0.212
Subjective norm 0.729 (0.541) 0.177 0.122
Perceived control 3.270 (0.851) 0.001* 0.545 -27.38 93.8 0.483
Step 2: Attitude 1.093 (0.733) 0.136 0.168
Subjective norm 0.762 (0.591) 0.197 0.117
Perceived control 2.849 (0.859) 0.001* 0.437
VS experience 0.791 (0.417) 0.058 0.121 -25.42 92.3 0.468
Step 3: Attitude 1.125 (0.758) 0.138 0.173
Subjective norm 0.748 (0.595) 0.209 0.115
Perceived control 2.854 (0.860) 0.001* 0.438
VS experience 0.768 (0.433) 0.076 0.118
PT experience 0.084 (0.472) 0.858 0.130 -25.40 92.3 0.483
Behavior (N = 132)
Step 1: Intention 1.350 (0.261) 0.001* 0.337 -69.76 72.0 1.087
Step 2: Intention 0.869 (0.280) 0.002* 0.217
VS experience 1.055 (0.268) 0.001* 0.264 -60.57 81.1 0.963
Step 3: Intention 0.874 (0.284) 0.002* 0.219
VS experience 1.046 (0.278) 0.000* 0.262
PT experience 0.028 (0.250) 0.911 0.007 -60.57 81.1 0.978
*p-value <.05
71
72
We now move to the second model in our analysis. In predicting behavior, the
relevant TPB construct (intention) was added in the first step, followed by visitor shuttle
experience in the second step, and public transit experience in the final step. Consistent
with the literature, intention contributed significantly to the prediction of behavior,
resulting in 72 percent accuracy in prediction when serving as the only predictor in the
model. However, when visitor shuttle experience was added in the second step, the
accuracy of the model in predicting behavior increased to 81 percent. Visitor shuttle
experience contributed significantly to the prediction of behavior in both the second and
third step, though public transit experience did not contribute significantly. An
examination of the marginal effects listed in Table 8 provides insight into the
contribution of the independent variables included in our analysis. When multiplied by
100, the marginal effects yield the percentage change in the probability of a visitor
engaging in the behavior in question (in our case, shuttle use). For example, looking at
the model for behavior, if a visitor has a one unit increase in visitor shuttle experience, it
would increase their probability of using shuttles by 26 percent.
Discussion
Intelligent transportation technologies have the potential to significantly increase
visitor awareness and use of alternative travel modes at parks and recreation areas
(Daigle & Zimmerman, 2004b; Ye, et al., 2010). To realize the full potential of these
technologies it is essential that we understand who is likely to use shuttles and what

73
factors influence their mode choice. Our study set out to explore the factors influencing
mode choice at Estes Park and ROMO, so as to determine potential strategies for
increasing voluntary shuttle use.
The first objective of our study was to examine the utility of the theory of planned
behavior to predict choice of travel mode in a recreation setting. Based on a series of
hierarchical logistic regression analyses, intention was found to be a significant predictor
of shuttle use. Furthermore, in predicting intention the use of the theory constructs
resulted in high accuracy in prediction, although only PBC contributed significantly to
the model. It is logical that PBC plays such an important role in predicting shuttle use in
recreation settings, as the infrequent nature of the activity reduces one‘s sense of control
over the behavior. Several studies have shown that visitors believe they have more
freedom and ability to travel where they choose in a private automobile as compared to a
visitor shuttle (Hallo & Manning, 2009; Youngs, et al., 2008). This perceived lack of
freedom can certainly contribute to one‘s sense of behavioral control.
Our second objective was to determine if past behavior can improve the predictive
power of the theory of planned behavior. Previous visitor shuttle experience contributed
significantly to the prediction of shuttle use, though not to the prediction of intention.
However, if PBC were to increase it is possible that previous shuttle experience would be
a significant predictor of intention as well. Previous experience using public transit at
home did not contribute significantly to the prediction of intention or shuttle use. These
results support the argument that transportation in recreations settings is inherently

74
different from public transportation in typical home and work environments (Hallo &
Manning, 2009). Therefore, visitors may be unaccustomed to the use of public
transportation, yet open to trying alternative travel modes in the context of a national
park. This is an important finding as it reveals that despite a lack of experience with
public transportation at home, if visitors can be convinced to simply try park transit, the
probability of future use of visitor shuttles increases. The task is then to determine how to
convince visitors to try visitor shuttles.
The third objective sought to do this, by applying the theory of planned behavior
to determine distinct segments of visitors in regard to their beliefs about transportation.
Using cluster analysis, we identified three distinct segments of Estes Park/ROMO
visitors. Consistent with the literature (Anable, 2005; Hunecke, et al., 2010), these
segments were statistically similar in regards to sociodemographic variables such as age,
gender, and education, yet significantly different in terms of their attitudes, subjective
norms, PBC and intentions to use shuttles. Therefore, comparisons were made between
segments to inform management strategies.
A number of useful conclusions can be made based on the comparisons between
segments on the likelihood and desirability of outcomes associated with shuttle use. Our
analysis revealed that while visitors largely desire the same outcomes, such as reduced
tension and stress and enhanced sightseeing ability, they differ in their beliefs about
whether using shuttles will allow them to realize these outcomes. The group Shuttle
Shunners holds the most negative views about shuttle use, thus it will be difficult to
75
convince them to try shuttles. However, Potential Mode-shifters are neutral in their
evaluations and therefore steps can be taken to improve their attitudes about shuttles and
perceptions of behavioral control. Potential Mode-shifters expressed strong desires to
reduce their tension and stress caused by driving and to alleviate their stress related to
finding parking. Thus, the messaging employed via the ITS should emphasis that by
using the free shuttles, visitors can relax and not have to worry about finding a parking
space or driving in congestion. Potential Mode-shifters also expressed strong desires to
enhance their sightseeing ability. The Estes Park and ROMO shuttles can be promoted as
a way for visitors to focus on the scenery and landscape while leaving the navigating to
the shuttle operators. These messages will also work to encourage shuttle use among Bus
Backers, who also strongly desired these outcomes. While the majority of Bus Backers
reported that they are already using visitor shuttles, more than 30 percent reported that
they did not use shuttles on their last visit to the area, despite their positive attitudes and
high intentions to use shuttles. Bus Backers desired reduced tension and stress related to
driving and parking above all other segments, therefore promoting those outcomes has
strong potential to shift the remaining Bus Backers from autos to shuttles.
All three segments indicated that feeling rushed or short on time was undesirable,
as well as feeling crowded or experiencing infrequent buses with long lines.
Unfortunately, neither Bus Backers nor Potential Mode-shifter were confident that these
outcomes were entirely unlikely. To assuage this concern, shuttle service must be
frequent and reliable, giving visitors the ability to access the most popular park
attractions without excessive wait times for shuttle pick-ups. The ITS must then
76
prominently advertise the frequency and hours of shuttle operation. In a park such as
ROMO, avoiding crowds is often impossible in the front country, so this should not be
advertised as a benefit of shuttle use. However, ITS can be used to inform visitors of off-
peak hours when shuttles and park attractions are less crowded. This information must
also be provided on the town and park websites, as well as through other trip planning
modes such as park literature, as many visitors have itineraries in mind before that arrive
to the area (Villwock-Witte & Collum, 2012).
Furthermore, based on the visitor evaluations, the ROMO website and other
online sources are the most useful travel information resources. Shuttle information must
be prominently displayed on these websites. Park brochures and maps were also rated as
very useful travel resources. The HAR was not rated as a useful information source by
any of the three segments, which suggests that the HAR may not be an appropriate ITS
technology for ROMO and Estes Park.
Our analysis also identified a number of scenarios that have the potential to
increase shuttle use. The scenario with the highest potential to increase shuttle use was
the availability of special recreation opportunities, such as pick-ups and drop-offs for
one-way hikes. Every year, thousands of visitors travel to ROMO to climb Longs Peak, a
long and challenging climb which necessitates climbers hit the trail hours before sunrise
in order to reach the peak before afternoon thunderstorms arrive (National Park Service,
2012). Currently, there is no shuttle route servicing Long‘s Peak. There are also other
popular hikes within ROMO for which hikers must arrange pick-up and drop-off. The
77
survey results indicate that offering shuttle drop-off and pick-up for these popular hikes
could improve shuttle ridership. Because of the length of time it takes to complete a hike
such as Longs Peak, the shuttles could provide as few as two drop-offs and two pick-ups
per day and still be successful.
Two other scenarios also ranked as having strong potential to increase shuttle
ridership. The first was the availability of direct shuttle routes between parking and park
attractions. A park-and-ride lot already exist in Estes Park; however, visitors must
transfer at the Estes Park Convention and Visitors Bureau in order to connect to the
shuttle route that accesses ROMO. A direct route from the park-and-ride to ROMO
would increase the appeal of the park-and-ride lot, and based on our results, strongly
influence many visitors to use shuttles. The second high-ranking scenario was the
implementation of electronic signs that display the real-time arrival and departure of
shuttle routes. Real-time arrival signs have tested well in other parking settings (Daigle &
Zimmerman, 2004b) and could make a valuable addition to an ITS at ROMO and Estes
Park.
While our study provides a number of recommendations concerning the
promotion of park shuttles, it is not without limitations. Foremost, the theory of planned
behavior offers the most utility when applied to a longitudinal study to evaluate the effect
of an intervention on a specific behavior (Fishbein & Ajzen, 2010). Time and resource
constraints made a longitudinal study impossible, therefore we were unable to properly
evaluate the potential for ITS at ROMO by gathering data before and after the

78
implementation of the ITS. If another pilot study is conducted in the future to explore
other ITS technologies, survey data should be gathered both pre- and post-
implementation to properly predict shuttle use.
Our study was also limited by a small sample size. Our relatively small sample
size was a result of combining this analysis with a larger data collection effort to evaluate
the pilot ITS. The respondents of our survey had already made a time investment by
filling out an onsite survey to evaluate the ITS, therefore, participating in the mail survey
required an additional investment of time, thus adding additional burden to respondents.
To minimize the time burden to respondents, the survey instrument was designed to be
short and concise. However, much can be gained from knowing more about the factors
that influence mode choice. Future research should evaluate the usefulness of other ITS
technologies, such as real-time arrival signs. Additional lifestyle and personally traits
should be considered in segmenting visitors, including reasons for visiting the area,
preferred recreation activities, and willingness to change plans and try new travel modes.
This information could further inform management strategies, making ITS a highly
effective tool for travel management.
79
Conclusions
In the coming decades America‘s parks and public lands will continue to grapple
with increasing visitation and growing pressure on natural and managerial resources. One
of the foremost challenges for park managers will be transitioning from the auto-
dominated park infrastructure of the past to the alternative transportation systems of the
future. ITS have the potential to vastly improve transportation management, but only if
the proper technologies are coupled with meaningful travel information.
Despite the unique character of park visitors, similarities exist between
individuals that can help managers determine appropriate ITS technologies to invest in
and effective messaging to be employed via these technologies. Our study demonstrates
the utility of the theory of planned behavior as a conceptual framework for predicting
shuttle use in park settings and segmenting visitors based on their beliefs with regard to
shuttle use. Segmentation analysis proved valuable for exploring the divergent beliefs
about shuttles held by park visitors. By combining theory and market segmentation, park
managers can identify and implement empirically sound travel management strategies.
Although ITS are gaining popularity in park and recreation settings, there are
inherent differences in travel for tourism purposes as opposed to traditional travel that
must be considered when identifying appropriate technologies. By employing
technologies that cater to the needs of park visitors and fit with the natural environment
of national parks, there is potential for a new park culture to emerge that is dominated by
smart, alternative transit options that lay lighter on the land.

80
REFERENCES
Ajzen, I. (1991). The theory of planned behavior. Organizational Behavior and Human
Decision Processes, 50(2), 179-211.
Ajzen, I., & Driver, B. L. (1992). Application of the theory of planned bahavior to leisure
choice. Journal of Leisure Research(24), 207-224.
Anable, J. (2005). 'Complacent Car Addicts' or 'Aspiring Environmentalists'? Identifying
travel behaviour segments using attitude theory. [Article]. Transport Policy,
12(1), 65-78.
Armstrong, J. S., & Overton, T. S. (1977). Estimating nonresponse bias in mail surveys.
Journal of Marketing Research, 14(3), 396-402.
Bamberg, S., Ajzen, I., & Schmidt, P. (2003). Choice of travel mode in the theory of
planned behavior: The roles of past behavior, habit, and reasoned action. Basic
and Applied Social Psychology, 25(3), 175-187.
Bamberg, S., & Schmidt, P. (2001). Theory-driven subgroup-specific evaluation of an
intervention to reduce private car use. Journal of Applied Social Psychology,
36(6), 1300-1329.
Bishop, P. (1996). Off road: Four-wheel drive and the sense of place. Environment and
Planning D-Society & Space, 14(3), 257-271.
Blotkamp, A. (2010). Rocky Mountain National Park Visitor Study. NPS/NRSS/SSD/NRR
- 2011/121/107587.
Colten, C. E., & Dilsaver, L. (2005). The hidden landscape of Yosemite National Park.
Journal of Cultural Gography.
Daigle, J. J. (2008). Transportation research needs in National Parks: A summary and
exploration of future trends. The GWS Journal of Parks, Protected Areas and
Cultural Sites, 25(1), 57-64.
Daigle, J. J., Hrubes, D., & Ajzen, I. (2002). A comparative study of beliefs, attitudes,
and values among hunters, wildlife viewers, and other outdoor recreationists.
Human Dimensions of Wildlife, 7(1), 1-19.
Daigle, J. J., & Zimmerman, C. A. (2004a). Alternative transportation and travel
information technologies: Monitoring parking lot conditions over three summer
seasons at Acadia National Park. Journal of Park and Recreation Administration,
22(4), 81-102.

81
Daigle, J. J., & Zimmerman, C. A. (2004b). The convergence of transportation,
information technology, and visitor experience at Acadia National Park. Journal
of Travel Research, 43(2), 151-160.
Devries, H., Backbier, E., Kok, G., & Dijkstra, M. (1995). The impact of social
influences in the context of attitude, self-efficacy, intention, and previous
behavior as predictors of smoking onset Journal of Applied Social Psychology,
25(3), 237-257.
Dillman, D., Smyth, J., & Christian, L. (2008). Internet, mail, and mixed-mode surveys:
the tailored design method: Wiley & Sons.
Dilsaver, L. M., & Wyckoff, W. (1999). Agency culture, cumulative causation and
development in Glacier National Park, Montana. [Article]. Journal of Historical
Geography, 25(1), 75-92.
Dilworth, G., & Shafer, S. (2004). Visitor perceptions of intelligent transportation
systems in a national park. Northeastern Recreation Research Symposium, 158-
163.
Dilworth, V. A. (2003). Visitor perceptions of alternative transportation systems and
intelligent transportation systems in national parks. Texas A & M University,
College Station, Texas.
Featherstone, M. (2004). Automobilities - An introduction. Theory Culture & Society,
21(4-5), 1-24.
Fishbein, M., & Ajzen, I. (2010). Predicting and changing behavior: The reasoned action
approach. New York: Psychology Press.
Gardner, B., & Abraham, C. (2010). Going Green? Modeling the Impact of
Environmental Concerns and Perceptions of Transportation Alternatives on
Decisions to Drive. Journal of Applied Social Psychology, 40(4), 831-849.
Hallo, J. C., & Manning, R. E. (2009). Transportation and recreation: A case study of
visitors driving for pleasure at Acadia National Park. Journal of Transport
Geography, 17(6), 491-499.
Harrison, G. S. (1975). The people and the park: Reactions to a system of public
transportation in Mt. McKinley National Park, Alaska. Journal of Leisure
Research, 7(1), 6-15.

82
Haustein, S., & Hunecke, M. (2007). Reduced use of environmentally friendly modes of
transportation caused by perceived mobility necessities: An extension of the
theory of planned behavior. Journal of Applied Social Psychology, 37(8), 1856-
1883.
Heath, Y., & Gifford, R. (2002). Extending the theory of planned behavior: Predicting the
use of public transportation. Journal of Applied Social Psychology, 32(10), 2154-
2189.
Holly, M. F., Hallo, J. C., Baldwin, E. D., & Mainella, F. P. (2010). Incentives and
disincentives for day visitors to park and ride public transportation at Acadia
National Park. Journal of Park and Recreation Administration, 28(2), 74-93.
Hrubes, D., Ajen, I., & Daigle, J. J. (2001). Predicting hunting intentions and behavior:
An application of the theory of planned behavior. Leisure Sciences(13), 717-734.
Hunecke, M., Haustein, S., Bohler, S., & Grischkat, S. (2010). Attitude-Based Target
Groups to Reduce the Ecological Impact of Daily Mobility Behavior.
Environment and Behavior, 42(1), 3-43.
Jensen, M. (1999). Passion and heart in transport — a sociological analysis on transport
behaviour. Transport Policy, 6(1), 19-33.
Lawson, S. R., Manning, R. E., Valliere, W. A., & Wang, B. (2003). Proactive
monitoring and adaptive management of social carrying capacity in Arches
National Park: an application of computer simulation modeling. Journal of
Environmental Management, 68(3), 305-313.
Louter, D. (2006). Windshield wilderness: Cars, roads, and nature in Washington's
national parks: University of Washington Press.
Manning, R. (1999). Studies in outdoor recreation: Search and research for satisfaction:
Oregon State University Press.
National Park Service. 2010 Park Statistics.
http://www.nps.gov/romo/parkmgmt/statistics.htm Retrieved May 25, 2012
National Park Service. NPS Transportation.
http://www.nps.gov/transportation/national_parks_usage_and_travel_modes.html
Retrieved March 25, 2012
National Park Service. (2000). National Park Service Strategic Plan 2001-2005. US
Department of Interior, National Park Service.

83
National Park Service. (2012). Rocky Mountain National Park website.
http://www.nps.gov/romo/index.htm Retrieved April 1, 2012
Ouellette, J. A., & Wood, W. (1998). Habit and intention in everyday life: The multiple
processes by which past behavior predicts future behavior. Psychological
Bulletin, 124, 54-74.
Pas, E. I., & Huber, J. C. (1992). Market-segementation analysis of potential inter-city
rail travelers Transportation, 19(2), 177-196.
Redmond, L. (2000). Identifying and Analyzing Travel-Related Attitudinal, Personality,
and Lifestyle Clusters in the San Francisco Bay Area.
Rocky Mountain National Park. (2008). Alternative Transportation in Parks and Public
Lands Program: Planning project proposal for fiscal year 2008.
Shaffer, M. (2001). See America first: Tourism and national identity, 1880-1940:
Smithsonian Institution Press.
Sheldon, P. J. (1997). Tourism Information Technology. Wallingford, U.K.
New York: CAB International.
Shiftan, Y., Vary, D., & Geyer, D. (2006). Demand for park shuttle services - a stated-
preference approach. Journal of Transport Geography, 14(1), 52-59.
Sims, C. B., Hodges, D. G., Fly, J. M., & Stephens, B. (2005). Modeling visitor
acceptance of a shuttle system in the Great Smoky Mountains National Park.
Journal of Park and Recreation Administration, 23(3), 25-44.
Strong, C. (1999). Overview of National Park Service Challenges. Paper presented at the
National Parks: Transportation alternatives and advanced technology for the 21st
century. Big Sky, Montana.
Strong, C., Eidswick, J., & Turner, S. (2007). Identifying opportunities for intelligent
transportation sysytems applications in California's National Parks: Project
overview and summary of recommendations. Transportation Research
Record(1895/2004), 170-181.
Sutter, P. (2002). Driven wild: How the fight against automobiles launched the modern
wilderness movement: University of Washington Press.
Terry, D. J., & Oleary, J. E. (1995). The theory of planned behavior - The effects of
perceived behavioral-control and self-efficacy British Journal of Social
Psychology, 34, 199-220.

84
Turnbull, K. (2010). Transportation to enhance America's best ideas: Addressing mobility
needs in America's National Parks. TR News, 267, 20-26.
U.S. Department of Transportation. (2012). http://www.fta.dot.gov/grants/13094.html.
Federal Transit Administration.
Vaske, J. J. (2008). Survey research and analysis : Applications in parks, recreation and
human dimensions. State College, Pa.: Venture Publishing.
Verplanken, B., Aarts, H., Vanknippenberg, A., & Vanknippenberg, C. (1994). Attitude
versus general habit - antecedents of travel mode choice Journal of Applied Social
Psychology, 24(4), 285-300.
Villwock-Witte, N., & Collum, K. (2012). Evaluation of an Intelligent Transportation
System for Rocky Mountain National Park and Estes Park: Final Report.
Bozeman, MT: Paul S. Sarbanes Transit in Parks Technical Assistance Center.
Villwock-Witte, N., Ye, Z., Eidswick, J., & Albert, S. (2011). Rocky Mountain National
Park Dynamic Message Sign/Highway Advisory Radio Operations Plan: Western
Transportation Institute
Waitt, G., & Lane, R. (2007). Four-wheel drivescapes: Embodied understandings of the
Kimberley. Journal of Rural Studies, 23(2), 156-169.
Wedel, M., & Kamakura, W. A. (2000). Market segmentation: conceptual and
methodological foundations: Kluwer Academic.
Western Transportation Institute. (2007). Evaluation of Portable Changeable Message
Signs at Golden Gate National Recreation Area.
White, D. D. (2007). An interpretive study of Yosemite National Park visitors‘
perspectives toward alternative transportation in Yosemite Valley. Environmental
Management, 39(1), 50-62.
Ye, Z., Albert, S., Eidswick, J., & Law, S. (2010). Improving shuttle ridership using
intelligent transportation system technologies national park case study.
Transportation Research Record(2174), 44-50.
Youngs, Y. L., White, D. D., & Wodrich, J. A. (2008). Transportation systems as cultural
landscapes in national parks: The case of Yosemite. Society & Natural Resources,
21(9), 797-811.

85
Zimmerman, C. A., Coleman, T. G., & Daigle, J. J. (2003). Evaluation of the Acadia
National Park ITS Field Operational Test: Final Report. Prepared for the U.S.
Department of Transportation ITS Joint Program Office.

86
APPENDIX A. HIGHWAY ADVISORY RADIO MESSAGE SETS
Table A.1. HAR Messages without Insider‘s Tip
Message
Number
Highway Advisory Radio Message – Without ―Insider‘s Tip‖
H-1 The following is traveler information for Rocky Mountain National Park. Rocky
Mountain National Park and the Gateway Community of Estes Park invite you to use
free shuttle services between the new park-and-ride lot in Estes Park and Rocky
Mountain National Park. Riding the shuttle is a relaxed and convenient way to
explore the Park; you will not have to wait in entrance lines, find a parking space at
each attraction or navigate your own way through the Park. By using this service,
you will also help the National Park Service reduce congestion and preserve natural
resources.
While the shuttle services are free, be sure to purchase your entrance pass at the Estes
Park or Beaver Meadows Visitors Center. You can also pick up maps and
information about shuttle services at either visitor center, so stop in and learn about
these options for car-free travel within the Park.
Here is an overview of the shuttle routes available. From the park-and-ride lot, take
the Silver Route to the Estes Park Visitors Center, where you can connect to the four
shuttle routes that travel to and within Rocky Mountain National Park and Estes
Park: the Hiker, Brown, Red and Blue Routes. Shuttle schedules and maps are
available at both Visitor Centers.
We hope you will take advantage of the new park-and-ride lot, with its convenient
access to Park shuttle services. As you travel west along US 36 into the Estes Park
valley, turn left on Community Drive to access the park-and-ride lot. Watch for the
electronic message sign just before the turn.
H-2 Rocky Mountain National Park and the gateway community of Estes Park invite you
to use free shuttle services between the Fairgrounds park-and-ride lot, the Town of
Estes Park, and Rocky Mountain National Park. By using the shuttles, you will help
the National Park Service and the Town reduce congestion and preserve natural
resources. Remember to purchase your entrance pass at the Estes Park or Beaver
Meadows Visitor Center, and while you‘re there, pick up maps and helpful
information about shuttle services at either visitor center.
As you travel west along US 36 into the Estes Park valley, turn left on Community
Drive and follow the green park-and-ride signs to the lot. Watch for the electronic
message sign just before the turn onto Community Drive. Once at the park-and-ride
lot, head to the shuttle shelter to board the Silver Route. This route will allow you to
connect to the Hiker, Brown, Red, or Blue Route, running daily from 10am to 8pm.
The Hiker shuttle connects you to Rocky Mountain National Park and the other
shuttles provide service to attractions in and around Estes Park.

87
Figure A.2. HAR Messages with Insider‘s Tip
Message
Number
Highway Advisory Radio Message – With ―Insider‘s Tip‖
H-IT-1 The following is traveler information for Rocky Mountain National Park. Rocky
Mountain National Park and the Gateway Community of Estes Park invite you to use
free shuttle services between the new park-and-ride lot in Estes Park and Rocky
Mountain National Park. Riding the shuttle is a relaxed and convenient way to
explore the Park; you will not have to wait in entrance lines, find a parking space at
each attraction or navigate your own way through the Park. By using this service,
you will also help the National Park Service reduce congestion and preserve natural
resources.
While the shuttle services are free, be sure to purchase your entrance pass at the Estes
Park or Beaver Meadows Visitors Center. You can also pick up maps and
information about shuttle services at either visitor center, so stop in and learn about
these options for car-free travel within the Park.
Here‘s an insider‘s tip that may help you enjoy area attractions even more. Most
visitors come to the National Park in the morning. If your schedule permits, explore
Estes Park in the morning and come to Rocky Mountain National Park in the
afternoon.
Here is an overview of the shuttle routes available. From the park-and-ride lot, take
the Silver Route to the Estes Park Visitors Center, where you can connect to the four
shuttle routes that travel to and within Rocky Mountain National Park and Estes
Park: the Hiker, Brown, Red and Blue Routes. Shuttle schedules and maps are
available at both Visitor Centers. We hope you will take advantage of the new park-
and-ride lot, with its convenient access to Park shuttle services. As you travel west
along US 36 into the Estes Park valley, turn left on Community Drive to access the
park-and-ride lot. Watch for the electronic message sign just before the turn.
H-IT-2 Rocky Mountain National Park and the gateway community of Estes Park invite you
to use free shuttle services between the Fairgrounds park-and-ride lot, the Town of
Estes Park, and Rocky Mountain National Park. By using the shuttles, you will help
the National Park Service and the Town reduce congestion and preserve natural
resources. Here‘s an insider‘s tip: you may also want to consider exploring Estes
Park in the morning and come to Rocky Mountain National Park in the afternoon
when there are less visitors. Remember to purchase your entrance pass at the Estes
Park or Beaver Meadows Visitor Center, and while you‘re there, pick up maps and
helpful information about shuttle services at either visitor center.
As you travel west along US 36 into the Estes Park valley, turn left on Community
Drive and follow the green park-and-ride signs to the lot. Watch for the electronic
message sign just before the turn onto Community Drive. Once at the park-and-ride
lot, head to the shuttle shelter to board the Silver Route. This route will allow you to
connect to the Hiker, Brown, Red, or Blue Route, running daily from 10am to 8pm.
The Hiker shuttle connects you to Rocky Mountain National Park and the other
shuttles provide service to attractions in and around Estes Park.

88
APPENDIX B. SHUTTLE ROUTES
Figure B.1. Hiker Shuttle Route
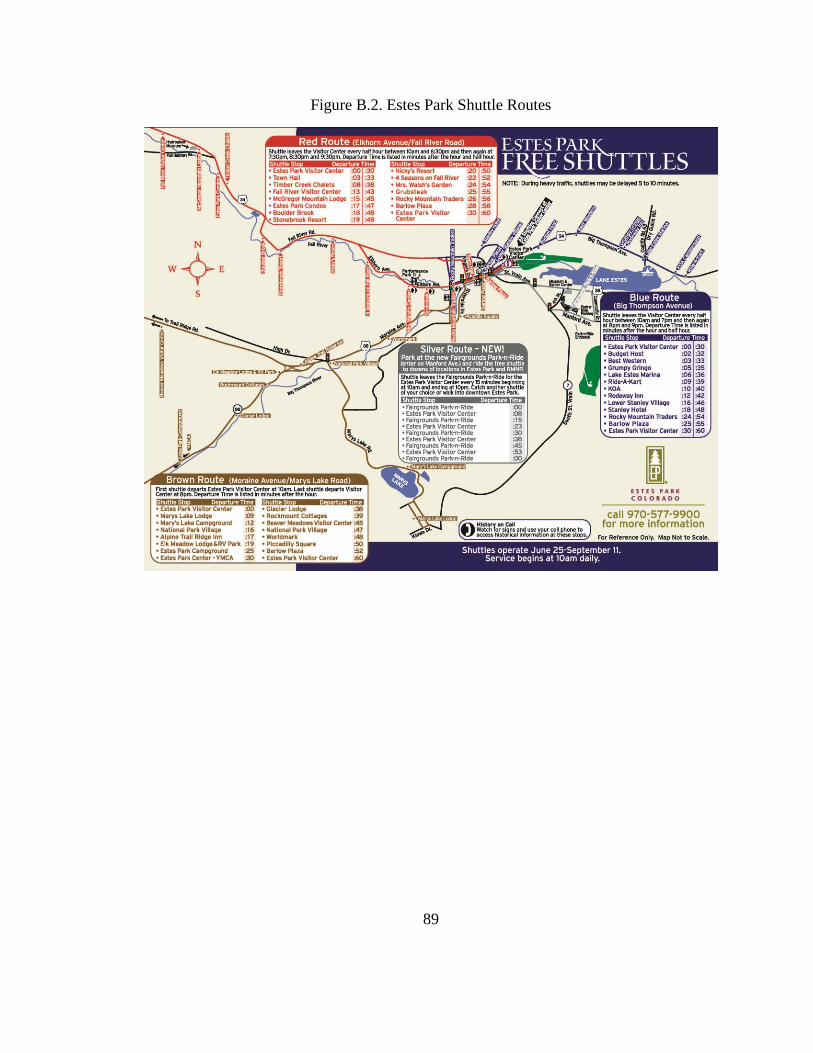
89
Figure B.2. Estes Park Shuttle Routes
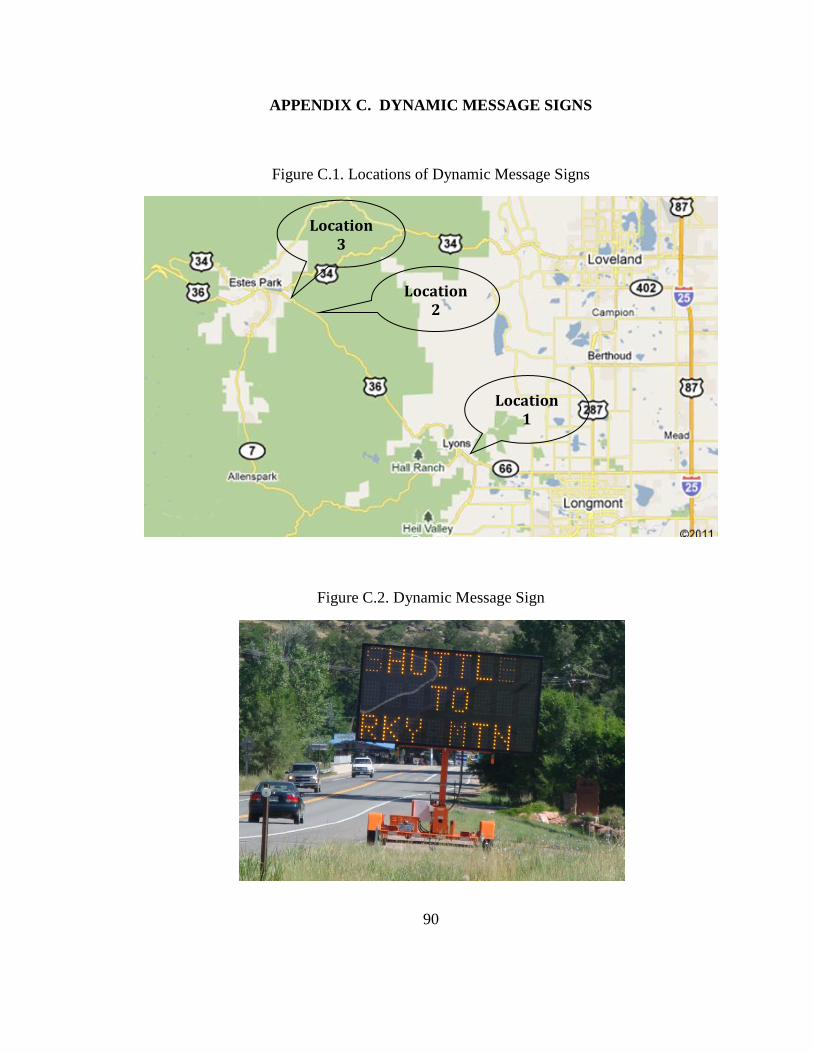
90
APPENDIX C. DYNAMIC MESSAGE SIGNS
Figure C.1. Locations of Dynamic Message Signs
Figure C.2. Dynamic Message Sign
Location 3
Location 2
Location 1
91
APPENDIX D. ONSITE SHUTTLE SURVEY

92
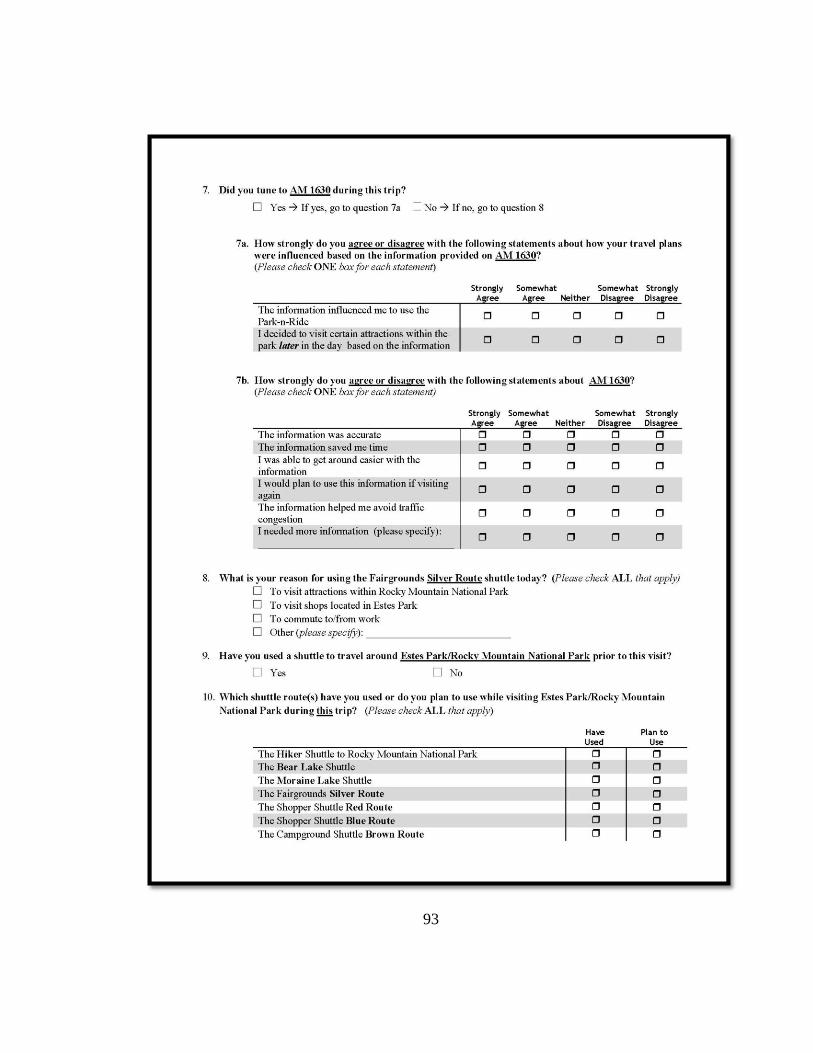
93
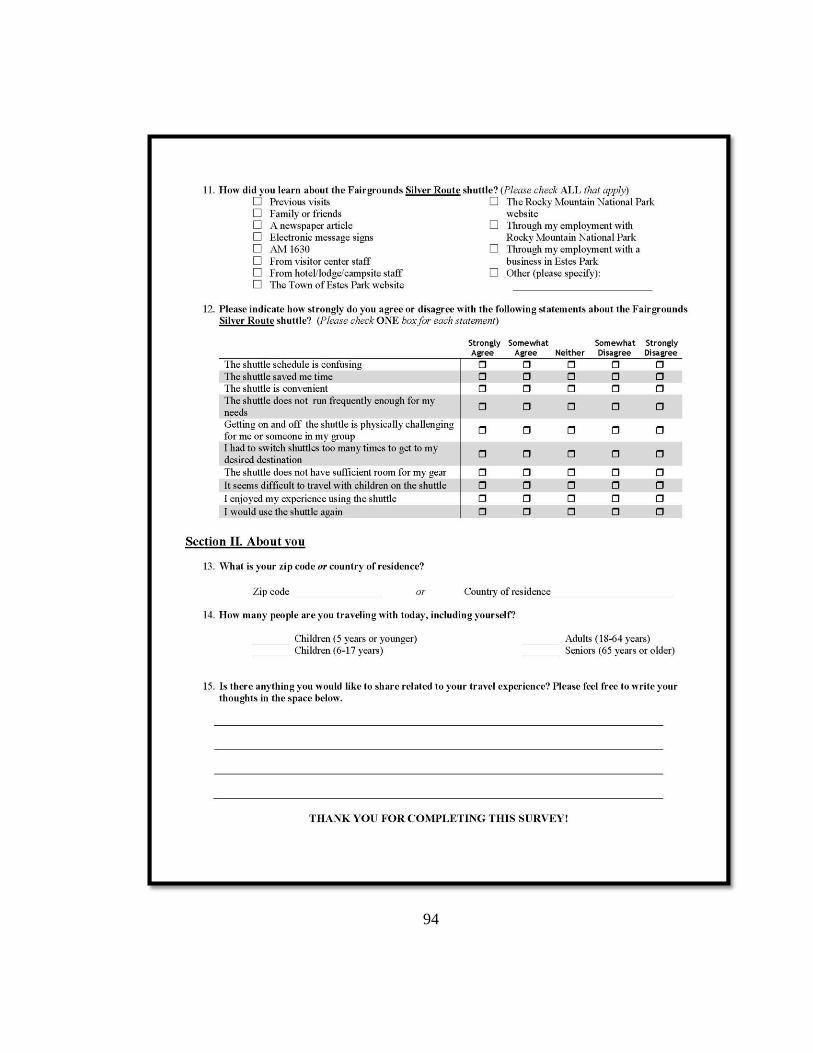
94

95
APPENDIX E. ONSITE VISITOR SURVEY
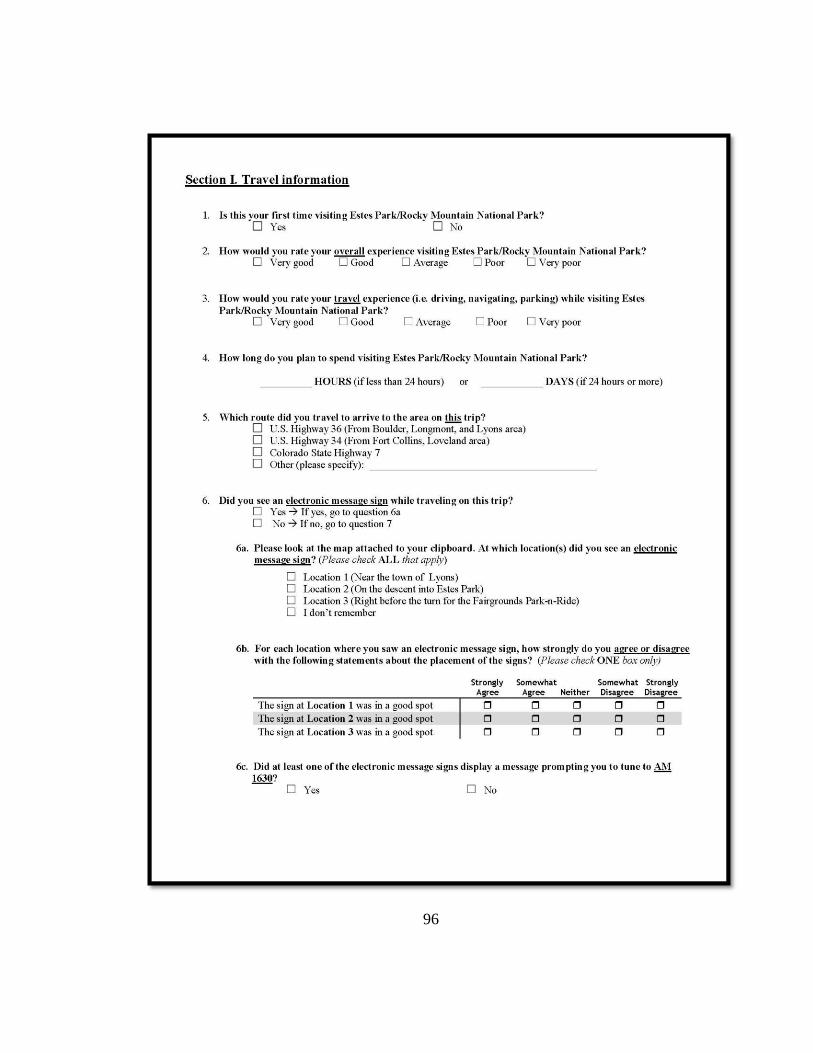
96

97
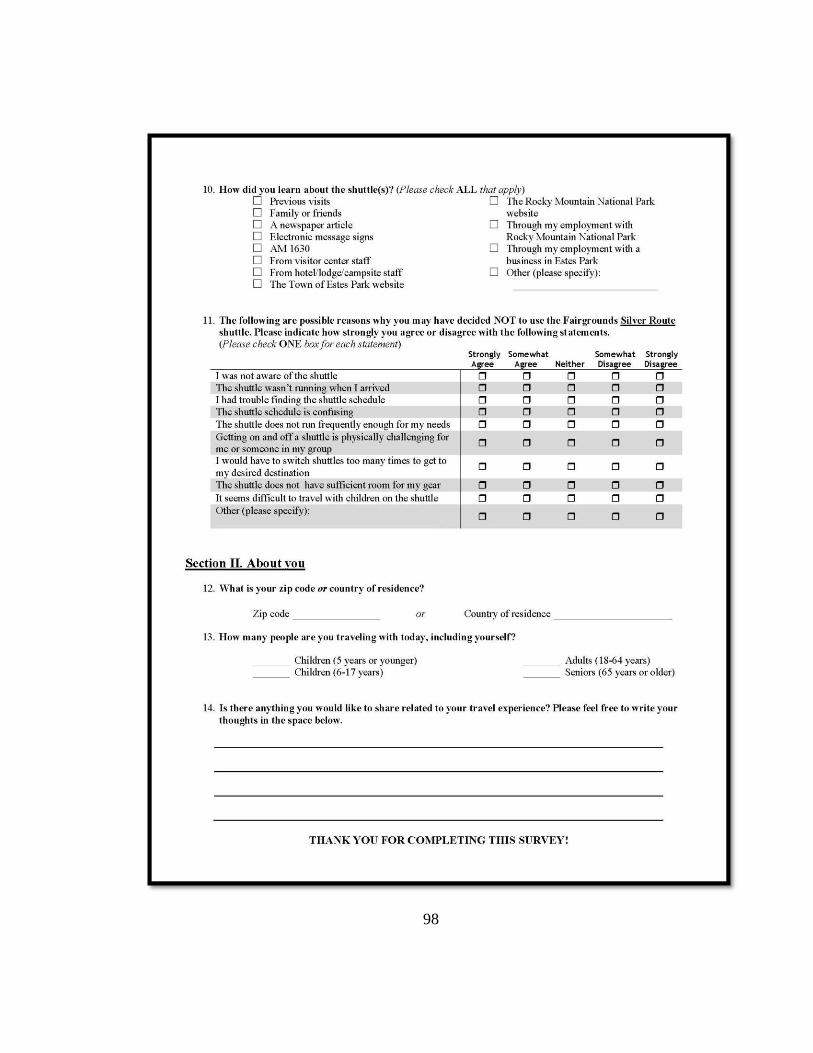
98

99
APPENDIX F. MAIL SURVEY
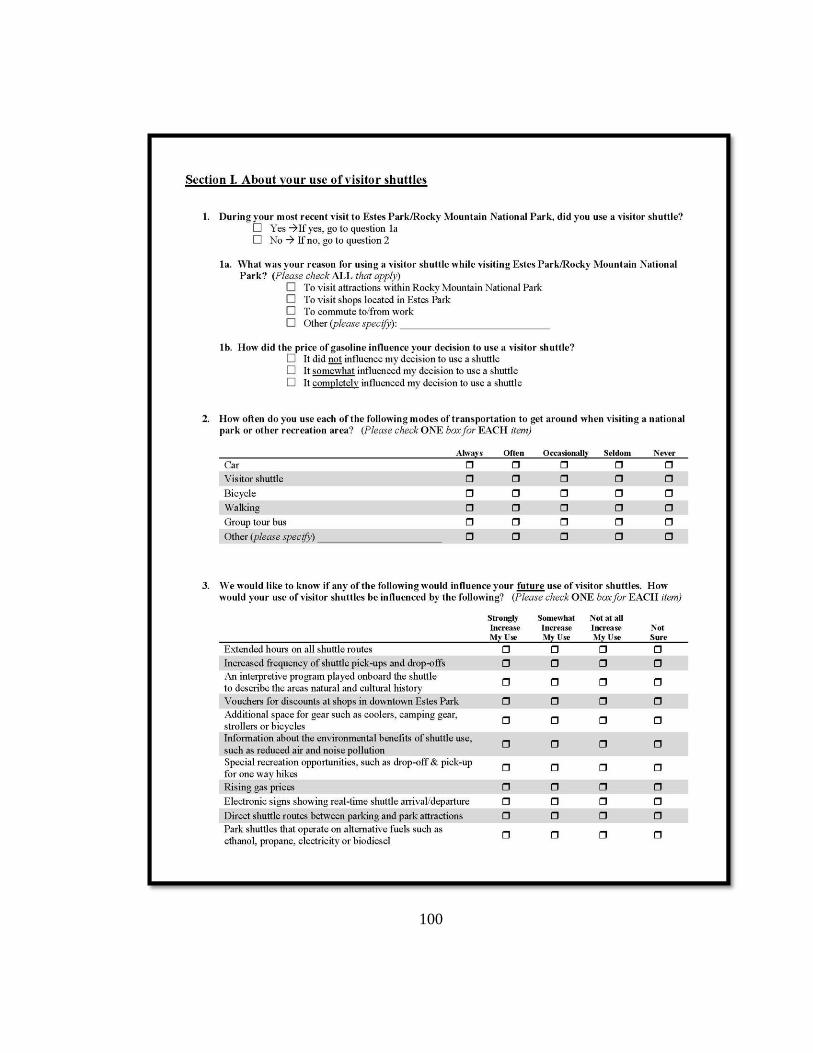
100
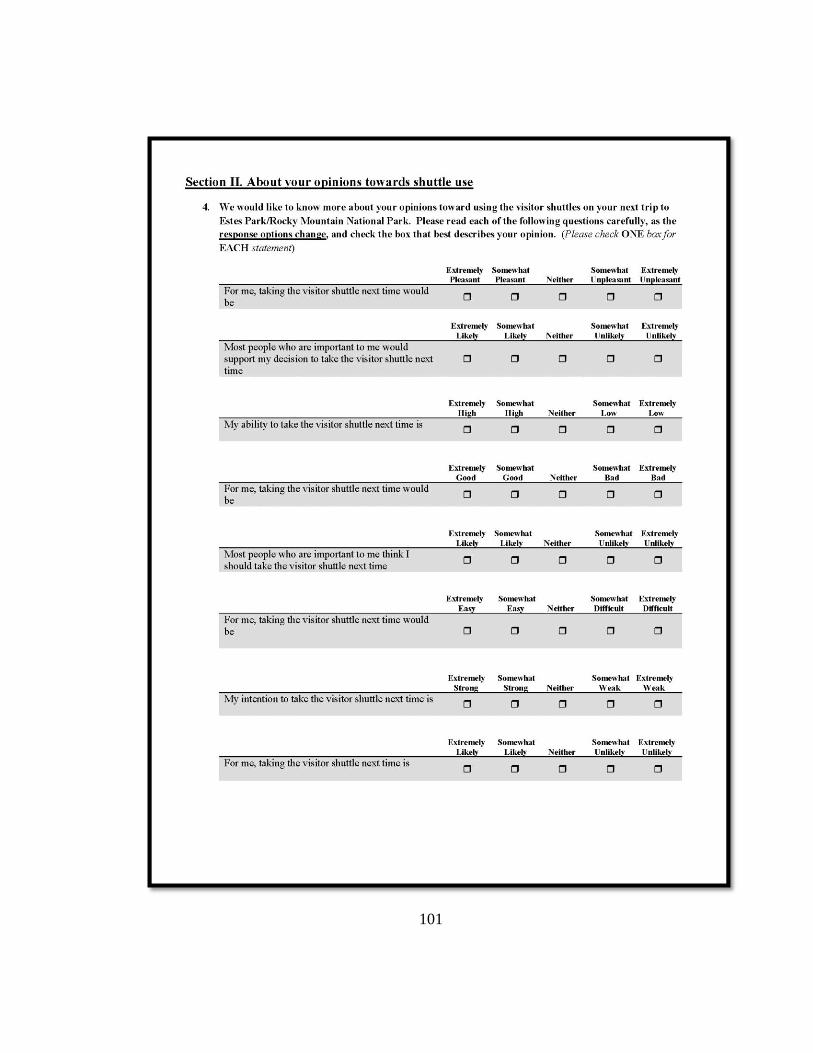
101
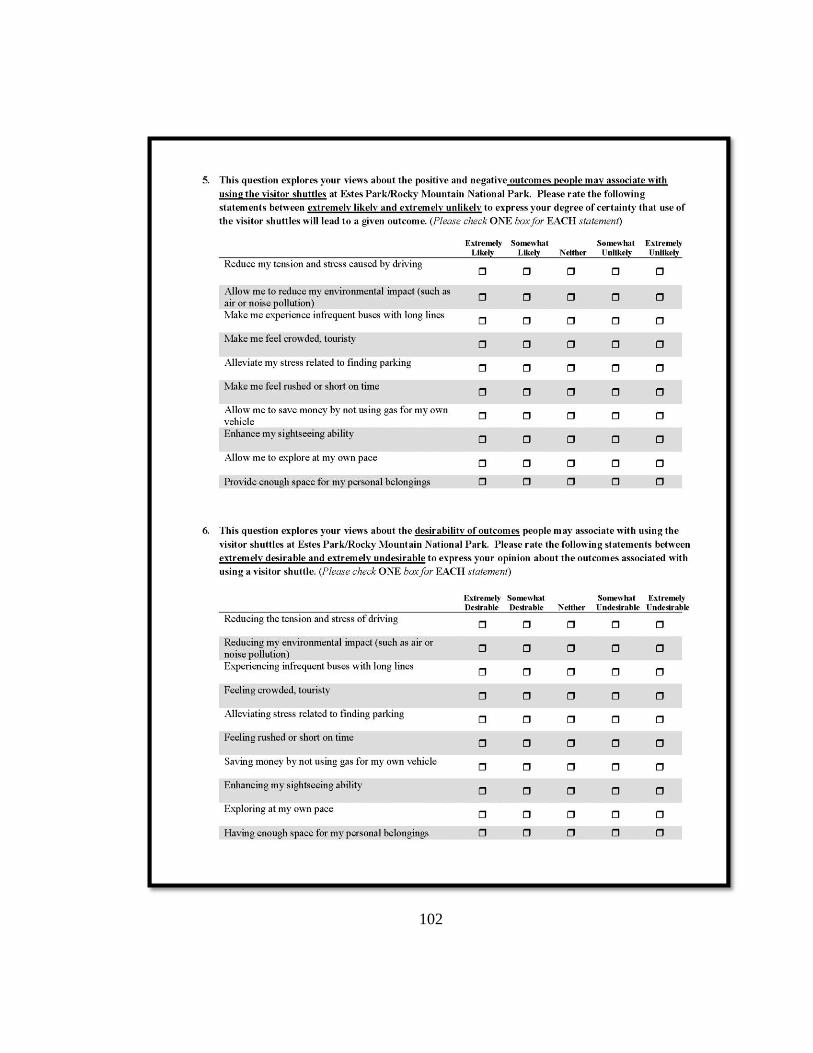
102
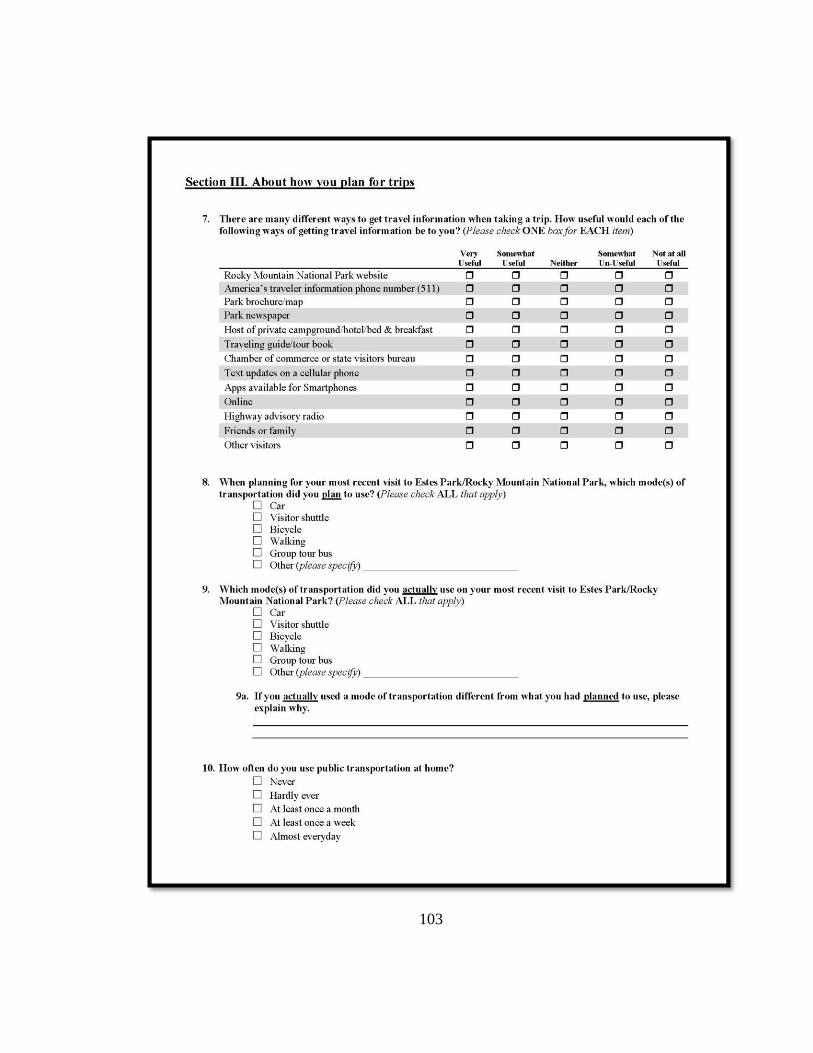
103

104

105
106
APPENDIX G. SURVEY MAILINGS Date
Respondent Name
Street
Town, State Zip
Dear (Respondent) ,
Recently you should have completed an on-site travel survey while visiting Estes Park, Colorado.
At that time, you were invited to participate in an extended mail survey that is part of a study
being conducted by the Paul S. Sarbanes Transit in Parks Technical Assistance Center. As we
mentioned before, your participation in our study will greatly aid our research. The best way for
us to understand the issues and challenges experienced by Estes Park travelers is to learn directly
from people like you.
We would like the member of your family/household that completed the on-site travel survey to
fill out this extended survey. Completing the survey should only take about 10 minutes and is
completely voluntary. Except for your time and inconvenience, there are no risks to you from
participating. Return of the survey implies consent to participate. You may skip any questions
you do not wish to answer.
A code number has been assigned to your survey to protect your identity, maintain the
confidentiality of your responses, and determine which participants have not responded so that we
can send a replacement survey. Your name will not be associated with your responses to the
survey. The electronic data will be kept on a password protected computer, and paper data, such
as the physical surveys, will be kept in a locked office. The key linking the code to your name
will be destroyed within one year, after data analysis is complete, and the physical surveys will be
destroyed within five years.
When you have completed the survey, please return it to the University of Maine in the postage-
paid envelope enclosed with the survey. If you have questions, comments, or concerns about the
study, you may contact us directly at (207) 581-2875. If you have questions about your rights as a
research participant you may contact Gayle Jones, Assistant to the University of Maine‘s Protection
for Human Subjects Review Board at (207) 581-1498.
Thank you again for your participation!
Kourtney Collum
Graduate Research Assistant
University of Maine
Parks, Recreation & Tourism Program
& the Paul S. Sarbanes Transit in Parks TAC
John Daigle, Ph.D.
Associate Professor
University of Maine
Parks, Recreation & Tourism Program
& the Paul S. Sarbanes Transit in Parks TAC
107
John J. Daigle
Parks, Recreation and Tourism Program
5755 Nutting Hall
University of Maine
Orono, ME 04469-5755
Dear Survey Participant:
Last week we mailed you a questionnaire asking about your opinions and preferences concerning
shuttle use when visiting Estes Park.
If you have already completed and returned the questionnaire, please accept our thanks. If you
have not yet completed it, please do so today. The questionnaire was sent to a small but
representative sample of Estes Park visitors. It is extremely important that your responses be
included in the study, as the results will be used to assist in the future management of
transportation in the Estes Park/Rocky Mountain National Park region.
If you did not receive the questionnaire, or if it has been misplaced, please call me at (207) 581-
2897 and we will mail a replacement questionnaire to you today.
We value your thoughts about your experience traveling in Estes Park/Rocky Mountain National
Park and look forward to hearing from you.
Kourtney Collum John J. Daigle
Graduate Research Assistant Associate Professor
University of Maine University of Maine
Parks, Recreation & Tourism Program Parks, Recreation & Tourism Program
The Paul S. Sarbanes Transit in Parks Technical Assistance Center
108
Date
Respondent Name
Street
Town, State ZIP
Dear (Respondent) ,
About four weeks ago, you should have received a mailed invitation to complete a survey that is
part of a study being conducted by the University of Maine in association with the Paul S.
Sarbanes Transit in Parks Technical Assistance Center. To the best of our knowledge, it has not
been returned. We are writing to encourage you to complete and return the survey. Your
participation in our study will greatly aid our research.
We would like the member of your family/household that completed the on-site travel survey to
fill out this extended survey. As mentioned before, the survey should take about 10 minutes to
fill out. Except for your time and inconvenience, there are no risks to you from participating.
Participation is voluntary. Return of the survey implies consent to participate. You may skip any
questions you do not wish to answer. A code number has been assigned to your survey to protect
your identity and maintain the confidentiality of your responses. Your name will not be
associated with your responses to the survey.
If you have already mailed your completed survey, please accept our sincere thanks. If not, we
have included a replacement survey for your convenience. Once completed, please return it to
the University of Maine in the postage-paid envelope enclosed with the survey. If you have
questions, comments, or concerns about the study, you may contact us directly at (207) 581-2875. If
you have questions about your rights as a research participant you may contact Gayle Jones,
Assistant to the University of Maine‘s Protection for Human Subjects Review Board at (207) 581-
1498.
Your willingness to participate in this study is greatly appreciated.
Sincerely,
Kourtney Collum
Graduate Research Assistant
University of Maine
Parks, Recreation & Tourism Program
& the Paul S. Sarbanes Transit in Parks TAC
John Daigle, Ph.D.
Associate Professor
University of Maine
Parks, Recreation & Tourism Program
& the Paul S. Sarbanes Transit in Parks TAC

109
APPENDIX H. INTERVIEW PROTOCOL FOR VISITOR SURVEY
Data collectors will be stationed at a table within the survey area. They will approach
every 6th
person that passes by and ask them to participate in the survey. If the 6th
person
declines to participate, they will then ask the next person until they locate a willing
participant.
Interviewer: Hello. I‘m a researcher working with the Town of Estes Park.
We‘re doing a study to assess visitor travel experience and awareness of
traveler information. All surveys are voluntary and anonymous and your
answers will in no way be linked to you. You may skip any questions you
do not wish to answer. Your participation is very important, because after
visiting today, you have a unique perspective on the strengths and
challenges of transportation in the area. Would you be interested in taking
5 minutes to complete this survey which will be used to improve travel
conditions in the area?
If No…...
Thank you for your time. Enjoy your visit! (Record gender, party size,
number of children under the age of 5 on non-response form)
If Yes…..
THANK YOU! We just have a few qualifying questions before you begin
the survey. Are you 18 years or older? (This question should only be asked
if the person appears to be younger than 26)
If Yes…..
Did you park your car at the Park-n-Ride located near the Fairgrounds and
use the Silver Route shuttle to get into town?
If Yes…..
That‘s great. You will actually have an opportunity to complete this
survey on your shuttle ride back to the Park-n-Ride later today, so we
won‘t take up any more of your time now. Thank you for taking the time
to talk with us. Enjoy your trip!
If No……
Ok, you qualify to participate in this survey. It should only take about 5
minutes to complete, and when you‘re done you can return it to me.
We are also asking visitors to participate in a more comprehensive survey
which you can complete now, or at home at your leisure. The information
that you would provide would be extremely helpful to the Town of Estes
Park and Rocky Mountain National Park. The results from the survey will
give managers insight into what would enhance your travel experience
when visiting the area, and help them improve the current transportation
system. I have a copy of the mail survey here. If you have an extra 5-7

110
minutes, you can complete it now and return it to me when you‘re done. If
you don‘t have time, you can take it with you and return it in the pre-paid
envelope that‘s attached to it. Would you be interested in participating in
the survey?
If Yes, they will participate in the comprehensive survey….
(Data collector will then provide the respondent with a clipboard and
pencil. A copy of the appropriate survey instruments will be attached to
the clipboard. If the respondent wishes to complete the comprehensive
survey onsite, simply give them both surveys. If they wish to complete it at
home, give them the onsite survey, the comprehensive survey, and a pre-
paid mail envelope to return it in. Ask them to complete the onsite survey,
and then fill out their information on a Mail Survey card, so that they can
be sent a reminder post card for the comprehensive survey. Then read the
following statement.)
There is a short statement on this card indicating that your participation in
this survey is completely voluntary. We want to assure you this
information will be kept confidential and that your name and address will
not be given to any other group or used by us beyond the purposes of this
study.
Will you please write your name and address at the top of the card?
THANK YOU very much and I would be happy to answer any other
questions about the study.
If No, they will not participate in the comprehensive survey…..
Well we appreciate you taking the time to complete the onsite survey.
(Data collector will then provide the respondent with a clipboard and
pencil. A copy of the appropriate survey instrument will be attached to the
clipboard.)
THANK YOU very much and I would be happy to answer any other
questions about the study.
111
APPENDIX I. INTERVIEW PROTOCOL FOR SHUTTLE SURVEY
The data collector will be on the shuttle and will address visitors as they are returning
from the CVB to the Park-n-Ride lot.
Interviewer: Hello. I‘m a researcher working with the Town of Estes Park.
We‘re doing a study to assess visitor travel experience and awareness of
traveler information. We want to invite one person from each group to
take a 5 minute survey which will be used to improve travel conditions in
the area. All surveys are voluntary and anonymous and your answers will
in no way be linked to you. You may skip any question you do not wish to
answer. Your participation is very important, because after visiting today,
you all have a unique perspective on the strengths and challenges of
transportation in the area. Would any of you be interested in helping us by
participating in this survey?
If No…...
Thank you for your time. Enjoy your visit! (Record gender, party size,
number of children under the age of 5 on non-response form)
If Yes…..
THANK YOU! For the sake of randomizing our survey results, could we
please have the person in your group with the last birthday complete this
survey. This person must be 18 years of age or older.
(Data collector will then provide respondents with a clipboard and pencil.
A copy of the appropriate survey instruments will be attached to the
clipboard.)
When you are done with your survey, you can return it to me.
We are also asking visitors to participate in a more comprehensive survey
which you can complete now, or at home at your leisure. The information
that you would provide would be extremely helpful to the Town of Estes
Park and Rocky Mountain National Park. The results from the survey will
give managers insight into what would enhance your travel experience
when visiting the area, and help them improve the current transportation
system. I have a copy of the mail survey here. If you have an extra 5-7
minutes, you can complete it now and return it to the survey box located at
the Park-n-Ride shuttle stop. If you don‘t have time, you can take it with
you and return it at your leisure in the pre-paid envelope that‘s attached to
it.

112
If Yes, they will participate in the comprehensive survey….
(If the respondent wishes to complete the comprehensive survey onsite,
simply give them both surveys. If they wish to complete it at home, give
them the onsite survey, the comprehensive survey, and a pre-paid mail
envelope to return it in. Ask them to complete the onsite survey, and then
fill out their information on a Mail Survey card, so that they can be sent a
reminder post card for the comprehensive survey. Then read the following
statement.)
There is a short statement on this card indicating that your participation in
this survey is completely voluntary. We want to assure you this
information will be kept confidential and that your name and address will
not be given to any other group or used by us beyond the purposes of this
study.
Will you please write your name and address at the top of the card?
THANK YOU very much and I would be happy to answer any other
questions about the study.
If No, they will not participate in the comprehensive survey…..
Well we appreciate you taking the time to complete the onsite survey.
THANK YOU very much and I would be happy to answer any other
questions about the study.

113
BIOGRAPHY OF AUTHOR
Kourtney Kristen Collum was born on January 23, 1987 in Monroe, Michigan.
Kourtney has two wonderful parents, Brian and Dawn, who taught her the value of
education at a young age and passed their strong Midwestern work ethic onto both her
and her sister, Shannon. Kourtney graduated from Monroe High School in June of 2005
and Western Michigan University in May of 2009. In the summers during college
Kourtney worked on several conservation projects in New Zealand, Maine, and Colorado.
Of all of these experiences, her time working on the trail crew at Baxter State Park left
the most indelible impression. Longing for the north woods, Kourtney decided to return
to Maine in 2010 to pursue a graduate degree. In her spare time Kourtney enjoys reading
and collecting books, hiking and exploring Maine with her boyfriend Patrick, gardening,
making delicious food and spending time with her lovely family in Michigan. Kourtney is
a candidate for the Master of Science degree in Forest Resources from the University of
Maine in May, 2012.