from classifiers to discriminators a nearest neighbor …cslzhang/paper/pr_11_nnrida.pdffrom...
TRANSCRIPT

Pattern Recognition ] (]]]]) ]]]–]]]
Contents lists available at ScienceDirect
Pattern Recognition
0031-32
doi:10.1
n Corr
E-m
cslzhan
csdzhan
PleasPatte
journal homepage: www.elsevier.com/locate/pr
From classifiers to discriminators: A nearest neighbor rule induceddiscriminant analysis
Jian Yang a,n, Lei Zhang b, Jing-yu Yang a, David Zhang b
a School of Computer Science and Technology, Nanjing University of Science and Technology, Nanjing 210094, PR Chinab Department of Computing, Hong Kong Polytechnic University, Kowloon, Hong Kong
a r t i c l e i n f o
Article history:
Received 15 February 2009
Received in revised form
10 November 2010
Accepted 14 January 2011
Keywords:
Classification
Classifier
Feature extraction
Discriminant analysis
Dimensionality reduction
Pattern recognition
03/$ - see front matter & 2011 Elsevier Ltd. A
016/j.patcog.2011.01.009
esponding author.
ail addresses: [email protected] (J. Ya
[email protected] (L. Zhang), yangjy@ma
[email protected] (D. Zhang).
e cite this article as: J. Yang, et al.,rn Recognition (2011), doi:10.1016/
a b s t r a c t
The current discriminant analysis method design is generally independent of classifiers, thus the
connection between discriminant analysis methods and classifiers is loose. This paper provides a way to
design discriminant analysis methods that are bound with classifiers. We begin with a local mean based
nearest neighbor (LM-NN) classifier and use its decision rule to supervise the design of a discriminator.
Therefore, the derived discriminator, called local mean based nearest neighbor discriminant analysis
(LM-NNDA), matches the LM-NN classifier optimally in theory. In contrast to that LM-NNDA is a NN
classifier induced discriminant analysis method, we further show that the classical Fisher linear
discriminant analysis (FLDA) is a minimum distance classifier (i.e. nearest Class-mean classifier)
induced discriminant analysis method. The proposed LM-NNDA method is evaluated using the
CENPARMI handwritten numeral database, the NUST603 handwritten Chinese character database,
the ETH80 object category database and the FERET face image database. The experimental results
demonstrate the performance advantage of LM-NNDA over other feature extraction methods with
respect to the LM-NN (or NN) classifier.
& 2011 Elsevier Ltd. All rights reserved.
1. Introduction
The nearest neighbor (1-NN) classifier is one of the mostwidely used classifiers due to its simplicity and effectiveness.Cover and Hart laid the theoretical foundation of 1-NN classifierand showed that when the training sample size approaches toinfinity, the error rate of the NN classifier is bounded above bytwice the Bayes error rate in 1967 [1]. As a generalization of 1-NNclassifier, K-NN classifier was presented subsequently [2]. Inrecent years, with the popularity of manifold learning, theNN-based classification methods arouse considerable research inter-ests and a number of improved variants of the NN classifier havebeen developed [3–8]. Among the most simple and interesting is thelocal mean based nearest neighbor (LM-NN) classifier, which usesthe mean of the R nearest neighbors within a class as the prototypeof the class [8]. The LM-NN classifier was demonstrated to be morerobust to outliers than the classical 1-NN and K-NN classifiers andthus achieves better classification performance [8].
If the dimension of the observation space is very high, it isgenerally time-consuming to perform the NN-based classificationdirectly based on all of the original features. In addition, using all
ll rights reserved.
ng),
il.njust.edu.cn (J.-y. Yang),
From classifiers to discrimj.patcog.2011.01.009
features for classification is not necessary to achieve optimumresults due to the problem of ‘‘dimensionality curse’’. Therefore,we usually perform feature extraction (or dimensionality reduc-tion) first before the classification step. Discriminant analysis is afundamental tool for feature extraction. By far, numerous dis-criminant analysis methods have been developed. Among themost well-known is Fisher linear discriminant analysis(FLDA) [36]. FLDA seeks to find a projection axis such that theFisher criterion (i.e. the ratio of the between-class scatter to thewithin-class scatter) is maximized after the projection of samples.FLDA receives intense attention in the past decade and numerousFLDA variants were put forward to deal with real-world smallsample size problems [9–16]. A nonlinear version of FLDA, thekernel Fisher Discriminant (KFD), was proposed for dealing withthe data with nonlinear structures [17–20]. Another nonlineardiscriminant analysis version, Locally Linear Discriminant Analy-sis which involves a set of locally linear transformations, waspresented recently based on the idea that global nonlinear datastructures are locally linear [21]. In addition, motivated by theidea of manifold learning algorithms [37,38], researchersdesigned a family of locality characterization based discriminantanalysis techniques, such as Locality Preserving Projections(LPP) [22], Local discriminant embedding [23], Marginal FisherAnalysis (MFA) [24], etc.
The existing discriminant analysis method design, however, isgenerally independent of classifier design. In other words, one
inators: A nearest neighbor rule induced discriminant analysis,

J. Yang et al. / Pattern Recognition ] (]]]]) ]]]–]]]2
does not consider what classifier would be used when trying toderive a discriminant analysis method. The derived discriminantanalysis method, thus, can theoretically work with any classifier.The connection between discriminant analysis methods andclassifiers is very loose. To generate an effective pattern recogni-tion system, one needs to choose a classifier to match thedesigned discriminant analysis method well by experience. But,what classifier optimally matches the discriminant analysismethod is generally unknown to us.
In this paper, we provide a way to design discriminant analysismethods that are bound with classifiers. We begin with aclassifier and use it as a steerer to direct the design of adiscriminator. Specifically we use the local mean based NNclassification rule to direct the design of a discriminator, thus,the obtained discriminator, called local mean based NN discrimi-nant analysis (LM-NNDA), matches the LM-NN classifier opti-mally. Therefore, the LM-NNDA based feature extractor and theLM-NN classifier can be seamlessly integrated into a patternrecognition system. In contrast to that LM-NNDA is a NN classifierinduced discriminant analysis method, we further show that theclassical FLDA is a minimum (Class-mean) distance classifier (orcalled nearest Class-mean classifier) induced discriminant analy-sis method. Therefore, FLDA is the most suitable feature extractorfor the minimum distance classifier in theory.
Compared with the existing discriminant analysis methods,the most remarkable advantages of the proposed LM-NNDAmethod is its close connection to the NN classifier. Since the NNclassifier has an asymptotical average error rate P satisfyingP*rPr2P*, where P* is the Bayes error rate [36], it is reasonableto believe that the proposed LM-NNDA method can yield a Bayessuboptimal projection matrix which is connected to Bayes errorvia lower and upper bounds. In contrast, most existing discrimi-nant analysis methods don’t have this property.
In literature, we find that Hastie and Tibshirani’s work [46]is quite interesting and related to ours. They proposed amethod, coined discriminant adaptive nearest neighbor (DANN),to connect the discriminant analysis and nearest neighbor classi-fication. The idea of DANN is quite different from ours, sinceDANN employs the between-class and within-class scatter infor-mation of a local linear discriminant analysis to define a newmetric for computing neighborhoods in the K-NN classifier,whereas our method uses the decision rule of local mean basednearest neighbor classifier to derive a new discriminant analysis.In other words, the former uses the idea of discriminant analysisfor the NN classifier design, while the later uses idea of theNN classifier for discriminant analysis design. Hastie andTibshirani also presented a global dimensionality reduction (DR)method using the local between-class discriminant informa-tion [46]. As an extension of Hastie and Tibshirani’s DANNmethod, Domeniconi et al. suggested a locally adaptive metricnearest-neighbor classification method by using the w2 distancefor metric learning [47]. Bressan and Vitria showed a connectionbetween nonparametric discriminant analysis and nearest neigh-bor classification [48]. Zhang et al. presented a discrimi-native nearest neighbor classification method by combiningsupport vector machines and K-NN classifiers into one frame-work [49].
The remainder of this paper is organized as follows. Section 2outlines the classical NN classifier and local mean based nearestneighbor (LM-NN) classifier. Section 3 develops the idea of thelocal mean based NN discriminant analysis (LM-NNDA) and therelevant algorithm. Section 4 reveals that FLDA is a minimum(Class-mean) distance classifier induced discriminant analysismethod and the connection between LM-NNDA andFLDA. Section 5 describes the experimental methodology andresults. Section 6 offers our conclusions and future work.
Please cite this article as: J. Yang, et al., From classifiers to discrimPattern Recognition (2011), doi:10.1016/j.patcog.2011.01.009
2. Outline of nearest neighbor classifiers
2.1. Nearest neighbor classifier
Suppose there are c known pattern classes. Let Xi ¼
fXij9j¼ 1,. . .,Mig be the training sample set of Class i, where Mi is
the number of training samples of Class i. For a given new samplex, let us find its nearest neighbor xir in each class. xir is viewed asthe prototype of Class i. The square distance from x to Class i isdefined by
diðxÞ ¼ 99x�xir992: ð1Þ
Assume that the distance between x and Class l is minimal, i.e.
dlðxÞ ¼mini
diðxÞ: ð2Þ
The decision rule of the 1-NN classifier is that x belongs toClass l.
Let Pn(e) be the average probability of error for the 1-NNdecision rule using n training samples. The asymptotical averageerror rate P¼ limn-1PnðeÞ satisfies the following property [36]:
P*rPrP* 2�c
c�1P*
� �o2P*, ð3Þ
where P* is the Bayes error rate. Eq. (3) provides lower and upperbounds for the error rate of the 1-NN classifier in the case of aninfinite number of samples.
The K-NN classifier naturally extends the idea of the 1-NNclassifier by taking the K nearest neighbors and assigning the signof the majority. Specifically, for a given test sample x, supposethere are ki samples belonging to Class i. If kl ¼maxi ki,x belongsto Class l. The K-NN classifier has a similar asymptotical averageerror rate as shown in Eq. (3). However, it should be stressed thatthe NN classifier (either 1-NN or K-NN) requires a large number oftraining samples so as to approach the asymptotic performance.For a given limited number of training samples, the asymptoticalerror rate cannot be guaranteed.
2.2. Minimum (Class-mean) distance classifier
Minimum distance classifier uses the Class-mean as the pro-totype of the class, thus this classifier is also called the nearestClass-mean classifier. Let mi (i¼1,y,c) be the mean vector of thetraining samples in Class i. The square distance from x to Class i isdefined by
diðxÞ ¼ 99x�mi992: ð4Þ
If the distance between x and Class l is minimal, i.e.dlðxÞ ¼mini diðxÞ, the decision of the minimum distance (MD)classifier is that x belongs to Class l.
2.3. Local mean based nearest neighbor (LM-NN) classifier
Instead of searching for the 1-nearest neighbor of the givensample x, the local mean NN classifier needs to find R-nearestneighbors of x from each class. Suppose the R-nearest neighborsof x in Class i are xir, where r¼1,y,R. Let us calculate the meanvector of the these R-nearest neighbors miðxÞ ¼ ð1=RÞ
PRr ¼ 1 xir ,
where mi(x) is called the local mean of the sample x in Class i.mi(x) is viewed as the prototype of Class i with respect to x. Thesquare distance from x to Class i is thus defined by
diðxÞ ¼ 99x�miðxÞ992: ð5Þ
If the distance between x and Class l is minimal, i.e.dlðxÞ ¼mini diðxÞ, we can make the decision that x belongs toClass l.
inators: A nearest neighbor rule induced discriminant analysis,

J. Yang et al. / Pattern Recognition ] (]]]]) ]]]–]]] 3
The LM-NN classifier can be thought of as a meaningful com-promise between the minimum distance classifier and the nearestneighbor classifier. It has been demonstrated to be more powerfulthan the classical 1-NN and K-NN classifiers [8]. A possible reason isthat the LM-NN classifier is more robust to outliers [8]. Actuallyeven when there is no outlier in the training sample set, the LM-NNclassifier can still be better. Fig. 1 provides an intuitive example forwhy the LM-NN classifier can outperform the 1-NN classifier. In theexample, the two-class of samples are supposed to be linearseparable and the number of given training samples is pretty small.Based on this small number of training samples, the 1-NN classifierproduces a locally linear decision surface as shown in Fig. 1, whichmust lead to poor generalization performance. In such a case, theK-NN classifier encounters the same problem [25] as the 1-NNclassifier and achieves an even worse decision surface. In contrast,the LM-NN classifier can yield a desired linear decision surface forthis case. Note that here we use R¼2 in the LM-NN classifier sincethe decision surface is one-dimensional (the nearest neighborparameter R is chosen as D+1 for D-dimensional decision surface).
It is obvious that the local mean based nearest neighborclassifier is the nearest neighbor classifier when the nearestneighbor parameter R¼1. The local mean based nearest neighborclassifier can be viewed as a generalized version of the classicalnearest neighbor classifier. Therefore, we use the local mean NNdecision rule in the design of our discriminant analysis method.
2.4. Parameter selection in the LM-NN classifier
The parameter R plays an important role in the performance ofthe LM-NN classifier, since it determines the degree of compromisebetween the MD classifier and the nearest neighbor classifier. If R istoo small, for example reaches 1, the LM-NN classifier becomes the1-NN classifier and loses the power of filling in ‘‘holes’’ caused bymissing samples (just as shown in Fig. 1). If R is too large andapproaching the training sample number of each class, the LM-NNclassifier becomes the MD classifier and loses its power for dealingwith nonlinearly separable problems. For instance, two classes ofsamples lie on or near the two concentric circles, respectively, asshown in Fig. 2, and suppose that for each class the mean of all 10samples is exactly the center of circle. If R¼10, the LM-NN classifiercannot make a decision because the Class-means share a same point.
From the theory of manifold learning [41,42,37,38], we canassume that each class of samples forms a lower-dimensionalmanifold (embedded in a high dimensional input space) which
Fig. 1. Illustration of the decision surfaces of the nearest neighbor (NN) classifier
and the local mean based nearest neighbor (LM-NN) classifier: (a) The decision
surface of the NN classifier (it is locally linear due to the limited number of
training samples) and (b) the decision surface of the LM-NN classifier. Note that in
(b), the white circles and triangles represents the generated samples by the local
mean operator (R¼2). These samples help the LM-NN classifier produce a desired
linear decision surface.
Please cite this article as: J. Yang, et al., From classifiers to discrimPattern Recognition (2011), doi:10.1016/j.patcog.2011.01.009
can reasonably be considered locally linear. For a given testingsample, it is reasonable to think that its R neighbors exist [21,25]on or near a local ‘‘flat patch’’ of the manifold, which is approxi-mated by an (R�1)-dimensional local hyperplane spanned by R
neighbors. From this point of view, it is reasonable to use themean of the R neighbors, i.e. the centroid of the local hyperplane,to represent the local ‘‘flat patch’’. Conversely, from the viewpointof manifolds, we have an insight into the LM-NN classifier itself.The parameter R, the number of the neighbors in the LM-NNclassifier, should be chosen as D+1, where D is the local dimen-sion, i.e. the dimension of the local ‘‘flat patch’’ of the manifold.
In the example as shown in Fig. 2, the 10 neighbors of one classare placed on a circle. The circle is viewed as a one-dimensionalmanifold, whose local patch is a line segment with a dimension of1. In such a case, for a given test samples on or near the classmanifold, we can find its R neighbors from each class, where R asis chosen as 2 rather than 10. Then, the local means of two classesare different and the LM-NN makes a right decision.
From this example, we can also find that there is a flexiblescope allowing the parameter R to vary around D+1. When R
varies from 1 to 3, the LM-NN can always achieve the rightresults. This provides us a flexibility to choose the parameter forachieving satisfying results. Our experimental results in Sections5.1 and 5.2 further demonstrate this fact.
The parameter R can be theoretically determined by the localdimension of the manifold. However, evaluating the local dimensionof a manifold accurately is very difficult or even impossible whenthere is a very limited number training samples available. Therefore,it is infeasible to choose R by evaluating the local dimension of themanifold. In practice, we generally choose R according to thenumber of training samples of each class. If there is a same numberof training samples for each class, we always assume that there is asame local dimension shared by all classes and choose a proper,common R for each class which yields the best recognition perfor-mance. Otherwise, we choose Ri¼R0Mi/M, where Mi is the numberof training samples in Class i, M is total number of the trainingsamples across all classes, i.e. M¼
Pci ¼ 1 Mi, and R0 is a parameter
which is shared by all classes. We use experiments to determine aproper R0 for achieving satisfying recognition results.
3. Nearest neighbor rule induced discriminant analysis
This section will develop a discriminant analysis methodunder the guide of the LM-NN decision rule. The central idea of
Fig. 2. Illustration of the choice of the parameter R in the LM-NN classifier for a
nonlinearly separable problem. Here, the red point denotes a test sample, and the
yellow points are local means belonging to different classes. An ideal parameter R
is chosen as 2, since the local dimension of the class manifold is 1.
inators: A nearest neighbor rule induced discriminant analysis,

J. Yang et al. / Pattern Recognition ] (]]]]) ]]]–]]]4
designing the method is to make the subsequent LM-NN classifierachieve the optimum performance in the reduced-dimensionalspace.
3.1. Basic idea
Let us first consider the problem in the observation space.Suppose there are c known pattern classes. Let X¼ fXijg be thetraining sample set, where i¼1,y,c and j¼1,y,Mi. For eachsample xij, we can find its R-nearest neighbors in every classand calculate the corresponding local mean vector. Let ms
ij be thelocal mean vector of xij in Class s. The distance between xij andClass s is
dsðxijÞ ¼ 99xij�msij99
2: ð6Þ
To make the LM-NN classifier perform well on the trainingsample set, we want the within-class local distance di(xij) as smallas possible and the between-class local distance ds(xij) for eachsa i as large as possible. To this end, let us define the local within-class scatter of samples in the observation space as follows:
1
M
Xi,j
diðxijÞ ¼1
M
Xi,j
:xij�miij:
2, ð7Þ
and the local between-class scatter of samples in the input spaceas follows:
1
Mðc�1Þ
Xi,j
Xsa i
dsðxijÞ ¼1
Mðc�1Þ
Xi,j
Xsa i
:xij�msij:
2, ð8Þ
where M is total number of training samples.The local within-class scatter is actually the average of all pair
of within-class local distances, and the local between-class scatteris the average of all pair of between-class local distances.According to LM-NN decision rule, larger local between-classscatter and smaller local within-class scatter will lead to betterclassification results in an average sense if samples are classifiedin the observation space.
Our goal is to find a linear discriminant transform
y¼ PT x where P¼ ðu1,. . .,udÞ, ð9Þ
such that the data points in the low-dimensional transformedspace have the following properties:
(i)
PlPa
The local neighbor relationship is preserved.
(ii) The local between-class scatter of samples is maximizedwhile at the same time the local within-class scatter ofsamples is minimized.
The first property is to guarantee that the R nearest neighborsof a point in the observation space are still the R nearestneighbors of the point in the transformed space. The secondproperty aims to make the LM-NN classifier perform well in thetransformed space.
3.2. Local mean based nearest neighbor discriminant analysis
(LM-NNDA)
For simplicity, let first consider a one-dimensional lineartransform y¼uTx. Under this transform, each data point xij inobservation space is mapped into yij¼PTxij in a one-dimensionaltransformed space. Let the R-nearest neighbors of xij in Class s inthe observation space be xsr, r¼1,y,R. Then, the local meanvector of xij in Class s in the observation space is ms
ij ¼PRr ¼ 1 xsr . Since we assume the local neighbor relationship is
preserved, in the transformed space, the R-nearest neighborsof the point yij in Class s is ysr, r¼1,y,R. The local mean of yij in
ease cite this article as: J. Yang, et al., From classifiers to discrimttern Recognition (2011), doi:10.1016/j.patcog.2011.01.009
Class s in the transformed space is
~msij ¼
XK
r ¼ 1
ysr ¼XK
r ¼ 1
uT xsr ¼uT msij: ð10Þ
Now, let us define the local within-class scatter of samples inthe transformed space as follows:
1
M
Xi,j
diðyijÞ ¼1
M
Xi,j
ðyij� ~miijÞ
2¼
1
M
Xi,j
ðuT xij�uT miijÞðu
T xij�uT miijÞ
T
¼uT 1
M
Xi,j
ðxij�miijÞðxij�mi
ijÞT
24
35u¼uT SL
wu,
where
SLw ¼
1
M
Xi,j
ðxij�miijÞðxij�mi
ijÞT
ð11Þ
is called the local within-class scatter matrix. It is easy to showthat SL
w is a nonnegative definite matrix.Similarly let us define the local between-class scatter of
samples in the transformed space as follows:
1
Mðc�1Þ
Xi,j
Xsa i
dsðyijÞ ¼1
Mðc�1Þ
Xi,j
Xsa i
ðyij� ~msijÞ
2
¼1
Mðc�1Þ
Xi,j
Xsa i
½uT ðxij�msijÞ�½u
T ðxij�msijÞ�
T
¼uT 1
Mðc�1Þ
Xi,j
Xsa i
ðxij�msijÞðxij�ms
ijÞT
24
35u¼uT SL
bu,
where
SLb ¼
1
Mðc�1Þ
Xi,j
Xsa i
ðxij�msijÞðxij�ms
ijÞT
ð12Þ
is called the local between-class scatter matrix. It is easy to showthat SL
b is a nonnegative definite matrix.To maximize the between-class scatter and simultaneously to
minimize the within-class scatter, we can choose to maximize thefollowing criterion:
JðuÞ ¼uT SL
buuT SL
wu: ð13Þ
The optimal solution of the criterion in Eq. (13) is actually thegeneralized eigenvector u, of SL
bX¼ lSLwX corresponding to the
largest eigenvalue. Like FLDA, for multiple-class problems, oneprojection axis u is not enough for discrimination, so we gen-erally need to find a set of projection axes. Similar to the wayadopted by FLDA to get multiple projection axes, we can calculatethe generalized eigenvectors u1,. . .,ud of SL
bX¼ lSLwX correspond-
ing to the d largest eigenvalues and use them as projection axes toproduce a transform matrix P¼ ðu1,. . .,udÞ, where d is thenumber of projection axes chosen. The linear transformationy¼PTx forms a feature extractor which reduces the dimensionof original feature vectors to d.
In summary of the description above, the local mean basednearest neighbor discriminant analysis (LM-NNDA) algorithm isgiven below:
3.2.1. The LM-NNDA algorithm
Step 1: For each sample point xij, find its R-nearest neighbors inevery class and calculate the corresponding local mean vector. Letms
ij be the local mean vector of xij in Class s.Step 2: Construct the local within-class scatter matrix SL
w andthe local between-class scatter matrix SL
b using Eqs. (11) and (12).Calculate the generalized eigenvectors u1,. . .,ud of SL
b and SLw
inators: A nearest neighbor rule induced discriminant analysis,

J. Yang et al. / Pattern Recognition ] (]]]]) ]]]–]]] 5
corresponding to the d largest generalized eigenvalues. LetP¼ ðu1,. . .,udÞ.
Step 3: For a given sample x, its feature vector y is obtained bythe linear transform y¼PTx.
It should be noted that unlike FLDA, which can generate atmost c�1 effective projection axes, the LM-NNDA algorithm canyield more than c�1 effective projection axes, since the rank of SL
b
is generally much larger than c�1.In addition, since LM-NNDA involves a parameter R, how to
choose the parameter is a first problem. Here, we assume that acommon R is shared by all classes and determine a proper R whichyields the best recognition performance by experimental evalua-tion, just as the way used in the LM-NN classifier. It should bementioned that our experiments show that LM-NNDA is insensi-tive to the variation of R, that is, the performance of LM-NNDA issteady when R ranges in a relative large interval.
Finally we would like to analyze the computational complexityof LM-NNDA. In the construction of the between-class andwithin-class scatter matrices SL
b and SLw, for each training sample,
we need to find its R nearest neighbors within each class. There-fore, compared to the FLDA method, an additional computationalcost of LM-NNDA is required for the nearest neighbor search. Thenaive (linear) search of the R neighbors of one point within Class i
has a running time of O(RMiD), where Mi is the number of samplesin the Class i and D is of dimension of the pattern vectors. Sothe computational complexity for nearest neighbor search inLM-NNDA is O(RM2D), where is M is total number of trainingsamples, M¼
Pci ¼ 1 Mi. The naive search algorithm only suits for
small sample size cases. For large sample size cases, moreadvanced nearest neighbor search algorithms with lower compu-tational complexity can be used instead [43].
3.3. Implementation of LM-NNDA in small sample size cases
In the small sample size cases where the number of trainingsamples is smaller than the dimension of the image vector space,the local within-class scatter matrix SL
w is always singular becausethe following proposition holds:
Proposition 1. The rank of the local within-class scatter matrix SLw is
equal or less than M�c, i.e. rankðSLwÞrM�c, where M is number of
training samples and c is the number of classes.
Proof. First of all, let us rewrite SLw ¼ ð1=MÞ
Pci ¼ 1 SLi
w, whereSLi
w ¼PMi
j ¼ 1ðxij�miijÞðxij�mi
ijÞT .
SLiw can be viewed as the local scatter matrix of Class i. For
convenience of discussion, we would like to express SLiw in a
matrix form. To this end, let us define a Mi-dimensional column
vector Hij ¼ ðHkijÞMi�1 for each sample point xij, whose kth element
is given below:
Hkij ¼
� 1K if xik is among K nearest nieghbors of xij,
1 if k¼ j,
0 otherwise :
8><>:
Letting Xi ¼ ½xi1,. . .,xiMi� and Hi ¼ ½Hi1,. . .,HiMi
�, we have
SLiw ¼
XMi
j ¼ 1
ðXiHijÞðXiHijÞT¼Xi
XMi
j ¼ 1
HijHTij
0@
1AXT
i ¼XiðHiHTi ÞX
Ti :
Now, let us consider the rank of the Mi by Mi matrix
Hi ¼ ½Hi1,. . .,HiMi�. Since the sum of the all elements in Hij is zero,
adding all but the first rows of the matrix Hi to the first row, we
Please cite this article as: J. Yang, et al., From classifiers to discrimPattern Recognition (2011), doi:10.1016/j.patcog.2011.01.009
get the following matrix:
0 0 � � � 0
H2i1 1 � � � H2
iMi
^ ^ & ^
HMi
i1 HMi
i2 � � � 1
266664
377775
Thus, rank(Hi)rMi�1. From the singular value decomposition
(SVD) theorem [26], we know that Hi and HiHTi have the same
rank. Therefore, rankðHiHTi ÞrMi�1.
Let X¼[X1,y,Xc] and H¼ diagðH1HT1,. . .,HcHT
c Þ. It is easy to
derive that
rankðHÞrXc
i ¼ 1
ðMi�1Þ ¼M�c:
Then, we have
SLw ¼
1
M
Xc
i ¼ 1
SLiw ¼
1
M
Xc
i ¼ 1
XiðHiHTi ÞX
Ti ¼
1
MXHXT :
Therefore rankðSLwÞrM�c. &
In real-world applications, the given M training samples aregenerally linear independent in the high-dimensional input space.The rank of SL
w is usually M�c. To avoid overfitting in smallsample size cases, we borrow the idea in [9,10] and use PCA toreduce the dimension of the input space such that SL
w is non-singular in the PCA-transformed space. We then performLM-NNDA based on PCA-transformed features. To furtherenhance the robustness of the LM-NNDA algorithm, we use thefollowing technique to regularize the local within-class scattermatrix SL
w:
SLw’SL
wþaI, ð14Þ
where I is the identity matrix and a is chosen asa¼ 0:001traceðSL
wÞ in this paper.
3.4. A special case of LM-NNDA: NNDA
Particularly, when the nearest neighbor parameter R¼1,LM-NNDA becomes a nearest neighbor rule induced discriminantanalysis (NNDA). In the training process of NNDA, for each samplepoint xij, we need to find its within-class nearest neighbor and allbetween-class nearest neighbors. Then, we try to minimize theaverage distance between every point and its within-class nearestneighbor and simultaneously to maximize the average distancebetween every point and its between-class nearest neighbor.
A NNDA closely related dicriminant analysis is the nonpara-metric margin maximum criterion (NMMC) method proposed byQiu and Wu [27]. The basic idea of NMMC is to find the within-class furthest neighbor (rather than the within-class nearest neigh-bor) and the between-class nearest neighbor of each sample point,and then to minimize the average distance between every pointand its within-class furthest neighbor and simultaneously to max-imize the average distance between every point and its between-class nearest neighbor. The most remarkable difference betweenNMMC and NNDA is that the former focuses on the within-classfurthest neighbor of a sample while the later focuses on the within-class nearest neighbor. Focusing on the within-class furthest neigh-bor, however, may encounter the following problems:
(i)
inat
The within-class furthest neighbors are more likely to beoutliers, so depending on them to characterize the within-class scatter is not very robust.
(ii)
In some cases, minimizing the distance between a point andits within-class furthest neighbor does not make sense forors: A nearest neighbor rule induced discriminant analysis,

Fig.neig
sam
neig
redu
not m
J. Yang et al. / Pattern Recognition ] (]]]]) ]]]–]]]6
PlPa
classification, as shown in Fig. 3. Reducing the distancebetween a sample X1 and its within-class furthest neighborX2 has no effect on the classification of the two-class samples.
In contrast, the NNDA method does not have the foregoingproblems since it uses the within-class nearest neighbors tocharacterize the within-class scatter. This within-class nearest
neighbors based within-class scatter characterization plus thebetween-class nearest neighbors based between-class scattercharacterization make NNDA more suitable for the NN classifierthan NMMC.
4. Further discussion
This section shows that FLDA is a minimum distance classifi-cation rule induced discriminant analysis method, and thenreveals the connection between LM-NNDA and FLDA. Finally weelucidate the dependency of LM-NNDA and the LM-NN classifierin a special case.
4.1. FLDA
FLDA seeks to find a projection axis such that the Fishercriterion (i.e. the ratio of the between-class scatter to the within-
class scatter) is maximized after the projection of samples. Thebetween-class and within-class scatter matrices Sb and Sw aredefined by
Sb ¼1
M
Xc
i ¼ 1
Miðmi�m0Þðmi�m0ÞT, ð15Þ
Sw ¼1
M
Xc
i ¼ 1
XMi
j ¼ 1
ðxij�miÞðxij�miÞT, ð16Þ
where xij denotes the jth training sample in class I, c is thenumber of classes, Mi is the number of training samples in class I,mi is the mean of the training samples in class I, m0 is the totalmean of training samples, i.e. m0 ¼ ð1=MÞ
PMj ¼ 1 xj ¼
ð1=MÞPc
i ¼ 1 Mimi. Specially when each class has the same num-ber of training samples, the between-class scatter matrix becomes
Sb ¼1
c
Xc
i ¼ 1
ðmi�m0Þðmi�m0ÞT, ð17Þ
Y1X1
X2
X3
3. Illustration of the within-class furthest neighbor, the within-class nearest
hbor and the between-class nearest neighbor of a sample point. For the
ple point X1, its within-class furthest neighbor is X2, its within-class nearest
hbor is X3, and it is between-class nearest neighbor is Y1. It is obvious that
cing the distance between X1 and its within-class furthest neighbor X2 does
ake sense for the classification of the two-class problem.
ease cite this article as: J. Yang, et al., From classifiers to discrimttern Recognition (2011), doi:10.1016/j.patcog.2011.01.009
The Fisher criterion is defined by
JF ðuÞ ¼uT SbuuT Swu
: ð18Þ
The stationary points of JF(u) are the generalized eigenvectorsu1,u2,y,ud, of SbX¼l SwX corresponding to d largest eigenva-lues. These stationary points form the coordinate system of FLDA.
4.2. FLDA is a minimum distance classification rule induced
discriminant analysis
In this section, we first develop a MD classification ruleinduced discriminant analysis method, and then show its equiva-lence to FLDA when each class has the same number of trainingsamples.
Let us consider the problem in the y¼uTx transformed space.Each data point xij in observation space is mapped into yij¼uTxij
in the transformed space. The class-mean vector mi (i¼1,y,c)and the total mean vector m0 in observation space is thus mappedinto ~mi ¼uT mi and ~m0 ¼uT m0, respectively, in the transformedspace. To make the MD classifier perform well, we try to minimizethe following within-class scatter:
1
M
Xi,j
diðyijÞ ¼1
M
Xi,j
ðyij� ~miÞ2¼
1
M
Xi,j
½uT ðxij�miÞ�½uT ðxij�miÞ�T
¼uT Swu, ð19Þ
and simultaneously to maximize the following between-classscatter:
1
Mðc�1Þ
Xi,j
Xsa i
dsðyijÞ ¼1
Mðc�1Þ
Xi,j
Xsa i
ðyij� ~msÞ2
¼1
Mðc�1Þ
Xi,j
Xsa i
½ðyij� ~miÞþð ~mi� ~msÞ�2
¼1
Mðc�1Þ
Xi,j
Xsa i
ðyij� ~miÞ2þ
1
Mðc�1Þ
Xi,j
Xsa i
ð ~mi� ~msÞ2
þ2
Mðc�1Þ
Xi,j
Xsa i
ðyij� ~miÞð ~mi� ~msÞ
¼1
M
Xi,j
ðyij� ~miÞ2þ
1
Mðc�1Þ
Xi
Xs
Mið ~mi� ~msÞ2þ0
¼uT Swuþ1
Mðc�1Þ
Xi
Xs
Mið ~mi� ~m0þ ~m0� ~msÞ2
¼uT Swuþ1
Mðc�1ÞcX
i
Mið ~mi� ~m0Þ2þX
i
Mi
Xs
ð ~ms� ~m0Þ2þ0
" #
¼uT Swuþ1
Mðc�1ÞcX
i
Mið ~mi� ~m0Þ2þM
Xs
ð ~ms� ~m0Þ2
" #
¼uT Swuþ1
Mðc�1Þ
Xi
ðcMiþMÞðuT mi�uT m0Þ2
¼uT SwuþuT 1
Mðc�1Þ
Xi
ðcMiþMÞðmi�m0Þðmi�m0ÞT
" #u:
ð20Þ
When each class has the same number of training samples,i.e. Mi¼M/c (i¼1,y,c), the foregoing between-class scatterbecomes
1
Mðc�1Þ
Xi,j
Xsa i
dsðyijÞ ¼uT SwuþuT 2c�1
Xi
ðmi�m0Þðmi�m0ÞT
" #u
¼uT Swuþ 2c�1u
T Sbu: ð21Þ
inators: A nearest neighbor rule induced discriminant analysis,

J. Yang et al. / Pattern Recognition ] (]]]]) ]]]–]]] 7
In such a case, the criterion of the MD classification ruleinduced discriminant analysis is given by
JMðuÞ ¼uT Swuþð2=c�1ÞuT Sbu
uT Swuð22Þ
It is easy to show that the following equivalent relationshipshold:
JMðuÞ3ð2=c�1ÞuT Sbu
uT Swu3
uT SbuuT Swu
¼ JF ðuÞ: ð23Þ
This equivalence means that the MD classification ruleinduced discriminant analysis method has the same solution withFLDA when each class has the same number of training samples.Therefore, FLDA can be viewed as a MD classification rule induceddiscriminant analysis method. From this point of view, it can besaid that FLDA is the most suitable feature extractor for theminimum distance classifier.
4.3. Connecting LM-NNDA to FLDA
In this section, we will show that, when each class has thesame number of training samples, LM-NNDA is approaching toFLDA with the increase of the nearest neighbor parameter R.
Suppose that the training sample number of each class isMi¼M/c (i¼1,y,c). Let ms
ij be the local mean vector of xij in Class s.It is easy to know that ms
ij is approaching to the mean of Class s, ms,when R approaches to Mi, i.e.
msij-ms when R-Mi: ð24Þ
Therefore, LM-NNDA approaches to the minimum distanceclassification rule induced discriminant analysis methoddescribed in the foregoing section when R approaches to Mi. Sincethe minimum distance classification rule induced discriminantanalysis has been proven equivalent to FLDA, we can concludethat LM-NNDA approaches to FLDA when R approaches to theclass training sample number Mi. This is interestingly consistentwith the fact that the LM-NN classifier approaches to the MDclassifier when R approaches to the class training sample numberMi, noticing that FLDA is a MD classification rule induceddiscriminant analysis method.
4.4. Dependency of LM-NNDA and the LM-NN classifier
The design of the LM-NNDA method is intuitively based thedecision rule of the LM-NN classifier. That is, in order to make thesubsequent LM-NN classifier achieve a good performance, wemodel LM-NNDA by maximizing the average point-to-intra-classdistance and simultaneously minimizing the average point-to-inter-class distance. Thus, we conclude that LM-NNDA is the mostsuitable feature extraction method for the LM-NN classifier. Inthis section, we try to provide some theoretical analysis on thedependency of LM-NNDA and the LM-NN classifier. We willdiscuss in what cases, LM-NNDA is guaranteed to be the statis-tically optimal for the LM-NN classifier.
Let us first begin with the FLDA method, a special case of LM-NNDA. It is known that the transform matrix of FLDA is the Bayesoptimal when each class of samples shares a normal distributionwith an identical covariance matrix [34]. In this case, the within-class scatter matrix of FLDA, Sw ¼ Si
w, for i¼1,y,c, where Siw is the
covariance matrix of Class i. Then, in such a case, we can ensurethat the transformed samples of each class share a normaldistribution and the covariance matrix is an identity matrixbecause the FLDA algorithm can lead to
PTSwP¼ I where P¼ ðu1,u2,. . .,udÞ where I is an identity matrix:
ð25Þ
Please cite this article as: J. Yang, et al., From classifiers to discrimPattern Recognition (2011), doi:10.1016/j.patcog.2011.01.009
The mean minimum distance classifier is the Bayes optimalwhen each class of samples has a normal distribution with anidentity covariance matrix. From the above analysis, we can nowconclude that FLDA is the statistically optimal for the MDclassifier in the case that each class of samples shares a normaldistribution with a same covariance matrix.
The above conclusion on FLDA can be extended to LM-NNDAbecause LM-NNDA can be viewed as a ‘‘locally’’ FLDA method.Specifically let us look at class manifolds and focus on the set of R
samples within a local patch, which can be thought of as asubclass. It is easy to show that LM-NNDA is a subclass basedFLDA method, following the derivation process given in Section4.2. If the all subclasses share a normal distribution with anidentity covariance matrix, the subclass based FLDA method (i.e.LM-NNDA) is the statistically optimal for the subclass based MDclassifier. Notice that the subclass (formed by the R local samples)based MD classifier is the LM-NN classifier. Therefore, we canconclude that when the class manifolds have the same localdistribution, i.e. all set of R local samples (subclasses) share anormal distribution with an identical covariance matrix,LM-NNDA is the statistically optimal for the LM-NN classifier.
It should be noted that here we only elucidate the dependencyof LM-NNDA and the LM-NN classifier in a special case. For moregeneral cases, statistical analysis on the dependency of LM-NNDAand the LM-NN classifier is still an open problem.
4.5. Connecting LM-NNDA to LB-LDA
Hastie and Tibshirani presented a dimensionality reductionmethod using the local discriminant information [46]. Their methodseeks the subspace spanned by eigenvectors of the average localbetween sum-of-squares matrices based on the globally sphereddata. In other words, the method characterizes the between-classscatter information locally, whereas characterizes the within-classscatter information globally. Therefore, Hastie and Tibshirani’smethod is essentially a semi-local dimensionality reductionmethod, which is named local between-class linear discriminantanalysis (LB-LDA) in this paper. In contrast, LM-NNDA is a full-localdimensionality reduction method, which characterizes both thebetween-class scatter information and the within-class scatterinformation locally. Specifically LM-NNDA use the local within-class scatter matrix as shown in Eq. (11), while LB-LDA uses theglobal within-class scatter matrix as LDA as shown in Eq. (16).
Moreover, as far as local between-class scatter information isconcerned, LM-NNDA and LB-LDA have different characteriza-tions. Specifically, for each sample point xij, suppose ms
ij is thelocal mean vector of xij in Class s. LM-NNDA uses xij and itsbetween-class local means ms
ij (sa i) to describe scatters and toconstruct the local between-class scatter matrix as shown inEq. (12), while LB-LDA uses the within-class local mean of xij,mij ¼mi
ij, and the overall local mean mij ¼ ð1=cÞPc
s ¼ 1 msij to
describe scatters and to construct the local between-class scattermatrix as follows:
SLBb ¼
Xi,j
ðmij�mijÞðmij�mijÞT
ð26Þ
It is evident that the formulation in Eq. (26) is different fromthat in Eq. (12).
Finally it should be stressed that based on the characterizationof the local between-class scatter matrix SLB
b and the globalwithin-class scatter matrix Sw, LB-LDA does not show directconnections to classifiers. In contrast, the characterization of thelocal between-class scatter matrix SL
b and the local within-classscatter matrix SL
w in LM-NNDA guarantees the connectionsbetween LM-NNDA and local mean based nearest neighborclassifier.
inators: A nearest neighbor rule induced discriminant analysis,

FLDA
LM-NNDALB-LDA
Fig. 4. Illustration of the projection direction of LM-NNDA (red), LB-LDA (blue)
and FLDA (black) for two classes of samples (for interpretation of the references to
color in this figure legend, the reader is referred to the web version of this article).
J. Yang et al. / Pattern Recognition ] (]]]]) ]]]–]]]8
Fig. 4 shows an illustrative example where LM-NNDA yieldsdifferent projection direction as opposed to LB-LDA and FLDA. Inthis example, there are two classes of samples. The samples of oneclass follows a normal distribution, while the samples of the otherclass form two clusters, each following a normal distribution. Inthe figure, the red line represents the projection direction ofLM-NNDA, the blue line represents that of LB-LDA, and the blackline represents that of FLDA. It appears that LM-NNDA produces amore meaningful projection direction than LB-LDA and FLDA forseparating the two classes of samples. After being projected ontothe direction of LM-NNDA, samples can be well classified under alocal mean based nearest neighbor classifier. LB-LDA produces aprojection direction somewhat close to LM-NNDA, but still causessome overlapping of the two classes of samples after the projec-tion. Note that LB-LDA uses the global within-class scatter matrixto sphere data. In our opinion, it is the global within-class scattermatrix that misleads the projection direction of LB-LDA. Whenone class contains two clusters of samples as shown in Fig. 4, theglobal within-class scatter matrix fails to characterize the struc-ture of data well. In contrast, the local within-class scatter matrixcan provide a much better characterization. Therefore, LM-NNDAcan yield a desirable projection direction.
2 4 6 8 10 12 14 16 18 200.6
0.65
0.7
0.75
0.8
0.85
0.9
The value of K (R)
Rec
ogni
tion
rate
LM-NN ClassifierK-NN Classifier
Fig. 5. The recognition rates of the LM-NN classifier and the K-NN classifier over
the variation of parameters on the validation set of the CENPARMI database.
5. Experiments
In this section, the local mean based nearest neighbor dis-criminant analysis (LM-NNDA) method is evaluated using theCENPARMI handwritten numeral database, the NUST603 hand-written Chinese character database, the ETH80 object categorydatabase, and the FERET face image database and compared withthe PCA, FLDA, Locality Preserving Projection (LPP) [22], and thenonparametric margin maximum criterion (NMMC) method [27].
It is natural that the proposed LM-NNDA based featureextractor and the LM-NN classifier can be integrated into acomplete pattern recognition system. In this system, however,the neighbor parameter R can be chosen differently in the featureextractor and classifier. The value of R is determined by the localdimension of the pattern class manifold. Since the dimension ofthe original pattern space is larger than the transformed featurespace, the value of R in LM-NNDA (which is performed in the
Please cite this article as: J. Yang, et al., From classifiers to discrimPattern Recognition (2011), doi:10.1016/j.patcog.2011.01.009
original pattern space) is generally chosen larger than the value ofR in the LM-NN classifier. For distinction, we use R1 to denote theparameter in LM-NNDA and R2 in the LM-NN classifier in thefollowing experiments.
5.1. Experiment using the CENPARMI handwritten numeral database
The experiment was conducted on Concordia University CEN-PARMI handwritten numeral database. The database contains6000 samples of 10 numeral classes (each class has 600 samples).The original 121-dimensional Legendre moment features [28]were extracted for each sample and used here. In our experiment,the first 200 samples of each class are used to compose thetraining set, the second 200 samples of each class compose thevalidation set, and the remaining 200 samples form the test set.
In order to provide a baseline, we first apply the threeclassifiers, the local-mean based nearest neighbor (LM-NN) clas-sifier, the K nearest neighbor (K-NN) classifier and the minimum(class-mean) distance (MD) classifier, to the original 121-dimen-sional Legendre moment features. The classification results on thevalidation set are shown in Fig. 5. It appears that the LM-NNclassifier consistently outperforms the K-NN classifier. The per-formance of the K-NN classifier does not improve with theincrease of K for this database. In contrast, the LM-NN classifieris more robust with the variation of the parameter. From theseresults, we choose the optimal parameter K¼1 for the K-NNclassifier and K¼6 for the LM-NN classifier. Based on theseparameters, we obtain the recognition results of both classifierson the test set, as shown in Table 1. Table 1 shows us that theLM-NN classifier performs better than the K-NN and MD classifiers.
PCA, FLDA, LB-LDA [46], LPP, and the proposed LM-NNDA are,respectively, used for feature extraction based on the originalLegendre moment features. For each of the five methods, we usethe three classifiers mentioned above. Taking the combination ofLM-NNDA and the LM-NN classifier as an example, we show howto tune the parameters R1 in the feature extractor and R2 in theclassifier on the validation set. Let R1 vary from 5 to 40 with aninterval of 5, R2 varies from 2 to 20 with an interval of 2, and thedimension of the extracted features vary from 2 to 50 with aninterval of 2. The maximal classification rates over the variation ofdimensions corresponding to R1 and R2 are shown in Table 2.From Table 2, we can see that the performance of LM-NNDA isvery robust with the variation of the parameter; it remains above95.6% despite the variation of R1 and R2 within the given range.
inators: A nearest neighbor rule induced discriminant analysis,

Table 1The recognition rates (%) of the three different classifiers based on the original
121-dimensional Legendre moment features on the test set.
MD K-NN (K¼1) LM-NN (R¼6)
54.4 88.2 91.8
Table 2The maximal classification rates over the variation of dimensions corresponding to
R1 in LM-NNDA and R2 in the LM-NN classifier on the validation set.
R2
R1 2 4 6 8 10 12 14 16 18 20
5 0.960 0.969 0.965 0.965 0.963 0.959 0.958 0.958 0.957 0.958
10 0.959 0.966 0.969 0.970 0.963 0.961 0.961 0.957 0.958 0.956
15 0.961 0.966 0.971 0.969 0.965 0.961 0.960 0.960 0.958 0.958
20 0.958 0.966 0.973 0.968 0.967 0.963 0.960 0.959 0.959 0.958
25 0.959 0.967 0.973 0.969 0.968 0.962 0.961 0.960 0.959 0.958
30 0.959 0.968 0.972 0.969 0.968 0.962 0.962 0.960 0.960 0.958
35 0.957 0.968 0.971 0.971 0.969 0.963 0.962 0.961 0.960 0.959
40 0.956 0.969 0.971 0.972 0.969 0.965 0.963 0.962 0.962 0.960
5 10 15 20 25 30 35 40 45 500.4
0.5
0.6
0.7
0.8
0.9
1
Dimension
Rec
ogni
tion
rate
LM-NNDA,LM-NNLPP,LM-NNLB-LDA,LM-NNPCA,LM-NNFLDA,LM-NN
Rec
ogni
tion
rate
5 10 15 20 2
0.4
0.5
0.6
0.7
0.8
0.9
Dim
Fig. 6. Recognition rates of PCA, FLDA, LB-LDA, LPP and the proposed LM-NNDA vers
(a) with the LM-NN classifier, (b) with the NN classifier and (c) with the MD classifier
J. Yang et al. / Pattern Recognition ] (]]]]) ]]]–]]] 9
Please cite this article as: J. Yang, et al., From classifiers to discrimPattern Recognition (2011), doi:10.1016/j.patcog.2011.01.009
This provides us enough flexibility for parameter selection inLM-NNDA. Here the optimal parameter combination is chosen asR1¼20 and R2¼6, which correspond to an optimal dimensiond¼48. In a similar way, we can find optimal parameters R1 and R2
for different combinations of other feature extraction methodsand classifiers. Based on these parameters, the recognition rate ofeach method on the test set versus the variation of dimensions isshown in Fig. 6.
Fig. 6(a) and (b) shows that the LM-NNDA with the LM-NN andNN classifiers noticeably outperforms PCA, LB-LDA and LPP withthe same classifiers, irrespective of the variation in dimensions.FLDA can only extract c�1¼9 features in this experiment sincethere are totally 10 classes. Although the nine FLDA features areas effective as the first nine LM-NNDA features, this small numberof features is obviously not enough to represent numeral patternfor recognition purposes. Fig. 6(c), however, shows that FLDAconsistently outperforms the other four feature extractionmethod in terms of the MD classifier. The above results arecompletely consistent with our analysis in the foregoing sections,that is, LM-NNDA is the LM-NN classification rule induceddiscriminant analysis, while FLDA is the MD classification ruleinduced.
5 10 15 20 25 30 35 40 45 500.4
0.5
0.6
0.7
0.8
0.9
1
Dimension
Rec
ogni
tion
rate
LM-NNDA,NNLPP,NNLB-LDA,NNPCA,NNFLDA,NN
5 30 35 40 45 50
ension
LM-NNDA,MDLPP,MDLB-LDA,MDPCA,MDFLDA,MD
us dimensions on the test set of the CENPARMI handwritten numeral database:
.
inators: A nearest neighbor rule induced discriminant analysis,

J. Yang et al. / Pattern Recognition ] (]]]]) ]]]–]]]10
To verify our analysis in Section 4.3 that LM-NNDA isapproaching to FLDA with the increase of the nearest neighborparameter R1, we perform an extra test of LM-NNDA in which R1
is chosen as 199 (note that the number of class training samples is200). The recognition rates of LM-NNDA with three classifiers areshown in Fig. 7(a). Just as expected, LM-NNDA achieves almostthe same recognition results as FLDA when the dimension variesfrom 1 to 9, no matter what classifier is used. In this case, the firstnine LM-NNDA features seem enough for classification, and theremaining features have trivial effect on the recognition perfor-mance. To explain this phenomenon, let us provide the values ofthe criterion in Eq. (13) corresponding to the first 18 projectionaxes, i.e. the first 18 largest generalized eigenvalues ofSL
bX¼ lSLwX, in Fig. 7(b). It is evident that the eigenvalues except
the first nine are very small and invariant. This characteristic ofeigenvalues is quite similar to that of FLDA, in which theeigenvalues except the first nine are all zeros.
Now, for further evaluating the performance of the proposedmethod, we do experiments by 10-fold cross validation. 200samples are randomly chosen from each class for training,while the remaining 400 samples are used for testing. Werun the system 10 times and obtain 10 different training andtesting sample sets for performance evaluation. Based on theoptimal parameters we obtain on the validation set in the fore-going experiment, we perform PCA, FLDA, LB-LDA, LPP andLM-NNDA with the three classifiers. The average recognition rates
2 4 6 8 10 12 14 16 180.2
0.3
0.4
0.5
0.6
0.7
0.8
0.9
1
Dimension
Rec
ogni
tion
rate
LM-NNDA (K=199),LM-NNFLDA,LM-NNLM-NNDA (K=199),NNFLDA,NNLM-NNDA (K=199),MDFLDA,MD
Fig. 7. The performance of LM-NNDA approximates to that of FLDA when R1 approx
LM-NNDA when R1¼199 (the training sample number of each class is 200) and FLD
corresponding to LM-NNDA.
Table 3The average recognition rates (%) and the standard deviations (stds) of PCA, FLDA, LB-LD
on the CENPARMI handwritten numeral database and the corresponding dimensions.
Feature extractor FLDA PCA
Classifier LM-NN LM-NN
Recognition rate 89.970.45 91.770.55
Dimension 9 40
Feature extractor FLDA PCA
Classifier NN NN
Recognition rate 87.870.37 88.670.47
Dimension 9 44
Feature extractor FLDA PCA
Classifier MD MD
Recognition rate 87.870.36 54.171.65
Dimension 9 38
Please cite this article as: J. Yang, et al., From classifiers to discrimPattern Recognition (2011), doi:10.1016/j.patcog.2011.01.009
and the standard deviations (stds) across ten tests are shownin Table 3.
By comparing the recognition results in the columnsof Table 3, we find that for all of the five feature extractionmethods, the LM-NN classifier achieves the better results than theother two classifiers. If we compare the performance of the fivefeature extraction methods based on the LM-NN classifier,LM-NNDA achieves the best result. However, if we do the compar-ison based on the MD classifier, FLDA achieves the best recognitionrate. These results show that LM-NNDA is the most suitablediscriminant analysis method for the LM-NN classifier, while FLDAis the most suitable method for the MD classifier.
Here, it should be pointed out that FLDA is the most suitablediscriminant analysis method for the MD classifier in theory, but,it is not true vice versa. That is, we cannot say that the MDclassifier is most suitable classifier for FLDA. In this experiment, itcan be seen that FLDA with the LM-NN classifier achieves betterresults than with the MD classifier.
Finally let us evaluate the experimental results in Table 3 usinga paired t-test. If the resulting p-value is below the desiredsignificance level (e.g. 0.05), the performance difference betweentwo algorithms is considered to be statistically significant. By thistest, we find that under the same LM-NN classifier, the perfor-mance of the first-ranked LM-NNDA method is statisticallysignificantly better than that of the second-ranked LB-LDAmethod at a significance level p¼5.53�10�9.
2 4 6 8 10 12 14 16 180
2
4
6
8
10
12
No. of the generalized eigenvalue
Gen
eral
ized
eig
enva
lue
imates to the training sample number of each class: (a) The recognition rates of
A and (b) the generalized eigenvalues (i.e. the values of discriminant criterion)
A, LPP and LM-NNDA with each of the three different classifiers using 10-run test
LB-LDA LPP LM-NNDA
LM-NN LM-NN LM-NN
91.870.64 91.571.04 96.070.21
44 50 48
LB-LDA LPP LM-NNDA
NN NN NN
88.270.69 88.671.12 94.270.52
42 48 24
LB-LDA LPP LM-NNDA
MD MD MD
86.670.60 67.677.06 85.370.43
50 34 46
inators: A nearest neighbor rule induced discriminant analysis,
J. Yang et al. / Pattern Recognition ] (]]]]) ]]]–]]] 11
5.2. Experiment using the NUST603 handwritten Chinese character
database
The experiment is performed on the NUST603 handwrittenChinese character database which was built in Nanjing Universityof Science and Technology. The database contains 19 groups ofChinese characters that are collected from bank checks. There are400 samples for each character and thus 7200 in total. The original128-dimensional Peripheral feature vectors [29] were extractedfor each sample and used in our experiment. The first 100 samplesof each class are used for training, the second 100 samples of eachclass for validation, and the remaining 200 samples for test.
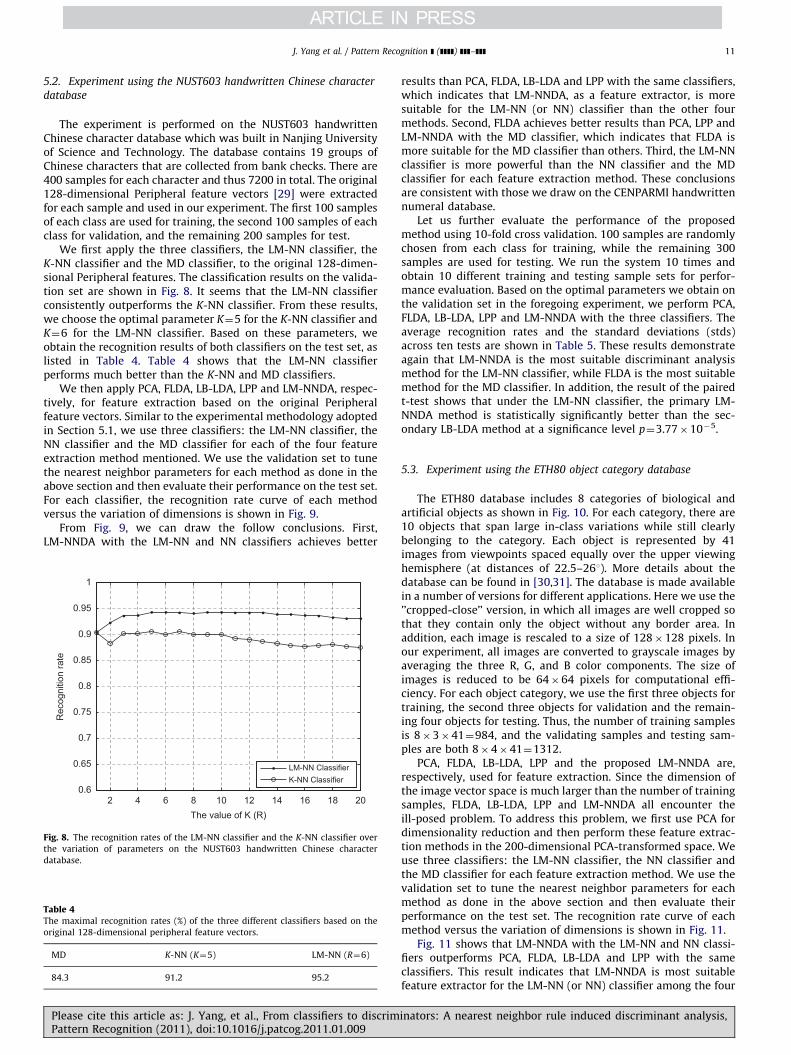
We first apply the three classifiers, the LM-NN classifier, theK-NN classifier and the MD classifier, to the original 128-dimen-sional Peripheral features. The classification results on the valida-tion set are shown in Fig. 8. It seems that the LM-NN classifierconsistently outperforms the K-NN classifier. From these results,we choose the optimal parameter K¼5 for the K-NN classifier andK¼6 for the LM-NN classifier. Based on these parameters, weobtain the recognition results of both classifiers on the test set, aslisted in Table 4. Table 4 shows that the LM-NN classifierperforms much better than the K-NN and MD classifiers.
We then apply PCA, FLDA, LB-LDA, LPP and LM-NNDA, respec-tively, for feature extraction based on the original Peripheralfeature vectors. Similar to the experimental methodology adoptedin Section 5.1, we use three classifiers: the LM-NN classifier, theNN classifier and the MD classifier for each of the four featureextraction method mentioned. We use the validation set to tunethe nearest neighbor parameters for each method as done in theabove section and then evaluate their performance on the test set.For each classifier, the recognition rate curve of each methodversus the variation of dimensions is shown in Fig. 9.
From Fig. 9, we can draw the follow conclusions. First,LM-NNDA with the LM-NN and NN classifiers achieves better
2 4 6 8 10 12 14 16 18 200.6
0.65
0.7
0.75
0.8
0.85
0.9
0.95
1
The value of K (R)
Rec
ogni
tion
rate
LM-NN ClassifierK-NN Classifier
Fig. 8. The recognition rates of the LM-NN classifier and the K-NN classifier over
the variation of parameters on the NUST603 handwritten Chinese character
database.
Table 4The maximal recognition rates (%) of the three different classifiers based on the
original 128-dimensional peripheral feature vectors.
MD K-NN (K¼5) LM-NN (R¼6)
84.3 91.2 95.2
Please cite this article as: J. Yang, et al., From classifiers to discrimPattern Recognition (2011), doi:10.1016/j.patcog.2011.01.009
results than PCA, FLDA, LB-LDA and LPP with the same classifiers,which indicates that LM-NNDA, as a feature extractor, is moresuitable for the LM-NN (or NN) classifier than the other fourmethods. Second, FLDA achieves better results than PCA, LPP andLM-NNDA with the MD classifier, which indicates that FLDA ismore suitable for the MD classifier than others. Third, the LM-NNclassifier is more powerful than the NN classifier and the MDclassifier for each feature extraction method. These conclusionsare consistent with those we draw on the CENPARMI handwrittennumeral database.
Let us further evaluate the performance of the proposedmethod using 10-fold cross validation. 100 samples are randomlychosen from each class for training, while the remaining 300samples are used for testing. We run the system 10 times andobtain 10 different training and testing sample sets for perfor-mance evaluation. Based on the optimal parameters we obtain onthe validation set in the foregoing experiment, we perform PCA,FLDA, LB-LDA, LPP and LM-NNDA with the three classifiers. Theaverage recognition rates and the standard deviations (stds)across ten tests are shown in Table 5. These results demonstrateagain that LM-NNDA is the most suitable discriminant analysismethod for the LM-NN classifier, while FLDA is the most suitablemethod for the MD classifier. In addition, the result of the pairedt-test shows that under the LM-NN classifier, the primary LM-NNDA method is statistically significantly better than the sec-ondary LB-LDA method at a significance level p¼3.77�10�5.
5.3. Experiment using the ETH80 object category database
The ETH80 database includes 8 categories of biological andartificial objects as shown in Fig. 10. For each category, there are10 objects that span large in-class variations while still clearlybelonging to the category. Each object is represented by 41images from viewpoints spaced equally over the upper viewinghemisphere (at distances of 22.5–261). More details about thedatabase can be found in [30,31]. The database is made availablein a number of versions for different applications. Here we use the’’cropped-close’’ version, in which all images are well cropped sothat they contain only the object without any border area. Inaddition, each image is rescaled to a size of 128�128 pixels. Inour experiment, all images are converted to grayscale images byaveraging the three R, G, and B color components. The size ofimages is reduced to be 64�64 pixels for computational effi-ciency. For each object category, we use the first three objects fortraining, the second three objects for validation and the remain-ing four objects for testing. Thus, the number of training samplesis 8�3�41¼984, and the validating samples and testing sam-ples are both 8�4�41¼1312.
PCA, FLDA, LB-LDA, LPP and the proposed LM-NNDA are,respectively, used for feature extraction. Since the dimension ofthe image vector space is much larger than the number of trainingsamples, FLDA, LB-LDA, LPP and LM-NNDA all encounter theill-posed problem. To address this problem, we first use PCA fordimensionality reduction and then perform these feature extrac-tion methods in the 200-dimensional PCA-transformed space. Weuse three classifiers: the LM-NN classifier, the NN classifier andthe MD classifier for each feature extraction method. We use thevalidation set to tune the nearest neighbor parameters for eachmethod as done in the above section and then evaluate theirperformance on the test set. The recognition rate curve of eachmethod versus the variation of dimensions is shown in Fig. 11.
Fig. 11 shows that LM-NNDA with the LM-NN and NN classi-fiers outperforms PCA, FLDA, LB-LDA and LPP with the sameclassifiers. This result indicates that LM-NNDA is most suitablefeature extractor for the LM-NN (or NN) classifier among the four
inators: A nearest neighbor rule induced discriminant analysis,

5 10 15 20 25 30 35 40 45 500.5
0.55
0.6
0.65
0.7
0.75
0.8
0.85
0.9
0.95
1
Dimension
Rec
ogni
tion
rate
LM-NNDA,LM-NNLPP,LM-NNLB-LDA,LM-NNPCA,LM-NNFLDA,LM-NN
5 10 15 20 25 30 35 40 45 500.5
0.55
0.6
0.65
0.7
0.75
0.8
0.85
0.9
0.95
1
Dimension
Rec
ogni
tion
rate
LM-NNDA,NNLPP,NNLB-LDA,NNPCA,NNFLDA,NN
5 10 15 20 25 30 35 40 45 50
0.4
0.5
0.6
0.7
0.8
0.9
Dimension
Rec
ogni
tion
rate
LM-NNDA,MDLPP,MDLB-LDA,MDPCA,MDFLDA,MD
Fig. 9. Recognition rates of PCA, FLDA, LB-LDA, LPP and the proposed LM-NNDA versus dimensions on the NUST603 handwritten Chinese character database: (a) with the
LM-NN classifier, (b) with the NN classifier and (c) with the MD classifier.
Table 5The maximal recognition rates (%) of PCA, FLDA, LB-LDA, LPP and the proposed LM-NNDA with each of the three different classifiers on the NUST603 handwritten Chinese
character database and the corresponding dimensions.
Feature extractor FLDA PCA LB-LDA LPP LM-NNDA
Classifier LM-NN LM-NN LM-NN LM-NN LM-NN
Recognition rate 95.0770.32 94.5770.30 95.5070.30 94.6370.36 96.3770.33
Dimension 18 46 46 50 48
Feature extractor FLDA PCA LB-LDA LPP LM-NNDA
Classifier NN NN NN NN NN
Recognition rate 93.7570.37 91.5570.39 93.0170.17 90.3770.71 94.8570.21
Dimension 18 48 48 30 28
Feature extractor FLDA PCA LB-LDA LPP LM-NNDA
Classifier MD MD MD MD MD
Recognition rate 92.4170.27 83.3670.55 92.2270.38 87.1070.67 92.4070.34
Dimension 18 46 38 36 32
J. Yang et al. / Pattern Recognition ] (]]]]) ]]]–]]]12
methods. In addition, FLDA achieves better results than PCA, LB-LDA, LPP and LM-NNDA with the MD classifier, which verifies thatFLDA is the most suitable feature extractor for the MD classifier.
Table 6 shows the average recognition rates and the standarddeviations (stds) across 10-fold tests. In each test, three objects arerandomly chosen for training, the remaining seven objects for testing.
Please cite this article as: J. Yang, et al., From classifiers to discrimPattern Recognition (2011), doi:10.1016/j.patcog.2011.01.009
These results demonstrate again that LM-NNDA is the best for theLM-NN classifier, while FLDA is the best for the MD classifier. Inaddition, the result of the paired t-test shows that under the LM-NNclassifier, the primary LM-NNDA method is statistically significantlybetter than the secondary LB-LDA method at a significance levelp¼3.16�10�4.
inators: A nearest neighbor rule induced discriminant analysis,

Fig. 10. The example figures of 8 categories of objects in the ETH80 database.
J. Yang et al. / Pattern Recognition ] (]]]]) ]]]–]]] 13
5.4. Experiment using the FERET database
The FERET face image database is a popular database for testingand evaluating state-of-the-art face recognition algorithms [32,33].Our experiment uses a subset of the database, which includes 1000images of 200 individuals (each one has 5 images). It is composed ofthe images whose names are marked with two-character strings:‘‘ba’’, ‘‘bj’’, ‘‘bk’’, ‘‘be’’ and ‘‘bf’’. This subset involves variations in facialexpression, illumination, and pose. In our experiment, the facialportion of each original image was automatically cropped based onthe location of eyes and mouth, and the cropped image was resizedto 80�80 pixels and further pre-processed by histogram equaliza-tion. Some sample images of one person are shown in Fig. 12.
In the first experiment, we use the first two images (i.e. ‘‘ba’’and ‘‘bj’’) of each class to form the training set, and the remainingthree images (i.e. ‘‘bk’’, ‘‘be’’ and ‘‘bf’’) of each class to form thevalidation set. PCA, FLDA, LB-LDA, LPP and the proposed LM-NNDA are used for feature extraction. Since the dimension of theimage vector space is much larger than the number of trainingsamples, FLDA, LB-LDA, LPP and LM-NNDA all encounter the ill-posed problem. To address this problem, we first use PCA fordimensionality reduction and then perform FLDA, LB-LDA, LPPand LM-NNDA in the 120-dimensional PCA-transformed space.Since there are only two training samples per class, the nearestneighbor parameter R1 is chosen as 1. Thus LM-NNDA is actuallyNNDA in this case. We use the NN classifier for each featureextraction method. The recognition rate curve of each methodversus the variation of dimensions is shown in Fig. 13. Themaximal recognition rate of each method and the correspondingdimension are shown in Table 7. From Fig. 13, we can see thatNNDA consistently outperforms the other four methods on thevalidation set, irrespective of the variation in the dimensions.
We further perform experiments by 10-run tests. In each run,we randomly choose two images from each class for training, andthe remaining images for test. Based on the optimal dimensionswe obtain on the validation set in Table 7, for each method, weperform PCA, FLDA, LB-LDA, LPP and LM-NNDA with the threeclassifiers. The average recognition rates and the standard
Please cite this article as: J. Yang, et al., From classifiers to discrimPattern Recognition (2011), doi:10.1016/j.patcog.2011.01.009
deviations (stds) across ten tests are shown in Table 8. Theseresults indicate that NNDA, a nearest neighbor rule induceddiscriminant analysis, is the most suitable method for the NNclassifier. In addition, from the paired t-test, we know that NNDAsignificantly outperforms the secondary FLDA method at asignificance level p¼1.61�10�5.
6. Conclusion, discussion and future work
This paper introduces a new concept of designing a discrimi-nant analysis method, which starts from a local mean basednearest neighbor (LM-NN) classifier and uses its decision rule todirect the design of a discriminant analysis method. The deriveddiscriminant analysis method, LM-NNDA, is the most suitablefeature extractor for the LM-NN classifier in theory. This has beendemonstrated by our experimental results on four databases: theCENPARMI handwritten numeral database, the NUST603 hand-written Chinese character database, the ETH80 object categorydatabase and the FERET face image database. In addition, weshow that the classical Fisher linear discriminant analysis (FLDA)is a minimum distance classifier (or called Nearest Class-meanclassifier) induced discriminant analysis method. This judgmentwas also verified by our experimental results.
The LM-NNDA based feature extractor closely connects to theNN classifier. The NN classifier has an asymptotical average errorrate connected to Bayes error via lower and upper bounds asshown in Eq. (2). It can be expected that the projection matrix ofLM-NNDA is Bayes suboptimal, that is, the asymptotical averageerror rate based on the LM-NNDA generated features has a lowerand upper bound of the Bayes error. Recently Petridis andPerantonis gave the concept of the Bayes optimal projectionmatrix and provided a theoretical framework to analyze theBayes optimality of linear discriminant analysis methods [34].Hamsici and Martinez present an algorithm that can provide theone-dimensional subspace where the Bayes error is minimized forthe C class problem with homoscedastic Gaussian distributionsand further extend the algorithm to suit for more general case
inators: A nearest neighbor rule induced discriminant analysis,

0 20 40 60 80 100 120 140 160 180 2000.35
0.4
0.45
0.5
0.55
0.6
0.65
0.7
0.75
Dimension
Rec
ogni
tion
rate
LM-NNDA,LM-NNLPP,LM-NNLB-LDA,LM-NNPCA,LM-NNFLDA,LM-NN
0 20 40 60 80 100 120 140 160 180 2000.35
0.4
0.45
0.5
0.55
0.6
0.65
0.7
0.75
Dimension
Rec
ogni
tion
rate
LM-NNDA,NNLPP,NNLB-LDA,NNPCA,NNFLDA,NN
0 20 40 60 80 100 120 140 160 180 2000.35
0.4
0.45
0.5
0.55
0.6
0.65
0.7
0.75
Dimension
Rec
ogni
tion
rate
LM-NNDA,MDLPP,MDLB-LDA,MDPCA,MDFLDA,MD
Fig. 11. Recognition rates of PCA, FLDA, LB-LDA, LPP and the proposed LM-NNDA versus dimensions on the ETH80 object category database: (a) with the LM-NN classifier,
(b) with the NN classifier and (c) with the MD classifier.
Table 6The maximal recognition rates (%) of PCA, FLDA, LB-LDA, LPP and the proposed LM-NNDA with each of the three different classifiers on the ETH80 object category database
and the corresponding dimensions.
Feature extractor FLDA PCA LB-LDA LPP LM-NNDA
Classifier LM-NN LM-NN LM-NN LM-NN LM-NN
Recognition rate 62.4972.95 68.8573.45 71.8673.87 66.9772.61 75.1972.79
Dimension 7 150 190 40 130
Feature extractor FLDA PCA LB-LDA LPP LM-NNDA
Classifier NN NN NN NN NN
Recognition rate 60.7973.32 66.1073.21 69.6572.79 61.8973.66 74.0273.21
Dimension 7 40 190 40 90
Feature extractor FLDA PCA LB-LDA LPP LM-NNDA
Classifier MD MD MD MD MD
Recognition rate 62.2072.48 50.0773.96 61.9772.68 56.6872.73 59.6372.97
Dimension 7 40 140 190 40
Fig. 12. Samples of the cropped images in the FERET database.
J. Yang et al. / Pattern Recognition ] (]]]]) ]]]–]]]14
Please cite this article as: J. Yang, et al., From classifiers to discriminators: A nearest neighbor rule induced discriminant analysis,Pattern Recognition (2011), doi:10.1016/j.patcog.2011.01.009

10 20 30 40 50 60 70 80 90 100 110 1200.4
0.45
0.5
0.55
0.6
0.65
0.7
0.75
0.8
Dimension
Rec
ogni
tion
rate
NNDALPPPCAFLDALB-LDA
Fig. 13. Recognition rates of PCA, FLDA, LB-LDA, LLP and the proposed NNDA
method with the NN classifier versus dimensions on the validation set of the
FERET database.
Table 7The maximal recognition rates (%) of PCA, FLDA, LB-LDA, LLP and the proposed
NNDA method with the NN classifier on the validation set of the FERET database
and the corresponding dimensions.
Feature extractor FLDA PCA LB-LDA LPP NNDA
Recognition rate 75.0 73.3 75.2 78.5 81.7
Dimension 100 85 90 90 100
Table 8The average recognition rates (%) and the standard deviations (stds) of PCA, FLDA,
LB-LDA, LLP and the proposed NNDA method with the NN classifier using 10-run
tests on the FERET database.
FLDA PCA LB-LDA LPP NNDA
76.0671.88 72.4072.38 76.0271.79 72.4875.13 82.8671.27
J. Yang et al. / Pattern Recognition ] (]]]]) ]]]–]]] 15
with heteroscedastic distributions and to obtain the d-dimen-sional solutions [35]. Generally, discussing the Bayes optimality ofa linear feature extraction method needs some assumptions onthe probability distribution of data. For example, we have shownthat LM-NNDA is Bayes optimal under the assumption that all setof R local samples share a normal distribution with an identicalcovariance matrix. However, how to analyze the Bayes optimalityof the proposed method without any assumption is still open;some new ideas and theoretical tools are required and we expectthem to be developed in the future.
Acknowledgments
The authors would like to thank the anonymous reviewers fortheir critical and constructive comments and suggestions. Thiswork was partially supported by the Program for New CenturyExcellent Talents in University of China, the NUST OutstandingScholar Supporting Program, the National Science Foundation ofChina under Grant nos. 60973098 and 60632050, and the HongKong RGC General Research Fund (PolyU 5351/08E).
References
[1] T.M. Cover, P.E. Hart, Nearest neighbor pattern classification, IEEE Transac-tions on Information Theory 13 (1) (1967) 21–27.
Please cite this article as: J. Yang, et al., From classifiers to discrimPattern Recognition (2011), doi:10.1016/j.patcog.2011.01.009
[2] K. Fukunaga, Introduction to Statistical Pattern Recognition, second edition,Academic Press, 1990.
[3] S.Z. Li, Juwei Lu, Face recognition using the nearest feature line method, IEEETransactions on Neural Networks 10 (2) (1999) 439–443.
[4] J.-T. Chien, C.-C. Wu, Discriminant waveletfaces and nearest feature classi-fiers for face recognition, IEEE Transactions on Pattern Analysis and MachineIntelligence 24 (12) (2002) 1644–1649.
[5] W. Zheng, L. Zhao, C. Zou, Locally nearest neighbour classifiers for patternclassification, Pattern Recognition 37 (6) (2004) 1307–1309.
[6] Z. Lou, Z. Jin, Novel adaptive nearest neighbor classifiers based on hit-distance, in: Proceedings of the 18th International Conference on PatternRecognition (ICPR 2006), vol. 3, August 20–24, 2006, pp. 87–90.
[7] H. Du, Y.Q. Chen, Rectified nearest feature line segment for pattern classifica-tion, Pattern Recognition 40 (2007) 1486–1497.
[8] Y. Mitani, Y. Hamamoto, A local mean-based nonparametric classifier, PatternRecognition Letters 27 (10) (2006) 1151–1159.
[9] Daniel L. Swets, John Weng, Using discriminant eigenfeatures for imageretrieval, IEEE Transactions on Pattern Analysis and Machine Intelligence18 (8) (1996) 831–836.
[10] P.N. Belhumeur, J.P. Hespanha, D.J. Kriengman, Eigenfaces vs. Fisherfaces:recognition using class specific linear projection, IEEE Transactions onPattern Analysis and Machine Intelligence 19 (7) (1997) 711–720.
[11] C.J. Liu, H. Wechsler, Robust coding schemes for indexing and retrieval from largeface databases, IEEE Transactions on Image Processing 9 (1) (2000) 132–137.
[12] H. Yu, J. Yang, A direct LDA algorithm for high-dimensional data—withapplication to face recognition, Pattern Recognition 34 (10) (2001)2067–2070.
[13] J. Yang, J.Y. Yang, Why can LDA be performed in PCA transformed space?,Pattern Recognition 36 (2) (2003) 563–566.
[14] W. Zhao, R. Chellappa, J. Phillips, Subspace linear discriminant analysis forface recognition, Technical Report, CS-TR4009, University of Maryland, 1999.
[15] J. Ye, R. Janardan, C. Park, H. Park, An optimization criterion for generalizeddiscriminant analysis on undersampled problems, IEEE Transactions onPattern Analysis and Machine Intelligence 26 (8) (2004) 982–994.
[16] H. Cevikalp, M. Neamtu, M. Wilkes, A. Barkana, Discriminative commonvectors for face recognition, IEEE Transactions on Pattern Analysis andMachine Intelligence 27 (1) (2005) 4–13.
[17] S. Mika, G. Ratsch, J. Weston, B. Scholkopf, K.-R. Muller Fisher discriminantanalysis with kernels, in: IEEE International Workshop on Neural Networksfor Signal Processing, vol. IX, Madison, USA, August 1999, pp. 41–48.
[18] G. Baudat, F. Anouar, Generalized discriminant analysis using a kernelapproach, Neural Computation 12 (10) (2000) 2385–2404.
[19] J. Lu, K.N. Plataniotis, A.N. Venetsanopoulos, Face recognition using kerneldirect discriminant analysis algorithms, IEEE Transactions on Neural Net-works 14 (1) (2003) 117–126.
[20] J. Yang, A.F. Frangi, J.-Y. Yang, D. Zhang, Z. Jin, KPCA plus LDA: a completekernel Fisher discriminant framework for feature extraction and recognition,IEEE Transactions on Pattern Analysis Machine Intelligence 27 (2) (2005)230–244.
[21] T.-K. Kim, J. Kittler, Locally linear discriminant analysis for multimodallydistributed classes for face recognition with a single model image, IEEETransactions on Pattern Analysis and Machine Intelligence 27 (3) (2005)318–327.
[22] X. He, S. Yan, Y. Hu, P. Niyogi, H.-J. Zhang, Face recognition using Laplacianfaces, IEEE Transactions on Pattern Analysis and Machine Intelligence 27 (3)(2005) 328–340.
[23] H.-T. Chen, H.-W. Chang, T.-L. Liu, Local discriminant embedding and itsvariants, in: IEEE Conference on Computer Vision and Pattern Recognition2005 (CVPR 2005), pp. 846–853.
[24] S. Yan, D. Xu, B. Zhang, H. Zhang, Q. Yang, S. Lin, Graph embedding andextension: a general framework for dimensionality reduction, IEEE Transac-tions on Pattern Analysis and Machine Intelligence 29 (1) (2007) 40–51.
[25] P. Vincent, Y. Bengio, K-local hyperplane and convex distance nearestneighbor algorithms, in: Advances in Neural Information Processing Systems(NIPS2002), 2002.
[26] G.H. Golub, C.F. Van Loan, Matrix Computations, Third edition, The JohnsHopkins University Press, Baltimore, London, 1996.
[27] X.P. Qiu, L.D. Wu, Face recognition by stepwise nonparametric marginmaximum criterion, in: Proceedings of the IEEE Conference on ComputerVision, Beijing, China, October 2005.
[28] S.X. Liao, M. Pawlak, On image analysis by moments, IEEE Transactions onPattern Analysis and Machine Intelligence 18 (3) (1996) 254–266.
[29] Y.H. Tseng, C.C. Kuo, H.J. Lee, Speeding up Chinese character recognition in anautomatic document reading system, Pattern Recognition 31 (11) (1998)1601–1612.
[30] B. Leibe, B. Schiele, Analyzing appearance and contour based methods forobject categorization, in: International Conference on Computer Vision andPattern Recognition (CVPR’03), Madison, Wisconsin, June 2003.
[31] B. Leibe, The ETH-80 Image Set. Available from: /http://www.mis.informatik.tu-darmstadt.de/Research/Projects/categorization/eth80-db.htmlS.
[32] P.J. Phillips, H. Moon, S.A. Rizvi, P.J. Rauss, The FERET evaluation methodologyfor face-recognition algorithms, IEEE Transactions on Pattern Analysis andMachine Intelligence 22 (10) (2000) 1090–1104.
[33] P.J. Phillips, H. Wechsler, J. Huang, P. Rauss, The FERET database andevaluation procedure for face recognition algorithms, Image and VisionComputing 16 (5) (1998) 295–306.
inators: A nearest neighbor rule induced discriminant analysis,

J. Yang et al. / Pattern Recognition ] (]]]]) ]]]–]]]16
[34] S. Petridis, S.T. Perantonis, On the relation between discriminant analysis andmutual information for supervised linear feature extraction, Pattern Recogni-tion 37 (5) (2004) 857–874.
[35] Onur C. Hamsici, Aleix M. Martinez, Bayes optimality in linear discriminantanalysis, IEEE Transactions on Pattern Analysis and Machine Intelligence 30(4) (2008) 647–657.
[36] R.O. Duda, P.E. Hart, D.G. Stork, Pattern Classification, 2nd Edition, JohnWiley & Sons, Inc., 2000.
[37] S.T. Roweis, L.K. Saul, Nonlinear dimensionality reduction by locally linearembedding, Science 290 (2000) 2323–2326.
[38] M. Belkin, P. Niyogi, Laplacian eigenmaps for dimensionality reduction anddata representation, Neural Computation 15 (6) (2003) 1373–1396.
[41] H.S. Seung, D.D. Lee, The manifold ways of perception, Science 290 (2000)2268–2269.
Please cite this article as: J. Yang, et al., From classifiers to discrimPattern Recognition (2011), doi:10.1016/j.patcog.2011.01.009
[42] J.B. Tenenbaum, V. de Silva, J.C. Langford, A global geometric framework fornonlinear dimensionality reduction, Science 290 (2000) 2319–2323.
[43] Nearest neighbor search. Available from: /http://en.wikipedia.org/wiki/Nearest_neighbor_searchS.
[46] T. Hastie, R. Tibshirani, Discriminant Adaptive Nearest Neighbor Classifica-tion, IEEE Transactions on Pattern Analysis on Machine Intelligence 18 (6)(1996) 607–615.
[47] C. Domeniconi, J. Peng, D. Gunopulos, Locally adaptive metric nearest-neighbor classification, IEEE Transactions on Pattern Analysis and MachineIntelligence 24 (9) (2002) 1281–1285.
[48] M. Bressan, J. Vitria, Nonparametric discriminant analysis and nearestneighbor classification, Pattern Recognition Letters 24 (2003) 2743–2749.
[49] H. Zhang, A.C. Berg, M. Maire, J. Malik, SVM-KNN: Discriminative NearestNeighbor Classification for Visual Category Recognition, CVPR, 2006.
Jian Yang received the B.S. degree in mathematics from the Xuzhou Normal University in 1995. He received the MS degree in applied mathematics from the ChangshaRailway University in 1998 and the Ph.D. degree from the Nanjing University of Science and Technology (NUST), on the subject of pattern recognition and intelligencesystems in 2002. In 2003, he was a postdoctoral researcher at the University of Zaragoza, and in the same year, he was awarded the RyC program Research Fellowshipsponsored by the Spanish Ministry of Science and Technology. From 2004 to 2006, he was a Postdoctoral Fellow at Biometrics Centre of Hong Kong Polytechnic University.From 2006 to 2007, he was a Postdoctoral Fellow at Department of Computer Science of New Jersey Institute of Technology. Now, he is a professor in the School ofComputer Science and Technology of NUST. He is the author of more than 50 scientific papers in pattern recognition and computer vision. His research interests includepattern recognition, computer vision and machine learning. Currently he is an associate editor of Pattern Recognition Letters and Neurocomputing, respectively.
Lei Zhang received the B.S. degree in 1995 from Shenyang Institute of Aeronautical Engineering, Shenyang, P.R. China, the M.S. and Ph.D degrees in Automatic ControlTheory and Engineering from Northwestern Polytechnical University, Xi’an, P.R. China, respectively, in 1998 and 2001. From 2001 to 2002, he was a research associate inthe Dept. of Computing, The Hong Kong Polytechnic University. From January 2003 to January 2006 he worked as a Postdoctoral Fellow in the Department of Electrical andComputer Engineering, McMaster University, Canada. Since Jan. 2006, he has been an Assistant Professor in the Dept. of Computing, The Hong Kong Polytechnic University.His research interests include Image and Video Processing, Biometrics, Pattern Recognition, Multisensor Data Fusion and Optimal Estimation Theory, etc.
Jing-yu Yang received the B.S. Degree in Computer Science from Nanjing University of Science and Technology (NUST), Nanjing, China. From 1982 to 1984 he was a visitingscientist at the Coordinated Science Laboratory, University of Illinois at Urbana-Champaign. From 1993 to 1994 he was a visiting professor at the Department of ComputerScience, Missuria University. And in 1998, he acted as a visiting professor at Concordia University in Canada. He is currently a professor and Chairman in the department ofComputer Science at NUST. He is the author of over 300 scientific papers in computer vision, pattern recognition, and artificial intelligence. He has won more than 20provincial awards and national awards. His current research interests are in the areas of pattern recognition, robot vision, image processing, data fusion, and artificialintelligence.
David Zhang graduated in Computer Science from Peking University. He received his MSc in Computer Science in 1982 and his Ph.D. in 1985 from the Harbin Institute ofTechnology (HIT). From 1986 to 1988 he was a Postdoctoral Fellow at Tsinghua University and then an Associate Professor at the Academia Sinica, Beijing. In 1994 hereceived his second PhD in Electrical and Computer Engineering from the University of Waterloo, Ontario, Canada. Currently he is a Chair Professor at the Hong KongPolytechnic University where he is the Founding Director of the Biometrics Technology Centre (UGC/CRC) supported by the Hong Kong SAR Government. He also serves asAdjunct Professor in Tsinghua University, Shanghai Jiao Tong University, Beihang University, Harbin Institute of Technology, and the University of Waterloo. He is theFounder and Editor-in-Chief, International Journal of Image and Graphics (IJIG); Book Editor, Springer International Series on Biometrics (KISB); Organizer, theInternational Conference on Biometrics Authentication (ICBA); Associate Editor of several international journals including IEEE Trans on SMC-A/SMC-C; TechnicalCommittee Chair of IEEE CIS and the author of more than 10 books and 160 journal papers. Professor Zhang is a Croucher Senior Research Fellow, Distinguished Speaker ofthe IEEE Computer Society, and a Fellow of the International Association of Pattern Recognition (IAPR), and IEEE Fellow.
inators: A nearest neighbor rule induced discriminant analysis,