from quantity to quality: delivering a home-based ... · orazio attanasio, alexis medina, and scott...
TRANSCRIPT

From Quantity to Quality: Delivering aHome-based Parenting Intervention through
China’s Family Planning Cadres
Sean Sylvia, Nele Warrinnier, Renfu Luo, Ai Yue,
Orazio Attanasio, Alexis Medina, and Scott Rozelle*
June 22, 2018
Abstract
We present the results of a randomised experiment evaluating the effects of ahome-based parenting program delivered by cadres in China’s Family Planning Com-mission (FPC) – the former enforcers of the one-child policy. We find that the programsignificantly increased infant cognitive skills after six months. Effects on infant skilldevelopment were accompanied by increases in both parental investment and parent-ing skills. Household participation in the program was associated with the degree towhich participants had a favorable view of the FPC, which also increased due to theprogram.
JEL Classification: J13, I21, I28, H11
Keywords: Early Childhood Development, Parenting, China, Poverty, Family Planning
*Sylvia: Department of Health Policy and Management, University of North Carolina at ChapelHill (email: sean [email protected]); Warrinnier: LICOS Centre for Institutions and Economic Perfor-mance, KULeuven and the Centre for Economic Performance, London School of Economics (email:[email protected]); Luo: China Center for Agricultural Policy, Peking University (email: [email protected]); Yue (Corresponding Author): Center for Experimental Economics in Education,Shaanxi Normal Univeristy (email: [email protected]); Attanasio: Department of Economics, UniversityCollege London and the Institute for Fiscal Studies (email: [email protected]); Medina: Freeman SpogliInstitute for International Studies, Stanford University (email: [email protected]); Rozelle: FreemanSpogli Institute for International Studies, Stanford University (email: [email protected]). The authors aresupported by the 111 Project, grant number B16031. We thank Cai Jianhua and the China National Healthand Family Planning Commission for their support on this project. We are grateful to the InternationalInitiative for Impact Evaluation (3ie), the UBS Optimus Foundation, the China Medical Board, the Bankof East Asia, the Huaqiao Foundation, and Noblesse for project funding and to Jo Swinnen and LICOS forsupporting Nele Warrinnier. We would also like to thank Jim Heckman for his support and conversationsand acknowledge the support of Shasha Jumbe and the Gates Foundation’s Healthy Birth, Growth andDevelopment Knowledge Integration (HBGDki), China Program. This trial is registered with the AEA RCTRegistry (number AEARCTR-0003052).
1

1 Introduction
A growing body of cross-disciplinary research highlights the importance of a child’s
environment in the first years of life for skill development and outcomes over the life
course (Knudsen et al., 2006). This period is thought to be important for human capital
accumulation both because very young children are sensitive to their environment and
because deprivation during this period can have long-term consequences. Research in
cognitive science suggests that malleability of cognitive ability is highest in infancy and
decreases over time (Nelson and Sheridan, 2011). Due to the hierarchical nature of brain
development – whereby higher level functions depend and build on lower level ones –
cognitive deficiencies in early life can permanently hinder skill development. The nature
of cognitive development may further lead to important dynamic complementarities in
the production of human capital where early skills increase the productivity of later
human capital investments and encourage more investment as a result (Cunha et al., 2010;
Attanasio et al., 2015).
These mechanisms may explain findings of large long-run effects of early childhood
interventions (Cunha and Heckman, 2007). Long-term follow-up studies of early child-
hood interventions to improve nutrition and create stimulating environments have found
large and wide-ranging effects into adulthood. These studies found programs to have
increased college attendance, employment, and earnings as well as cause reductions in
teen pregnancy and criminal activity (Heckman et al., 2010; Walker et al., 2011; Gertler
et al., 2014).
Findings from this body of research provide strong support for investments in early
childhood programs (Carneiro and Heckman, 2003). Particularly in low and middle-
income countries, the social returns to early intervention could be substantial due to the
large number of children that are at risk of becoming developmentally delayed. Estimates
indicate that 250 million children (43%) younger than 5 years old living in low-income
and middle-income countries are at risk of not reaching their full development potential
2

(Lu et al., 2016). While there are several reasons that so many children are at risk in
developing countries, a significant factor is that children often lack a sufficiently stimulat-
ing environment (Black et al., 2017). Partly as a result of this evidence, Early Childhood
Development (ECD) has been the subject of substantial policy advocacy, as evidenced by
its inclusion in the United Nation’s Sustainable Development Goals (Nations, 2015).
A key practical challenge facing policy makers, however, is how to deliver ECD pro-
grams cost effectively at scale (Berlinski et al., 2016; Richter et al., 2017). Providing ECD
interventions at scale is challenging largely due to the infrastructure required to deliver
services effectively to families in need, many of whom live in hard-to-reach communities
such as urban slums and sparsely populated rural areas. Because building a new infrastruc-
ture to support ECD services alone would be costly, some have suggested integrating ECD
programs into existing public service infrastructures (Richter et al., 2017). For example,
international agencies including the World Bank, the Inter-American Development Bank,
the United Nations and the World Health Organization have called for ECD to be inte-
grated into health and nutrition programs (Chan, 2013; Black and Dewey, 2014). Whether
such a strategy can be successful is an open question. It is unclear, for example, if existing
personnel who have been working in other areas and have little or no background in early
childhood education can be trained to effectively deliver an ECD program. Moreover, it is
often the case that public sector agencies resist new tasks, particularly if they are perceived
as misaligned with the organisation’s existing mission (Wilson, 1989; Dixit, 2002).
We study the promotion of ECD in rural China through a home-based parent training
intervention implemented by one of the world’s largest bureaucracies, the China Family
Planning Commission (FPC). In recent years, the Chinese government has relaxed its
family planning laws and, since January 2016, has allowed all parents to conceive two
children without penalty. Relaxation of the One Child Policy (OCP) and changing fertility
preferences have greatly diminished the need for enforcement, and the FPC has begun to
shift focus to other areas including ECD (Wu et al., 2012). Delivering ECD policies through
3

the infrastructure of the FPC has promise but also potentially significant challenges. It is
therefore unclear – even if an intervention itself is efficacious – whether it can be effectively
delivered through the apparatus of the FPC.1 This study investigates whether it is possible
to re-train cadres formerly responsible for enforcing the OCP into effective parenting
teachers. In other words, can the local knowledge and infrastructure of the FPC – which
has been responsible for managing the quantity of human capital – be used to effectively
raise the quality of human capital in China?
To study the effects of an FPC-delivered home-based parenting intervention, we con-
ducted a cluster-randomised controlled trial across 131 villages in Shaanxi Province,
located in northwestern China. We worked with the FPC to re-train 70 cadres (local
officials) to deliver a structured curriculum aimed at improving parenting practices in
early childhood through weekly home visits. Loosely modeled on the Jamaican Early
Childhood Development Intervention (Grantham-McGregor et al., 1991), the curriculum
was designed with ECD experts in China and aimed to train and encourage caregivers to
engage in stimulating activities with their children.
We find that the intervention substantially increased the development of cognitive skills
in children assigned to receive weekly home visits. Effects on infant skill development
were accompanied by increases in both parental investment and parenting skills. Children
who lagged behind in their cognitive development and received little parental investment
at the onset of the intervention benefited most from the program. Although the average
effect of the program was diminished by imperfect compliance, we find evidence that one
of the primary factors hindering compliance – unfavorable public perception of the FPC –
was also significantly reduced as a result of the program. This suggests that compliance
may improve overtime if implemented by the FPC.
Our findings add to an emerging literature studying how ECD can be integrated into
existing infrastructure in developing countries to facilitate delivery at scale. Attanasio et al.
1See China Central Television (CCTV) News report: How will a Million Family Planning WorkersTransition? https://youtu.be/84WIe1C3XTM
4

(2014) found that a parenting intervention integrated into an existing conditional cash
transfer program in Colombia and delivered by local volunteers successfully improved
cognitive development outcomes, and, like the program we study in China, did so primarily
through increased parental investments (Attanasio et al., 2015). Again in Colombia,
Attanasio et al. (2018) analyse the impact of a stimulation intervention implemented
within an existing programme promoted by the Colombian government and show that
it has a sizable impact on children developmental outcomes. In Pakistan, Yousafzai et al.
(2014) find significant improvements in early childhood outcomes of children enrolled
in a parenting intervention integrated in a community-based health service and find that
effects persist 2 years after termination of the parenting intervention (Yousafzai et al.,
2016). Our study adds to the literature by providing evidence on the effectiveness of an
ECD intervention integrated into local government services in China: specifically whether
the infrastructure and personnel of the FPC can effectively implement a home-based
parenting program and reduce the high prevalence of cognitive delay among infants and
toddlers in rural China.
The remainder of the paper is structured as follows. In the next section we discuss
the FPC and how their role is changing with the abolishment of the One Child Policy. In
section 3 we describe the experimental design and data collection. In section 4 we report
findings of the impact evaluation of the parenting intervention. Section 5 concludes.
2 Background: The Changing Role of the FPC
The Family Planning Commission (FPC)2 is the entity responsible for the implementation
of population and family planning policies in China. From 1980, a large part of the agency’s
mandate included enforcement of the One Child Policy – a policy comprised of a set of
2In March 2013, the National Population and Family Planning Commission was merged with the Ministryof Health to form the current National Health and Family Planning Commission. Since March 2018, theministry is called the National Health Commission.
5

regulations governing family size.3 Although there were several, now well-documented,
unintended consequences of the policy, the government at the time considered population
containment necessary to improve living standards as the country faced an impending
baby boom (Hesketh et al., 2005).
The implementation of China’s One China Policy required close interaction between
families and local FPC cadres to ensure universal access to contraceptive methods, to
monitor for violations, and to enforce penalties. Although details of how the policy was
implemented varied across regions and time, at its most intense phase of implementation
families were required to obtain birth permits before pregnancy and births were to be
registered with the local FPC cadre. Once families met their number of allowed children,
FPC officers often encouraged or forced sterilisation (Greenhalgh, 1986). If women became
pregnant without a birth permit, FPC facilities were used for abortions (both voluntary and
not). The FPC also enforced penalties for out-of-plan births which included substantial
fines and loss of employment.
Given the numerous and complicated set of policy instruments, and the close interac-
tion with families that this entailed, implementation of the One Child Policy required a
large bureaucracy. As of 2005, the FPC had more than 500,000 administrative staff and
more than 1.2 million village-level FPC operatives.4 In 2016, the budget supporting the
FPC’s activities exceeded 8.85 billion dollars.5 However, after debates in recent years
about the necessity of the One Child Policy’s continuation, the government announced
in October 2015 that the policy would be formally terminated as of January 1, 2016.6
3Despite its name, most families were not restricted to having only one child. In many rural areas,families were allowed two children and there were a number of other exemptions including for minoritygroups and for parents who worked in high-risk occupations. See Hesketh et al. (2005) and Hesketh et al.(2015) for good overviews of the policy and implementation.
4See NPFPC, 2006, Statistical Bulletin of Forth National Population and Family Planning System Sta-tistical, http://www.nhfpc.gov.cn/guihuaxxs/s10741/201502/f68e73331a9147e78209ab81bd156a39.
shtml5Includes funding for health and family planning activities. See NHFPC, 2016, The Departmental
budget report of National Health and Family Planning commission of the PRC, http://www.nhfpc.gov.cn/caiwusi/s3574/201604/3582098e060144148a1e3b4f3f1a4fe0.shtml
6The Central Committee of the Communist Party of China, 2015. Bulletin of Fifth Plenary Session of18th CPC Central Committee.
6

Termination of the policy also has called into question the future role of the FPC.7
Some have argued that an appropriate future focus of the FPC would include early
childhood care and education, which falls within the technical purview of the agency
(Wu et al., 2012). Currently, responsibility for providing these services is spread across
multiple entities, which in practice has led to a gap in service provision (Wu et al., 2012).
Whether the FPC would be able to effectively fill this role is an open question, however. On
one hand, the FPC has the ideal infrastructure to provide early childhood services: a large,
well-functioning organisation with representation in every village and community in the
country; a relatively well-educated work force; and the ability to maintain information on
every family and child. On the other hand, it may be difficult for FPC cadres to retrain and
effectively deliver ECD services. More significantly, the agency’s history and reputation
could limit its effectiveness. Although the enforcement of the policy relaxed over time, the
agency’s at times draconian measures may have created lasting social animosity toward
the family planning commission that could hinder its effective delivery of ECD services.8
3 Experimental Design and Data Collection
3.1 Sampling and Randomisation
The study sample was selected from one prefecture located in a relatively poor province
located in Northwest China. The province ranks in the bottom half of provinces nationally
in terms of GDP per capita. The prefecture chosen for the study is located in a mountainous
and relatively poor region of the province.
To identify the sample, we first selected townships from four nationally-designated
poverty counties in the chosen prefecture. All townships in each county were included
7See Sonmez, F., Wall Street Journal, 2015. After the One-Child Policy: What Hap-pens to China’s Family-Planning Bureaucracy? http://blogs.wsj.com/chinarealtime/2015/11/12/
after-the-one-child-policy-what-happens-to-chinas-family-planning-bureaucracy/8See China Central Television (CCTV) News report: How will a Million Family Planning Workers
Transition? https://youtu.be/84WIe1C3XTM
7

except the one township in each county that housed the county seat. Within each township,
government data was used to compile a list of all villages reporting a population of at
least 800 people. We then randomly selected two villages from the list in each township.
These exclusion criteria were chosen to ensure a rural sample and increase the likelihood
that sampled villages had a sufficient number of children in the target age range. Our
final sample consisted of 131 villages total. All children in sample villages between 18
and 30 months of age were enrolled in the study. At baseline, a total of 592 children were
sampled.
Following baseline data collection (described below), 65 villages were randomly as-
signed to the parenting intervention group and the remaining 66 to a control group. The
randomisation procedure was stratified by county, child cohort, and experimental group
of an earlier trial.9
Each trainer was assigned a maximum of four families chosen randomly from treatment
villages to be enrolled in the program. In treatment villages, a total of 212 children were
enrolled and the remaining 79 were not. In the analysis, we test for spillover effects on
these children in treatment villages who were not selected to participate.
3.2 Parenting Program
Parenting trainers, selected by the FPC from among their cadres in each township, de-
livered a structured curriculum through weekly home visits to households in treatment
villages for a period of six months (from November 2014 to April 2015). Based loosely
on the Jamaican home visiting model (Grantham-McGregor et al., 1991) and adapted
by child development psychologists in China to the local setting, the goal of the inter-
9The children included in this study were previously part of the sample for a randomised trial testing theeffect of micronutrient powders aimed at reducing anemia. For that trial, children were recruited when theywere between 6 and 12 months of age. Recruitment was done in two six-month cohorts. The findings of thattrial, reported in Luo et al. 2016, show no effect of micronutrient powder on haemoglobin or anemia at 18months. The treatment assignment for the parenting intervention evaluated in this study was stratified onthe arms of the earlier trial. There is no evidence that effects of the parenting intervention vary across armsof the earlier trial. In all analysis we additionally control for past nutrition assignment status.
8
vention was to train caregivers to interact with their children through stimulating and
developmentally-appropriate activities.
The curriculum delivered by the parenting trainers was developed by the research team
in collaboration with the FPC and outside ECD experts in China. The curriculum was
stage-based and fully scripted. Weekly age-appropriate sessions were developed targeting
children from 18 months of age to 36 months of age. Each weekly session contained
modules focused on two of four total developmental areas: cognition, language, socio-
emotional, and (fine and gross) motor skills. Every two weeks, caregivers would encounter
one activity from each category. In addition to developmental activities, the curriculum
also included one weekly module on child health/nutrition.
During sessions, parent trainers were trained to introduce caregivers to the activity and
assist caregivers to engage in the activity with their child. Typically the only caregiver that
participated was the primary caregiver (usually mother or grandmother), though other
caregivers sometimes observed. At the end of each weekly session, the materials used for
that week’s activities (toys and books) were left in the household to be returned at the next
visit.
Parenting trainers were selected and deployed by the FPC office in each township.
Summary statistics on trainer characteristics are shown in Appendix Table A1. Around 60
percent of the parenting trainers deployed by the FPC office were men. The majority of
parenting trainers were married and had children themselves. The parenting trainers were
well educated with most of them having enjoyed a community college higher education
and around 30 percent had obtained a bachelor degree. On average, parenting trainers
were 34 years old and had worked 12 years for the Family Planning Commission. FPC
offices assigned parent trainers to enrolled families in their township. Most trainers were
assigned families in only one village.
Fully scripting the curriculum eliminated the need for extensive training of parent train-
ers. All parenting trainers underwent an initial, centralised one-week intensive training at
9

the beginning of the program which covered theories and principles of early childhood
development, parenting skills, and the curriculum. This initial training consisted of both
classroom-based instruction as well as field practice. Throughout the program, trainers
received periodic training by phone on curriculum activities which would vary according
to the ages of children to whom they were assigned.
3.3 Data Collection
We conducted our baseline survey in October 2014 and our follow-up survey in May
2015. Teams of enumerators collected detailed information on children, caregivers and
households. Each child’s primary caregiver was identified and administered a survey on
child, parent and household characteristics including each child’s gender, birth order,
maternal age and education. Each child’s age was obtained from his or her birth certificate.
The primary caregiver was identified by each family as the individual most responsible for
the infant’s care (typically the child’s mother or grandmother).
Children’s cognitive, psychomotor and social-emotional development were assessed in
each round. At baseline, all children were assessed using the Bayley Scales of Infant Devel-
opment (BSID) Version I, a standardised test of infant cognitive and motor development
(Bayley, 1969). The test was formally adapted to the Chinese language and environment in
1992 and scaled according to an urban Chinese sample (Yi et al., 1993; Huang et al., 1993).
Following other published studies that use the BSID to assess infant development in China
(Li et al., 2009; Chang et al., 2013; Wu et al., 2011), it was this officially adapted version of
the test that was used in this study (Yi, 1995). All BSID enumerators attended a week-long
training course on how to administer the BSID, including a 2.5 day experiential learning
program in the field. The test was administered in the household using a standardised set
of toys and detailed scoring sheet. The BSID takes into consideration each child’s age in
days, as well as whether he or she was premature at birth. These two factors, combined
with the child’s performance on a series of tasks using the standardised toy kit, are used
10

to construct two sub-indices: the Mental Development Index (MDI), which evaluates
memory, habitation, problem solving, early number concepts, generalisation, classification,
vocalisation and language to produce a measure of cognitive development; and the Psy-
chomotor Development Index (PDI), which evaluates gross motor skills (rolling, crawling
and creeping, sitting and standing, walking, running and jumping) and fine motor skills
to produce a measure of psychomotor development (Bayley, 1969).
Because the BSID-I is not designed to assess outcomes for children older than 30
months, only children aged 30 months or under at follow-up (approximately half of the
sample) were administered the BSID in the follow-up survey. Older children were assessed
using the Griffith Mental Development Scales (GMDS-ER 2-8) (Luiz et al., 2006), which
has been shown to be comparable in its assessment of early childhood development to the
BSID-I (Cirelli et al., 2015).10
Enumerators were trained for two days on how to administer the Griffith Mental
Development Scales. As with the BSID, a standard activity kit is used to test different
skill sets of children and enumerators score children on a standardised form based on
their performance on tested activities. The GMDS-ER 2-8 comprises six sub scales: loco-
motor, personal-social, language (receptive and expressive), hand and eye coordination,
performance, practical reasoning.11
For the analysis, raw scores are standardised separately by sub-index. Since raw scores
are increasing in age, we compute age-adjusted z-scores using age-conditional means
and standard deviations estimated by non-parametric regression. This non-parametric
standardisation method is less sensitive to outliers and small sample size within age-
category and yields normally distributed standardised scores with mean zero across the
age range (in months)(Attanasio et al., 2015).12
10The Pearson correlation coefficient between the BSID and GMDS is found to be higher than 0.8.11The last sub-scale of the GMDS-ER, practical reasoning, is only used to assess development of older
children, hence was not registered to this particular age group. Furthermore, in the analysis we ommit theGMDS-ER language subscale as receptive and expressive language skills are not explicitly tested by theBSID I and we want to have comparable measures across the two age cohorts.
12The non-parametric method is described further in the Web Appendix B.4. of Attanasio et al. (2015).
11

In each wave we also assessed children’s social-emotional behavior using the Ages and
Stages Questionnaire: Social Emotional (ASQ:SE) (Squires et al., 2003). The items in this
questionnaire (which vary by age) measure a child’s tendency towards a set of behaviors
such as ability to calm down, accept directions, demonstrate feelings for others (empathy),
communicate feelings, initiate social responses to parents and others, and respond without
guidance (move to independence). Main caregivers were asked to indicate whether the
child exhibits these behaviors most of the time, sometimes, or never. Depending on the
desirability of the behavior, answered are scored either 0, 5, or 10 points. Children
who score 60 or more are considered to require further assessment for social-emotional
problems.
The parenting curriculum was designed to affect child development by increasing
parenting skills and investment of caregivers in the development of their children. We
measured parenting skills at baseline and follow up by asking the primary caregiver a
series of questions on parenting knowledge and confidence. These included questions
about the importance of different activities such as reading and playing with their children
and caregiver confidence in engaging in these activities. Caregivers responded to these
questions using a 7-point likert scale. Parental investment was measured by asking
whether the main caregiver engaged in a set of child-rearing activities, such as story-
telling and playing with toys, the previous day and how many children’s books they have
in the house.
Information on compliance – including whether the weekly parenting sessions took
place and, if not, the reason they did not take place – as well as details of the interaction
were collected on a monthly basis from caregivers and on a weekly basis from parenting
trainers through telephone interviews. In our analysis, we use parenting trainer reports
as these data are more complete. The difference in average compliance for these two
measures is insignificant and the two measures are highly correlated (correlation of 0.69).
12

3.4 Baseline Characteristics, Balance, and Attrition
Summary statistics and tests for balance across control and treatment groups are shown in
Table 1. Differences between study arms in individual child and caregiver characteristics
are insignificant. A joint significance test across all baseline characteristics also confirms
the study arms are balanced.13 Appendix Table A2 shows that characteristics of untreated
children in treatment villages (the ”spillover group”) are also balanced with those of
children in the treatment and control groups.
Children in our sample are on average just over 24 months old at the start of the
program. Less than 5% of children are born with low birth weight. A large part of the
children in our sample are first born in the family (60%). More than 80% of children were
ever breastfed and around 35% were breastfed for more than one year. More than 20%
percent of sample children were anemic according to the WHO-defined threshold of 110
g/L. On average children were reported to be ill 4 days over the previous month.14 At
baseline, around 40 percent of the sample is cognitively delayed with Bayley MDI scores
below 80 points, but few (10%) were delayed in their motor development. Around 30
percent of the children are at risk of social-emotional problems at baseline.
We also collected information on caregivers and families. Around 26 percent of
the sample receives social security support through the dibao, China’s minimum living
standard guarantee program, as reported in Panel B of Table 1. The biological mother
is the primary caregiver in only 60 percent of households, with grandmothers often
taking over child rearing when mothers out-migrate to join the labour force in larger
cities. We find that slightly more than 70 percent of primary caregivers in the sample
(mothers or grandmothers as appropriate) have at least 9 years of formal schooling. On
average households report being somewhat indifferent in their feelings toward the FPC at
13We test this by regressing treatment status on all baseline characteristics reported in Table 1 and testthat the coefficients on all characteristics were jointly zero. The p-value of this test is 0.529.
14Caregivers were asked whether the child had suffered from fever, cough, diarrhea, indigestion orrespiratory cold over the previous month.
13

baseline.15
Baseline statistics on parental inputs shown in Panel C of Table 1 show that caregivers
engage in few stimulating activities with their children. Only 11% of caregivers told a
story to their child the previous day. Less than 5% read a book to their child (on average
households have only 1.6 books). Only around 1 in 3 caregivers report playing or singing
to their child the previous day.
Overall attrition between November 2014 and May 2015 was less than 1 percent and
insignificantly correlated with treatment status. We define attrition as missing a Bayley’s
or Griffith outcome (depending on the age-cohort) measure at endline for children with a
Bayley baseline measure.
3.5 Estimation of Program Effects
Given random assignment of households into treatment and control groups, comparison
of outcome variable means across treatment arms provides unbiased estimates of the effect
of the parenting intervention on outcomes. However, to increase power (and to account
for our stratified randomisation procedure) we condition our estimates on randomisation
strata (Bruhn and McKenzie, 2009) and baseline values of the outcome variable.
We use ordinary least-squares (OLS) to estimate the intention-to-treat (ITT) effects of
the parenting intervention with the following ANCOVA specification:
Yijt = α1 + β1Tjt +γ1Yij(t−1) + τs + εij (1)
where Yijt is an outcome measure for child i in village j at follow-up; Tjt is a dummy
variable indicating the treatment assignment of village j; Yij(t−1) is the outcome measure
for child i at baseline, and τs is a set of strata fixed effects. We adjust standard errors
15We asked caregivers to rate their perception of local Family Planning Commission on a 5-point scale (1very much like; 2 like; 3 Neither like nor dislike; 4 dislike; 5 very much dislike).
14

for clustering at the village level using the Liang-Zeger estimator. To estimate spillover
effects we use the same specification but replace treated children with untreated children
in treatment villages in the estimation sample. Because we estimate treatment effects
on multiple outcomes, we present p-values adjusted for multiple hypotheses using the
step-down procedure of Romano and Wolf (2005) which controls for the familywise error
rate (FWER).
We estimate program effects both separately by age cohort and on the full sample
pooling both cohorts together. Because different assessments were used for the cohorts
at endline, we construct a combined index of infant skill development that allows us
to estimate effects on the full sample. To construct this index, we follow Heckman et
al. (2013) and develop a dedicated measurement system relating the observed infant
development outcome measures in both cohorts to a latent infant skill factor. We assume
that the measurement system is invariant to treatment assignment which implies that
any observed treatment effect on measured development outcomes results from a change
in the latent skill and not from a change in the measurement system.16 Hence, for each
cohort we estimate following dedicated measurement system at baseline and follow-up:
yθim = µθm +θ′iλθm + δθim (2)
with yθim the observed mth measure for child i; µθm the mean of the mth measure and
λθm the loadings of the factor for measure m. The measurement error δθim is the remaining
proportion of the variance of the outcome measures m that is not explained by the factor
and is assumed to be independent of the latent infant skill factor θ and to have a zero
mean.17
16More formally, this assumption implies that the measurement system intercept, factor loadings anddistribution of measurement errors are the same for the control and the treatment group
17Table A4 in the appendix shows the measurement system for the latent infant skill factor at baseline andfollow-up. The first column in this table reports factor loadings. We normalised the factor loading of thefirst measure in both periods and cohorts to one. Hence, at baseline, the scale of the latent infant skill factoris determined by the Bayley Mental Development Index. At follow up, the scale of the latent infant skillfactor is determined by the Bayley Mental Development Index for the younger cohort, and by the Griffith
15

After estimating the measurement system for each cohort separately we use the esti-
mated means and factor loadings to predict a factor score for each child i in the sample
using the Bartlett scoring method (Bartlett, 1937)18. The predicted infant skill factors are
standardised non-parametrically for each age-month group by cohort and we control for
cohort fixed effects in our pooled regression specification.
In the same spirit as the creation of a latent infant skill factor, we estimate a dedicated
measurement system relating all observed measures of parental investment behaviour and
parenting skills to latent factors. We estimate following system of equations for baseline
and follow-up:
yPim = µPm + P ′i λPm + δPim (3)
yIim = µIm + I ′iλIm + δIim (4)
with yPim and yIim the observed mth measure of parenting skill or parental investment
of child i; µPm and µIm the mean of the mth measure and λPm and λIm the loadings of the
factor for measure m. The measurement system for the latent parenting skill factor and
parental investment factor at baseline and follow-up can be found in Appendix Table A4.
The predicted parenting skill factor and parental investment factor are standardised by
the distribution of the control group.
Performance scale for the older age cohort. The second column of the table shows estimates for how muchof the variance is driven by signal relative to noise. The signal-to-noise ratios for the mth measure of childdevelopment is calculated as:
Sθm =λ2mV ar(θ)
λ2mV ar(θ) +V ar(δm)
These calculations show that Bayley and Griffith measures derived form objective testing by trained enu-merators have relatively high signal-to-noise ratios while the signal of the ASQ: Social-Emotional, a measurebased on caregiver response, is relatively poor.
18Bartlett’s scoring method is based on GLS estimation with measures as dependent variables and factorloadings as regressors.
16
4 Impact of the Parenting Intervention
4.1 Average Treatment Effects on Infant Skills
Pooling the two cohorts, Figure 1 plots the kernel density estimates of the latent infant skill
distribution at baseline and follow-up by treatment assignment. At baseline, the infant
skill distribution of infants in treatment and control villages overlap and a Kolmogorov-
Smirnov (K-S) test indicates that the two distributions are similar (p-value = 0.828). At
follow-up, the infant skill distribution is shifted to the right in the treatment group. A
K-S test rejects the equality of distributions in the treatment and control groups with a
p-value of 0.029.
Table 2 presents the average treatment effects on infant skills are shown in Table
2. Pooling cohorts, we estimate that the parenting program led to an overall average
increase of 0.23 standard deviations in infant skill (bottom row). Estimating effects
separately by cohort, we find that the parenting intervention significantly increased
cognitive skills as measured by the Mental Development Index of the Bayley assessment
scale for the younger age-cohort and by the Griffith assessment scales of Performance and
Personal-Social for the older age-cohort. The 6-month intervention led to a significant
increase of 0.24 standard deviations in cognitive development in the younger cohort and an
increase of 0.27 standard deviations for the older cohort. We find no significant program
effects on child psychomotor development or on social-emotional outcomes. These results
are similar to the finding of Attanasio et al. (2014), who report that their home-based
parenting intervention in Colombia led to an increase of 0.26 standard deviations in
cognitive development but no significant improvement in psychomotor development.
Despite similar effect sizes of both programs, the Colombia study lasted one year longer
(18 months in total) and enrolled younger children (12-24 months).
17

4.2 Mechanisms: Effects on Parenting Skills and Investment
To motivate the mechanisms through which the parenting intervention may have affected
infant skills, consider the following general production function of early skill formation:
θt+1 = ft+1(θt, ITt+1, I
Pt+1, Pt+1,Xt). (5)
Here, θt and θt+1 are vectors of infant skills at baseline and follow-up respectively, ITt+1
are direct investments from the treatment (i.e. time spent with the child during weekly
visits), IPt+1 are parental investments during the intervention period, Pt+1 are parenting
skills during the intervention period, and Xt a vector of household characteristics.
This production function illustrates several mechanisms through which the interven-
tion may have affected infant skill. First, the intervention could have a direct impact
on infant skill formation through the weekly interactions with the parenting trainers
(investment from the treatment itself, a shift in ITt+1). Alternatively, the intervention may
have indirect effects by affecting either (a) parental investment (IPt+1) or (b) the effective-
ness of parental investment through an increase in parenting skills (Pt+1). Although the
intervention was designed to improve the quantity and quality of infant-caregiver inter-
actions it is not a priori clear that parents would spend more time with their children.
Parental investment could be crowded-out as a result of the intervention if parents see the
intervention as an in-kind transfer and hence re-optimise the allocation of the household
resources.19
Our data allow us to estimate the causal effect of the intervention on two of these four
mechanisms: parental investments and on parenting skills. Assuming measurement error
19An additional potential mechanisms is that the intervention could change the production technologyby shifting the productivity parameter. Attanasio et al. (2014) use data from an intervention in Colombiato explicitly test for this mechanism and do not find evidence for this channel. Following this result, wedo not test for this mechanism here (as we focus on reduced-form results), but assume that this channel isnegligible in our interpretation of mechanisms.
18
is sufficiently small, no treatment effects on parental investment would suggest that the
main mechanism for program effects is through a direct effect of the program. Effects on
these two indicators, however, would not rule these out as potential channels of impact.
Kernel density estimates of the latent parental investment factor and the latent parent-
ing skill factor at baseline and follow-up are plotted in Figure 2 by treatment assignment.
At baseline both the parental investment factor and parenting skill factor have a similar
distribution for control and treatment villages (confirmed by K-S test p-values of 0.96 and
0.62 respectively). At follow-up we find that the distribution of the parental investment
factor in the treatment villages has drastically shifted to the right. This visual evidence
is also supported by a strong K-S test rejection of the equality of the two parenting in-
vestment factor distributions with a p-value < 0.01. We see a more moderate shift in the
distribution of the parenting skill factor. Nevertheless, the distributional shift is significant
(p-value=0.05) and we find again that caregivers in treatment villages have improved
parenting skills along the entire ability distribution.
Average treatment effects on the secondary outcomes can be found in Table 3. We find
that the program significantly increase parenting skills (Panel A). In terms of individual
components, caregivers in treatment households report a stronger belief in the importance
of reading for child development, more confidence in their ability to read to their children,
and more confidence (less nervousness) in their ability to care for their children. The
intervention had no effect on parental beliefs about the importance of play for child
development or confidence.
We also find large effects on parental investment (Panel B). The parenting interven-
tion increased the time caregivers spend with their children actively engaging in age-
appropriate developmental activities such has reading and singing. Furthermore, we
find that treatment households had significantly more children’s books in their homes
at the end of the program compared to the households in the control group. We find no
evidence of crowding-out of parental investment as a result of the parenting intervention
19

as children in treatment households did not significantly spend more time watching tv or
playing by themselves.
Overall this evidence suggests that parents are investing considerably more effort into
parenting and have gained some better parenting skills as a result of the intervention.
This evidence suggests that an important mechanism contributing to the effectiveness of
the intervention was a change in parenting behavior, which was the aim of the parenting
intervention and is in line with findings of Attanasio et al. (2015).
4.3 Compliance and Dose-Response Estimation
On average, 16.4 visits (out of 24 total planned visits) were completed for each household
during the course of the study based on reports from parent trainers. To assess the drivers
of incomplete compliance, we regress the number of reported household visits on child,
family, and trainer characteristics as well as the distance from the village to the closest
FPC office. The estimated correlates of compliance can be found in Table 4.
Compliance is most strongly correlated with four factors: whether the child is male,
whether a child suffered cognitive delay at the start of the intervention, distance from
the village to the FPC office in the township, and caregiver perception of the FPC. Male
children receive on average slightly more household visits. Children who were cognitive
delayed (measured as BSID< 80) received on average one to two household visits less
compared to children who were at a more normal developmental stage at the start of
the intervention. Compliance is negatively correlated with the distance to the FPC office,
which may reflect supply-side compliance failure as parenting trainers chose to visit
remote households less frequently, though it may also be capturing correlated demand-
side characteristics of households.
Once all variables are included in the compliance regression, the most important
demand-side factor associated with compliance appears to be whether households had
an unfavorable view of the FPC at baseline. Households with a more unfavorable view of
20
the agency completed significantly fewer visits. If the program were to be implemented
in the future, however, this may become less of an obstacle to implementation as we find
that the program itself has a significant positive effect on public perception of the FPC
as reported in Table 5. The estimated average treatment effect of the intervention on the
household’s reported negative perception of the FPC (on 5-point likert scale) at the end of
the parenting program is -0.33 and significant at the 5% level.
Given imperfect compliance, we present estimates of the dose-response relationship
between the number of completed household visits and our main outcomes of interest
(infant skill, parenting skill, and parental investment) using control function methods. We
do this first assuming a linear relationship and then allowing for a concave relationship by
adding a squared term for household visits completed. For both of these, we instrument
the number of visits with the treatment assignment, the distance between the village and
the FPC township office, and the interaction between these two variables.20
Table 6 shows control function estimates of the dose-response relationships. In
Columns (1), (3) and (5) we assume a linear relationship between the number of completed
household visits and the latent infant skill, parenting skill and parental investment factors.
We estimate that each session completed increases infant skill with 0.012 standard devia-
tions, parenting skill with 0.020 standard deviations and parental investment with 0.044
standard deviations. Results from Column (2), (4) and (6) which allow for non-linearity
do not suggest that these relationships are concave. Assuming a linear relationship up
to 24 household visits, these estimates suggest that under full compliance we would see
infant skill increase by 0.288 standard deviations, parenting skill by 0.480 deviations and
parental investment by 1.008 standard deviations.
20Linear estimates of the dose-response relationship between the number of completed household visitsand cognitive development outcomes are similar when instrumenting compliance with only treatmentassignment.
21

4.4 Heterogeneity
We estimate average treatment effects within subgroups defined by pre-treatment charac-
teristics. To do so, we create dummy variables indicating treatment for each subgroup and
include these, along with dummy variables indicating subgroups, in Equation (1). A t-test
is used to test whether estimated treatment effects differ significantly across sub-groups.
The subgroup analysis is presented in Table 7. After adjusting for multiple hypotheses,
we find that average treatment effects differ significantly for children who had low baseline
infant skills (below the median) at the onset of the program. We further find significant
heterogeneity in treatment effects for children with low levels of parental investment before
the start of the program. Average treatment effects do not, however, differ significantly at
the 10 % level or lower across any of the other subgroups examined, which could be due
to insufficient power. Overall this evidence suggest that the program was most effective
for children who lagged behind in their cognitive development and come from households
where baseline levels of parental investments were low at the onset of the intervention.
This suggests that the parenting intervention helped those children most in need of extra
cognitive stimulation.
5 Conclusion
This paper reports the results of a randomised trial of a home-based parenting program
delivered by cadres employed by China’s Family Planning Commission. We find that the
program significantly increased infant cognitive skills of children after only six months.
There were no significant effects on motor development or social-emotional outcomes. The
program also had corresponding positive effects on measures of parental investment and
let to a significant increase in parenting skills. Children who lagged behind cognitively
and received little parental investment at the onset of the intervention benefited most of
the program. These effects occurred despite lackluster compliance with the program which
22

appears to have been driven primarily by a combination of supply-side implementation
failures and an unfavorable perception of the FPC by beneficiary households. The program
itself, however, had a positive effect on views of the FPC suggesting that public perception
may be a less significant obstacle as the program is implemented over time. Efforts
to improve supply-side compliance will likely have the greatest impact on improving
program effectiveness.
Our study faces a number of limitations. First, the study took place in one poor rural
area in Northwest China; results may differ in other regions and contexts. Second, children
were already over 18 months of age at the start of the trial. It is possible that effects would
be larger if children were enrolled at an earlier age and/or the intervention took place
over a longer period of time. Finally, we estimate effects only at one point in time at the
conclusion of the intervention. Longer-run follow-up of the children in the study will be
necessary to determine if the gains we find are lasting or fade out over time.
Despite these limitations, our results imply that an ECD program can be effectively
delivered through the existing infrastructure of the National Health and Family Planning
Commission. Future research should explore alternative interventions to improve ECD
outcomes and compare relative cost-effectiveness across alternative delivery models.
23

References
Attanasio, O., Baker-Henningham, H., Bernal, R., Meghir, C., Pineda, D., and Rubio-
Codina, M. (2018). Early stimulation: The impacts of a scalable intervention. discussion
paper, IFS.
Attanasio, O., Cattan, S., Fitzsimons, E., Meghir, C., and Rubio-Codina, M. (2015). Esti-
mating the production function for human capital: Results from a randomized control
trial in colombia. Discussion paper, National Bureau of Economic Research.
Attanasio, O. P., Fernandez, C., Fitzsimons, E. O., Grantham-McGregor, S. M., Meghir, C.,
and Rubio-Codina, M. (2014). Using the infrastructure of a conditional cash transfer
program to deliver a scalable integrated early child development program in colombia:
cluster randomized controlled trial. BMJ, 349:g5785.
Bartlett, M. S. (1937). The statistical conception of mental factors. British journal of
Psychology, 28(1):97–104.
Bayley, N. (1969). Manual for the Bayley scales of infant development. Psychological Corpo-
ration.
Berlinski, S., Schady, N., et al. (2016). The early years: Child well-being and the role of public
policy. Springer.
Black, M. M. and Dewey, K. G. (2014). Promoting equity through integrated early child
development and nutrition interventions. Annals of the New York Academy of Sciences,
1308(1):1–10.
Black, M. M., Walker, S. P., Fernald, L. C., Andersen, C. T., DiGirolamo, A. M., Lu, C.,
McCoy, D. C., Fink, G., Shawar, Y. R., Shiffman, J., et al. (2017). Early childhood
development coming of age: science through the life course. The Lancet, 389(10064):77–
90.
24
Bruhn, M. and McKenzie, D. (2009). In pursuit of balance: Randomization in practice in
development field experiments. American economic journal: applied economics, 1(4):200–
232.
Carneiro, P. M. and Heckman, J. J. (2003). Human capital policy.
Chan, M. (2013). Linking child survival and child development for health, equity, and
sustainable development. Lancet, 381(9877):1514–1515.
Chang, S., Zeng, L., Brouwer, I. D., Kok, F. J., and Yan, H. (2013). Effect of iron deficiency
anemia in pregnancy on child mental development in rural china. Pediatrics, 131(3):e755–
e763.
Cirelli, I., Graz, M. B., and Tolsa, J.-F. (2015). Comparison of griffiths-ii and bayley-ii tests
for the developmental assessment of high-risk infants. Infant Behavior and Development,
41:17–25.
Cunha, F. and Heckman, J. (2007). The technology of skill formation. American Economic
Review, 97(2):31–47.
Cunha, F., Heckman, J. J., and Schennach, S. M. (2010). Estimating the technology of
cognitive and noncognitive skill formation. Econometrica, 78(3):883–931.
Dixit, A. (2002). Incentives and organizations in the public sector: An interpretative
review. Journal of human resources, pages 696–727.
Gertler, P., Heckman, J., Pinto, R., Zanolini, A., Vermeersch, C., Walker, S., Chang, S. M.,
and Grantham-McGregor, S. (2014). Labor market returns to an early childhood stimu-
lation intervention in jamaica. Science, 344(6187):998–1001.
Grantham-McGregor, S. M., Powell, C. A., Walker, S. P., and Himes, J. H. (1991). Nutri-
tional supplementation, psychosocial stimulation, and mental development of stunted
children: the jamaican study. The Lancet, 338(8758):1–5.
25

Greenhalgh, S. (1986). Shifts in china’s population policy, 1984-86: Views from the central,
provincial, and local levels. Population and Development Review, pages 491–515.
Heckman, J., Pinto, R., and Savelyev, P. (2013). Understanding the mechanisms through
which an influential early childhood program boosted adult outcomes. American Eco-
nomic Review, 103(6):2052–86.
Heckman, J. J., Moon, S. H., Pinto, R., Savelyev, P. A., and Yavitz, A. (2010). The rate of
return to the highscope perry preschool program. Journal of public Economics, 94(1):114–
128.
Hesketh, T., Lu, L., and Xing, Z. W. (2005). The effect of china’s one-child family policy
after 25 years.
Hesketh, T., Zhou, X., and Wang, Y. (2015). The end of the one-child policy: lasting
implications for china. Jama, 314(24):2619–2620.
Huang, H., Tao, S., Zhang, Y., et al. (1993). Standardization of bayley scales of infant
development in shanghai. Chin J Child Health, 1(3):158–160.
Knudsen, E. I., Heckman, J. J., Cameron, J. L., and Shonkoff, J. P. (2006). Economic,
neurobiological, and behavioral perspectives on building america’s future workforce.
Proceedings of the National Academy of Sciences, 103(27):10155–10162.
Li, Q., Yan, H., Zeng, L., Cheng, Y., Liang, W., Dang, S., Wang, Q., and Tsuji, I. (2009).
Effects of maternal multimicronutrient supplementation on the mental development
of infants in rural western china: follow-up evaluation of a double-blind, randomized,
controlled trial. Pediatrics, 123(4):e685–e692.
Lu, C., Black, M. M., and Richter, L. M. (2016). Risk of poor development in young children
in low-income and middle-income countries: an estimation and analysis at the global,
regional, and country level. The Lancet Global Health, 4(12):e916–e922.
26

Luiz, D., Barnard, A., Knoesen, N., Kotras, N., Horrocks, S., McAlinden, P., Challis, D., and
O’Connell, R. (2006). Griffiths mental development scales: Extended revised. two to
eight years. administration manual. Hogrefe, Oxford, UK.
Nations, U. (2015). Transforming our world: The 2030 agenda for sustainable development.
New York: United Nations, Department of Economic and Social Affairs.
Nelson, C. A. and Sheridan, M. A. (2011). Lessons from neuroscience research for under-
standing causal links between family and neighborhood characteristics and educational
outcomes. Whither opportunity, pages 27–46.
Richter, L. M., Daelmans, B., Lombardi, J., Heymann, J., Boo, F. L., Behrman, J. R., Lu, C.,
Lucas, J. E., Perez-Escamilla, R., Dua, T., et al. (2017). Investing in the foundation of
sustainable development: pathways to scale up for early childhood development. The
Lancet, 389(10064):103–118.
Romano, J. P. and Wolf, M. (2005). Stepwise multiple testing as formalized data snooping.
Econometrica, 73(4):1237–1282.
Squires, J., Bricker, D., and Twombly, E. (2003). The asq: Se user’s guide for the ages &
stages questionnaires, social-emotional: A parent completed, child-monitoring system
for social-emotional behaviors. Baltimore: Paul H. Brookes Publishing Co.
Walker, S. P., Chang, S. M., Vera-Hernandez, M., and Grantham-McGregor, S. (2011).
Early childhood stimulation benefits adult competence and reduces violent behavior.
Pediatrics, 127(5):849–857.
Wilson, J. Q. (1989). Bureaucracy: What government agencies do and why they do it. Basic
Books.
Wu, K. B., Young, M. E., and Cai, J. (2012). Early child development in China: Breaking the
cycle of poverty and improving future competitiveness. World Bank Publications.
27
Wu, W., Sheng, D., Shao, J., and Zhao, Z. (2011). Mental and motor development and
psychosocial adjustment of chinese children with phenylketonuria. Journal of paediatrics
and child health, 47(7):441–447.
Yi, S. (1995). Manual of bayley scales of infant development, chinese revision. xiangya
school of medicine.
Yi, S., Luo, X., Yang, Z., and Wan, G. (1993). The revising of bayley scales of infant
development (bsid) in china. Chin J Clin Psychol, 1:71–5.
Yousafzai, A. K., Obradovic, J., Rasheed, M. A., Rizvi, A., Portilla, X. A., Tirado-Strayer,
N., Siyal, S., and Memon, U. (2016). Effects of responsive stimulation and nutrition
interventions on children’s development and growth at age 4 years in a disadvantaged
population in pakistan: a longitudinal follow-up of a cluster-randomised factorial
effectiveness trial. The Lancet Global Health, 4(8):e548–e558.
Yousafzai, A. K., Rasheed, M. A., Rizvi, A., Armstrong, R., and Bhutta, Z. A. (2014). Effect
of integrated responsive stimulation and nutrition interventions in the lady health
worker programme in pakistan on child development, growth, and health outcomes: a
cluster-randomised factorial effectiveness trial. The Lancet, 384(9950):1282–1293.
28

Table 1: Descriptive Statistics and Balance
(1) (2) (3)
Control(N=301)
Treatment(N=212)
p-value
Panel A. Child Characteristics
(1) Age in months 24.46 24.45 0.747
(0.20) (0.22)
(2) Male 0.45 0.51 0.185
(0.03) (0.04)
(3) Low birth weight 0.04 0.04 0.774
(0.01) (0.01)
(4) First born 0.59 0.61 0.366
(0.03) (0.04)
(5) Ever breastfed 0.85 0.87 0.974
(0.03) (0.04)
(6) Breastfed ≥ 12 months 0.35 0.39 0.867
(0.05) (0.05)
(7) Anemia (Hb <110 g/L) 0.23 0.27 0.849
(0.03) (0.04)
(8) Days ill past month 4.32 4.55 0.620
(0.33) (0.37)
(9) Cognitive Delay (BSID MDI<80) 0.46 0.39 0.206
(0.04) (0.03)
(10) Motor Delay (BSID PDI<80) 0.12 0.10 0.476
(0.02) (0.02)
(11) Social-Emotional Problems (ASQ:SE>60) 0.25 0.28 0.401
(0.03) (0.03)
Panel B. Household Characteristics
(1) Social security support recipient 0.28 0.25 0.832
(0.03) (0.03)
(2) Mother at home 0.68 0.62 0.116
(0.04) (0.05)
(3) Caregiver education ≥ 9 years 0.72 0.74 0.487
(0.03) (0.04)
(4) Unfavourable perception of FPC 2.87 2.85 0.824
(0.06) (0.05)
Panel C. Parental Inputs
(1) Told story to child yesterday 0.11 0.11 0.960
(0.02) (0.02)
(2) Read book to child yesterday 0.05 0.04 0.872
(0.01) (0.01)
(3) Sang song to child yesterday 0.37 0.35 0.651
(0.03) (0.04)
(4) Played with child yesterday 0.34 0.34 0.996
(0.03) (0.03)
(5) Number of books in household 1.60 1.90 0.615
(0.24) (0.29)
P-values account for clustering within villages. Unfavourable perception of FPC is measured on a 5-point likert scale.
29

Table 2: Program Treatment Impact on Infant Skills
Treatment effect
Point estimate Std. error Romano-WolfP-value
Cohort 1: Below 30 months at follow-up (N=226)
Bayley: Mental Development Index 0.244∗∗ (0.108) {0.0360}Bayley: Psychomotor Development Index -0.011 (0.119) {0.9168}ASQ: Social-Emotional Problems -0.005 (0.139) {0.9020}
Cohort 2: Above 30 months at follow-up (N=277)
Griffith: Performance 0.275∗∗ (0.107) {0.0115}Griffith: Personal-Social 0.264∗∗∗ (0.107) {0.0092}Griffith: Locomotor -0.026 (0.115) {0.8854}Griffith: Eye-hand coordination 0.118 (0.114) {0.2609}ASQ: Social-Emotional Problems 0.114 (0.118) {0.6732}
Infant Skill Factor 0.225∗∗∗ (0.076)
Note: In all regressions we control for strata (county) fixed effects, previous nutrition assignment sta-tus and baseline developmental outcomes. In the pooled factor regression we additionally controlfor cohort fixed effects. All development outcomes are non-parametrically standardized for each age-month group. The Griffith language subscale is omitted in the analysis for the older cohort as re-ceptive and expressive language skills are not explicitly tested by the BSID I and we want compa-rable measures of infant skills across both age groups. We find a positive but insignificant treat-ment effect on the Griffith language subscale (point estimate: 0.023 and std. error: 0.107). Allstandard errors are clustered at the village level. Significance stars indicate significance after adjust-ing for multiple hypotheses using the step-down procedure of Romano Wolf (2005) to control for thefamilywise error rate (FWER). Significance levels are as follows: ∗ p < 0.1, ∗∗ p < 0.05, ∗∗∗ p < 0.01.
30

Table 3: Program Treatment Impacts on Parenting Skills and Parental Investment
Treatment effect
Point estimate Std. error Romano-WolfP-value
Panel A. Parenting Skills at follow-up (N=510)
Parent feels duty to help baby understand the world 0.129 (0.072) {0.2043}Parent knows how to play with baby 0.057 (0.086) {0.3468}Parent knows how to read stories to baby 0.282∗∗∗ (0.085) {0.0011}Parent finds it important to play with baby 0.062 (0.087) {0.3633}Parent finds it important to read stories to baby 0.303∗∗∗ (0.085) {0.0004}Parent finds it difficult to communicate with baby 0.047 (0.095) {0.6243}Parent feels nervous when caring for baby -0.168∗∗ (0.086) {0.0464}Parenting Skill Factor 0.342∗∗∗ (0.092)
Panel B. Parental Investment at follow-up (N=510)
Number of books in hh for reading to baby 0.268∗∗∗ (0.088) {0.0015}Number of times per week family reads to baby 0.869∗∗∗ (0.117) {0.0000}Number of times per week family sings to baby 0.274∗∗∗ (0.089) {0.0047}Number of times per week family goes out with baby -0.079 (0.089) {0.5041}Number of hours per day baby spends watching tv 0.015 (0.077) {0.8700}Number of hours per day baby plays by itself 0.111 (0.103) {0.7215}Parental Investment Factor 0.724∗∗∗ (0.104)
Note: In all regressions we control for strata (county) fixed effects, previous nutrition assignment sta-tus and baseline parental skills or investment measures. In the pooled factor regressions we addi-tionally control for cohort fixed effects. All outcomes are standardized by the distribution of the con-trol group. Parenting skill outcomes are measured on a 7-point likert scale. Number of times perweek family reads, sings or goes out with baby are measured on a 4-point likert scale. All stan-dard errors are clustered at the village level. Significance stars indicate significance after adjustingfor multiple hypotheses using the step-down procedure of Romano Wolf (2005) to control for thefamilywise error rate (FWER). Significance levels are as follows: ∗ p < 0.1, ∗∗ p < 0.05, ∗∗∗ p < 0.01.
31

Table 4: Determinants of Compliance
(1) (2) (3) (4) (5)
HH Visits HH Visits HH Visits HH Visits HH Visits
Male 1.599∗ 1.965∗∗ 1.935∗∗ 1.849∗∗ 1.367
(0.823) (0.849) (0.841) (0.853) (0.825)
Age in months -0.083 -0.040 -0.038 0.005 -0.038
(0.118) (0.115) (0.116) (0.123) (0.099)
Cognitive Delay (BSID MDI<80) -1.541∗ -1.691∗∗ -1.526∗ -1.548∗ -1.085
(0.851) (0.840) (0.834) (0.827) (0.733)
Motor Delay (BSID PDI<80) -1.130 -1.573 -1.897∗ -1.714 -0.449
(1.201) (1.089) (1.072) (1.113) (0.988)
Socio-Emotional Problems (ASQ:SE> 60) 0.110 0.663 0.930 0.662 0.769
(0.972) (0.837) (0.842) (0.853) (0.830)
Number of days ill 0.085 0.037 0.045 0.030 -0.057
(0.132) (0.131) (0.130) (0.129) (0.125)
Mother home >2 years 0.652 0.596 0.911 0.703
(1.067) (1.021) (0.984) (0.856)
Maternal education > 9 years 1.136 0.973 1.048 0.519
(0.961) (0.926) (0.886) (0.983)
Social security support recipient -1.582 -1.916∗ -1.821∗ -1.412
(0.999) (0.985) (1.036) (1.051)
Distance to FPC office -0.326∗∗∗ -0.331∗∗∗ -0.339∗∗∗ -0.304∗∗∗
(0.116) (0.115) (0.118) (0.111)
Unfavourable perception of FPC -1.467∗∗∗ -1.562∗∗∗ -1.814∗∗∗
(0.518) (0.528) (0.508)
Trainer is male -1.214 -1.426
(1.400) (1.399)
Trainer work experience FPC 0.144 0.154
(0.110) (0.112)
Trainer has bachelor degree 0.045 -0.493
(1.417) (1.073)
County FE No No No No Yes
Observations 211 211 211 211 211
R2 0.04 0.13 0.16 0.18 0.27
Note: Unfavorable perception of Family Planning Commission (FPC) is measured on a 5-point likert scale. Trainer workexperience is measured by the number of years worked as a cadre for the FPC. All Standard errors are clustered at the villagelevel. Significance levels are as follows: ∗ p < 0.1, ∗∗ p < 0.05
32
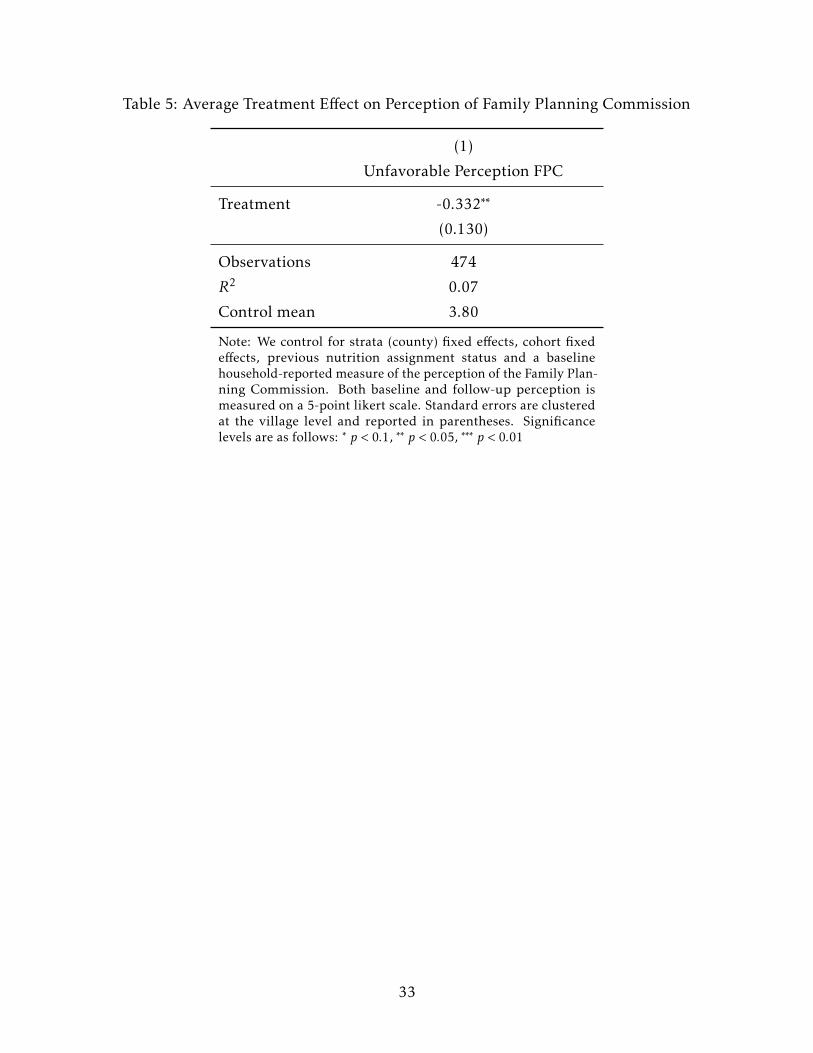
Table 5: Average Treatment Effect on Perception of Family Planning Commission
(1)
Unfavorable Perception FPC
Treatment -0.332∗∗
(0.130)
Observations 474
R2 0.07
Control mean 3.80
Note: We control for strata (county) fixed effects, cohort fixedeffects, previous nutrition assignment status and a baselinehousehold-reported measure of the perception of the Family Plan-ning Commission. Both baseline and follow-up perception ismeasured on a 5-point likert scale. Standard errors are clusteredat the village level and reported in parentheses. Significancelevels are as follows: ∗ p < 0.1, ∗∗ p < 0.05, ∗∗∗ p < 0.01
33

Table 6: Dose-Response Relationships
(1) (2) (3) (4) (5) (6)
Infant Skill Infant Skill Parenting Skill Parenting Skill Parental Inv. Parental Inv.
Number of HH Visits 0.012∗∗∗ 0.055 0.020∗∗∗ 0.027 0.042∗∗∗ 0.011
(0.005) (0.037) (0.005) (0.042) (0.006) (0.044)
Number of HH Visits2 -0.003 -0.001 0.002
(0.002) (0.002) (0.003)
Observations 503 503 510 510 510 510
R2 0.29 0.29 0.08 0.08 0.25 0.25
Note: Column (1), (3) and (5) give control function estimates of the treatment effect of one householdvisit on the factor outcomes of interest, assuming a linear relationship between the number of house-hold visits and the factor outcomes up to 24 household visits. Column (2), (4) and (6) give control func-tion estimates of the treatment effect of one household visit, assuming a concave relationship. Residu-als used in the control function estimation are derived from regressing the number of household visitson treatment status, distance to the FPC office, baseline perception of the FPC and the interaction ofboth the distance and perception measure with treatment assignment. F-test of joint significance of theexcluded instruments gives a p-value of 0.000. In all regressions we control for baseline latent factors,strata(county) fixed effects, cohort fixed effects and previous nutrition assignment status. All standarderrors are clustered at the village level. Significance levels are as follows: ∗ p < 0.1, ∗∗ p < 0.05, ∗∗∗ p < 0.01.
34

Table 7: Program Treatment Impact on Infant Skill, Parenting Skills and Parental Invest-ment by Subgroups
(2) (3)
Infant Skill Romano Wolf P-value
(N=510)
Child Gender
Male 0.292 0.471
(0.114)
Female 0.174
(0.101)
Baseline Infant Skill
Low infant skill 0.356 0.091
(0.111)
High infant skill 0.090
(0.096)
Maternal Migration
Mother at home < 2 years 0.199 0.684
(0.102)
Mother at home ≥ 2 years 0.249
(0.118)
Maternal Education
Caregiver education < 9 years 0.161 0.739
(0.171)
Caregiver education ≥ 9 years 0.228
(0.088)
Baseline Parenting Skills
Low parenting skills .341 0.257
(0.157)
High parenting skills .182
(.140)
Baseline Parental Investment
Low investment .384 0.054
(.118)
High investment .0887
(.099)
Note: In all regressions we control for strata (county) fixed effects, cohort fixed effects, previous nutri-tion assignment status and baseline developmental outcomes. All standard errors are clustered at thevillage level. For baseline infant skills, parenting skills and baseline parental investment dummies are con-structed at the median value of the baseline latent factor. Column (2) reports p-values of a t-test of equalityof treatment effects for different sub-groups controlling for the familywise error rate by using the step-down adjustment procedure of Romano Wolf (2005). All standard errors are clustered at the village level.
35

Figure 1: Probability density functions of Bartlett factor scores of Infant Skill are showfor baseline and follow-up by treatment assignment. The Kolmogorov-Smirnov (K-S) testof the equality of the infant skill distribution of control and treatment villages cannot berejected at the 5% significance level (p-value:0.828) at baseline. At follow-up the K-S testrejects the equality of the two distributions (p-value:0.029).
36

(a) Parental Investment Factor (b) Parenting Skill Factor
Figure 2: Probability density functions of Bartlett factor scores of Parental Investment (a)and Parenting Skill (b) are shown for baseline and follow-up by treatment assignment. TheKolmogorov-Smirnov (K-S) test of the equality of the parental investment and parentingskill distribution of control and treatment villages cannot be rejected at the 5% significancelevel (p-value:0.619 and 0.959) at baseline. At follow-up the K-S test rejects the equalityof the control and treatment distribution for both the parental investment and parentingskill factors (p-value:0.000 and 0.053).
37
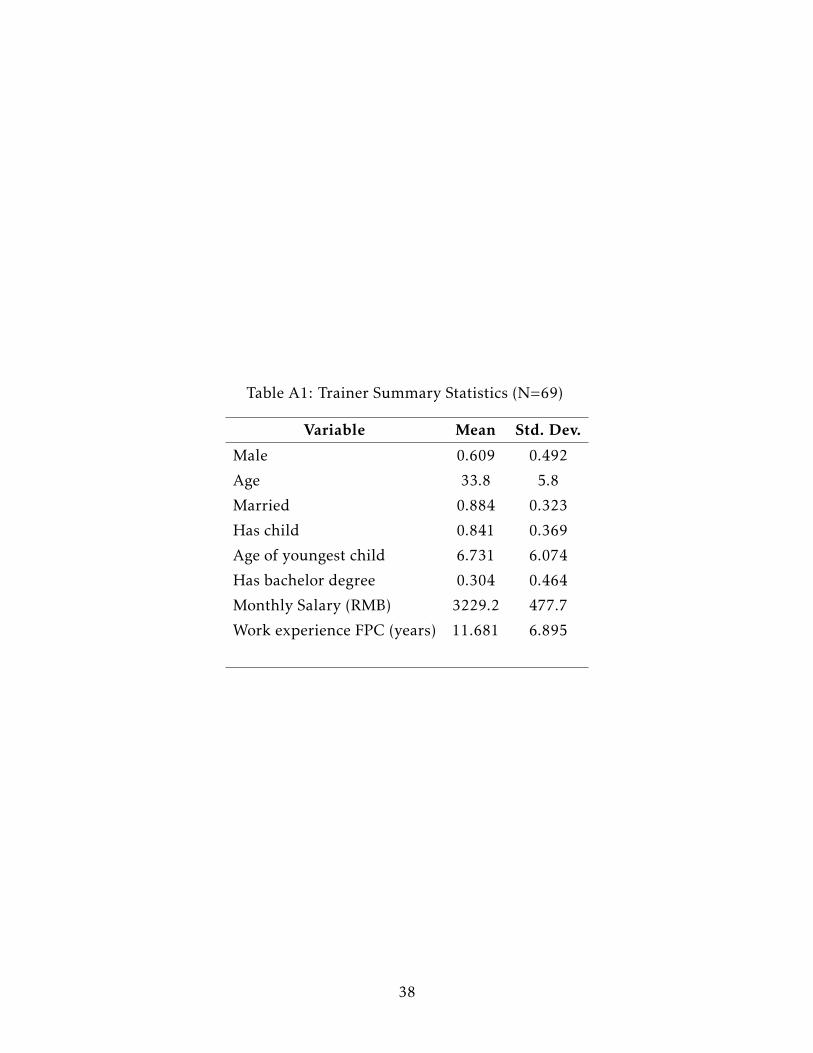
Table A1: Trainer Summary Statistics (N=69)
Variable Mean Std. Dev.
Male 0.609 0.492
Age 33.8 5.8
Married 0.884 0.323
Has child 0.841 0.369
Age of youngest child 6.731 6.074
Has bachelor degree 0.304 0.464
Monthly Salary (RMB) 3229.2 477.7
Work experience FPC (years) 11.681 6.895
38

Table A2: Descriptive Statistics and Balance
(1) (2) (3) (4) (5) (6)
Control(N=300)
Treatment(N=212)
Spillover(N=79)
P-valueControl
vs.Treatment
P-valueControl
vs.Spillover
P-valueTreatment
vs.Spillover
Panel A. Child Characteristics
(1) Age in months 24.47 24.45 24.38 0.800 0.689 0.856
(0.20) (0.22) (0.33)
(2) Male 0.45 0.51 0.58 0.196 0.017 0.110
(0.03) (0.034) (0.05)
(3) Low birth weight 0.04 0.04 0.05 0.777 0.683 0.808
(0.01) (0.01) (0.03)
(4) First born 0.58 0.61 0.66 0.358 0.427 0.985
(0.03) (0.04) (0.06)
(5) Ever breastfed 0.85 0.87 0.87 0.997 0.502 0.562
(0.03) (0.04) (0.06)
(6) Still breastfed ≥ 12 months 0.35 0.39 0.33 0.900 0.929 0.690
(0.05) (0.05) (0.08)
(7) Anemia (Hb <110 g/L) 0.23 0.27 0.16 0.846 0.871 0.831
(0.03) (0.04) (0.05)
(8) Days ill past month 4.32 4.55 4.77 0.702 0.995 0.725
(0.34) (0.37) (0.84)
(9) Cognitive Delay (BSID MDI<80) 0.46 0.39 0.36 0.243 0.846 0.611
(0.04) (0.03) (0.08)
(10) Motor Delay (BSID PDI<80) 0.12 0.10 0.13 0.568 0.832 0.476
(0.023) (0.024) (0.055)
(11) Social-Emotional Problems(ASQ:SE>60) 0.25 0.28 0.32 0.414 0.286 0.957
(0.03) (0.03) (0.05)
Panel B. Household Characteristics
(1) Social security support recipient 0.28 0.25 0.29 0.852 0.895 0.910
(0.03) (0.03) (0.06)
(20 Mother at home 0.68 0.62 0.66 0.120 0.481 0.102
(0.04) (0.04) (0.06)
(3) Caregiver education ≥ 9 years 0.72 0.74 0.78 0.460 0.201 0.886
(0.03) (0.04) (0.04)
(4) Unfavourable perception of FPC 2.87 2.85 2.86 0.882 0.946 0.707
(0.06) (0.05) (0.09)
Panel C. Parental Inputs
(1) Told story to child yesterday 0.11 0.11 0.09 0.985 0.694 0.330
(0.02) (0.02) (0.04)
(2) Read book to child yesterday 0.05 0.04 0.02 0.859 0.404 0.350
(0.01) (0.01) (0.02)
(3) Sang song to child yesterday 0.37 0.35 0.46 0.653 0.400 0.082
(0.03) (0.04) (0.08)
(4) Played with child yesterday 0.33 0.34 0.38 0.952 0.296 0.756
(0.03) (0.03) (0.06)
(5) Number of books in household 1.60 1.89 2.30 0.599 0.148 0.179
(0.24) (0.29) (0.64)
P-values account for clustering within villages.
39

Table A3: Average Treatment Effects on Infant Skills, Parenting Skills and Parental Invest-ment of Non-treated Children in Treatment Villages (N=79)
Treatment effect
Point estimate Std. error
Infant Skill Factor 0.073 (0.108)
Parenting Skill Factor 0.083 (0.127)
Parental Investment Factor 0.076 (0.122)Note: In all regressions we control for strata (county) fixed effects, cohort fixed effects, previ-ous nutrition assignment status and baseline latent factors. All standard errors are clusteredat the village level. Significance levels are as follows: ∗ p < 0.1, ∗∗ p < 0.05, ∗∗∗ p < 0.01.
40

Table A4: Measurement System
Latent Factor Measurement factor loading % Signal
Infant Skill Factor at baseline
Bayley: Mental Development Index 1 0.56
Bayley: Psychomotor Development Index 0.61 0.22
ASQ: Social-Emotional Problems -0.46 0.10
Infant Skill Factor at follow-up
Age-Cohort 1 Bayley: Mental Development Index 1 0.29
Bayley: Psychomotor Development Index 0.94 0.35
ASQ: Social-Emotional Problems -0.54 0.06
Age-Cohort 2 Griffith: Performance 1 0.35
Griffith: Personal-Social 0.79 0.41
Griffith: Locomotor 0.94 0.50
Griffith: Eye-hand coordination 0.71 0.34
ASQ: Social-Emotional Problems -1.79 0.02
Parenting Skill Factor at baseline
Parent knows how to read stories to baby 1 0.45
Parent knows how to play with baby 1.19 0.64
Parent finds it important to read stories to baby 1.05 0.66
Parent finds it important to play with baby 1.17 0.83
Parent feels duty to help baby understand the world 1.39 0.79
Parent finds it difficult to communicate with baby 0.73 0.27
Parent feels nervous when caring for baby 0.50 0.17
Parenting Skill Factor at follow-up
Parent knows how to read stories to baby 1 0.45
Parent knows how to play with baby 0.57 0.19
Parent finds it important to read stories to baby 0.59 0.32
Parent finds it important to play with baby 0.30 0.13
Parent feels duty to help baby understand the world 0.23 0.09
Parent finds it difficult to communicate with baby -0.16 0.01
Parent feels nervous when caring for baby -0.22 0.03
Parental Investment Factor at baseline
Number of books in hh for reading to baby 1 0.18
Number of times per week family reads to baby 0.34 0.39
Number of times per week family sings to baby 0.47 0.42
Number of times per week family goes out with baby 0.36 0.18
number of times per day baby spends watching tv 0.19 0.05
Number of times per day baby plays by itself 0.34 0.04
Parental Investment Factor at follow-up
Number of books in hh for reading to baby 1 0.12
Number of times per week family reads to baby 0.38 0.51
Number of times per week family sings to baby 0.45 0.35
Number of times per week family goes out with baby 0.12 0.00
Number of times per day baby spends watching tv -0.07 0.00
Number of times per day baby plays by itself -0.08 0.00
Note: Table shows dedicated measurement system. For each measure factor loadings are shownas well as the fraction of the variance in each measure that is explained by the variance in signal.