from the descriptor collection till the indicator definition
TRANSCRIPT

Glass Eel thematic box 0Porto 6-7th ofJune 2006
Glass-Eel Thematic boxFrom the descriptor collection till
the indicator definition
Authors by alphabetic order:J.-C. Bouvet, N. Bru; M.-N de Casamajor; G. Castelnaud; S.
Dossou-Gbete et P. Prouzet

Glass Eel thematic box 0Porto 6-7th ofJune 2006
Descriptors are used to characterize, for a given biological stage, various contexts and features which will allow to define the indicators and to interpret them
Environmental and administrative contextsFishery contextBiological featuresAbundance Anthropogenic impacts

Glass Eel thematic box 0Porto 6-7th ofJune 2006
Environmental and administrativecontexts

Glass Eel thematic box 0Porto 6-7th ofJune 2006
Hydrodynamic and administrative contexts An example : The Adour river
NL-3 NL-1 NL+1NL+3 PQ-2 PQ PQ+2 PL-3 PL-1 PL+1 PL+3 DQ-2 DQ DQ+2LUNE
0
1
2
3
4
CPUE
Cm
oy
Moon phases and catches
0
2
4
6
8
10
12
14
16
18
01/11
/0106
/11/01
11/11
/0116
/11/01
21/11
/0126
/11/01
01/12
/0106
/12/01
11/12
/0116
/12/01
21/12
/0126
/12/01
31/12
/0105
/01/02
10/01
/0215
/01/02
20/01
/0225
/01/02
30/01
/0204
/02/02
09/02
/0214
/02/02
19/02
/0224
/02/02
01/03
/0206
/03/02
11/03
/0216
/03/02
21/03
/02
T°c
-4.00
-2.00
0.00
2.00
4.00
6.00
8.00
10.00
Diff
éren
tiel t
herm
ique
(°c)
T°c - mer T°c - estuaire Différentiel thermique
Thermal contrast
20
30
40
50
60
70
80
90
100
110
120
01/11
/1999
07/11
/1999
13/11
/1999
19/11
/1999
25/11
/1999
01/12
/1999
07/12
/1999
13/12
/1999
19/12
/1999
25/12
/1999
31/12
/1999
06/01
/2000
12/01
/2000
18/01
/2000
24/01
/2000
30/01
/2000
05/02
/2000
11/02
/2000
17/02
/2000
23/02
/2000
29/02
/2000
06/03
/2000
12/03
/2000
18/03
/2000
24/03
/2000
Saison 1999/2000
Coe
ffic
ient
de
mar
ée
0
200
400
600
800
1000
1200
1400
1600
1800
2000
Déb
it en
m3.
s-1
COEF DEBITS
Tide coefficient & flow rate
-1
-0.8
-0.6
-0.4
-0.2
0
0.2
0.4
0.6
0.8
1
0 5 10 15 20 25 30 35Km
vite
sse
m/s
t:2.0ht:4.0ht:6.0ht:8.0ht:10.0ht:12.0ht:14.0ht:16.0ht:18.0h
Bayonne Urt
PM : 7h09 - 19h30BM : 0h53 - 13h19
Dynamic front tide
Salinity front
012
012
3,14,15,16,17,28,29,2
7,5 8,5 9,5 10,5 11,5 12,5 13,5
10 15 20 25 30 35Salinity (g/l)
Temperature (°C)
W E
Dep
th(m
)
50
Freshwater
Seawater
Maritime zone
River zonePush sieves
Hand sieves
0
200
400
600
800
1000
1200
1400
1711
2411 51
2
1112
1912
2912 80
1
1601
2201
3001 50
2
1302
Dates campagne 1997/1998
Déb
its e
n m
3/s
0
20
40
60
80
100
120
140
160
180
200
NTU
Débits Turbidité
Turbidity and flow rate
Glass Eel thematic box 0Porto 6-7th ofJune 2006
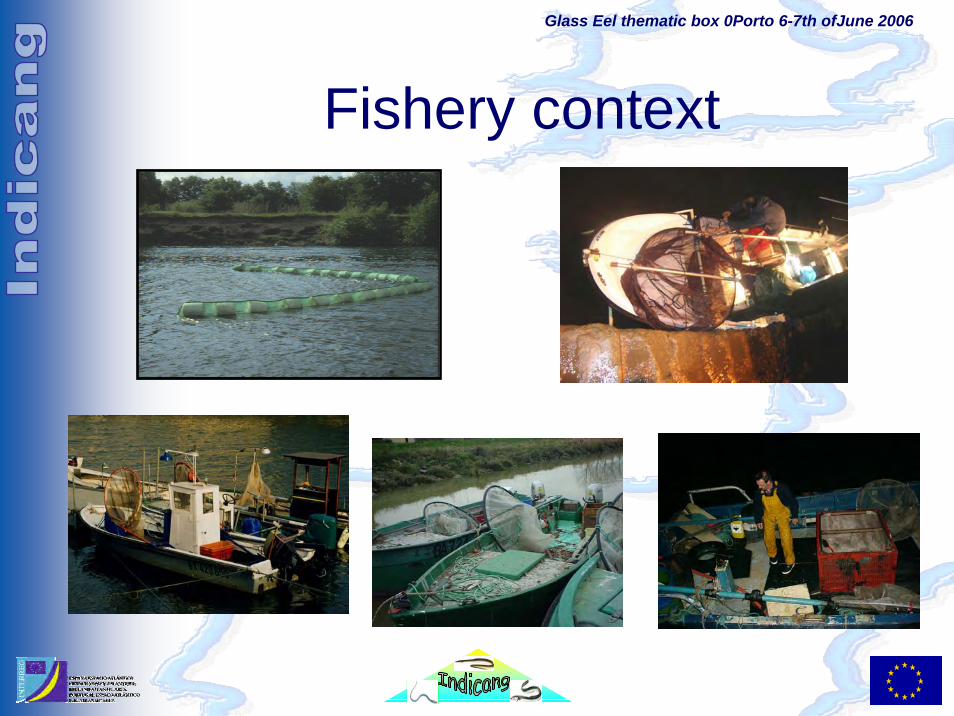
Fishery context

Glass Eel thematic box 0Porto 6-7th ofJune 2006
Descriptors and fisheries monitoring
The fishery descriptors and primary Socio Economic ones proceed from the fishing results, the fishing activity, and are linked to the fisheries monitoring systems which permit to collect the data; they are of 2 kinds:
1.Compulsory declaration ( logbook), from the whole population;2. if no existence, impossibility or for assessment:
Data obtained from a representative sample of professional fishermen ( equal to the cooperative sample used by Cemagrefsystem) ;
The (sophisticated) Socio-Economic Descriptors (SED) are coming from the Fishing enterprise (production factor = workers,vessels, gears and facilities) and from the market (trading, purchases); they involve socio-economic surveys.

Glass Eel thematic box 0Porto 6-7th ofJune 2006Fishery and Socio-Economic (primary) Descriptors
Fisheries statisticsSED and FD
Socio-economicobjective
Biologicalobjective
The aim is to collect descriptors in order to : estimate, under some requirements, the abundance of the species ; estimate the viability of the fishing enterprises ;provide information on biological processes ;compare the fisheries among catchments ;

Glass Eel thematic box 0Porto 6-7th ofJune 2006
Descriptors of fishing pressure (I) performance and economic viability (II)
Ratio per season between (examples):1) number of fishermen (by category and all categories)/ Total surface basin 2) production (idem)/ Colonized surf. by Glass eel 3) total surf. Scoop net/ Surf. technically fishableRatio per season between (examples):1) total turn over of the glass eel fisheries/ total turn over of the eel fisheries)2) total turn over of the glass eel fisheries / Total t.o. all species3) total turn over of the glass eel fisheries / Nber of fishermen 4) total turn over of the glass eel fisheries / Surf. technically fishable.
(I)
(II)

Glass Eel thematic box 0Porto 6-7th ofJune 2006
From rough to accurate: fishery Descriptors
- Capture: weight in kg for glass eel;
- Effort: season, Nber of fishermen, Nber of fishing days, Nber of gears, tot. surface of straining, tot. filtered volume (units: 1 fisherman-season, 1 day-fisherman, 1 gear, m2, m3 );
- CPUE: weight / season, weight / group of fishermen, weight / fishermen, weight / fishing day, weight / gear, weight / m2, weight/ m3 ….
They lead to recruitment index recruitment estimation(associated to scientific fishing experiments)
They need: historical seriesdata of good quality
Only possible in catchments where exploitation existsProblem of data availability and reliability
Glass Eel thematic box 0Porto 6-7th ofJune 2006
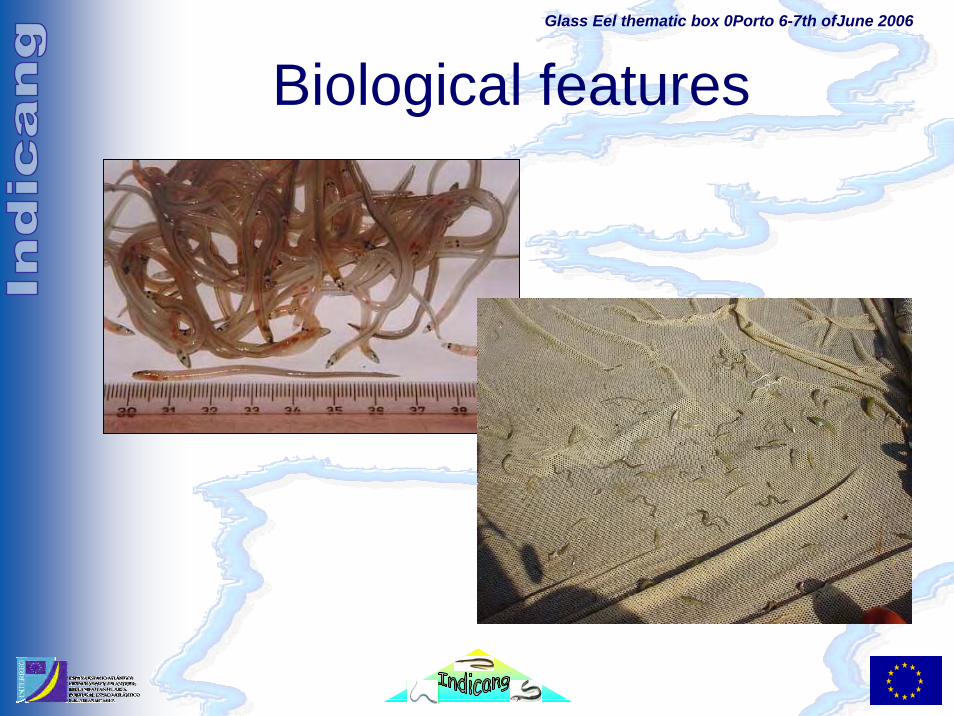
Biological features

Glass Eel thematic box 0Porto 6-7th ofJune 2006
Biological descriptorsLength (mm)
Weight (mg)
Pigmentation stage(Document de référence: Elie et al., 1982 ; Grellier et al., 1991)
Glass eel biometric descriptors
Validation of sampling protocol

Glass Eel thematic box 0Porto 6-7th ofJune 2006
Glass eel biometric descriptors
• Sampling conditionsHydrography locationTemporal frequencyPeriodicity of sampling Recommendation for
validation of descriptors
Each yearMonthly (New Moon)
50 individuals (minimum)Temperature + Salinity
Dynamic and salinity tide area• Quantity of individuals
Number of individualsMini 50 – if possible 100(according to the homogeneity of pigmentation stage in the sample)
• Environmental conditionsTemperatureSalinityTurbidity

Glass Eel thematic box 0Porto 6-7th ofJune 2006
Glass eel biometric indicatorsDistribution of the pigmentation stages
on two rivers
Isle
VB94%
VA6%
Loire

Glass Eel thematic box 0Porto 6-7th ofJune 2006
Example
Adour
Glass eel biometric indicatorsCondition factor of glass eel (w/alb)
Length – Weight
Monthly samplingOn new moon

Glass Eel thematic box 0Porto 6-7th ofJune 2006
How to determinate the glass eel abundance and its variation ?
0
20
40
60
80
100
120
140
01/1
1/19
98
08/1
1/19
98
15/1
1/19
98
22/1
1/19
98
29/1
1/19
98
06/1
2/19
98
13/1
2/19
98
20/1
2/19
98
27/1
2/19
98
03/0
1/19
99
10/0
1/19
99
17/0
1/19
99
24/0
1/19
99
31/0
1/19
99
07/0
2/19
99
14/0
2/19
99
21/0
2/19
99
28/0
2/19
99
07/0
3/19
99
14/0
3/19
99
21/0
3/19
99
Poid
s tot
al c
aptu
ré p
ar jo
ur (K
g)
Tamis à main Tamis poussé
Nov Dec Jan Feb1999 2000
500
1000
1500
2000
2500
3000
3500
4000
4500
5000
*
* ****
*
*
*
Biomasse estimée sur certains joursBiomasse extrapolée sur la saisonBiomasse observée

Glass Eel thematic box 0Porto 6-7th ofJune 2006
From catches to abundanceCatch equation :Catch quantity equals to the product of q by effort intensity and bythe ratio of glass eel abundance on the size in space and time of the dispersion area.
So the catch per unit effort is proportional to the density of glass eel and proportional to abundance if the dispersion area remains the same from one year to another.
ANfqC ×Δ×=Δ
AN
fC q ×=Δ
Δ
0
1 000
2 000
3 000
4 000
5 000
6 000
7 000
8 000
9 000
10 000
1988 1989 1990 1991 1992 1993 1994 1995 1996 1997 1998 1999 2000 2001
Cap
ture
s (kg
)
0 .0
0.5
1.0
1.5
2.0
2.5
3.0
3.5
4.0
4.5
5.0
kg / sortie
kg kg/sortie tamis kg/sortie pibalour

Glass Eel thematic box 0Porto 6-7th ofJune 2006Relevant descriptors for biomass
Two possibilities :
Computation and measurement system :
Ideal !!
More realistics…
Type of data collection
Calculated Observed
Exhaustive Number
Partial Glass eel density Number
• Glass eel fish ladders• Special fisheries
(below dams…)
• Section of fishing gears• Time span by fishing• Speed of filtration
Professional fishery statisticsScientific sampling surveys

Glass Eel thematic box 0Porto 6-7th ofJune 2006
Estimates of Glass eel density :Some examples of sampling protocol
El Minho (Portugal) The Adour river (France)
Professional catches Scientific sampling surveys
Tamis poussés (points d’échantillon--nage)
Fond
Surface
RDMRG
Aval
Courant
S1 S2 S3S4 S5 S6
Rive gauche Milieu Rive droite
Transect
S1,.. Compartiments
Tamis poussés (points d’échantillon--nage)
Fond
Surface
RDMRG
Aval
Courant
S1 S2 S3S4 S5 S6
Rive gauche Milieu Rive droite
Transect
S1,.. Compartiments

Glass Eel thematic box 0Porto 6-7th ofJune 2006
Vilaine River (France) Glass eel fish ladders
Professional catches below dam(strong catchability)
Glass eel counts :Some examples of sampling protocol
Counts through glass eel ladders

Glass Eel thematic box 0Porto 6-7th ofJune 2006
From glass eel density : From glass eel counts :
Computation of some biomass indicators
densitydensity ×× waterwater volume of volume of spreadingspreading
Sum Sum of of countscounts
i. Glass eel migratory behaviourii. Known hydroclimatic parametersiii. In a fixed part of the water colum :
be able to compute glass eel densities
Basic mathematical principle Basic mathematical principle
i. How to compute the part of the glass eel run coming through the glass eel fish ladders ?
Underlying constraints Underlying constraints
Absolute indicator of biomassVia observed
descriptorsVia calculated
descriptors

Glass Eel thematic box 0Porto 6-7th ofJune 2006Computations of glass eel biomass indicator : To estimate the fishery impact
01/11/1998 27/11/1998 24/12/1998 19/01/1999 15/02/1999
Date (jrs)
0
500
1000
1500
2000
Bio
mas
se jo
urna
lière
(kg)
0
200
400
600
Cap
ture
s pr
ofes
sion
nelle
s (k
g)
31/10/1999 30/11/1999 30/12/1999 29/01/2000 28/02/2000
Date (jrs)
0
1000
2000
3000
Bio
mas
se jo
urna
lière
(kg)
0
200
400
600
800
Cap
ture
pro
fess
ionn
elle
(kg)
01/11/2000 27/11/2000 24/12/2000 19/01/2001 15/02/2001
Date (jrs)
0
200
400
600
800
Bio
mas
se jo
urna
lière
(kg)
0
100
200
300
400
Cap
ture
s pr
ofes
sion
nelle
s (k
g)
Biomasse estiméeBiomasse estimée (lissage)Biomasse calculéeCaptures prof.

Glass Eel thematic box 0Porto 6-7th ofJune 2006
Rate of exploitation some examples for the Adour river
Fishing season 1998-1999Total catches = 1,65 tonsSeasonal rate of exploitation = 10,1% [6,5 – 17,1%]Mean daily rate of exploitation = 11,8% [6,5 – 17,1%] Seasonal biomass = 16,4 tons [14,9 – 17,8]Fishing season 1998-1999Total catches = 4,58 tonsSeasonal rate of exploitation = 7,8% [7,4 – 8,1%]Mean daily rate of exploitation = 12,1% [8,8 – 15,3%] Seasonal biomass = 59,2 tons [56,7 – 61,6]Fishing season 1998-1999Total catches = 1,45 tonsSeasonal rate of exploitation = 22,9% [19,4 – 25,5%]Mean daily rate of exploitation = 23,2% [17,2 – 29,2%] Seasonal biomass = 6,6 tons [5,7 – 7,5]

Glass Eel thematic box 0Porto 6-7th ofJune 2006
Thank You