fsa of mtm
TRANSCRIPT
8/8/2019 FSA of MTM
http://slidepdf.com/reader/full/fsa-of-mtm 1/27
Financial statement analysis of Financial statement analysis of
MTMMTM
Presented to:
SIR HAMZA MUKHTAR.Presented by:
y Muhammad Aamir (2006-ag-3498)
y
Zahid Farid (2008-ag-153)

8/8/2019 FSA of MTM
http://slidepdf.com/reader/full/fsa-of-mtm 2/27
Brief IntroductionBrief Introduction
Founded 1994
Founder M.Nazir Ahmad
Key people Mr.shahid Nazir &Mr Muhammad Nawaz Tishna
Industry Textile
Products Fabric, yarn,
loungewear,activewear,sleepwear,athletic,sportswear,et
c etc
Registered office West canal road, Faisalabad
Area served World wide
Web site www.masoodtextile.com

8/8/2019 FSA of MTM
http://slidepdf.com/reader/full/fsa-of-mtm 3/27
DIVISONS OF MTMDIVISONS OF MTM
y Spinning
y Knitting
y Fabric Dying Mills MTM Divisions
y Processing
y Laundry
y Cutting
y Stitching
y Finishing Apparel Division
y Packing
y Shipping
8/8/2019 FSA of MTM
http://slidepdf.com/reader/full/fsa-of-mtm 4/27
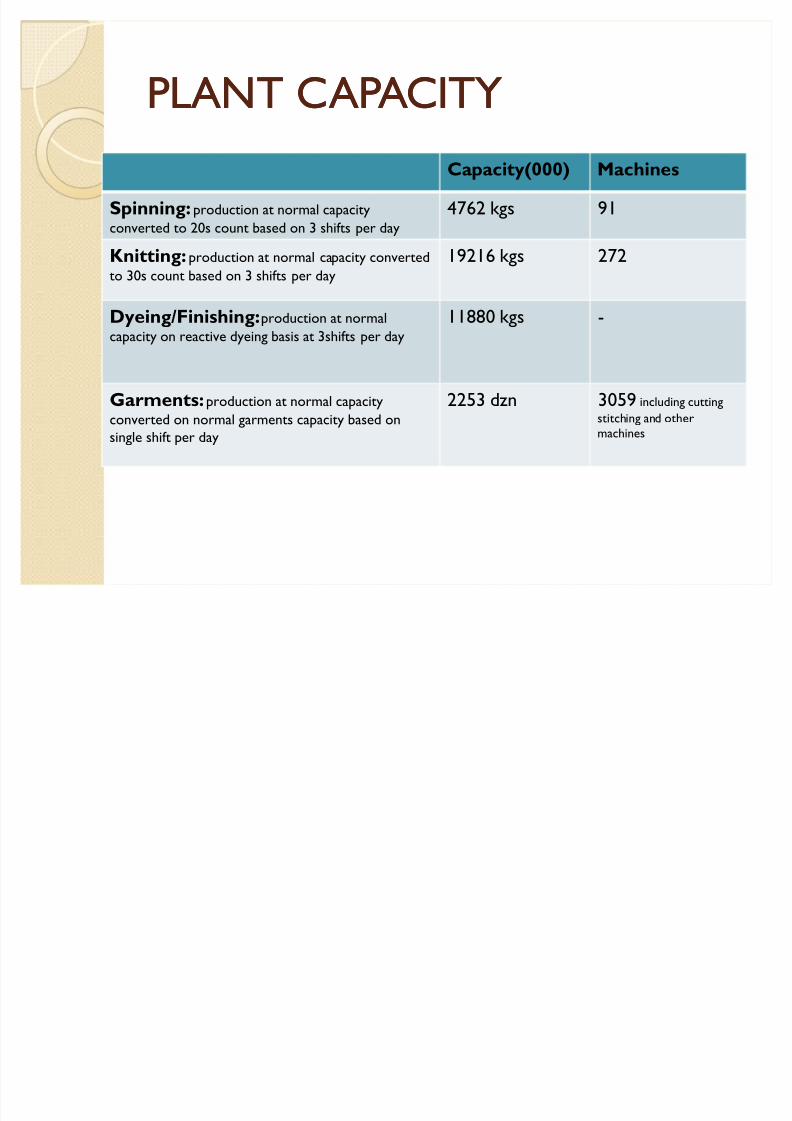
PLANT CAPACITYPLANT CAPACITY
Capacity(000) Machines
Spinning: production at normal capacity
converted to 20s count based on 3 shifts per day
4762 kgs 91
Knitting: production at normal capacity converted
to 30s count based on 3 shifts per day
19216 kgs 272
Dyeing/Finishing:production at normal
capacity on reactive dyeing basis at 3shifts per day
11880 kgs -
Garments:production at normal capacity
converted on normal garments capacity based onsingle shift per day
2253 dzn 3059 including cutting
stitching and othermachines
8/8/2019 FSA of MTM
http://slidepdf.com/reader/full/fsa-of-mtm 5/27
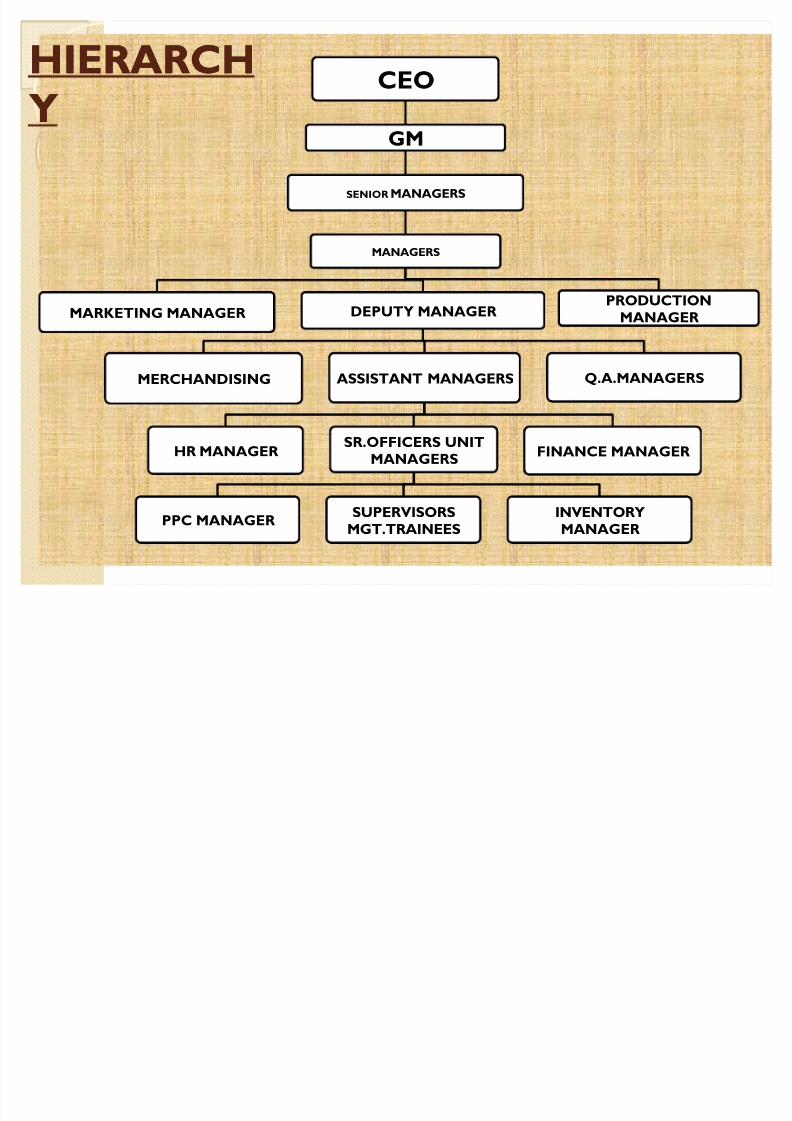
CEO
GM
SENIOR MANAGERS
MANAGERS
PRODUCTION
MANAGERDEPUTY MANAGER
Q.A.MANAGERSASSISTANT MANAGERS
FINANCE MANAGERSR.OFFICERS UNIT
MANAGERS
INVENTORY
MANAGER
SUPERVISORS
MGT.TRAINEESPPC MANAGER
HR MANAGER
MERCHANDISING
MARKETING MANAGER
HIERARCHHIERARCH
YY
8/8/2019 FSA of MTM
http://slidepdf.com/reader/full/fsa-of-mtm 6/27
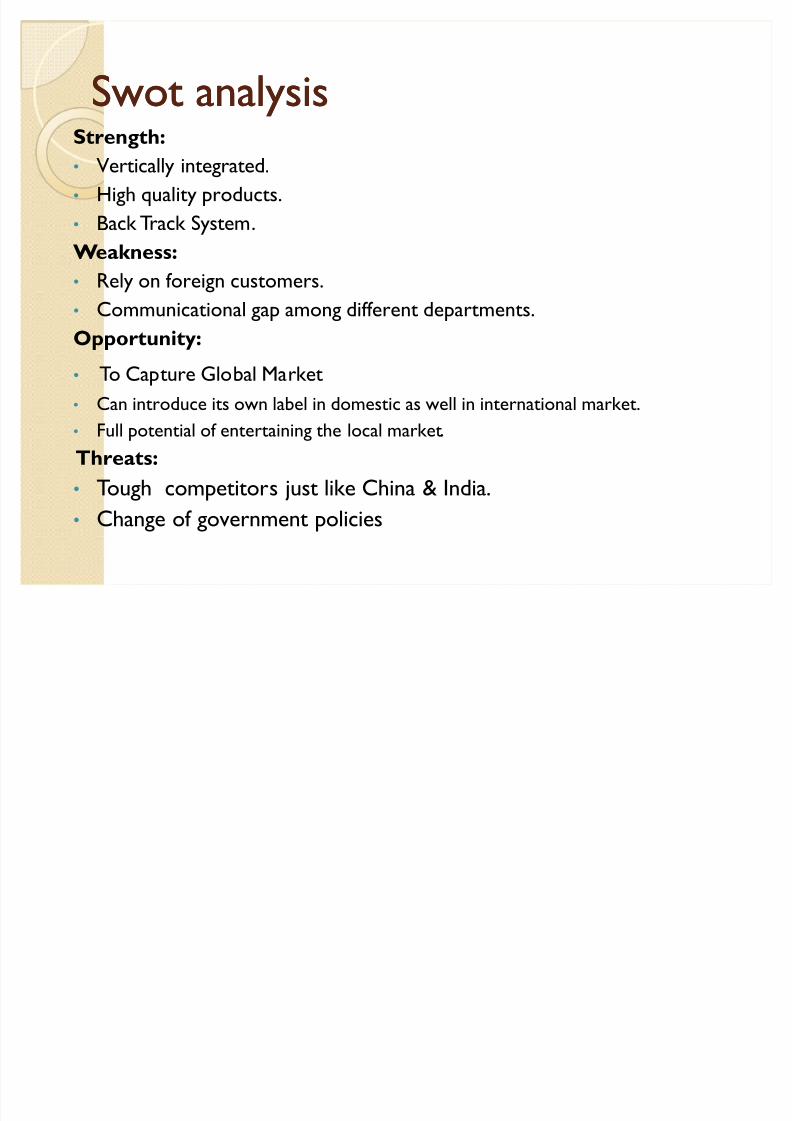
Swot analysisSwot analysisStrength: Vertically integrated.
High quality products.
Back Track System.
Weakness:
Rely on foreign customers. Communicational gap among different departments.
Opportunity:
To Capture Global Market
Can introduce its own label in domestic as well in international market.
Full potential of entertaining the local market.
Threats:
Tough competitors just like China & India.
Change of government policies

8/8/2019 FSA of MTM
http://slidepdf.com/reader/full/fsa-of-mtm 7/27
Economy analysisEconomy analysis
Inflation
Discount rate
Exchange rates parity
8/8/2019 FSA of MTM
http://slidepdf.com/reader/full/fsa-of-mtm 8/27
Economy analysisEconomy analysis
Inflation
rates and changes in inflation has been studied and compared theeffects in different ways
effect of such inflation on CGS & Sales price.
Low product demand customer will move towards other courtiers.
competitors will improve and grows up.( India man to machine ratio goes
down)to cop up the inflation cost quality have to sacrifice.
Govt. while to control inflation tightened the monetary policy. by last 3years.
8/8/2019 FSA of MTM
http://slidepdf.com/reader/full/fsa-of-mtm 9/27
Exchange rate
y Foreign currency rate plays an important role while the foreign incomeconverted into national currency
y if any firm or industry is dealing with international market then it has to
face the day to day change in currency rates.
y higher the $ price higher the cost of import of raw material or payment of foreign debts.
y Today $ price is trading at peak Rs.84.10.(07-12-2009)

8/8/2019 FSA of MTM
http://slidepdf.com/reader/full/fsa-of-mtm 10/27
Discount rate
y Discount rate has been studied and observed through out the
analysis during different time periods because it has positiverelation with cost of financing
y Effect of discount rates during periods are observed according tothe borrowing in short

8/8/2019 FSA of MTM
http://slidepdf.com/reader/full/fsa-of-mtm 11/27

8/8/2019 FSA of MTM
http://slidepdf.com/reader/full/fsa-of-mtm 12/27
y GDP growth.y Textile sector's contribution to total GDP is 8.5%.
Real GDP growth rate
4.50%
5.50%6.10%
6.60%6.60%
5.30%
2.70%
0.00%
1.00%
2.00%
3.00%
4.00%
5.00%
6.00%
7.00%
2 0 0 3
2 0 0 4
2 0 0 5
2 0 0 6
2 0 0 7
2 0 0 8
2 0 0 9
GDP

8/8/2019 FSA of MTM
http://slidepdf.com/reader/full/fsa-of-mtm 13/27
Rules and regulations.
y Govt. to discourage the export of yarn has imposed the 5%duty
y Due to export cotton/40kg price high Rs.4708(04-12-09)y rebate on export is 2.5%
y compensation on R&D is 6% to encourage the export.
8/8/2019 FSA of MTM
http://slidepdf.com/reader/full/fsa-of-mtm 14/27
Competition
There is very low competition for MTM in Pakistanalthough in eastern group as India and somehow
china. China has closed its spinning sector (yarn making)&India is going to close till end2010..
So they will be new yarn importer customer of
Pakistan
8/8/2019 FSA of MTM
http://slidepdf.com/reader/full/fsa-of-mtm 15/27
FIRM ANALYSISFIRM ANALYSIS
SponsorsAllied bank, MCB, Habib Bank, HB ag Zurich, UBL
,PICIC Major sponsor bank is HBL
Net Worth (2008)=Total assets ²Total liabilities
=Rs82,34,421,000-60,38,810,000
=Rs.21,95,611,000
Family based business
Political family background
8/8/2019 FSA of MTM
http://slidepdf.com/reader/full/fsa-of-mtm 16/27
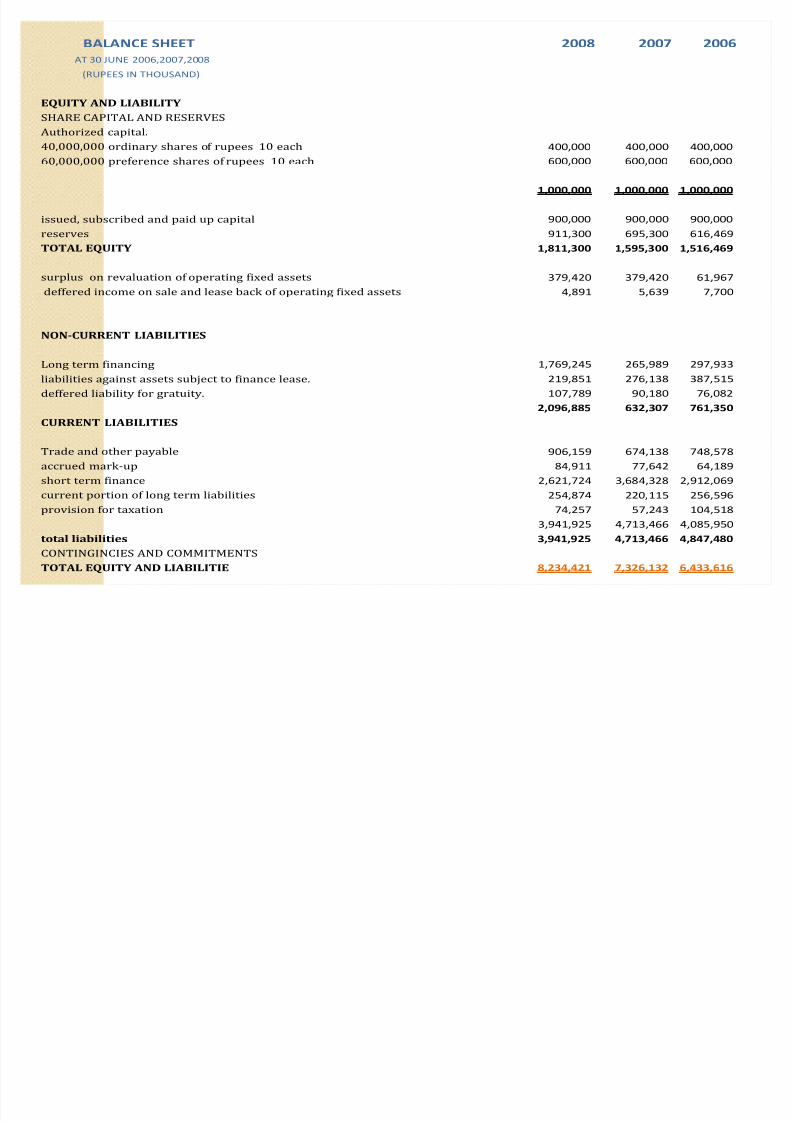
BALANCE SHEET 2008 2007 2006
AT 30 JUNE 2006,2007,2008
(RUPEES IN THOUSAND)
EQUITY AND LIABILITY
SHARE CAPITAL AND RESERVES
Authorized capital.
40,000,000 ordinary shares of rupees 10 each 400,000 400,000 400,000
60,000,000 preference shares of rupees 10 each 600,000 600,000 600,000
1,000,000 1,000,000 1,000,000
issued, subscribed and paid up capital 900,000 900,000 900,000
reserves 911,300 695,300 616,469
TOTAL EQUITY 1,811,300 1,595,300 1,516,469
surplus on revaluation of operating fixed assets 379,420 379,420 61,967deffered income on sale and lease back of operating fixed assets 4,891 5,639 7,700
NON-CURRENT LIABILITIES
Long term financing 1,769,245 265,989 297,933
liabilities against assets subject to finance lease. 219,851 276,138 387,515
deffered liability for gratuity. 107,789 90,180 76,082
2,096,885 632,307 761,350
CURRENT LIABILITIES
Trade and other payable 906,159 674,138 748,578
accrued mark-up 84,911 77,642 64,189
short term finance 2,621,724 3,684,328 2,912,069
current portion of long term liabilities 254,874 220,115 256,596
provision for taxation 74,257 57,243 104,518
3,941,925 4,713,466 4,085,950
total liabilities 3,941,925 4,713,466 4,847,480
CONTINGINCIES AND COMMITMENTSTOTAL EQUITY AND LIABILITIE 8,234,421 7,326,132 6,433,616
8/8/2019 FSA of MTM
http://slidepdf.com/reader/full/fsa-of-mtm 17/27
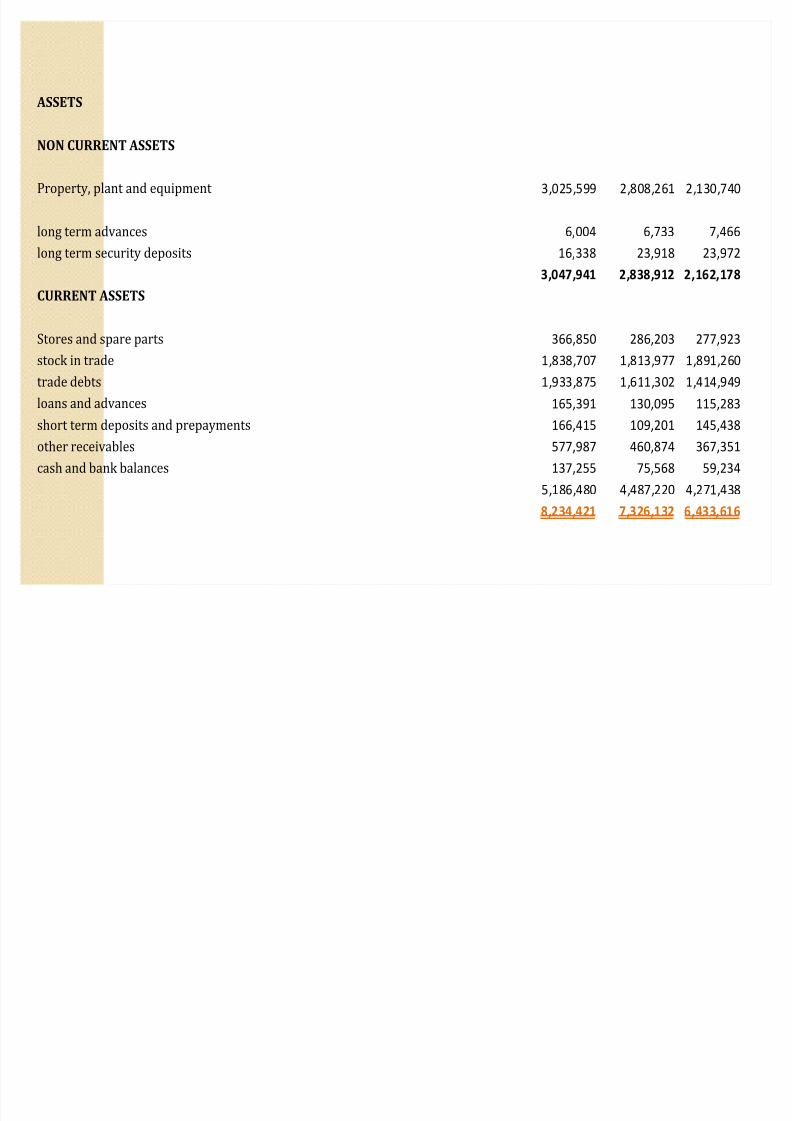
ASSETS
NON CURRENT ASSETS
Property, plant and equipment 3,025,599 2,808,261 2,130,740
long term advances 6,004 6,733 7,466
long term security deposits 16,338 23,918 23,972
3,047,941 2,838,912 2,162,178CURRENT ASSETS
Stores and spare parts 366,850 286,203 277,923
stock in trade 1,838,707 1,813,977 1,891,260
trade debts 1,933,875 1,611,302 1,414,949
loans and advances 165,391 130,095 115,283
short term deposits and prepayments 166,415 109,201 145,438
other receivables 577,987 460,874 367,351
cash and bank balances 137,255 75,568 59,234
5,186,480 4,487,220 4,271,438
8,234,421 7,326,132 6,433,616

8/8/2019 FSA of MTM
http://slidepdf.com/reader/full/fsa-of-mtm 18/27
PROFIT AND LOSS ACCOUNT 2008 2007 2006
FOR THE YEAR ENDEDAT 30 JUNE 2006,2007,2008
(RUPEES IN THOUSAND)
Sa 7,884,785 5, 50,366 4,899, 90
Co of Goo So 6,428,798 4,963, 90 4,000,910
GROSS PROFIT 1,455,987 987,176 898,280
DISTRIBUTION AND SELLING COSTS 348,281 222,101 245,922
ADMINISTRATIVE AND GENERAL EXPENSES 139,577 132,967 123,812
OTHER OPERATING EXPENSES 29,855 31,586 13,766
517,713 600,522 514,780
OTHER OPERATING INCOME 8,700 6,887 2,778
OPERATING PROFIT 946,974 607,409 517,558
FINANCE COST 538,964 416,657 335,266
PROFIT BEFORE TAXATION 408,010 190,752 182,292
PROVISION FOR TAXATION 74,257 57,243 52,329
PROFIT AFT R TAX 333,753 133,509 129,963

8/8/2019 FSA of MTM
http://slidepdf.com/reader/full/fsa-of-mtm 19/27
Net Worth of the companyNet Worth of the company
Net Worth (2008)=Total assets ²Total
liabilities
=Rs82,34,421,000-60,38,810,000
=Rs.21,95,611,000

8/8/2019 FSA of MTM
http://slidepdf.com/reader/full/fsa-of-mtm 20/27
ANALYSIS OF BALANCE SHEET ITEMS
2,008 2,007 2,008 2,007 2,006
100 100 4.86 5.46 6.22
100 100 7.29 8.19 9.33
100 100
100 100 10.93 12.28 13.99
131 113 11.07 9.49 9.58
114 105 22.00 21.78 23.57
100 612 4.61 5.18 0.96
87 73 0.06 0.08 0.12
665 89 21.49 3.63 4.63
80 71 2.67 3.77 6.02
120 119 1.31 1.23 1.18
332 83 25.46 8.63 11.83
134 90 11.00 9.20 11.64
109 121 1.03 1.06 1.00
71 127 31.84 50.29 45.26
116 86 3.10 3.00 3.99
130 55 0.90 0.78 1.62
84 115 47.87 64.34 63.51
84 97 47.87 64.34 75.35
112 114 100.00 100.00 100.00
COMMON SIZEINDEX ANALYSISBALANCE SHEET
AT 30 JUNE 2006 2007 2008
(RUPEES INTHOUSAND)
EQUITY AND LIABILITY
SHARE CAPITAL AND RESERVES
Authorized capital.
40,000,000 ordinary shares of rupees 10 each
60,000,000 preference shares of rupees 10 each
issued, subscribed and paid up capital
reserves
TOTAL EQUITY
surplus on revaluation of operating fixed assets
deffered income on sale and lease back of operating fixed assets
NON-CURRENT LIABILITIES
Long term financing
liabilities against assets subject to finance lease.
deffered liability for gratuity.
CURRENT LIABILITIES
Trade and other payable
accrued mark-up
short term finance
current portion of long term liabilities
provision for taxation
total liabilities
CONTINGINCIES AND COMMITMENTS
TOTAL EQUITY AND LIABILITIES

8/8/2019 FSA of MTM
http://slidepdf.com/reader/full/fsa-of-mtm 21/27
108 132 36.74 38.33 33.12
89 90 0.07 0.09 0.12
68 100 0.20 0.33 0.37
107 131 37.01 38.75 33.61
128 103 4.46 4.81 4.32
101 96 22.33 24.76 29.40
120 114 23.49 21.99 21.99
127 113 2.01 1.78 1.79
152 75 2.02 1.49 2.26
125 125 7.02 6.29 5.71
182 128 1.67 1.03 0.92
116 105 62.99 61.25 66.39
100.00 100.00 100.00
ASSETS
NON CURRENT ASSETS
Property, plant and equipment
long term advances
long term security deposits
CURRENT ASSETS
tores and spare parts
stock in trade
trade debts
loans and advances
short term deposits and prepayments
other receivables
cash and bank balances
TOTAL ASSETS

8/8/2019 FSA of MTM
http://slidepdf.com/reader/full/fsa-of-mtm 22/27
132.51 121.46 100.00 100.00 100.00
129.53 124.05 81.53 83.41 81.66
147.49 109.90 18.47 16.59 18.34
156.81 90.31 4.42 3.73 5.02
104.97 107.39 1.77 2.23 2.53
94.52 229.45 0.38 0.53 0.28
86.21 116.66 6.57 10.09 10.51
126.32 247.91 0.11 0.12 0.06
155.90 117.36 12.01 10.21 10.56
129.35 124.28 6.84 7.00 6.84
213.90 104.64 5.17 3.21 3.72
129.72 109.39 0.94 0.96 1.07
249.99 102.73 4.23 2.24 2.65
250.11 102.77 0.00 0.00 0.00
278.28 110.91 0.00 0.00 0.00
Sales
Cost of Goods Sold
GROSS PROFIT
DISTRIBUTION AND SELLING COSTS
ADMINISTRATIVE AND GENERAL EXPENSES
OTHER OPERATING EXPENSES
OTHER OPERATING INCOME
OPERATING PROFIT
FINANCE COST
PROFIT BEFORE TAXATION
PROVISION FOR TAXATION
PROFIT AFTER TAX
EARNING PER SHARE-BASIC
DILUTED
ANALYSIS OF INCOME STATEMENT ITEMS
8/8/2019 FSA of MTM
http://slidepdf.com/reader/full/fsa-of-mtm 23/27
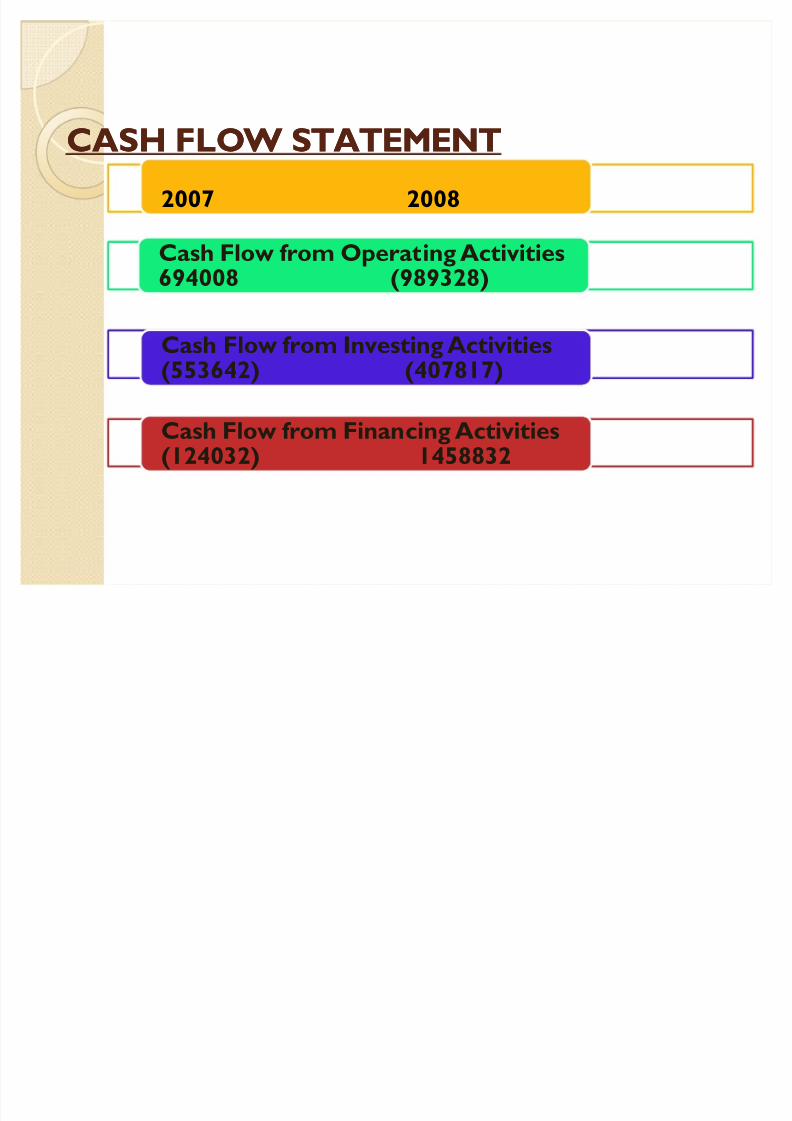
CASH FLO W STATEMENTCASH FLO W STATEMENT
2007 2008
Cash Flow from Operating Activities
694008 (989328)
Cash Flow from Investing Activities(553642) (407817)
Cash Flow from Financing Activities(124032) 1458832

8/8/2019 FSA of MTM
http://slidepdf.com/reader/full/fsa-of-mtm 24/27
LIQUID RATIOSRANA
TEXTILE
MASOO
D
AHSA
N
OLYMPI
A
Current Ratio RATIO 1.65 3.93 1.36 1.43
Quick Ratio Or Acid Test Ratio RATIO .74 1.27 .59 .69
LEVERAGE RATIOS
Debt To Total Assets Ratio RATIO .48 .52 .46
Debt To Equity Ratio RATIO 35.67 83.93 25.61 63.69
ACTIVITY RATIOS
Receivable Turnover Ratio RATIO 2.34 3.92 3.54 3.87
Receivable Turnover In Days/(Average Collection Period) DAYS 75 63 95 88
Inventory Turnover Ratio (IT) TIME 3.24 4.24 3.10 2.66
Inventory Turnover In Days (ITD) DAYS 85 96 69 57
(Time Interest EarnedCOVERAGE RATIOS
Ratio)RATIO 53.57 93.38 65.78 48.75
PROFITABILITY RATIOS
(IN TERM OF SALES)
PROFITABILITY
RATIOS
)TERM OF SALES(IN
Gross Profit Margin % Age 2.48 3.31 2.10 2.23
Net Profit Margin % Age 1.28 1.74 1.18 1.63
PROFITABILITY RATIOS
(IN TERM OF INVESTMENT)
Return On Assets % Age 1.75 4.35 1.65 1.69
Return On Equity (ROE) % Age 1.02 1.74 1.36 1.65
8/8/2019 FSA of MTM
http://slidepdf.com/reader/full/fsa-of-mtm 25/27
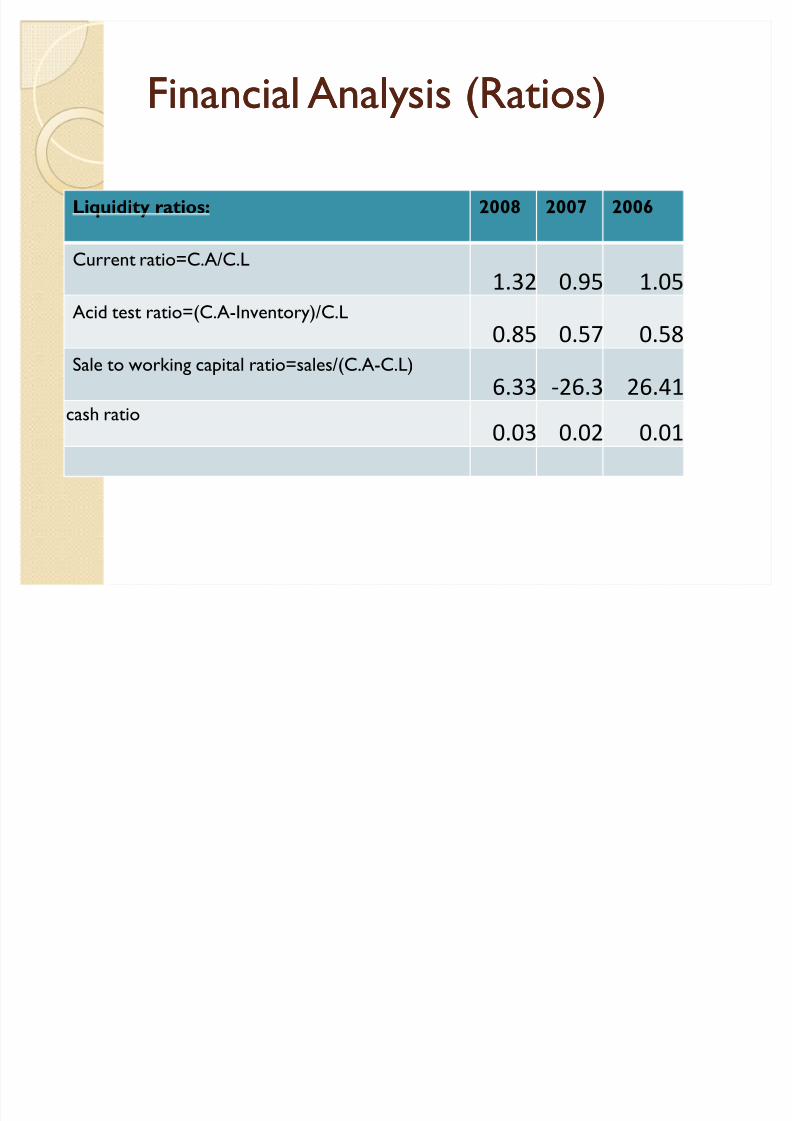
Financial Analysis (Ratios)Financial Analysis (Ratios)
Liquidity ratios: 2008 2007 2006
Current ratio=C.A/C.L
1.32 0.95 1.05
Acid test ratio=(C.A-Inventory)/C.L
0.85 0.57 0.58
Sale to working capital ratio=sales/(C.A-C.L)
6.33 -26.3 26.41
cash ratio0.03 0.02 0.01
8/8/2019 FSA of MTM
http://slidepdf.com/reader/full/fsa-of-mtm 26/27
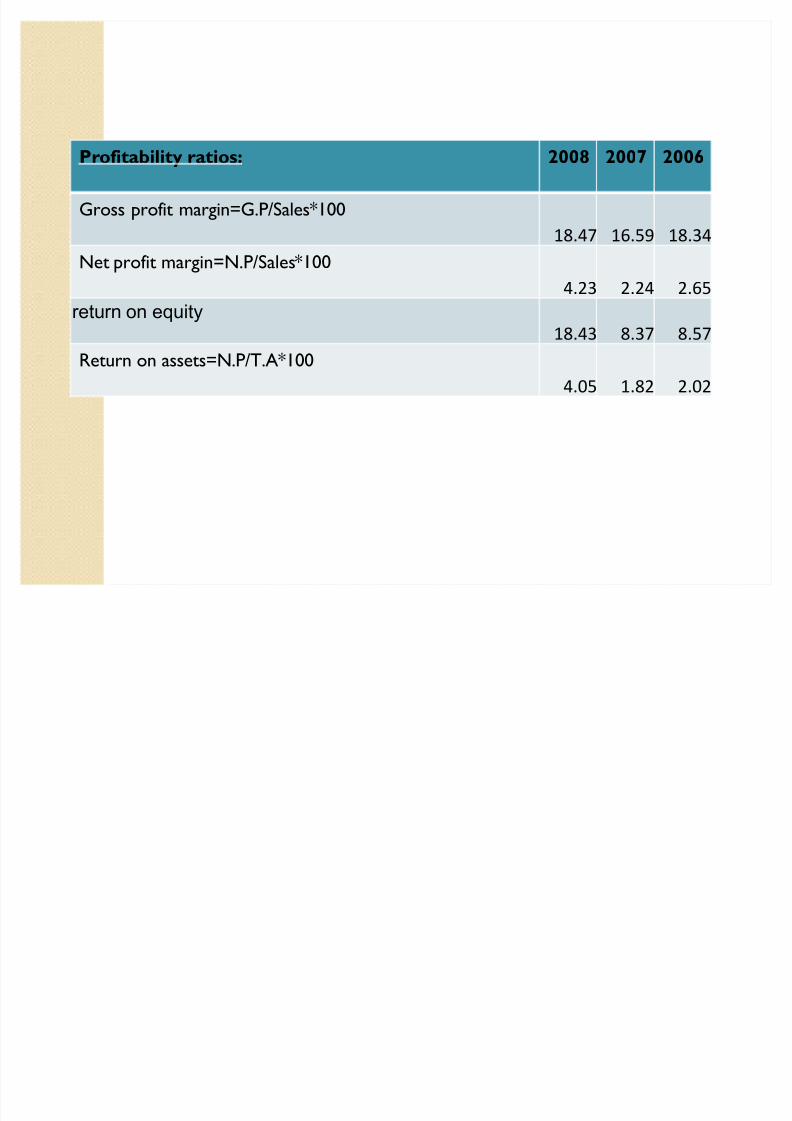
Profitability ratios: 2008 2007 2006
Gross profit margin=G.P/Sales*100
18.47 16.59 18.34
Net profit margin=N.P/Sales*100
4.23 2.24 2.65
r eturn on equity18.43 8.37 8.57
Return on assets=N.P/T.A*100
4.05 1.82 2.02

8/8/2019 FSA of MTM
http://slidepdf.com/reader/full/fsa-of-mtm 27/27
Activity ratios: 2008 2007 2006
fix assets turnover 2.60 2.09 2.26
Total assets turnover 0.95 0.82 0.77
Account receivable turnover 3.80 3.08 2.74
A\R turnover in days 94.4 116.8 131.4
Inventory turnover 3.52 2.67 2.15
Inventory turnover in days 102.27 134.83 167.26