full spectrum mode - kruve lab
TRANSCRIPT


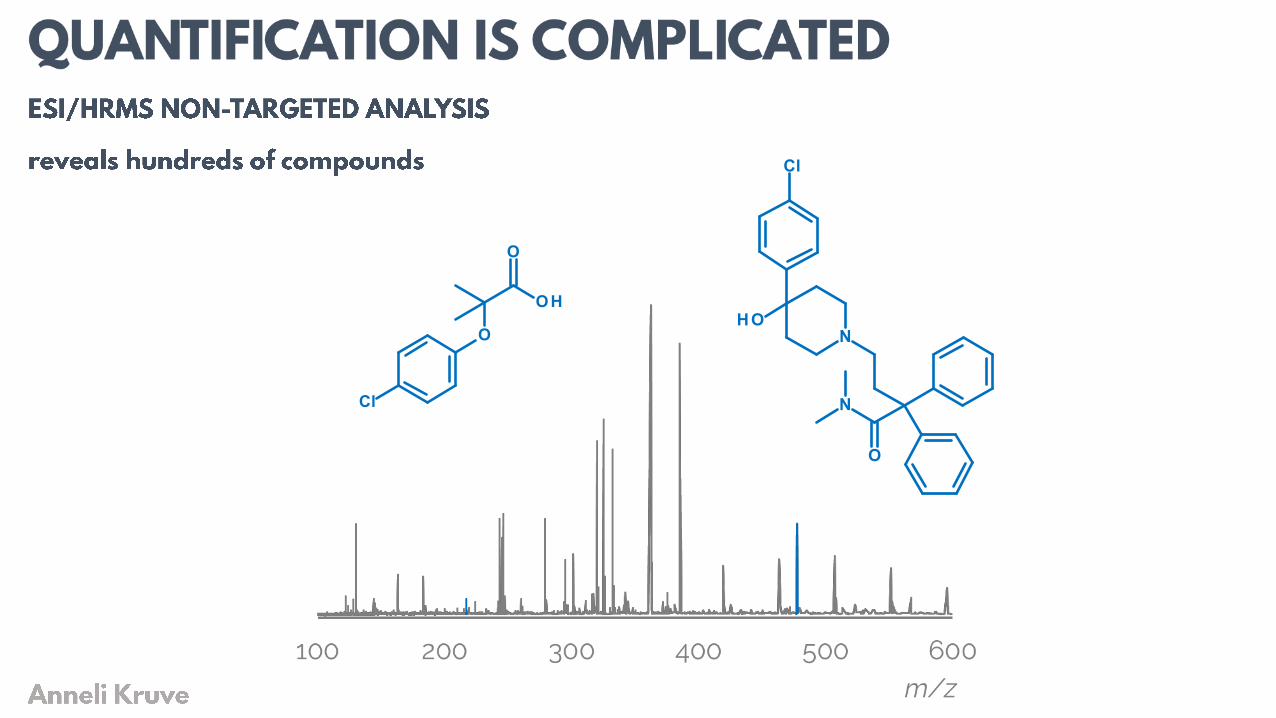
FULL SPECTRUM MODE

FULL SPECTRUM MODE


Level 5: Exact mass of interest133.0640 MS

Level 4: Unequivocal molecular formula
Level 5: Exact mass of interest
C7H7N3
133.0640
MS isotope/adduct
MS

Level 3: Tentative candidate(s)structure, substituent, class
Level 4: Unequivocal molecular formula
Level 5: Exact mass of interest
C7H7N3
133.0640
MS, MS2, Exp. data
MS isotope/adduct
MS


AC50 (µM) NA 0.27 NA 12.82 NA


0.E+00
5.E+06
1.E+07
2.E+07
2.E+07
3.E+07
3.E+07
4.E+07
0.E+00 2.E-05 4.E-05 6.E-05 8.E-05
Sig
nal
c (M)
0.E+00
2.E+07
4.E+07
6.E+07
8.E+07
1.E+08
1.E+08
1.E+08
2.E+08
2.E+08
2.E+08
0.E+00 5.E-06 1.E-05 2.E-05 2.E-05 3.E-05
Sig
nal
c (M) 𝑠𝑙𝑜𝑝𝑒1𝑠𝑙𝑜𝑝𝑒2
→𝐼𝐸


Ionization Efficiency
M. Oss et al. Anal. Chem. 2010, 82, 2865.A. Kruve et al. Anal. Chem. 2014, 86, 4822.

3.40
2.03
0.65
logP
Ionization Efficiency
M. Oss et al. Anal. Chem. 2010, 82, 2865.A. Kruve et al. Anal. Chem. 2014, 86, 4822.

13.32
9.93
6.79
pKaMeCN
Ionization Efficiency
M. Oss et al. Anal. Chem. 2010, 82, 2865.A. Kruve et al. Anal. Chem. 2014, 86, 4822.

Change in ionizationefficiency~5x
1350
260
10
100
1,000
10,000
100,000
0 20 40 60 80 100
Ioni
zatio
n E
ffic
ienc
y
%MeCN
J. Liigand et al. JASMS 2014, 25, 1853.

1350
260
10
100
1,000
10,000
100,000
0 20 40 60 80 100
Ioni
zatio
n E
ffic
ienc
y
%MeCN
Change in ionizationefficiency~5x
1350
0.6
0
1
10
100
1,000
10,000
100,000
1,000,000
0 2 4 6 8 10 12Io
niza
tion
Eff
icie
ncy
pH
Analytes’ pKa > 10 orpKa < 2
Analytes’ 2 < pKa < 10
J. Liigand et al. JASMS 2014, 25, 1853.

1
10
100
1,000
10,000
100,000
1,000,000
Ioni
zatio
nE
ffic
ienc
y
AgilentESI
ThermoESI
ThermoHESI
SciexHESI
WatersHESI
J. Liigand et al. JASMS 2015, 26, 1923.

Me
asu
red
IE(S
cie
x)
Measured IE (Thermo)1
10
100
1,000
10,000
100,000
1,000,000
Ioni
zatio
nE
ffic
ienc
y
AgilentESI
ThermoESI
ThermoHESI
SciexHESI
WatersHESI
R2 = 0.83
J. Liigand et al. JASMS 2015, 26, 1923.


dataset
structure solventIE
testing algorithms
random forest regression
predicted IE
J. Liigand et al. Sci. Rep. 2020, 10, 5808.

5663 data points
1410 small molecules
106 eluent compositions
MeCN/MeOH
0 – 100%
pH = 2.0 – 10.7
Prediction error
Training set 1.9x
Test set 3.0x
0
1
100
10,000
1,000,000
0 1 100 10,000 1,000,000
IEp
red
icte
d
IEmeasured
TrainingTest
J. Liigand et al. Sci. Rep. 2020, 10, 5808.

app.quantem.co


AC50 (µM) NA 0.27 NA 12.82 NA

AC50 (µM) NA 0.27 NA 12.82 NA
c (nM) 2.6 2.4 1.7 0.7 3.6

MS, MS2, RT, Reference Std.Level 1: Confirmed structure
by reference standard
Level 2: Probable structurea) by library spectrum matchb) by diagnostic evidence
Level 3: Tentative candidate(s)structure, substituent, class
Level 4: Unequivocal molecular formula
Level 5: Exact mass of interest
C7H7N3
133.0640
MS, MS2, Library MS2
MS, MS2, Exp. data
MS, MS2, Exp. data
MS isotope/adduct
MS

AC50 (µM) NA 0.27 NA 12.82 NA
cpredicted(nM)
2.6 2.4 1.7 0.7 3.6
cmeasured(nM)
1.4

28 contaminants from 28 surface water samples fromthe Netherlands
Quantified with targetedmethod
Mean prediction error 1.8x
c pre
dic
ted
(M)
cmeasured (M)
10-8
10-9
10-10
10-11
10-810-910-1010-11


ion mobility resolution 400
mass resolution 100,000
m/z 20 to 64,000 Da

very high IMS resolution
IMS/DIA experimentsdeconvolution of MS/MS spectra
CID/IMS experiments
