full year 201916 net financials dkkm 2019 2018 change currency hedge gains 21 9 12 currency gains...
TRANSCRIPT

Full year 2019
The NNIT Presenting Team
PER OVE KOGUT
Chief Executive Officer
JENS BLÜITGEN BINGER
Head of Investor Relations
CARSTEN KROGSGAARDTHOMSEN
Chief Financial Officer
2
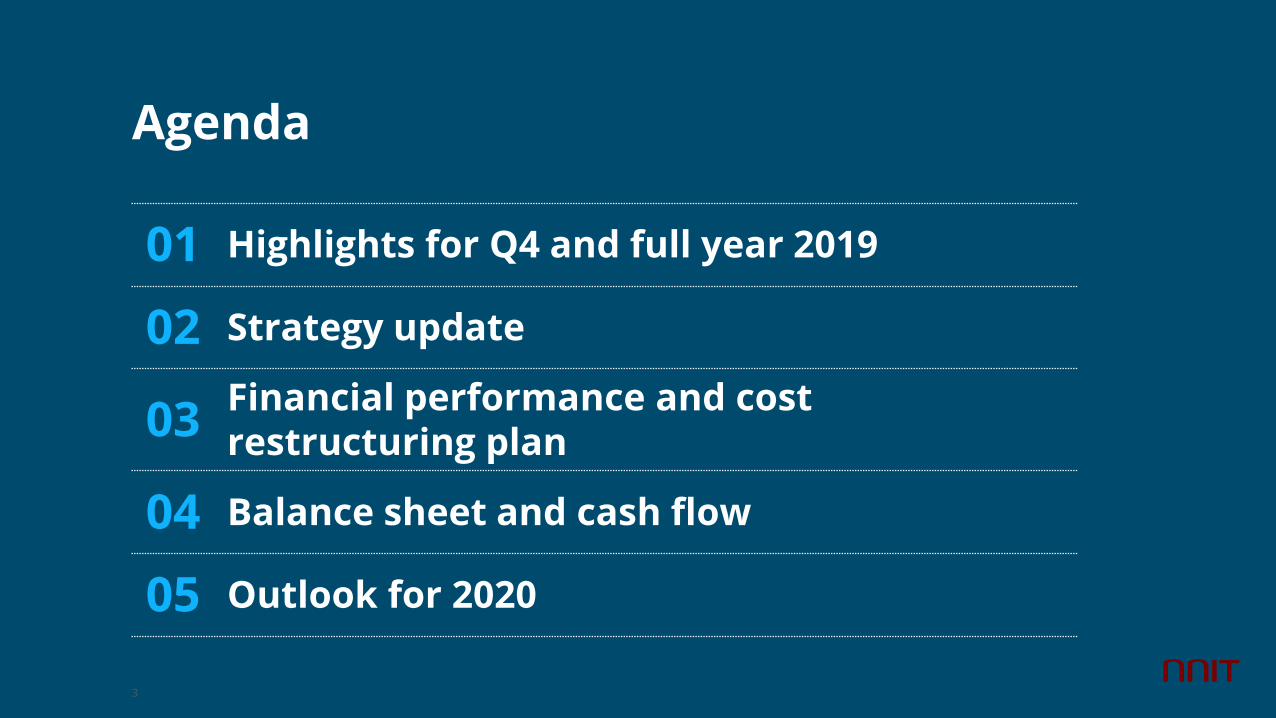
Agenda
01 Highlights for Q4 and full year 2019
02 Strategy update
03Financial performance and cost restructuring plan
04 Balance sheet and cash flow
05 Outlook for 2020
3
Forward looking statements
This presentation contains forward-looking statements. Words such as ‘believe’,‘expect’, ‘may’, ‘will’, ‘plan’, ‘strategy’, ‘prospect’, ‘foresee’, ‘estimate’, ‘project’,‘anticipate’, ‘can’, ‘intend’, ‘outlook’, ‘guidance’, ‘target’ and other words and termsof similar meaning in connection with any discussion of future operating orfinancial performance identify forward-looking statements. Statements regardingthe future are subject to risks and uncertainties that may result in considerabledeviations from the outlook set forth.
Furthermore, some of these expectations are based on assumptions regardingfuture events which may prove incorrect.
4
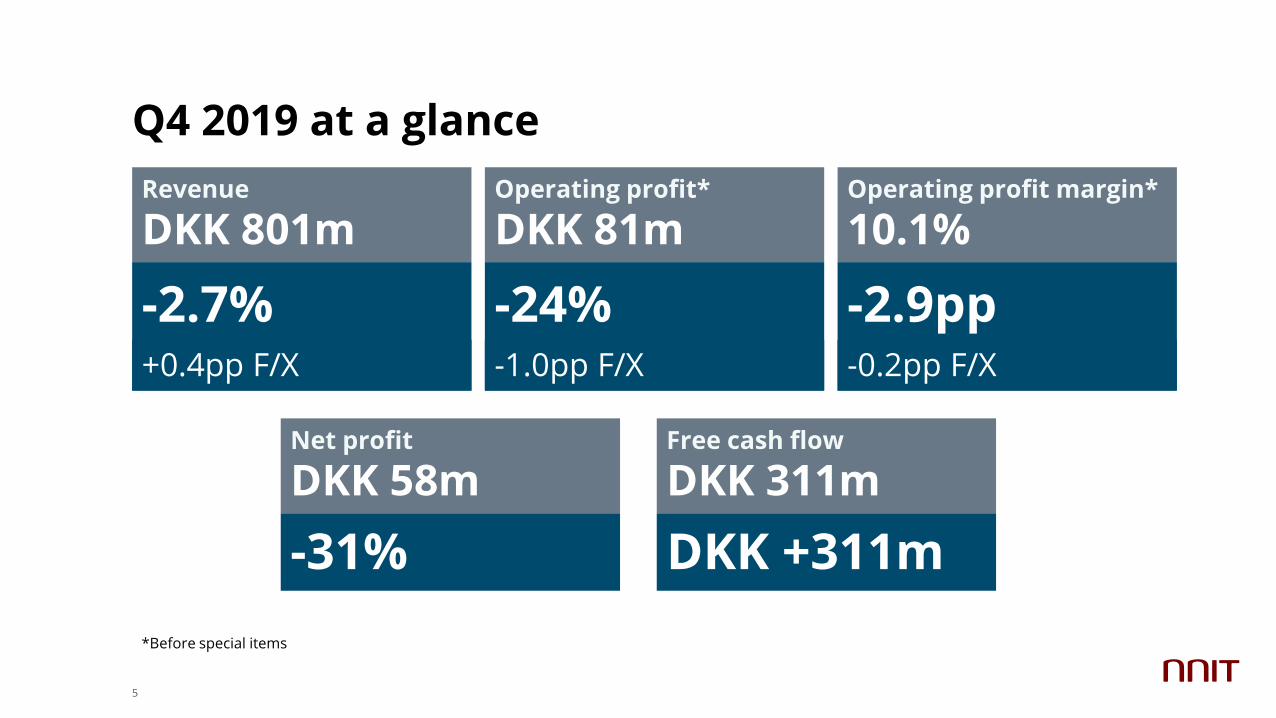
Q4 2019 at a glance
-2.7%
Revenue
DKK 801m
+0.4pp F/X
-24%
Operating profit*
DKK 81m
-1.0pp F/X
-2.9pp
Operating profit margin*
10.1%
-0.2pp F/X
-31%
Net profit
DKK 58m
DKK +311m
Free cash flow
DKK 311m
*Before special items
5
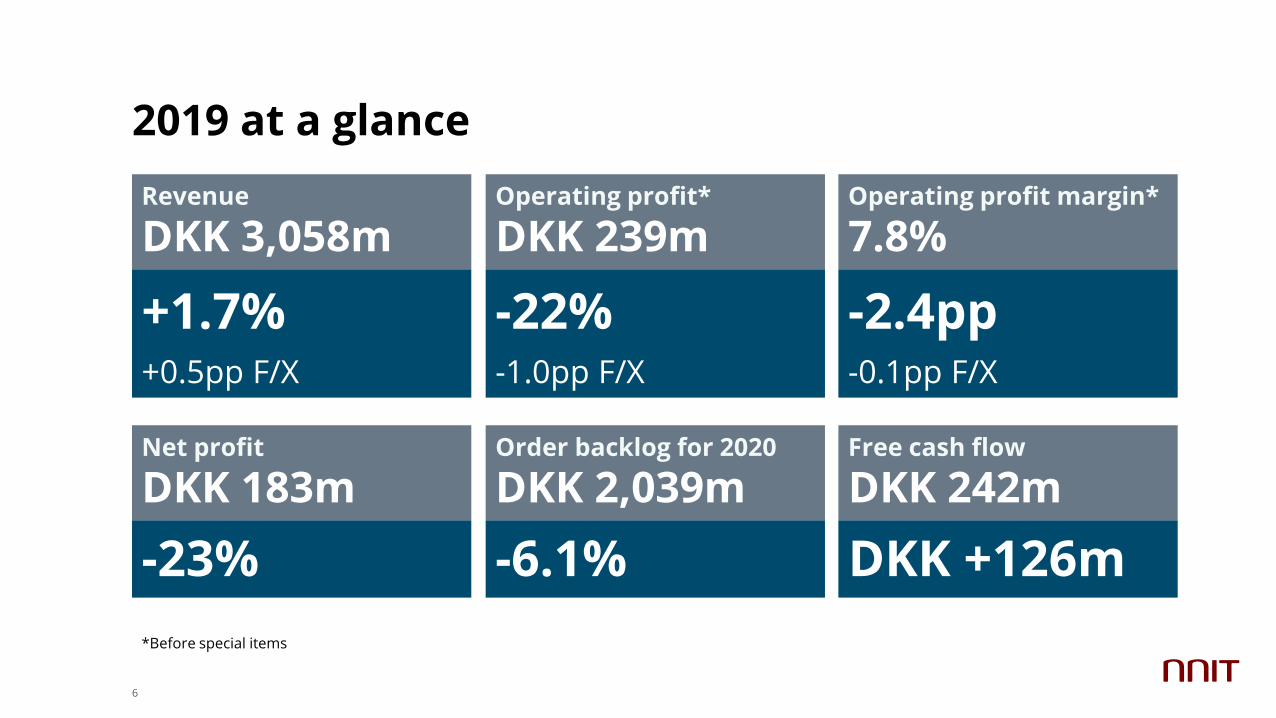
2019 at a glance
+1.7%
Revenue
DKK 3,058m
+0.5pp F/X
-22%
Operating profit*
DKK 239m
-1.0pp F/X
-2.4pp
Operating profit margin*
7.8%
-0.1pp F/X
-23%
Net profit
DKK 183m
-6.1%
Order backlog for 2020
DKK 2,039m
DKK +126m
Free cash flow
DKK 242m
6
*Before special items
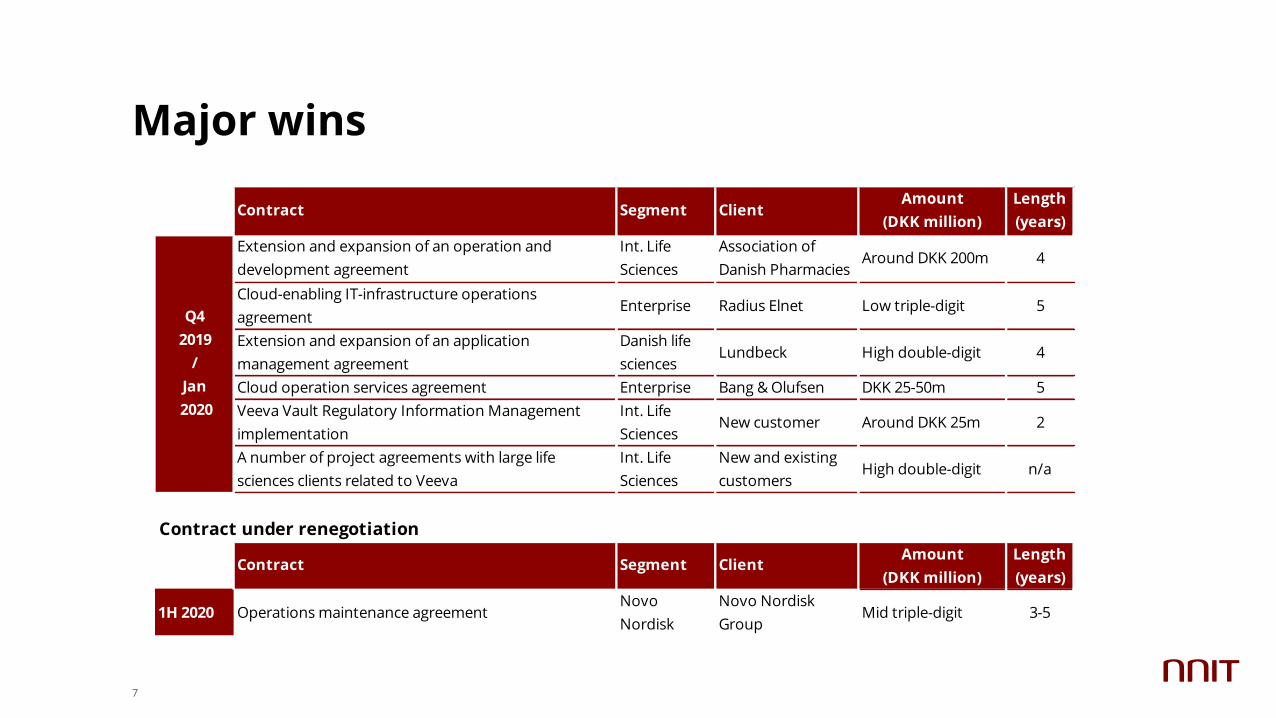
Major wins
7
Amount Length
(DKK million) (years)
Extension and expansion of an operation and
development agreement
Int. Life
Sciences
Association of
Danish PharmaciesAround DKK 200m 4
Cloud-enabling IT-infrastructure operations
agreement Enterprise Radius Elnet Low triple-digit 5
Extension and expansion of an application
management agreement
Danish life
sciencesLundbeck High double-digit 4
Cloud operation services agreement Enterprise Bang & Olufsen DKK 25-50m 5
Veeva Vault Regulatory Information Management
implementation
Int. Life
SciencesNew customer Around DKK 25m 2
A number of project agreements with large life
sciences clients related to Veeva
Int. Life
Sciences
New and existing
customersHigh double-digit n/a
Contract under renegotiation
Amount Length
(DKK million) (years)
1H 2020 Operations maintenance agreementNovo
Nordisk
Novo Nordisk
GroupMid triple-digit 3-5
Contract Segment Client
Q4
2019
/
Jan
2020
Contract Segment Client
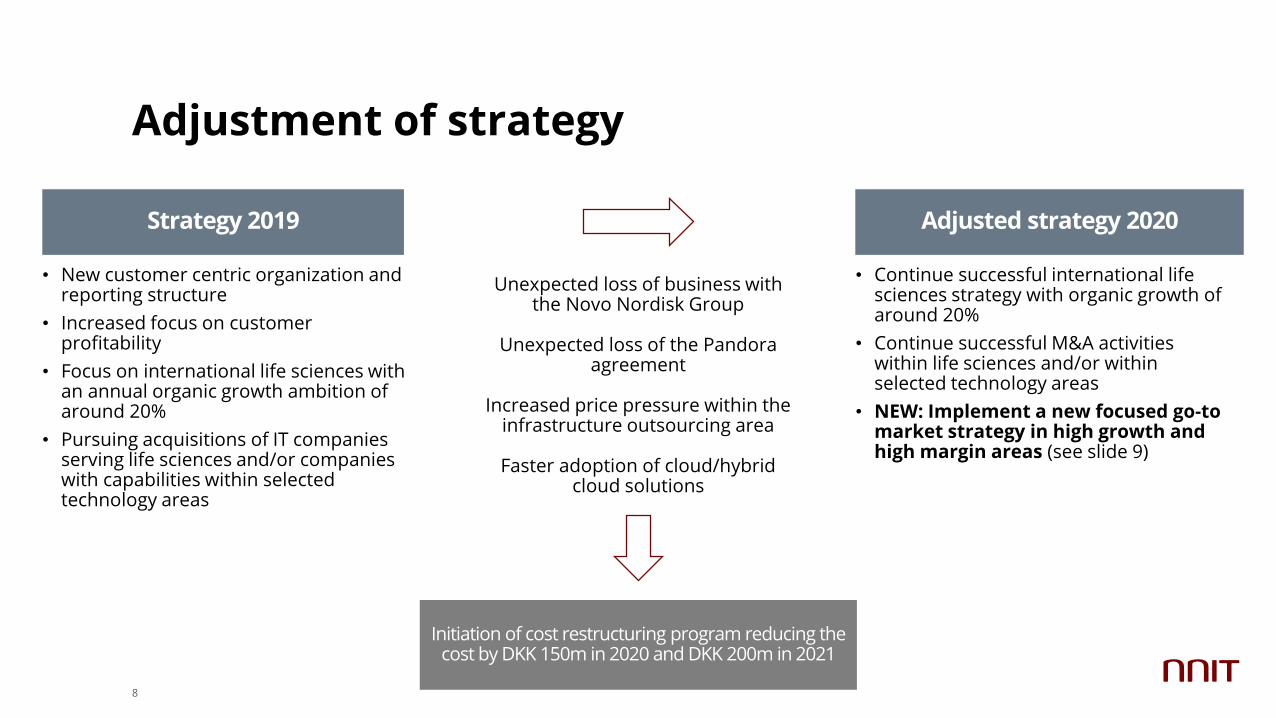
Adjustment of strategy
• New customer centric organization and reporting structure
• Increased focus on customer profitability
• Focus on international life sciences with an annual organic growth ambition of around 20%
• Pursuing acquisitions of IT companies serving life sciences and/or companies with capabilities within selected technology areas
8
• Continue successful international life sciences strategy with organic growth of around 20%
• Continue successful M&A activities within life sciences and/or within selected technology areas
• NEW: Implement a new focused go-to market strategy in high growth and high margin areas (see slide 9)
Strategy 2019 Adjusted strategy 2020
Initiation of cost restructuring program reducing the cost by DKK 150m in 2020 and DKK 200m in 2021
Unexpected loss of business with the Novo Nordisk Group
Unexpected loss of the Pandora agreement
Increased price pressure within the infrastructure outsourcing area
Faster adoption of cloud/hybrid cloud solutions
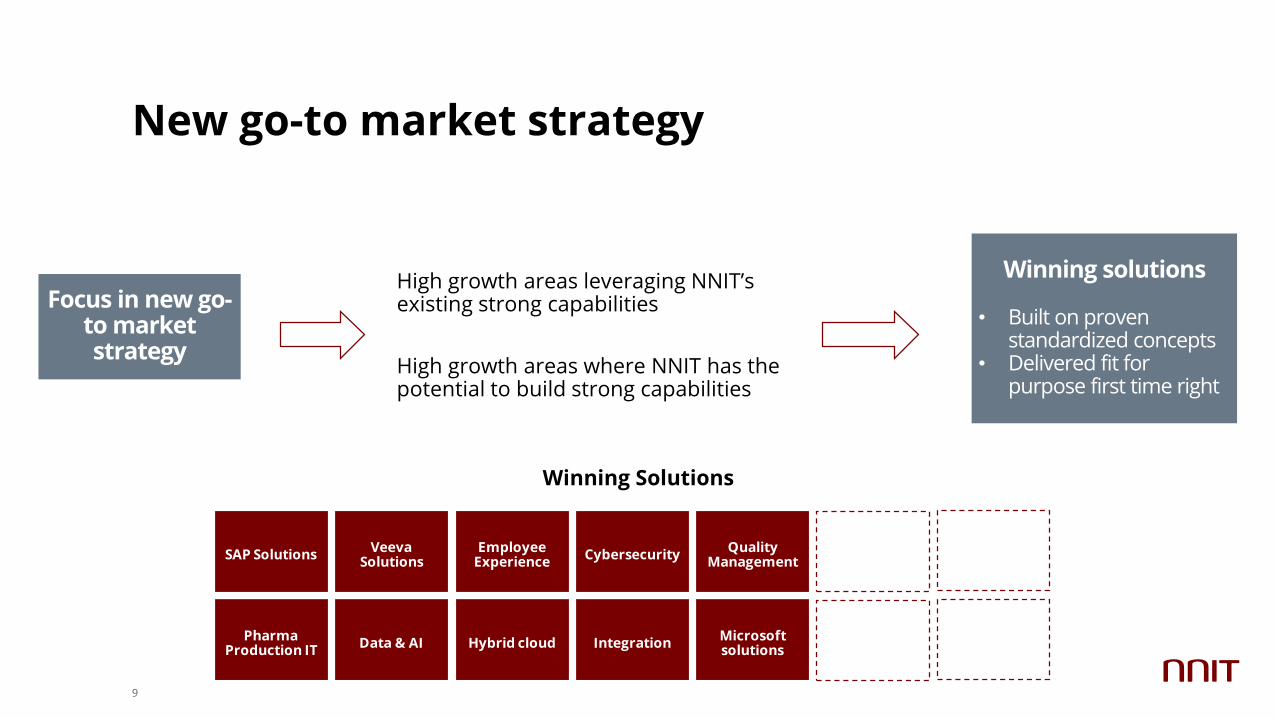
New go-to market strategy
High growth areas leveraging NNIT’s existing strong capabilities
High growth areas where NNIT has the potential to build strong capabilities
9
Focus in new go-to market strategy
SAP SolutionsVeeva
SolutionsEmployee
ExperienceQuality
ManagementCybersecurity
Pharma Production IT
Data & AI Hybrid cloudMicrosoft solutions
Integration
Winning solutions
• Built on proven standardized concepts
• Delivered fit for purpose first time right
Winning Solutions
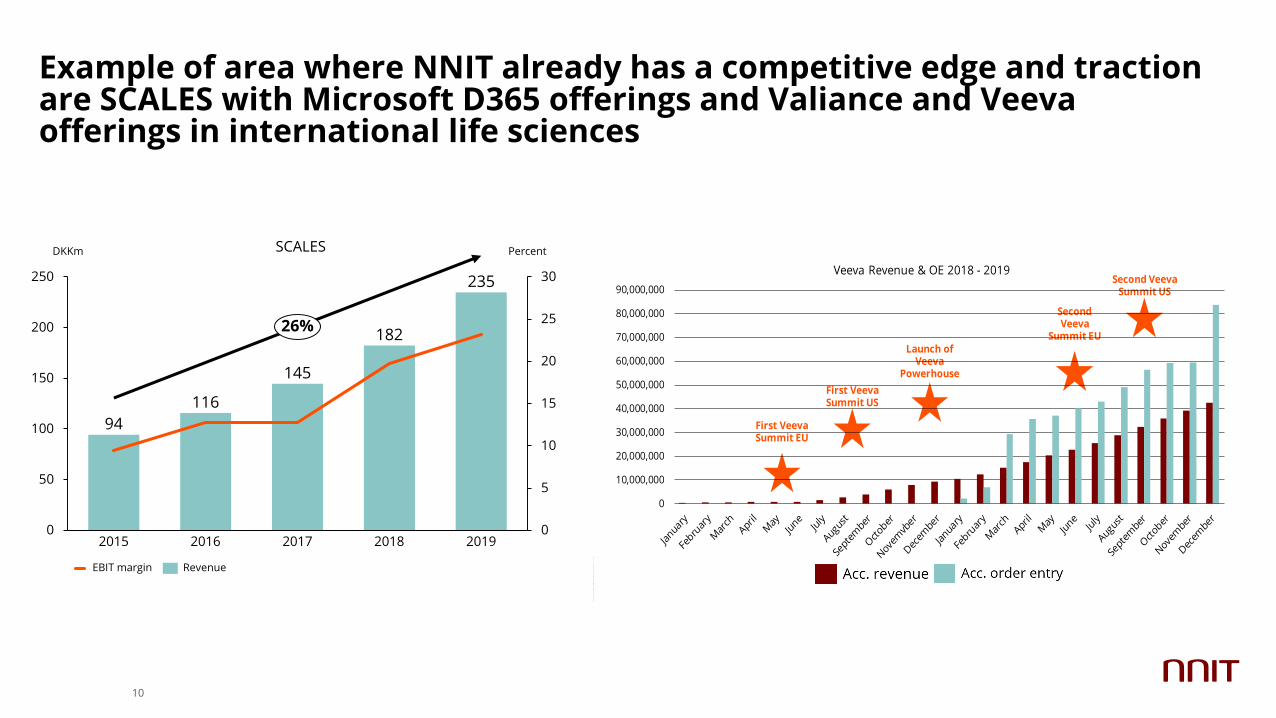
Example of area where NNIT already has a competitive edge and traction are SCALES with Microsoft D365 offerings and Valiance and Veeva offerings in international life sciences
10
Classification xxxx Author xxxx Approved by xxxx Version xx
First VeevaSummit EU
First VeevaSummit US
Launch of Veeva
Powerhouse
Second Veeva
Summit EU
Second VeevaSummit US
0
10,000,000
20,000,000
30,000,000
40,000,000
50,000,000
60,000,000
70,000,000
80,000,000
90,000,000
Veeva Revenue & OE 2018 - 2019
Revenue OE
94
116
145
182
235
0
5
10
15
20
25
30
0
50
100
150
200
250
2015 2016 2017 2018 2019
DKKm Percent
26%
EBIT margin Revenue
SCALES
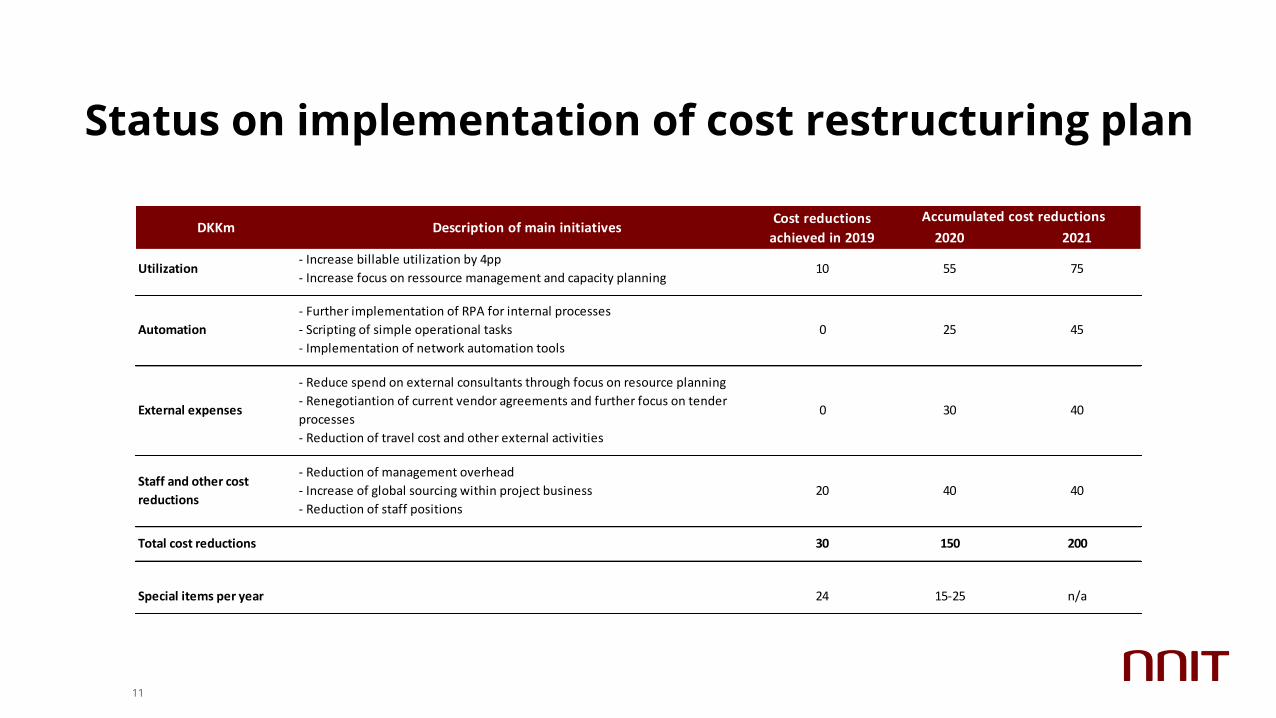
Status on implementation of cost restructuring plan
11
2020 2021
Utilization- Increase billable utilization by 4pp
- Increase focus on ressource management and capacity planning10 55 75
Automation
- Further implementation of RPA for internal processes
- Scripting of simple operational tasks
- Implementation of network automation tools
0 25 45
External expenses
- Reduce spend on external consultants through focus on resource planning
- Renegotiantion of current vendor agreements and further focus on tender
processes
- Reduction of travel cost and other external activities
0 30 40
Staff and other cost
reductions
- Reduction of management overhead
- Increase of global sourcing within project business
- Reduction of staff positions
20 40 40
Total cost reductions 30 150 200
Special items per year 24 15-25 n/a
Accumulated cost reductionsDKKm Description of main initiatives
Cost reductions
achieved in 2019
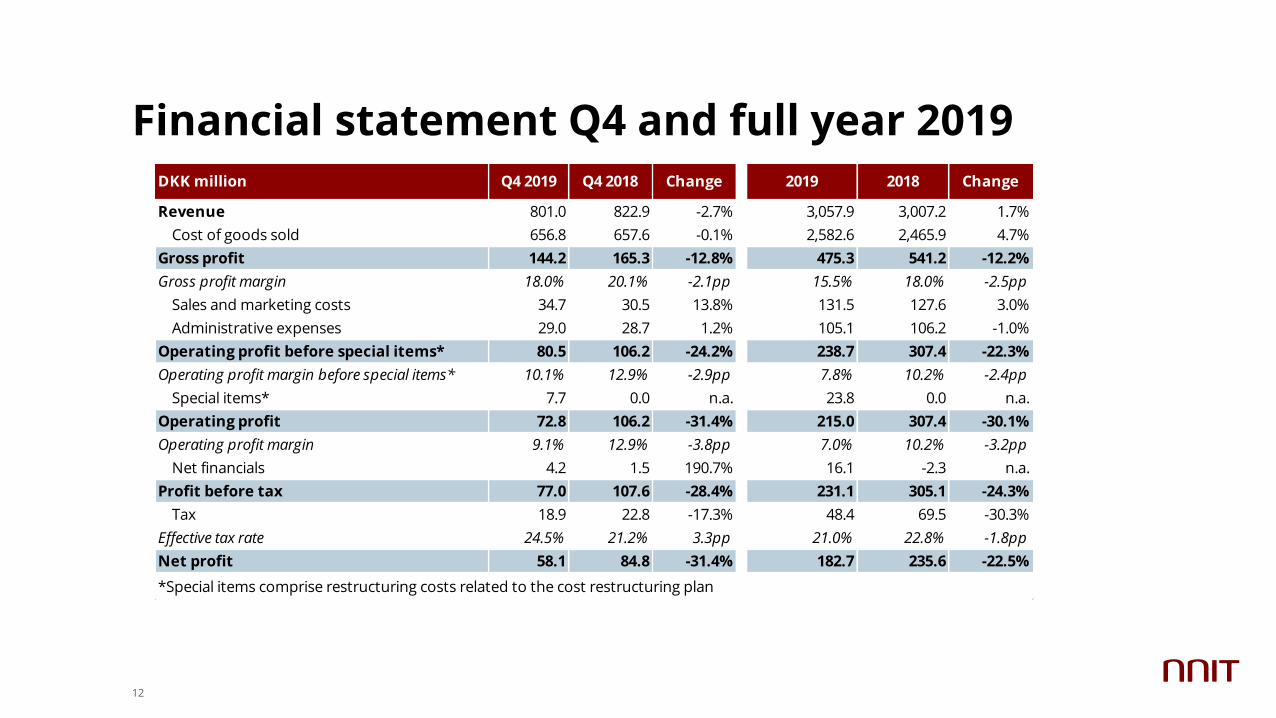
Financial statement Q4 and full year 2019
12
DKK million Q4 2019 Q4 2018 Change 2019 2018 Change
Revenue 801.0 822.9 -2.7% 3,057.9 3,007.2 1.7%
Cost of goods sold 656.8 657.6 -0.1% 2,582.6 2,465.9 4.7%
Gross profit 144.2 165.3 -12.8% 475.3 541.2 -12.2%
Gross profit margin 18.0% 20.1% -2.1pp 15.5% 18.0% -2.5pp
Sales and marketing costs 34.7 30.5 13.8% 131.5 127.6 3.0%
Administrative expenses 29.0 28.7 1.2% 105.1 106.2 -1.0%
Operating profit before special items* 80.5 106.2 -24.2% 238.7 307.4 -22.3%
Operating profit margin before special items* 10.1% 12.9% -2.9pp 7.8% 10.2% -2.4pp
Special items* 7.7 0.0 n.a. 23.8 0.0 n.a.
Operating profit 72.8 106.2 -31.4% 215.0 307.4 -30.1%
Operating profit margin 9.1% 12.9% -3.8pp 7.0% 10.2% -3.2pp
Net financials 4.2 1.5 190.7% 16.1 -2.3 n.a.
Profit before tax 77.0 107.6 -28.4% 231.1 305.1 -24.3%
Tax 18.9 22.8 -17.3% 48.4 69.5 -30.3%
Effective tax rate 24.5% 21.2% 3.3pp 21.0% 22.8% -1.8pp
Net profit 58.1 84.8 -31.4% 182.7 235.6 -22.5%
*Special items comprise restructuring costs related to the cost restructuring plan
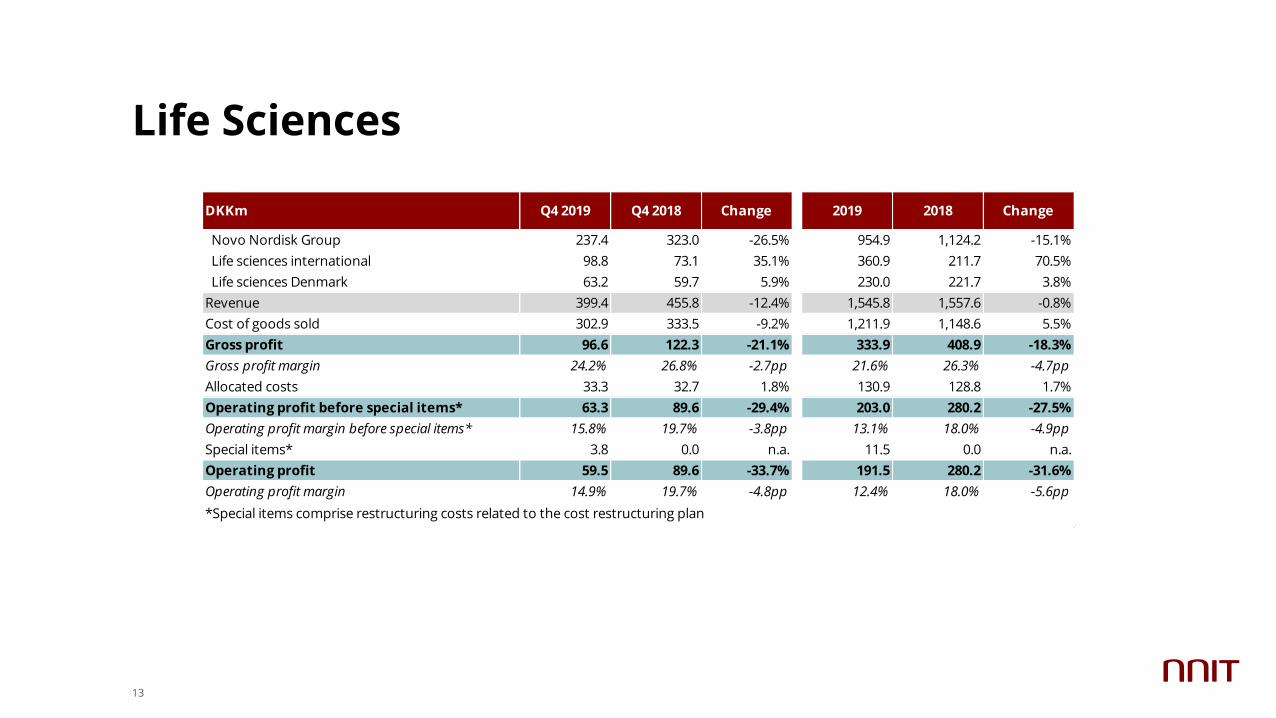
Life Sciences
13
DKKm Q4 2019 Q4 2018 Change 2019 2018 Change
Novo Nordisk Group 237.4 323.0 -26.5% 954.9 1,124.2 -15.1%
Life sciences international 98.8 73.1 35.1% 360.9 211.7 70.5%
Life sciences Denmark 63.2 59.7 5.9% 230.0 221.7 3.8%
Revenue 399.4 455.8 -12.4% 1,545.8 1,557.6 -0.8%
Cost of goods sold 302.9 333.5 -9.2% 1,211.9 1,148.6 5.5%
Gross profit 96.6 122.3 -21.1% 333.9 408.9 -18.3%
Gross profit margin 24.2% 26.8% -2.7pp 21.6% 26.3% -4.7pp
Allocated costs 33.3 32.7 1.8% 130.9 128.8 1.7%
Operating profit before special items* 63.3 89.6 -29.4% 203.0 280.2 -27.5%
Operating profit margin before special items* 15.8% 19.7% -3.8pp 13.1% 18.0% -4.9pp
Special items* 3.8 0.0 n.a. 11.5 0.0 n.a.
Operating profit 59.5 89.6 -33.7% 191.5 280.2 -31.6%
Operating profit margin 14.9% 19.7% -4.8pp 12.4% 18.0% -5.6pp
*Special items comprise restructuring costs related to the cost restructuring plan
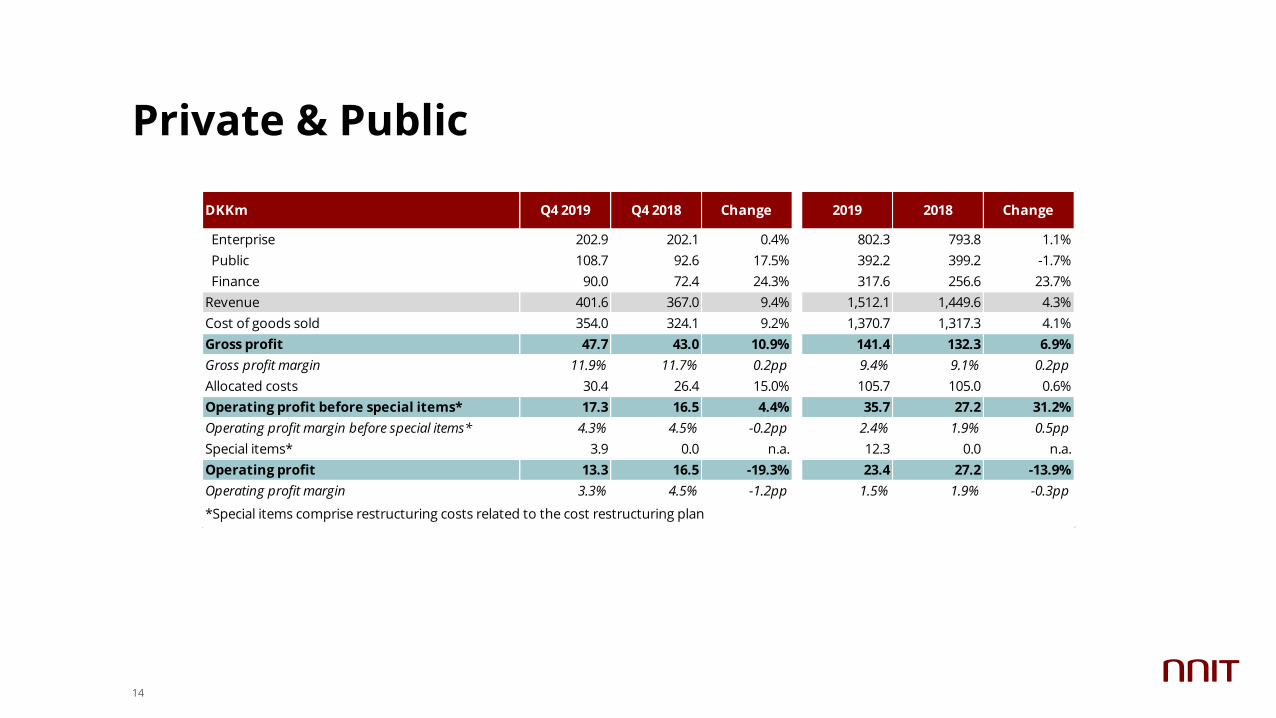
Private & Public
14
DKKm Q4 2019 Q4 2018 Change 2019 2018 Change
Enterprise 202.9 202.1 0.4% 802.3 793.8 1.1%
Public 108.7 92.6 17.5% 392.2 399.2 -1.7%
Finance 90.0 72.4 24.3% 317.6 256.6 23.7%
Revenue 401.6 367.0 9.4% 1,512.1 1,449.6 4.3%
Cost of goods sold 354.0 324.1 9.2% 1,370.7 1,317.3 4.1%
Gross profit 47.7 43.0 10.9% 141.4 132.3 6.9%
Gross profit margin 11.9% 11.7% 0.2pp 9.4% 9.1% 0.2pp
Allocated costs 30.4 26.4 15.0% 105.7 105.0 0.6%
Operating profit before special items* 17.3 16.5 4.4% 35.7 27.2 31.2%
Operating profit margin before special items* 4.3% 4.5% -0.2pp 2.4% 1.9% 0.5pp
Special items* 3.9 0.0 n.a. 12.3 0.0 n.a.
Operating profit 13.3 16.5 -19.3% 23.4 27.2 -13.9%
Operating profit margin 3.3% 4.5% -1.2pp 1.5% 1.9% -0.3pp
*Special items comprise restructuring costs related to the cost restructuring plan
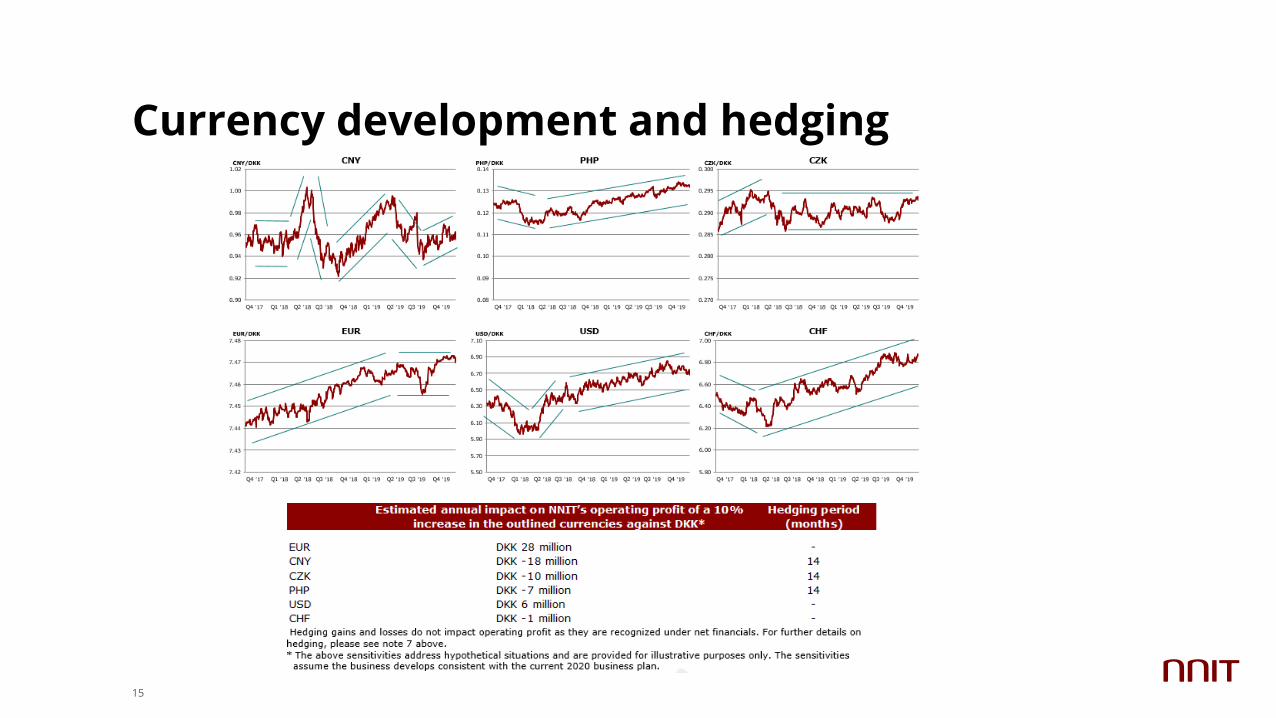
Currency development and hedging
15
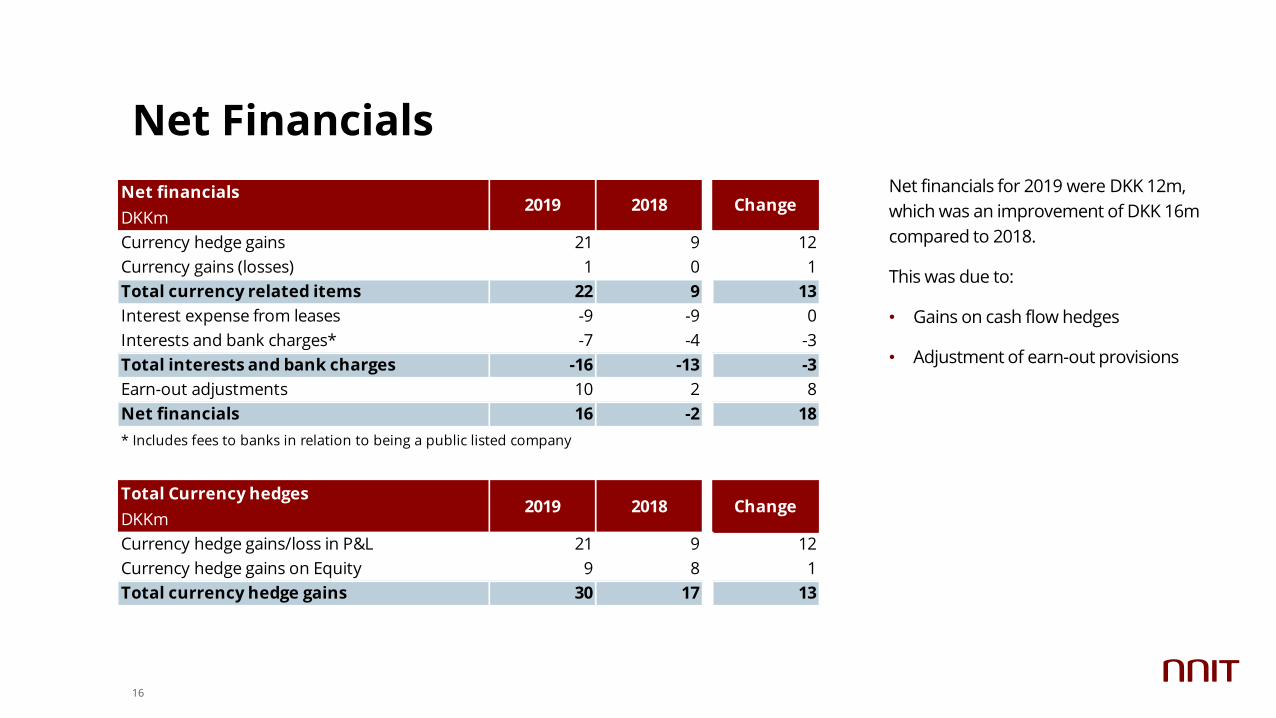
Net Financials
Net financials for 2019 were DKK 12m,
which was an improvement of DKK 16m
compared to 2018.
This was due to:
• Gains on cash flow hedges
• Adjustment of earn-out provisions
16
Net financials
DKKm2019 2018 Change
Currency hedge gains 21 9 12
Currency gains (losses) 1 0 1
Total currency related items 22 9 13
Interest expense from leases -9 -9 0
Interests and bank charges* -7 -4 -3
Total interests and bank charges -16 -13 -3
Earn-out adjustments 10 2 8
Net financials 16 -2 18
Total Currency hedges
DKKm2019 2018 Change
Currency hedge gains/loss in P&L 21 9 12
Currency hedge gains on Equity 9 8 1
Total currency hedge gains 30 17 13
* Includes fees to banks in relation to being a public listed company
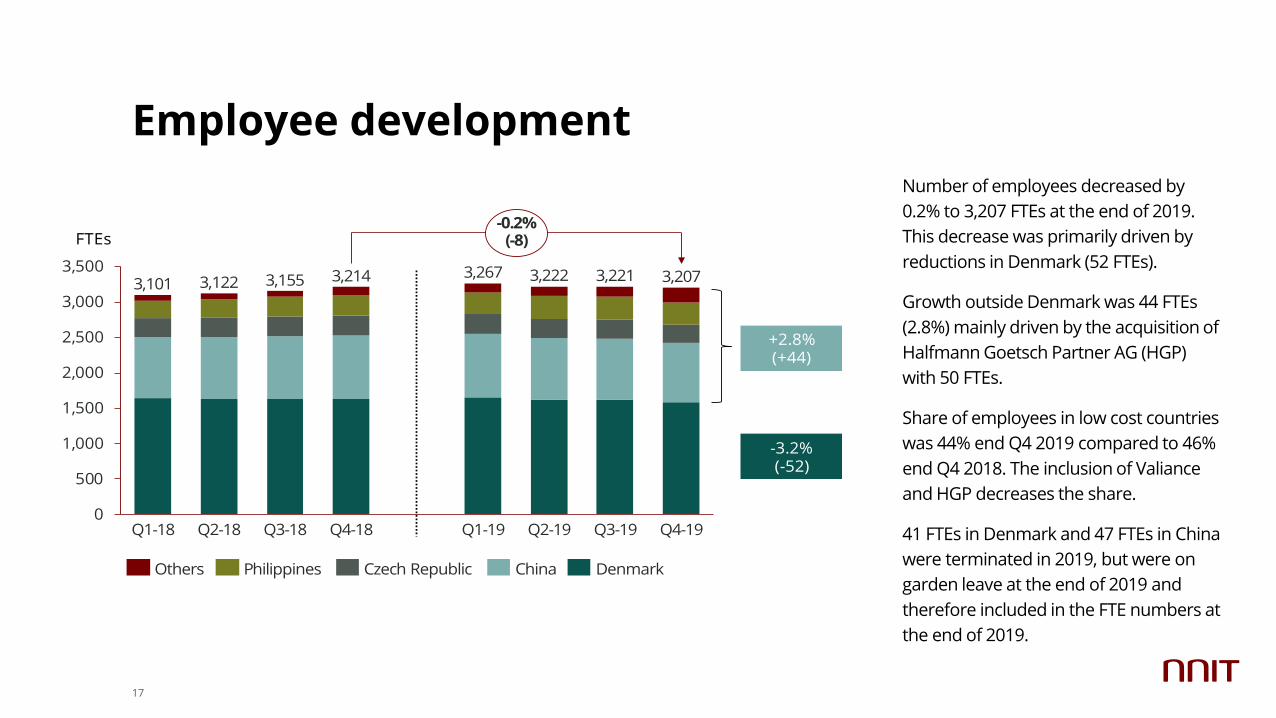
Employee development
Number of employees decreased by
0.2% to 3,207 FTEs at the end of 2019.
This decrease was primarily driven by
reductions in Denmark (52 FTEs).
Growth outside Denmark was 44 FTEs
(2.8%) mainly driven by the acquisition of
Halfmann Goetsch Partner AG (HGP)
with 50 FTEs.
Share of employees in low cost countries
was 44% end Q4 2019 compared to 46%
end Q4 2018. The inclusion of Valiance
and HGP decreases the share.
41 FTEs in Denmark and 47 FTEs in China
were terminated in 2019, but were on
garden leave at the end of 2019 and
therefore included in the FTE numbers at
the end of 2019.
17
0
500
1,000
1,500
2,000
2,500
3,000
3,500
Q2-18 Q2-19Q1-18 Q3-18 Q4-18 Q1-19
3,101
Q3-19 Q4-19
3,122 3,155 3,214 3,267 3,222 3,221 3,207
-0.2%(-8)
Others Philippines Czech Republic DenmarkChina
-3.2%(-52)
+2.8%(+44)
FTEs
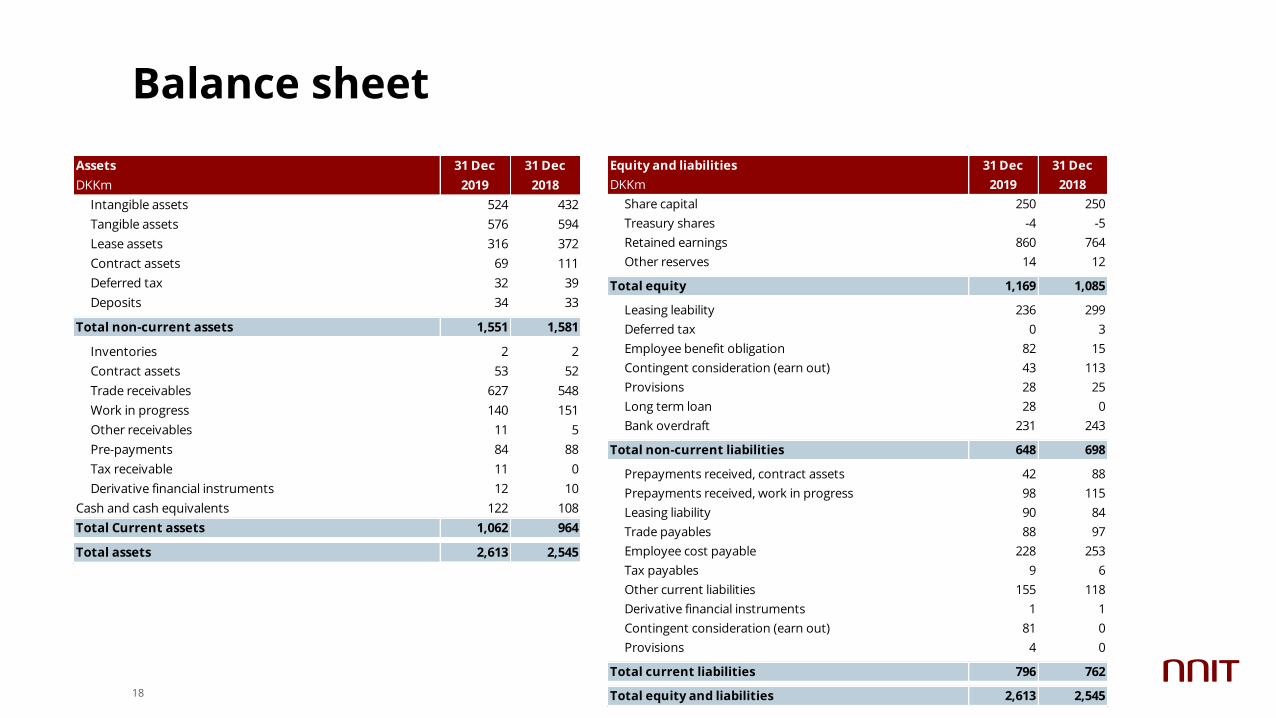
Balance sheet
18
Assets
DKKm
31 Dec
2019
31 Dec
2018
Intangible assets 524 432
Tangible assets 576 594
Lease assets 316 372
Contract assets 69 111
Deferred tax 32 39
Deposits 34 33
Total non-current assets 1,551 1,581
Inventories 2 2
Contract assets 53 52
Trade receivables 627 548
Work in progress 140 151
Other receivables 11 5
Pre-payments 84 88
Tax receivable 11 0
Derivative financial instruments 12 10
Cash and cash equivalents 122 108
Total Current assets 1,062 964
Total assets 2,613 2,545
Equity and liabilities
DKKm
31 Dec
2019
31 Dec
2018
Share capital 250 250
Treasury shares -4 -5
Retained earnings 860 764
Other reserves 14 12
Total equity 1,169 1,085
Leasing leability 236 299
Deferred tax 0 3
Employee benefit obligation 82 15
Contingent consideration (earn out) 43 113
Provisions 28 25
Long term loan 28 0
Bank overdraft 231 243
Total non-current liabilities 648 698
Prepayments received, contract assets 42 88
Prepayments received, work in progress 98 115
Leasing liability 90 84
Trade payables 88 97
Employee cost payable 228 253
Tax payables 9 6
Other current liabilities 155 118
Derivative financial instruments 1 1
Contingent consideration (earn out) 81 0
Provisions 4 0
Total current liabilities 796 762
Total equity and liabilities 2,613 2,545
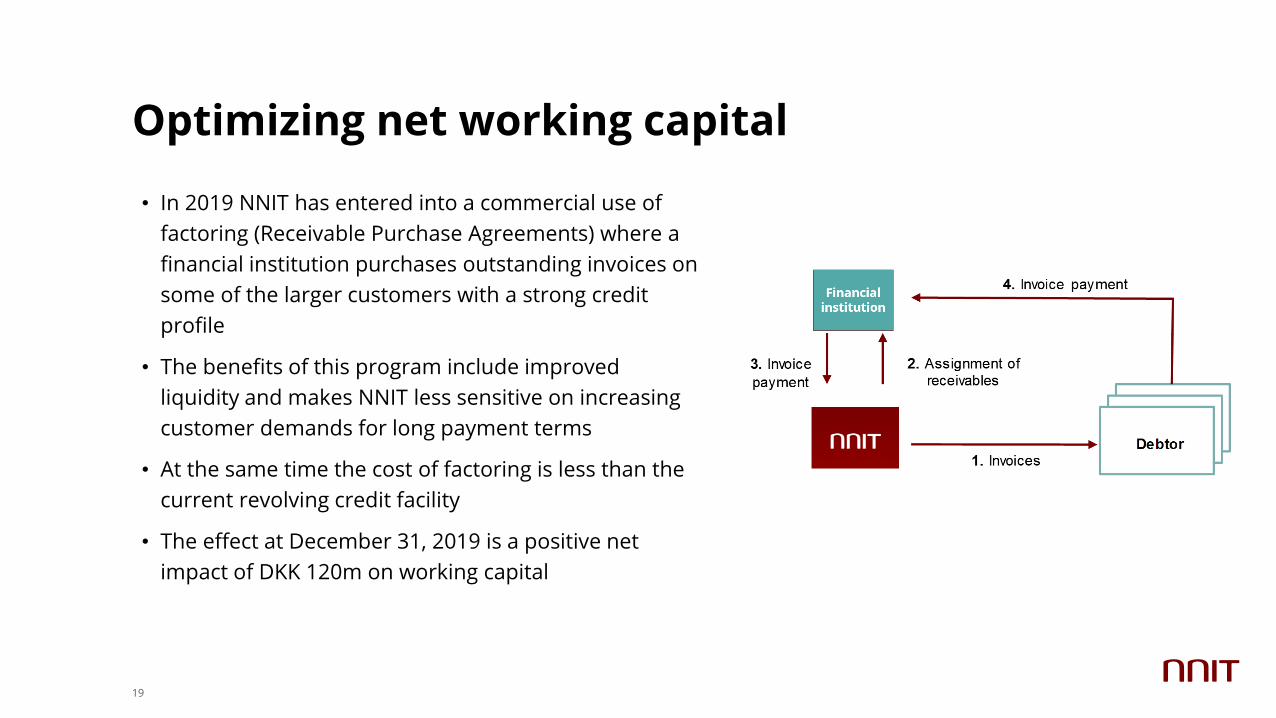
Optimizing net working capital
19
• In 2019 NNIT has entered into a commercial use of
factoring (Receivable Purchase Agreements) where a
financial institution purchases outstanding invoices on
some of the larger customers with a strong credit
profile
• The benefits of this program include improved
liquidity and makes NNIT less sensitive on increasing
customer demands for long payment terms
• At the same time the cost of factoring is less than the
current revolving credit facility
• The effect at December 31, 2019 is a positive net
impact of DKK 120m on working capital
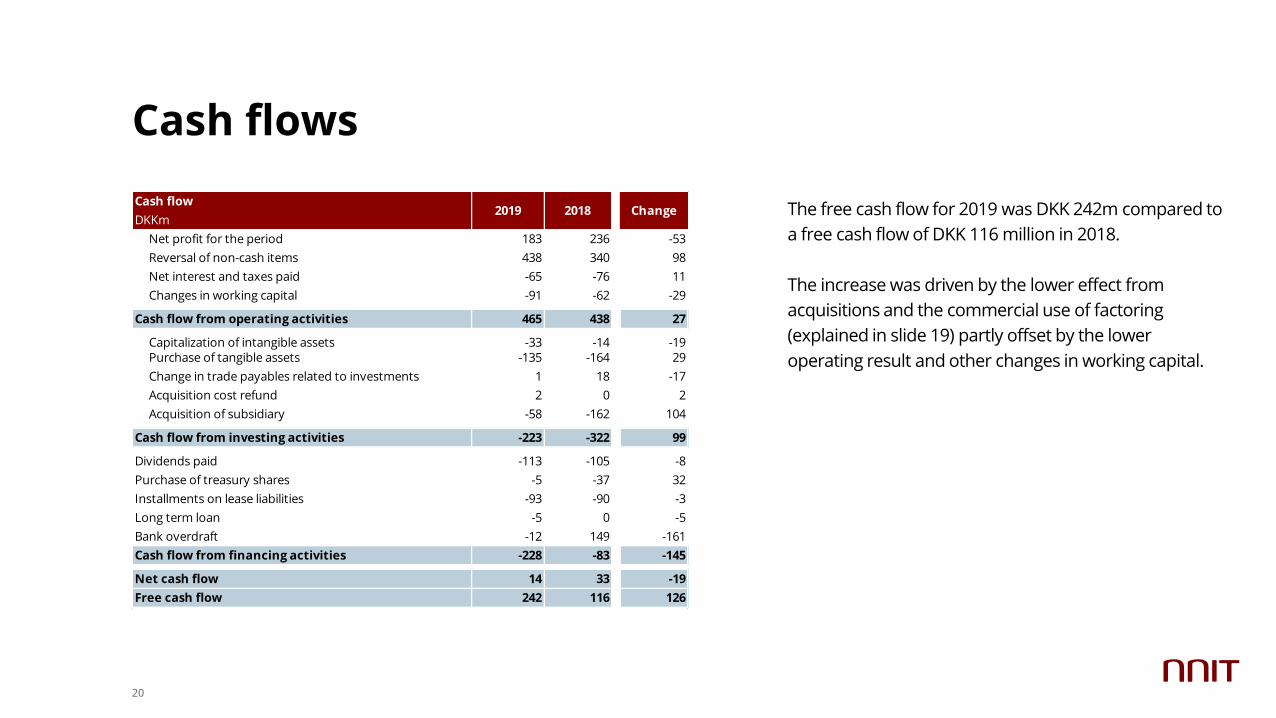
Cash flows
The free cash flow for 2019 was DKK 242m compared to
a free cash flow of DKK 116 million in 2018.
The increase was driven by the lower effect from
acquisitions and the commercial use of factoring
(explained in slide 19) partly offset by the lower
operating result and other changes in working capital.
20
Cash flow
DKKm2019 2018 Change
Net profit for the period 183 236 -53
Reversal of non-cash items 438 340 98
Net interest and taxes paid -65 -76 11
Changes in working capital -91 -62 -29
Cash flow from operating activities 465 438 27
Capitalization of intangible assets -33 -14 -19Purchase of tangible assets -135 -164 29
Change in trade payables related to investments 1 18 -17
Acquisition cost refund 2 0 2
Acquisition of subsidiary -58 -162 104
Cash flow from investing activities -223 -322 99
Dividends paid -113 -105 -8
Purchase of treasury shares -5 -37 32
Installments on lease liabilities -93 -90 -3
Long term loan -5 0 -5
Bank overdraft -12 149 -161
Cash flow from financing activities -228 -83 -145
Net cash flow 14 33 -19
Free cash flow 242 116 126
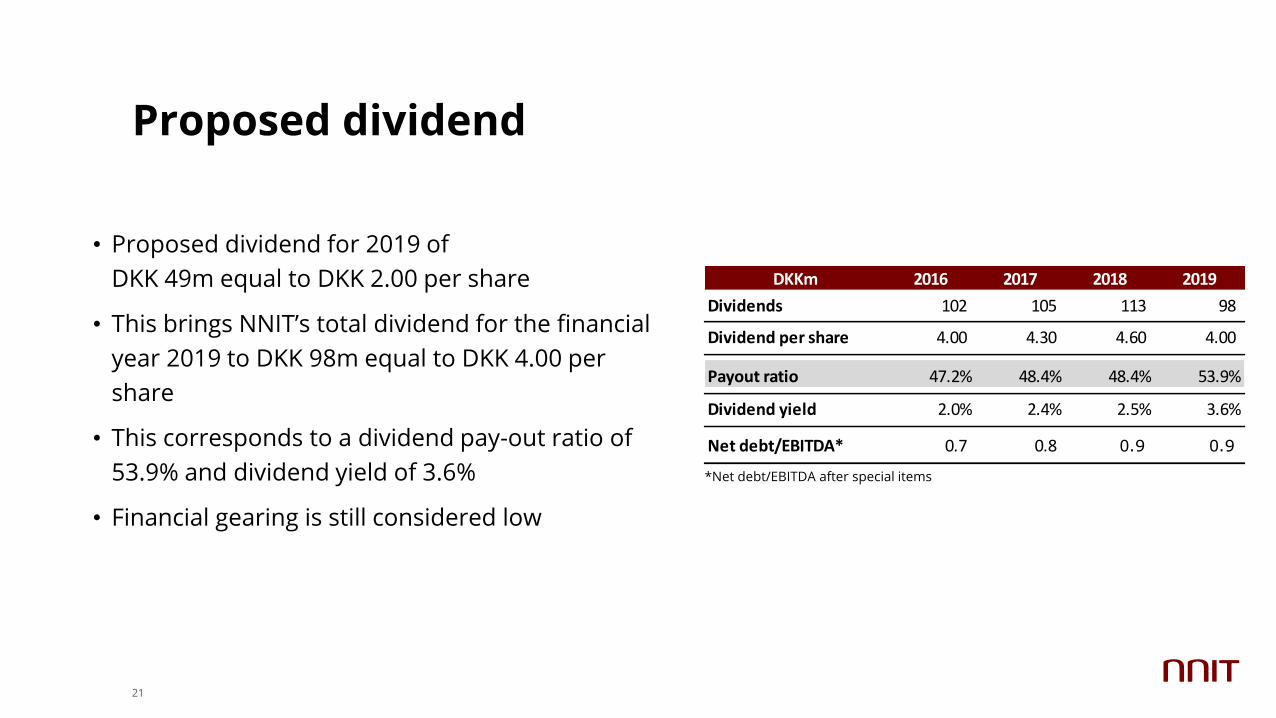
Proposed dividend
21
• Proposed dividend for 2019 of
DKK 49m equal to DKK 2.00 per share
• This brings NNIT’s total dividend for the financial
year 2019 to DKK 98m equal to DKK 4.00 per
share
• This corresponds to a dividend pay-out ratio of
53.9% and dividend yield of 3.6%
• Financial gearing is still considered low
*Net debt/EBITDA after special items
DKKm 2016 2017 2018 2019
Dividends 102 105 113 98
Dividend per share 4.00 4.30 4.60 4.00
Payout ratio 47.2% 48.4% 48.4% 53.9%
Dividend yield 2.0% 2.4% 2.5% 3.6%
Net debt/EBITDA* 0.7 0.8 0.9 0.9
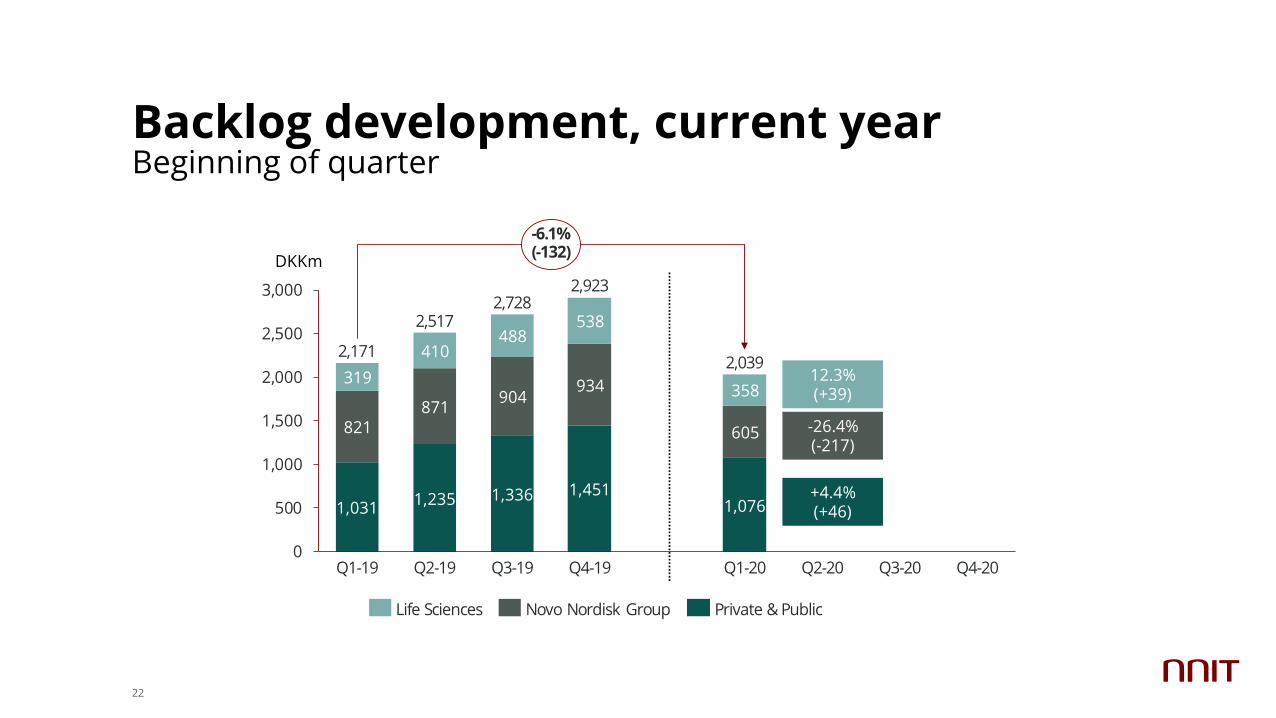
Backlog development, current yearBeginning of quarter
22
1,0311,235 1,336 1,451
1,076
821871
904934
605
319
410488
538
358
0
500
1,000
1,500
2,000
2,500
3,000
Q1-20
2,517
Q2-20Q1-19 Q2-19 Q4-20Q3-19
2,171
Q4-19 Q3-20
2,7282,923
2,039
-6.1%(-132)
Life Sciences Novo Nordisk Group Private & Public
+4.4%(+46)
12.3%(+39)
DKKm
-26.4%(-217)
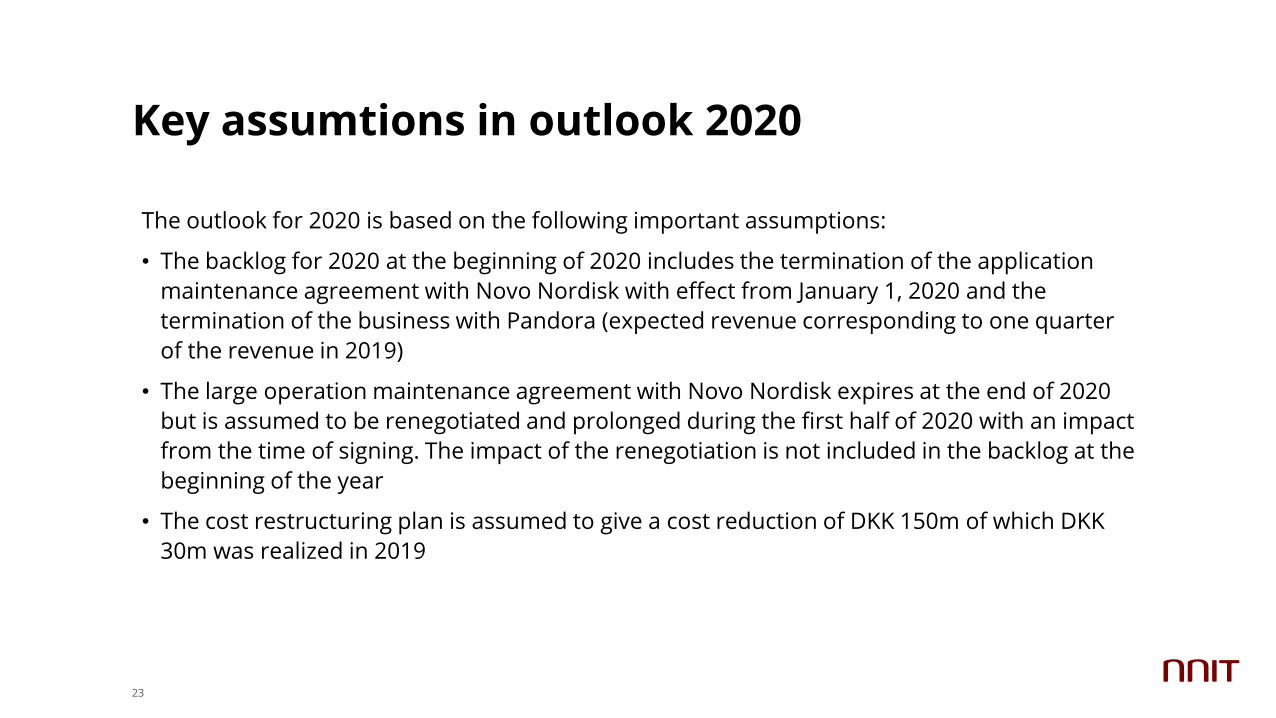
Key assumtions in outlook 2020
23
The outlook for 2020 is based on the following important assumptions:
• The backlog for 2020 at the beginning of 2020 includes the termination of the application
maintenance agreement with Novo Nordisk with effect from January 1, 2020 and the
termination of the business with Pandora (expected revenue corresponding to one quarter
of the revenue in 2019)
• The large operation maintenance agreement with Novo Nordisk expires at the end of 2020
but is assumed to be renegotiated and prolonged during the first half of 2020 with an impact
from the time of signing. The impact of the renegotiation is not included in the backlog at the
beginning of the year
• The cost restructuring plan is assumed to give a cost reduction of DKK 150m of which DKK
30m was realized in 2019
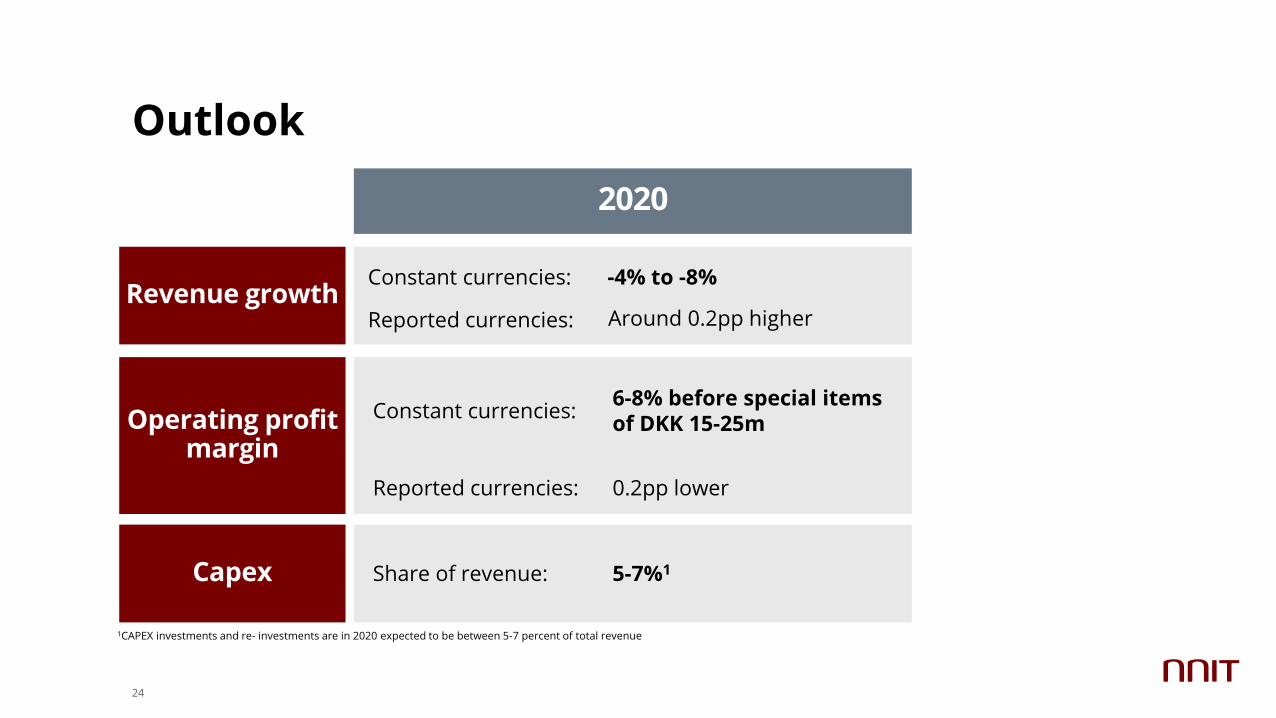
Outlook
Operating profit margin
Capex
2020
Revenue growth
Constant currencies:6-8% before special items of DKK 15-25m
Reported currencies: 0.2pp lower
Share of revenue: 5-7%1
1CAPEX investments and re- investments are in 2020 expected to be between 5-7 percent of total revenue
24
Constant currencies: -4% to -8%
Reported currencies: Around 0.2pp higher
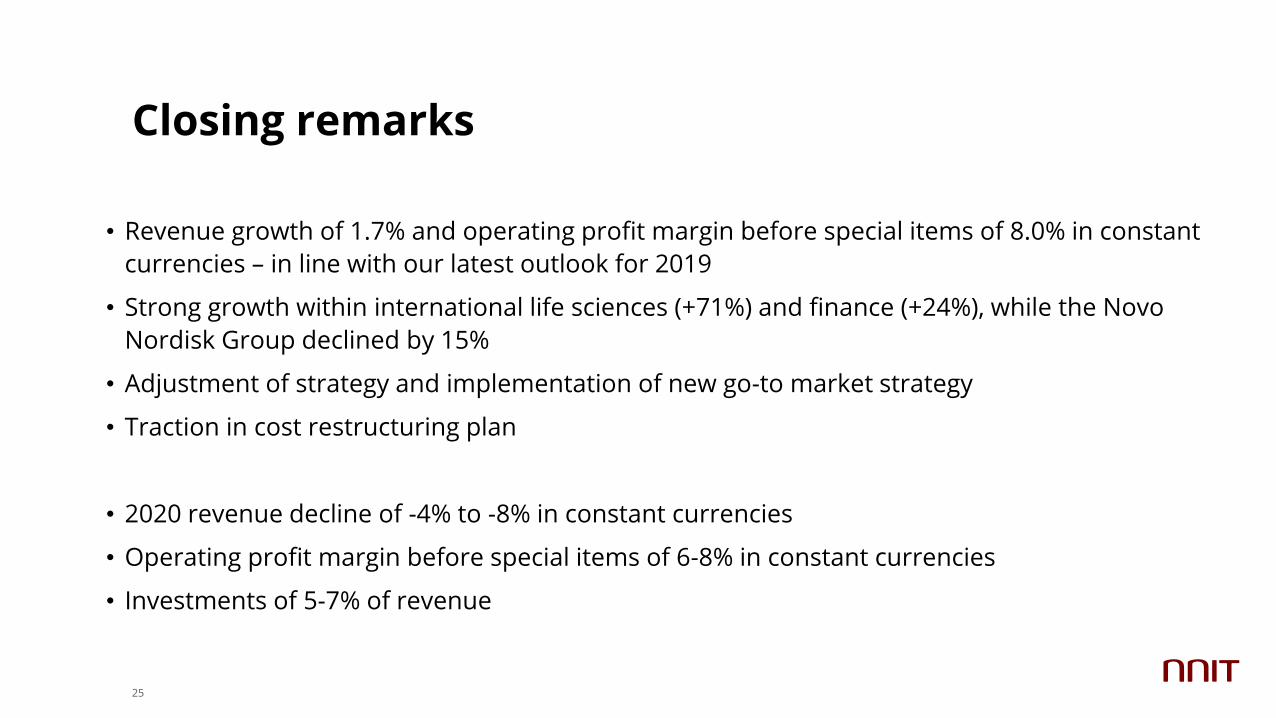
Closing remarks
• Revenue growth of 1.7% and operating profit margin before special items of 8.0% in constant
currencies – in line with our latest outlook for 2019
• Strong growth within international life sciences (+71%) and finance (+24%), while the Novo
Nordisk Group declined by 15%
• Adjustment of strategy and implementation of new go-to market strategy
• Traction in cost restructuring plan
• 2020 revenue decline of -4% to -8% in constant currencies
• Operating profit margin before special items of 6-8% in constant currencies
• Investments of 5-7% of revenue
25
Investor contact information
CARSTEN KROGSGAARDTHOMSENChief Financial Officer
NNIT A/S, Østmarken 3A, 2860 Søborg, Denmark+45 3075 [email protected]
Upcoming events Investor contact regarding Q4 2019
March 5, 2020:
• Annual General Meeting
May 6, 2020
• Interim report for the first three months of 2020
August 13, 2020
• Interim report for the first six months of 2020
October 29, 2020
• Interim report for the first nine months of 2020
26