functional analysis of pseudorabies virus genes -...
TRANSCRIPT
Functional Analysis of Pseudorabies Virus Genes
PhD Thesis
Dóra Tombácz
Supervisor: Zsolt Boldogkői
Department of Medical Biology
University of Szeged
Szeged, Hungary
2010
i
LIST OF PUBLICATIONS
FULL PAPERS DIRECTLY RELATED TO THE SUBJECT OF THE THESIS
I. Tombácz D, Tóth JS, Petrovszki P, Boldogkői, Z: Whole-genome analysis of pseudorabies
virus gene expression by real-time quantitative RT-PCR assay. BMC Genomics 2009,
10:491. IF: 3.926
II. Boldogkői Z, Bálint K, Awatramani GB, Balya D, Busskamp V, Viney TJ, Lagali PS,
Duebel J, Pásti E, Tombácz D, Tóth JS, Takács IF, Scherf BG, Roska B: Genetically timed,
Activity sensor and Rainbow transsynaptic viral tools. Nature Methods 2009, 6, 127 - 130
IF: 13.651
III. Prorok J, Kovács PP, Kristóf AA, Nagy N, Tombácz D, Tóth SJ, Ördög B, Jost N,
Virágh L, Papp GJ, Varró A, Tóth A, Boldogkői Z: Herpesvirus-mediated delivery of a
genetically encoded fluorescent Ca2+ sensor to primary adult canine cardiomyocytes. J
Biomed Biotech 2009, 361795
IF: 2.563
IV. Rezek Ö, Boldogkői Z, Tombácz D, Kővágó C, Gerendai I, Palkovits M, Tóth
IE: Location of parotid preganglionic neurons in the inferior salivatory nucleus and its
relation to the superior salivatory nucleus of rat. Transneuronal labeling by pseudorabies
viruses. Neurosci Lett 2008, 440(3): 265-269.
IF: 2.200
FULL PAPERS NOT RELATED TO THE SUBJECT OF THE THESIS
I. Márton G, Tombácz D, Tóth JS, Szabó A, Boldogkői Z, Dénes, Á, Hornyák Á, Nógrádi
A: In vivo infection of human embryonic spinal cord neurons prior to transplantation into
adult mouse cord, BMC Neuroscience 2010, conditionally accepted for publication
IF: 2.850
CUMMULATIVE IF: 25.190
ii
ABSTRACTS RELATED TO THE SUBJECT OF THE THESIS
6. Tombácz D, Tóth JS, Petrovszki P, Boldogkői Z: Transcriptional analysis of Aujeszky’s
disease virus by Real-Time RT-PCR. Acta Microbiol Immunol Hung 2009, 56, 103.
5. Tóth JS, Tombácz D, Petrovszki P, Boldogkői Z: Regulatory function or transcriptional
noise? – Antisense RNS sin Aujeszky’s disease virus. Acta Microbiol Immunol Hung
2009, 56, 104.
4. Petrovszki P, Tombácz D, Tóth JS, Boldogkői Z: Activity sensor-expressing Aujeszky’s
disease viruses for neural circuit analysis. Acta Microbiol Immunol Hung 2009, 56, 81.
3. Tombácz D, Tóth JS, Boldogkői Z: Whole-genome analysis of pseudorabies virus by
Real-Time RT-PCR. Acta Microbiol Immunol Hung 2009, 56, 253.
2. Márton G, Tombácz D, Tóth J, Szabó A, Boldogkői Z, Nógrádi A: Inhibition of
pseudorabies virus spreading in the nervous system: effects of fluorescent tracers. Clin.
Neurosci 2007, 61: 1, 43-44.
1. Tombácz D, Pásti E, Takács I, Bálint K, Roska B, Tóth J , Boldogkői Z: Development of
pseudorabies virus-based transsynaptic gene delivery vectors. Acta Microbiol Immunol
Hung 2007, 54, 134-135.
ORAL PRESENTATIONS
7. Tombácz D, Tóth JS, Boldogkői Z: Whole-genome analysis of pseudorabies virus by
Real-Time RT-PCR. 2nd CEFORM Central European Forum for Microbiology, 2009,
Keszthely, Hungary
6. Tóth JS, Tombacz D, Bálint K, Roska B, Boldogkoi Z: Genetically modified pseudorabies
viruses for neural circuit analysis. I. International Student Medical Congress, 2009, Kosice,
Slovakia
5. Tombácz D, Boldogkői Z: Az Aujeszky-féle vírus összgenom analízise Real-Time RT-
PCR-ral. „Genetikai Műhelyek Magyarországon” - VIII. Genetikai minikonferencia, 2009,
Szeged, Hungary
iii
4. Tóth J, Tombácz D, Petrovszki P, Boldogkői Z: Az Aujeszky-féle vírus transzkriptom
vizsgálata kvantitatív RT-PCR-ral VIII. Magyar Genetikai Kongresszus / XV. Sejt- és
Fejlődésbiológiai Napok, 2009, Nyíregyháza, Hungary
3. Nagy V, Tombácz D, Boldogkői Z: Az Aujeszky-féle vírus genom transzkripciós
analízise. XXIX. Biológia OTDK, 2009, Veszprém, Hungary
2. Petrovszki P, Tombácz D, Tóth JS, Boldogkői Z: Neuronhálózatok aktivitásának
vizsgálata rekombináns Aujeszky-féle vírusokkal. Genetikai Minikonferencia, 2008, Szeged,
Hungary
1. Tombácz D, Tóth JS, Petrovszki P, Boldogkői Z: Az Aujeszky-féle vírus genom
transzkripciós analízise real-time RT-PCR technikával. A Magyar Mikrobiológiai Társaság
2008. évi Nagygyűlése, 2008, Keszthely, Hungary
POSTER PRESENTATIONS
12. Tombácz D, Tóth JS, Takács IF, Boldogkői Z: Global analysis of pseudorabies virus
gene expression by RT-PCR. Advances In Genomics Symposium, 2010, Ghent, Belgium
11. Ferecskó AS, Boldogkői Z, Tombácz D, Ördög B, Hirase H, Tiesinga P , Sík A:
Development of a novel pseudorabies virus-based method for monosynaptic neuronal
network tracing. IBRO International Workshop, 2010, Pécs, Hungary
10. Marton G, Tombacz D, Toth J, SzaboA, Boldogkői Z, Nógrádi A: Effect of the
fluorescent tracer Fast Blue on the Pseudorabies virus infection. Frontiers in system
neuroscience, 2009, Chicago, IL, USA
9. Tombácz D, Tóth JS, Petrovszki P, Boldogkői Z: Real-time RT-PCR Profiling of Global
mRNA Transcription from Pseudorabies Virus Genome. 34th International Herpesvirus
Workshop, 2009, Ithaca, NY, USA
8. Petrovszki P, Tombácz D, Tóth JS, Sík A, Bálint K, Roska B, Boldogkői Z: Fluorescent
calcium sensor expressing pseudorabies viruses for the study of neural circuits. HFSP 20th
Anniversary and 9th Awardees Meeting, 2009, Tokyo, Japan
iv
7. Márton G., Tombácz D, Tóth J, Szabó A, Boldogkői Z, Nógrádi A: Effect of the
fluorescent tracer Fast Blue on the Pseudorabies virus infection, A Magyar Idegtudományi
Társaság XII. Konferenciája, 2009, Budapest, Hungary
6. Prorok J, Tóth A, Iost N, Kovács PP, Kristóf AA, Tombácz D, Tóth J, Ördög B, Virág L,
Papp JG, Varró A, Boldogkői Z: Herpesvirus-mediated delivery of genetically encoded
fluorescent Ca2+ sensor to adult canine cardiomyocytes. 32nd Meeting of the European
Working Group on Cardiac and Cellular Electrophysiology, 2008, Madrid, Spain
5. Tombácz D, Tóth JS, Bálint K, Roska B, Boldogkői Z: Activity sensor expressing
pseudorabies viruses for the study of neural circuits. 33rd Annual International Herpesvirus
Workshop, 2008, Estoril, Portugal
4.Tóth JS, Tombácz D, Petrovszki P, Boldogkői Z: Genome-wide antisense transcription in
pseudorabies virus. 33rd Annual International Herpesvirus Workshop, 2008, Estoril, Portugal
3. Tóth JS, Tombácz D, Petrovszki P, Boldogkői Z: Szabályozás, vagy transzkripciós zaj? –
Antiszensz RNS-ek az Aujeszky-féle vírusnál. A Magyar Mikrobiológiai Társaság 2008. évi
Nagygyűlése, 2008, Keszthely, Hungary
2. Petrovszki P, Tombácz D, Tóth JS, Boldogkői Z: Aktivitás szenzort kifejező Aujeszky-
féle vírusok ideghálózatok térképezésére. A Magyar Mikrobiológiai Társaság 2008. évi
Nagygyűlése, 2008, Keszthely, Hungary
1. Tombácz D, Pásti E, Takács I, Bálint K, Roska B, Tóth J, Boldogkői Z: Development of
pseudorabies virus-based transsynaptic gene delivery vectors. 15th International Congress of
Hungarian Society for Mirobiology

v
CONTENTS
LIST OF ABBREVIATIONS iv.
INTRODUCTION 1.
Pseudorabies virus (PRV) 1.
The PRV genome and the genes 2.
Herpesvirus gene expression 2.
PRV genes 5.
(1) The early protein 0 (ep0) gene 5.
(2) Virion host shutoff (VHS, ul41) gene 5.
(3) The gE and the gI genes 6.
(4) Thymidine kinase (TK) gene 8.
(5) Ribonucleotide reductase (RR) gene 8.
Genomic sequences 8.
(1) ASP (antisense promoter) 8.
(2) PAC (Package and cleavage) 8.
(3) ORI (Origin of replication) 9.
(4) Neut region 9.
Antisense RNAs 9.
Herpesviruses as neural circuit tracers 11.
Herpesviruses as biological tools in cardiovascular research 12.
THE MAJOR AIMS OF THE STUDY 12.
MATERIALS AND METHODS 13.
Cells and viruses 13.
Porcine kidney 15 (PK-15) cells 13.
Canine cardiomyocytes 13.
PRV strains 13.
Infection conditions 14.
Viral DNA preparation 14.
Primers for RT and PCR 15.
Polymerase chain reaction (PCR) 15.
RNA preparation 16.
Quantitative Real-Time RT-PCR 16.
Reverse transcription (RT) 16.

vi
Real-time PCR 17.
Statistics 17.
Calculation of relative expression ratio (R) 17.
Calculation of the modified R values: Ra, R∆, Ri-PAA and Ri-CHX 18.
Analysis and presentation of Real-Time PCR data 18.
Gel electrophoresis 19.
Restriction endonuclease (RE) analysis 19.
Construction of recombinant plasmids 19.
DNA sequencing 19.
Construction of targeting vectors 20.
Flanking sequences 20.
Reporter genes 20.
Modification of the gE and gI coding region 20.
Neut region 20.
Construction of the TK-expression cassette 21.
Generation of PRV amplicon constructs 21.
Creation of ep0 gene targeting vector 21.
Generation of the RR gene targeting vector 21.
ASP (putative antisense promoter) region 21.
Transfection 22.
Generation and isolation of recombinant viruses 22.
Activity sensor PRVs 22.
Generation of Ka-VHS-Lac virus strain 23.
Generation of ∆TK viruses 23.
Construction of colorless KO viruses 23.
RESULTS 24.
Whole-genome analysis of wild-type (wt) PRV 24.
Kinetic classes of PRV genes on the basis of dependence 24.
of gene expression on DNA replication
and de novo protein synthesis
Characterization of the kinetic properties of the PRV genes 27.
in untreated cells
Define the expression pattern of the whole PRV genome 27.
Detection and analysis of antisense RNAs 29.
vii
Gene expression analysis of a VHS-deleted mutant PRV 34.
Analysis of individual PRV genes 37.
Glycoprotein E and I (gE and gI) 37.
Thymidine kinase (TK) 38.
Ribonucleotide reductase (RR) 38.
Early protein 0 (ep0) 38.
Antisense promoter (ASP) 38.
The use of genetically modified viruses 38.
A PRV-∆TK and amplicon-based system for the study 38.
of neural connections
Timer, Rainbow and Activity sensor PRVs 39.
for the study of the structure and function of the brain
PRV-mediated gene delivery to cultured cardiomyocytes 39.
Dual viral transneuronal tracing with Ba-DsRed 40.
DISCUSSION 41.
Global expression analysis of pseudorabies virus genome 41.
Functional analysis of the virus genes 44.
Timer, Rainbow and Activity sensor viruses 44.
for the analysis of the brain structure and function
Examination of monosynaptic neural connections 44.
PRV-mediated gene delivery into cardiomyocytes 45.
Dual viral tracing of neurons 45.
SUMMARY 46.
…OF THE TRANSCRIPTIONAL ANALYSIS 46.
…OF THE VIRAL TRACING METHODS 46.
…OF PRV-BASED GENE DELIVERY 46.
REFERENCES 747.
ACKNOWLEDGEMENTS 58.
ANNEX: Publications related to the subject of the Thesis
viii
LIST OF ABBREVIATIONS
AS-RNA Antisense RNA
ASP Putative Antisense promoter
BDR Bartha DsRed
CFP Cyan fluorescent protein
CHX Cycloheximide
CNS Central nervous system
Ct Threshold cycle
DMEM Dulbecco's Modified Eagle Medium
E Early
E Efficiency
EDTA Ethylene diamine tetra-acetic acid
EHV Equine herpesvirus
ep0 Early protein 0 gene
EtBr Ethidium bromide
FP Fluorescent protein
FRET Fluorescence resonance energy transfer
GCV (MP, TP) Ganciclovir (monophosphate, triphosphate)
GFP Green fluorescent protein
HSV (-1, -2) Herpes simplex virus (type-1 and type-2)
IE Immediate early
IR Inverted repeat
ISN Inferior salivatory nucleus
KO Knock-out
L Late
LAP Latency-associated promoter
LAT Latency associated transcript
LLT Long latency transcript
MARCKS2 Myristoylated alanine-rich C-kinase substrate
memGFP Membrane-targeted green fluorescent protein
miRNA micro RNA
mRFP Monomeric red fluorescent protein
MOI Multiplicity of infection
ix
NC Non-coding
ORF Open reading frame
ORI Origin of replication
PAA Phosphonoacetic acid
PAC element Packaged and cleavaged
PBS Phosphate buffered saline
PCR Polymerase chain reaction
piRNA piwi-interacting RNA
PK-15 Porcine kidney 15
PRV Pseudorabies virus
PRV –Ba Bartha strain of PRV
PRV– Ka Kaplan strain of PRV
r Pearson’s correlation coefficient
R Relative expression ratio
Ra Rates of change
R∆ Net increase of the relative expression ratios between two time points
RE Restriction endonuclease
Ri-CHX Inhibitory effect of CHX on the gene expression
Ri-PAA Inhibitory effect of PAA treatment on the gene expression
RR Ribonucleotide reductase
RT Reverse transcription
RT2-PCR Reverse transcription Real-Time PCR
SDS Sodium dodecyl sulfate
SE Standard error
siRNA Small interfering RNA
SSN Superior salivatory nucleus
TBE Tris-borate-EDTA buffer
TFP Teal fluorescent protein
Tm Melting temperature
TR Terminal repeat
UT Untreated (non treated)
VHS Virion host shutoff
VZV Varicella zoster virus
wt wild-type
1
INTRODUCTION
Pseudorabies virus
The pseudorabies virus (PRV; also called suid herpesvirus type 1, or Aujeszky’s disease virus)
belongs to the subfamily of Alphaherpesvirinae (also called neurotropic herpesviruses) of
Herpesviridae family. PRV, together its close relatives, the Varicella-zoster virus, the bovine
herpesviruses and equine herpesviruses are the members of the Varicellovirus genus. In spite
of its name, PRV has no relationship to rabies virus; the name came from the symptoms similar
to those of rabies caused in susceptible animals [1]. PRV is an important pathogen of swine,
causing Aujeszky’s disease [2]. Albeit, great efforts have been taken to eradicate PRV in
Europe and in the United States, it still causes economic losses in many countries worldwide
[3]. This virus has an extremely broad host spectrum including, among others, rodents,
ungulates and carnivorous animals. However, human, higher primates and horses are resistant
to PRV infection [1]. PRV can exhibit two alternative infectious pathways; it can infect cell in
a lytic way causing cytopathic effects and producing new viral particles, or it can establish
latency in the sensory ganglia [3].
Due to the significant homology among the members of neurotropic herpesviruses, information
derived from the PRV studies provides a powerful opportunity for comparative molecular
virology [4]. PRV is a frequently used model organism for studies in pathogenesis and
molecular biology of herpesviruses. Furthermore, this virus is widely utilized as a neural circuit
tracer [5, 6 and 7] in neurobiology, and it has also reported to serve as a suitable too for gene
delivery to various cells [8, 9].
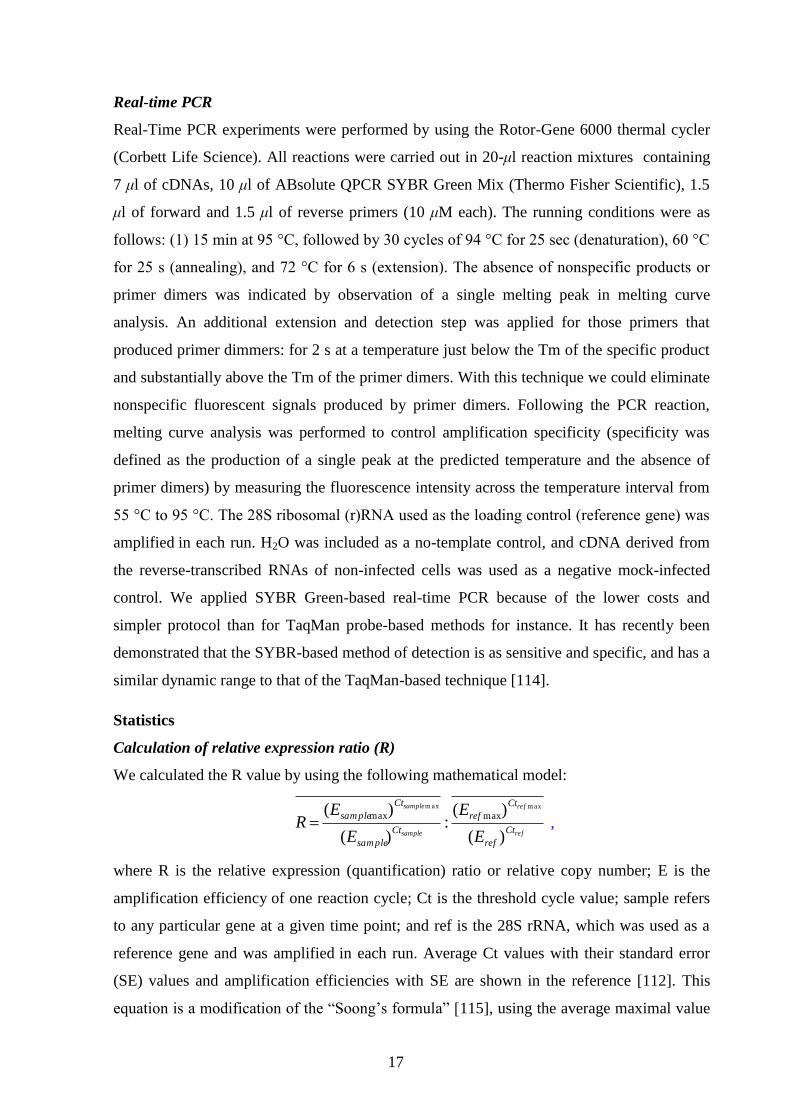
Like all the member of herpesviruses, the PRV contains a large linear double-stranded (ds)
DNA genome (it is 142 kb in length with a G+C content of 74%) and has 70 protein coding
genes. The virus genome consists of a unique long (UL) and a unique short (US) region flanked
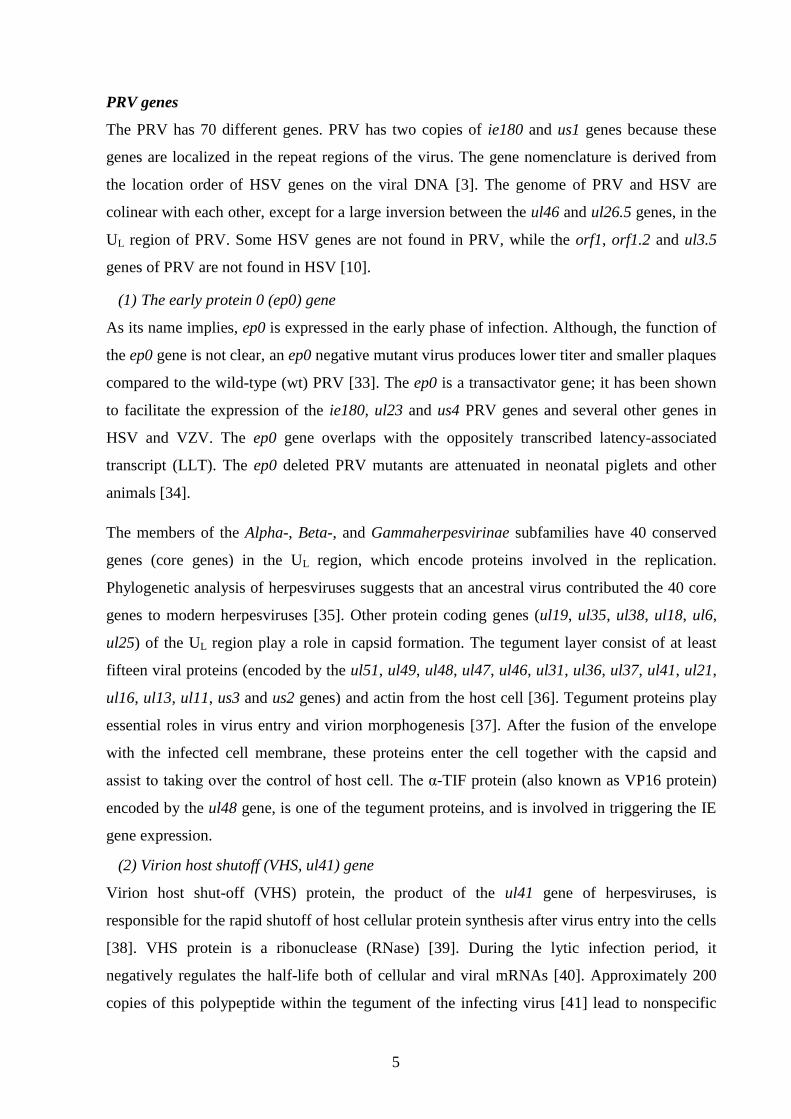
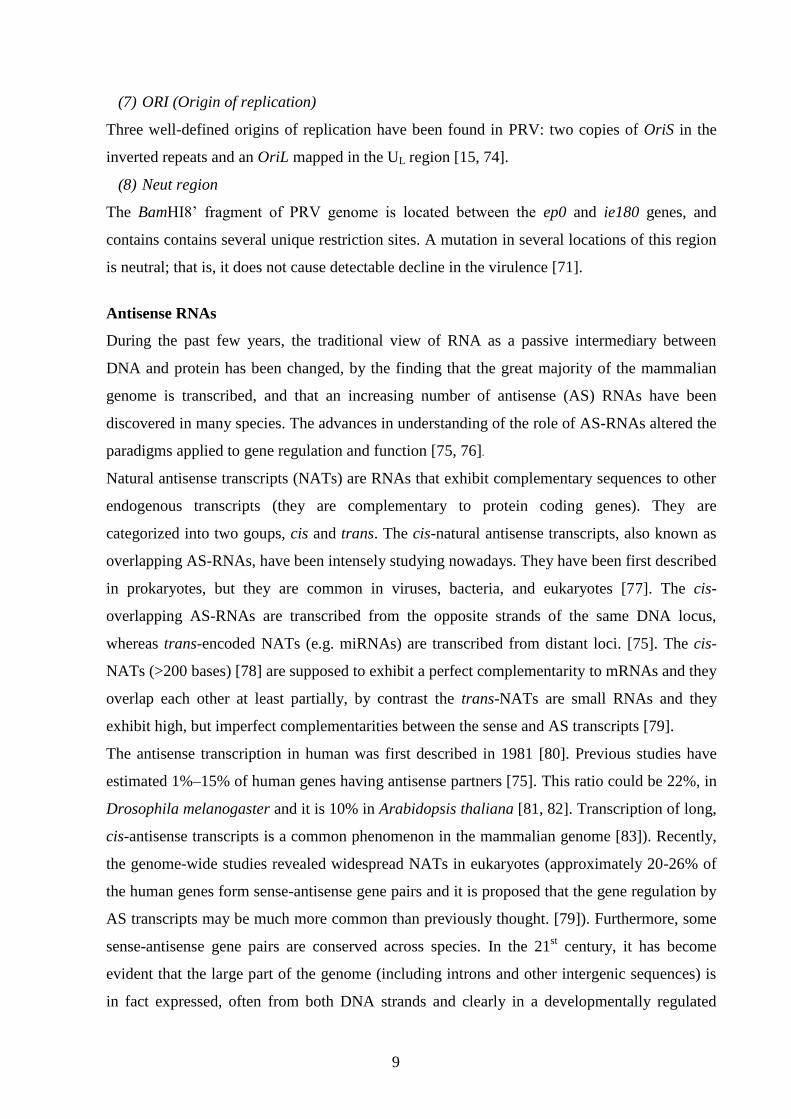
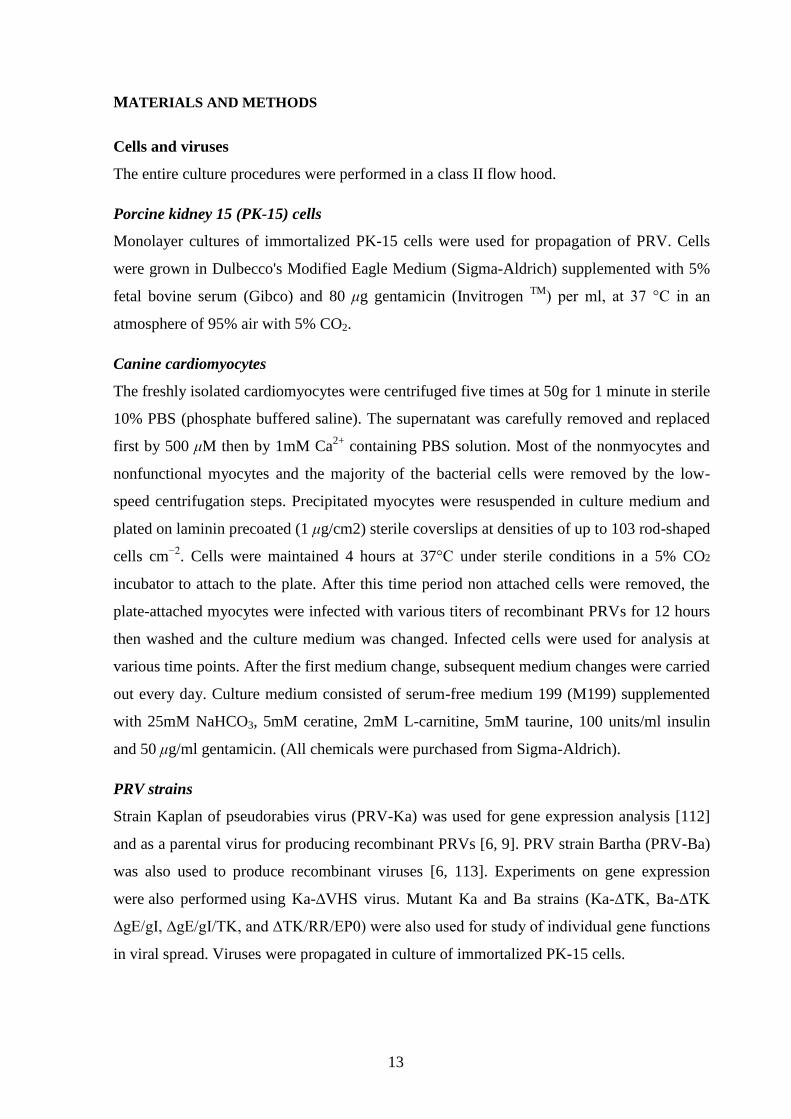
by inverted repeat (IR) sequences. About half of the gene products are structural components
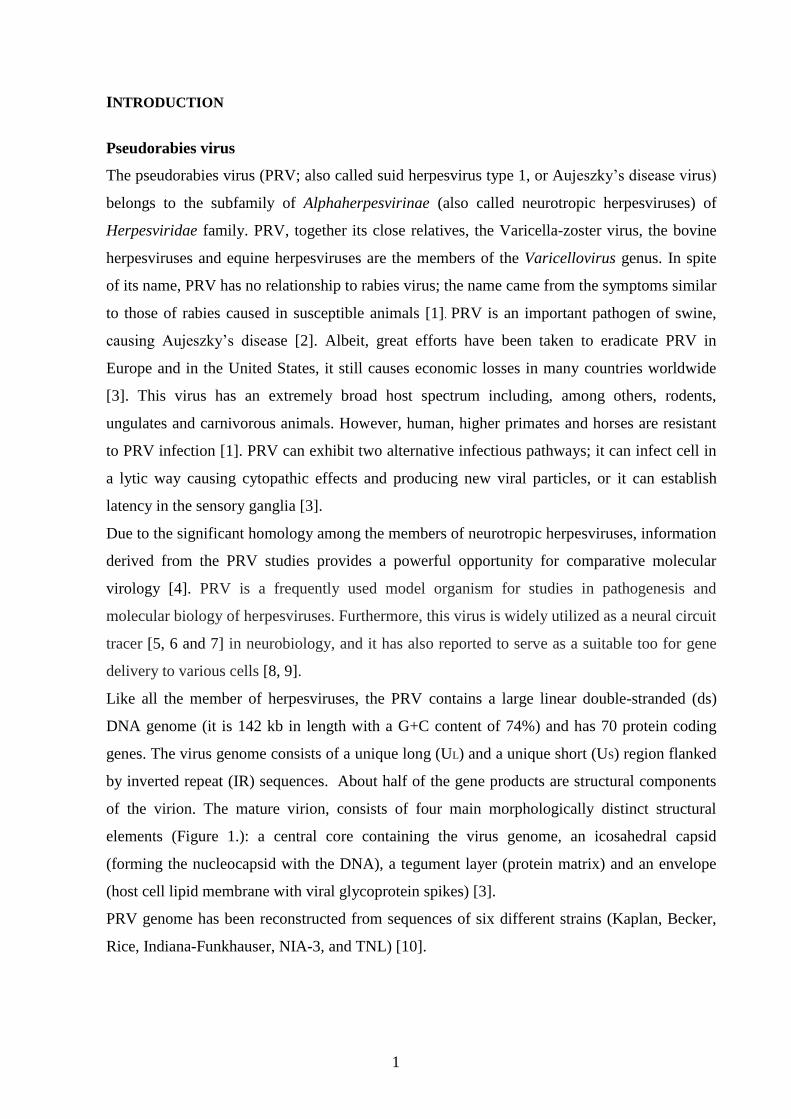
of the virion. The mature virion, consists of four main morphologically distinct structural
elements (Figure 1.): a central core containing the virus genome, an icosahedral capsid
(forming the nucleocapsid with the DNA), a tegument layer (protein matrix) and an envelope
(host cell lipid membrane with viral glycoprotein spikes) [3].
PRV genome has been reconstructed from sequences of six different strains (Kaplan, Becker,
Rice, Indiana-Funkhauser, NIA-3, and TNL) [10].
2
Figure 1. A schematic drawing and an electron microscope image of the PRV virion.
The PRV genome and the genes
Herpesvirus gene expression
The expression of PRV genes is mainly regulated at the level of transcription. The genes of -
herpesviruses are divided into three major temporal classes: (immediate-early, IE or ; early, E
or β, and late, L or ), which are regulated in a coordinated, cascade-like fashion [11 and 12].
First the IE genes are expressed, independently of de novo protein synthesis from the virus.
They are regulatory genes. PRV contains a single IE gene, the ie180 gene homologous to
herpes simplex virus (HSV) ICP4 gene, which is transactivator of the expression of the entire
PRV genes. Early genes are mainly involved in DNA synthesis of the virus. On a finer scale,
the E genes can be subdivided into β1 (E) and β2 (E/L) genes. Finally, the late genes are
expressed; they mainly encode the structural elements of the virus. Blockers of DNA
replication inhibit the expression of L genes to a larger extent than E genes expression. The
transcription of the L genes is partially (1, leaky L genes) or completely (2, true L genes)
dependent on the viral DNA synthesis [3].
HSV expresses 5 IE genes: icp0, icp4, icp22, icp27 and icp47, while PRV encodes a single IE
gene, the ie180 gene. The ep0 (homologous to the homolog of HSV icp0 gene; [13] and ul54
(homologous to the icp27 of HSV; [14]) are expressed proteins in E kinetics in PRV, and this
virus lacks the icp47 gene. There is no consensus as to whether the US1 protein (Rsp40;
homologous to HSV ICP22) is expressed in the IE [15] or the E kinetics [16].
Infection of cells by herpesviruses can lead to either lytic (productive) or latent infection [3].
In productive infection, the entire transcription machinery of the herpesvirus is initiated, and
the progress of infection leads to the production of new virus particles, meanwhile exerting
strong cytotoxic effects. Contrary to productive infection, during the latent stage, a limited
3
segment (latency-associated transcript; LAT region) of the herpesvirus genome is
transcriptionally active [17], no new virions are produced and the cells survive the infection.
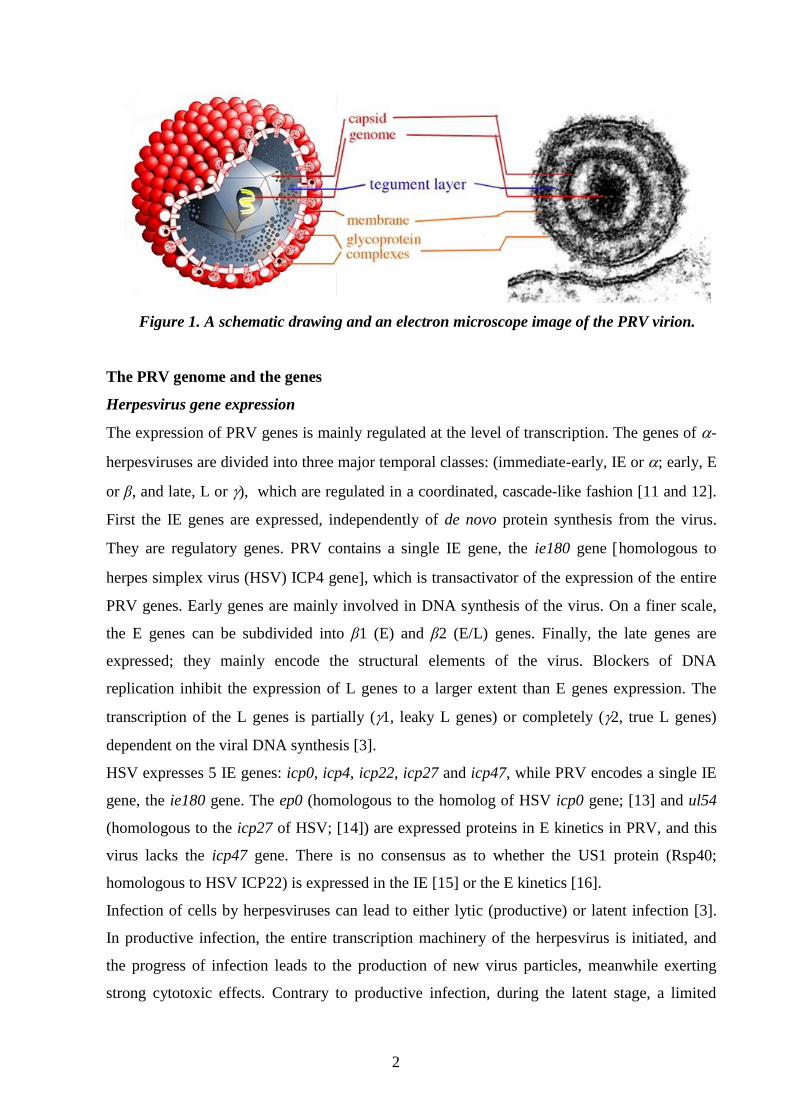
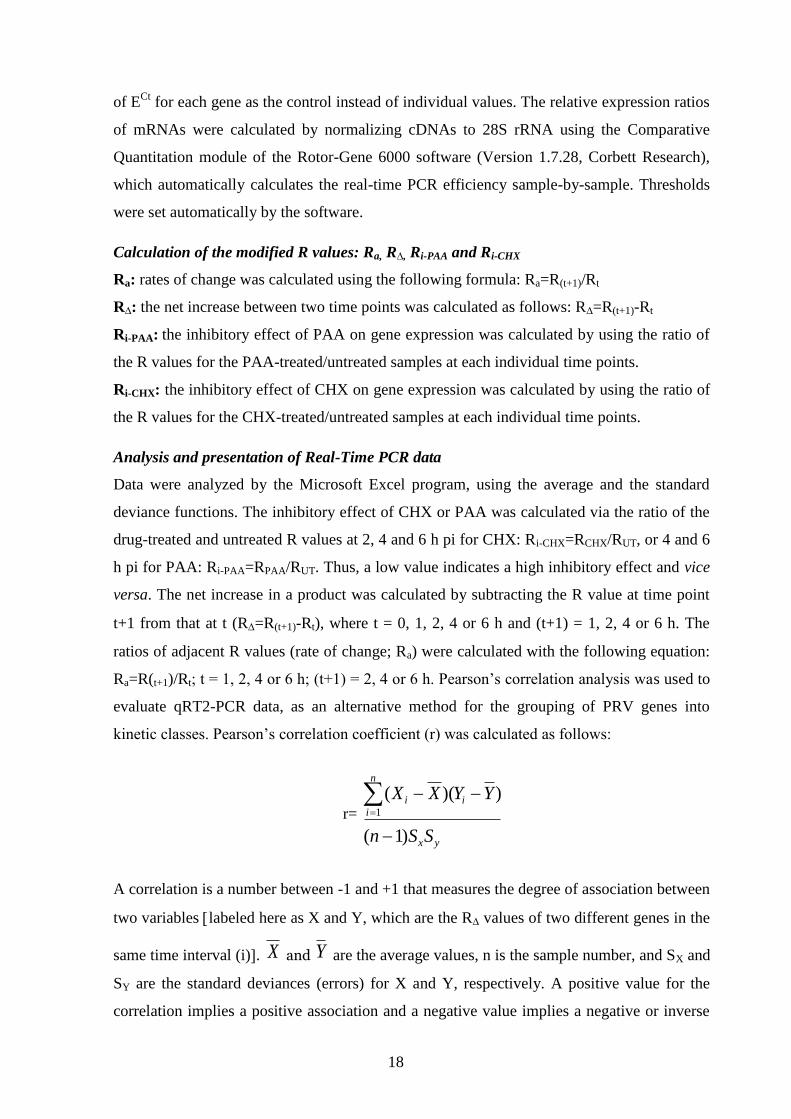
The LATs are transcribed from the opposite strand of EP0 gene [3]. A characteristic feature of
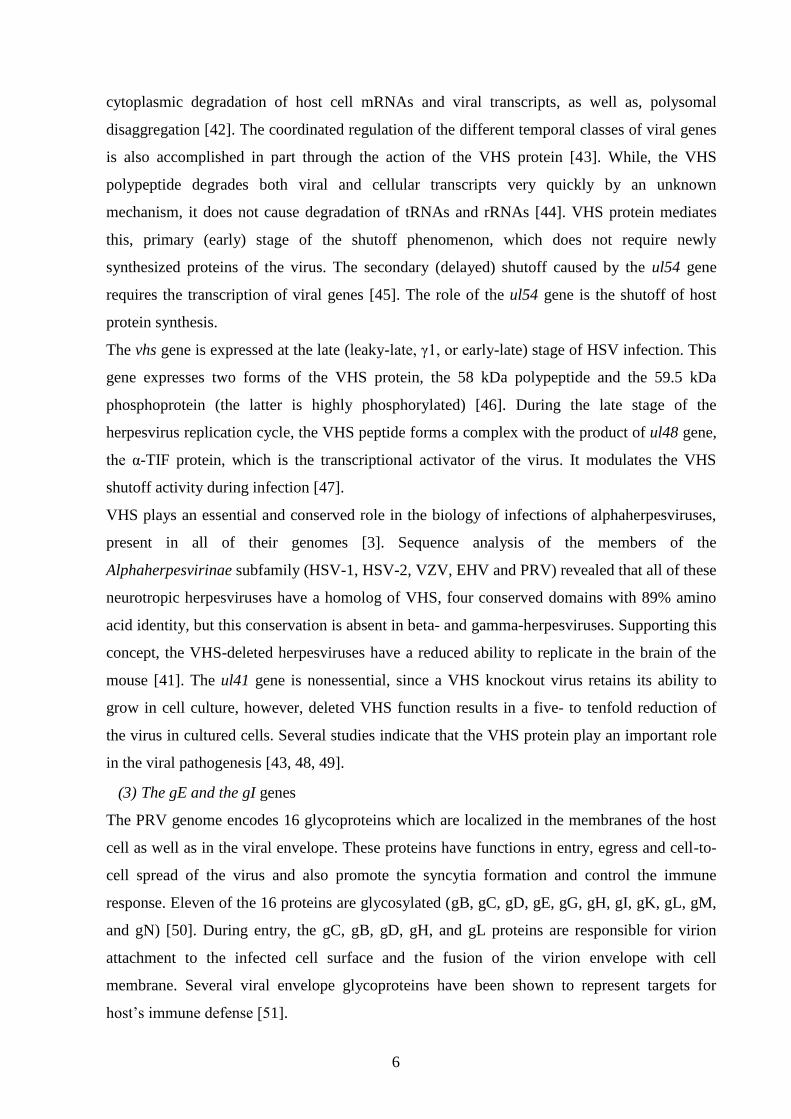
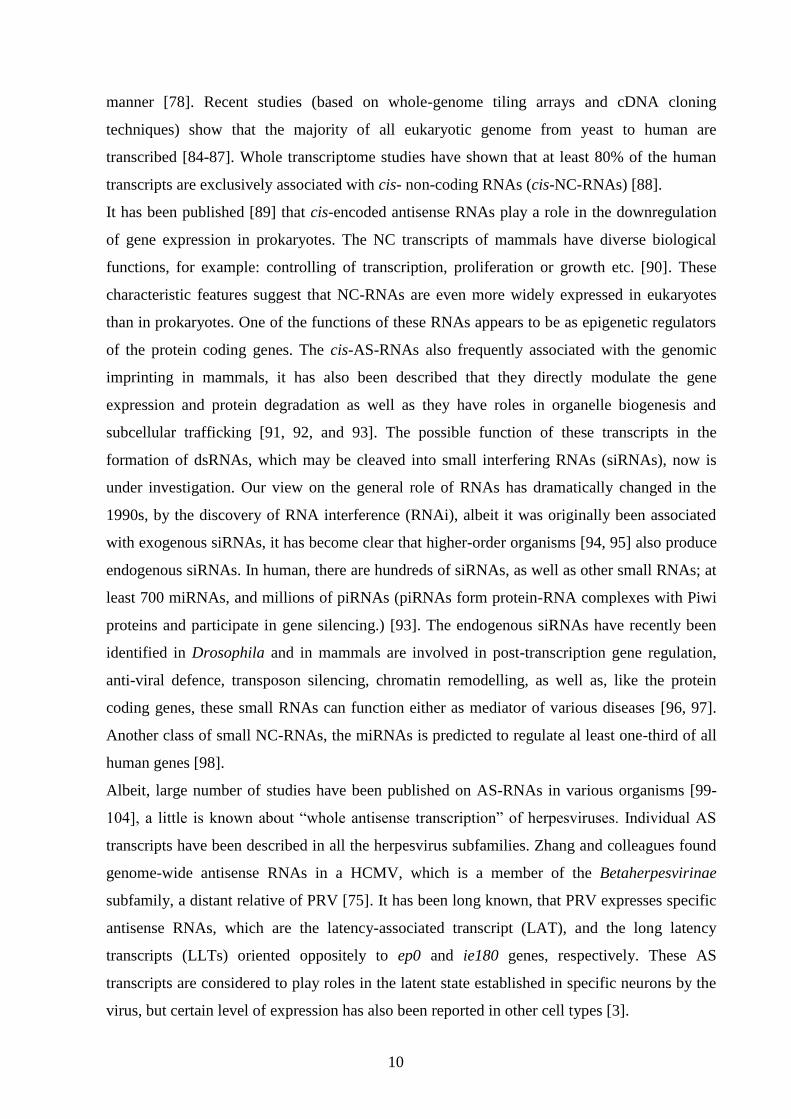
the organization of the herpesvirus genome is so called nested localization of genes which
produce 3’-coterminal transcripts. Nested genes form convergent (Figure 2.) or divergent
clusters on the PRV genome.
Figure 2. Schematic illustration of oppositely
oriented nested gene clusters with common 3’
ends. Arrows represents the PRV genes and their
orientations, while the rectangules represents the
protein coding sequences.
ICP27 has been reported to affect the use of certain internal polyA signals, resulting in
differential transcript lengths throughout the life cycle of the virus [18, 19]. The read-through
of transcription of the nested genes is regulated by the ICP27 protein [18]. In neurotropic
herpesviruses only a few gene was found to be spliced. PRV contains two spliced (US1 and
LAT) and a putative spliced transcript (UL15). Their homologs are also spliced in HSV [3].
Traditionally, herpesvirus gene expression has been analyzed using Northern blot technique,
ribonuclease protection assay, and end-point RT-PCR analysis. Nevertheless, these techniques
have several disadvantages. For example, Northern blotting is time-consuming and labor-
intensive, allows only semiquantitative determination of the mRNA level and it is looking at
one or a small number of genes at the same time. Moreover, hybridization-based membrane
arrays profile changes in a nonlinear fashion, tending to overemphasize large alterations, and
they are insensitive to smaller variations. Ribonuclease protection assay-based methods require
the use of polyacrylamide gel electrophoresis and typically utilize radioactively labeled probes.
The limitations of endpoint PCR technique are the low sensitivity and resolution, the poor
precision, and the variable endpoints between samples. The endpoint detection is very time
consuming and need for post PCR processing (ethidium bromide for staining which is not very
quantitative).
Over the past decade, DNA chip techniques have revolutionized practically all disciplines of
molecular biology, including herpesvirus research. Contrary to the traditional methods,
microarray analysis is applicable for the parallel analysis of a large set of gene product, and
even whole genomes. The disadvantage of DNA chip technology is associated with the
uncertain quality control: it is impossible to assess the identity of DNA immobilized on any
4
microarray. Further, fluorescence technology, which is the most commonly used detection
method for array readouts is reproducible, but is limited in sensitivity and there are many
artifacts associated with image and data analysis. Real-time RT-PCR (RT2-PCR) is an
alternative to microarray techniques for the analysis of transcription from multiple genes.
An advantage of RT-PCR is its high sensitivity compared to other high-throughput assays.
Furthermore, the RT-PCR technique offers numerous other advantages, such as reproducible
quantitation of DNA copies and large dynamic range. Furthermore, in RT2-PCR various
controls can be included to ensure accuracy, such as a loading control to verify equal cDNA
loading, a no-primer control to prove a measure of non-amplification-related background, a no-
template control to screen for possible contamination of reagents or false amplification
products, and a no-RT control with confirm the absence of DNA contamination. In contrast to
DNA chip techniques, in RT-PCR the parameters for each gene can be individually optimized.
Moreover, the identity of PCR products can be confirmed through melting curve analysis,
restriction endonuclease analysis, or DNA sequencing. In fact, real-time PCR is often used to
verify gene expression data obtained by microarrays. Nevertheless, considerable pitfalls may
be associated with this technique. The major disadvantage of real-time RT-PCR compared to
microarray techniques is the higher cost and labor-consuming work for a large number of
samples. Another disadvantage of real-time PCR as compared with blotting techniques is that
only the accumulation, but not the size of the transcripts can be monitored. Microarray
techniques have recently been applied to investigate herpesvirus gene expression [20, 21, 22
and 23]; to analyze the effects of the deletion of particular viral genes or of the specific
experimental conditions on whole-genome viral gene expression [24, 25, and 26]; and to
analyze the impact of virus infection on the expression of cellular genes [27, 28, 29 and 30].
The kinetic properties of PRV genes have been characterized by traditional methods, but many
of its genes have not yet been studied at all. Flori and colleagues [30] investigated the dialog
between PRV and epithelial cells, but obtained poor resolution for viral transcripts that did not
provide conclusive data on the temporal expression of the PRV genes. To date, RT2-PCR has
not been frequently utilized in herpesvirus research for global gene expression analysis. With
this technique Oster and Höllsberg [31] performed an expression study of 35 genes of human
herpesvirus 6B, a β-herpesvirus, and Dittmer and co-workers [32] carried out a whole-genome
profiling of the rhesus monkey rhadinovirus, a -herpesvirus. As far as we are aware, no
genome-wide expression data obtained by RT2-PCR have been published so far on -
herpesviruses.
5
PRV genes
The PRV has 70 different genes. PRV has two copies of ie180 and us1 genes because these
genes are localized in the repeat regions of the virus. The gene nomenclature is derived from
the location order of HSV genes on the viral DNA [3]. The genome of PRV and HSV are
colinear with each other, except for a large inversion between the ul46 and ul26.5 genes, in the
UL region of PRV. Some HSV genes are not found in PRV, while the orf1, orf1.2 and ul3.5
genes of PRV are not found in HSV [10].
(1) The early protein 0 (ep0) gene
As its name implies, ep0 is expressed in the early phase of infection. Although, the function of
the ep0 gene is not clear, an ep0 negative mutant virus produces lower titer and smaller plaques
compared to the wild-type (wt) PRV [33]. The ep0 is a transactivator gene; it has been shown
to facilitate the expression of the ie180, ul23 and us4 PRV genes and several other genes in
HSV and VZV. The ep0 gene overlaps with the oppositely transcribed latency-associated
transcript (LLT). The ep0 deleted PRV mutants are attenuated in neonatal piglets and other
animals [34].
The members of the Alpha-, Beta-, and Gammaherpesvirinae subfamilies have 40 conserved
genes (core genes) in the UL region, which encode proteins involved in the replication.
Phylogenetic analysis of herpesviruses suggests that an ancestral virus contributed the 40 core
genes to modern herpesviruses [35]. Other protein coding genes (ul19, ul35, ul38, ul18, ul6,
ul25) of the UL region play a role in capsid formation. The tegument layer consist of at least
fifteen viral proteins (encoded by the ul51, ul49, ul48, ul47, ul46, ul31, ul36, ul37, ul41, ul21,
ul16, ul13, ul11, us3 and us2 genes) and actin from the host cell [36]. Tegument proteins play
essential roles in virus entry and virion morphogenesis [37]. After the fusion of the envelope
with the infected cell membrane, these proteins enter the cell together with the capsid and
assist to taking over the control of host cell. The α-TIF protein (also known as VP16 protein)
encoded by the ul48 gene, is one of the tegument proteins, and is involved in triggering the IE
gene expression.
(2) Virion host shutoff (VHS, ul41) gene
Virion host shut-off (VHS) protein, the product of the ul41 gene of herpesviruses, is
responsible for the rapid shutoff of host cellular protein synthesis after virus entry into the cells
[38]. VHS protein is a ribonuclease (RNase) [39]. During the lytic infection period, it
negatively regulates the half-life both of cellular and viral mRNAs [40]. Approximately 200
copies of this polypeptide within the tegument of the infecting virus [41] lead to nonspecific
6
cytoplasmic degradation of host cell mRNAs and viral transcripts, as well as, polysomal
disaggregation [42]. The coordinated regulation of the different temporal classes of viral genes
is also accomplished in part through the action of the VHS protein [43]. While, the VHS
polypeptide degrades both viral and cellular transcripts very quickly by an unknown
mechanism, it does not cause degradation of tRNAs and rRNAs [44]. VHS protein mediates
this, primary (early) stage of the shutoff phenomenon, which does not require newly
synthesized proteins of the virus. The secondary (delayed) shutoff caused by the ul54 gene
requires the transcription of viral genes [45]. The role of the ul54 gene is the shutoff of host
protein synthesis.
The vhs gene is expressed at the late (leaky-late, γ1, or early-late) stage of HSV infection. This
gene expresses two forms of the VHS protein, the 58 kDa polypeptide and the 59.5 kDa
phosphoprotein (the latter is highly phosphorylated) [46]. During the late stage of the
herpesvirus replication cycle, the VHS peptide forms a complex with the product of ul48 gene,
the α-TIF protein, which is the transcriptional activator of the virus. It modulates the VHS
shutoff activity during infection [47].
VHS plays an essential and conserved role in the biology of infections of alphaherpesviruses,
present in all of their genomes [3]. Sequence analysis of the members of the
Alphaherpesvirinae subfamily (HSV-1, HSV-2, VZV, EHV and PRV) revealed that all of these
neurotropic herpesviruses have a homolog of VHS, four conserved domains with 89% amino
acid identity, but this conservation is absent in beta- and gamma-herpesviruses. Supporting this
concept, the VHS-deleted herpesviruses have a reduced ability to replicate in the brain of the
mouse [41]. The ul41 gene is nonessential, since a VHS knockout virus retains its ability to
grow in cell culture, however, deleted VHS function results in a five- to tenfold reduction of
the virus in cultured cells. Several studies indicate that the VHS protein play an important role
in the viral pathogenesis [43, 48, 49].
(3) The gE and the gI genes
The PRV genome encodes 16 glycoproteins which are localized in the membranes of the host
cell as well as in the viral envelope. These proteins have functions in entry, egress and cell-to-
cell spread of the virus and also promote the syncytia formation and control the immune
response. Eleven of the 16 proteins are glycosylated (gB, gC, gD, gE, gG, gH, gI, gK, gL, gM,
and gN) [50]. During entry, the gC, gB, gD, gH, and gL proteins are responsible for virion
attachment to the infected cell surface and the fusion of the virion envelope with cell
membrane. Several viral envelope glycoproteins have been shown to represent targets for
host’s immune defense [51].
7
The standard nomenclature of alpha-herpesvirus glycoproteins was adopted at the 18th
International Herpesvirus Workshop in 1993. PRV glycoprotein E (gE) and glycoprotein I (gI)
(encoded by the us8 and us7 genes, respectively) form non-covalently bound physical, hetero-
oligomeric complexes which are conserved in -herpesviruses and many functions attributed
to them [52, 53, 54].
The US8 transcript of PRV is categorized as an early gene [55], while its homolog in HSV is
described either as an early [56, 57] or as a late gene [58, 59]; so there is no consensus on this
issue. The us8 gene codes for the gE glycoprotein which plays an important role in direct cell-
to-cell spread of the virus [54, 60, 61, 62 and 63]. The gE is also required for neurovirulence. This
protein is dispensable for viral replication in tissue culture and infection. In cell cultures, the
gE-deleted virus forms smaller plaques than the wild type. The domain mediating
neurovirulence is encoded within the cytoplasmic tail of the gE protein [64]. Several studies
suggest that the gE cytoplasmic tail interacts with the products of ul49 gene (VP22 protein).
This tegument protein also interacts with the glycoprotein M (gM, encoded by the ul10 gene).
The gE protein together with the gM and VP22, plays a role in the secondary envelopment of
the virus during egress [65]. The cytoplasmic tail of gE is not required for the formation of a
complex with glycoprotein (g)I. The gE gene of PRV is conserved among the neurotropic
herpesviruses indicating the importance of this gene for these viruses. The us7 gene of PRV
encodes the viral glycoprotein gI. Our knowledge about the us7 expression kinetics in PRV is
very poor; its transcript was detected 6 hours post-infection at high MOI (multiplicity of
infection) in porcine kidney–15 (PK-15) cells. Kinetic properties are not well characterized in
HSV either (it is an early or a late gene; there is no general agreement on this issue).
The gI is not an essential protein for replication in tissue culture [66]. The gE/gI complex plays
a role in anterograde spread of the virus from the peripheral nervous system to the central
nervous system [54, 60-63]. Following the infection of the rat eye, the wild type virus
replicates in retinal ganglion neurons and then spreads in an anterograde manner to all visual
nuclei in the central nervous system (CNS) [67]. Contrary to the wt PRV, gE/gI mutant viruses
replicate in the eye, but do not spread to the second-order neurons in CNS. Infection of
olfactory nervous pathway, as well as trigeminal ganglia of swine with gE/gI-mutant PRV
showed reduced neuronvirulence and defective anterograde spread in the CNS [54, 60-62]. In
cell culture, the gI-deleted virus forms smaller plaques [62]. The gE and gI glycoproteins are
not required for retrograde spreading [64]. Glycoprotein I homologs are found only in
Alphaherpesvirinae.
8
(4) Thymidine kinase (TK) gene
Several enzymes encoded by the PRV genome are involved in the nucleotide metabolism. For
example, PRV and also HSV contain the ul23 (encoding the viral thymidine kinase, TK), the
ul50 (encoding dUTPase), ul39 and ul40 (encoding the large and small subunits of
ribonucleotide reductase, RR1 and RR2, respectively). The ul23 gene can only be found in the
- and γ-herpesvirus subfamilies. This enzyme has a key role in the replication of viral DNA;
it catalyzes the phosphorylation of deoxythymidine which is an important step in the dTTP
synthesis pathway. The TK gene is not essential for virus replication in cultured cells, but it is
essential for the propagation in living animals: UL23-negative PRV mutants are not able to
replicate in mice, rabbits or pigs [68, 69].
(5) Ribonucleotide reductase (RR) gene
The RR enzyme catalyzes the conversion of ribonucleotide diphosphates into
deoxyribonucleotide diphosphates, which are raw materials for the DNA synthesis. The
herpesvirus enzymes consist of two non-identical subunits. The RR subunits are encoded by
the ul39 (the large subunit, RR1) and ul40 (the small subunit, RR2) genes. The ul39 or ul40
mutant PRV viruses are able to replicate in cell culture, while are severely attenuated in pigs
and mice. The RR1 gene contains several highly conserved sequences [70].
Genomic sequences
(5) ASP (antisense promoter)
The putative antisense promoter (ASP) is located at the inverted repeat region of the PRV,
therefore, it is represented in two copies. It has been suggested that the role of ASP is to
control the expression of an antisense transcript called AST (antisense transcript), but it’s
precise function has not yet been elaborated. It has been earlier reported that even a point
mutation in the ASP region (within the putative TATAA box of the promoter) results in a
significant reduction of virulence in PRV [71].
(6) PAC (Package and cleavage)
The encapsidation of the PRV genome requires the cleavages of the replicated concatameric
DNA into monomeric DNA segments followed by the packaging of these unit-length PRV
DNA molecules into the empty capsids [72, 73]. Two conserved domains (the pac1 and the
pac2) at the ends of the linear herpesvirus genomes are necessary for the site-specific DNA-
cleavage and packaging. While the pac1 resides near the end of the TR (terminal repeat) and in
the IR sequence (close to the UL region), the pac2 domain is located at the end of the UL
region.
9
(7) ORI (Origin of replication)
Three well-defined origins of replication have been found in PRV: two copies of OriS in the
inverted repeats and an OriL mapped in the UL region [15, 74].
(8) Neut region
The BamHI8’ fragment of PRV genome is located between the ep0 and ie180 genes, and
contains contains several unique restriction sites. A mutation in several locations of this region
is neutral; that is, it does not cause detectable decline in the virulence [71].
Antisense RNAs
During the past few years, the traditional view of RNA as a passive intermediary between
DNA and protein has been changed, by the finding that the great majority of the mammalian
genome is transcribed, and that an increasing number of antisense (AS) RNAs have been
discovered in many species. The advances in understanding of the role of AS-RNAs altered the
paradigms applied to gene regulation and function [75, 76].
Natural antisense transcripts (NATs) are RNAs that exhibit complementary sequences to other
endogenous transcripts (they are complementary to protein coding genes). They are
categorized into two goups, cis and trans. The cis-natural antisense transcripts, also known as
overlapping AS-RNAs, have been intensely studying nowadays. They have been first described
in prokaryotes, but they are common in viruses, bacteria, and eukaryotes [77]. The cis-
overlapping AS-RNAs are transcribed from the opposite strands of the same DNA locus,
whereas trans-encoded NATs (e.g. miRNAs) are transcribed from distant loci. [75]. The cis-
NATs (>200 bases) [78] are supposed to exhibit a perfect complementarity to mRNAs and they
overlap each other at least partially, by contrast the trans-NATs are small RNAs and they
exhibit high, but imperfect complementarities between the sense and AS transcripts [79].
The antisense transcription in human was first described in 1981 [80]. Previous studies have
estimated 1%–15% of human genes having antisense partners [75]. This ratio could be 22%, in
Drosophila melanogaster and it is 10% in Arabidopsis thaliana [81, 82]. Transcription of long,
cis-antisense transcripts is a common phenomenon in the mammalian genome [83]). Recently,
the genome-wide studies revealed widespread NATs in eukaryotes (approximately 20-26% of
the human genes form sense-antisense gene pairs and it is proposed that the gene regulation by
AS transcripts may be much more common than previously thought. [79]). Furthermore, some
sense-antisense gene pairs are conserved across species. In the 21st century, it has become
evident that the large part of the genome (including introns and other intergenic sequences) is
in fact expressed, often from both DNA strands and clearly in a developmentally regulated
10
manner [78]. Recent studies (based on whole-genome tiling arrays and cDNA cloning
techniques) show that the majority of all eukaryotic genome from yeast to human are
transcribed [84-87]. Whole transcriptome studies have shown that at least 80% of the human
transcripts are exclusively associated with cis- non-coding RNAs (cis-NC-RNAs) [88].
It has been published [89] that cis-encoded antisense RNAs play a role in the downregulation
of gene expression in prokaryotes. The NC transcripts of mammals have diverse biological
functions, for example: controlling of transcription, proliferation or growth etc. [90]. These
characteristic features suggest that NC-RNAs are even more widely expressed in eukaryotes
than in prokaryotes. One of the functions of these RNAs appears to be as epigenetic regulators
of the protein coding genes. The cis-AS-RNAs also frequently associated with the genomic
imprinting in mammals, it has also been described that they directly modulate the gene
expression and protein degradation as well as they have roles in organelle biogenesis and
subcellular trafficking [91, 92, and 93]. The possible function of these transcripts in the
formation of dsRNAs, which may be cleaved into small interfering RNAs (siRNAs), now is
under investigation. Our view on the general role of RNAs has dramatically changed in the
1990s, by the discovery of RNA interference (RNAi), albeit it was originally been associated
with exogenous siRNAs, it has become clear that higher-order organisms [94, 95] also produce
endogenous siRNAs. In human, there are hundreds of siRNAs, as well as other small RNAs; at
least 700 miRNAs, and millions of piRNAs (piRNAs form protein-RNA complexes with Piwi
proteins and participate in gene silencing.) [93]. The endogenous siRNAs have recently been
identified in Drosophila and in mammals are involved in post-transcription gene regulation,
anti-viral defence, transposon silencing, chromatin remodelling, as well as, like the protein
coding genes, these small RNAs can function either as mediator of various diseases [96, 97].
Another class of small NC-RNAs, the miRNAs is predicted to regulate al least one-third of all
human genes [98].
Albeit, large number of studies have been published on AS-RNAs in various organisms [99-
104], a little is known about “whole antisense transcription” of herpesviruses. Individual AS
transcripts have been described in all the herpesvirus subfamilies. Zhang and colleagues found
genome-wide antisense RNAs in a HCMV, which is a member of the Betaherpesvirinae
subfamily, a distant relative of PRV [75]. It has been long known, that PRV expresses specific
antisense RNAs, which are the latency-associated transcript (LAT), and the long latency
transcripts (LLTs) oriented oppositely to ep0 and ie180 genes, respectively. These AS
transcripts are considered to play roles in the latent state established in specific neurons by the
virus, but certain level of expression has also been reported in other cell types [3].
11
Herpesviruses as neural circuit tracers
To understand the function of the brain, it is essential to know its structure and the connections
between neurons [8]. Due to fact that the CNS consist of a network of enormous number of
neurons it is practically impossible to track their connections without specifically labeling
individual neurons or a small group of cells [8, 105]. Various circuit labeling methods were
developed in the 1990s [8]. The non-viral techniques for mapping functional connections of
neurons involve the inoculation of dyes or enzymes into a particular region of the brain. The
tracing material is taken up from this area, by nerve terminals and transported along axons
[106]. However, most of these traditional tracers are not or inefficiently transported to
synaptically connected neurons. Hence, it is difficult to label multi-component neuronal
pathways by these dyes. Therefore, multisynaptic viral tracers are inevitable tools in the
analysis of neural pathways [1, 8]. Initially, wt and traditionally generated neurotropic viruses
were used for this purpose. Nevertheless, the natural features of these circuit-tracing viruses
impose severe limitations in tracing paradigms. Genetic engineering of these viruses offers a
tool to get rid of their disadvantageous properties (e. g. cytotoxicity) and to equip them with
novel characteristics lacking from their parent viruses [8].
In recent years PRV has become the most popular neurotropic herpesvirus for tracing studies, it
has been used as a live tracer of the neural networks due to its propensity to infect synaptically
connected neurons [3, 107]. PRV is suitable for delivering large foreign DNA fragments and
mutated genomic sequences. These properties of PRV make it a useful tool for studies in the
field of neuroscience.
PRVs expressing fluorescent proteins (FPs) are effective for labeling neurons in a functional
neural network in vitro and also in vivo. In addition, it is possible to generate recombinant
viruses expressing genetically encoded fluorescent Ca2+
indicators that report the activity of the
infected cells.
Generally, the virulent PRV strains (e.g. NIA-3, PRV-Becker), which induce rapid, lethal
inflammatory responses within 2-3 days after infection, are not suitable tracer, because the
injected animals die before the target neurons become infected [1].
One of the most widely used virus is an attenuated PRV strain (PRV-Bartha, PRV-Ba,
generated in 1961), which induces reduced inflammatory responses and contrary to the wt
PRVs, it spreads in an exclusively retrograde manner [108]. Recombinant PRV-Ba strains are
also employed as retrograde transsynaptical tracers. This virus is also widely used in Europe as
a live vaccine against Aujeszky’s disease [2]. It was generated by traditional mutagenesis and
selected on the basis of its plaque morphology (it produces small plaques; [109]). PRV-Ba has
12
several recognized mutations, including a deletion in the unique short (US) region
encompassing gI, gE, US9 and US2 genes and point mutations in the gC, gM, UL21 and US3
genes [110-111].
Herpesviruses as biological tools in cardiovascular research
Alphaherpesviruses are the most suitable and widely used tools for labeling neurons, but
herpesviruses have yet not been used as gene delivery vectors for cardiomyocytes.
THE MAJOR AIMS OF THIS STUDY WERE AS FOLLOWS
(1) Analysis of the function of all the PRV genes under different conditions
- to characterize the kinetic patterns and compare the expression dynamics of all the 70 viral
genes in the wt PRV in untreated or CHX (cycloheximede) or PAA (phosponoacetic acid)-
treated PK-15 cells.
- to analyze the antisense transcription from the PRV genome
(2) Analysis of individual PRV gene functions using knockout viruses
- to analyze the effect of the ul41 gene on the expression of the other PRV genes
- to examine the effect of individual PRV genes on the spread properties of the virus strains
(3) Development of transgenic viruses encoding
- activity sensors with which we can examine the activity of connected neurons in the brain
- differentially colored FPs and multiple colored FPs to differentiate the brain regions
Remark: In this thesis, I put a much greater emphasis on the analysis of global PRV gene
expression, which is my main project, than on the utilization of PRV as a tool in biological
disciplines, in which I am only a co-author.
13
MATERIALS AND METHODS
Cells and viruses
The entire culture procedures were performed in a class II flow hood.
Porcine kidney 15 (PK-15) cells
Monolayer cultures of immortalized PK-15 cells were used for propagation of PRV. Cells
were grown in Dulbecco's Modified Eagle Medium (Sigma-Aldrich) supplemented with 5%
fetal bovine serum (Gibco) and 80 μg gentamicin (Invitrogen TM
) per ml, at 37 °C in an
atmosphere of 95% air with 5% CO2.
Canine cardiomyocytes
The freshly isolated cardiomyocytes were centrifuged five times at 50g for 1 minute in sterile
10% PBS (phosphate buffered saline). The supernatant was carefully removed and replaced
first by 500 μM then by 1mM Ca2+
containing PBS solution. Most of the nonmyocytes and
nonfunctional myocytes and the majority of the bacterial cells were removed by the low-
speed centrifugation steps. Precipitated myocytes were resuspended in culture medium and
plated on laminin precoated (1 μg/cm2) sterile coverslips at densities of up to 103 rod-shaped
cells cm−2
. Cells were maintained 4 hours at 37°C under sterile conditions in a 5% CO2
incubator to attach to the plate. After this time period non attached cells were removed, the
plate-attached myocytes were infected with various titers of recombinant PRVs for 12 hours
then washed and the culture medium was changed. Infected cells were used for analysis at
various time points. After the first medium change, subsequent medium changes were carried
out every day. Culture medium consisted of serum-free medium 199 (M199) supplemented
with 25mM NaHCO3, 5mM ceratine, 2mM L-carnitine, 5mM taurine, 100 units/ml insulin
and 50 μg/ml gentamicin. (All chemicals were purchased from Sigma-Aldrich).
PRV strains
Strain Kaplan of pseudorabies virus (PRV-Ka) was used for gene expression analysis [112]
and as a parental virus for producing recombinant PRVs [6, 9]. PRV strain Bartha (PRV-Ba)
was also used to produce recombinant viruses [6, 113]. Experiments on gene expression
were also performed using Ka-∆VHS virus. Mutant Ka and Ba strains (Ka-∆TK, Ba-∆TK
∆gE/gI, ∆gE/gI/TK, and ∆TK/RR/EP0) were also used for study of individual gene functions
in viral spread. Viruses were propagated in culture of immortalized PK-15 cells.
14
Infection conditions
The stock of the virus was prepared as follows: PK-15 cells were infected with 10 plaque
forming units (pfu)/cell PRV-Ka followed by incubation of the cells until a complete
cytopathic effect was observed. For the expression analysis of the PRV, rapidly-growing
semi-confluent PK-15 cells were infected with a low multiplicity of infection (MOI; 0.1
pfu/cell) of the virus, and incubated for 1 h, after which the virus suspension was removed
and the PK-15 cells were washed with phosphate-buffered saline (PBS). Cells were further
cultivated in newly added growing medium for 0, 1, 2, 4 or 6 h. Cells were incubated in the
presence or absence of 100 μg/ml cycloheximide (CHX), an inhibitor of protein synthesis, or
400 μg/ml phosphonoacetic acid (PAA), a blocker of DNA replication (both purchased from
Sigma-Aldrich) 1 h prior to virus infection. Mock-infected cells, treated in the same way as
infected cells, were used as controls.
We also infected PK-15 cells with high MOI (10 pfu/cell) of different PRVs: wild-type (wt)
Ka, ep0, and vhs-deleted viruses. In this case, the infected cells cultivated for 0, 12, 4, 6, 8,
12, 18 or 24 hours. For the study of antisense transcription data was used from also the
“high-titer” experiments of wt and vhs-mutant viruses. The effect of vhs gene on the
expression of the others was tested by using the data derived from the high-titer infection.
For the PRV-based delivery system the stocks of PRV were prepared by infecting PK-15
cells with of 1 pfu/cell, harvested after 24 hours, followed by freezing and thawing three
times. The cells were then centrifuged and the pellet discarded. The supernatant fluid was
stored in 400 μL aliquots at −80◦C.
Viral DNA preparation
Viral DNA was used for testing the primer efficiency and specificity, applied in real-time
PCR. The viral DNA was isolated as follows: PK-15 cell monolayers were infected with the
PRV at an MOI of 10, and cultivated at 37 °C until a complete cytopathic effect was
observed. Next, culture medium was collected without disrupting the cells and clarified by
centrifugation at 4,000 rpm for 10 min using a Sorvall GS-3 rotor. Subsequently, the virus in
the supernatant fluids was sedimented on a 30% sucrose cushion by ultracentrifugation at
24,000 rpm for 1 h using a Sorvall AH-628 rotor. The sedimented virus was resuspended in
sodium Tris-EDTA buffer. After this step, proteinase-K (l00 g/ml final concentration) and
sodium dodecyl sulfate (SDS; 0.5% final concentration) was added, and the lysate was
incubated at 37 °C for 1 h. Finally, it was purified by phenol-chloroform extraction and
dialysis.
15
Primers for reverse transcription (RT) and polymerase chain reaction (PCR)
Primers pairs were designed using the Primer Express program (Applied Biosystems) and the
FastPCR Professional (Primer Digital Ltd.) oligonucleotide design software according to the
given guidelines. All primers were designed to the 3’-end regions of the open reading frames
(ORFs) for each gene (Table 3). The ul26 and ul26.5, and orf1 and orf1.2 genes contain
overlapping ORFs; and we therefore, did not employ distinct primers for them. Specificity of
the primers was verified by BLAST searches of the GenBank database (National Center for
Biotechnology Information (NCBI) website (http://www.ncbi.nlm.nih.gov/BLAST/).
Oligonucleotide primers were purchased from Bio Basic Inc. (Mississauga, Ontario,
Canada).
Polymerase chain reaction (PCR)
A traditional, end-point PCR technique was used to check the potential genomial DNA
contamination. Primer specificity and quality also was tested by running PCR reactions by
using the GC Rich PCR System in accordance with the manufacturer’s instructions (Roche
Diagnostics GmbH) and a Veriti™ 96-Well Thermal Cycler (Applied Biosystems) according
to the protocol: 1 cycle of 4 min at 94 °C; 30 cycles of 1 min at 94 °C, 60 °C for 1 min and
72 °C for 2 min; and 1 cycle of 72 °C for 7 min.
The complete PRV genome sequence is a composite of 6 different strains (Becker, Indiana-
Funkhauser, Ka, NIA-3, Rice, and TNL) [10], the percentage of nucleotide identity between
them is approximately 99%. Most of the sequence data (86.7%) have been derived from
strain Kaplan (PRV-Ka), which were used in our experiments. To circumvent the problem of
genetic background differences, we tested 2 or more primers for RT and PCR reactions for
non-Ka sequences and selected those that performed best; alternatively, we sequenced the
particular DNA region and designed new primers based on the sequence data. For all genes,
we tested several primers to optimize the reactions and selected those, which did not produce
primer dimers or other nonspecific products. To minimize the primer dimmer effects in case
of that genes where we could not eliminate them, a detection step (“extra extension step”)
was applied in every cycle after the extension with a temperature approximately 3°C below
the melting temperature (Tm) of the specific PCR product, but well above the Tm of the
primer dimers) for the detection.
16
RNA preparation
PK-15 cells (5x10⁶ cells per flask) were washed in PBS and
harvested for RNA purification
at 0, 1, 2, 4 and 6 h pi. Total RNA was isolated from the cells with the NucleoSpin RNA II
Kit (Macherey-Nagel GmbH and Co. KG) as recommended by the manufacturer. Briefly,
cells were collected by low-speed centrifugation, lysed in a buffer containing the chaotropic
salts, which inactivates RNases and allow nucleic acids to bind to silica membranes.
Samples were treated with RNase-free rDNase solution (included in the Kit) to remove
potential genomic DNA contamination. Subsequently, the possible residual DNA
contamination was removed by using Turbo DNase (Ambion Inc.). As a final step, RNA
samples were eluted in RNase-Free Water (supplied with the Kit) in a total volume of 60 µl.
The measurement of RNA concentrations were quantified in triplicate by
spectrophotometrically by measuring the absorbance at 260 nm in a BioPhotometer Plus
(Eppendorf). The RNA solution was stored at -80 °C until use.
Quantitative real-time RT-PCR
A reverse transcriptase based quantitative real-time PCR was carried out for the
transcriptional analysis. For each gene, a minimum of 3 parallel independent samples
(separate infections) were used.
Reverse transcription (RT)
Total RNA extracted from infected cell cultures subjected to drug treatment (CHX or PAA)
was transcribed into cDNA for real-time PCR analysis. RT reactions were performed in a
total volume of 5 μl of solution containing 0.07 μg of total RNA, 0.25 μl of dNTP mix (10
μM final concentration), 2 pmol of the gene- and strand-specific primer, 1 μl of 5x First-
Strand Buffer, 0.25 μl (50 units/μl) of SuperScript III Reverse Transcriptase (Invitrogen) and
1U of RNAsin (Applied Biosystems Inc.). RT mixtures were incubated at 55 °C for 60 min.
The reaction was stopped by raising the temperature to 70 °C for 15 min.
No-RT control
reactions (RTs without the reverse transcriptase enzyme) were run to test the potential viral
DNA contamination by conventional PCR. RNA samples with no detectable DNA
contamination were used for quantitative RT-PCR reactions. First-strand cDNAs were
diluted 10-fold with Gibco UltraPure DEPC-treated, RNase- and DNase-free distilled water
(Gibco/Invitrogen), and then subjected to real-time PCR analysis.
17
Real-time PCR
Real-Time PCR experiments were performed by using the Rotor-Gene 6000 thermal cycler
(Corbett Life Science). All reactions were carried out in 20-μl reaction mixtures containing
7 μl of cDNAs, 10 μl of ABsolute QPCR SYBR Green Mix (Thermo Fisher Scientific), 1.5
μl of forward and 1.5 μl of reverse primers (10 μM each). The running conditions were as
follows: (1) 15 min at 95 °C, followed by 30 cycles of 94 °C for 25 sec (denaturation), 60 °C
for 25 s (annealing), and 72 °C for 6 s (extension). The absence of nonspecific products or
primer dimers was indicated by observation of a single melting peak in melting curve
analysis. An additional extension and detection step was applied for those primers that
produced primer dimmers: for 2 s at a temperature just below the Tm of the specific product
and substantially above the Tm of the primer dimers. With this technique we could eliminate
nonspecific fluorescent signals produced by primer dimers. Following the PCR reaction,
melting curve analysis was performed to control amplification specificity (specificity was
defined as the production of a single peak at the predicted temperature and the absence of
primer dimers) by measuring the fluorescence intensity across the temperature interval from
55 °C to 95 °C. The 28S ribosomal (r)RNA used as the loading control (reference gene) was
amplified in each run. H2O was included as a no-template control, and cDNA derived from
the reverse-transcribed RNAs of non-infected cells was used as a negative mock-infected
control. We applied SYBR Green-based real-time PCR because of the lower costs and
simpler protocol than for TaqMan probe-based methods for instance. It has recently been
demonstrated that the SYBR-based method of detection is as sensitive and specific, and has a
similar dynamic range to that of the TaqMan-based technique [114].
Statistics
Calculation of relative expression ratio (R)
We calculated the R value by using the following mathematical model:
ref
ref
sample
sample
Ct
ref
Ct
ref
Ct
sample
Ct
sample
E
E
E
ER
)(
)(:
)(
)( m axm ax
maxmax ,
where R is the relative expression (quantification) ratio or relative copy number; E is the
amplification efficiency of one reaction cycle; Ct is the threshold cycle value; sample refers
to any particular gene at a given time point; and ref is the 28S rRNA, which was used as a
reference gene and was amplified in each run. Average Ct values with their standard error
(SE) values and amplification efficiencies with SE are shown in the reference [112]. This
equation is a modification of the “Soong’s formula” [115], using the average maximal value
18
of ECt
for each gene as the control instead of individual values. The relative expression ratios
of mRNAs were calculated by normalizing cDNAs to 28S rRNA using the Comparative
Quantitation module of the Rotor-Gene 6000 software (Version 1.7.28, Corbett Research),
which automatically calculates the real-time PCR efficiency sample-by-sample. Thresholds
were set automatically by the software.
Calculation of the modified R values: Ra, R∆, Ri-PAA and Ri-CHX
Ra: rates of change was calculated using the following formula: Ra=R(t+1)/Rt
R∆: the net increase between two time points was calculated as follows: R∆=R(t+1)-Rt
Ri-PAA: the inhibitory effect of PAA on gene expression was calculated by using the ratio of
the R values for the PAA-treated/untreated samples at each individual time points.
Ri-CHX: the inhibitory effect of CHX on gene expression was calculated by using the ratio of
the R values for the CHX-treated/untreated samples at each individual time points.
Analysis and presentation of Real-Time PCR data
Data were analyzed by the Microsoft Excel program, using the average and the standard
deviance functions. The inhibitory effect of CHX or PAA was calculated via the ratio of the
drug-treated and untreated R values at 2, 4 and 6 h pi for CHX: Ri-CHX=RCHX/RUT, or 4 and 6
h pi for PAA: Ri-PAA=RPAA/RUT. Thus, a low value indicates a high inhibitory effect and vice
versa. The net increase in a product was calculated by subtracting the R value at time point
t+1 from that at t (R=R(t+1)-Rt), where t = 0, 1, 2, 4 or 6 h and (t+1) = 1, 2, 4 or 6 h. The
ratios of adjacent R values (rate of change; Ra) were calculated with the following equation:
Ra=R(t+1)/Rt; t = 1, 2, 4 or 6 h; (t+1) = 2, 4 or 6 h. Pearson’s correlation analysis was used to
evaluate qRT2-PCR data, as an alternative method for the grouping of PRV genes into
kinetic classes. Pearson’s correlation coefficient (r) was calculated as follows:
r=
yx
n
iii
SSn
YYXX
)1(
))((1
A correlation is a number between -1 and +1 that measures the degree of association between
two variables labeled here as X and Y, which are the R values of two different genes in the
same time interval (i). X and Y are the average values, n is the sample number, and SX and
SY are the standard deviances (errors) for X and Y, respectively. A positive value for the
correlation implies a positive association and a negative value implies a negative or inverse
19
association. Genes were clustered by using a complete linkage hierarchical clustering method
with a centered correlation similarity metric with Cluster 3.0 program (Stanford University).
To view the clustering results generated by Cluster 3.0, we used Alok Saldanha's Java
TreeView software.
Gel electrophoresis
Larger DNA fragments generated by using conventional PCR cycler were run on 1%
agarose/TBE gels containing ethidium bromide (EtBr) and visualized under UV illumination,
using Marker 16 (Lambda DNA/Eco130I; Fermentas) to size DNA fragments. Smaller DNA
fragments generated by qRT2-PCR were run in a 12% polyacrylamide gel to determine if the
amplified products are of the correct size. To visualize the DNA fragments, the EtBr-stained
gels were placed on UV transilluminator. A GeneRuler™ Low Range DNA Ladder
(Fermentas) was included in each run.
Restriction endonuclease (RE) analysis
To make sure the amplified RT2-PCR products are specific, RE analysis was performed.
Construction of recombinant plasmids
Plasmids containing PRV DNA fragments were constructed for DNA sequencing analysis,
which was performed when the specificity of amplicons generated by real-time PCR was
uncertain; or if primers designed on the basis of sequence data relating to non-Ka strains
performed badly. PRV DNAs were subcloned by using two methods: PCR amplification of
the particular DNA segment; or subcloning of the desired DNA region by standard molecular
cloning protocols. Amplified products were subcloned to the pGEM (Promega) vector
following the manufacturer's descriptions. PRV BamHI fragments to be sequenced were
subcloned to the pRL525 vector [116].
DNA sequencing
Subcloned DNA fragments were subjected to DNA sequencing with the ABI Prism™ 3730xl
DNA sequencer (AME Bioscience Ltd.). DNA sequences were analyzed by using the
Chromas Lite 2.01 software (Technelysium Pty Ltd).

20
Construction of targeting vectors
Targeting vectors were used to deliver reporter genes and/or mutations to the PRV genome.
A typical targeting plasmid was constructed by the insertion of a marker gene expression
cassette to an internal position of a previously subcloned viral DNA segment, which
provided homologous flanking sequences for recombination with the desired integration site
in the PRV genome.
Flanking sequences
PRV DNA segments of interest were subcloned into members of a palindrome-containing
positive-selection vector family (pRL479, pRL525) or pBlueScript II KS plasmid.
Subsequently, viral DNA sequences were cut with one or two unique restriction
endonucleases (REs), followed by Klenow filling-in of 5’f-overhangs (in case of sticky ends)
and insertion of either an EcoRI or a HindIII linker, which served as a cloning site for the
incorporation of reporter gene expression cassettes [6].
Reporter genes
Several reporter genes were fused with MARCKS2 (myristoylated alanine-rich C-kinase
substrate) to create membrane targeted fluorescent proteins (e.g. memOrange, memTFP).
Expression cassettes were modified to contain either HindIII or EcoRI RE sites at both ends
for subcloning into flanking viral sequences. We also engineered multiple color expressing
viruses which express different fluorescent proteins (e. g. orange, teal, red) [6].
Modification of the gE and gI coding region
The first step in the generation of gE/gI deletion-based flanking sequence was to the BamHI-
7 fragment of the PRV genome - containing the gE and gI coding region - was isolated and
subcloned to pRL525 cloning vector. Its 1855-bp StuI – AgeI DNA fragment was replaced
by an EcoRI linker. The removed StuI – AgeI fragment resulted in the inactivation of both gE
and gI genes of the virus. Reporter genes were ligated to the EcoRI site of the construct.
Neut region
The DsRed2 (Clontech Laboratories Inc.) is an engineered monomeric red fluorescent
protein (RFP) from Discosoma sp. The BamHI8’ fragment, which contain the Neut region of
the virus genome was subcloned into the pRL525 plasmid. StuI unique restrictrion site
(located in the Neut region) was replaced by EcoRI linker. The DsRed was ligated to the
EcoRI site of the plasmid.
21
Construction of the TK-expression cassette
TK gene of HSV was inserted into the pUCB vector. The gene was controlled by
transcription regulatory sequences (pCMV and SV40 PolyA).
Generation of PRV amplicon constructs
We have generated modified virus vectors (amplicons): amplicon-memCherry (amp-
memCherry), amplicon-memCerulean (amp-memCerulean) and amplicon-memGFP (amp-
memGFP). The OriS and PAC regions of the PRV genome were amplified by PCR than
subcloned into pBlueScript II KS plasmid. Several FPs (membrane bound red, blue and
green fluorescent proteins: memCherry, memCerulean and memGFP respectively) were also
inserted to the EcoRI recognition site of the plasmid. Reporter genes were driven by the
human cytomegalovirus immediate early 1 promoter (pCMV) and terminated by the simian
virus SV40 polyadenylation sequence.
Creation of ep0 gene targeting vector
The KpnI-F DNA fragment containing the sequence of the ep0 gene was cloned into the
pRL525. Next, it was cleaved with BamHI RE to remove the 1388 bp BamHI fragment
including the entire ep0 gene. Subsequently, free DNA ends were filled up by Klenow
enzyme followed an EcoRI linker insertion. The lacZ gene expression cassette was
subcloned to the EcoRI site of this plasmid.
Generation of the RR gene targeting vector
Firstly, a 5-kbp SalI-F fragment of the virus DNA containing both subunits of RR (large:
RR1 and small: RR2) gene was isolated and subcloned into the pRL494, [34], which was cut
with ScaI and MluI REs generating a 1805-bp deletion. This deletion included a 1789-bp
DNA sequence from the 3’ of RR1 and a 7-bp DNA sequence from the 5’ end of RR2 of
ribonucleotide reductase gene. As a next step, free DNA ends were converted to EcoRI sites
via Klenow filling and attaching EcoRI linker to the blunt DNA ends. Finally, a lacZ gene
expression cassette flanked by EcoRI sites was subcloned to the EcoRI site of this plasmid.
ASP (putative antisense promoter) region
The BamHI-8’-F PRV DNA fragment (4.9 kb) was isolated and subcloned to pRL525
cloning vector. The DraI site of the putative TATAA box of ASP sequence was converted to
EcoRI by linker insertion destroying its function and generating pASP-RI. Alternatively,
BamHI-8’-F fragment was subcloned into pRL479 followed by conversion of the DraI site to
HindIII resulting in pASP-HIII. As a final step, the various reporter gene expression
22
cassettes were inserted either into the EcoRI site of pASP-RI (GFP, lacZ, troponeon), or the
others into the HindIII site of pASP-HIII, resulting in the generation of ASP-based targeting
constructs.
Transfection
Fluorescent protein-encoding plasmids were transfected to PK-15 cells with
Lipofectamine™ transfection reagent (Invitrogen ™) following the manufacturer's
recommendations.
Generation and isolation of recombinant viruses
Recombinant viruses were generated by means of homologous recombination between
parental virus genomes and the homologous sequences of the targeting plasmids (Table 1.
shows the recombinant viruses constructed by me). Actively growing PK-15 cells were co-
transfected with viral DNA and the linearized targeting vector with lipofectamine-mediated
gene delivery (Lipofectamine 2000 Reagent, Invitrogen). Plaques formed by FP-carrying
recombinant viruses were screened based on their fluorescence or the lacZ gene-expressing
PRVs were detected by blue plaque assay using 5-bromo-4-chloro-3-indolyl-b-D-
galactopyranoside (XGal), the chromogenic substrate of β-galactosidase. Recombinant
viruses were isolated by 6-15 cycles of plaque purifications using a fluorescence microscope
(Olympus IX-71). Deletions in the viral genome without reporter gene insertion were
generated by insertion and subsequently elimination (via empty flanking sequences) of the
FP or lacZ expression cassette.
Activity sensor PRVs
Gene encoding, fluorescence resonance energy transfer (FRET)-based fluorescent Ca2+
indicators (TN-L15, troponeon [117] were inserted to the PRV genome (either to the Ka, or
to the Bartha strain). Troponeon expressing PRVs were under the control of the major
immediate early promoter of human cytomegalovirus (CMV promoter) developed activity
sensor PRVs that report the activity of the infected cells. The marker gene expression
cassette also contained simian virus 40 (SV40)-derived sequences (eg. polyA
(polyadenylation) signal and transcription termination sequences). Additionally, a lacZ gene
was also used as a reporter gene for the identification of mutant viruses.
23
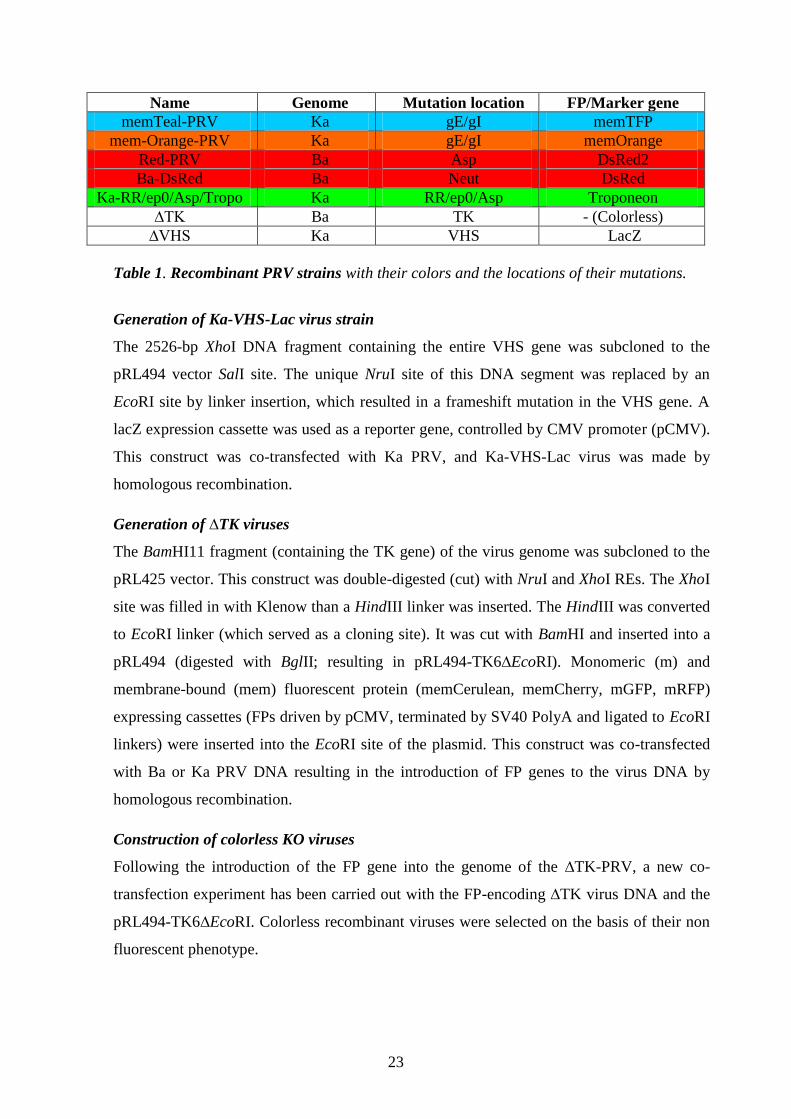
Name Genome Mutation location FP/Marker gene
memTeal-PRV Ka gE/gI memTFP
mem-Orange-PRV Ka gE/gI memOrange
Red-PRV Ba Asp DsRed2
Ba-DsRed Ba Neut DsRed
Ka-RR/ep0/Asp/Tropo Ka RR/ep0/Asp Troponeon
∆TK Ba TK - (Colorless)
∆VHS Ka VHS LacZ
Table 1. Recombinant PRV strains with their colors and the locations of their mutations.
Generation of Ka-VHS-Lac virus strain
The 2526-bp XhoI DNA fragment containing the entire VHS gene was subcloned to the
pRL494 vector SalI site. The unique NruI site of this DNA segment was replaced by an
EcoRI site by linker insertion, which resulted in a frameshift mutation in the VHS gene. A
lacZ expression cassette was used as a reporter gene, controlled by CMV promoter (pCMV).
This construct was co-transfected with Ka PRV, and Ka-VHS-Lac virus was made by
homologous recombination.
Generation of ∆TK viruses
The BamHI11 fragment (containing the TK gene) of the virus genome was subcloned to the
pRL425 vector. This construct was double-digested (cut) with NruI and XhoI REs. The XhoI
site was filled in with Klenow than a HindIII linker was inserted. The HindIII was converted
to EcoRI linker (which served as a cloning site). It was cut with BamHI and inserted into a
pRL494 (digested with BglII; resulting in pRL494-TK6∆EcoRI). Monomeric (m) and
membrane-bound (mem) fluorescent protein (memCerulean, memCherry, mGFP, mRFP)
expressing cassettes (FPs driven by pCMV, terminated by SV40 PolyA and ligated to EcoRI
linkers) were inserted into the EcoRI site of the plasmid. This construct was co-transfected
with Ba or Ka PRV DNA resulting in the introduction of FP genes to the virus DNA by
homologous recombination.
Construction of colorless KO viruses
Following the introduction of the FP gene into the genome of the ∆TK-PRV, a new co-
transfection experiment has been carried out with the FP-encoding ∆TK virus DNA and the
pRL494-TK6∆EcoRI. Colorless recombinant viruses were selected on the basis of their non
fluorescent phenotype.
24
RESULTS
Whole-genome analysis of wild-type (wt) PRV
Kinetic classes of PRV genes on the basis of dependence of gene expression on DNA
replication and de novo protein synthesis
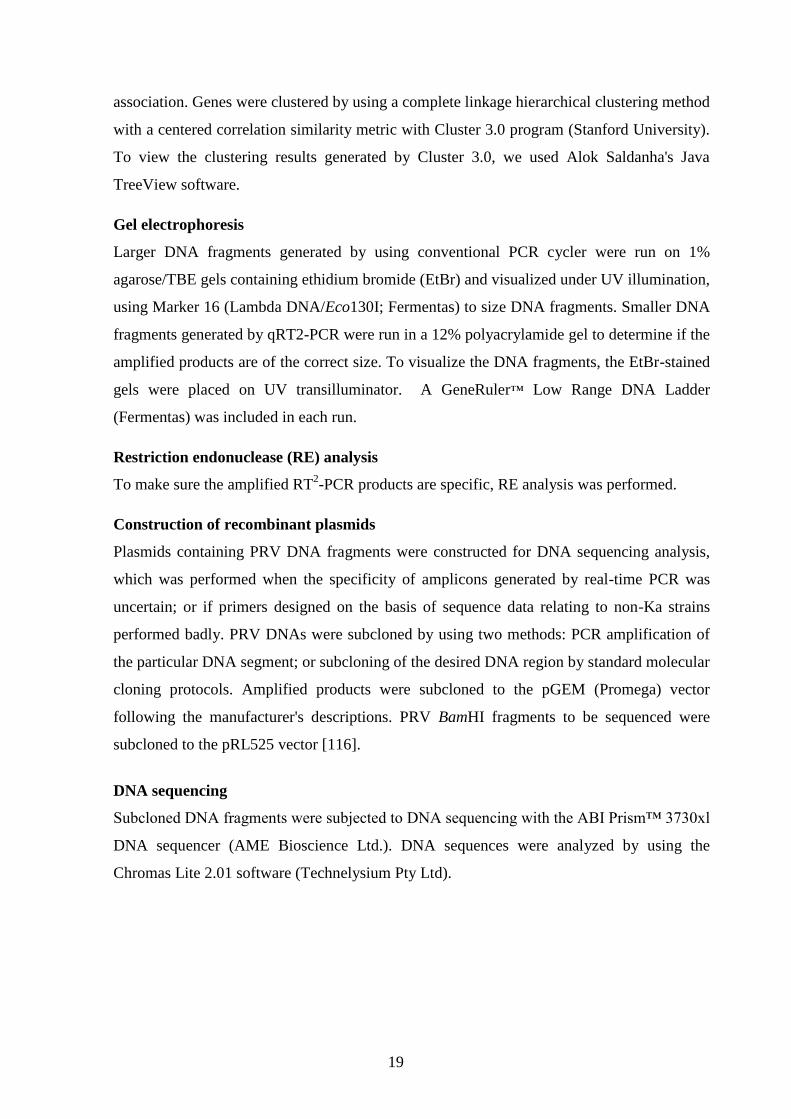
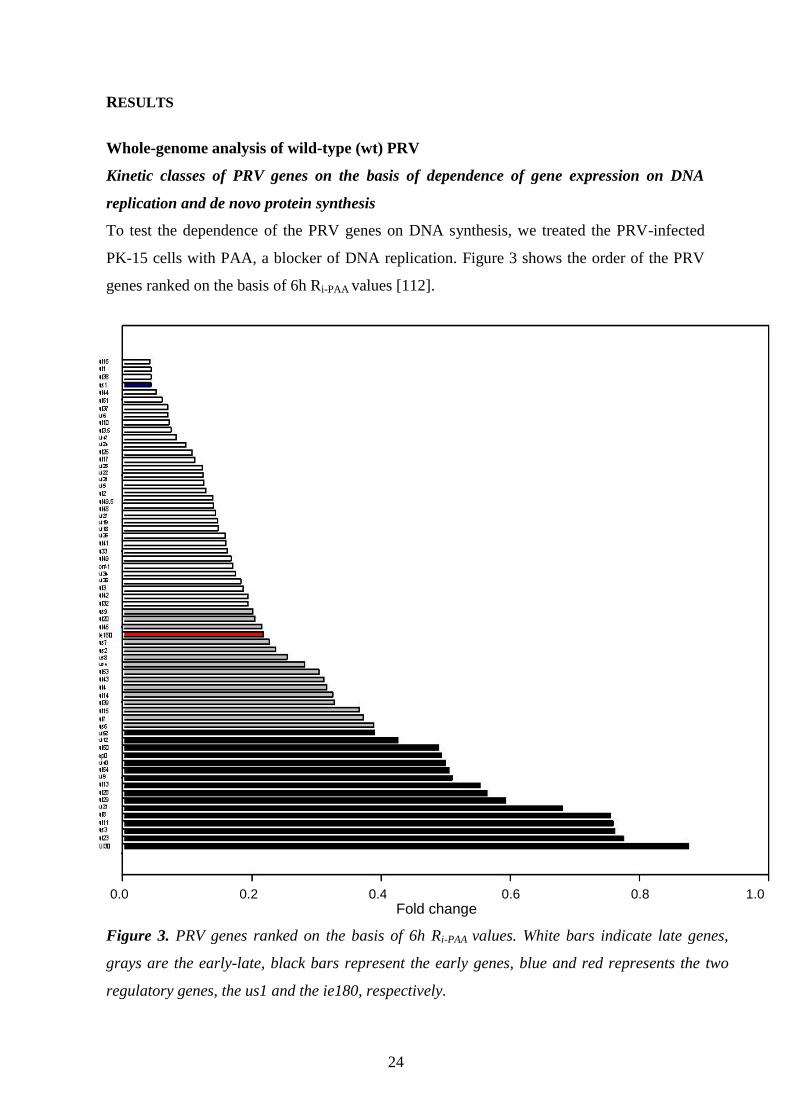
To test the dependence of the PRV genes on DNA synthesis, we treated the PRV-infected
PK-15 cells with PAA, a blocker of DNA replication. Figure 3 shows the order of the PRV
genes ranked on the basis of 6h Ri-PAA values [112].
Figure 3. PRV genes ranked on the basis of 6h Ri-PAA values. White bars indicate late genes,
grays are the early-late, black bars represent the early genes, blue and red represents the two
regulatory genes, the us1 and the ie180, respectively.
0.0 0.2 0.4 0.6 0.8 1.0
0,0 0,2 0,4 0,6 0,8 1,0
0,0 0,2 0,4 0,6 0,8 1,0
Fold change
25
Our result shows that PAA exerts a drastic effect on the expression of L genes (these genes
have the lowest Ri-PAA values), while it inhibits E gene expression to a lower extent (they have
higher Ri-PAA values). This phenomenon is explained by the fact that the gene expression is
dependent on the promoter activity as well as on the copy numbers of genes which are higher
after the viral genome replication than at the initial stage of infection when the PRV DNA is
represented in a single copy per cell in our system). As figure 3 shows, it is not possible to
draw a sharp line between the E and L genes; there is rather continuity between the kinetic
classes. All protein-coding PRV genes have been well categorized by PAA analysis, except the
ie180 gene which displays a unique expression pattern. We compared our results with the
previously published kinetic groups of HSV and PRV genes. It is known that there is a certain
degree of disagreement between the authors in the categorization of HSV genes. Furthermore,
a complete expression data set for the PRV genes is not available [112].
Table 2 shows the PRV genes and their kinetic classes based on our PAA experiments, and
also the categories established by earlier studies (collected by Mettenleiter), as well as the
kinetic properties of the homologous genes of HSV (based on the studies conducted by Wagner
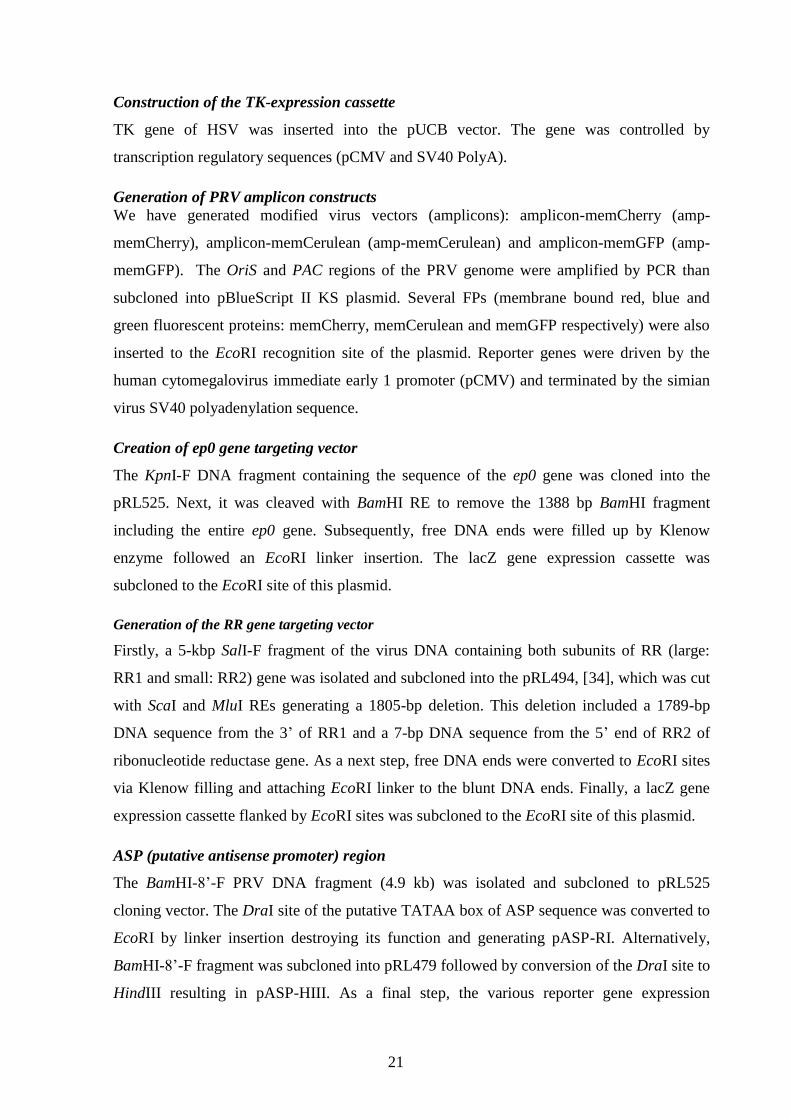
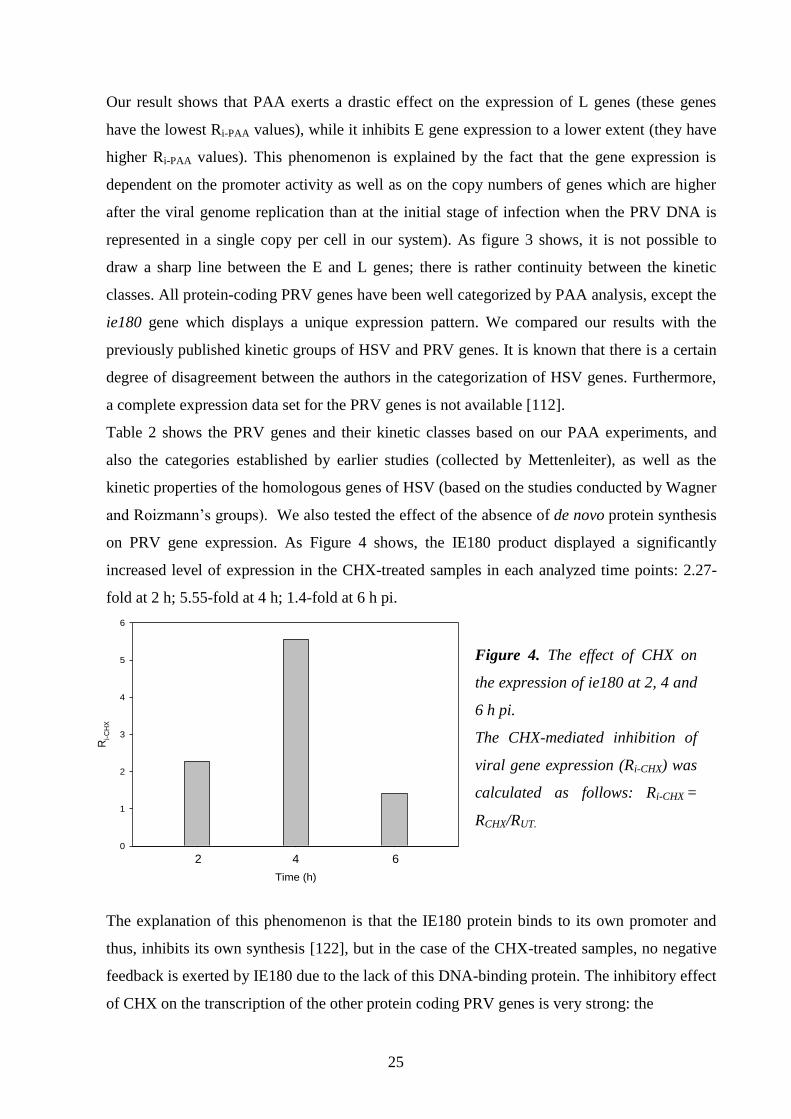
and Roizmann’s groups). We also tested the effect of the absence of de novo protein synthesis
on PRV gene expression. As Figure 4 shows, the IE180 product displayed a significantly
increased level of expression in the CHX-treated samples in each analyzed time points: 2.27-
fold at 2 h; 5.55-fold at 4 h; 1.4-fold at 6 h pi.
Time (h)
3 4 5
Ri-
CH
X
0
1
2
3
4
5
6
The explanation of this phenomenon is that the IE180 protein binds to its own promoter and
thus, inhibits its own synthesis [122], but in the case of the CHX-treated samples, no negative
feedback is exerted by IE180 due to the lack of this DNA-binding protein. The inhibitory effect
of CHX on the transcription of the other protein coding PRV genes is very strong: the
2 4 6
Figure 4. The effect of CHX on
the expression of ie180 at 2, 4 and
6 h pi.
The CHX-mediated inhibition of
viral gene expression (Ri-CHX) was
calculated as follows: Ri-CHX =
RCHX/RUT.
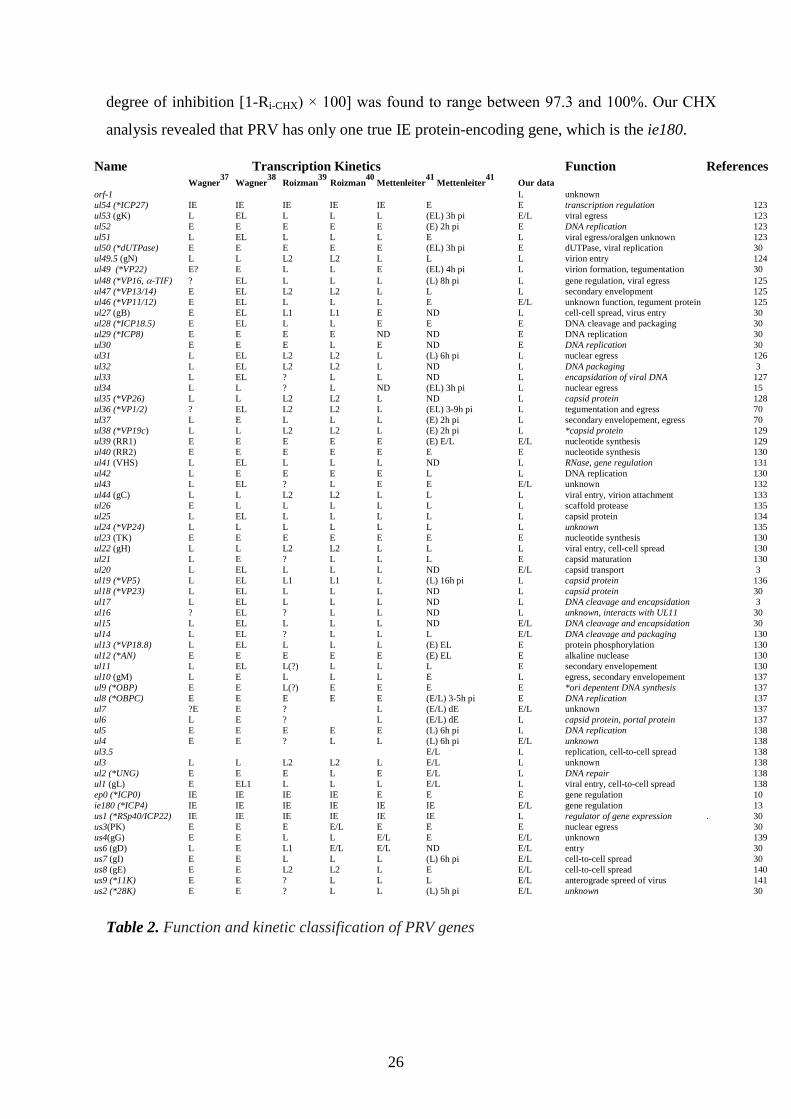
26
degree of inhibition [1-Ri-CHX) × 100] was found to range between 97.3 and 100%. Our CHX
analysis revealed that PRV has only one true IE protein-encoding gene, which is the ie180.
Name Transcription Kinetics Function References
Wagner37
Wagner38
Roizman39
Roizman40
Mettenleiter41
Mettenleiter41
Our data
orf-1 L unknown
ul54 (*ICP27) IE IE IE IE IE E E transcription regulation 123
ul53 (gK) L EL L L L (EL) 3h pi E/L viral egress 123
ul52 E E E E E (E) 2h pi E DNA replication 123
ul51 L EL L L L E L viral egress/oralgen unknown 123
ul50 (*dUTPase) E E E E E (EL) 3h pi E dUTPase, viral replication 30
ul49.5 (gN) L L L2 L2 L L L virion entry 124
ul49 (*VP22) E? E L L E (EL) 4h pi L virion formation, tegumentation 30
ul48 (*VP16, -TIF) ? EL L L L (L) 8h pi L gene regulation, viral egress 125
ul47 (*VP13/14) E EL L2 L2 L L L secondary envelopment 125
ul46 (*VP11/12) E EL L L L E E/L unknown function, tegument protein 125
ul27 (gB) E EL L1 L1 E ND L cell-cell spread, virus entry 30
ul28 (*ICP18.5) E EL L L E E E DNA cleavage and packaging 30
ul29 (*ICP8) E E E E ND ND E DNA replication 30
ul30 E E E L E ND E DNA replication 30 ul31 L EL L2 L2 L (L) 6h pi L nuclear egress 126
ul32 L EL L2 L2 L ND L DNA packaging 3
ul33 L EL ? L L ND L encapsidation of viral DNA 127
ul34 L L ? L ND (EL) 3h pi L nuclear egress 15
ul35 (*VP26) L L L2 L2 L ND L capsid protein 128
ul36 (*VP1/2) ? EL L2 L2 L (EL) 3-9h pi L tegumentation and egress 70
ul37 L E L L L (E) 2h pi L secondary envelopement, egress 70
ul38 (*VP19c) L L L2 L2 L (E) 2h pi L *capsid protein 129
ul39 (RR1) E E E E E (E) E/L E/L nucleotide synthesis 129
ul40 (RR2) E E E E E E E nucleotide synthesis 130
ul41 (VHS) L EL L L L ND L RNase, gene regulation 131
ul42 L E E E E L L DNA replication 130
ul43 L EL ? L E E E/L unknown 132
ul44 (gC) L L L2 L2 L L L viral entry, virion attachment 133
ul26 E L L L L L L scaffold protease 135
ul25 L EL L L L L L capsid protein 134
ul24 (*VP24) L L L L L L L unknown 135
ul23 (TK) E E E E E E E nucleotide synthesis 130
ul22 (gH) L L L2 L2 L L L viral entry, cell-cell spread 130
ul21 L E ? L L L E capsid maturation 130
ul20 L EL L L L ND E/L capsid transport 3
ul19 (*VP5) L EL L1 L1 L (L) 16h pi L capsid protein 136
ul18 (*VP23) L EL L L L ND L capsid protein 30
ul17 L EL L L L ND L DNA cleavage and encapsidation 3
ul16 ? EL ? L L ND L unknown, interacts with UL11 30
ul15 L EL L L L ND E/L DNA cleavage and encapsidation 30
ul14 L EL ? L L L E/L DNA cleavage and packaging 130
ul13 (*VP18.8) L EL L L L (E) EL E protein phosphorylation 130
ul12 (*AN) E E E E E (E) EL E alkaline nuclease 130
ul11 L EL L(?) L L L E secondary envelopement 130
ul10 (gM) L E L L L E L egress, secondary envelopement 137
ul9 (*OBP) E E L(?) E E E E *ori depentent DNA synthesis 137
ul8 (*OBPC) E E E E E (E/L) 3-5h pi E DNA replication 137
ul7 ?E E ? L (E/L) dE E/L unknown 137
ul6 L E ? L (E/L) dE L capsid protein, portal protein 137
ul5 E E E E E (L) 6h pi L DNA replication 138
ul4 E E ? L L (L) 6h pi E/L unknown 138
ul3.5 E/L L replication, cell-to-cell spread 138
ul3 L L L2 L2 L E/L L unknown 138
ul2 (*UNG) E E E L E E/L L DNA repair 138
ul1 (gL) E EL1 L L L E/L L viral entry, cell-to-cell spread 138
ep0 (*ICP0) IE IE IE IE E E E gene regulation 10
ie180 (*ICP4) IE IE IE IE IE IE E/L gene regulation 13
us1 (*RSp40/ICP22) IE IE IE IE IE IE L regulator of gene expression . 30
us3(PK) E E E E/L E E E nuclear egress 30
us4(gG) E E L L E/L E E/L unknown 139
us6 (gD) L E L1 E/L E/L ND E/L entry 30
us7 (gI) E E L L L (L) 6h pi E/L cell-to-cell spread 30
us8 (gE) E E L2 L2 L E E/L cell-to-cell spread 140
us9 (*11K) E E ? L L L E/L anterograde spreed of virus 141
us2 (*28K) E E ? L L (L) 5h pi E/L unknown 30
Table 2. Function and kinetic classification of PRV genes
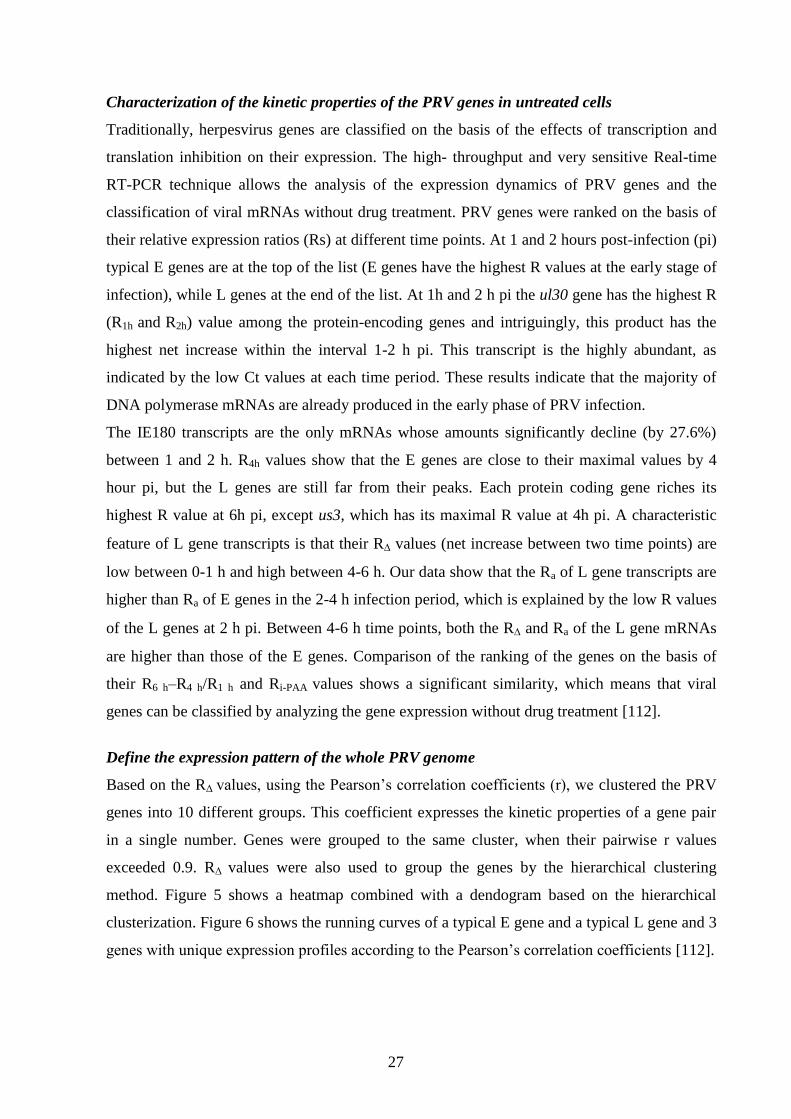
27
Characterization of the kinetic properties of the PRV genes in untreated cells
Traditionally, herpesvirus genes are classified on the basis of the effects of transcription and
translation inhibition on their expression. The high- throughput and very sensitive Real-time
RT-PCR technique allows the analysis of the expression dynamics of PRV genes and the
classification of viral mRNAs without drug treatment. PRV genes were ranked on the basis of
their relative expression ratios (Rs) at different time points. At 1 and 2 hours post-infection (pi)
typical E genes are at the top of the list (E genes have the highest R values at the early stage of
infection), while L genes at the end of the list. At 1h and 2 h pi the ul30 gene has the highest R
(R1h and R2h) value among the protein-encoding genes and intriguingly, this product has the
highest net increase within the interval 1-2 h pi. This transcript is the highly abundant, as
indicated by the low Ct values at each time period. These results indicate that the majority of
DNA polymerase mRNAs are already produced in the early phase of PRV infection.
The IE180 transcripts are the only mRNAs whose amounts significantly decline (by 27.6%)
between 1 and 2 h. R4h values show that the E genes are close to their maximal values by 4
hour pi, but the L genes are still far from their peaks. Each protein coding gene riches its
highest R value at 6h pi, except us3, which has its maximal R value at 4h pi. A characteristic
feature of L gene transcripts is that their R values (net increase between two time points) are
low between 0-1 h and high between 4-6 h. Our data show that the Ra of L gene transcripts are
higher than Ra of E genes in the 2-4 h infection period, which is explained by the low R values
of the L genes at 2 h pi. Between 4-6 h time points, both the R and Ra of the L gene mRNAs
are higher than those of the E genes. Comparison of the ranking of the genes on the basis of
their R6 h–R4 h/R1 h and Ri-PAA values shows a significant similarity, which means that viral
genes can be classified by analyzing the gene expression without drug treatment [112].
Define the expression pattern of the whole PRV genome
Based on the RΔ values, using the Pearson’s correlation coefficients (r), we clustered the PRV
genes into 10 different groups. This coefficient expresses the kinetic properties of a gene pair
in a single number. Genes were grouped to the same cluster, when their pairwise r values
exceeded 0.9. RΔ values were also used to group the genes by the hierarchical clustering
method. Figure 5 shows a heatmap combined with a dendogram based on the hierarchical
clusterization. Figure 6 shows the running curves of a typical E gene and a typical L gene and 3
genes with unique expression profiles according to the Pearson’s correlation coefficients [112].
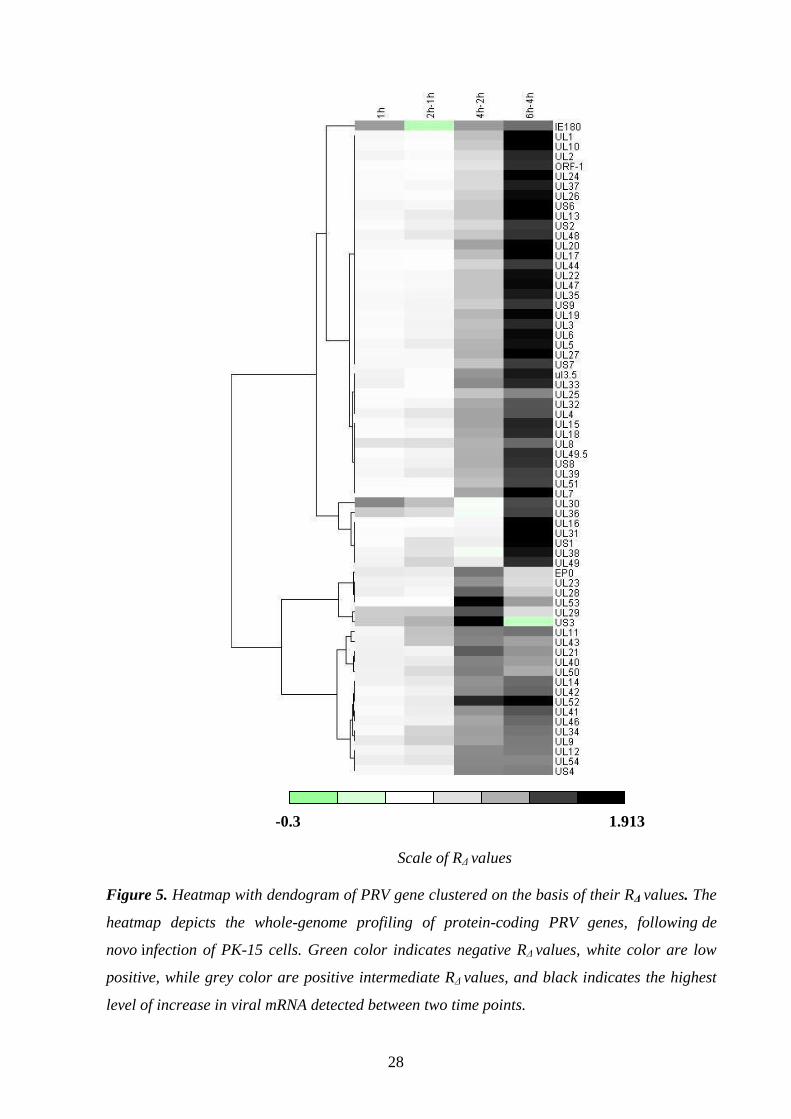
28
-0.3 1.913
Scale of RΔ values
Figure 5. Heatmap with dendogram of PRV gene clustered on the basis of their RΔ values. The
heatmap depicts the whole-genome profiling of protein-coding PRV genes, following de
novo infection of PK-15 cells. Green color indicates negative RΔ values, white color are low
positive, while grey color are positive intermediate RΔ values, and black indicates the highest
level of increase in viral mRNA detected between two time points.
29
2D Graph 1
Time (h)
0 1 2 3 4 5 6 7
R(t
+1)-
Rt
-0,4
-0,2
0,0
0,2
0,4
0,6
0,8
1,0
1,2
1,4
ie180
ul30
ul34
us3
E (ep0)
L (ul41)
2D Graph 1
Time (h)
0 1 2 3 4 5 6 7
R(t
+1
)-R
t
-0,4
-0,2
0,0
0,2
0,4
0,6
0,8
1,0
1,2
1,4
ie180
ul30
ul34
us3
E (ep0)
L (ul41)
Figure 6. The expression curves of 6 genes. Pearson's correlation analysis was performed for
clustering of PRV genes into groups on the basis of their similar expression dynamics (using
pairwise RΔ values) across the examination period. The early genes have the highest net
increase between 2 and 4 h pi, while they decrease after 4h pi. The ep0 represents the E genes.
The late genes rich their highest R values at 6 h pi. The plot of ul41 shows the typical
expression dynamics of L genes. The ie180, ul30, ul34 and us3 show unique expression
profiles.
Detection and analysis of antisense RNAs
Using strand-specific primers for the reverse transcription, it was possible to detect
transcription from both DNA strands. Due to the sensitivity of the Real-time RT-PCR
technique, we detected antisense transcription from the opposite strand of almost every protein
coding gene both in high and low MOI infection. The figures 7 A and B show the expression
dynamics of two antisense transcripts [the long-latency transcript-1 (LLT1), and the long-
latency transcript-2 (LLT2)], as well as and their sense partners (EP0 and IE180 mRNAs). Llt1
and llt2 are antiparallel to ep0 and ie180, respectively. LLTs of PRV are the only
transcript made during latent viral infection [112].
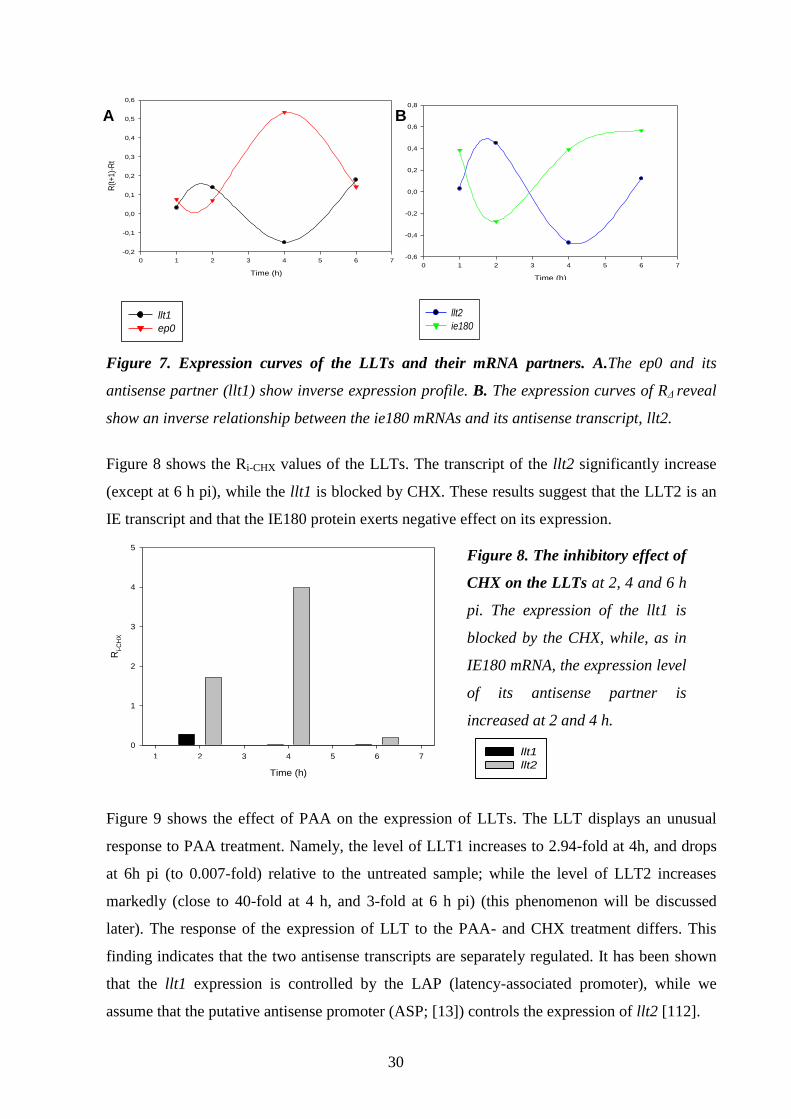
30
llt1, ep0
Time (h)
0 1 2 3 4 5 6 7
R(t
+1
)-R
t
-0,2
-0,1
0,0
0,1
0,2
0,3
0,4
0,5
0,6
llt1
ep0
llt1, ep0
Time (h)
0 1 2 3 4 5 6 7
R(t
+1)-
Rt
-0,2
-0,1
0,0
0,1
0,2
0,3
0,4
0,5
0,6
llt1
ep0
llt1, ep0
Time (h)
0 1 2 3 4 5 6 7
R(t
+1
)-R
t
-0,2
-0,1
0,0
0,1
0,2
0,3
0,4
0,5
0,6
llt1
ep0
Figure 7. Expression curves of the LLTs and their mRNA partners. A.The ep0 and its
antisense partner (llt1) show inverse expression profile. B. The expression curves of RΔ reveal
show an inverse relationship between the ie180 mRNAs and its antisense transcript, llt2.
Figure 8 shows the Ri-CHX values of the LLTs. The transcript of the llt2 significantly increase
(except at 6 h pi), while the llt1 is blocked by CHX. These results suggest that the LLT2 is an
IE transcript and that the IE180 protein exerts negative effect on its expression. 2D Graph 2
Time (h)
1 2 3 4 5 6 7
Ri-
CH
X
0
1
2
3
4
5
llt1
llt2
2D Graph 2
Time (h)
1 2 3 4 5 6 7
Ri-C
HX
0
1
2
3
4
5
llt1
llt2
Figure 9 shows the effect of PAA on the expression of LLTs. The LLT displays an unusual
response to PAA treatment. Namely, the level of LLT1 increases to 2.94-fold at 4h, and drops
at 6h pi (to 0.007-fold) relative to the untreated sample; while the level of LLT2 increases
markedly (close to 40-fold at 4 h, and 3-fold at 6 h pi) (this phenomenon will be discussed
later). The response of the expression of LLT to the PAA- and CHX treatment differs. This
finding indicates that the two antisense transcripts are separately regulated. It has been shown
that the llt1 expression is controlled by the LAP (latency-associated promoter), while we
assume that the putative antisense promoter (ASP; [13]) controls the expression of llt2 [112].
llt2, ie180
Time (h)
0 1 2 3 4 5 6 7
R(t
+1)
-Rt
-0,6
-0,4
-0,2
0,0
0,2
0,4
0,6
0,8
llt2
ie180
llt2, ie180
Time (h)
0 1 2 3 4 5 6 7
R(t
+1
)-R
t
-0,6
-0,4
-0,2
0,0
0,2
0,4
0,6
0,8
llt2
ie180
Figure 8. The inhibitory effect of
CHX on the LLTs at 2, 4 and 6 h
pi. The expression of the llt1 is
blocked by the CHX, while, as in
IE180 mRNA, the expression level
of its antisense partner is
increased at 2 and 4 h.
B A
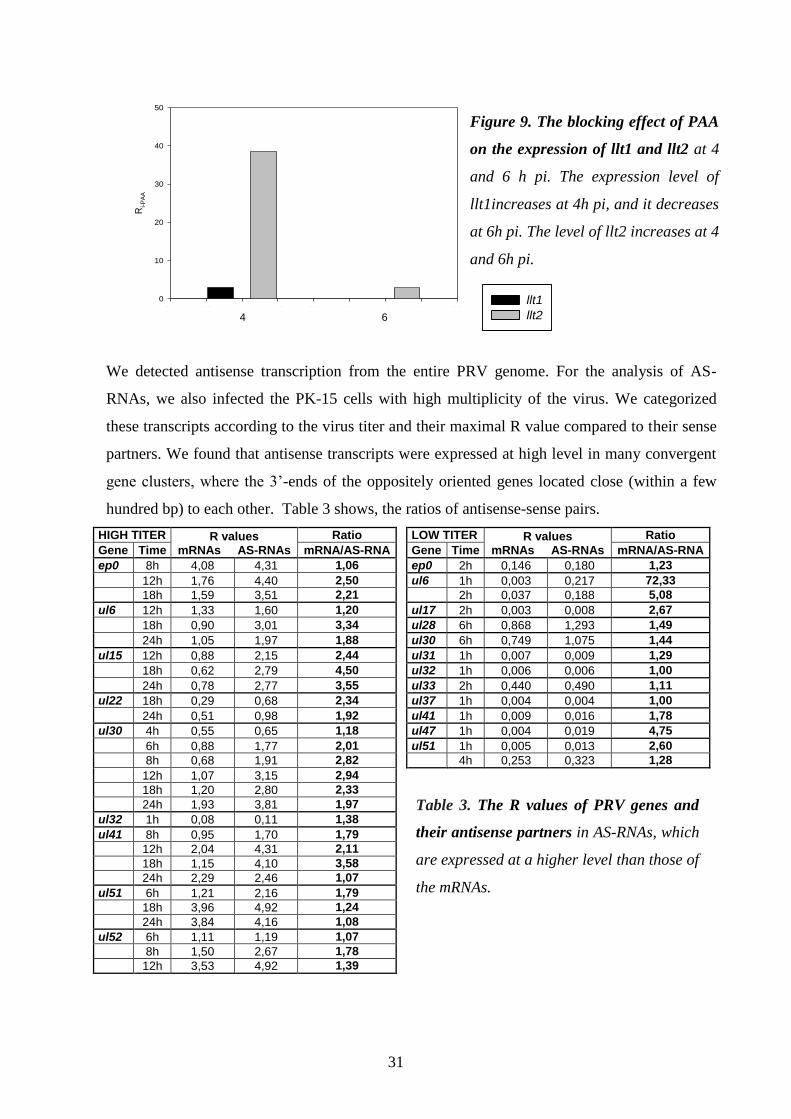
31
2D Graph 3
Time (h)
3,0 3,5 4,0 4,5 5,0 5,5 6,0 6,5 7,0
Ri-
PA
A
0
10
20
30
40
50
llt1
llt2
2D Graph 3
Time (h)
3,0 3,5 4,0 4,5 5,0 5,5 6,0 6,5 7,0
Ri-
PA
A
0
10
20
30
40
50
llt1
llt2
We detected antisense transcription from the entire PRV genome. For the analysis of AS-
RNAs, we also infected the PK-15 cells with high multiplicity of the virus. We categorized
these transcripts according to the virus titer and their maximal R value compared to their sense
partners. We found that antisense transcripts were expressed at high level in many convergent
gene clusters, where the 3’-ends of the oppositely oriented genes located close (within a few
hundred bp) to each other. Table 3 shows, the ratios of antisense-sense pairs.
HIGH TITER R values mRNAs AS-RNAs
Ratio LOW TITER R values mRNAs AS-RNAs
Ratio
Gene Time mRNA/AS-RNA Gene Time mRNA/AS-RNA
ep0 8h 4,08 4,31 1,06 ep0 2h 0,146 0,180 1,23
12h 1,76 4,40 2,50 ul6 1h 0,003 0,217 72,33
18h 1,59 3,51 2,21 2h 0,037 0,188 5,08
ul6 12h 1,33 1,60 1,20 ul17 2h 0,003 0,008 2,67
18h 0,90 3,01 3,34 ul28 6h 0,868 1,293 1,49
24h 1,05 1,97 1,88 ul30 6h 0,749 1,075 1,44
ul15 12h 0,88 2,15 2,44 ul31 1h 0,007 0,009 1,29
18h 0,62 2,79 4,50 ul32 1h 0,006 0,006 1,00
24h 0,78 2,77 3,55 ul33 2h 0,440 0,490 1,11
ul22 18h 0,29 0,68 2,34 ul37 1h 0,004 0,004 1,00
24h 0,51 0,98 1,92 ul41 1h 0,009 0,016 1,78
ul30 4h 0,55 0,65 1,18 ul47 1h 0,004 0,019 4,75
6h 0,88 1,77 2,01 ul51 1h 0,005 0,013 2,60
8h 0,68 1,91 2,82 4h 0,253 0,323 1,28
12h 1,07 3,15 2,94
18h 1,20 2,80 2,33
24h 1,93 3,81 1,97
ul32 1h 0,08 0,11 1,38
ul41 8h 0,95 1,70 1,79
12h 2,04 4,31 2,11
18h 1,15 4,10 3,58
24h 2,29 2,46 1,07
ul51 6h 1,21 2,16 1,79
18h 3,96 4,92 1,24
24h 3,84 4,16 1,08
ul52 6h 1,11 1,19 1,07
8h 1,50 2,67 1,78
12h 3,53 4,92 1,39
Time (h) 4 6
Figure 9. The blocking effect of PAA
on the expression of llt1 and llt2 at 4
and 6 h pi. The expression level of
llt1increases at 4h pi, and it decreases
at 6h pi. The level of llt2 increases at 4
and 6h pi.
Table 3. The R values of PRV genes and
their antisense partners in AS-RNAs, which
are expressed at a higher level than those of
the mRNAs.
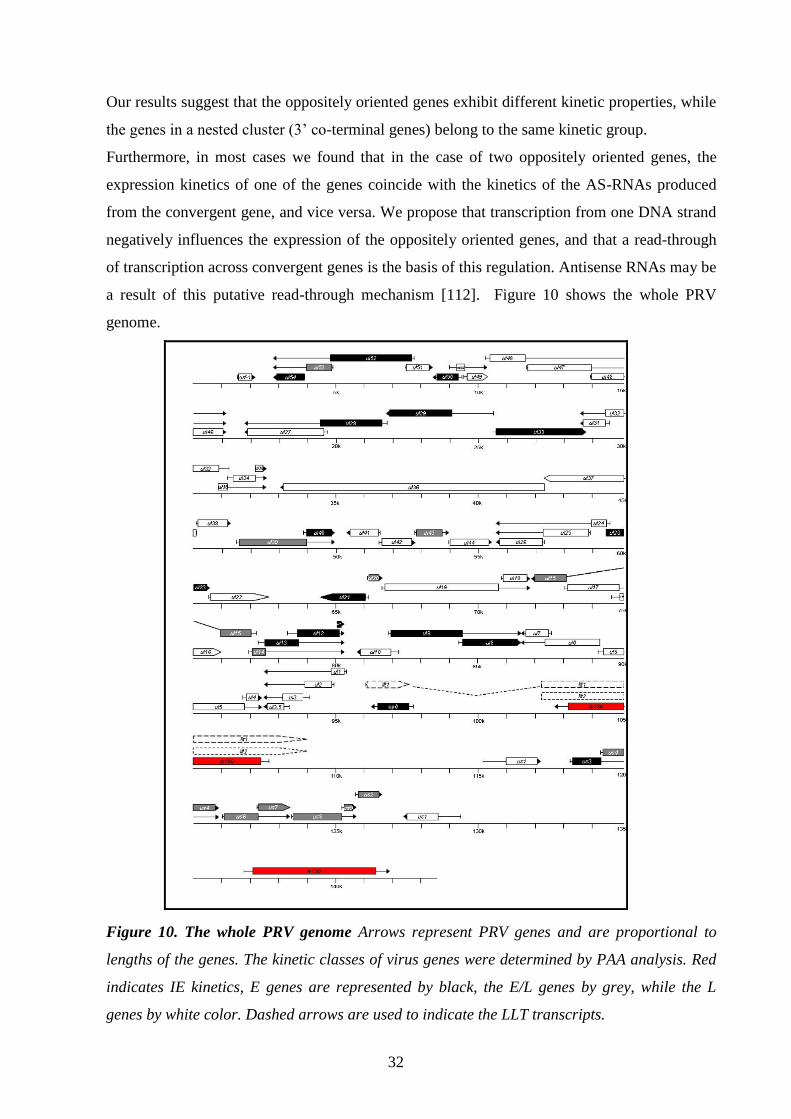
32
Our results suggest that the oppositely oriented genes exhibit different kinetic properties, while
the genes in a nested cluster (3’ co-terminal genes) belong to the same kinetic group.
Furthermore, in most cases we found that in the case of two oppositely oriented genes, the
expression kinetics of one of the genes coincide with the kinetics of the AS-RNAs produced
from the convergent gene, and vice versa. We propose that transcription from one DNA strand
negatively influences the expression of the oppositely oriented genes, and that a read-through
of transcription across convergent genes is the basis of this regulation. Antisense RNAs may be
a result of this putative read-through mechanism [112]. Figure 10 shows the whole PRV
genome.
Figure 10. The whole PRV genome Arrows represent PRV genes and are proportional to
lengths of the genes. The kinetic classes of virus genes were determined by PAA analysis. Red
indicates IE kinetics, E genes are represented by black, the E/L genes by grey, while the L
genes by white color. Dashed arrows are used to indicate the LLT transcripts.
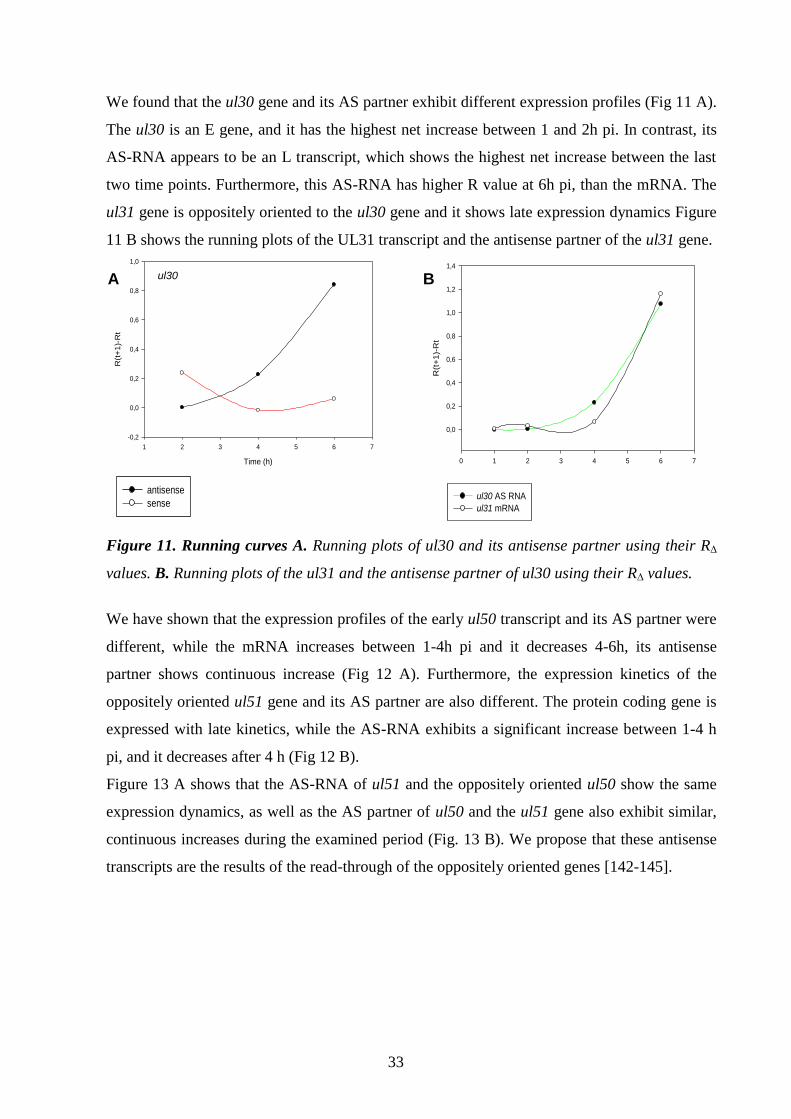
33
We found that the ul30 gene and its AS partner exhibit different expression profiles (Fig 11 A).
The ul30 is an E gene, and it has the highest net increase between 1 and 2h pi. In contrast, its
AS-RNA appears to be an L transcript, which shows the highest net increase between the last
two time points. Furthermore, this AS-RNA has higher R value at 6h pi, than the mRNA. The
ul31 gene is oppositely oriented to the ul30 gene and it shows late expression dynamics Figure
11 B shows the running plots of the UL31 transcript and the antisense partner of the ul31 gene. 2D Graph 2
Time (h)
1 2 3 4 5 6 7
R(t
+1
)-R
t
-0,2
0,0
0,2
0,4
0,6
0,8
1,0
antisense
sense
2D Graph 1
Time (h)
0 1 2 3 4 5 6 7
R(t
+1)-
Rt
0,0
0,2
0,4
0,6
0,8
1,0
1,2
1,4
ul30 AS RNA
ul31 mRNA
2D Graph 2
Time (h)
1 2 3 4 5 6 7
R(t
+1
)-R
t
-0,2
0,0
0,2
0,4
0,6
0,8
1,0
antisense
sense
2D Graph 1
Time (h)
0 1 2 3 4 5 6 7
R(t
+1
)-R
t0,0
0,2
0,4
0,6
0,8
1,0
1,2
1,4
ul30 AS RNA
ul31 mRNA
Figure 11. Running curves A. Running plots of ul30 and its antisense partner using their R∆
values. B. Running plots of the ul31 and the antisense partner of ul30 using their R∆ values.
We have shown that the expression profiles of the early ul50 transcript and its AS partner were
different, while the mRNA increases between 1-4h pi and it decreases 4-6h, its antisense
partner shows continuous increase (Fig 12 A). Furthermore, the expression kinetics of the
oppositely oriented ul51 gene and its AS partner are also different. The protein coding gene is
expressed with late kinetics, while the AS-RNA exhibits a significant increase between 1-4 h
pi, and it decreases after 4 h (Fig 12 B).
Figure 13 A shows that the AS-RNA of ul51 and the oppositely oriented ul50 show the same
expression dynamics, as well as the AS partner of ul50 and the ul51 gene also exhibit similar,
continuous increases during the examined period (Fig. 13 B). We propose that these antisense
transcripts are the results of the read-through of the oppositely oriented genes [142-145].
ul30 B A
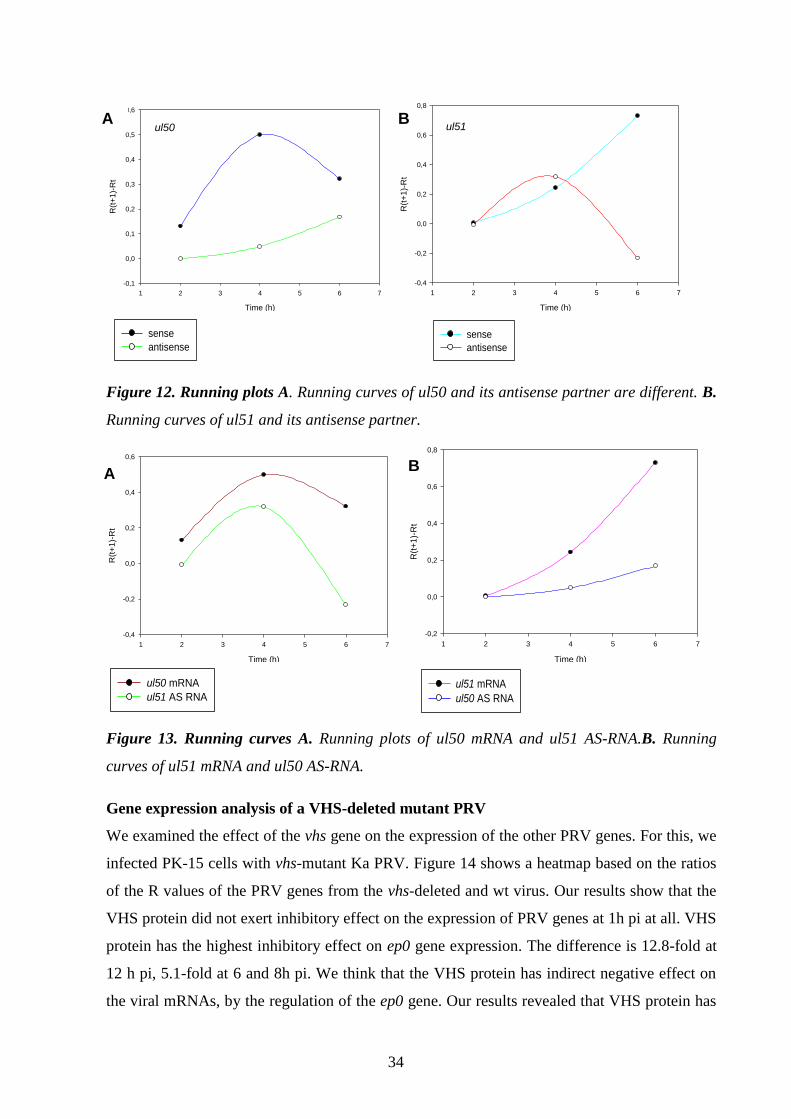
34
ul50
Time (h)
1 2 3 4 5 6 7
R(t
+1)-
Rt
-0,1
0,0
0,1
0,2
0,3
0,4
0,5
0,6
sense
antisense
ul51
Time (h)
1 2 3 4 5 6 7
R(t
+1)-
Rt
-0,4
-0,2
0,0
0,2
0,4
0,6
0,8
sense
antisense
ul50
Time (h)
1 2 3 4 5 6 7
R(t
+1)-
Rt
-0,1
0,0
0,1
0,2
0,3
0,4
0,5
0,6
sense
antisense
ul51
Time (h)
1 2 3 4 5 6 7
R(t
+1
)-R
t
-0,4
-0,2
0,0
0,2
0,4
0,6
0,8
sense
antisense
Figure 12. Running plots A. Running curves of ul50 and its antisense partner are different. B.
Running curves of ul51 and its antisense partner. 2D Graph 3
Time (h)
1 2 3 4 5 6 7
R(t
+1
)-R
t
-0,4
-0,2
0,0
0,2
0,4
0,6
ul50 mRNA
ul51 AS RNA
2D Graph 4
Time (h)
1 2 3 4 5 6 7
R(t
+1
)-R
t
-0,2
0,0
0,2
0,4
0,6
0,8
ul51 mRNA
ul50 AS RNA
2D Graph 3
Time (h)
1 2 3 4 5 6 7
R(t
+1
)-R
t
-0,4
-0,2
0,0
0,2
0,4
0,6
ul50 mRNA
ul51 AS RNA
2D Graph 4
Time (h)
1 2 3 4 5 6 7
R(t
+1
)-R
t
-0,2
0,0
0,2
0,4
0,6
0,8
ul51 mRNA
ul50 AS RNA
Figure 13. Running curves A. Running plots of ul50 mRNA and ul51 AS-RNA.B. Running
curves of ul51 mRNA and ul50 AS-RNA.
Gene expression analysis of a VHS-deleted mutant PRV
We examined the effect of the vhs gene on the expression of the other PRV genes. For this, we
infected PK-15 cells with vhs-mutant Ka PRV. Figure 14 shows a heatmap based on the ratios
of the R values of the PRV genes from the vhs-deleted and wt virus. Our results show that the
VHS protein did not exert inhibitory effect on the expression of PRV genes at 1h pi at all. VHS
protein has the highest inhibitory effect on ep0 gene expression. The difference is 12.8-fold at
12 h pi, 5.1-fold at 6 and 8h pi. We think that the VHS protein has indirect negative effect on
the viral mRNAs, by the regulation of the ep0 gene. Our results revealed that VHS protein has
B ul50 ul51
A
B A
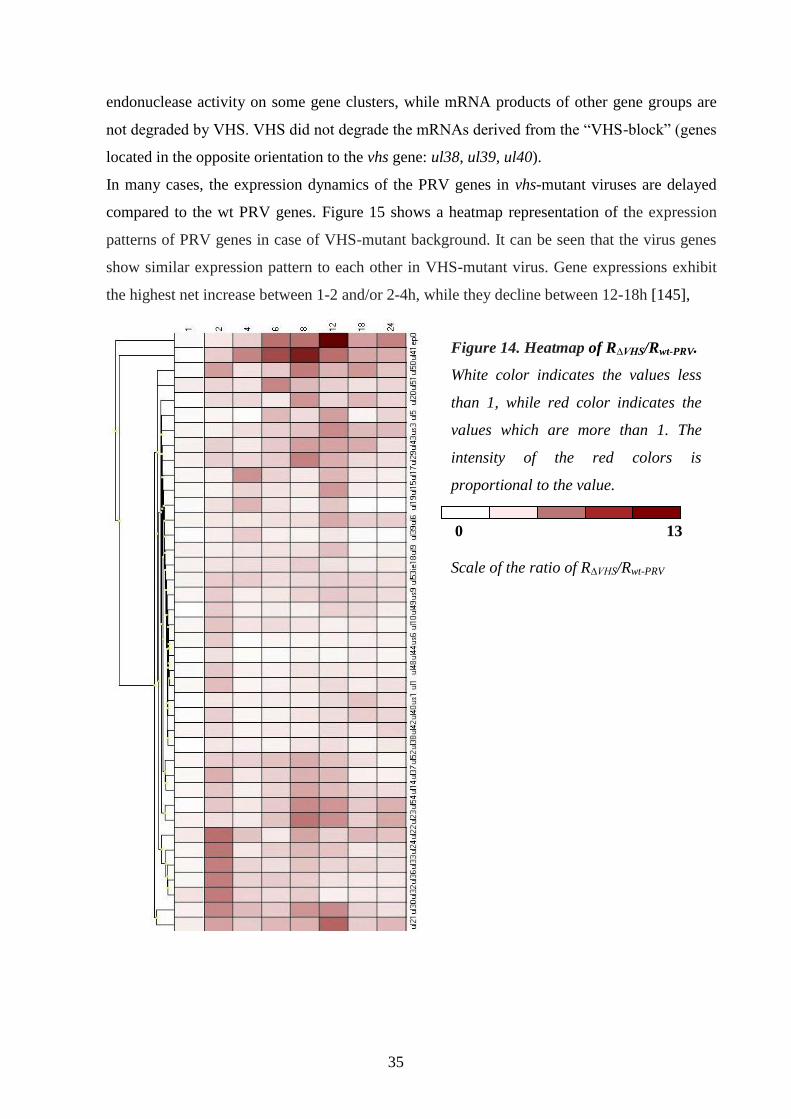
35
endonuclease activity on some gene clusters, while mRNA products of other gene groups are
not degraded by VHS. VHS did not degrade the mRNAs derived from the “VHS-block” (genes
located in the opposite orientation to the vhs gene: ul38, ul39, ul40).
In many cases, the expression dynamics of the PRV genes in vhs-mutant viruses are delayed
compared to the wt PRV genes. Figure 15 shows a heatmap representation of the expression
patterns of PRV genes in case of VHS-mutant background. It can be seen that the virus genes
show similar expression pattern to each other in VHS-mutant virus. Gene expressions exhibit
the highest net increase between 1-2 and/or 2-4h, while they decline between 12-18h [145],
Figure 14. Heatmap of R∆VHS/Rwt-PRV.
White color indicates the values less
than 1, while red color indicates the
values which are more than 1. The
intensity of the red colors is
proportional to the value.
0 13
Scale of the ratio of R∆VHS/Rwt-PRV
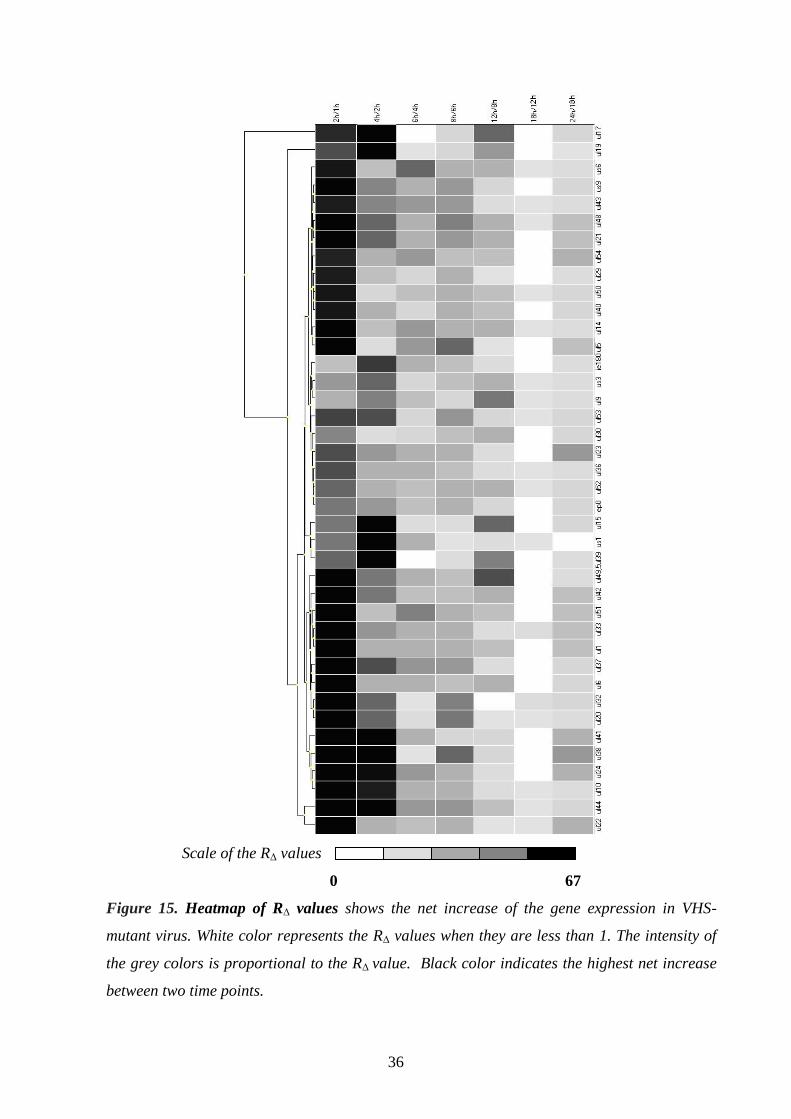
36
Scale of the R∆ values
0 67
Figure 15. Heatmap of R∆ values shows the net increase of the gene expression in VHS-
mutant virus. White color represents the R∆ values when they are less than 1. The intensity of
the grey colors is proportional to the R∆ value. Black color indicates the highest net increase
between two time points.
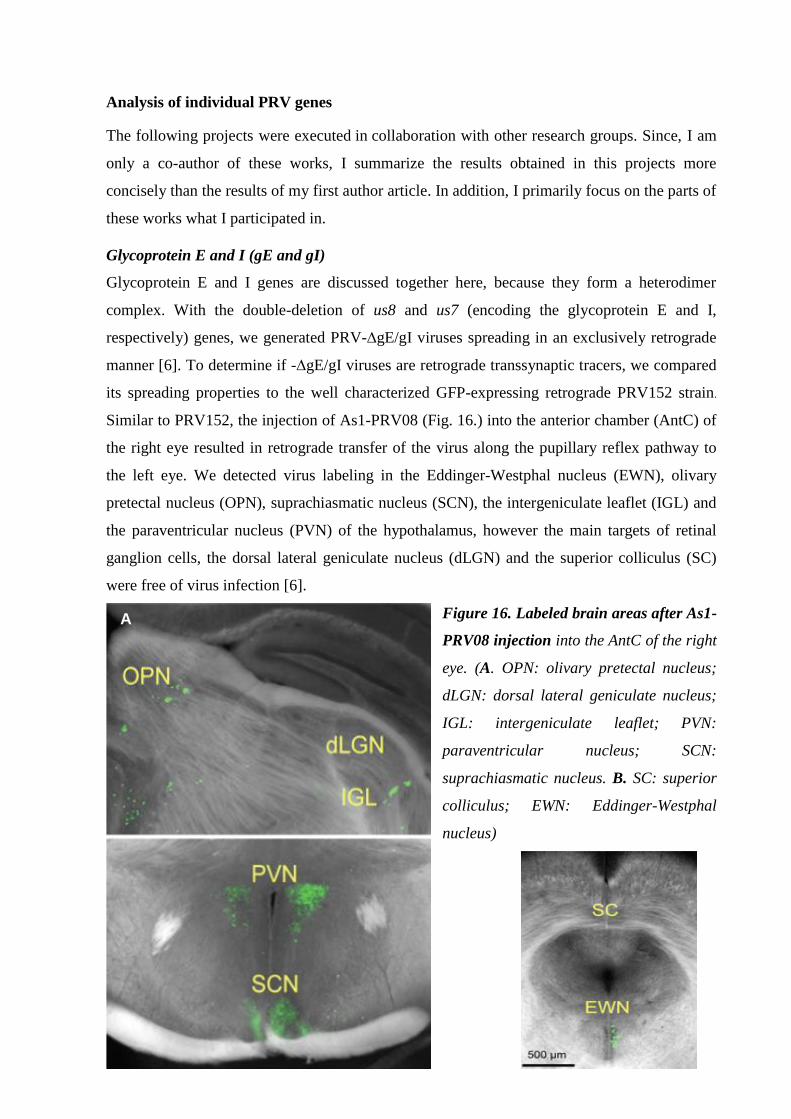
37
Analysis of individual PRV genes
The following projects were executed in collaboration with other research groups. Since, I am
only a co-author of these works, I summarize the results obtained in this projects more
concisely than the results of my first author article. In addition, I primarily focus on the parts of
these works what I participated in.
Glycoprotein E and I (gE and gI)
Glycoprotein E and I genes are discussed together here, because they form a heterodimer
complex. With the double-deletion of us8 and us7 (encoding the glycoprotein E and I,
respectively) genes, we generated PRV-∆gE/gI viruses spreading in an exclusively retrograde
manner [6]. To determine if -∆gE/gI viruses are retrograde transsynaptic tracers, we compared
its spreading properties to the well characterized GFP-expressing retrograde PRV152 strain.
Similar to PRV152, the injection of As1-PRV08 (Fig. 16.) into the anterior chamber (AntC) of
the right eye resulted in retrograde transfer of the virus along the pupillary reflex pathway to
the left eye. We detected virus labeling in the Eddinger-Westphal nucleus (EWN), olivary
pretectal nucleus (OPN), suprachiasmatic nucleus (SCN), the intergeniculate leaflet (IGL) and
the paraventricular nucleus (PVN) of the hypothalamus, however the main targets of retinal
ganglion cells, the dorsal lateral geniculate nucleus (dLGN) and the superior colliculus (SC)
were free of virus infection [6].
Figure 16. Labeled brain areas after As1-
PRV08 injection into the AntC of the right
eye. (A. OPN: olivary pretectal nucleus;
dLGN: dorsal lateral geniculate nucleus;
IGL: intergeniculate leaflet; PVN:
paraventricular nucleus; SCN:
suprachiasmatic nucleus. B. SC: superior
colliculus; EWN: Eddinger-Westphal
nucleus)
A
B
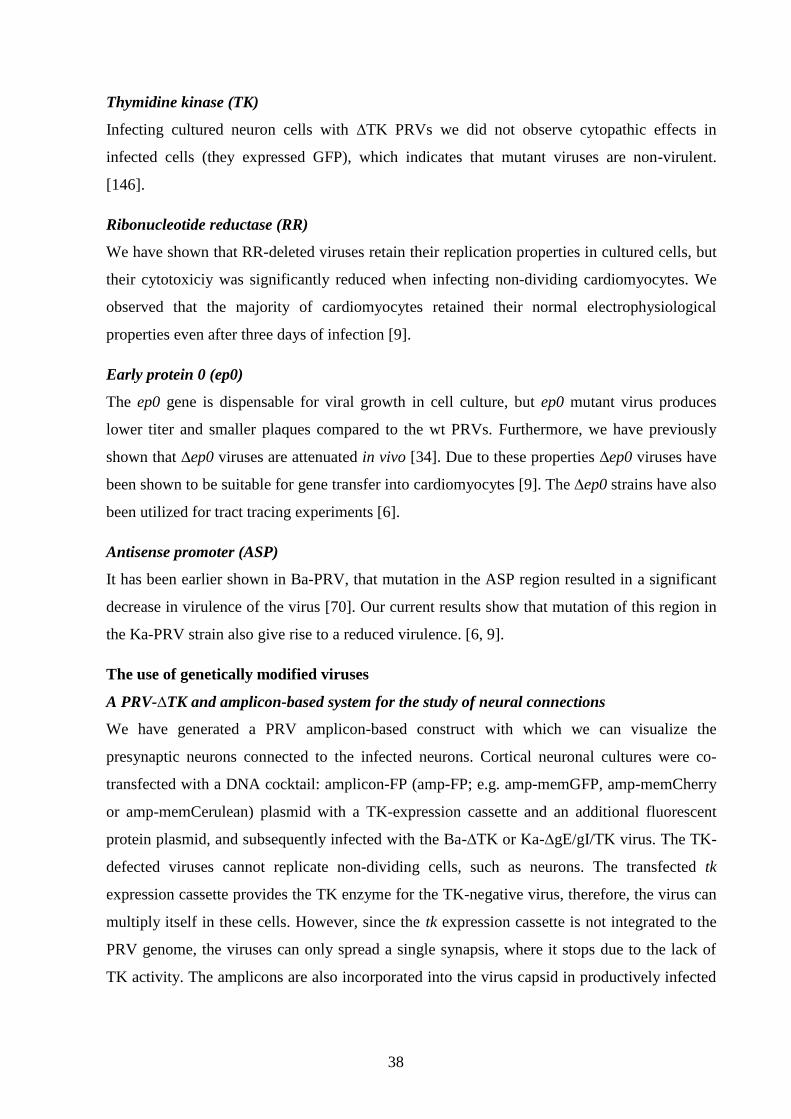
38
Thymidine kinase (TK)
Infecting cultured neuron cells with ∆TK PRVs we did not observe cytopathic effects in
infected cells (they expressed GFP), which indicates that mutant viruses are non-virulent.
[146].
Ribonucleotide reductase (RR)
We have shown that RR-deleted viruses retain their replication properties in cultured cells, but
their cytotoxiciy was significantly reduced when infecting non-dividing cardiomyocytes. We
observed that the majority of cardiomyocytes retained their normal electrophysiological
properties even after three days of infection [9].
Early protein 0 (ep0)
The ep0 gene is dispensable for viral growth in cell culture, but ep0 mutant virus produces
lower titer and smaller plaques compared to the wt PRVs. Furthermore, we have previously
shown that ∆ep0 viruses are attenuated in vivo [34]. Due to these properties ∆ep0 viruses have
been shown to be suitable for gene transfer into cardiomyocytes [9]. The ∆ep0 strains have also
been utilized for tract tracing experiments [6].
Antisense promoter (ASP)
It has been earlier shown in Ba-PRV, that mutation in the ASP region resulted in a significant
decrease in virulence of the virus [70]. Our current results show that mutation of this region in
the Ka-PRV strain also give rise to a reduced virulence. [6, 9].
The use of genetically modified viruses
A PRV-∆TK and amplicon-based system for the study of neural connections
We have generated a PRV amplicon-based construct with which we can visualize the
presynaptic neurons connected to the infected neurons. Cortical neuronal cultures were co-
transfected with a DNA cocktail: amplicon-FP (amp-FP; e.g. amp-memGFP, amp-memCherry
or amp-memCerulean) plasmid with a TK-expression cassette and an additional fluorescent
protein plasmid, and subsequently infected with the Ba-∆TK or Ka-∆gE/gI/TK virus. The TK-
defected viruses cannot replicate non-dividing cells, such as neurons. The transfected tk
expression cassette provides the TK enzyme for the TK-negative virus, therefore, the virus can
multiply itself in these cells. However, since the tk expression cassette is not integrated to the
PRV genome, the viruses can only spread a single synapsis, where it stops due to the lack of
TK activity. The amplicons are also incorporated into the virus capsid in productively infected
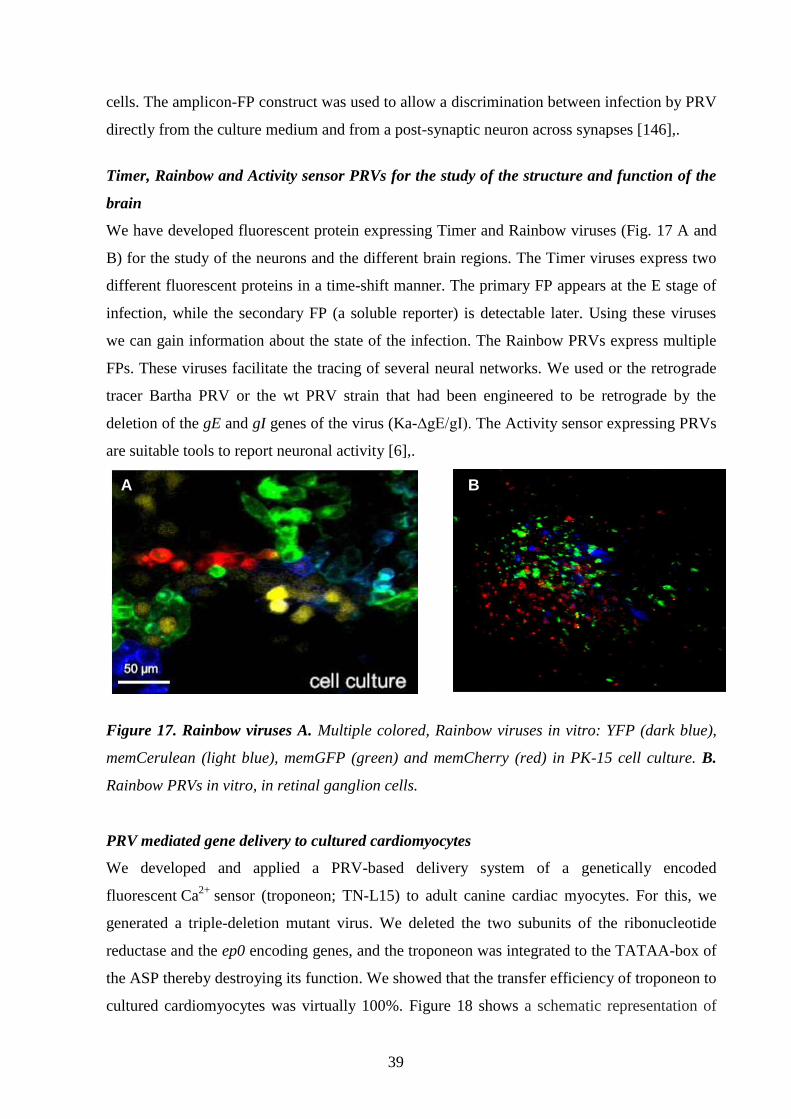
39
cells. The amplicon-FP construct was used to allow a discrimination between infection by PRV
directly from the culture medium and from a post-synaptic neuron across synapses [146],.
Timer, Rainbow and Activity sensor PRVs for the study of the structure and function of the
brain
We have developed fluorescent protein expressing Timer and Rainbow viruses (Fig. 17 A and
B) for the study of the neurons and the different brain regions. The Timer viruses express two
different fluorescent proteins in a time-shift manner. The primary FP appears at the E stage of
infection, while the secondary FP (a soluble reporter) is detectable later. Using these viruses
we can gain information about the state of the infection. The Rainbow PRVs express multiple
FPs. These viruses facilitate the tracing of several neural networks. We used or the retrograde
tracer Bartha PRV or the wt PRV strain that had been engineered to be retrograde by the
deletion of the gE and gI genes of the virus (Ka-∆gE/gI). The Activity sensor expressing PRVs
are suitable tools to report neuronal activity [6],.
Figure 17. Rainbow viruses A. Multiple colored, Rainbow viruses in vitro: YFP (dark blue),
memCerulean (light blue), memGFP (green) and memCherry (red) in PK-15 cell culture. B.
Rainbow PRVs in vitro, in retinal ganglion cells.
PRV mediated gene delivery to cultured cardiomyocytes
We developed and applied a PRV-based delivery system of a genetically encoded
fluorescent Ca2+
sensor (troponeon; TN-L15) to adult canine cardiac myocytes. For this, we
generated a triple-deletion mutant virus. We deleted the two subunits of the ribonucleotide
reductase and the ep0 encoding genes, and the troponeon was integrated to the TATAA-box of
the ASP thereby destroying its function. We showed that the transfer efficiency of troponeon to
cultured cardiomyocytes was virtually 100%. Figure 18 shows a schematic representation of
B A
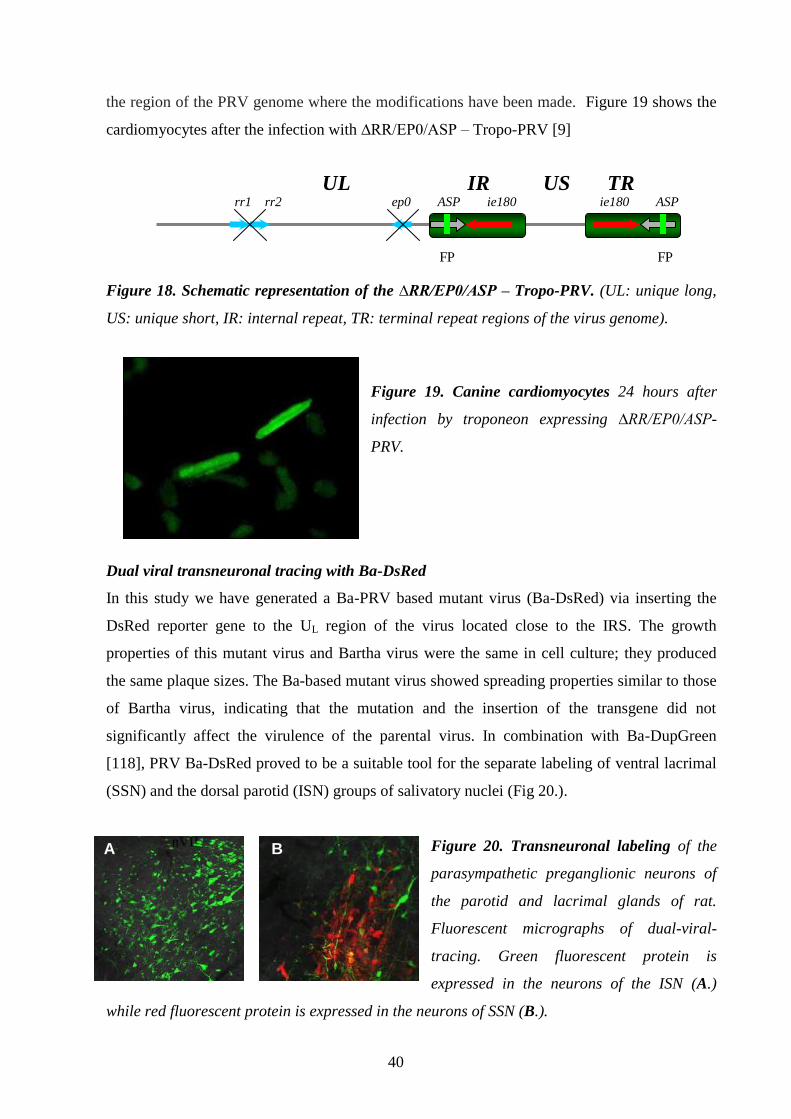
40
the region of the PRV genome where the modifications have been made. Figure 19 shows the
cardiomyocytes after the infection with ∆RR/EP0/ASP – Tropo-PRV [9]
Figure 18. Schematic representation of the ∆RR/EP0/ASP – Tropo-PRV. (UL: unique long,
US: unique short, IR: internal repeat, TR: terminal repeat regions of the virus genome).
Figure 19. Canine cardiomyocytes 24 hours after
infection by troponeon expressing ∆RR/EP0/ASP-
PRV.
Dual viral transneuronal tracing with Ba-DsRed
In this study we have generated a Ba-PRV based mutant virus (Ba-DsRed) via inserting the
DsRed reporter gene to the UL region of the virus located close to the IRS. The growth
properties of this mutant virus and Bartha virus were the same in cell culture; they produced
the same plaque sizes. The Ba-based mutant virus showed spreading properties similar to those
of Bartha virus, indicating that the mutation and the insertion of the transgene did not
significantly affect the virulence of the parental virus. In combination with Ba-DupGreen
[118], PRV Ba-DsRed proved to be a suitable tool for the separate labeling of ventral lacrimal
(SSN) and the dorsal parotid (ISN) groups of salivatory nuclei (Fig 20.).
Figure 20. Transneuronal labeling of the
parasympathetic preganglionic neurons of
the parotid and lacrimal glands of rat.
Fluorescent micrographs of dual-viral-
tracing. Green fluorescent protein is
expressed in the neurons of the ISN (A.)
while red fluorescent protein is expressed in the neurons of SSN (B.).
rr1 rr2 ep0 ASP ie180 ie180 ASP
UL IR US TR
FP FP
A B
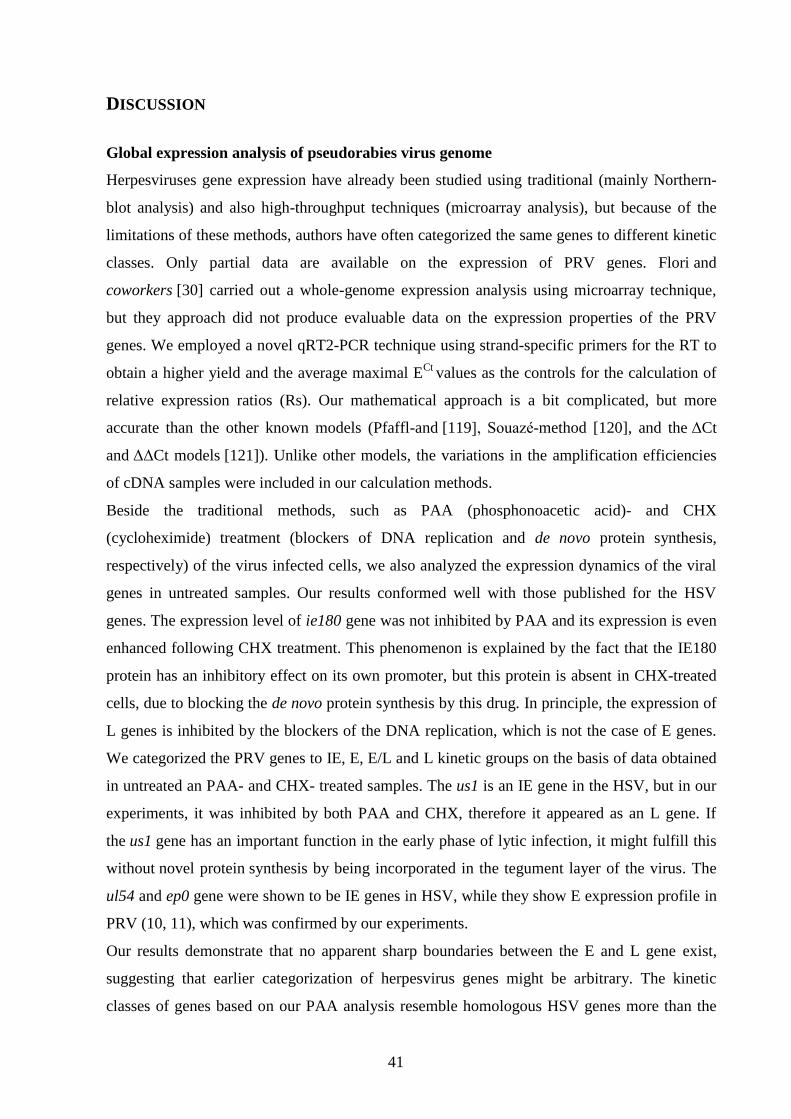
41
DISCUSSION
Global expression analysis of pseudorabies virus genome
Herpesviruses gene expression have already been studied using traditional (mainly Northern-
blot analysis) and also high-throughput techniques (microarray analysis), but because of the
limitations of these methods, authors have often categorized the same genes to different kinetic
classes. Only partial data are available on the expression of PRV genes. Flori and
coworkers [30] carried out a whole-genome expression analysis using microarray technique,
but they approach did not produce evaluable data on the expression properties of the PRV
genes. We employed a novel qRT2-PCR technique using strand-specific primers for the RT to
obtain a higher yield and the average maximal ECt
values as the controls for the calculation of
relative expression ratios (Rs). Our mathematical approach is a bit complicated, but more
accurate than the other known models (Pfaffl-and [119], Souazé-method [120], and the ΔCt
and ΔΔCt models [121]). Unlike other models, the variations in the amplification efficiencies
of cDNA samples were included in our calculation methods.
Beside the traditional methods, such as PAA (phosphonoacetic acid)- and CHX
(cycloheximide) treatment (blockers of DNA replication and de novo protein synthesis,
respectively) of the virus infected cells, we also analyzed the expression dynamics of the viral
genes in untreated samples. Our results conformed well with those published for the HSV
genes. The expression level of ie180 gene was not inhibited by PAA and its expression is even
enhanced following CHX treatment. This phenomenon is explained by the fact that the IE180
protein has an inhibitory effect on its own promoter, but this protein is absent in CHX-treated
cells, due to blocking the de novo protein synthesis by this drug. In principle, the expression of
L genes is inhibited by the blockers of the DNA replication, which is not the case of E genes.
We categorized the PRV genes to IE, E, E/L and L kinetic groups on the basis of data obtained
in untreated an PAA- and CHX- treated samples. The us1 is an IE gene in the HSV, but in our
experiments, it was inhibited by both PAA and CHX, therefore it appeared as an L gene. If
the us1 gene has an important function in the early phase of lytic infection, it might fulfill this
without novel protein synthesis by being incorporated in the tegument layer of the virus. The
ul54 and ep0 gene were shown to be IE genes in HSV, while they show E expression profile in
PRV (10, 11), which was confirmed by our experiments.
Our results demonstrate that no apparent sharp boundaries between the E and L gene exist,
suggesting that earlier categorization of herpesvirus genes might be arbitrary. The kinetic
classes of genes based on our PAA analysis resemble homologous HSV genes more than the
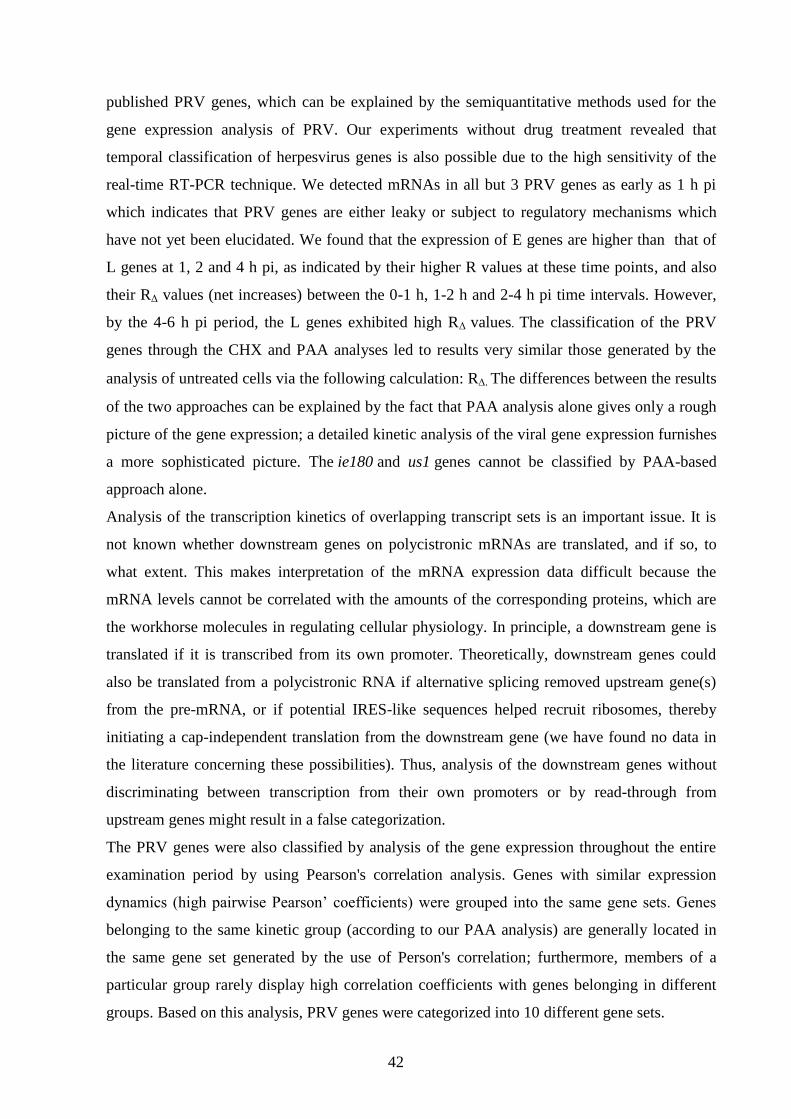
42
published PRV genes, which can be explained by the semiquantitative methods used for the
gene expression analysis of PRV. Our experiments without drug treatment revealed that
temporal classification of herpesvirus genes is also possible due to the high sensitivity of the
real-time RT-PCR technique. We detected mRNAs in all but 3 PRV genes as early as 1 h pi
which indicates that PRV genes are either leaky or subject to regulatory mechanisms which
have not yet been elucidated. We found that the expression of E genes are higher than that of
L genes at 1, 2 and 4 h pi, as indicated by their higher R values at these time points, and also
their RΔ values (net increases) between the 0-1 h, 1-2 h and 2-4 h pi time intervals. However,
by the 4-6 h pi period, the L genes exhibited high RΔ values. The classification of the PRV
genes through the CHX and PAA analyses led to results very similar those generated by the
analysis of untreated cells via the following calculation: R. The differences between the results
of the two approaches can be explained by the fact that PAA analysis alone gives only a rough
picture of the gene expression; a detailed kinetic analysis of the viral gene expression furnishes
a more sophisticated picture. The ie180 and us1 genes cannot be classified by PAA-based
approach alone.
Analysis of the transcription kinetics of overlapping transcript sets is an important issue. It is
not known whether downstream genes on polycistronic mRNAs are translated, and if so, to
what extent. This makes interpretation of the mRNA expression data difficult because the
mRNA levels cannot be correlated with the amounts of the corresponding proteins, which are
the workhorse molecules in regulating cellular physiology. In principle, a downstream gene is
translated if it is transcribed from its own promoter. Theoretically, downstream genes could
also be translated from a polycistronic RNA if alternative splicing removed upstream gene(s)
from the pre-mRNA, or if potential IRES-like sequences helped recruit ribosomes, thereby
initiating a cap-independent translation from the downstream gene (we have found no data in
the literature concerning these possibilities). Thus, analysis of the downstream genes without
discriminating between transcription from their own promoters or by read-through from
upstream genes might result in a false categorization.
The PRV genes were also classified by analysis of the gene expression throughout the entire
examination period by using Pearson's correlation analysis. Genes with similar expression
dynamics (high pairwise Pearson’ coefficients) were grouped into the same gene sets. Genes
belonging to the same kinetic group (according to our PAA analysis) are generally located in
the same gene set generated by the use of Person's correlation; furthermore, members of a
particular group rarely display high correlation coefficients with genes belonging in different
groups. Based on this analysis, PRV genes were categorized into 10 different gene sets.
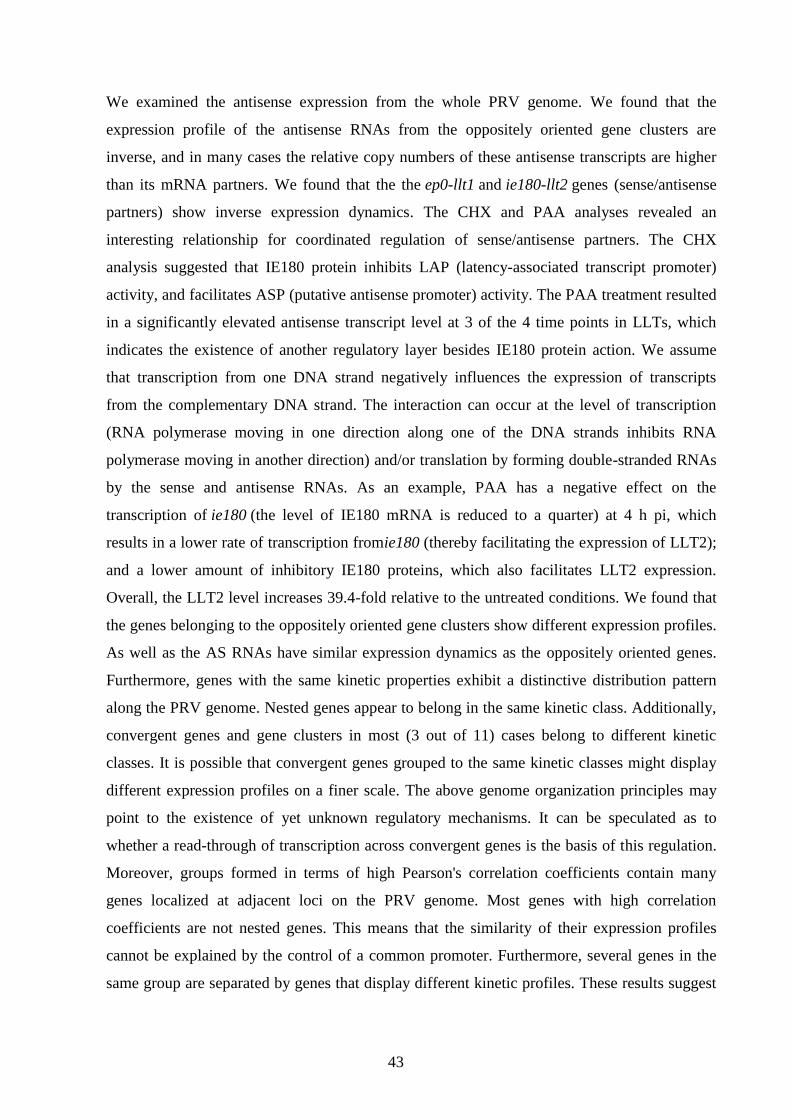
43
We examined the antisense expression from the whole PRV genome. We found that the
expression profile of the antisense RNAs from the oppositely oriented gene clusters are
inverse, and in many cases the relative copy numbers of these antisense transcripts are higher
than its mRNA partners. We found that the the ep0-llt1 and ie180-llt2 genes (sense/antisense
partners) show inverse expression dynamics. The CHX and PAA analyses revealed an
interesting relationship for coordinated regulation of sense/antisense partners. The CHX
analysis suggested that IE180 protein inhibits LAP (latency-associated transcript promoter)
activity, and facilitates ASP (putative antisense promoter) activity. The PAA treatment resulted
in a significantly elevated antisense transcript level at 3 of the 4 time points in LLTs, which
indicates the existence of another regulatory layer besides IE180 protein action. We assume
that transcription from one DNA strand negatively influences the expression of transcripts
from the complementary DNA strand. The interaction can occur at the level of transcription
(RNA polymerase moving in one direction along one of the DNA strands inhibits RNA
polymerase moving in another direction) and/or translation by forming double-stranded RNAs
by the sense and antisense RNAs. As an example, PAA has a negative effect on the
transcription of ie180 (the level of IE180 mRNA is reduced to a quarter) at 4 h pi, which
results in a lower rate of transcription fromie180 (thereby facilitating the expression of LLT2);
and a lower amount of inhibitory IE180 proteins, which also facilitates LLT2 expression.
Overall, the LLT2 level increases 39.4-fold relative to the untreated conditions. We found that
the genes belonging to the oppositely oriented gene clusters show different expression profiles.
As well as the AS RNAs have similar expression dynamics as the oppositely oriented genes.
Furthermore, genes with the same kinetic properties exhibit a distinctive distribution pattern
along the PRV genome. Nested genes appear to belong in the same kinetic class. Additionally,
convergent genes and gene clusters in most (3 out of 11) cases belong to different kinetic
classes. It is possible that convergent genes grouped to the same kinetic classes might display
different expression profiles on a finer scale. The above genome organization principles may
point to the existence of yet unknown regulatory mechanisms. It can be speculated as to
whether a read-through of transcription across convergent genes is the basis of this regulation.
Moreover, groups formed in terms of high Pearson's correlation coefficients contain many
genes localized at adjacent loci on the PRV genome. Most genes with high correlation
coefficients are not nested genes. This means that the similarity of their expression profiles
cannot be explained by the control of a common promoter. Furthermore, several genes in the
same group are separated by genes that display different kinetic profiles. These results suggest
44
the existence of a genetic mechanism that synchronizes gene expression on a higher-order
scale.
We have analyzed the effect of VHS mutation on the other PRV genes. Our data revealed that
the VHS protein induces endoribonucleolytic activity of certain viral mRNAs. VHS has the
highest inhibitory effect on the EP0 expression. We cannot exclude that VHS has an inhibitory
effect on the expression of PRV genes through the inhibition of EP0 by degrading the EP0
transcript.
Functional analysis of the virus genes
Timer, Rainbow and Activity sensor viruses for the analysis of the brain structure and
function
We used a gE/gI∆-PRV spreading in a retrograde manner for the generation of Timer, Rainbow
and Activity sensor PRVs. Timer viruses express two fluorescent proteins (DsRed2 and GFP)
with a delayed expression kinetics to gain information about the state of infection. The
multicolored Rainbow PRVs help to dissect the fine structure of brain nuclei sending multiple
outputs. Finally, we have developed Activity sensor viruses encoding genetic fluorescent Ca2+
sensor to report the activity of the labeled neurons.
This project was executed in cooperation between the Department of Medical Biology,
University of Szeged, Szeged, Hungary and the Friedrich Miescher Institute, Basel,
Switzerland.
Examination of monosynaptic neural connections
We have generated a four-component system that made it possible to analyze the presynaptic
neurons connected to the targeted nerve cells. We deleted the TK gene using as a parental
virus, the retrograde tracer Ba-PRV, or the gE/gI∆-PRV which indicated monosynaptic
transsynaptic spreading of the virus. Fluorescent protein expressing PRV-amplicons were used for
the visualization of the presynaptic neurons.
These results due to a scientific cooperation with the Medical School, University of
Birmingham, Birmingham, United Kingdom.
45
PRV-mediated gene delivery into cardiomyocytes
Pseudorabies virus is a widely used transsynaptic tracer for the study of neural pathways due to
its ability that is to spread across the synapses and deliver marker genes. Tract tracing
herpesvirus strains must retain their virulence for their successful spread in the nervous system.
However, a gene delivery vector must be non-virulent, otherwise it destroys the physiological
functions of the targeted cells. In this study we have developed a herpesvirus-based vector for
delivery of genetically encoded activity sensors to cultured canine cardiac myocytes, which is a
novel tool in cardiovascular research.
Our system has advantages compare to the earlier applied nonviral methods: we showed that
the PRV enters to cells did not cause cytototxic effects, the virus did not change the measured
electrophysiological properties of the myocytes for a prolonged period. Cells are suitable for
electrophysiological studies after 4 days.
Our results demonstrate that novel PRV-based vectors can transduce genes efficiently into
nondividing cardiomyocytes. Thus, PRV can be an alternative to the other viral systems based
on adeno-, adeno-associated- and retroviral systems.
This project was performed in cooperation with the Department of Pharmacology and
Pharmacotherapy, University of Szeged, Szeged, Hungary.
Dual viral tracing of neurons
We have developed a dual Bartha-PRV-based viral tracer system (Ba-DsRed and Ba-
DupGreen), which was utilized for labeling the sensory, the parasympathetic and the
sympathetic pathways related to the parotid gland, and for defining the relationship between
the ventral lacrimal (SSN) and the dorsal parotid (ISN) groups of salivatory nuclei.
This project was executed in cooperation program with Neuromorphological and
Neuroendocrine Research Laboratory, Hungarian Academy of Sciences and Semmelweis
University, Budapest, Hungary.
46
SUMMARY
…OF THE TRANSCRIPTIONAL ANALYSIS
1. We have developed a real-time RT-PCR method for the global analysis of PRV gene
expression.
2. We have developed a novel calculation method which allows us to examine the relative
expression ratios, characterize the expression dynamics of all PRV genes and also categorized
them.
3. This method is applicable to evaluate loss of function phenotypes of mutant viruses and to
analyze the antisense transcription from the whole genome.
4. The model is also applicable for the analysis of gene expression in any genetic system that
progressively changes in time.
… OF THE VIRAL TRACING METHODS
1. We have developed PRV-based troponeon expressing transsynaptic tracers (activity sensor
PRVs) which label synaptically connected nerve cells and also permit assaying the dynamics of
activity of neurons located several synapses away from the inoculation site.
2. We have generated timer viruses by inserting a red fluorescent protein gene expression-
cassette to the genome of activity sensor PRV. DsRed-2 served as indicator of late phase of
virus cycle since it exhibits a slow maturation time, and it was inserted to a transcriptionally
less permissive DNA region than the troponeon gene.
3. We have generated Rainbow viruses that are useful for dissecting the local circuit
organizations of brain nuclei.
4. We have developed genetically engineered strains of Ba and Ka viruses allowing tracing of
presynaptic monosynaptic neuronal connections.
5. We have constructed Ba-DsRed virus which has proved to be an appropriate tool for the
study of specific brain regions.
…OF PRV-BASED GENE DELIVERY
1. We have developed a method for short-term culture of isolated canine cardiomyocytes that
retains their physiological and morphological integrity and a PRV-based system for delivery of
foreign genes to adult cardiac muscle cells.
47
REFERENCES
1. Ekstrand MI, Enquist LW, Pomeranz LE: The alpha-herpesviruses: molecular pathfinders
in nervous system circuits. Trends Mol Med 2008, 14(3):134-40.
2. Aujeszky A: A contagious disease, not readily distinguishable from rabies, with unknown
origin. Veterinarius 1902, 25:387-396.
3. Pomeranz LE, Reynolds AE, Hengartner CJ: Molecular biology of pseudorabies virus:
impact on neurovirology and veterinary medicine. Microbiol Mol Biol Rev 2005, 69(3):462-
500.
4. Enquist LW: Life beyond eradication: veterinary viruses in basic science. Arch Virol 1999,
15:87-109.
5. Card JP, Enquist LW: Transneuronal circuit analysis with pseudorabies viruses. Curr Protoc
Neurosci 2001, Chapter 1(Unit 1.5).
6. Boldogkõi Z, Bálint K, Awatramani GB, Balya D, Busskamp V, Viney TJ, Lagali PS,
Duebel J, Pásti E, Tombácz D, Tóth JS, Takács IF, Scherf BG, Roska B: Genetically timed,
Activity sensor and Rainbow transsynaptic viral tools. Nature Methods 2009, 6:127-130.
7. Granstedt AE, Szpara ML, Kuhn B, Wang SS, Enquist LW: Fluorescence-based monitoring
of in vivo neural activity using a circuit-tracing pseudorabies virus. PLoS ONE 2009, 4(9):
e6923.
8. Boldogkõi Z, Sík A, Dénes A, Reichart A, Toldi J, Gerendai I, Kovács KJ, Palkovits
M: Novel tracing paradigms-genetically engineered herpesviruses as tools for mapping
functional circuits within the CNS: present status and future prospects. Prog
Neurobiol 2004, 72(6):417-445.
9. Prorok J, Kovács PP, Kristóf AA, Nagy N, Tombácz D, Tóth SJ, Ördög B, Jost N, Virágh L,
Papp GJ, Varró A, Tóth A, Boldogkői Z: Herpesvirus-mediated delivery of a genetically
encoded fluorescent Ca2+ sensor to primary adult canine cardiomyocytes. J Biomed Biotech
2009, 10.1155.
10. Klupp BG Hengartner CJ, Mettenleiter TC, Enquist LW: Complete, annotated sequence of
the pseudorabies virus genome. J Virol 2004, 78:424–440.
11. Demarchi JM, Schmidt CA, Kaplan AS: Patterns of Transcription of Human
Cytomegalovirus in Permissively Infected Cells. J Virol 1980, 35(2):277-286.
12. Honess RW, Roizman B: Regulation of Herpesvirus Macromolecular Synthesis I. Cascade
Regulation of the Synthesis of Three Groups of Viral Proteins. J Virol 1974, 14(1):8-19.
48
13. Cheung AK: Cloning of the latency gene and the early protein 0 gene of pseudorabies
virus. J Virol 1991, 65:5260-5271.
14. Huang C, Wu CY: Characterization and expression of the pseudorabies virus early gene
UL54. J Virol Methods 2004, 119:129-136.
15. Fuchs W, Ehrlich C, Klupp BG, Mettenleiter TC: Characterization of the replication origin
(Ori(S)) and adjoining parts of the inverted repeat sequences of the pseudorabies virus genome.
J Gen Virol 2000, 81:1539-1543.
16. Zhang G, Leader DP: The structure of the pseudorabies virus genome at the end of the
inverted repeat sequences proximal to the junction with the short unique region. J Gen
Virol 1990, 71:2433-2441.
17. Teri Shors: Understanding Viruses. Sudbury, MA: Jones & Bartlett Publishers; 2008.
18. Hann LE, Cook WJ, Uprichard SL, Knipe DM, Coen DM: The role of herpes simplex virus
ICP27 in the regulation of UL24 gene expression by differential polyadenylation. J
Virol 1998, 72(10):7709-7714.
19. Pearson A, Knipe DM, Coen DM: ICP27 selectively regulates the cytoplasmic localization
of a subset of viral transcripts in herpes simplex virus type 1-infected cells. J Virol 2004,
78(1):23-32.
20. Chambers J, Angulo A, Amaratunga D, Guo H, Jiang Y et al: DNA microarrays of the
complex human cytomegalovirus genome: profiling kinetic class with drug sensitivity of viral
gene expression. J Virol 1999, 73(7):5757-5766.
21. Stingley SW, Ramirez JJ, Aguilar SA, Simmen K, Sandri-Goldin RM, Ghazal P, Wagner
EK: Global analysis of herpes simplex virus type 1 transcription using an oligonucleotide-
based DNA microarray. J Virol 2000, 74(21):9916-9927.
22. Kennedy PG, Grinfeld E, Craigon M, Vierlinger K, Roy D, Forster T, Ghazal
P: Transcriptomal analysis of varicella-zoster virus infection using long oligonucleotide-based
microarrays. J Gen Virol 2005, 86(10):2673-2684.
23. Aguilar JS, Devi-Rao GV, Rice MK, Sunabe J, Ghazal P, Wagner EK: Quantitative
comparison of the HSV-1 and HSV-2 transcriptomes using DNA microarray analysis.
Virol 2006, 348(1):233-241.
24. Yang WC, Devi-Rao GV, Ghazal P, Wagner EK, Triezenberg SJ: General and specific
alterations in programming of global viral gene expression during infection by VP16
activation-deficient mutants of herpes simplex virus type 1. J Virol 2002, 76(24):12758-74.
49
25. Sun A, Devi-Rao GV, Rice MK, Gary LW, Bloom DC, Sandri-Goldin RM, Ghazal P,
Wagner EK: Immediate-early expression of the herpes simplex virus type 1 ICP27 transcript is
not critical for efficient replication in vitro or in vivo. J Virol 2004, 78(19):10470-10478.
26. Karaca G, Hargett D, McLean TI, Aguilar JS, Ghazal P, Wagner EK, Bachenheimer
SL: Inhibition of the stress-activated kinase, p38, does not affect the virus transcriptional
program of herpes simplex virus type 1. Virol 2004, 329(1):142-156.
27. Blanchard Y, Le MN, Le CM, Blanchard P, Leger J, Jestin A: Cellular gene expression
survey of PseudoRabies Virus (PRV) infected Human Embryonic Kidney cells (HEK-293).
Vet Res 2006, 37:705-723.
28. Brukman A, Enquist LW: Suppression of the interferon-mediated innate immune response
by pseudorabies virus. J Virol 2006, 80:6345-6356.
29. Ray N, Enquist LW: Transcriptional response of a common permissive cell type to
infection by two diverse alphaherpesviruses. J Virol 2004, 78:3489-3501.
30. Flori L, Rogel_Gaillard C, Cochet M, Lemonnier G, Hugot K, Chardon P, Robin S,
Lefèvre F: Transcriptomic analysis of the dialogue between Pseudorabies virus and porcine
epithelial cells during infection. BMC Genomics 2008, 9:123.
31. Øster B, Bundgaard B, Höllsberg P: Viral gene expression patterns in human herpesvirus
6B-infected T cells. J Virol 2002, 76(15):7578-7586.
32. Dittmer DP, Gonzalez CM, Vahrson W, DeWire SM, Hines-Boykin R, Damania : Whole-
genome transcription profiling of rhesus monkey rhadinovirus. J Virol 2005, 79(13):8637-
8650.
33. Cheung, AK, Fang JJ, Wesley RD: Characterization of a pseudorabies virus that is
defective in the early protein 0 and latency genes. Am J Vet Res 1994, 55:1710-1716.
34. Boldogkoi Z, Braun A, Fodor I: Replication and virulence of early protein 0 and long
latency transcript deficient mutants of the Aujeszky’s disease (pseudorabies) virus. Microbes
Infect 2000, 2:1321–1328.
35. Davison AJ: Evolution of the herpesviruses. Vet Microbiol 2002, 86:69–88.
36. Del Rio T, Decoste CJ, Enquist LW: Actin is a component of the compensation mechanism
in pseudorabies virus virions lacking the major tegument protein VP22. J Virol 2005, 79:8614–
8619.
37. Mettenleiter TC: Herpesvirus Assembly and Egress. J Virol. 2002. 76(4): 1537–1547.
38. Sydiskis RJ, Roizman B: Polysomes and protein synthesis in cells infected with a DNA
virus. Science 1966, 1;153(731):76-8.
50
39. Zelus BD, Stewart RS, Ross J: The virion host shutoff protein of herpes simplex virus type
1: messenger ribonucleolytic activity in vitro. J Virol 1996, ;70(4):2411-9.
40. Everly DN Jr, Read GS: Site-directed mutagenesis of the virion host shutoff gene (UL41)
of herpes simplex virus (HSV): analysis of functional differences between HSV type 1 (HSV-
1) and HSV-2 alleles. J Virol 1999, 73(11):9117-29.
41. Smith TJ, Ackland-Berglund CE, Leib DA: Herpes simplex virus virion host shutoff (vhs)
activity alters periocular disease in mice. J Virol 2000, 74(8):3598-604.
42. Oroskar AA, Read GS: Control of mRNA stability by the virion host shutoff function of
herpes simplex virus. J Virol 1989, 63(5):1897-906.
43. Strelow LI, Leib DA: Role of the virion host shutoff (vhs) of herpes simplex virus type 1 in
latency and pathogenesis. J Virol 1995, 69(11):6779-86.
44. Nishioka Y, Silverstein S: Degradation of cellular mRNA during infection by herpes
simplex virus. PNAS 1977, 74(6):2370-4.
45. Suzutani T, Nagamine M, Shibaki T, Ogasawara M, et al: The role of the UL41 gene of
herpes simplex virus type 1 in evasion of non-specific host defence mechanisms during
primary infection. J Gen Virol 2000, 81(Pt 7):1763-71.
46. Read GS, Karr BM, Knight K: Isolation of a herpes simplex virus type 1 mutant with a
deletion in the virion host shutoff gene and identification of multiple forms of the vhs (UL41)
polypeptide. J Virol 1993, 67(12):7149-60.
47. Schmelter J, Knez J, Smiley JR, Capone JP: Identification and characterization of a small
modular domain in the herpes simplex virus host shutoff protein sufficient for interaction with
VP16. J Virol 1996, 70(4):2124-31.
48. Strelow LI, Leib DA: Analysis of conserved domains of UL41 of herpes simplex virus type
1 in virion host shutoff and pathogenesis. J Virol 1996, 70(8):5665-7.
49. Strelow L, Smith T, Leib D: The virion host shutoff function of herpes simplex virus type 1
plays a role in corneal invasion and functions independently of the cell cycle. Virol 1997
28;231(1):28-34.
50. Mettenleiter TC: Aujeszky’s disease (pseudorabies) virus: the virus and molecular
pathogenesis–state of the art, June 1999. Vet Res 2000, 31:99–115.
51. Mettenleiter TC: Immunobiology of pseudorabies (Aujeszky’s disease).Vet Immunol
Immunopathol 1996, 54:221–229.
52. Tyborowska J, Reszka N, Kochan G, Szewczky B: Formation of pseudorabies virus
glycoprotein E/I complex in baculovirus recombinant system. Acta virol 2006, 50:169-174.
53. Mettenleiter TC: Herpesvirus assembly and egress. J Virol 2002, 76: 1537–1547.
51
54. Whealy ME, Card JP, Robbins AK, Dubin JR, Rhiza HJ, Enquist L: Specific pseudorabies
virus infection of the rat visual system requires both gI and gp63 glycoproteins. J Virol 1993,
67:3786-97.
55. Mettenleiter TC, Lukacs N, Rziha HJ: Mapping of the Structural Gene of Pseudorabies
Virus Glycoprotein A and Identification of Two Non-Glycosylated Precursor Polypeptides. J
Virol 1985, 53:52-57.
56. Some Genetic Functions Encoded by Herpes Simplex Virus type 1:
http://darwin.bio.uci.edu/~faculty/wagner/table.html
57. The Genetic and Transcription Map of the HSV-1 Genome :
http://darwin.bio.uci.edu/~faculty/wagner/hsvimg04z.jpg
58. Roizman B: The function of herpes simplex virus genes: A primer for genetic engineering
of novel vectors. PNAS 1996, 93:11307-11312
59. Roizman B, Campadelli-Fiume G: Alphaherpes viral genes and their functions. In Human
Herpesviruses - Biology, Therapy and Immunoprophylaxis. Edited by: Arvin A, et al.
Cambridge: Cambridge University Press; 2007:70-92.
60. Kritas SK, Pensaert MB, Mettenleiter TC: Invasion and spread of single glycoprotein
deleted mutants of Aujeszky's disease virus (ADV) in the trigeminal nervous pathway of pigs
after intranasal inoculation. Vet Microbiol 1994, 40:323-34.
61. Kritas SK, Pensaert MB, Mettenleiter TC: Role of envelope glycoproteins gI, gp63 and gIII
in the invasion and spread of Aujeszky's disease virus in the olfactory nervous pathway of the
pig. J Gen Virol 1994, 75:2319-27.
62. Kimman D, de Wind TGN, Oei-Lie N, Pol JM, Berns AJ, Gielkens AL: Contribution of
single genes within the unique short region of Aujeszky's disease virus (suid herpesvirus type
1) to virulence, pathogenesis and immunogenicity. Vet Microbiol 1992, 33:45-52.
63. Babic E, Klupp B, Brack A, Mettenleiter TC, Ugolini G, Flamand A: Deletion of
glycoprotein gE reduces the propagation of pseudorabies virus in the nervous system of mice
after intranasal inoculation. Virol 1996, 219:279-84.
64. Tirabassi RS, Townley RA, Eldridge MG, Enquist LW: Characterization of Pseudorabies
Virus Mutants Expressing Carboxy-Terminal Truncations of gE : Evidence for Envelope
Incorporation, Virulence and Neurotropism Domains. J Virol 1997, 71:6455-6464.
65. Fuchs W, Klupp BG, Granzow H, Hengartner C, Brack A, Mundt A, Enquist LW,
Mettenleiter TC: Physical interaction between envelope glycoproteins E and M of pseudorabies
virus and the major tegument protein UL49. J Virol 2002, 76:8208-17.
52
66. Zsak L, Mettenleiter TC, Sugg N, Ben-Porat T: Release of pseudorabies virus from
infected cells is controlled by several viral functions and is modulated by cellular components.
J Virol 1989, 63:5475-5477.
67. Husak PJ, Kuo T, Equist LW: Pseudorabies Virus Membrane Proteins gI and gE Facilitate
Anterograde Spread of Infection in Projection - Specific Neurons in the Rat. J Virol 2000,
74(23):10975–10983.
68. Kit S, Kit M,. Pirtle EC: Attenuated properties of thymidine kinase-negative deletion
mutant of pseudorabies virus. Am J Vet Res 1985, 46:1359-1367
69. McGregor S, Easterday BC, Kaplan AS, Ben-Porat T: Vaccination of swine with
thymidine kinase-deficient mutants of pseudorabies virus. Am J Vet Res 1985, 46:1494-1497.
70. de Wind N, Berns A, Gielkens A, Kimman T: Ribonucleotide reductase-deficient mutants
of pseudorabies virus are avirulent for pigs and induce partial protective immunity. J Gen Virol
1993, 74:351-359.
71. Boldogkői Z, Reichart A, Tóth IE, Sík A, Erdélyi F et al: Construction of recombinant
pseudorabies viruses optimized for labeling and neurochemical characterization of neural
circuitry. Mol Brain Res 2002, 109 (1-2): 105-118.
72. Kwong AD, Frenkel N: The herpes simplex virus virion host shutoff function. J Virol 1989,
63: 4834-4839.
73. Ladin BF, Blankenship ML, Ben-Porat T: Replication of herpesvirus DNA. V. Maturation
of concatemeric DNA of pseudorabies virus to genome length is related to capsid formation. J
Virol 1980, 33:1151-1164.
74. Wu CA, Harper L, Ben-Porat T: Molecular basis for interference of defective interfering
particles of pseudorabies virus with replication of standard virus. J Virol 1986, 59:308-317.
75. Zhang G, Raghavan B, Kotur M, Cheatham J, Sedmak D et al: Antisense transcription in
the human cytomegalovirus transcriptome. J Virol 2007, 81 (20): 11267-81.
76. Johnson C, Sundaresan V: Regulatory small RNAs in plants Plant. Systems Biol 2007,
97:99-113.
77. Sanna CR, Li WH, Zhang L: Overlapping genes in the human and mouse genomes. BMC
Genomics 2008, 14(9):169.
78. Mattick JS: Deconstructing the Dogma: A New View of the Evolution and Genetic
Programming of Complex Organisms. Annals of the New York Academy of Sciences 2009,
1178(1): 29-46(18).
79. Jin H, Vacic V, Girke T, Lonardi S, Zhu JK: Small RNAs and the regulation of cis-natural
antisense transcripts in Arabidopsis. BMC Mol Biol 2008, 14;9:6.
53
80. Anderson S, Bankier AT, Barrell BG, de Bruijn MHL, Coulson AR et al: Sequence and
organization of the human mitochondrial genome. Nature 1981, 290, 457 – 465.
81. Boi S, Solda G, TenchiniML: Shedding light on the dark side of the genome: overlapping
genes in higher eukaryotes. Curr Genomics 2004, 5, 509–524.
82. Wang XJ, Gaasterland T, Chua NH: Genome-wide prediction and identification of cis-
natural antisense transcripts in Arabidopsis thaliana. Genome Biol 2005, 6:R30
83. Katayama S, Tomaru Y, Kasukawa T, Waki K, Nakanishi M, et al.: Antisense
Transcription in the Mammalian Transcriptome. Science 2005, 309: 5740, 1564 – 1566.
84. Carninci P, Kasukawa T, Katayama J, Gough J, Frith MC, et al.: The Transcriptional
Landscape of the Mammalian Genome. Science 2005, 309: 5740, 1559-1563
85. Cheng J, Kapranov P, Drenkow J, Dike S, Brubaker S et al.: Transcriptional maps of 10
human chromosomes at 5-nucleotide resolution. Science 2005, 20;308(5725):1149-54
86. He H, Wang J, Liu T, Liu XS, Li T et al: Mapping the C. elegans noncoding transcriptome
with a whole-genome tiling microarray, Genome Res 2007, 17:1471-1477.
87. Nagalakshmi U, Wang Z, Waern K, Shou C, Raha D et al: The transcriptional landscape of
the yeast genome defined by RNA sequencing. Science 2007, 316(5830):1484-8.
88. Kapranov P, Cheng J, Dike S, Nix DA, Duttagupta R et al: RNA Maps Reveal New RNA
Classes and a Possible Function for Pervasive Transcription. Science 2007, 8;316:1484-8.
89. Wagner EG, Simons RW: AntisenseRNAcontrol in bacteria, phages, and plasmids. Annu
Rev Microbiol 1994, 48: 713–742.
90. Vanhée-Brossollet C, Vaquero C: Do natural antisense transcripts make sense in
eukaryotes? Gene 1998, 211(1):1-9.
91. Mattick JS, Amaral PP, Dinger ME, Mercer TR, Mehler MF: RNA regulation of epigenetic
processes. Bioessays 2009, 31(1):51-9.
92. Chamberlain SJ, Brannan CI: The Prader-Willi syndrome imprinting center activates the
paternally expressed murine Ube3a antisense transcript but represses paternal Ube3a.
Genomics 2001, 73(3):316-22.
93. Taft RJ, Pang KC, Mercer TR, Dinger M, Mattick JS: Non-coding RNAs: regulators of
disease. J Pathol 2009, 220(2):126-139.
94. Tam OH, Aravin AA, Stein P, Girard A, Murchison EP et al: Pseudogene-derived small
interfering RNAs regulate gene expression in mouse oocytes. Nature 2008, 453, 534-538
95. Borsani O, Zhu J, Verslues PE, Sunkar R, Zhu JK: Endogenous siRNAs derived from a
pair of natural cis-antisense transcripts regulate salt tolerance in Arabidopsis. Cell 2005,
123(7):1279-91.
54
96. Watanabe T, Totoki Y, Toyoda A, Kaneda M, Kuramochi-Miyagawa S et al: Endogenous
siRNAs from naturally formed dsRNAs regulate transcripts in mouse oocytes. Nature 2008,
453, 539-543.
97. Okamura K, Chung WJ, Ruby JG, Guo H, Bartel DP, Lai EC: The Drosophila hairpin RNA
pathway generates endogenous short interfering RNAs. Nature 2008, 453, 803-806.
98. Zamore PD, Haley B: Ribo-gnome: The Big World of Small RNAs. Science 2005,
309(5740):1519–1524.
99. Jacquemont B, Roizman B: RNA synthesis in cells infected with herpes simplex virus. X.
Properties of viral symmetric transcripts and of double-stranded RNA prepared from them. J
Virol. 1975, 15(4):707-13.
100. Bohenzky RA, Lagunoff M, Roizman B, Wagner EK, Silverstein S: Two overlapping
transcription units which extend across the L-S junction of herpes simplex virus type 1. J Virol
1995, 69:2889–2897.
101. Borchers K, Wolfinger U, Lawrenz B, Schellenbach A, Ludwig H: Equine herpesvirus 4
DNA in trigeminal ganglia of naturally infected horses detected by direct in situ PCR. J Gen
Virol 1997, 78:1109–1114.
102. Carter KL, Ward PL, Roizman B: Characterization of the products of the U(L)43 gene of
herpes simplex virus 1: potential implications for regulation of gene expression by antisense
transcription. J Virol 1996, 70: 7663–7668.
103. Cheung AK:. The BamHI J fragment (0.706 to 0.737 map units) of pseudorabies virus is
transcriptionally active during viral replication. J Virol 1990, 64:977–983.
104. Wirth UV, Vogt B, Schwyzer M: The three major immediateearly transcripts of bovine
herpesvirus 1 arise from 2 divergent and spliced transcription units. J Virol 1991, 65:195–205.
105. Basua K, Gravel C, Tomioka R, Kaneko T, Tamamaki N, Sík A: Novel strategy to
selectively label excitatory and inhibitory neurons in the cerebral cortex of mice. J Neurosci
Meth 2008, 170:2 212-219.
106. Weiss P, Hiscoe HN: Experiments on the mechanism of nerve growth. 1948. J Exp Zool
107, 315–395.
107. Rothermel M, Schöbel N, Damann N, Klupp BG et al: Anterograde transsynaptic tracing
in the murine somatosensory system using Pseudorabies virus (PrV): A “live-cell”-tracing tool
for analysis of identified neurons in vitro. J Neurovirol 2007, 13. 6: 579-585
108. Enquist LW, Cardy JP: Recent advances in the use of neurotropic viruses for circuit
analysis. Curr Opinion Neurobiol 2003, 13:603–606.
55
109. Bartha A: Experimental reduction of virulence of Aujesky's disease virus. Magyar
Állatorvosok Lapja 1961, 16:42-45.
110. Lomniczi B, Watanabe S, Ben-Porat T, Kaplan AS: Genome location and identification of
functions defective in the Bartha vaccine strain of pseudorabies virus. J Virol 1987, 61:796-
801.
111. Lyman MG, Demmin GL, Banfield BW: The attenuated pseudorabies virus strain Bartha
fails to package the tegument proteins Us3 and VP22. J Virol 2003, 77:1403-1414.
112. Tombácz D, Tóth JS, Petrovszki P, Boldogkői Z: Whole-genome analysis of pseudorabies
virus gene expression by real-time quantitative RT-PCR assay. BMC Genomics 2009, 10:491
113. Rezek Ö, Boldogkői Z, Tombácz D, Kővágó C, Gerendai I, Palkovits M, Tóth IE:
Location of parotid preganglionic neurons in the inferior salivatory nucleus and its relation to
the superior salivatory nucleus of rat. Transneuronal labeling by pseudorabies
viruses. Neurosci Lett 2008, 440(3): 265-269.
114. Papin J, Vahrson W, Hines-Boykin R, Dittmer DP: Real-time quantitative PCR analysis
of viral transcription. Methods Mol Biol 2005, 292:449-480.
115. Soong R, Tabiti K: Detection of colorectal micrometastasis by quantitative RT-PCR of
cytokeratin 20 mRNA. Proceedings of the American Association for Cancer Research 2000,
41:391.
116. Elhai J, Wolk CP: A versatile class of positive-selection vectors based on the nonviability
of palindrome-containing plasmids that allows cloning into long polylinkers. Gene 1988,
68(1):119-138.
117. Heim N, Griesbeck O: Genetically encoded indicators of cellular calcium dynamics based
on troponin C and green fluorescent protein. J Biol Chem 2004, 279(14):14280–14286.
118. Tóth IE, Wiesel O, Boldogkői Z, Bálint K, Tapaszti Z, Gerendai I: Predominance of
supraspinal innervation of the left ovary. Microsc Res Technol 2007, 70: 710–718.
119. Pfaffl MW: A new mathematical model for relative quantification in real-time RT-PCR.
Nucleic Acids Res 2001, 29(9):e45.
120. Souazé F, Ntodou-Thomé A, Tran CY, Rostène W, Forgez P: Quantitative RT-PCR:
limits and accuracy. Biotechniques 1996, 21(2):280-285.
121. Livak KJ, Schmittgen TD: Analysis of relative gene expression data using real-time
quantitative PCR and the 2ΔΔ C(T) Method. Methods 2001, 25(4):402-408.
122. Gómez-Sebastián S, Tabarés E: Negative regulation of herpes simplex virus type 1 ICP4
promoter by IE180 protein of pseudorabies virus. J Gen Virol 2004, 85:2125-2130.
56
123. Fuchs W, Klupp BG, Granzow H, Osterrieder N, Mettenleiter TC: The Interacting UL31
and UL34 Gene Products of Pseudorabies Virus Are Involved in Egress from the Host-Cell
Nucleus and Represent Components of Primary Enveloped but Not Mature Virions. J Virol
2002, 76(1):364-378.
124. Bras F, Dezelee S, Simonet B, Nguyen X et al: The left border of the genomic inversion
of pseudorabies virus contains genes homologous to the UL46 and UL47 genes of herpes
simplex virus type 1, but no UL45 gene. Virus Res 1999, 60:29-40.
125. Reynolds AE, Fan Y, Baines JD: Characterization of the UL33 gene product of herpes
simplex virus 1. Virology 2000, 266:310-8.
126. McNabb DS, Courtney RJ: Identification and characterization of the herpes simplex virus
type 1 virion protein encoded by the UL35 open reading frame. J Virol 1992, 66:2653-63.
127. Klupp BG, Fuchs W, Granzow H et al: Pseudorabies virus UL36 tegument protein
physically interacts with the UL37 protein. J Virol 2002, 76:3065-3071.
128. Braun A, Kaliman A, Boldogkõi Z, Aszódi A, Fodor I: Sequence and expression analyses
of the UL37 and UL38 genes of Aujeszky's disease virus. Acta Vet Hung 2000, 48(1):125-136.
129. Ambagala AP, Hinkley S, Srikumaran S: An early pseudorabies virus protein down-
regulates porcine MHC class I expression by inhibition of transporter associated with antigen
processing (TAP). J Immunol 2000, 164:93-99.
130. Powers L, Wilkinson KS, Ryan P: Characterization of the prv43 gene of pseudorabies
virus and demonstration that it is not required for virus growth in cell culture. Virol 1994,
199:81-88.
131. Robbins AK, Watson RJ, Whealy ME, Hays WW, Enquist LW: Characterization of a
pseudorabies virus glycoprotein gene with homology to herpes simplex virus type 1 and type 2
glycoprotein. J Virol 1986, 58(2):339-347.
132. Kaelin K, Dezelee S, Masse MJ, Bras F, Flamand A: The UL25 Protein of Pseudorabies
Virus Associates with Capsids and Localizes to the Nucleus and to Microtubules. J Virol 2000,
74:474-482.
133. Dezélée S, Bras F, Vende P, Simonet B, Nguyen X, Flamand A, Masse MJ: The BamHI
fragment 9 of pseudorabies virus contains genes homologous to the UL24, UL25, UL26, and
UL 26.5 genes of herpes simplex virus type 1. Virus Res 1996, 42:27-39.
134. Yamada S, Imada T, Watanabe W, Honda Y et al: Nucleotide sequence and
transcriptional mapping of the major capsid protein gene of pseudorabies virus. Virology 1991,
185:56-66.
57
135. Dijkstra JM, Fuchs W, Mettenleiter TC, Klupp BG: Identification and transcriptional
analysis of pseudorabies virus UL6 to UL12 genes. Arch Virol 1997, 142:17-35.
136. 55 Dean HJ, Cheung AK: A 3'coterminal gene cluster in pseudorabies virus contains
herpes simplex virus UL1, UL2, UL3 gene homologs and a unique UL3.5 open reading frame.
J Virol 1993, 67:5955-5961.
137. Krause PR, Croen KD, Ostrove JM, Straus SE: Structural and Kinetic Analyses of Herpes
Simplex Virus Type I Latencyassociated Transcripts in Human Trigeminal Ganglia and in Cell
Culture. J Clin Invest 1990, 86(1):235-241.
138. van Zijl M, Gulden H, de Wind N, Gielkens A, Anton Berns A: Identification of Two
Genes in the Unique Short Region of Pseudorabies Virus; Comparison with Herpes Simplex
Virus and Varicella-zoster Virus. J Gen Virol 1990, 71:1747-1755.
139. de Wind N, Peeters B et al: Mutagenesis and characterization of a 41-kilobase-pair region
of the pseudorabies virus genome: transcription map, search for virulence genes, and
comparison with homologs of herpes simplex virus type 1. Virology 1994, 200:784-790.
140. Dean HJ, Cheung AK: Identification of the pseudorabies virus UL4 and UL5 (helicase)
genes. Virology 1994, 202(2):962-7.
141. Van Minnebruggen G, Favoreel HW, Jacobs L, Nauwynck HJ: Pseudorabies virus US3
protein kinase mediates actin stress fiber brakedown. J Virol 2003, 77(16):9074-80.
142. Tombácz D, Boldogkői Z: Az Aujeszky-féle vírus összgenom analízise Real-Time RT-
PCR-ral. VIII. Genetikai minikonferencia, 2009, Szeged, Hungary
143. Tombácz D, Tóth JS, Boldogkői Z: Whole-genome analysis of pseudorabies virus by
Real-Time RT-PCR. 2nd CEFORM Central European Forum for Microbiology, 2009,
Keszthely, Hungary
144. Tombácz D, Tóth JS, Takács IF, Boldogkői Z: Global analysis of pseudorabies virus gene
expression by RT-PCR. Advances In Genomics Symposium, 2010, Ghent, Belgium
145. Tombácz D, Tóth JS, Petrovszki P, Boldogkői Z: Real-time RT-PCR Profiling of Global
mRNA Transcription from Pseudorabies Virus Genome. 34th International Herpesvirus
Workshop, 2009, Ithaca, NY, USA
146. Ferecskó AS, Boldogkői Z, Tombácz D, Ördög B, Hirase H, Tiesinga P, Sík A:
Development of a novel pseudorabies virus-based method for monosynaptic neuronal network
tracing. IBRO International Workshop, 2010, Pécs, Hungary
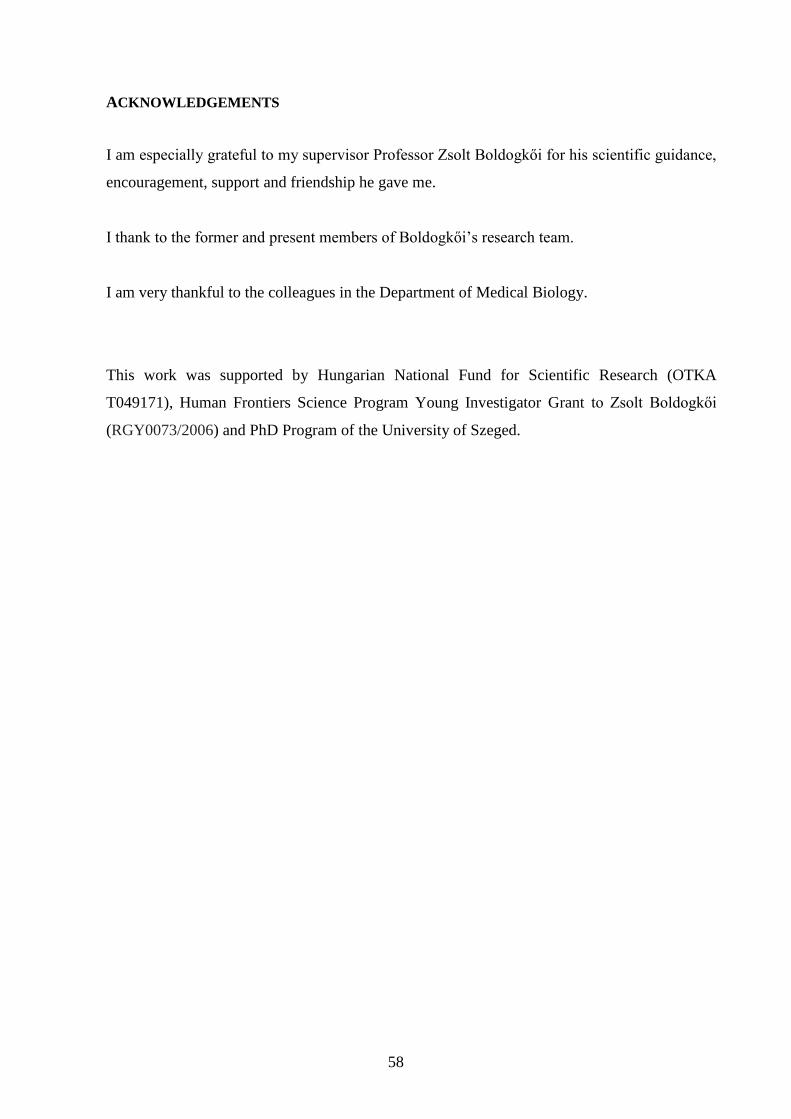
58
ACKNOWLEDGEMENTS
I am especially grateful to my supervisor Professor Zsolt Boldogkői for his scientific guidance,
encouragement, support and friendship he gave me.
I thank to the former and present members of Boldogkői’s research team.
I am very thankful to the colleagues in the Department of Medical Biology.
This work was supported by Hungarian National Fund for Scientific Research (OTKA
T049171), Human Frontiers Science Program Young Investigator Grant to Zsolt Boldogkői
(RGY0073/2006) and PhD Program of the University of Szeged.