funded by the center for urban transportation … by the center for urban transportation research,...
TRANSCRIPT

1
DECISION ANALYSIS TO ADDRESS EXTREME WEATHER
EXTREME WEATHER EFFECTS ON RIDERSHIP AND MODELING THE DECISION TO INVEST IN CANOPY COVERAGE
Funded by The Center for Urban Transportation Research, University of South Florida
Draft Report
September, 2016
Authors Qing Miao, PhD Center for Science, Technology and Environmental Policy Studies, Arizona State University Eric Welch, PhD Director, Center for Science, Technology and Environmental Policy Studies Arizona State University P.S. Sriraj, PhD Director, Urban Transportation Center University of Illinois at Chicago

2
Table of Contents List of Tables .................................................................................................................................. 3
List of Figures ................................................................................................................................. 4 1. Introduction ............................................................................................................................. 5
2. Part I. Decision Problem Identification and Model ................................................................. 5
2.1. Introduction ...................................................................................................................... 5
2.2. Case Selection and Initial Decision Model ...................................................................... 6 2.3. Data Collection and Analysis Plan ................................................................................... 8
3. Part II. ...................................................................................................................................... 9
3.1. Introduction and Summary of Findings ........................................................................... 9
3.3. Method ........................................................................................................................... 11 3.4. CTA Case Study ............................................................................................................. 12
3.4.1. Data ......................................................................................................................... 12
3.4.2. Results ..................................................................................................................... 14
3.5. UTA Case Study............................................................................................................. 19 3.5.1. Data ......................................................................................................................... 19
3.5.2. Regression Results .................................................................................................. 22
3.6. Conclusions .................................................................................................................... 24
4. Part III. Decision Analysis Application ................................................................................. 25 5. Conclusion ............................................................................................................................. 28

3
List of Tables TABLE 1. DESCRIPTIVE STATISTICS OF MAIN VARIABLES ............................................................................................. 14
TABLE 2. REGRESSION OF WEATHER ON DAILY RIDERSHIP CONDITIONING ON STATION TYPE ................................. 16
TABLE 3. WEATHER EFFECTS ON DAILY RIDERSHIP CONDITIONING ON STATION CANOPY COVERAGE ..................... 18
TABLE 4. DESCRIPTIVE STATISTICS OF MAIN VARIABLES ............................................................................................. 22
TABLE 5. REGRESSION OF WEATHER ON DAILY RIDERSHIP CONDITIONING ON SHELTER AND BENCH ...................... 23
TABLE 6 SENSITIVITY ANALYSIS – BASELINE RIDERSHIP FOR BENCH / SHELTER INSTALLATION ................................. 26
4
List of Figures FIGURE 1. SIMPLIFIED INFLUENCE DIAGRAM FOR THE STATION/STOP DECISION PROBLEM ....................................... 6
FIGURE 2. SIMPLIFIED DECISION TREE MODEL FOR BUS STOP ENCLOSURE PROBLEM ................................................ 7
FIGURE 3. SIMPLIFIED DECISION TREE EXTENSION FOR BUS STOP ENCLOSURE DECISION PROBLEM .......................... 8
FIGURE 4. CTA RAIL TRANSIT SYSTEM MAP ................................................................................................................. 13
FIGURE 5. DAILY MEAN TEMPERATURE AND PRECIPITATION DISTRIBUTION IN CHICAGO IN 2014 .......................... 15
FIGURE 6. UTA SALT LAKE CITY TRANSIT SYSTEM MAP ............................................................................................... 20
FIGURE 7. MONTH MEAN TEMPERATURE AND PRECIPITATION DISTRIBUTION BY COUNTIES .................................. 21
FIGURE 8. DECISION MODEL ANALYSIS ....................................................................................................................... 27

5
1. Introduction This project applies a decision analytic methodology that takes considerations of extreme weather events to quantify and assess canopy investment options. The project collected data for two cases studies in two different transit agencies: Chicago Transit Authority (CTA) and Utah Transit Authority (UTA). The UTA analysis focuses on bus stop canopy coverage while the CTA case focuses on rail transit station coverage. The report is constructed in three parts. Part I presents the decision analysis approach and overall project design. Part II presents analysis to assess how canopy coverage effects ridership and revenue on extreme weather days. Part III integrates the analysis from Part II and other data into a final decision tree to present a workable decision model. Findings from Part II demonstrate that bus stop shelter and bench installation in UTA service area can effectively reduce the ridership losses due to extreme hot and cold weather, and shelters provide additional benefits on heavy rain days. These findings generally suggest that transit infrastructure and amenities that reduce passengers’ exposure to weather can save more rides on extreme weather days. Finding from the CTA analysis are less conclusive, largely because of significant data limitations. Part III takes a further step to examine the cost-effectiveness of installing such weather-proof infrastructure by integrating the existing cost and fare revenue data with the estimated effects of station amenities. Overall, our research extends the extant weather and transit literature and presents the first attempt to empirically estimate the moderating effect of transit amenities. It is also highly relevant for transit planners and managers by providing a systematic approach to evaluating the cost and benefits of extreme weather mitigating facilities and infrastructure.
2. Part I. Decision Problem Identification and Model 2.1. Introduction Decision analysis provides a structured, typically quantitative approach to understanding and modeling complex decisions. The methodology will make use of influence diagrams and decision trees to structure decisions such that choices among a set of options are made explicit. For example, decision analysis can help managers understand the range of factors involved in weighing which of several types of materials, communication technologies or security devices may be most appropriate for the organization. In this project, we set out to demonstrate how selection among different types of station coverage infrastructure may mitigate the loss of ridership due to extreme weather. The decision model includes the direct costs of each choice (e.g., technology) but also the indirect costs such as ridership losses associated with events caused by extreme weather. It includes probabilities associated with the different events identified in the model and perceived risks and risk tolerances of decision makers. Sensitivity analysis will be performed to determine how variation in the parameters may affect preferences. The project required collection of ridership, weather, system infrastructure and cost data for two cases: UTA and CTA. The work provides an initial decision tool approach that may be of use to transit decision makers as one input to help with complex decisions that require consideration of extreme weather effects on transit.

6
2.2. Case Selection and Initial Decision Model The project the research team approached several different Transit Agencies to assist with the project. Both the Chicago Transit Authority (CTA) and the Utah Transit Authority (UTA) agreed that an investigation of the role of canopy structures in mitigating the effects of extreme weather on ridership loss was an important, relatively concise and potentially valuable topic for research. Overhead coverage at the station platform or bus stop were recognized by CTA and UTA transit planners and managers to have a sizeable impact on rider comfort. Coverage serves a number of functions which can increase comfort in the station environment including protection from sun during extremely hot days and shelter during storms and other high precipitation events. Thus, the decision confronting transit agency decision makers, especially given that climate models predict increased extreme heat and extreme precipitation, concerns the level of investment in canopy coverage.
Interviews with key decision makers at CTA were conducted to inform a decision model for station/stop coverage. Based on that information it was possible to structure an initial model of the decision, which is presented in an influence diagram in Figure 1. An influence diagram is a commonly used tool in decision analysis to graphically depict the key factors involved in a decision.
Figure 1. Simplified Influence Diagram for the Station/Stop Decision Problem
Four different types of nodes (shapes) are used in the influence diagram: 1) decision nodes (green squares) which represent the choices or options; 2) chance nodes (red circles) that capture key dimensions of uncertainty related to the decision problem; 3) calculation nodes (blue

7
rounded corner rectangles) that represent dimensions of the project where intermediate-level costs and benefits are tallied; and 4) ultimate payoff nodes (blue diamond). The arrows in the diagram demonstrate how different factors are related.
In Figure 1, the ultimate payoff for a transit agency would be the total gains or losses that result for each option as a result of calculating the costs and benefits. Based on interviews with CTA planning personnel, factors that could ultimately play into the costs and benefits include the type or level of coverage at the station or stop. Coverage costs would include all the capital and labor, but may also affect insurance, permitting or other legal expenses. Different coverage options would have different cost implications. Additionally, ridership and the revenues from transit riders depend on the existing coverage, and weather extremes. Those elements are unknown (uncertain), but the coverage options would have implications for ridership revenue gains or losses. Finally extreme weather may damage station infrastructure which should also be taken into account. Figure 1 provides a simplified version of all the different factors that may be involved. Nevertheless, it also helps focus the study on the key decision factors and the data requirements for analysis.
Decision trees are another tool that provides structure to complex problems with multiple potential options for action. Similar to the influence diagram, the tree consists of three types of nodes: decision nodes (which are represented by green squares), chance nodes (which are represented by red circles), and consequence nodes (which are represented by blue triangles). A decision node for the UTA analysis (figure 2) shows four options – large enclosure, small enclosure, no enclosure but with a bench, and not enclosure. The blue triangles indicate that each option has a calculable consequence.
Figure 2. Simplified Decision Tree Model for Bus Stop Enclosure Problem
An example of a more complete decision tree is presented in Figure 3. Here, the same four options exist, but additional chance nodes are included in a build out of one of the branches. In this example, we include only three additional chance nodes – bus enclosure costs, extreme weather and change in ridership. For each chance node, there is a probability associated with each potential outcomes and all probabilities for each node must sum to one. For example, enclosure costs has to possibilities, high and low, each with a fifty percent chance of occurrence. Extreme weather has a three percent chance of occurrence and a 97% chance of not occurring. A dollar amount is associated with each possible outcome and in a fully functional decision tree the dollar quantities are multiplied by the probabilities at each stage, starting from right to left,
Large Enclosure
Bus Stop Canopy Coverage Decision
No Enclosure
No Enclosure / Bench
Small Enclosure

8
proceeding back through the tree to the decision options. There a final cost for each option is calculated, indicating a preference of one option over the others. In addition to the construction and calculations afforded by the tree, sensitivity analysis examines how sensitive the preferred option is to changes in the various parameters. For example, it may be that a slightly different probability of extreme weather could lead a decision maker to switch from a preferred option of a bench to a preferred option of a small enclosure.
Figure 3. Simplified Decision Tree Extension for Bus Stop Enclosure Decision Problem .
2.3. Data Collection and Analysis Plan Based on the initial discussions with CTA and UTA and the resulting influence diagram and decision tree, the research team identified the range of data required to carry out a decision analysis. The primary categories of data include a) costs of materials and labor for canopies and shelters; b) existing coverage at stations and stops; c) daily ridership data; 4) weather data to identify weather extremes.
Discussed further in Part II of this report, daily ridership data was provided by both agencies, presented in two separate case studies, one for CTA and one for UTA. Weather data were obtained from NOAA weather databases for weathers stations having longitudinal data records in each city, Chicago and Salt Lake City area. Existing coverage at CTA stations was measured
50.0%$
3.0% Ridership Change$
50.0%$
50.0% Extreme Weather$
50.0%$
97.0% Ridership Change$
50.0%$
Enclosure Costs$
50.0%$
3.0% Ridership Change$
50.0%$
50.0% Extreme Weather$
50.0%$
97.0% Ridership Change$
50.0%$
Decision
$
$
$
Station Coverage Decision
No Enclosure
Large Enclosure
High
Yes
Ridership Increase
Ridershp Decrease
No Enclosure / Bench
Small Enclosure
No
Ridership Increase
Ridershp Decrease
Low
Yes
Ridership Increase
Ridershp Decrease
No
Ridership Increase
Ridershp Decrease

9
manually by the research team as the total length of the train platform and checked against internal CTA records. Bus stop coverage data were provided by UTA. Cost data was not available from CTA because canopy costs are typically embedded in major construction projects and not contracted separately. The research team attempted to use the job order contract database purchased through RSMeans, a construction costing firm, to assess canopy costs for train platforms in Chicago. Because the complexities of the task were substantial and because the UTA provided the research team with clear cost data for bus stop enclosures, it was decided to focus the full decision analysis around the UTA bus station enclosure.
Presented in Part II, the data collected were used in statistical analysis to examine how canopies and enclosures affect ridership during extreme weather events for both UTA and CTA. The findings from this analysis are then built into the final decision analysis in Part III.
3. Part II. 3.1. Introduction and Summary of Findings How weather influences travel behavior is a question of interest to both researchers and transit agencies. Several recent studies have investigated the effect of adverse weather conditions on urban transit ridership (e.g., Guo et al., 2007; Stover and McCormack, 2012; Cravo and Cogen, 2009; Changnon, 1996; Singhal et al., 2014). They focus on various weather factors, primarily daily temperature and rainfall (including snow) fluctuations, and generally document a negative impact of bad weather on transit ridership. Such findings imply that unfavorable weather conditions result in a direct revenue loss for transit service providers. Furthermore, weather may also affect the availability and the quality of transit service as well as the physical transit infrastructure (Chung, 2013; Flegenheimer, 2013; Hodges, 2011). Therefore, how to manage the potential risks posed by external weather conditions is an important issue to public transit managers, and warrants increased attention particularly given the scientific consensus that climate change will increase the frequency and intensity of extreme weather events such as heatwaves, hurricanes and floods (Intergovernmental Panel on Climate Change, 2012).
In this part of the study, we go beyond the traditional estimation of the weather-ridership relationship to consider possible adaptation strategies. More specifically, we consider adaptation as specific solutions, technologies or facilities that help reduce the expected adverse impact of climatic disruptions. To examine the possible adaptation effect, we delve into the heterogeneity of weather-ridership dynamics, and ask how adverse weather impact on ridership varies by transit station type and station amenities. This study adds to the extant weather and travel literature as the first research that empirically examines the moderating effect of transit amenities, to the best of our knowledge. It also contributes to the climate change literature by linking transit, weather, and adaptation-related infrastructure at the system level. Moreover, our research is highly relevant for practitioners by providing a systematic approach to evaluate effectiveness of weather-proof facilities and infrastructure. It provides additional insights into the cost and benefits that accrue along different infrastructure investment pathways and assists transit agencies in better assessing the feasibility of climate-proof investment.
Our results, based on two case studies focused respectively on the service areas of Chicago Transit Authority (CTA) and Utah Transit Authority (UTA), suggest that extreme weather poses differential impacts on ridership conditioning on station-level characteristics. In the CTA study,
10
we find that different types of rail stations have differential impact on ridership on bad weather days. In particular, subway ridership is significantly higher than that at the above-ground stations when extreme precipitation occurs. In the case of UTA analysis, we utilize bus stop-level microdata to show that the installation of shelter and bench can effectively mitigate the negative weather impact on ridership on extreme hot and cold days. In addition, shelters also reduce the ridership loss due to heavy precipitation.
The next section briefly reviews the relevant literature, which is followed by a description of the empirical model used in the regression analysis. We then present the CTA and UTA case study before summarizing the findings and implications.
3.2. Prior Literature The extant transit literature has provided consistent empirical evidence that weather affects ridership. In an early study, Changnon (1996) find that summer rain significantly decreases transit ridership in the Chicago area and moreover, this dampening effect is higher during the midday hours than in the morning or evening periods, suggesting that rainfall disrupts discretionary passengers/trips more than regular commuters. This weather effect translates into more than $0.6 million (1979 dollars) revenue losses for CTA. In another Chicago study, Guo et al. (2007) look into five different weather factors, including temperature, precipitation, snow, wind and fog, and they show that adverse weather conditions, in particular heavy rainfall, snow, and wind, have a negative effect on ridership. Such impact is higher on bus ridership than rail ridership, presumably because bus stops are more exposed to weather. Additionally, they find that riders are more affected on weekend days compared to weekdays.
Stover and McCormack (2012) examine the impact of weather (including wind, temperature, rain and snow) on bus ridership in Pierce County, Washington, for the period 2006-2008. Their research, by incorporating both weather and non-weather-related variables such as gas prices and unemployment rates, provides consistent finding that bad weather decreases ridership. Furthermore, they show certain weather conditions (e.g., high winds, snow) have differential effects depending on the time of year.
In a similar study focused on New York City, Cravo and Cohen (2009) investigate the weather (temperature, precipitation and snow) impact on transit ridership and revenue. They find that rain and snow in winter months exert negative impacts on both bus and subway ridership. Subway revenues increase when temperatures are cooler than normal in the spring and fall, and decrease when temperature are warmer than normal in the summer. In another New York City study, Singhal et al. (2014) use more detailed hourly data to examine the weather impact (temperature, rain, snow, wind, fog) on the Metropolitan Transportation Authority (MTA) subway ridership, and how such impact varies depending on station type. They find that the negative impact of adverse weather conditions (rain, wind, higher temperature) is more pronounced for elevated stations compared to underground stations. More interestingly, heavy snow conditions seem to have significantly increased the ridership at underground stations over weekdays, which suggests the possibility of a reverse mode shift of private vehicle based commuters to transit due to more difficult driving conditions.
In addition to the single-city studies, researchers also utilize data from multiple cities to further examine the weather-ridership relationship. For example, Kalstein et al. (2009) assess the effect of air masses on daily rail ridership in Chicago, San Francisco Bay area and northern New Jersey.

11
By comparing the mean ridership residuals among the different air mass types, they show a significant impact of air masses, with ridership increasing during dry and comfortable days and decreasing on days with cool and moist weather.
Our research extends the line of multi-city studies by asking how ridership of different transit modes (bus and rail) responds to extreme weather conditions at different geographic locations with distinctive climate profiles. We investigate the possible moderating effect of station amenities during adverse weather conditions, and use the empirical estimates to perform the cost-benefit analysis for transit infrastructural improvements. As noted in other research (Stover and McCormack, 2012), a common belief in the transit industry is that people are more likely to use public transportation in a more comfortable waiting environment. Placing shelters at bus stops is one way to provide weather protection and improve the comfort of waiting passengers (Law and Taylor 2001). In this respect, this study is the first to provide concrete empirical evidence on the ridership/revenue-generating potential of transit amenities. Considering the potential endogeneity of the placement of transit amenities, we employ a different estimation strategy which controls for the possible confounding effect of unobserved cross-station heterogeneity on transit ridership. Our empirical methodology is discussed in more detail in the next section.
3.3. Method In both case studies, we adopt essentially the same approach by matching the daily weather conditions with the daily station-level ridership data. Specifically, we construct a panel data set containing multiple transit stations and repeated observations for each individual station over multiple time periods (i.e., days). Given our primary interest in station-specific amenities which might affect a station’s exposure to extreme weather and improve rider comfort, we interact this variable with the extreme weather indicators to examine the moderating effect in the following equation. Ln(ridership)it = β1weatherit + β2 weather it*st_characteristici + δmonth + γstation + μ (1) Our dependent variable is the logarithm of daily ridership at a given transit station i on a day t.1 Weatherit denotes a set of variables measuring adverse weather condition including extreme hot and cold days, and heavy precipitation which varies by location (i.e., county where the transit station is located) and by day. St_characteristici includes variables measuring transit station type (e.g., underground versus above-ground stations) or other amenity (e.g., canopy coverage, availability of shelter and bench). Our key parameter of interest is β2, which is an estimate of the extent to which station-specific characteristics moderate the loss of ridership due to extreme weather conditions. β2 is expected to be positive if certain amenities mitigate the adverse weather impacts. The model also includes monthly fixed effects, δmonth, to account for the seasonal changes in ridership which are common to all stations, and the station-level fixed effects, γstation, to control for the unobserved heterogeneity across stations. μ denotes the error term. In all regressions, standard errors are clustered at the station level to adjust for possible heteroskedasticity.
1 In this study we estimate a log linear functional form because of the large variation in ridership across stations. Therefore, it is more reasonable to estimate the percentage change rather than levels. We also find that the log linear model yields better goodness of fit compared to using ridership levels.
12
It is important to note here that by including station individual fixed effects, we identify the weather and amenity effect using only within-station variations over time. The basic rationale for using this model is that the placement of transit amenities is likely to be endogenous. Transit agencies might purposefully invest in amenity facilities at stations where they expect to see larger ridership. This creates the simultaneity problem because the flow of causality is not purely from the explanatory variable (e.g., amenities) to the outcome variable (i.e., ridership) but could be in the opposite direction (Wooldridge, 2013). It is also possible that the availability of amenities might correlate with other station-specific characteristics which can influence ridership, thereby creating omitted variable bias as another source of endogeneity. Therefore, using the station individual fixed effects allows us to control all the time-invariant station-level characteristics; we do not estimate the direct effect of station amenity on ridership. Instead, we use the interaction term to identify the ridership sensitivity to extreme weather conditions, because it is constructed by interacting the exogenous weather variables with the potentially endogenous variable, st_characteristici, and can be interpreted as exogenous if the latter is directly controlled for (Angrist & Krueger, 1999).
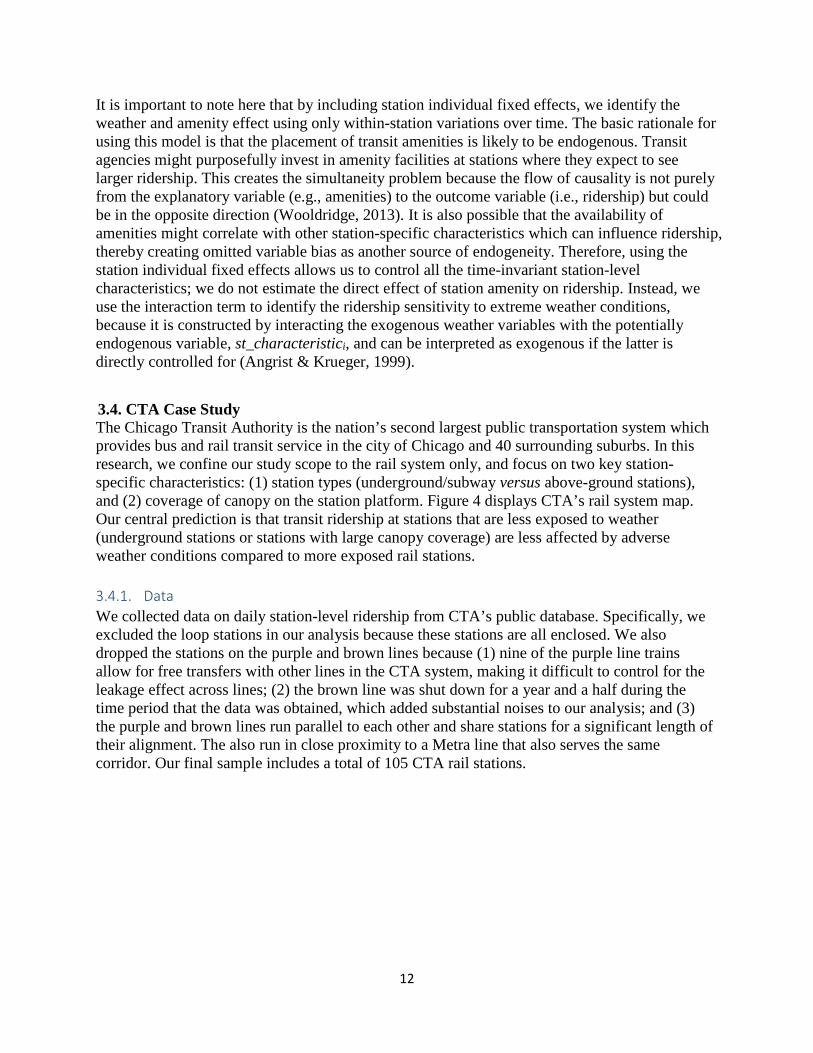
3.4. CTA Case Study The Chicago Transit Authority is the nation’s second largest public transportation system which provides bus and rail transit service in the city of Chicago and 40 surrounding suburbs. In this research, we confine our study scope to the rail system only, and focus on two key station-specific characteristics: (1) station types (underground/subway versus above-ground stations), and (2) coverage of canopy on the station platform. Figure 4 displays CTA’s rail system map. Our central prediction is that transit ridership at stations that are less exposed to weather (underground stations or stations with large canopy coverage) are less affected by adverse weather conditions compared to more exposed rail stations. 3.4.1. Data We collected data on daily station-level ridership from CTA’s public database. Specifically, we excluded the loop stations in our analysis because these stations are all enclosed. We also dropped the stations on the purple and brown lines because (1) nine of the purple line trains allow for free transfers with other lines in the CTA system, making it difficult to control for the leakage effect across lines; (2) the brown line was shut down for a year and a half during the time period that the data was obtained, which added substantial noises to our analysis; and (3) the purple and brown lines run parallel to each other and share stations for a significant length of their alignment. The also run in close proximity to a Metra line that also serves the same corridor. Our final sample includes a total of 105 CTA rail stations.

13
Figure 4. CTA Rail Transit System Map

14
Also based on the CTA database, we identified the station-type for each station. We define a station’s canopy coverage as the proportion of canopy-covered area to the area of the station platform. A UIC graduate student used a survey wheel to measure all the station platform dimensions. The canopy coverage was obtained from CTA. Because the measurement was conducted in 2012, we limit our analysis to only this year considering the possibility that canopy coverage may alter before or after due to station renovation. More specifically, we categorize canopy coverage into three levels – low (below 50% covered), medium (50% - 80% covered) and high (above 80% covered) based on the distribution of the raw measurement data.2
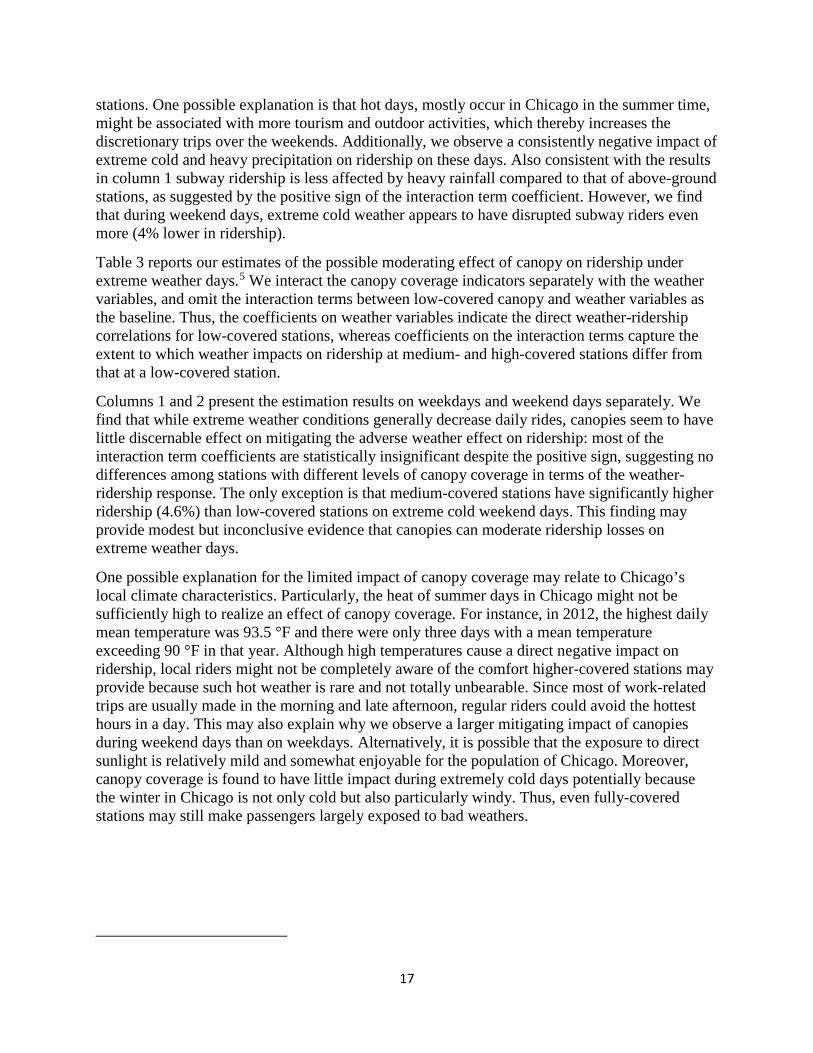
The weather data are taken from the National Climate Data Center (NCDC) Global Historical Climatology Network (GHCN) – Daily database. We use the observational records at the Chicago Midway Airport station to represent the weather conditions for the entire CTA service region throughout 2012. Our key variables of interest are temperature and precipitation. Figure 5 displays the daily mean temperature (a simple average of the maximum and minimum temperature during a day) and precipitation statistics over this year. To construct the extreme weather conditions, we define extreme hot when the daily mean temperature is at or above the 90th percentile of the annual daily temperature distribution (approximately 80 °F), extreme cold at or above the 10th percentile (21 °F), and heavy rainfall at or above the 90th percentile of annual daily precipitation distribution (0.25 inch). All the adverse weather conditions are coded as binary variables that equal one if they meet the aforementioned criteria and zero otherwise. Table 1 summarizes the descriptive statistics of the main variables used in this analysis.
Table 1. Descriptive Statistics of Main Variables Variables N Mean Std. Dev. Min Max Daily rides 37875 3435.7560 3060.6760 3 25280 Extreme hot (temp. >= 90th percentile) 38218 0.1099 0.3128 0 1 Extreme cold (temp. <= 10th percentile) 38218 0.1030 0.3040 0 1 Heavy rainfall (precip. >= 90th percentile) 38218 0.1013 0.3017 0 1 Subway Station 38218 0.1724 0.3777 0 1 Low canopy coverage 38218 0.1125 0.3160 0 1 Medium canopy coverage 38218 0.2171 0.4123 0 1 High canopy coverage 38218 0.6704 0.4701 0 1
3.4.2. Results We estimate equation (1) to examine the weather impact on CTA rail ridership by differentiating station types and levels of canopy coverage, respectively. In addition, we distinguish between weekdays and weekend days to facilitate the comparison between work-related travel and discretionary travel behaviors.
2 Underground stations are considered as 100% covered and classified as high coverage.

15
Figure 5. Daily Mean Temperature and Precipitation Distribution in Chicago in 2014
0
10
20
30
40
50
60
70
80
90
100
daily mean temperature (°F)
0
0.5
1
1.5
2
2.5
3
3.5
4
daily precipitation (inch)

16
Table 2 reports the regression results comparing changes in ridership at subway and above-ground stations during extreme weather days.3 The coefficients on weather variables capture the weather impact on above-ground stations, whereas the coefficients on the interaction terms indicate the difference between underground and above-ground stations in terms of ridership losses due to bad weather. Column 1 (weekdays only) shows that all adverse weather conditions (extreme hot, extreme cold, and heavy precipitation) have a statistically significant and negative impact on ridership at the above-ground stations. Specifically, one extreme cold or hot day is expected to decrease daily ridership by 14 % or 11%, respectively. Daily rides in those stations decrease by 1.4% during heavy rainy days compared to normal weather conditions.
Table 2. Regression of Weather on Daily Ridership conditioning on Station Type Independent variables Weekdays Weekends Extreme cold -0.142*** -0.0544***
(0.00399) (0.00530)
Extreme hot -0.109*** 0.0647***
(0.00588) (0.00580)
Heavy Rain -0.0137*** -0.0413***
(0.00283) (0.00346)
Extreme cold *Subway station -0.000419 -0.0425**
(0.00997) (0.0179)
Extreme hot *Subway station 0.00227 0.00798
(0.0223) (0.0170)
Heavy Rain *Subway station 0.0201*** 0.0247***
(0.00619) (0.00878)
Constant 7.959*** 7.206***
(0.00445) (0.00914)
Observations 27,018 10,857 Number of stations 105 105 One interesting finding is that subway ridership is significantly higher (2%) than that at above-ground stations during heavy rainy days. We further estimate the direct weather impact on subway ridership by computing the sum of β1 and β2, which turns out to be positive but statistically insignificant.4 This result may suggest that the fully covered environment in subway stations minimizes the exposure of passengers to bad weather, and effectively offsets any negative impact on ridership. However, the moderating effect of underground stations is not detected for extreme hot and cold weather conditions.
Column 2 presents the estimates of weather impact on rail ridership on weekend days. One noticeable difference (from column 1) is that high temperature seems to increase ridership over weekends, and this effect is statistically significant for both underground and above-ground 3 Subway is a binary variable which equals to 1 if the station is underground and 0 otherwise. Because this variable is time-constant, it is dropped from the station fixed-effect regression model and therefore not included in the results. 4 The test is performed by using the “lincom” command in STATA.
17
stations. One possible explanation is that hot days, mostly occur in Chicago in the summer time, might be associated with more tourism and outdoor activities, which thereby increases the discretionary trips over the weekends. Additionally, we observe a consistently negative impact of extreme cold and heavy precipitation on ridership on these days. Also consistent with the results in column 1 subway ridership is less affected by heavy rainfall compared to that of above-ground stations, as suggested by the positive sign of the interaction term coefficient. However, we find that during weekend days, extreme cold weather appears to have disrupted subway riders even more (4% lower in ridership).
Table 3 reports our estimates of the possible moderating effect of canopy on ridership under extreme weather days.5 We interact the canopy coverage indicators separately with the weather variables, and omit the interaction terms between low-covered canopy and weather variables as the baseline. Thus, the coefficients on weather variables indicate the direct weather-ridership correlations for low-covered stations, whereas coefficients on the interaction terms capture the extent to which weather impacts on ridership at medium- and high-covered stations differ from that at a low-covered station.
Columns 1 and 2 present the estimation results on weekdays and weekend days separately. We find that while extreme weather conditions generally decrease daily rides, canopies seem to have little discernable effect on mitigating the adverse weather effect on ridership: most of the interaction term coefficients are statistically insignificant despite the positive sign, suggesting no differences among stations with different levels of canopy coverage in terms of the weather-ridership response. The only exception is that medium-covered stations have significantly higher ridership (4.6%) than low-covered stations on extreme cold weekend days. This finding may provide modest but inconclusive evidence that canopies can moderate ridership losses on extreme weather days.
One possible explanation for the limited impact of canopy coverage may relate to Chicago’s local climate characteristics. Particularly, the heat of summer days in Chicago might not be sufficiently high to realize an effect of canopy coverage. For instance, in 2012, the highest daily mean temperature was 93.5 °F and there were only three days with a mean temperature exceeding 90 °F in that year. Although high temperatures cause a direct negative impact on ridership, local riders might not be completely aware of the comfort higher-covered stations may provide because such hot weather is rare and not totally unbearable. Since most of work-related trips are usually made in the morning and late afternoon, regular riders could avoid the hottest hours in a day. This may also explain why we observe a larger mitigating impact of canopies during weekend days than on weekdays. Alternatively, it is possible that the exposure to direct sunlight is relatively mild and somewhat enjoyable for the population of Chicago. Moreover, canopy coverage is found to have little impact during extremely cold days potentially because the winter in Chicago is not only cold but also particularly windy. Thus, even fully-covered stations may still make passengers largely exposed to bad weathers.

18
Table 3. Estimating Weather Effects on CTA Daily Ridership Conditioning on Canopy Coverage Independent variables Weekdays Weekends Extreme cold -0.140*** -0.0677***
(0.00819) (0.0120)
Extreme cold* median coverage 0.0106 0.0458***
(0.00967) (0.0135)
Extreme cold* high coverage -0.00781 -0.00583
(0.00972) (0.0154)
Extreme hot -0.102*** 0.0617***
(0.0114) (0.0145)
Extreme hot* median coverage 0.0119 0.00620
(0.0162) (0.0203)
Extreme hot* high coverage -0.0132 0.00445
(0.0149) (0.0181)
Heavy Rain -0.0126** -0.0455***
(0.00516) (0.00689)
Heavy Rain* median coverage 0.00160 0.0139
(0.00611) (0.0109)
Heavy Rain* high coverage 0.00300 0.00830
(0.00652) (0.00763)
Constant 7.959*** 7.206***
(0.00446) (0.00917)
Observations 27,018 10,857 Number of stations 105 105 Clustered standard errors in parentheses *** p<0.01, ** p<0.05, * p<0.1 It is also worth noting that our results indicate subway ridership is generally less affected by heavy precipitation but high-covered stations (including those underground stations) seem to have little moderating effect on its ridership. This may suggest that factors other than canopy size could affect passenger comfort. It is possible that riders recognize whether a station is underground or above-ground, but they pay little attention to a station’s canopy, which means this amenity does not factor into their travel decision. While this research only considers the relative size of canopies, other station relevant transit amenities, such as drainage system and platform structures, may affect passenger comfort during extreme weather conditions.
Finally, it should also be noted that multicollinearity is one empirical challenge of using interaction terms in regression analysis. We do find that the interaction terms (with canopy variables) highly correlate with the weather variables, which thereby inflates the standard errors and affects the accuracy of our statistical inferences. Therefore, we acknowledge that our results should be taken with caution.

19
3.5. UTA Case Study The Utah Transit Authority operates transit services, including buses, light rail lines, streetcar line and commuter rail train, throughout the Wasatch Front of Utah. It serves the metropolitan areas of Ogden, Park City, Provo, Salt Lake City and Tooele. In this case study, we confine our scope of analysis to the bus system only, and focus on the availability of shelter and bench as two key features of UTA bus stop facilities. As we discussed before, we expect bus stops equipped with shelter to provide passengers with extra weather protection and lessen the negative weather impact on ridership. The installation of the bench may improve the comfort of waiting passengers and provide additional benefits under unfavorable weather conditions. 3.5.1. Data We obtained the data on daily ridership and bus-stop amenities from the UTA. One measurement issue that should be noted here is that UTA installs passenger counting equipment on only half of its fleet. Thus, not all bus trips are sampled during a day. A bus stop tends to have a higher ridership if more trips it serves are sampled on a day, thereby introducing considerable noise into the estimation of bus-stop daily ridership. Hence, instead of using the sum of recorded rides from randomly sampled trips, we compute the average daily boarding per bus run at an individual bus stop as a proxy for daily ridership. If no trip is sampled for the bus stop on a given day, the ridership is coded as missing and does not enter the regression. It should be noted that this measure is still flawed: although it helps alleviate the trip sampling bias, it fails to incorporate the cross-bus stop variations in the number of routes they actually serve on a daily basis.6
As for bus stop amenity measures, we create a binary variable which equals one if the bus stop has a shelter and zero otherwise. We generate the bench indicator in the same way (i.e., as a dummy variable). We merge the ridership data with the amenity information to form a final sample of around 7,300 bus stops over the period from 2010 through 2015. About half of these bus stops are located in the Salt Lake County. The others are in Utah, Davis, Weber, Tooele, Box Elder, Summit counties. A bus system map for the Salt Lake County is shown in Figure 6.
We collected the weather data from the NCDC GHCN – Daily database. We matched weather stations to counties using each station's reported latitude and longitude. We create the weather variables, daily mean temperature and daily precipitation, at the county level and merge the weather data with the bus stop-level ridership data. For counties with multiple weather stations, we take the average of their measures for each day, which is a standard approach in the climate literature (e.g., Deryugina, 2013). Figure 7 displays the average monthly temperature and precipitation by county over the 2010-2015 period. Similarly, we construct the extreme weather variables by defining extreme hot when the daily mean temperature is at or above 90th percentile of the entire distribution (approximately 74 °F), extreme cold at or above 10th percentile (26 °F), and heavy rainfall a or above 75th percentile of annual daily precipitation distribution (0.75 inch). All the adverse weather conditions are coded as binary variables that equal one if they meet the aforementioned criteria and zero otherwise.
Table 4 summarizes the descriptive statistics of the main variables used in this case study.
6 It is possible that two bus stops have similar average boarding per trip, but if one bus stop serves much more routes than the other one, the former will have a higher daily ridership.

20
Figure 6. UTA Salt Lake County Transit System Map

21
Figure 7. Month Mean Temperature and Precipitation Distribution by Counties
20
30
40
50
60
70
80
1 2 3 4 5 6 7 8 9 10 11 12
F°
Month
Average Monthly Tempratures (2010-2015) In UTA Service Area
Box Elder Davis Salt Lake Summit Tooele Utah Weber
0
0.02
0.04
0.06
0.08
0.1
0.12
0.14
1 2 3 4 5 6 7 8 9 10 11 12
Inch
Month
Average Monthly Precipitation (2010-2015) in UTA Service Area
Box Elder Davis Salt Lake Summit Tooele Utah Weber

22
Table 4. Descriptive Statistics of Main Variables Variable N Mean Std. Dev. Min Max Daily average boardings per trip 6679117 0.2970 0.8560 0 137 Extreme cold (temp. <= 10th percentile) 6679117 0.0740 0.2618 0 1 Extreme hot (temp. >= 10th percentile) 6679117 0.1237 0.3293 0 1 Heavy rainfall (precip. >= 75th percentile) 6679117 0.2802 0.4491 0 1 Bench 6679117 0.7876 0.4090 0 1 Shelter 6679117 0.7599 0.4271 0 1 3.5.2. Regression Results Using the constructed panel data, we estimate equation (1) to examine the weather impact on UTA bus ridership conditioning on the installation of shelter and bench at the bus stop. We still distinguish between weekdays and weekend days to compare travel behaviors in response to bad weather. Also note that in addition to month fixed effects, we also include year fixed effects to account for possible annual changes common to all bus stops over the study period.
Table 5 reports our estimation results. Columns 1 and 2 include the interactions between shelter and weather variables, while columns 3 and 4 focus on the moderating effect of having a bench at a stop. Again, the coefficients on weather variables reflect the weather impact on ridership for those unequipped bus stops, whereas the coefficients on the interaction terms capture whether bus stops with shelter or bench are different from those exposed ones on ridership losses. Overall, we find consistent evidence that bad weather (i.e., extreme hot and cold, heavy precipitation) leads to a decrease in daily ridership at the exposed bus stops. Moreover, such effects are statistically significant on both weekdays and weekend days. Column 1 shows that during all the extreme weather conditions, sheltered bus stops see a higher ridership compared to unsheltered ones (as suggested by the positive interaction term coefficients). This finding, as we expect, suggests that shelters can effectively lessen the weather disruptions on bus ridership by reducing riders’ exposure to weather. However, we also show that this effect is negligible during weekend days: the coefficient estimates not only become statistically indistinguishable from zero but also decrease in magnitude (Column 2).
Column 3 shows that the installation of benches has a similar moderating effect on ridership during extreme hot and cold conditions, though there is no effect on heavy rainy days. Similarly, we find that benches no longer matter for bad weather during weekend days (Column 4). It is somewhat surprising to see that ridership seems to be affected more by rainfall at bus stops with shelter on weekend days, but this estimate is only marginally significant (at the 10 percent level).

23
Table 5. Estimating Weather Effects on UTA Daily Ridership Conditioning on Shelter and Bench Independent variables weekdays weekends weekdays weekends Extreme cold -0.0146*** -0.00432*** -0.0156*** -0.00493***
(0.00115) (0.00155) (0.00127) (0.00175)
Extreme hot -0.00245** -0.00486*** -0.00479*** -0.00499***
(0.00122) (0.00138) (0.00132) (0.00149)
Heavy Rain -0.00567*** -0.00512*** -0.00543*** -0.00446***
(0.000531) (0.000728) (0.000576) (0.000792)
Shelter * extreme cold 0.00336** -7.27e-05
(0.00136) (0.00181)
Shelter * extreme hot 0.00349** 9.45e-05
(0.00148) (0.00159)
Shelter * heavy rain 0.00120* -0.000855
(0.000621) (0.000857)
Bench * extreme cold
0.00452*** 0.000692
(0.00146) (0.00199)
Bench * extreme hot
0.00632*** 0.000261
(0.00158) (0.00169)
Bench * heavy rainfall
0.000856 -0.00165*
(0.000655) (0.000910)
Constant 0.212*** 0.219*** 0.212*** 0.219***
(0.00202) (0.00226) (0.00202) (0.00226)
Observations 4,906,775 1,772,342 4,906,775 1,772,342 Number of bus stops 7,300 7,263 7,300 7,263 Robust standard errors in parentheses *** p<0.01, ** p<0.05, * p<0.1

24
3.6. Conclusions To summarize, findings of the two case studies of the service areas of Chicago Transit Authority (CTA) and Utah Transit Authority (UTA) show that extreme weather effects ridership differently depending on station-level characteristics. In the CTA study, we find that different types of rail stations have differential impact on ridership on bad weather days. In particular, subway ridership is significantly higher than that at the above-ground stations when extreme precipitation occurs. While the results did not show that canopy coverage on exposed train platforms affects ridership levels on extreme weather days, we consider this still an open question due to data limitations (we were only able to use on year of data) and the lack of variability in station canopy coverage (most CTA ‘El’ stations have high levels of canopy coverage). In the case of UTA analysis, microdata analysis shows that installation of shelters and benches does mitigate the negative effects of weather on ridership on extreme hot and cold days. In addition, shelters also reduce the ridership loss due to heavy precipitation.

25
4. Part III. Decision Analysis Application Drawing upon our empirical estimates, we take a further step to examine the cost-effectiveness of installing such weather-proof infrastructure by integrating the existing cost and fare revenue data with the estimated effects of station amenities. We then apply a decision analysis approach to quantify and model choices that transit agencies could reasonably make to address the potential costs, risks and uncertainty related to extreme weather events.
Given the empirical evidence we have provided on the moderating effect of shelters and benches in the UTA case study, it suggests that installing these facilities on bus stops can serve as an effective adaptation strategy. Due to its positive influence on ridership during extreme weather conditions, these facilities are also expected to increase fare revenues from the public transit agency’s perspective. In the meantime, improving infrastructure incurs additional costs. To evaluate whether it is economically viable to invest in these facilities, we take a further step to conduct a cost-benefit analysis by integrating our estimated parameters of the shelter/bench effect with relevant cost/revenue information provided by the UTA.
The major economic benefit of installing shelters or benches, based on this research, is the gain of additional fare revenues under adverse weather conditions. Therefore, the size of the gain depends on the magnitude of the moderating effect on ridership, number of bad weather days, as well as average fare per ride.7 An increase in any of these variables will enlarge the economic gain. Also note that these earnings would recur every year over a relatively long time horizon, which makes the weather-proof facility a long-term investment. Adding a shelter or bench to an unequipped bus stop incurs an upfront cost of facility purchase and installation and future maintenance cost. We itemized all the cost and revenue information and calculated the net present value (NPV).
One key issue here is that we estimate the moderating effect of shelter and bench in the percentage term. Thus, to compute the additional rides UTA would save under extreme weather conditions we need to know the baseline ridership for a bus stop. Presumably, the higher the baseline ridership, the more rides these facilities may potentially add. This leads us to first calculate the baseline ridership which can result in an economic profit from investing in weather-proof facilities equalize the cost.
Table 6 presents our estimates of the breakeven ridership, respectively, for shelter and bench, under different scenarios with varying rider fares, the number of extreme weather days in a year, and discount rates. Specifically, we assume a 10% or 20% increase in the current rider fare, and a 10% or 20% increase in the number of extreme weather days. We consider a 20-year time frame (with 3%, 5%, and 10% discount rate) in this analysis. Overall, we show the required breakeven ridership is much higher for building a shelter than benches. For example, using the current average fare per ride ($1.08) and bad-weather days (i.e., 26 extreme hot days, 26 extreme cold days and 65 rainy days), the daily baseline ridership justifying a bench is around 80 while the baseline ridership for a shelter is more than 1,000. This is because installing a shelter involves a much higher upfront cost than a bench. We also show that the results are most sensitive to the choice of discount rate, as it can substantially affect the future benefit flows. For example, using 7 Based on our current analysis, we estimate that installing a shelter would increase the bus-stop-level ridership in a year by 28% of its daily ridership, and a shelter would increase the annual total by 26% times its daily ridership. These figures are calculated as the sum of the products of the number of extreme weather days in a year and the moderating effect for this specific weather.

26
the 3% discount rate and the baseline extreme-weather days and average rider fare, to make the bench installation breakeven requires a daily ridership of 66. Using a 10% discount rate under the same scenario would require a daily ridership of 116 for breakeven.
Table 6 Sensitivity Analysis – Baseline Ridership for Bench / Shelter Installation Current Fare plus 10% plus 20% Discount Rate Weather $1.08 $1.188 $1.296
Baseline 66 60 55
3% Plus 10% 59 54 49 Plus 20% 56 51 46
Baseline 79 72 66
5% Plus 10% 71 64 59 Plus 20% 66 60 55
Baseline 116 105 96
10% Plus 10% 104 94 86 Plus 20% 97 88 81
Current Fare plus 10% plus 20% Discount Rate Weather $1.08 $1.188 $1.296
Baseline 851 773 709
3% Plus 10% 764 695 637 Plus 20% 712 647 593
Baseline 1015 923 846
5% Plus 10% 912 829 760 Plus 20% 850 773 708
Baseline 1486 1351 1239
10% Plus 10% 1335 1214 1113 Plus 20% 1244 1131 1037 In Figure 8 we present the decision model analysis, which reports the NPV of adding a shelter or bench for a bus stop with a daily baseline ridership of 50 boardings. We show that while under certain conditions the benefits of installing a bench outweigh the cost of construction, adding a shelter seems to result in a negative NPV under all scenarios. Again, this is attributed to the high construction cost of shelters. Also, it should be noted that despite its statistical significance, the magnitude of the moderating effect of shelter/bench is relatively small, and we consider the effect on ridership only under extreme weather conditions.
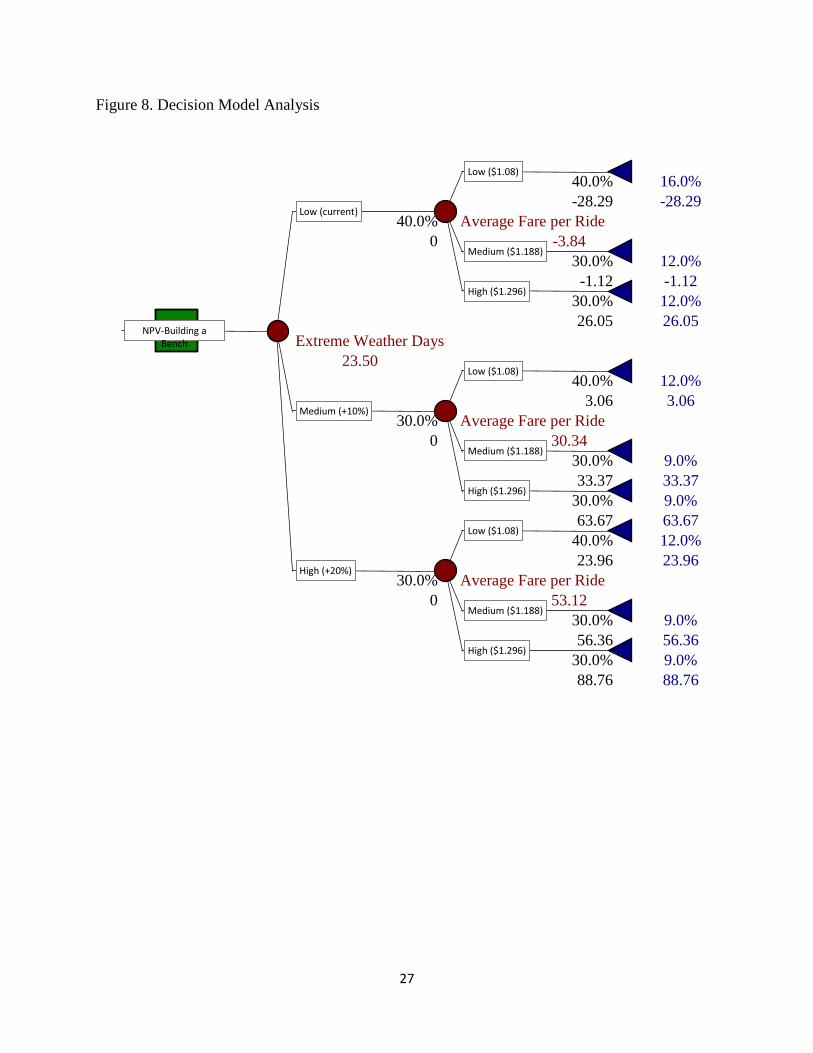
27
Figure 8. Decision Model Analysis
40.0% 16.0%
-28.29 -28.29
40.0% Average Fare per Ride
0 -3.84
30.0% 12.0%
-1.12 -1.12
30.0% 12.0%
26.05 26.05
Extreme Weather Days
23.50
40.0% 12.0%
3.06 3.06
30.0% Average Fare per Ride
0 30.34
30.0% 9.0%
33.37 33.37
30.0% 9.0%
63.67 63.67
40.0% 12.0%
23.96 23.96
30.0% Average Fare per Ride
0 53.12
30.0% 9.0%
56.36 56.36
30.0% 9.0%
88.76 88.76
NPV-Building a Bench
Low (current)
Low ($1.08)
Medium ($1.188)
High ($1.296)
Medium (+10%)
Low ($1.08)
Medium ($1.188)
High ($1.296)
High (+20%)
Low ($1.08)
Medium ($1.188)
High ($1.296)

28
Figure 8 (continued). Decision Model Analysis
40.0% 16.0%
-3294.25 -3294.25
40.0% Average Fare per Ride
0 -3275.74
30.0% 12.0%
-3273.68 -3273.68
30.0% 12.0%
-3253.10 -3253.10
Extreme Weather Days
-3255.03
40.0% 12.0%
-3271.00 -3271.00
30.0% Average Fare per Ride
0 -3250.39
30.0% 9.0%
-3248.10 -3248.10
30.0% 9.0%
-3225.19 -3225.19
40.0% 12.0%
-3254.20 -3254.20
30.0% Average Fare per Ride
0 -3232.08
30.0% 9.0%
-3229.63 -3229.63
30.0% 9.0%
-3205.05 -3205.05
Several final caveats related to the analysis and findings. First and foremost, the analysis conducted in this study did not assess the extent to which shelter installation attracts new riders. It is likely that the placement of a bus enclosure or bench promotes bus ridership on non-extreme weather days for multiple reasons including increased general comfort, perceived safely and reduced certainty of production during non-extreme weather days. Further work should examine the effect that bus enclosure installation has on ridership increases, through attraction of new riders. Additionally, the selection of baseline of only 50 daily boardings per day leaves open the opportunity to examine whether stations with higher boardings per day make economic sense.
Yet, overall, our analysis provides a relatively clear picture of how extreme weather impacts ridership, and how bus-stop shelter coverage and benches moderate ridership losses caused by extreme weather. This research suggests that installing the weather-proof amenities serves as an important adaptation strategy that reduces the adverse impact of ongoing climate change. It also
NPV-Building a Shelter
Low (current)
Low ($1.08)
Medium ($1.188)
High ($1.296)
Medium (+10%)
Low ($1.08)
Medium ($1.188)
High ($1.296)
High (+20%)
Low ($1.08)
Medium ($1.188)
High ($1.296)

29
provides additional insights into the possible adaptation costs public transit agencies have to confront.
5. Conclusion Extreme weather can pose serious interruptions to various aspects of the transit sector. For public transit managers, to effectively address potentially damaging weather risks requires not only a good understanding of the weather impacts on transit but also possible strategies that lessen the negative impacts. This research extends the extant literature on weather and ridership by examining whether and how the weather effect on ridership is moderated by station characteristic and transit amenities such as canopy and shelter coverage. Our research, based on two case studies focused on CTA and UTA service areas, suggests the heterogeneous effect of the adverse weather conditions across rail stations in Chicago and bus stops in Salt Lake Metropolitan Areas. Specifically, we find that subway ridership in Chicago is generally less affected by extreme precipitation compared to ridership at above-ground stations. The UTA case study shows that bus stop shelter and bench can effectively lessen the ridership losses due to extreme hot and cold weather, and shelters provide additional benefits on heavy rainy days. These findings generally suggest that transit infrastructure and amenities that reduce passenger exposure to weather can reduce ridership losses on extreme weather days. Moreover, in both studies, we find that the moderating effect is more pronounced on weekdays than on weekend days.
Using the empirical estimates drawn from the UTA study, we present a systematic approach to examining what costs and benefits that accrue along different infrastructure investment pathways. Our analysis shows that the adaptation cost varies by the type of weather-proof facilities, while the benefits are sensitive to a variety of factors related to rider fare, future extreme weather frequency, size of the moderating effect, as well as the discount rate agencies adopt in their cost-benefit analyses. Further work should be done to estimate whether bus stop enclosures attract new riders and how sensitive the outcomes are to the number of boardings at bus stops.

30
References Angrist, J. D., and Krueger, A.B. 1999. Empirical strategies in labor economics, Handbook of Labor Economics: 1277–1366. Changnon, S.A., 1996. Effects of summer precipitation on urban transportation. Clim. Change, 32 (4), 481–494. Chung, J., 2013. Severe weather advisory in effect for NYC, Gothamist, NewYork. http://gothamist.com/2013/02/07/severe_weather_advisory_in_effect_f.php Cravo, V.S., Cohen, J.E., 2009. The impact of weather on transit revenue in New York City. In: Proceedings of the 88th Annual Meeting of the Transportation Research Board, Transportation Research Board of National Academies. Washington, DC. Flegenheimer, M., 2013. M.T.A. Chief announces storm plan for subways, buses and commuter trains. The New York Times. http://cityroom.blogs.nytimes.com/2012/10/27/m-t-achief-announces-storm-plan-for-subways-buses-and-commuter-trains/?_r=0. Guo, Z., Wilson, N.H.M., Rahbee, A., 2007. Impact of weather on transit ridership in Chicago, Illinois. Transp. Res. Rec.: J. Transp. Res. Board, 2034, 3–10. Hodges, T., 2011. Flooded bus barns and buckled rails: public transportation and climate change adaptation. Federal Transit Administration Report No. 0001. IPCC, 2012. Managing the Risks of Extreme Events and Disasters to Advance Climate Change Adaptation [Field, C.B., V. Barros, T.F. Stocker, D. Qin, D.J. Dokken, K.L. Ebi, M.D. Mastrandrea, K.J. Mach, G.-K. Plattner, S.K. Allen, M. Tignor, and P.M. Midgley (eds.)]. A Special Report of Working Groups I and II of the Intergovernmental Panel on Climate Change. Cambridge University Press, Cambridge, UK, and New York, NY, USA. Kalstein, A.J., Kuby, M., Gerrity, D., Clancy, J.J., 2009. An analysis of air mass effects on rail ridership in three U.S. cities. J. Transp. Geogr. 17 (3), 198–207. Singhal, A., Kamga, C., Yazici, A., 2014. Impact of weather on urban transit ridership. Transportation Research Part A, 69, 379-391. Stover, V.W., McCormack, E.D., 2012. The impact of weather on bus ridership in pierce county, Washington. J. Public Transp. 15 (1), 95–110. Wooldridge, J. M., 2013. Introductory Econometrics: A Modern Approach. 5th ed. Mason, OH: South-Western.