future replenishment in poole bay - southern coastal … · bop-bmth pier 70 l . 1877 distance : no...
TRANSCRIPT
Future replenishment in Poole Bay
Dr David Harlow 1st February 2013
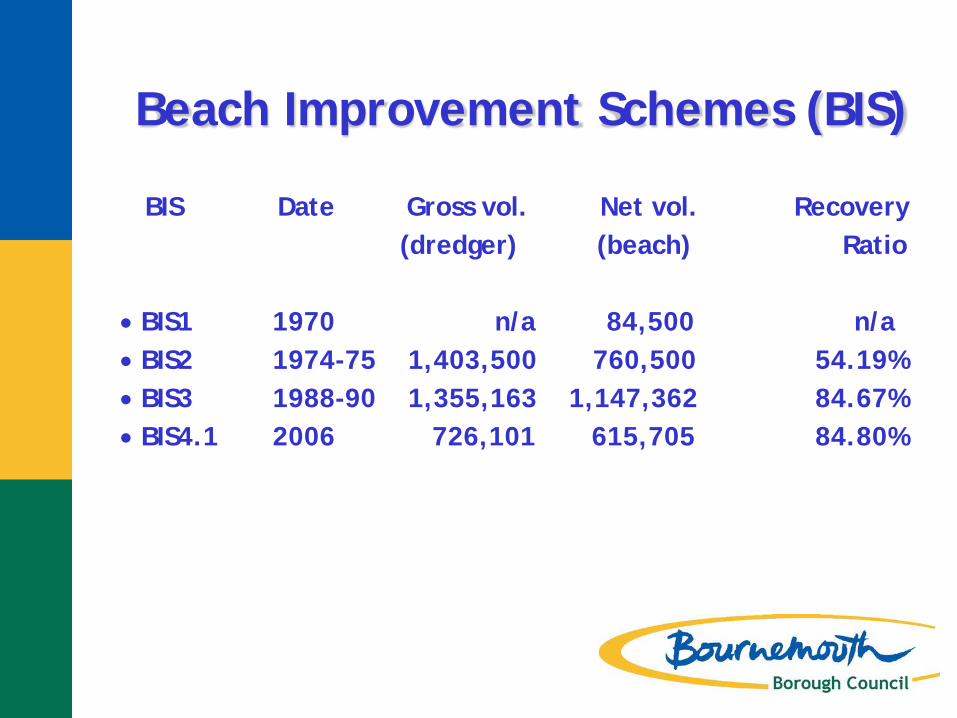
Beach Improvement Schemes (BIS) BIS Date Gross vol. Net vol. Recovery (dredger) (beach) Ratio • BIS1 1970 n/a 84,500 n/a
• BIS2 1974-75 1,403,500 760,500 54.19%
• BIS3 1988-90 1,355,163 1,147,362 84.67% • BIS4.1 2006 726,101 615,705 84.80%

Blank

Beach Improvement Schemes (BIS) BIS Date Dredger Beach Recovery Cost volume volume ratio per m3 • BIS1 1970 n/a 84,500 n/a
• BIS2 1974-75 1,403,500 760,500 54.19%
• BIS3 1988-90 1,355,163 1,147,362 84.67% • BIS4.1 2006 726,101 615,705 84.80% £4.58 • BIS4.2 2006/7 1,020,456 897,722 87.97% £5.19 • BIS4.3 2008 93,905 81,209 86.48% £11.08 • BIS4.4 2009 81,522 74,192 91.01% £12.59 • BIS4.5 2010 88,260 72,719 82.39% £13.01

1,500,000
2,000,000
2,500,000
3,000,000
3,500,000
1974 1976 1978 1980 1982 1984 1986 1988 1990 1992 1994 1996 1998 2000 2002 2004 2006 2008 2010 2012 2014
Volu
me
(m3)
Year
Figure 1202: History of BIS2, BIS3 & BIS4; Net beach volume v time; Poole Bay to 100m
MinBVol MaxBVol Replenishment Beach volume
BIS2 MaxBVol
MinBVol
BIS3
MinBVol 23 Sep.87 1,882,494m3
MinBVol +6
BIS4

BIS5?
Crystal ball image
Please Google “crystal ball, Normandy beach”...

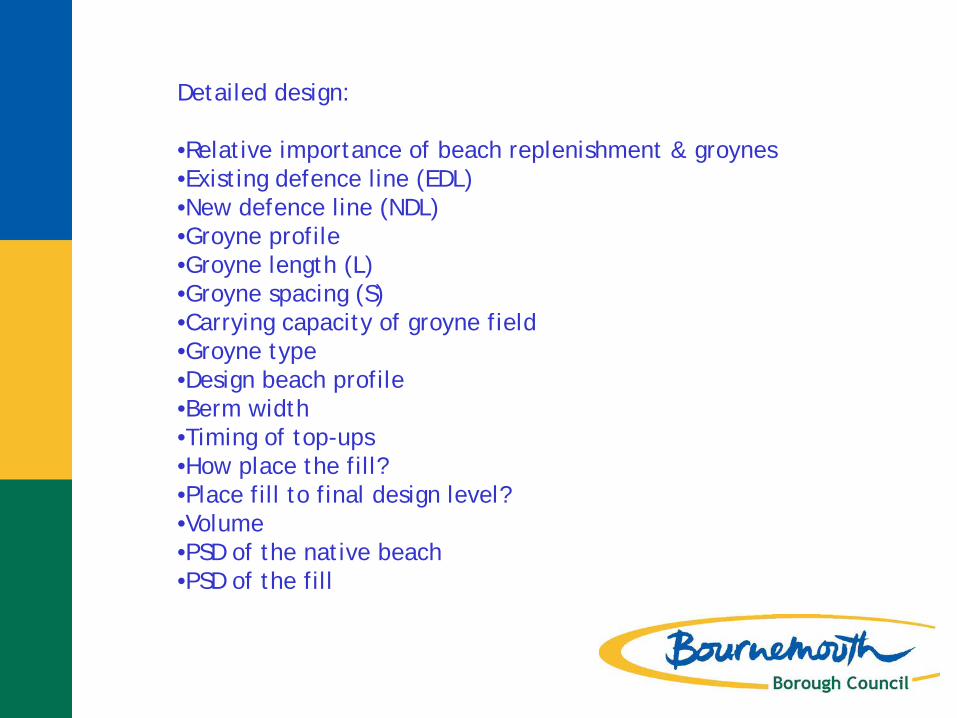
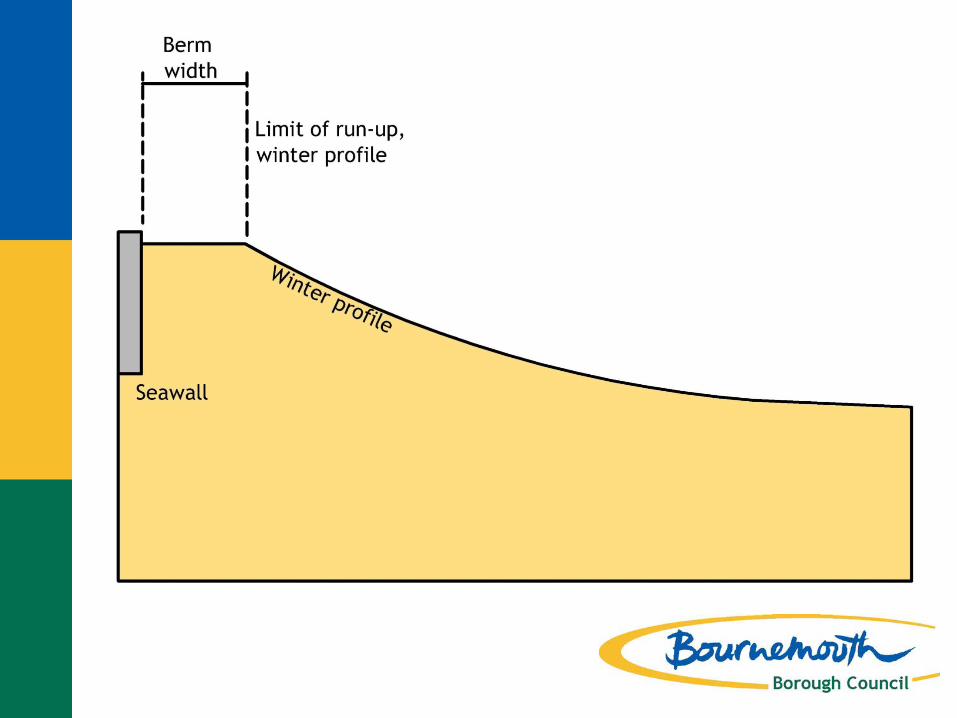
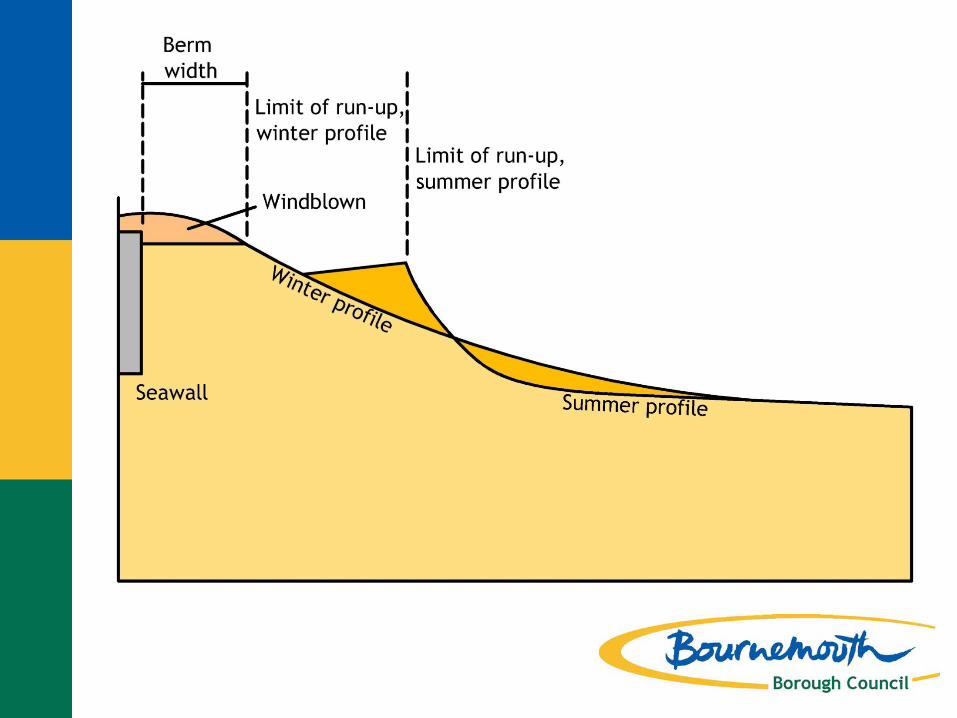
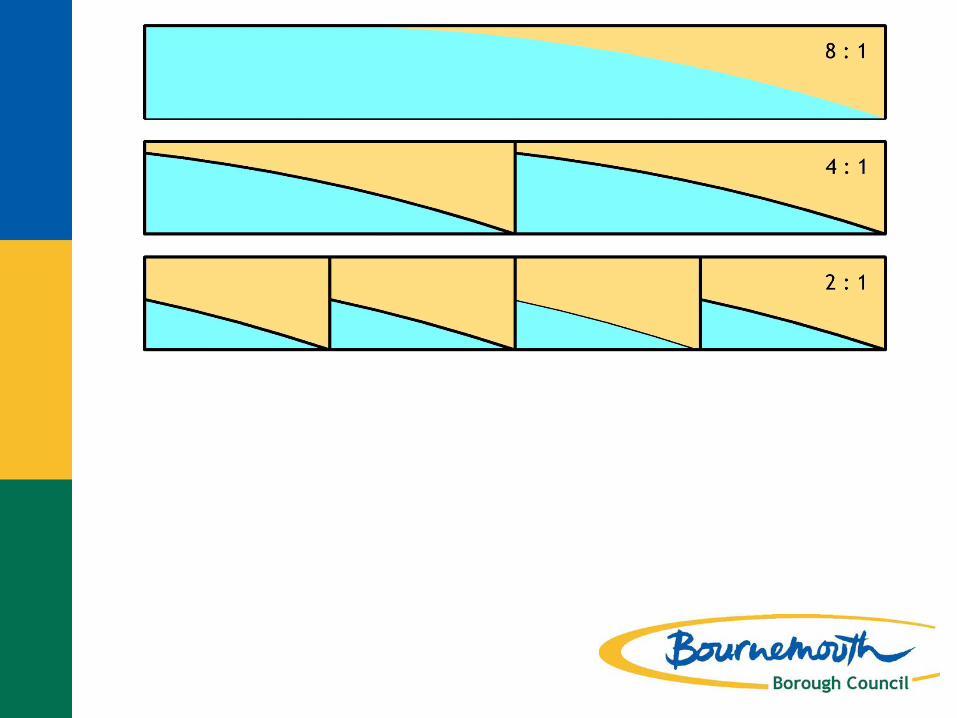
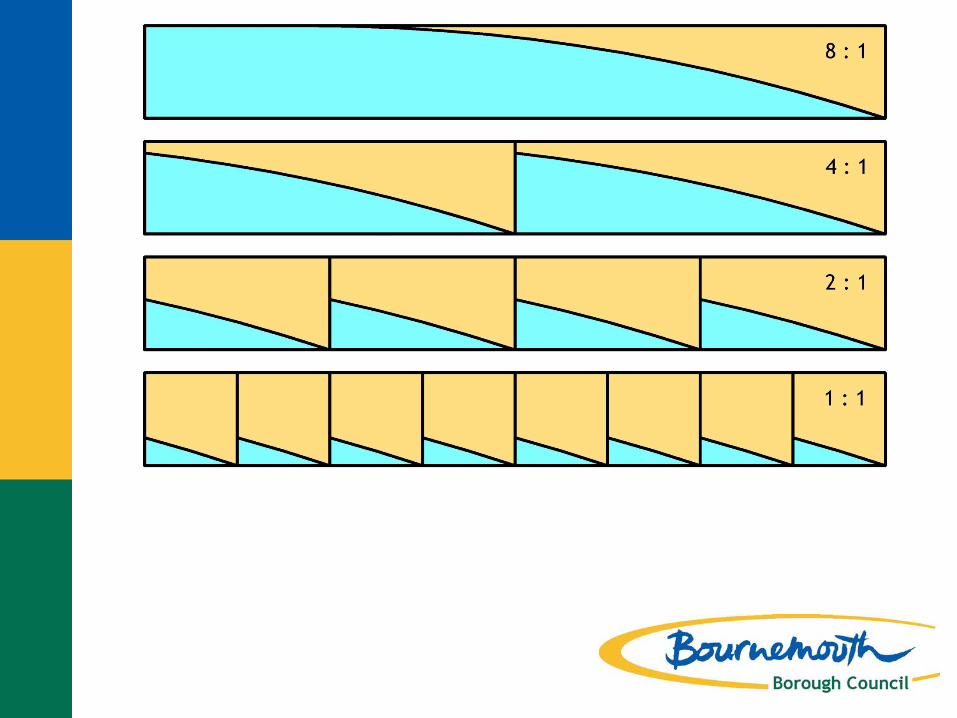
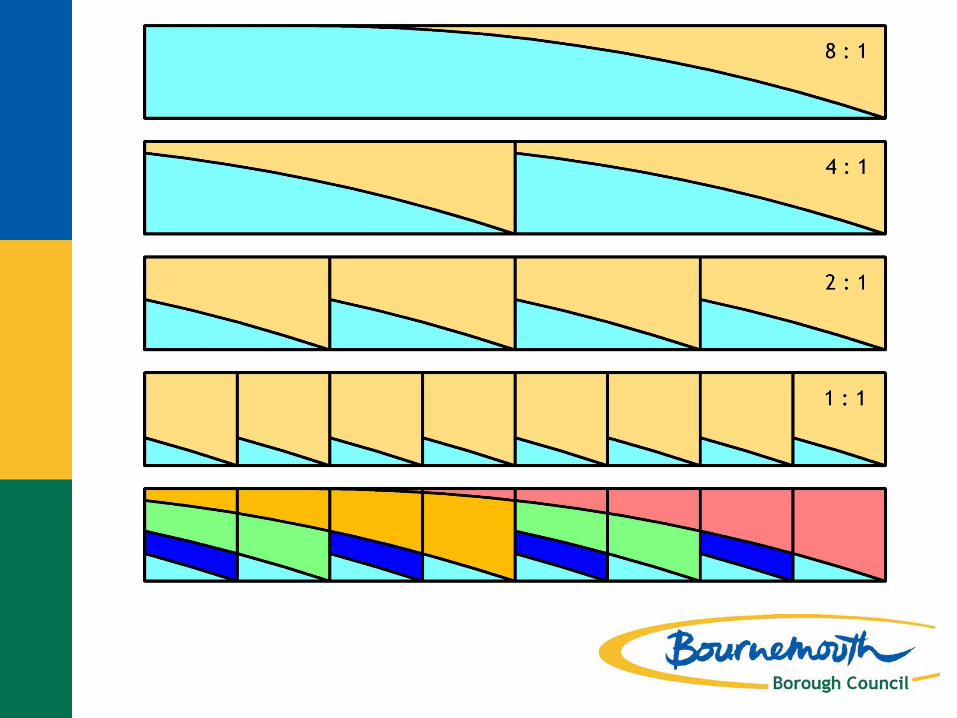
Detailed design: •Relative importance of beach replenishment & groynes •Existing defence line (EDL) •New defence line (NDL) •Groyne profile •Groyne length (L) •Groyne spacing (S) •Carrying capacity of groyne field •Groyne type •Design beach profile •Berm width •Timing of top-ups •How place the fill? •Place fill to final design level? •Volume •PSD of the native beach •PSD of the fill

0
100,000,000
200,000,000
300,000,000
400,000,000
500,000,000
600,000,000
0 50 100 150 200 250 300 350 400 450 500
Cost
(£)
Number of groynes
Figure 2004: Cost of rock groynes & beach replenishment over 100 years
Groyne costs
Beach rep costs
Total costs
present case

Existing Defence Line (EDL)


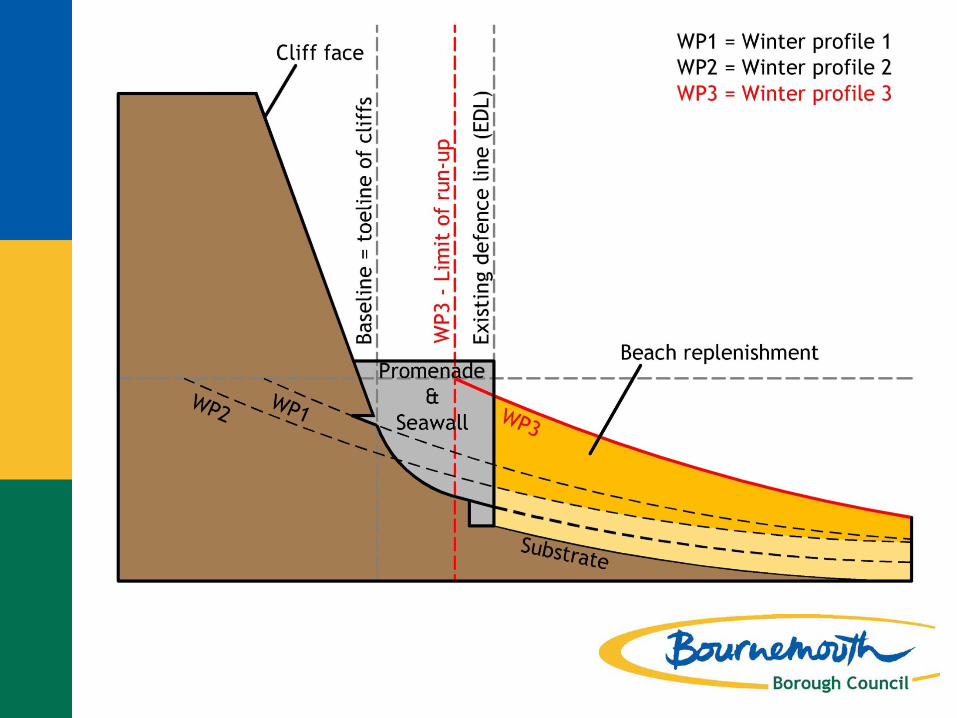

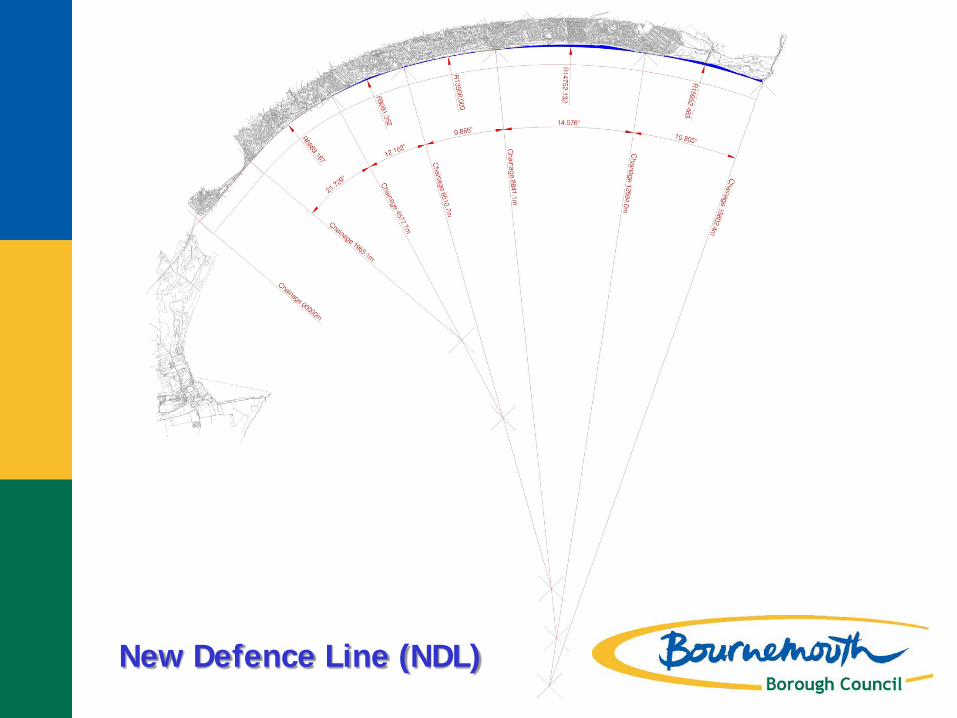
New Defence Line (NDL)


BoP-Bmth Pier
70 L
1877 distance
no of groynes ave. S S/L
9 208.56 2.98
10 187.70 2.68
11 170.64 2.44
12 156.42 2.23
13 144.38 2.06
14 134.07 1.92
15 125.13 1.79
16 117.31 1.68
17 110.41 1.58
18 104.28 1.49
19 98.79 1.41
20 93.85 1.34
21 89.38 1.28
22 85.32 1.22
23 81.61 1.17
24 78.21 1.12
25 75.08 1.07
26 72.19 1.03

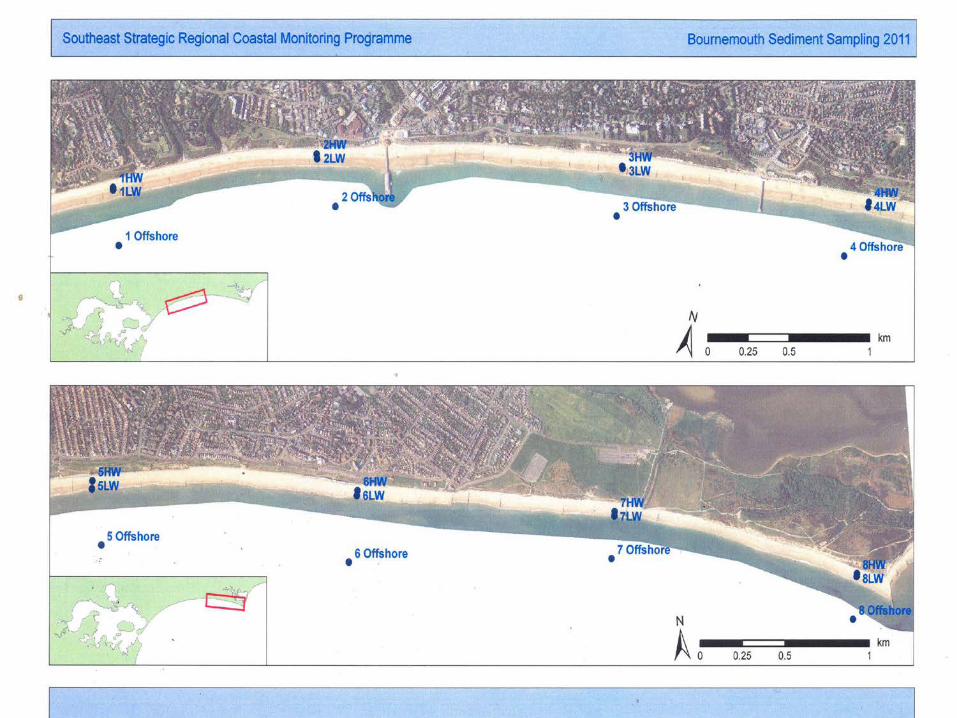
Probably the best beach monitoring in England

21.5 million cubic metres - www.sandmotor.nl

6,000,000
7,000,000
8,000,000
9,000,000
10,000,000
1974 1976 1978 1980 1982 1984 1986 1988 1990 1992 1994 1996 1998 2000 2002 2004 2006 2008 2010 2012 2014
Volu
me
(m3)
Year
Figure 510: Net beach volume v time; Poole Bay to 450m
maximium average minimum replenishment dates volume
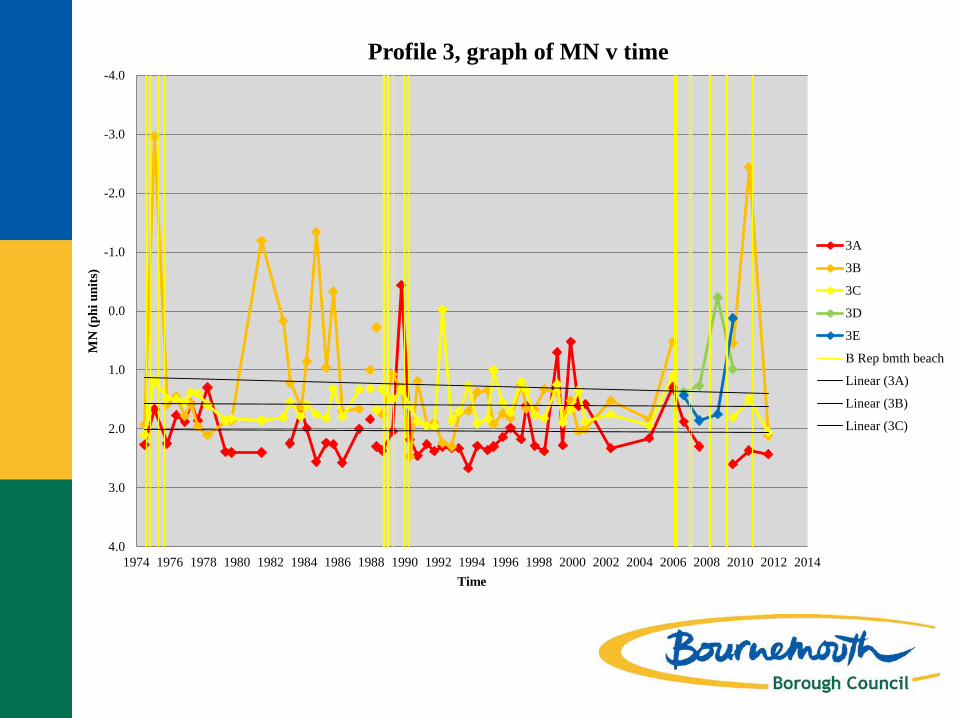
-4.0
-3.0
-2.0
-1.0
0.0
1.0
2.0
3.0
4.01974 1976 1978 1980 1982 1984 1986 1988 1990 1992 1994 1996 1998 2000 2002 2004 2006 2008 2010 2012 2014
MN
(phi
uni
ts)
Time
Profile 3, graph of MN v time
3A
3B
3C
3D
3E
B Rep bmth beach
Linear (3A)
Linear (3B)
Linear (3C)
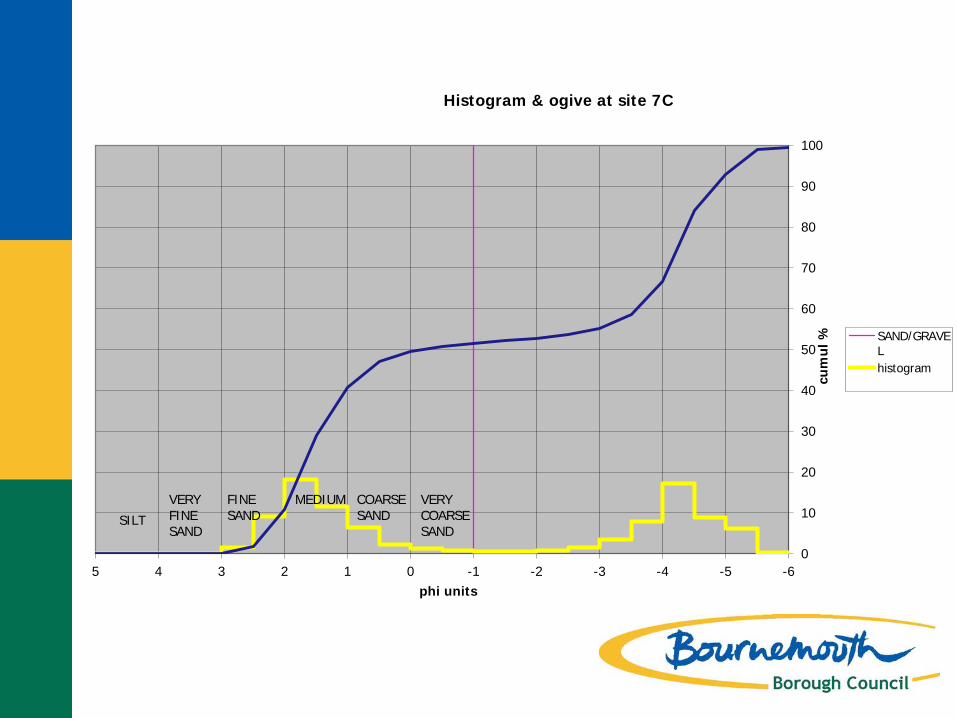
0
10
20
30
40
50
60
70
80
90
100
-6-5-4-3-2-1012345
cum
ul %
phi units
Histogram & ogive at site 7C
SAND/GRAVELhistogram
FINE SAND
MEDIUM COARSE SAND
VERY COARSE SAND
VERY FINE SAND
SILT


Every beach is unique. It varies in......
•Geology •History •Wave climate •PSD •Coast protection works •Property at risk •Amenity use