gaseous vocs rapidly modify particulate matter and its biological
TRANSCRIPT

Atmos. Chem. Phys., 12, 12293–12312, 2012www.atmos-chem-phys.net/12/12293/2012/doi:10.5194/acp-12-12293-2012© Author(s) 2012. CC Attribution 3.0 License.
AtmosphericChemistry
and Physics
Gaseous VOCs rapidly modify particulate matter and its biologicaleffects – Part 2: Complex urban VOCs and model PM
S. Ebersviller1, K . Lichtveld 1, K. G. Sexton1, J. Zavala1, Y.-H. Lin 1, I. Jaspers1,2, and H. E. Jeffries1
1Environmental Sciences and Engineering, Gillings School of Global Public Health, The University of North Carolina atChapel Hill, North Carolina, USA2Center for Environmental Medicine and Lung Biology, Human Studies Facility, The University of North Carolina at ChapelHill, North Carolina, USA
Correspondence to:S. Ebersviller ([email protected])
Received: 13 January 2012 – Published in Atmos. Chem. Phys. Discuss.: 13 March 2012Revised: 23 October 2012 – Accepted: 15 November 2012 – Published: 21 December 2012
Abstract. This is the second study in a three-part studydesigned to demonstrate dynamic entanglements amonggaseous organic compounds (VOCs), particulate matter(PM), and their subsequent potential biological effects. Westudy these entanglements in increasingly complex VOCand PM mixtures in urban-like conditions in a large out-door chamber, both in the dark and in sunlight. To the tra-ditional chemical and physical characterizations of gas andPM, we added new measurements of gas-only- and PM-only-biological effects, using cultured human lung cells as modelliving receptors. These biological effects are assessed hereas increases in cellular damage or expressed irritation (i.e.,cellular toxic effects) from cells exposed to chamber air rel-ative to cells exposed to clean air. Our exposure systems per-mit side-by-side, gas-only- and PM-only-exposures from thesame air stream containing both gases and PM in equilibria,i.e., there are no extractive operations prior to cell exposurefor either gases or PM.
In Part 1 (Ebersviller et al., 2012a), we demonstrated theexistence of PM “effect modification” (NAS, 2004) for thecase of a single gas-phase toxicant and an inherently non-toxic PM (mineral oil aerosol, MOA). That is, in the pres-ence of the single gas-phase toxicant in the dark, the initiallynon-toxic PM became toxic to lung cells in the PM-only-biological exposure system. In this Part 2 study, we usedsunlit-reactive systems to create a large variety of gas-phasetoxicants from a complex mixture of oxides of nitrogen and54 VOCs representative of those measured in US city air.In these mostly day-long experiments, we have designatedthe period in the dark just after injection (but before sun-
rise) as the “Fresh” condition and the period in the dark aftersunset as the “Aged” condition. These two conditions wereused to expose cells and to collect chemical characteriza-tion samples. We used the same inherently non-toxic PMfrom the Part 1 study as the target PM for “effect modifi-cation”. Fortunately, in the absence of “seed particles”, thecomplex highly-reactive VOC system useddoes notcreateany secondary aerosol in situ. All PM present in these testswere, therefore, introduced by injection of MOA to serveas PM-to-be-modified by the gaseous environment. PM ad-dition was only done during dark periods, either before orafter the daylight period. The purpose of this design is totest if a non-toxic PM becomes toxic in initially unreacted(“Fresh”), or in reacted (“Aged”) complex VOC conditions.To have a complete design, we also tested the effects of cleanair and the same VOC conditions, but without introducingany PM. Thus, there were six exposure treatment conditionsthat were evaluated with the side-by-side, gas-only- and PM-only-effects exposure systems; five separate chamber experi-ments were performed: two with clean air and three with thecomplex VOC/NOx mixture.
For all of these experiments and exposures, chemical com-position data and matching biological effects results for twoend-points were compared. Chemical measurements demon-strate the temporal evolution of oxidized species, with a cor-responding increase in toxicity observed from exposed cells.The largest increase in gas-phase toxicity was observed in thetwo “Aged” VOC exposures. The largest increase in particle-phase toxicity was observed in the “Aged” VOC exposurewith the addition of PM after sunset. These results are a
Published by Copernicus Publications on behalf of the European Geosciences Union.

12294 S. Ebersviller et al.: Part 2: Complex urban VOCs and model PM
clear demonstration that the findings from Part 1 can be ex-tended to the complex urban oxidized environment. This fur-ther demonstrates that the atmosphere itself cannot be ig-nored as a source of toxic species when establishing the risksassociated with exposure to PM. Because gases and PM aretransported and deposited differently within the atmosphereand lungs, these results have significant consequences. In thenext (and final) part of the study, testing is further applied tosystems with real diesel exhaust, including primary PM froma vehicle operated with different types of diesel fuel.
1 Introduction
In its most-recent document summarizing the state of thescience related to PM, the US National Research Council(NRC) stated that “a finding that the effect of particles de-pends on the concentration of another pollutant that is, “ef-fect modification” would have implications for setting Na-tional Ambient Air Quality Standards (NAAQS) indepen-dently for the various criteria pollutants” (NAS, 2004).
In Part 1 (Ebersviller et al., 2012a), we demonstrated theexistence of PM “effect modification” for the case of a singlegas-phase toxicant and an inherently non-toxic PM (mineraloil aerosol, MOA). That is, in the presence of the single gas-phase toxicant in the dark, the initially non-toxic PM becametoxic to lung cells in the PM-only-biological exposure sys-tem. In the first experiment, the non-toxic PM (MOA) wasadded to clean air and both biological exposures were per-formed, which resulted in no response from cells to eithergases or PM. In the second experiment, a gas-phase toxicant,either p-tolualdehyde or acrolein, was directly injected intoclean air in the dark chamber and both biological effects ex-posures were performed. The result was an increase in re-sponse from the gas-only cells, but not the PM-only cells.In a third experiment both the gas-phase toxicant and thePM were added to the chamber, and both biological expo-sures were performed. In this case, the PM-only-exposuresshowed 2× to 4× larger responses than did the clean air ex-posures. The gas-only-exposures, in the PM-added experi-ment decreased significantly or remained about the same asthe gas-only exposure in the absence of PM. That is, for thegas with lower volatility, it appears that much of the gas-phase mass was removed to the PM, but in the higher volatil-ity gas, it was less clear how the toxicant partitioned. Theseresults showed that a gas from the environment surroundingan initially non-toxic PM could modify the PM so that it be-came toxic to lung cells due to atmospheric processes only.This is the “effect modification” that the NRC posed wouldhave implications for research and regulation of PM.
This study was designed to extend our demonstration ofthe existence of “effect modification” to VOC systems thatare more like those in large urban areas, but to have an exper-
imental design simple enough to be relatively unambiguousabout demonstrating the PM modification by the gas-phase.
Extensive literature exists regarding how gases and parti-cles interact in important and dynamic processes during theageing of anthropogenic emissions in the atmosphere. WhenPM is present, VOCs constantly shift between the gas andparticle phases of ambient air, and at the same time they canbe modified by chemical reactions in each phase. Partition-ing theory that describes these processes has recently beencoupled to atmospheric chemistry models in an attempt tocapture and characterize these interactions in a quantitativeway (Hu and Kamens, 2007; Donahue et al., 2006; Lee et al.,2004; Kamens and Jaoui, 2001; Pankow et al., 1997; Kamenset al., 1981). What has remained uncharacterised to this pointis if – and how – these gas and particle interactions affect theactual toxicity of each phase.
Many toxicological studies focus on single species, or sin-gle primary pollutants, in the search for an entity that canbe assigned causality for health outcomes observed in epi-demiology studies (e.g.,Steenhof et al., 2011; Farina et al.,2011; Schlesinger et al., 2006; Dreher, 2000). While it is use-ful to examine the effects of single pollutants, these stud-ies ignore atmospheric ageing and the photochemical evolu-tion of species that occurs during the day in the ambient en-vironment. This simplified approach of ignoring secondarypollutants, while it permits laboratory studies to be under-taken, also ignores the complexity of the air we breathe inthe ambient environment, and thereby misses the contribu-tion of the atmosphere itself as a source of toxicity. “Suchapproaches are likely to over-simplify the underlying biolog-ical processes and how the mixture of air pollutants that isinhaled adversely affects health” (NAS, 2004).
The effects of photochemical-ageing and gas and parti-cle interactions have recently begun to be evaluated for theirimpact on the relative risk associated with exposure (Doyleet al., 2004; Sexton et al., 2004; Doyle et al., 2007; Lichtveldet al., 2012). Previous experiments using outdoor irradia-tion chambers have measured significant changes in chemicalcomposition as air pollution mixtures age in sunlight and, inmost cases, have measured an accompanying increase in tox-icity. In addition, these studies have indicated that the overalltoxicity of an aged pollution mixture may not be completelyaccounted for by the major daughter products alone, and thatsignificant portions of the observed response can be inducedby exposure to minor, and even undetected, products (Sextonet al., 2004; Doyle et al., 2004, 2007).
Therefore, in designing this study, we used sunlit-reactivesystems to create a large variety of gas-phase toxicants, in-cluding those not yet identified or detected, from a complexmixture of oxides of nitrogen (e.g., NOx, NO, and NO2) and54 VOCs that serve as primary reactants in our outdoor sun-lit chamber. The daylight reactions in this system consumea large portion of the primary VOCs and create a very largenumber of secondary oxidized products, with a wide distribu-tion of life-times. Some of these products we cannot detect,
Atmos. Chem. Phys., 12, 12293–12312, 2012 www.atmos-chem-phys.net/12/12293/2012/

S. Ebersviller et al.: Part 2: Complex urban VOCs and model PM 12295
and others we can detect but cannot identify explicitly. Thiswould be a limitation if we were performing a toxicologicaldose-response study, but we are more interested in having afully complex, urban-like system for exposure to living cells.For the purpose of these experiments, we are interested in therelative magnitude of cellular responses to reproducible, butnot totally characterizable (at least within this study), sys-tems to indicate the “types” of reactive systems that deservefurther attention.
To maintain a system with little ambiguity for PM “ef-fect modification” we used the same inherently non-toxic PMfrom the Part 1 study (Ebersviller et al., 2012a).
While we are aware of the dynamic interactions of gasesand PM in an evolving photochemical oxidizing system withPM present, including these processes here would intro-duce ambiguity to our ability to interpret the effects results.Thus, in our experimental design, we exclude PM during thedaytime photoactive period and only introduce it to test ifthe gases present will modifyaddednon-toxic PM (caus-ing the inherently non-toxic PM to become toxic to cells).This would clearly be “effect modification” as posed by theNAS. Our primary hypothesis is that – because many urbanatmospheres are capable of acting as a source of toxicity viathe creation of photochemically-aged daughter species in situ– non-toxic PM, in the presence of a photochemically-agedurban-like mixture, will become toxic to lung cells via theuptake of the toxic gases present in the aged mixture.
2 Methods
The methods and procedures used in this Part 2 study wereessentially identical to those reported in the Part 1 study(Ebersviller et al., 2012a). Thus, only brief summaries ofthese will be given here.
2.1 Chamber
The experiments described here were performed in theGillings Innovation Laboratory 120 m3 chamber on the roofof the four story School of Global Public Health at UNC, thesame as used in the Part 1 study (Fig.1). The chamber isabove all surrounding buildings and receives direct sunshineon its tilted Teflon film faces.
The chemical and biological analysis laboratories are lo-cated directly below the roof-top chamber on the fourth floor.Pollutants to be studied (VOCs, PM, etc.) are injected into thechamber through its floor. Chamber contents are monitoredcontinuously via sample lines that pass through the floor ofthe chamber, the roof of the building, and into the labora-tory below. These same sample lines provide chamber air tothe biological effects exposure systems that are maintained inan incubator with proper conditions to support living human-derived lung cells. For analytes that may be lost in long trans-
Outdoor SmogChamber
Incubator (37o C)
CO
2
To exhaust
Chamber Sample Lines
GIVES(gas only)
EAVES (par�cles only)
FiltersCarbonyl Sampling
GC-MSGC-ECDSMPSO₃/NOxDP
Roof
Fig. 1. Schematic of The Gillings Innovation Laboratory 120 m3
Outdoor Chamber located on the roof of the four-story GillingsSchool of Global Public Health, UNC-CH. Sample lines passthrough the floor of the chamber, the building’s roof, and then di-rectly into the chemistry and biological exposure laboratory on thefourth floor. Filter and carbonyl-specific sampling are performed onthe roof directly through the chamber floor to minimize loss in sam-ple lines.
fer lines, samples are collected directly below the chamber onthe roof of the building.
2.2 Gas phase compositional analysis
2.2.1 Direct sampling of the chamber by gaschromatography
Chamber air was sampled directly with a Varian 3400 gaschromatograph with flame ionization detector (FID) and cou-pled to a Saturn 2000 mass spectrometer (GC-MS). The di-lution rate of the chamber was monitored continuously by aVarian 3800 GC with an electron capture detector (ECD).A Varian 3800 GC with Saturn 2200 mass spectrometer(MS) was used to analyse condensed-phase samples (suchas function-specific or filter samples). See (Ebersviller et al.,2012a) for more details on components and operating condi-tions for these systems.
2.2.2 Species-specific analysis of carbonyls
Our chemical analysis places a large focus on carbonyl-containing compounds because they are the major oxidation
www.atmos-chem-phys.net/12/12293/2012/ Atmos. Chem. Phys., 12, 12293–12312, 2012
12296 S. Ebersviller et al.: Part 2: Complex urban VOCs and model PM
products of primary VOCs, and from earlier research havebeen shown to have great influence on the toxicity of anaged air mass (Takigawa et al., 2009; Hauptmann et al.,2004; Zhang and Smith, 2003; WHO, 2000). In this study,selective ion analysis for carbonyl-containing compoundswas performed with o-(2,3,4,5,6-pentafluorobenzyl) hydrox-ylamine chloride (PFBHA) as described before (Ebersvilleret al., 2012a). Mixtures of gases and particles were sam-pled with midget impinger apparatuses similar to those de-scribed before (Yu et al., 1995, 1997; Liu et al., 1999b,a).While we could visually see that some PM was collected inthe impinger, we acknowledge that the impingers’ collectionefficiencies are difficult to accurately quantify for PM. Assuch, we can be certain that some of the PM in the mixturewas collected, but we cannot determine unambiguously thepercentage collected. The PFBHA-derivatised measurementsshould, therefore, be thought to represent an indication of thespecies present in the mixture, but not absolute quantificationof the total production of a given species by the system. Im-pinger samples were collected at 1 L min−1 for ca. 3 h.
2.2.3 Inorganic gas phase analysis/chamber conditionmonitoring
Ozone (O3) and nitrogen oxides (NOx) concentrations inthe chamber were monitored continuously (ML9811 OzonePhotometer and ML9841 NOx Oxides of Nitrogen Analyzer,Monitor Labs, Englewood, CO), as were chamber tempera-ture and dew point (DP). These chamber data were recordedwith one-minute resolution using a data acquisition systemconnected to a computer. Prior to each experiment, the O3and NOx meters were calibrated by gas-phase titration usinga NIST standard NO tank and stable O3 source.
2.3 Particle phase analysis
2.3.1 Scanning mobility particle sizer
During all experiments, the size distribution and mass con-centration of the aerosols in the test atmospheres were mon-itored with a Scanning Mobility Particle Sizer (SMPS; TSIInc., St. Paul, MN). All particle-phase analyses were per-formed as described in the Part 1 study.
2.3.2 Teflon membrane filters
Teflon membrane filters (2 µm pore size, 47 mm diameter:Pall Corporation, New York) were used to collect particles atan average flow rate of 17.5 L min−1 for 3 h. Filters were col-lected concurrently with exposure periods. The aerosol massconcentration in the air was calculated by dividing the masscollected on the filter by the total volume of air sampled dur-ing collection. This value was used as a check against thevalue calculated from SMPS data. All particle-phase analy-ses were performed as described in the Part 1 study.
2.4 Biological effects model and measurements ofresponse
Cultured human epithelial lung cells, type A549, were usedas the biological receptor model in this study. A549 humanrespiratory cells are a commercially available cell line thathave been shown to react in a manner that is representative ofthe human airway in vivo (Lieber et al., 1976; ATCC, 2011).The A549 cells were cultured and prepared for exposure asexplained previously (Jaspers et al., 1997; Doyle et al., 2004;Sexton et al., 2004; de Bruijne et al., 2009; Ebersviller et al.,2012a).
The Gas In Vitro Exposure System (GIVES) and Electro-static Aerosol in Vitro Exposure System (EAVES) have alsobeen described in detail previously (Ebersviller et al., 2012a;Lichtveld et al., 2012; de Bruijne et al., 2009; Doyle et al.,2004, 2007; Sexton et al., 2004). Briefly, these systems al-low the cellular toxicity of the gaseous and particle phasecomponents of the same air pollution mixture to be evalu-ated independently of one another, and with no substantivemodification to the sample prior to exposure. This allowscells to encounter pollutants as they might in the ambientenvironment. These exposure systems are not an attempt toreproduce a human deep lung in all of its complexity. Theyare models intended to be biosensors – a means by whichto further characterize the distribution of species among thegas and particle phases, and to indicate which systems war-rant further evaluation for harmful biological effects. This ismeasured by gauging cellular responses to treatment air ex-posures relative to clean air exposures. Gas-only exposures inGIVES lasted 4 h in all experiments. PM-only exposures inEAVES lasted 30 min. Post-exposure treatment and process-ing were performed as described before (Ebersviller et al.,2012a).
2.4.1 Biological effects endpoints (cytotoxicity andinflammation)
Cytotoxicity is expressed as the increase of lactate dehydro-genase (LDH) levels over clean air controls, as outlined be-fore (Ebersviller et al., 2012a). LDH levels were measuredusing a Cytotoxicity Detection Kit (TaKaRa Bio Inc., Tokyo,Japan). Interleukin 8 (IL-8) cytokine release was evaluatedusing an ELISA kit (BD Biosciences, San Diego, CA). In-flammatory response is reported as the increase of IL-8 levelsover clean air controls.
Bar plots of treatment response measurements over controlresponse measurements are produced as data results. Thesevalues are then used to compare exposure results of one treat-ment with another treatment. The latter are presented as ta-bles of relative response ratios. Further description of thesecalculations can be found in Part 1 (Ebersviller et al., 2012a).
Atmos. Chem. Phys., 12, 12293–12312, 2012 www.atmos-chem-phys.net/12/12293/2012/

S. Ebersviller et al.: Part 2: Complex urban VOCs and model PM 12297
2.5 Statistical analysis
All calibration curves were tested by fitting a linear leastsquares line through the data. Calibration factors were calcu-lated for each species to be analysed, with appropriate prop-agation of uncertainty. All instrument measurements are re-ported as the mean±95 % confidence interval, unless oth-erwise stated. The statistical analyses of toxicity endpointswere the same as those used in Part 1 study (Ebersviller et al.,2012a).
2.6 Experimental design
2.6.1 Urban VOC mixture and non-toxic PM
The VOC mixture used in Part 2 experiments was based oncanister samples of 06:00–09:00 a.m. ambient air collectedand analysed by the US EPA in 39 large cities in the US(Seila et al., 1989). UNC researchers previously analysedthis database to create a 200 species average VOC compo-sition of urban air (Jeffries, 1995). From this analysis, UNCresearchers also created a synthetic VOC mixture (consist-ing of 54 VOC species) that was closely based on the EPAanalysis of more than 1000 canisters. This mixture was cre-ated to facilitate accurate and reproducible initial injectionsof urban-like primary VOC emissions into the UNC cham-bers (Jeffries et al., 1985). In the design of this syntheticVOC mixture, care was taken to choose a composition thathad more than 70 % of the carbon represented explicitly inthe mix and to choose the other components to match the av-erage carbon fractions, average carbon number, and branch-ing ratios in each of the VOC groupings (alkanes, alkenes,aromatics, and carbonyls). The lighter compounds of the syn-thetic mixture were produced as a commercially-certified gascylinder, with 10 000 ppmC of the VOCs mixed in nitrogen.The heavier species were blended as a mixture of liquid hy-drocarbons. The result is that only two simple injections intothe chamber are required to achieve a highly reproducibletotal distribution of VOCs. A very large number of chamberexperiments have been conducted with this mix – called Syn-thetic Urban Mixture – and it has also been used in chamberexperiments around the world (Simonaitis et al., 1997; John-son et al., 1997).
In the absence of “seed aerosol”, this complex and highly-reactive systemdoes notcreate any secondary aerosol in situ.Thus, its use will not create any secondary PM (with per-haps inherent toxicity) into the observation of the PM ef-fects. This experimental design for the atmospheric chem-istry environment results in a complex and highly realistic,but not totally quantifiable, set of gas-phase potential toxi-cants that are available for both gas-only exposures, and forpotential uptake by test PM we introduce to the chamber totest PM “effect modification.” The composition of SyntheticUrban Mixture (SynUrb54) is given in Table1. In this Part 2study, SynUrb54 and NOx were used to represent a “typi-
cally reactive” gas-only urban environment (i.e., no primaryPM). In three Part 2 experiments, SynUrb54 was injectedinto the chamber in the dark to a total carbon mixing ratioof 2.00 ppmC with ca. 0.30 ppm of NOx (Table3).
To maintain a system with little ambiguity for PM “effectmodification,” we used the same inherently non-toxic PMfrom the Part 1 study (Ebersviller et al., 2012a). This PM wascreated by nebulising steri-filtered liquid mineral oil (phar-maceutical grade, 100 %) into the chamber, thereby creatingmineral oil aerosol (MOA). For this study, MOA is a conve-nient and sufficiently complex surrogate for ambient PM thatcontains organic material, as described in Part 1. The additionof PM to the chamber during experiments was only done inthe dark (either before sunrise or after sunset), to be presentduring the biological-effects sampling. No experiment had adaylight period in which PM was present.
2.6.2 Chamber conditions and example data
In Part 2 we simulate the complexity of the ambient atmo-sphere by performing both day-long photochemical exper-iments (to produce significant oxidation conditions in ouroutdoor chamber), and shorter night-time experiments (for“blanks” or “thermal-only” conditions). The photochemicalexperiments start in the dark with realistic mixtures of urbanhydrocarbons (i.e., SynUrb54) and NOx that undergo oxida-tion in ambient sunlight. After sunset, chamber contents areretained into the dark period to permit additional samplingand exposures. The experimental operation can be better un-derstood by examining Tables2 and3 and an example exper-iment shown in Figs.2, 3, and4.
In Table2, the chamber experiments are given both an Ex-periment Number, which is a Roman numeral, I to V, anda run date-derived name, e.g. “JN2509”. The biological ex-posure tests periods are given Exposure Labels, which areupper-case letters, A to F (“Expo. Label” in Table2). Moredetails of the conditions of the biological exposures are givenin Table3 using the same Exposure Labels.
Table2 shows that there were two “Clean Air” dark ex-periments, two SynUrb54/NOx sunlit experiments, and oneSynUrb54/NOx dark (i.e., “Fresh with MOA”) experiment.Of the five chamber experiments, three had MOA added inthe dark. One sunlit experiment (Expt. III) had no MOAadded in either “Fresh” or “Aged” periods (Expo. C and E).This was to produce gas-only “Fresh” and gas-only “Aged”exposures for contrast to the “Fresh” (Expt. IV, Expo. D) and“Aged” exposures (Expt. V, Expo. F) with added-PM.
To illustrate the relation among the chemical conditionsand the biological exposures during the sunlit experiments,the time series data for several inorganic and organic speciesfor one experiment (Expt. III) are shown in Figs.2, 3, and4. On each figure, shading is used to indicate “dark” periods,and the actual time for sunrise and sunset are marked at thetop of each plot. VOCs and NOx were injected at 02:30 EDTfor this experiment. In these experiments, we have designated
www.atmos-chem-phys.net/12/12293/2012/ Atmos. Chem. Phys., 12, 12293–12312, 2012

12298 S. Ebersviller et al.: Part 2: Complex urban VOCs and model PM
Table 1.Chemical Compositiond of Synthetic Urban VOC Mixture, SynUrb54 (Jeffries et al., 1985).
Alkanes ppbCa Alkenes ppbCb Aromatics ppbCc
isopentane 86.4 ethene 26.7 toluene 69.0n-butane 73.5 2,3,3-trimethyl-1-butene 16.0 1,2,4-trimethylbenzene 56.0propane 46.1 c-2-pentene 13.5 m-xylene 37.0ethane 38.5 t-2-butene 11.6 benzene 22.03-methylhexane 35.0 propene 8.4 1,3-diethylbenzene 18.0isobutane 32.9 1-octene 8.0 o-xylene 16.0n-pentane 31.1 2-methyl-1-pentene 8.0 p-ethyltoluene 15.04-methylnonane 23.0 1-pentene 8.0 ethylbenzene 11.02-methylpentane 22.0 1-nonene 7.0 n-propalbenzene 11.0n-decane 20.0 2-methylpropene 4.5 m-ethyltoluene 10.02,3-dimethylpentane 17.0 2-methyl-1-butene 4.2 sec-butylbenzene 7.0n-nonane 16.0 2-methyl-2-pentene 3.0 1,2,3,5-tetramethylbenzene 6.0n-heptane 16.0 cyclohexene 1.03-methylpentane 16.0
n-hexane 14.0 Dialkenes ppbC Alkenated Aromatics ppbC
2,2,4-trimethylpentane 13.0 1,3-butadiene 2.1 α-methylstyrene 3.0n-octane 12.0 isoprene 3.02,5-dimethylhexane 11.0 α-pinene 6.0
2,3,4-trimethylhexane 10.0 Aldehydes ppbC
2,3-dimethylbutane 6.0 formaldehyde 10.4methylcyclopentane 11.0 acetaldehyde 11.2cyclohexane 10.0methylcyclohexane 6.0
a 23 alkanes total 566.4 ppbC.b 13 alkenes total 119.9 ppbC; 3 dialkenes total 11.1 ppbC.c 12 aromatics total 278.0 ppbC; 1 alkenated aromatic 3.0 ppbC; and 2 aldehydes total 21.6 ppbC.d All 54 species total to 1000 ppbC or 1 ppmC.
the period in the dark just after injection (but before sunrise)as the “Fresh” condition and the period in the dark after sun-set as the “Aged” condition. These two time-windows wereused to expose cells and to collect additional chemical char-acterization samples. The exposures and chemical character-ization samples were performed in the dark to ensure thatany chemical reactions occurring in the system were pro-ceeding slowly and that substantial modification of the cham-ber contents would not occur during the sampling windows.On these time-series plots, biological exposure windows aredesignated by orange bars. The gas-only exposures occurredduring the times marked by the solid bars, and the PM-onlyexposures occurred during the shorter bars with alternatingorange and black bands. Additional sampling to character-ize the chemical environment during the “Fresh” and “Aged”conditions are designated by the magenta bar and the bluedashed bar. Individual GCMS sampling times are designatedby red circles.
During the particular experiment illustrated (Expt. III, per-formed on JN2509), no PM was added at any point. For ex-periments in which PMwasadded (see Table2), it was in-jected at the beginning of the “Fresh” window or at the be-
ginning of the “Aged” window to permit the gases present tomodify the inherently non-toxic PM. Of course, if PM wasadded to the “Fresh” window, the subsequent day time ox-idation would be affected due to both evaporation of MOAmass to the gas phase, and perhaps due to gain in PM massfrom secondary organic aerosol production on the MOA sur-face. In this case (Expt. IV, performed on ST2310), the ex-periment was used only for “Fresh with MOA” exposure(Expo. D), and the rest of the experiment was discarded.A separate whole-day experiment (Expt. V, performed onST1510) was performed to produce an “Aged with MOA”exposure (Expo. F) in which the PM was added only aftersunset to the otherwise gas-only mixture.
2.6.3 Summary: conditions and exposure strategy
Within these SynUrb54 experiments we used the “Fresh”and “Aged” time-windows to either sample the gas systemwithout PM, or to add MOA to the gas system and sample.This created four different complex gas and PM measure-ment and exposure conditions. To these four conditions weadded two clean air control conditions, resulting in six com-parison conditions necessary to demonstrate the existence of
Atmos. Chem. Phys., 12, 12293–12312, 2012 www.atmos-chem-phys.net/12/12293/2012/

S. Ebersviller et al.: Part 2: Complex urban VOCs and model PM 12299
0.00
0.10
0.20
0.30
0.40
0.50
0.60
0.00
0.10
0.20
0.30
0.40
0.50
0.60
0 1 2 3 4 5 6 7 8 9 10 11 12 13 14 15 16 17 18 19 20 21 22 23
O3
mpp ,ON ,
O
N2
mpp ,
Hours, EDT, Chapel Hill, NC
NO NO2 O3 GIVES Exposure
EAVES ExposurePFBHA Filter GCMS Sample
Sunrise Sunset
Experiment IIIJune 25, 2009
Fig. 2. Time series of ozone (O3), nitric oxide (NO), and nitro-gen dioxide (NO2) during experiment III (JN2509), performed withSynUrb54 and NOx injected in the dark at 02:30 EDT. Color barsrepresent the type and time window for biological exposure sam-pling (GIVES, EAVES), for filter sampling, and for impinger sam-pling for PFBHA carbonyl analysis; red dots represent the time ofVOC sampling for GCMS direct injection analyses.
0
1
2
3
4
5
6
Vb pp ,o it aR gni xiVO
C M
Alkanes at 0230 = 71.3 ppbV0445 = 64.5 ppbV
0 1 2 3 4 5 6 7 8 9 10 11 12 13 14 15 16 17 18 19 20 21 22 23Hours, EDT, Chapel Hill, NC
Sunrise Sunset
Experiment IIIJune 25, 2009
0
5
10
15
20
25
30
35
40
45
50
V X
100
0bpp ,oit aR gni xi
Dilu
�on
Trac
er M
propane/propene
isobutane
butane isopentane
3-methylhexanetoluene m-xylene 1,2,4-trimethylbenzene
Alkanes Alkenes
Aroma�csDilu�on Tracer
PFBHAFilter Collec�on
GCMS Sample GIVES Exposure EAVES Exposure
Fig. 3. Time series of explicit (solid lines) or functionally-grouped(dashed lines) primary (injected) VOC mixing ratios during exper-iment III (JN2509), performed with SynUrb54 and NOx injectedin the dark at 02:30 EDT. Explicitly represented species are not in-cluded in their functional group mixing ratio values. Colored barsand large red dots are as in Fig.2. See Table4 for mixing ratiovalues at specific time points.
0
2
4
6
8
10
12
14
Vbpp , oitaR gn ixiM
0 1 2 3 4 5 6 7 8 9 10 11 12 13 14 15 16 17 18 19 20 21 22 23Hours, EDT, Chapel Hill, NC
Sunrise Sunset
Experiment IIIJune 25, 2009
GIVES Exposure EAVES ExposurePFBHAFilter Collec�onGCMS Sample
15
16
acetaldehyde C3 carbonyl
C3|C4 carbonyl
C3|C4 carbonyl
C5 carbonyl C5|C6 carbonyl C6 carbonyl C6|C7 aldehydearoma�c carbonyl C8|C9 carbonyl C8|C10 carbonyl Subst'd C8|C11 carbonyl
benzaldehyde C8|C11 carbonyl
acetophenone methylbenzaldehyde
Fig. 4. Time series of explicit or type-identified, secondaryVOCs produced during experiment III (JN2509), performed withSynUrb54 and NOx injected in the dark at 02:30 EDT. The sym-bol between carbon number names means “or”; the functionality isspecified if known, the carbon chain length is estimated by retentiontimes. Colored bars and large red dots are as in Fig.2. See Table4for mixing ratio values at specific time points.
PM “effect modification” for complex, urban-like gaseousenvironments. Because of the need for both initial and finalVOC conditions tested with and without PM, five differentexperiments were necessary to generate these six chamberconditions (Expo. A–F; summarized in Table3). As statedabove, all biological exposures for gas-only- and PM-only-effects occurred during “Fresh” or “Aged” conditions, in thedark, either before sunrise or after sunset.
3 Results
The results are organized into sections related to:
1. the temporal changes in the gas-phase NOx, O3, andVOC concentrations as revealed by the gas monitors,the GCMS, and FID measurements;
2. the temporal creation of secondary carbonyl species,some of which were further oxidized, as revealed by di-rect GCMS sampling and GCMS of PFBHA-derivatisedsamples;
3. the demonstration of a lack of secondary PM formationfrom the daytime oxidation of the SynUrb54 VOCs (asrevealed by SMPS measurements); the quantification ofMOA size distributions and mass concentrations follow-ing the injection of MOA into the chamber during darkperiods (before and after the oxidation experiments, asrevealed by SMPS and filter sample measurements);
www.atmos-chem-phys.net/12/12293/2012/ Atmos. Chem. Phys., 12, 12293–12312, 2012

12300 S. Ebersviller et al.: Part 2: Complex urban VOCs and model PM
Table 2.Chamber Experimental Runs and Relevant Conditions.
Identification Experimental Conditions Biological Exposure
Initial Conc. Added MOAa Expo. Labelb
Solar VOC NOx Fresh Aged Fresh Aged NoteExpt. Name Type Exposure ppmC ppm mg m−3 mg m−3
I. AP2808 Clean Air Dark 0.00 0.00 – – A. – 1
II. AU1909 Clean Air, w/MOA
Dark 0.00 0.00 1.56 – B. – 2
III. JN2509 SynUrb54,Gas only
Sunlit(14 h)
2.00 0.30 – – C. E. 3
IV. ST2310 FreshSynUrb54, w/MOA
Dark 2.00 0.30 0.90 – D. – 4
V. ST1510 AgedSynUrb54, w/MOA
Sunlit(12 h)
2.00 0.30 – 0.89 – F. 5
a Mineral Oil Aerosol.b See Table3 for biological exposure condition details.Notes:
1. used in Figs.10, 11; Tables3, 7,2. used in Figs.8, 10, 11; Tables3, 73. used in Figs.2, 5, 3, 4, 6, 10, 11; Tables4, 5, 6, 3, 74. used in Figs.8, 10, 11; Tables5, 3, 75. used in Figs.8, 7, 10, 11; Tables5, 6, 3, 7.
Table 3.Six Exposure Conditions During Blank and Complex Mixture Experiments.
Treatment Mixing Ratio Concentration Relative Humidity
Expo.a Stateb VOC/NOx Mix MOA c VOC Ozone NO NOx PM % %added ppmC ppm ppm ppm mg m−3 In Chamber In Exposure
A. Clean none NDd 0.009 0.007 0.008 0.001 47.8 31.7B. Clean none MOA NDd 0.009 0.007 0.007 1.562 69.2 30.1C. Fresh SynUrb54/NOx 1.80 0.002 0.231 0.304 0.001 74.6 29.9D. Fresh SynUrb54/NOx MOA 1.80 0.003 0.232 0.312 0.898 61.1 38.9E. Aged SynUrb54/NOx 0.86 0.344 0.001 0.085 0.001 35.4 29.6F. Aged SynUrb54/NOx MOA 1.07 0.459 0.002 0.052 0.867 55.2 31.0
a Exposure Label. All exposures occur in dark before (Clean, Fresh) or after (Aged) daylight period.b Chamber state during exposure. Fresh is injected VOC/NOx mixture in dark; Aged is dark period after daytime reaction period.c MOA is mineral oil aerosol added only in dark for exposures B, D, and F. MOA was not present during photo-irradiation.d None detected.All measurements represent the mean value over an entire exposure interval.
4. the consistency of the organic and inorganic gas-phaseconditions and the PM concentrations in each of thesix biological exposures as revealed by matching dataacross experiments;
5. the graphical and tabular biological relative responsesfor the two biological endpoints, inflammation and cel-lular damage, for the six exposure conditions as re-vealed by the biological assays of the cellular media.
Each of these datasets will be briefly highlighted and thelocation of selected results will be cited in figures and tables.
3.1 Primary NOx and VOC oxidation and dilution lossresults
Time-series plots from an example experiment for the con-sumption of NO and VOCs, as well as the resulting pro-duction of O3 and multiple generations of oxidized daughtercompounds are shown in Figs.2–4. The species included inFig. 3 are limited to those found in SynUrb54 (Table1), withspecific, major components represented explicitly and othersgrouped by organic function. Species represented explicitly
Atmos. Chem. Phys., 12, 12293–12312, 2012 www.atmos-chem-phys.net/12/12293/2012/

S. Ebersviller et al.: Part 2: Complex urban VOCs and model PM 12301
Table 4.GCMS Measured VOC species at four times during experiment III (JN2509) using SynUrb54/NOx in Gillings Outdoor Chamber.See Fig.5 for the corresponding chromatograms.
Mixing ratio, ppbV; Time, EDT Mixing ratio, ppbV; Time, EDT
Id. Species 04:45 12:44 15:25 19:00 Id. Species 04:45 12:44 15:25 19:00
1 propane/propene 36.33 24.61 18.15 13.46 30 C8|C9 carbonyl 0.00 0.00 0.00 0.172 isobutane 16.45 6.62 4.40 2.98 31 C8|C10 carbonyl 0.00 0.00 0.98 0.773 acetaldehyde 0.00 3.24 1.13 0.00 32 methylcyclohexane 1.71 0.57 0.29 0.144 butane 36.75 6.74 4.33 2.84 33 2,5-dimethylhexane 2.75 0.16 0.57 0.375 C3 carbonyl 0.00 2.23 3.91 2.80 34 2,3,4-trimethylhexane 2.22 0.85 0.57 0.326 C3|C4 carbonyl 0.00 0.00 1.09 1.30 35 toluene 19.71 8.44 4.99 3.377 isopentane 34.56 11.70 9.64 6.78 36 1-octene 2.00 0.00 0.00 0.008 C3|C4 carbonyl 0.00 9.51 13.93 14.03 37 n-octane 3.00 1.28 0.93 0.299 1-pentene 3.20 0.00 0.00 0.00 38 Subst’d C8|C11 carbonyl 0.00 0.40 0.57 0.5210 n-pentane 12.44 1.77 0.84 0.45 39 ethylbenzene 2.75 1.23 0.78 0.4811 trans-2-butene 5.80 0.00 0.00 0.00 40 m-xylene 9.25 1.05 0.23 0.0612 cis-2-pentene 5.40 0.32 0.00 0.00 41 o-xylene 4.00 1.04 0.50 0.2313 C5 carbonyl 0.00 0.00 0.00 0.56 42 1-nonene 1.56 0.00 0.00 0.0014 2-methylpentane 7.33 7.15 2.58 4.34 43 n-nonane 3.56 0.89 0.36 0.1715 C5|C6 carbonyl 0.00 0.00 0.80 0.22 44 benzaldehyde 0.00 0.00 0.28 0.5516 C6 Carbonyl 0.00 0.00 1.83 1.40 45 α-pinene 1.20 0.00 0.00 0.0017 3-methylpantane 5.33 5.86 5.04 6.39 46 n-propylbenzene 2.44 0.95 0.47 0.3618 C6|C7 aldehyde 0.00 0.00 0.00 1.40 47 m-ethyltoluene 2.22 0.00 0.00 0.0019 2-methyl1-pentene 2.67 0.00 0.00 0.00 48 p-ethyltoluene 3.33 0.36 0.03 0.0020 n-hexane 4.67 2.96 0.87 0.68 49 4-methylnonane 4.60 0.57 0.14 0.0921 methylcyclopentane 3.67 1.09 2.61 1.47 50 C8|C11 carbonyl 0.00 0.00 0.31 0.2322 2,3,3-trimethyl-1-butene 4.57 0.00 0.00 0.00 51 1,2,4-trimethylbenzene 12.44 1.35 0.38 0.2323 benzene 7.33 6.36 5.75 5.87 52 n-decane 4.00 0.63 0.11 0.0624 cyclohexane 3.33 1.23 1.13 0.93 53 sec-butylbenzene 1.40 0.62 0.20 0.0925 2,3-dimethylpentane 4.86 2.91 2.64 0.92 54 1,3-diethylbenzene 3.60 0.78 0.47 0.2626 3-methylhexane 10.00 3.56 0.86 0.57 55 acetophenone 0.00 2.48 2.49 2.0427 2,2,4-trimethylpentane 3.25 1.53 0.64 0.69 56 methylbenzaldehyde 0.00 4.30 4.62 3.7028 n-heptane 4.57 1.74 1.03 1.26 57 1,2,3,5-tetramethylbenzene 1.20 0.70 0.17 0.0629 aromatic carbonyl 0.00 0.00 0.35 0.38
in Fig. 3 are not included in the grouped categories, i.e., theyare not counted twice.
A non-reactive dilution tracer was used to monitor lossesdue to dilution during each experiment (see “DilutionTracer” in Fig. 3). The concentration data presented here,however, were not corrected for this dilution. The data weretabulated in this way to represent the chamber contents dur-ing exposure periods accurately, rather than as measures ofthe reactivities of the species present.
The volume of chamber air needed for the exposures andsampling led to dilution of injected initial reactants prior tosunrise (Figs.2 and3). Significant losses in NO and VOCconcentrations began just after sunrise as a result of chemi-cal reaction. These losses continued until a given species wasconsumed or the oxidant production from photolysis pro-cesses stopped (i.e., the sun set).
To illustrate the types of photochemical transformationsthat we typically observe, four GCMS chromatograms areshown in Fig.5. These chromatograms show the changein the gas-phase VOC composition during the course ofphotochemical ageing during experiment III (performed onJN2509). Observed mixing ratio measurements and peak
identities for hydrocarbon species from Fig.5 are reportedin Table4.
The photochemical ageing of SynUrb54 created a cleartemporal change in composition through the course of theday. The relative rates at which species were consumed wereconsistent with their kinetic rate constants (determined bythe rate at which they react with photochemically-generatedspecies such as hydroxyl radicals and O3; Atkinson, 2000).Olefinic compounds (alkenes) reacted at the greatest rate, andwere completely consumed by midday (Figs.3 and 5; Ta-ble 4). The aromatics and alkanes decayed more slowly, andalmost all of these compounds were still detectable at the endof the day (Fig.3, Table4).
3.2 Secondary carbonyls results
The photochemical degradation of parent compounds led tothe production of multiple generations of (oxidized) daugh-ter compounds, with some species appearing early in theday and others appearing later (as shown in the exampledata in Figs.4 and5; Table4). For many of these oxidizedspecies, authentic standards were not available, or there were
www.atmos-chem-phys.net/12/12293/2012/ Atmos. Chem. Phys., 12, 12293–12312, 2012

12302 S. Ebersviller et al.: Part 2: Complex urban VOCs and model PM
752
51
50
49
48
47
46
45
44
4342
41
40
39
38
3736
35
3433
1110
9
12
8
13
14
15
16
17
18
19
2021
22
23
2425
32
31
30
29
28
27
26
54
53
57
5655
30 35 40 45 50minutes
kCounts
3300 3355 4400 4455 5500mmiinnuutteess
3300 3355 4400 4455 5500mmiinnuutteess
3300 3355 4400 4455 5500mmiinnuutteess
0445
1244
1525
1900
40
30
20
10
0
40
30
20
10
0
40
30
20
10
0
40
30
20
10
0
Fig. 5. FID chromatograms of VOCs during the experiment III(JN2509) using SynUrb54/NOx mixture. Numbers labeling thespecies in the chromatograms correspond to the identification num-bers in Table4 and the time of sample corresponds to the red circlesin Figs.2, 3, and4.
similarities between the mass spectra of an unknown speciesand more than one compound. For instances such as these(in which an unambiguous identification was not possible)daughter compounds are identified in the table as “Cn car-bonyl” (where n is the carbon number of the compound).For “Cn” compounds for which more than one carbon num-ber was possible, a “|” symbol was inserted between pos-sible carbon numbers. Figure4 illustrates the evolution ofseveral generations of select daughter compounds, some ofwhich are present at midday (C3|C4 carbonyl, acetophe-none, methylbenzaldehyde), while others do not develop un-til closer to sundown (C6 carbonyl, C6|C7 aldehyde). More-over, some compounds were produced early in the day andwere then consumed by further reaction (acetaldehyde, C3carbonyl), while others persisted or continued to increase inconcentration until the end of the day (acetophenone, C3|C4carbonyl; refer to Figs.4 and5).
15 20 25 30 35minutes
0
1
2
3
4
5
6
kCounts
15 20 25 30 35minutes
0
1
2
3
4
5
6
kCounts
Expt. III - JN2509Expo. C
Expt. III - JN2509Expo. E
1
2
3
4 8
11
12
6
5
4
3
2
1
0
6
5
4
3
2
1
0
3
2
1
IS
IS
UR
UR
UR
Fig. 6.GCMS selective ion chromatograms for PFBHA-derivatizedsamples from time windows for PFBHA sampling shown in Figs.2,3, and4 for experiment III (JN2509). Top: Exposure C; bottom:Exposure E. See Table6 for key to numbers labeling species. Thepeak labeled “UR” is unreacted PFBHA reagent; the peak labeled“IS” is the internal standard.
Additional sampling using carbonyl-specific analyses(with PFBHA) that occurred over the course of the biolog-ical exposure time-windows are summarized in Table6, andFigs. 6 and7. It should be noted that the chromatogram atthe top of Fig.6 ideally represents the same chamber con-dition as the chromatogram at the top of Fig.7 (i.e., twoinstances of Exposure condition C: Fresh SynUrb54 with-out MOA present). There were small differences in the car-bonyls present in these two “Fresh” exposures. This will bediscussed in more detail below.
One difference between the “Aged” samples for Expts. IIIand V is that the MOA that was added to the mixture inExpt. V was present in the PFBHA sample’s air stream withthe VOCs (PM was not removed from the air stream priorto sampling). What this means for our analysis is that theExpt. V chromatogram likely contains some carbonyls thatwere in the particulate phase. Though it is difficult to ac-curately measure PM collection efficiency for this samplingmethod, the species identified in the chromatogram (Fig.7;Expo. F), and mixing ratios reported in Table6, likely repre-sent a mixture of gaseous and particle-borne carbonyls. Be-cause current chemical sampling techniques are not able tounambiguously determine which phase detected species arein, we do not attempt to make any distinction as to whethercarbonyls present in the sample were in the gas or the parti-cle phase. The mixing ratios of the unknown carbonyls werecalculated using the carbon number of the species closestto it with a positive identification in the chromatogram (2-heptanone for both, Table6).
Atmos. Chem. Phys., 12, 12293–12312, 2012 www.atmos-chem-phys.net/12/12293/2012/

S. Ebersviller et al.: Part 2: Complex urban VOCs and model PM 12303
15 20 25 30 35minutes
kCounts
Expt. V - ST1510No exposure
results reported
Expt. V - ST1510Expo. F
5 6 7
6
5
4
3
2
1
0
15 20 25 30 35minutes
kCounts
6
5
4
3
2
1
0
5 6
1
2
34
11 12
81
UR
UR
Fig. 7. GCMS chromatograms for PFBHA-derivatized samplesfrom time windows for PFBHA sampling in experiment V(ST1510). Top: Exposure none; bottom: Exposure F. See Table6for key to numbers labeling species. The peak labeled “UR” is un-reacted PFBHA reagent; the peak labeled “IS” is the internal stan-dard.
3.3 Particle size and mass results
The particle mass concentrations across all of the exposuresin which no particles were added were close to the limit ofdetection for the SMPS instrument (as determined by the av-erage PM concentrations and 95 % confidence intervals re-ported in Table3). For the experiment in which SynUrb54was photochemically aged and no MOA was added to thechamber (Expt. III), no significant secondary aerosol wasformed in situ (Fig.8; Table3). As stated above, this agreeswith previous experimental results for the photochemical-ageing behaviour of this mixture. The particle mass concen-trations for the exposure periods in which MOA was addedto the chamber were ca. 900× to 1500× higher than theexposures without PM (Table3). A very slight increase inthe mode particle diameter was observed when MOA andSynUrb54 were mixed in the chamber (relative to MOA inclean air; from 233 nm to 269 nm for both SynUrb54/MOAmixtures; Fig.8). The mode particle diameter increased bythe same amount regardless of whether the SynUrb54 was atthe “Fresh” (Expo. D) or “Aged” (Expo. F) condition (Fig.8).
The only detectable species present in the filter samplestaken during this study were components of mineral oilaerosol.
0
2
4
6
8
10
12
10.0 100.0 1000.0
dN/d
logD
p
/100
00, c
m-3
Particle Diameter, nm
Expo. B
Expo. D
Expo. E
Expo. F
Particle Mass Concentrations: Expo. B 1.56 ± 0.03 mg m-3
Expo. D 0.90 ± 0.02 mg m-3 Expo. E 0.00 ± 0.00 mg m-3 Expo. F 0.87 ± 0.02 mg m-3
Fig. 8. Mineral Oil Aerosol (MOA) size distributions for four ex-posure periods: Exposure B occurred during Expt. II (AU1909),“Clean Air with MOA”. Exposure D occurred during Expt. IV(ST2310), “Fresh SynUrb54 with MOA”. Exposure E occurred dur-ing Expt. III (JN2509), “Aged SynUrb without MOA”. Exposure Foccurred during Expt. V (ST1510), “Aged SynUrb54 with MOA”.
3.4 Exposure conditions
The experiments performed in this study resulted in expo-sures with the over-all gas-phase and particle concentrationconditions given in Table3.
It is important to note that the values presented in Table3for VOC mixing ratios are an estimate of the total VOC in thechamber during the gas-phase exposure time-window. Theseestimates were calculated by correcting the initial VOC con-centration (2.00± 0.04 ppmC) for dilution over time. Mea-sured concentrations of identified VOC and carbonyl speciesresulting from both dilution and reaction are presented in (Ta-bles4 and6).
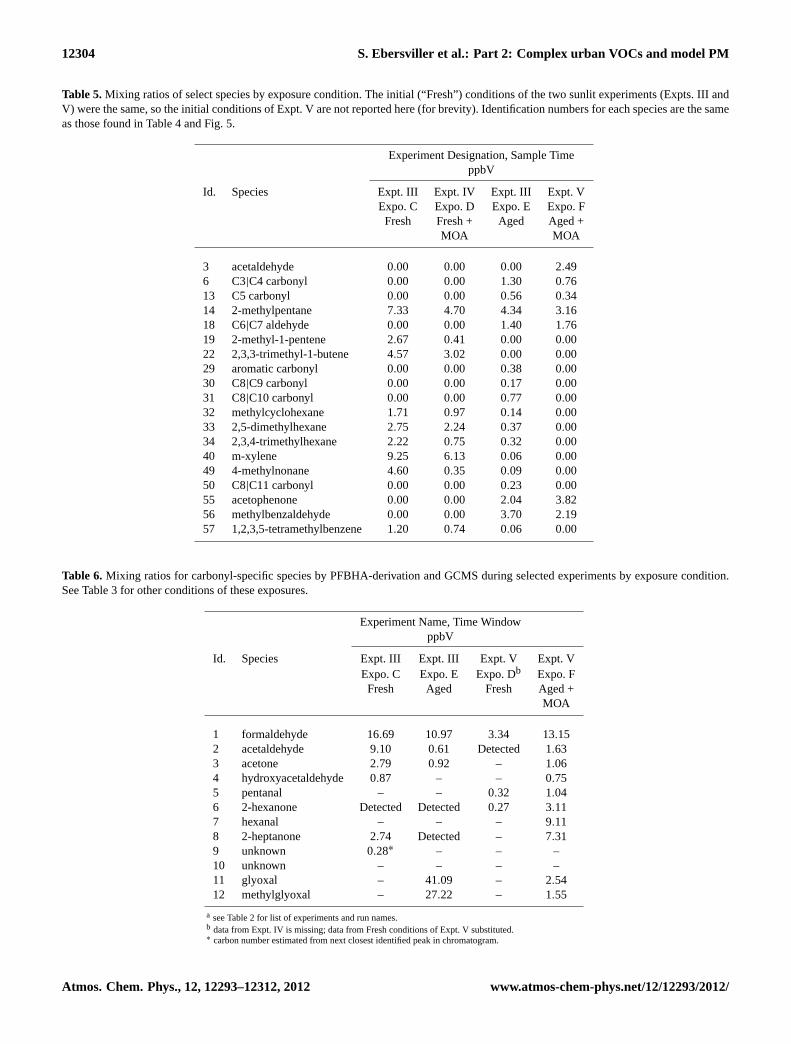
To focus on the differences between the chamber contentsduring each exposure scenario, concentrations measured bydirect GCMS sampling for select species were compiled inTable5. In this table, species’ identification numbers matchthose from Table4 and Fig.5. Chamber conditions matchthose from Table3 and Figs.10and11(Expo. C–F). The ex-posure concentrations for these species vary greatly by con-dition, with the greatest difference between the Fresh andAged mixtures. All of the species present in the Fresh mix-tures had much lower concentrations in the Aged mixtures,to the point that some were undetectable (e.g., 2-methyl-1-pentene and 2,3,3-trimethyl-1-butene). In addition, sev-eral species were only detected in the Aged mixtures (Ta-ble 5). In general, the gas-phase concentration measuredfor each species was lower during the experiment with thelonger sunlit irradiation time (Expo. E: 14.5 h) comparedto the shorter sunlit irradiation time (Expo. F: 12 h). These
www.atmos-chem-phys.net/12/12293/2012/ Atmos. Chem. Phys., 12, 12293–12312, 2012
12304 S. Ebersviller et al.: Part 2: Complex urban VOCs and model PM
Table 5.Mixing ratios of select species by exposure condition. The initial (“Fresh”) conditions of the two sunlit experiments (Expts. III andV) were the same, so the initial conditions of Expt. V are not reported here (for brevity). Identification numbers for each species are the sameas those found in Table4 and Fig.5.
Experiment Designation, Sample TimeppbV
Id. Species Expt. III Expt. IV Expt. III Expt. VExpo. C Expo. D Expo. E Expo. FFresh Fresh + Aged Aged +
MOA MOA
3 acetaldehyde 0.00 0.00 0.00 2.496 C3|C4 carbonyl 0.00 0.00 1.30 0.7613 C5 carbonyl 0.00 0.00 0.56 0.3414 2-methylpentane 7.33 4.70 4.34 3.1618 C6|C7 aldehyde 0.00 0.00 1.40 1.7619 2-methyl-1-pentene 2.67 0.41 0.00 0.0022 2,3,3-trimethyl-1-butene 4.57 3.02 0.00 0.0029 aromatic carbonyl 0.00 0.00 0.38 0.0030 C8|C9 carbonyl 0.00 0.00 0.17 0.0031 C8|C10 carbonyl 0.00 0.00 0.77 0.0032 methylcyclohexane 1.71 0.97 0.14 0.0033 2,5-dimethylhexane 2.75 2.24 0.37 0.0034 2,3,4-trimethylhexane 2.22 0.75 0.32 0.0040 m-xylene 9.25 6.13 0.06 0.0049 4-methylnonane 4.60 0.35 0.09 0.0050 C8|C11 carbonyl 0.00 0.00 0.23 0.0055 acetophenone 0.00 0.00 2.04 3.8256 methylbenzaldehyde 0.00 0.00 3.70 2.1957 1,2,3,5-tetramethylbenzene 1.20 0.74 0.06 0.00
Table 6. Mixing ratios for carbonyl-specific species by PFBHA-derivation and GCMS during selected experiments by exposure condition.See Table3 for other conditions of these exposures.
Experiment Name, Time WindowppbV
Id. Species Expt. III Expt. III Expt. V Expt. VExpo. C Expo. E Expo. Db Expo. FFresh Aged Fresh Aged +
MOA
1 formaldehyde 16.69 10.97 3.34 13.152 acetaldehyde 9.10 0.61 Detected 1.633 acetone 2.79 0.92 – 1.064 hydroxyacetaldehyde 0.87 – – 0.755 pentanal – – 0.32 1.046 2-hexanone Detected Detected 0.27 3.117 hexanal – – – 9.118 2-heptanone 2.74 Detected – 7.319 unknown 0.28∗ – – –10 unknown – – – –11 glyoxal – 41.09 – 2.5412 methylglyoxal – 27.22 – 1.55
a see Table2 for list of experiments and run names.b data from Expt. IV is missing; data from Fresh conditions of Expt. V substituted.∗ carbon number estimated from next closest identified peak in chromatogram.
Atmos. Chem. Phys., 12, 12293–12312, 2012 www.atmos-chem-phys.net/12/12293/2012/
S. Ebersviller et al.: Part 2: Complex urban VOCs and model PM 12305
non-ideal differences in conditions will be further discussedin the Discussion section.
3.5 Biological exposure responses results
Figure9 provides the “key” to the colors and shading of allthe biological response plots and defines the statistical signif-icant markers for each bar. Results are presented in Fig.10,Fig. 11, and in Table7.
All but one of the individual biological effects measure-ments exhibited high precision (i.e., low noise) and the statis-tics for testing differences among exposures were of highpower. The exception was a likely contamination issue withthe assay for the IL-8 response for the Expo. D test. These re-sults have been replaced wherever necessary with an averageof previous Fresh SynUrb54/NOx IL-8 tests, which show lit-tle response above the clean air controls. These averages aremarked in figures in which they appear as Expo. D’ (Figs.10and12, Table7). We determined that the assay for cellulardamage (LDH) for these samples, however, was not contam-inated. Therefore, the exposure in Fig.11 represents the cel-lular response from cells exposed during Expt. IV, and doesnot have a modified label.
Because the exposure times and the relative doses aredifferent for the gas-only system and the PM-only system,the relative results for gas-only exposurescannotbe com-pared with the relative results for PM-only exposures. There-fore, we limit our comparisons to the biological effects ob-served among cells exposedwithin the same exposure system(EAVES and GIVES).
In addition, to facilitate the inter-comparison of responseswithin each endpoint measurement (i.e., IL-8 or LDH), therelative responses induced by each exposure condition arepresented as relative response ratios. These ratios are repre-sented as the response to exposure “i” vs. the response toexposure “j ” and labelled as “Rr[i:j ]”.
The most important of these are:
Rr[A:A] Expo. A – the response to Clean Air is the referencefor all other bars;
Rr[B:A] Expo. B to Expo. A – the relative effect of PM inClean Air when MOA was added in absence of anyVOCs (Expts. I and II, April 2008 and August 2009);
Rr[C:A] Expo. C to Expo. A – the relative effect of “Fresh”VOC gases in absence of MOA (Expts. I and III, April2008 and June 2009);
Rr[D:A] Expo. D to Expo. A – the relative effect of “Fresh”VOC gases in presence of MOA (Expts. I and IV, April2008 and September 2010);
Rr[E:C] Expo. E to Expo. C – the effect of photochemistry ongas-phase toxicity in the absence of MOA (14.5-h sunlitday, Expt. III June 2009);
Rr[F:D] Expo. F to Expo. D – the effect of photochemistry ongas-phase toxicity and the effect of increased gas-phasetoxicity on the toxicity of added MOA following a 12-h sunlit day (Expts. IV and V, both September 2010,occurred duringdifferent but temporally closeexperi-ments)
These relative response ratios are presented tabularly inTable7 and graphically in Fig.12.
4 Discussion
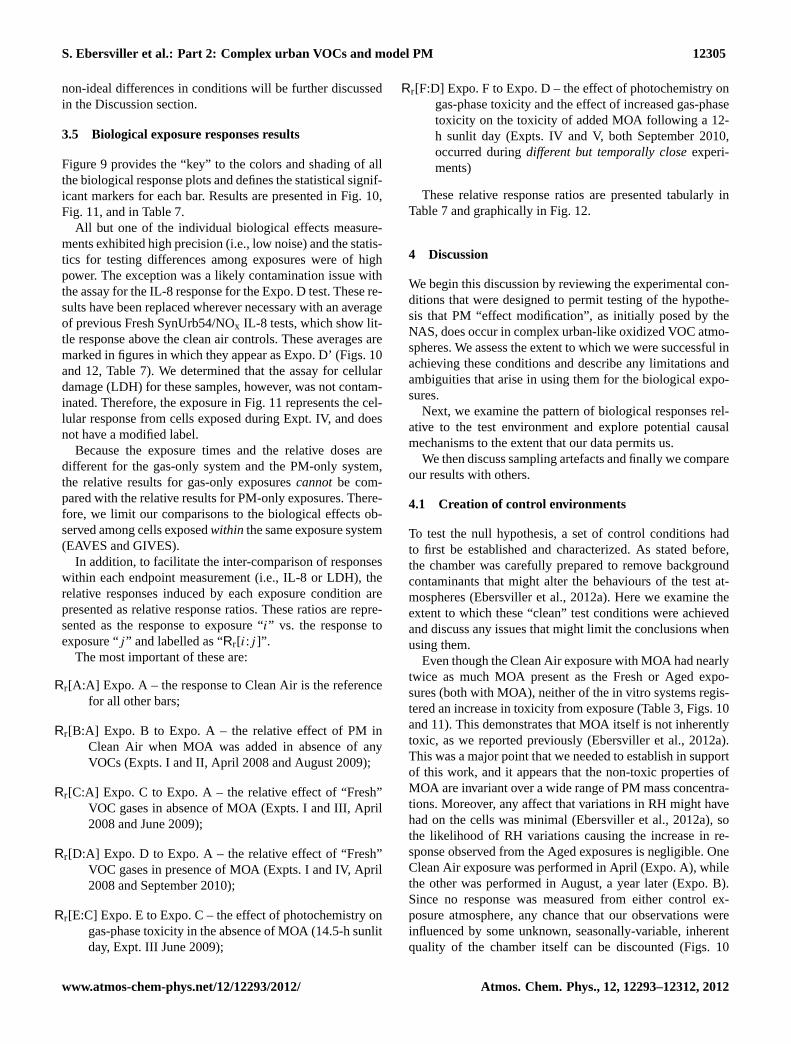
We begin this discussion by reviewing the experimental con-ditions that were designed to permit testing of the hypothe-sis that PM “effect modification”, as initially posed by theNAS, does occur in complex urban-like oxidized VOC atmo-spheres. We assess the extent to which we were successful inachieving these conditions and describe any limitations andambiguities that arise in using them for the biological expo-sures.
Next, we examine the pattern of biological responses rel-ative to the test environment and explore potential causalmechanisms to the extent that our data permits us.
We then discuss sampling artefacts and finally we compareour results with others.
4.1 Creation of control environments
To test the null hypothesis, a set of control conditions hadto first be established and characterized. As stated before,the chamber was carefully prepared to remove backgroundcontaminants that might alter the behaviours of the test at-mospheres (Ebersviller et al., 2012a). Here we examine theextent to which these “clean” test conditions were achievedand discuss any issues that might limit the conclusions whenusing them.
Even though the Clean Air exposure with MOA had nearlytwice as much MOA present as the Fresh or Aged expo-sures (both with MOA), neither of the in vitro systems regis-tered an increase in toxicity from exposure (Table3, Figs.10and11). This demonstrates that MOA itself is not inherentlytoxic, as we reported previously (Ebersviller et al., 2012a).This was a major point that we needed to establish in supportof this work, and it appears that the non-toxic properties ofMOA are invariant over a wide range of PM mass concentra-tions. Moreover, any affect that variations in RH might havehad on the cells was minimal (Ebersviller et al., 2012a), sothe likelihood of RH variations causing the increase in re-sponse observed from the Aged exposures is negligible. OneClean Air exposure was performed in April (Expo. A), whilethe other was performed in August, a year later (Expo. B).Since no response was measured from either control ex-posure atmosphere, any chance that our observations wereinfluenced by some unknown, seasonally-variable, inherentquality of the chamber itself can be discounted (Figs.10
www.atmos-chem-phys.net/12/12293/2012/ Atmos. Chem. Phys., 12, 12293–12312, 2012

12306 S. Ebersviller et al.: Part 2: Complex urban VOCs and model PM
Clean Air (Sham)
Clean Air with MOA
Fresh SynUrb54 Aged SynUrb54
Fresh SynUrb54 with MOA
Aged SynUrb54 with MOA
* Indicates a statistically significant difference in response relative to Clean Air (no MOA) # Indicates a statistically significant difference in response relative to Clean Air with MOA δ Indicates a statistically significant difference in response relative to Fresh (no MOA) φ Indicates a statistically significant difference in response relative to Fresh with MOA γ Indicates a statistically significant difference in response relative to Aged (no MOA)
A. C. E.
B. D. F.
Fig. 9.Key for biological effects response plots in Figs.10and11.
a) b)
A B C D’ E F A B C D’ E F
Fig. 10.The IL-8 inflammatory response of lung cells following exposure to six air mixtures. The response induced by exposure to(a) thegaseous components of each mixture and(b) the particle-phase components of each mixture.
a) b)
A B C D E F A B C D E F
Fig. 11.The LDH Cellular damage following exposure to six air mixtures. The response induced by exposure to(a) the gaseous componentsof each mixture and(b) the particle-phase components of each mixture.
and11). Therefore, with minimal criteria (Ebersviller et al.,2012a), we were successful in creating stable “clean” atmo-spheres in our outdoor chamber that could be used as ourbaseline (“zero effect” exposure).
4.2 Creation and consistency of urban-like atmospheres
To study the dynamic entanglements of the phases in anurban-like environment, we first needed to create airbornemixtures of VOCs that approached the complexity of the am-bient urban environment. The SynUrb54 mixture has beenextensively used and well studied by our research group inthe past, so it was an ideal candidate for use in this study. The“Fresh” conditions in the chamber are a well designed modelfor the observed morning atmospheres in large urban areas.
While the average mixing ratios in some urban areas mayhave changed since the design of the mix, the identities ofthe VOCs likely have not. These conditions are a model thatcan be used to create a highly repeatable set of conditionsmore complex than has been used in other chamber work,which often use only 6 to 10 VOCs in their mixtures. Whenthe SynUrb54 mixture is photochemically oxidized it cre-ates hundreds to thousands of oxidized species in situ, manyof which would be unavailable to researchers attempting toevaluate their toxicity in more-traditional ways. This “Aged”condition in the chamber truly begins to approach the com-plexity of gaseous pollutants in urban areas.
There were some small differences in composition be-tween the two “Fresh” chamber conditions without MOA(Expo. C). Specifically, the presence of certain oxidized
Atmos. Chem. Phys., 12, 12293–12312, 2012 www.atmos-chem-phys.net/12/12293/2012/

S. Ebersviller et al.: Part 2: Complex urban VOCs and model PM 12307
Table 7.Relative Response Ratios for gas-only and PM-only IL-8 and LDH responses to exposures, with and without added MOA.
IL-8 – Irritationb LDH – Cellular Damageb
Exposure Type Exposure Type
Relative Response Ratioa gas-only PM-only gas-only PM-only
Clean Air
Rr[A:A] 1 .0 1.0 1.0 1.0Rr[B:A] w/MOA 1 .2 1.0 1.0 1.2
Fresh SynUrb54 to Clean Air
Rr[C:A] 0.7 2.0 0.9 1.8Rr[D:A] w/MOA 0 .8c 2.1c 1.1 2.0
Aged SynUrb54 to Fresh SynUrb54
Rr[E:C] 8.1 0.6 4.9 0.9Rr[F:D] w/MOA 15.6c 3.0c 11.4 4.4
a Rr[i:j ] means ratio of Expo.i to Expo.j . Refer to Table3 for definitions of Expo. A to F.b Bold entries are statistically significant ratios atp ≤ 0.05.c Values represent comparison toD′ rather thanD – refer to text for explanation.
species in the “Fresh” condition during Expt. III (acetone and2-heptanone; Fig.6) is from low levels of O3 that lingered inthe chamber from the day before (Fig.2 before 02:00), whichlikely reacted with the components of SynUrb54 as they wereinjected into the chamber. This O3 was titrated with NO, butin this instance the VOCs were added concurrently with thetitration, allowing the O3 to oxidise some of the VOCs inthe mix. This small introduction of oxidized species to the“Fresh” mixture was not sufficient to alter the biological ef-fects of the chamber contents (Figs.10–12, and Table7).
We also observed some variability in the “Aged” conditionin the chamber. In particular, there were some day-to-day dif-ferences in the identities and mixing ratios of the oxidizedspecies present (Table6), as well as in the O3 concentrationgenerated by the photochemical ageing process (ca. 110 ppb,refer to Table3). It is important to note that, while some ob-served VOC mixing ratios in the Aged mixtures were lowerwhen MOA was added, others were higher. The differencesin concentration cannot be assigned unambiguously to par-ticle uptake, and may be due to a combination of factors.The presence of MOA in the chamber should, therefore, bethought of as co-incident with these variations in concentra-tion, rather than explicitly causative. Most likely, the reasonthe observed mixing ratios varied from one experiment to thenext had more to do with the differences in the length of theday and, by extension, the extent of reaction in the system.
The goal for these experiments was for substantial repro-ducibility of conditions and exposures for the VOC contain-ing experiments. These experiments were complex and re-quired significant preparation and analysis time. They alsocompeted with other experiments for time in the outdoorchamber, and thus it was not possible to run the five exper-iments in a short time period. Unfortunately this scheduling
issue confounds a “treatment change” (i.e., the presence orabsence of MOA), with a “seasonal change” (i.e., length ofday and its influence on the extent of gas-phase reaction cre-ating toxicant burden). The reality of scheduling, the exe-cution of the run, the complexity of establishing conditions,and simultaneously taking complex measurements resultedin some non-ideal results that will be discussed further be-low.
Some disagreement between direct measurements of thechamber by GCMS and the PFBHA-analysis method is alsoexpected, and should not be seen as a shortcoming in ourdataset. The reason that PFBHA-derivative samples are col-lected directly below the chamber (and not in the laboratory)is that polar compounds can be lost in sample lines. More-over, direct analysis of carbonyl-compounds by GCMS canbe unreliable, while numerous studies have used PFBHA togreat effect (Ebersviller et al., 2012a; Seaman et al., 2006;Liu et al., 2005, 1999a,b; Yu et al., 1997).
The particle size distribution of each exposure atmospherewas continually monitored, so we are able to rule out the ef-fects of particle size variation on the observed toxicologicalresponses (refer to Fig.8). In addition, PM was never intro-duced to the chamber in the presence of sunlight in any of theexperiments presented here, meaning that the particles them-selves were never subjected to the possibility of having theirtoxicity or chemical composition altered by direct reactionwith the sun. Further, the PM composition is a mixture ofalkanes that do not react with ozone and, in the dark, there isno source of hydroxyl radicals. Thus, any increase in the tox-icity of the particle phase was most likely due to its uptakeof gas-phase toxics.
Due to the dynamic nature of the equilibria between thegas and particle phases, it is not possible to absolutely
www.atmos-chem-phys.net/12/12293/2012/ Atmos. Chem. Phys., 12, 12293–12312, 2012
12308 S. Ebersviller et al.: Part 2: Complex urban VOCs and model PM
determine the distribution of a volatile or semi-volatilespecies across the phases with current chemical samplingtechniques. For instance, when chamber contents are sam-pled directly with a GCMS, PM is typically removed via anin-line filter to avoid clogging the injection system and/orcolumn. While this may seem to remove particle-borne com-pounds from the analysis stream, the pressure drop across thefilter is likely to lead to off-gassing of volatile species fromthe back side of the filter, thereby reintroducing them to thesample stream. Other filter sampling artefacts are discussedbelow.
We have demonstrated that we can create a highly com-plex, urban-like system that consists of a mixture of primary,secondary, tertiary and beyond oxidized products, even ifwe can not totally identify and quantify all of the compo-nents. Our systems have some daily variations that lead todifferences in the observed concentrations of some products.Nevertheless, these systems remain highly representative ofurban-like environments and are, therefore, useful in demon-strating the existence of PM “effect modification”, even ifthe cause of the observed effect can not be explicitly iden-tified. Furthermore, the totally unambiguous results of thePart 1 study show that PM effect modification occurs, andwas caused by the uptake of a single VOC by the particle.In this study, even with the variations in the conditions inthe chamber, all SynUrb54-type experiments made similarcomplex mixtures of the same types of compounds that wereused in Part 1, and did not introduce enough ambiguity tothe results to alter our conclusions. It is the integration ofchemical and biological measurements that allows us to seethat species are distributed between the phases, rather thanconcentrated in the gas phase and absent from the condensedphase.
4.2.1 Biological exposures and “effect modification”
Our results clearly show that when a non-toxic PM is addedto these complex oxidized-VOC systems, like in the single-species VOC systems in Part 1, the PM becomes toxic to cellsin the PM-only biological exposure system. This is directproof that in situ generation of gas-phase VOCs that are toxicto cells exposed in the gas-only biological exposure systemcan, in the presence of non-toxic PM, modify that PM to betoxic to cells exposed in the PM-only biological exposuresystem. By extension to real urban atmospheres, the atmo-spheric oxidation of ambient primary VOCs can make other-wise non-toxic PM become toxic in the lungs of exposed hu-mans. This is from atmospheric chemistry and physics pro-cesses phenomena that cannot be ignored when assessing thehealth-related consequences of the presence of PM in urbanenvironments.
Beyond the direct demonstration shown here, atmosphericscientists would like a mechanistic explanation, or a processidentified, to explain observed phenomena. As stated above,the amount of photochemical ageing that occurs in a given
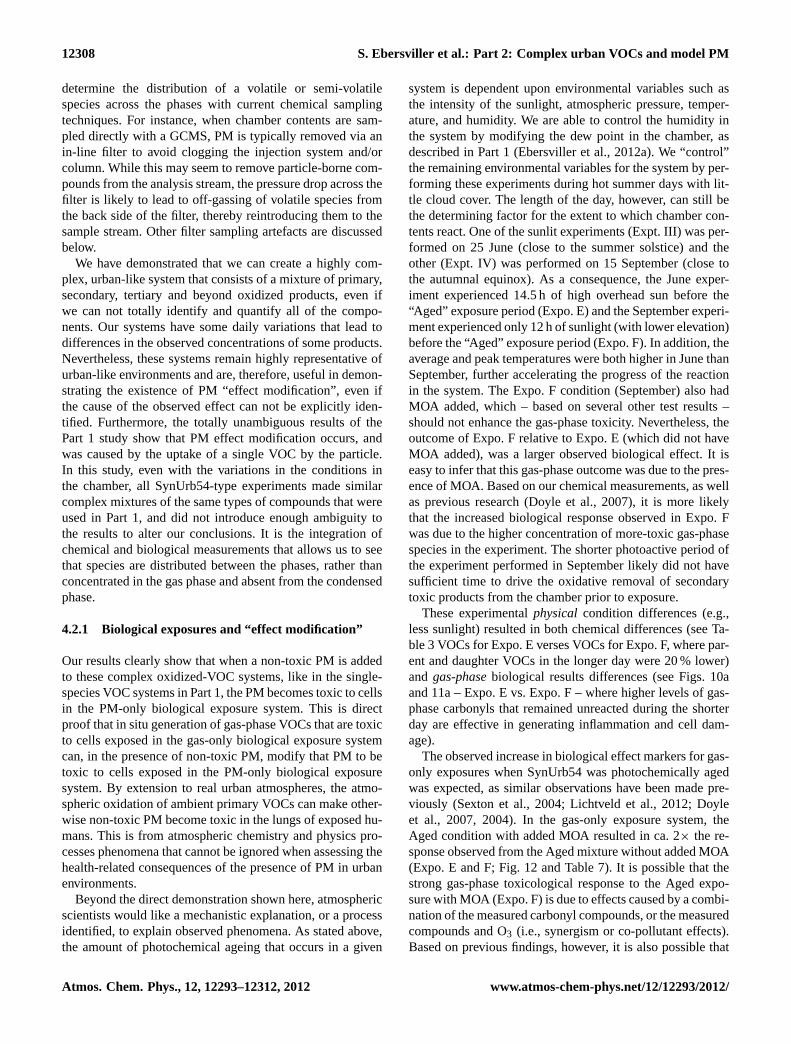
system is dependent upon environmental variables such asthe intensity of the sunlight, atmospheric pressure, temper-ature, and humidity. We are able to control the humidity inthe system by modifying the dew point in the chamber, asdescribed in Part 1 (Ebersviller et al., 2012a). We “control”the remaining environmental variables for the system by per-forming these experiments during hot summer days with lit-tle cloud cover. The length of the day, however, can still bethe determining factor for the extent to which chamber con-tents react. One of the sunlit experiments (Expt. III) was per-formed on 25 June (close to the summer solstice) and theother (Expt. IV) was performed on 15 September (close tothe autumnal equinox). As a consequence, the June exper-iment experienced 14.5 h of high overhead sun before the“Aged” exposure period (Expo. E) and the September experi-ment experienced only 12 h of sunlight (with lower elevation)before the “Aged” exposure period (Expo. F). In addition, theaverage and peak temperatures were both higher in June thanSeptember, further accelerating the progress of the reactionin the system. The Expo. F condition (September) also hadMOA added, which – based on several other test results –should not enhance the gas-phase toxicity. Nevertheless, theoutcome of Expo. F relative to Expo. E (which did not haveMOA added), was a larger observed biological effect. It iseasy to infer that this gas-phase outcome was due to the pres-ence of MOA. Based on our chemical measurements, as wellas previous research (Doyle et al., 2007), it is more likelythat the increased biological response observed in Expo. Fwas due to the higher concentration of more-toxic gas-phasespecies in the experiment. The shorter photoactive period ofthe experiment performed in September likely did not havesufficient time to drive the oxidative removal of secondarytoxic products from the chamber prior to exposure.
These experimentalphysicalcondition differences (e.g.,less sunlight) resulted in both chemical differences (see Ta-ble3 VOCs for Expo. E verses VOCs for Expo. F, where par-ent and daughter VOCs in the longer day were 20 % lower)and gas-phasebiological results differences (see Figs.10aand11a – Expo. E vs. Expo. F – where higher levels of gas-phase carbonyls that remained unreacted during the shorterday are effective in generating inflammation and cell dam-age).
The observed increase in biological effect markers for gas-only exposures when SynUrb54 was photochemically agedwas expected, as similar observations have been made pre-viously (Sexton et al., 2004; Lichtveld et al., 2012; Doyleet al., 2007, 2004). In the gas-only exposure system, theAged condition with added MOA resulted in ca. 2× the re-sponse observed from the Aged mixture without added MOA(Expo. E and F; Fig.12 and Table7). It is possible that thestrong gas-phase toxicological response to the Aged expo-sure with MOA (Expo. F) is due to effects caused by a combi-nation of the measured carbonyl compounds, or the measuredcompounds and O3 (i.e., synergism or co-pollutant effects).Based on previous findings, however, it is also possible that
Atmos. Chem. Phys., 12, 12293–12312, 2012 www.atmos-chem-phys.net/12/12293/2012/

S. Ebersviller et al.: Part 2: Complex urban VOCs and model PM 12309S. Ebersviller et al.: Part 2: Complex urban VOCs and model PM 17
0.0 2.0 4.0 6.0 8.0 10.0 12.0 14.0 16.0 18.0
R[A:A] R[B:A] MOA R[C:A] R[D':A] MOA R[E:C] R[F:D'] MOA
IL-‐8 gas-‐only
Clean Air : Clean Air! Fresh SynUrb54 : Clean Air! Aged SynUrb54 : Fresh SynUrb54!
*!
*!
0.0
1.0
2.0
3.0
4.0
5.0
6.0
R[A:A] R[B:A] MOA R[C:A] R[D':A] MOA R[E:C] R[F:D'] MOA
IL-‐8 PM-‐only
Clean Air : Clean Air! Fresh SynUrb54 : Clean Air! Aged SynUrb54 : Fresh SynUrb54!
*
0.0
2.0
4.0
6.0
8.0
10.0
12.0
14.0
R[A:A] R[B:A] MOA R[C:A] R[D:A] MOA R[E:C] R[F:D] MOA
LDH gas-‐only
Clean Air : Clean Air! Fresh SynUrb54 : Clean Air! Aged SynUrb54 : Fresh SynUrb54!
*!
*!
0.0
1.0
2.0
3.0
4.0
5.0
6.0
R[A:A] R[B:A] MOA R[C:A] R[D:A] MOA R[E:C] R[F:D] MOA
LDH PM-‐only
Clean Air : Clean Air! Fresh SynUrb54 : Clean Air! Aged SynUrb54 : Fresh SynUrb54!
*
Fig. 12.Biological Relative Response Ratios by experiment type, endpoint, and exposure system. This Figure is a graphical representationof the numbers presented in Table7 (∗ indicates ratio is statistically significant atp ≤ 0.5).
vious tests (with SynUrb54 reactive mixtures, as well aswith the exposures in Part 1 (Ebersviller et al., 2012a)), alarger IL-8 response can occur without a matching LDHresponse. In addition, in testing for dose-response relation-ships for a single toxicant, we have found a nearly linearcorrelation between total carbonyl concentration in the ex-posure and LDH response. This same relationship was notfound for IL-8, which exhibited signs of saturation. If the IL-8 response (which requires living, functioning cells to cre-ate the cytokine), is “corrected” for the extent of cell death(as measured by increasing LDH), then the observed IL-8dose-response becomes more linear (Sexton et al., 2012).Thus, our work suggests that inflammatory responses occurat lower exposure levels than do cellular damage responses.A lower response for LDH could merely indicate that, while
the insult was sufficient to elicit an inflammatory responsefrom the cells, it was not enough to result in failure of the cel-lular membrane. Conversely, if an exposure is severe enough,cells may die before they are able to produce enough IL-8 cy-tokine to be detected with commercially-available assays.
As stated above, our study provides some insight, but wasnot designed to unravel the specific chemical causes of gas-phase toxicity by itself, which may vary as chamber exper-imental conditions vary over seasons. Our results are, how-ever, strongly suggestive that oxygenated compounds (espe-cially those that have a carbonyl function) are major com-ponents in the evolution and transfer of toxicity among thephases. While not as unambiguous as we had wished, weconsider these results to be, nevertheless, adequate to sup-port the hypothesis that photochemically-produced gaseous
www.atmos-chem-phys.net/12/1/2012/ Atmos. Chem. Phys., 12, 1–20, 2012
Fig. 12.Biological Relative Response Ratios by experiment type, endpoint, and exposure system. This Figure is a graphical representationof the numbers presented in Table7 (∗ indicates ratio is statistically significant atp ≤ 0.5).
undetected species and/or species present at a trace level con-tributed significantly to the observed response (Doyle et al.,2007). For this reason, we are not attempting to indicatespecific causative agents in our results. Further toxicologi-cal investigation of the species detected will be necessaryfor their relative contributions to the total observed responsesto be accurately measured. Whatever the causal relationshipis eventually discovered to be, when taken in combinationwith the research presented in the Part 1 study in this series(Ebersviller et al., 2012a), we can conclude that gaseous airtoxics partitioned to the PM are likely responsible for the ob-served increase in response.
Occasionally, there were slight variations between theresponses observed in the biological effect markers wemeasured. In comparing response results from inflamma-tion (Fig. 10) with response results from cellular damage
(Fig. 11), the reader should note that, in general, in our pre-vious tests (with SynUrb54 reactive mixtures, as well aswith the exposures in Part 1 (Ebersviller et al., 2012a)), alarger IL-8 response can occur without a matching LDHresponse. In addition, in testing for dose-response relation-ships for a single toxicant, we have found a nearly linearcorrelation between total carbonyl concentration in the ex-posure and LDH response. This same relationship was notfound for IL-8, which exhibited signs of saturation. If the IL-8 response (which requires living, functioning cells to cre-ate the cytokine), is “corrected” for the extent of cell death(as measured by increasing LDH), then the observed IL-8dose-response becomes more linear (Sexton et al., 2012).Thus, our work suggests that inflammatory responses occurat lower exposure levels than do cellular damage responses.A lower response for LDH could merely indicate that, while
www.atmos-chem-phys.net/12/12293/2012/ Atmos. Chem. Phys., 12, 12293–12312, 2012

12310 S. Ebersviller et al.: Part 2: Complex urban VOCs and model PM
the insult was sufficient to elicit an inflammatory responsefrom the cells, it was not enough to result in failure of the cel-lular membrane. Conversely, if an exposure is severe enough,cells may die before they are able to produce enough IL-8 cy-tokine to be detected with commercially-available assays.
As stated above, our study provides some insight, but wasnot designed to unravel the specific chemical causes of gas-phase toxicity by itself, which may vary as chamber exper-imental conditions vary over seasons. Our results are, how-ever, strongly suggestive that oxygenated compounds (espe-cially those that have a carbonyl function) are major com-ponents in the evolution and transfer of toxicity among thephases. While not as unambiguous as we had wished, weconsider these results to be, nevertheless, adequate to sup-port the hypothesis that photochemically-produced gaseoustoxicants can modify non-toxic PM so that it becomes toxicto lung cells.
4.2.2 Discussion of sampling artefacts
There are several possible explanations for the lack ofdetectable species in our filter samples. As we men-tioned above, our chemical analysis concentrates largely oncarbonyl-containing compounds (specifically, aldehydes andketones). There is a long history of evidence that speciesin the condensed phase tend to be organic acids, large hy-drocarbons (such as PAHs), and oligomers (Cao and Jang,2008; Lee et al., 2004; Kamens and Jaoui, 2001). None ofthese classes of compounds would be derivatised by PFBHA,which reacts preferentially with aldehydes and ketones (Liuet al., 1999a,b; Yu et al., 1995). So, by derivatising our fil-ter samples with PFBHA, we may simply have missed thespecies that were present. In future work, multiple filters willbe taken at each time point, thereby allowing us to prefer-entially target more classes of compounds as well as doingmore generalized analysis.
It has been a common practice that, to increase the likeli-hood of having enough material to detect with current anal-ysis methods, researchers typically try to collect as muchparticulate matter as possible. In the past, sampling arte-facts have been documented to alter the chemical compo-sition of particles collected on filters (Sihabut et al., 2005;Volckens and Leith, 2003; Lichtveld et al., 2012). Whilethese studies were mostly limited to large, low volatility com-pounds thought to be the mostly likely in the particle phase,it can be extrapolated that these effects would be greatlyenhanced for species with higher volatilities – to the pointthat some species would be completely removed from theparticle phase during the sampling process. So, while col-lecting as much material as possible might seem to increasethe likelihood of detecting more species in a sample, the in-creased pressure drop across the filter membrane as it be-comes plugged with PM may, in fact, impede the improveddetection of trace species.
Moreover, to be weighed and prepared for analysis accu-rately, filters need to be handled multiple times after sam-pling. Placing particle-laden filters into clean laboratory airwill also interrupt the equilibria between the PM and thespecies partitioned to it – causing partitioned species to leavethe filter by off-gassing to the air. Researchers (ourselves in-cluded) attempt to mitigate these effects by performing anal-yses quickly and efficiently, but it is ultimately unlikely thatthe particles that are eventually analysed will have exactlythe same chemical composition as those that were in the air.In addition, even though our filters were stored in a freezer at−20◦C, prolonged filter storage prior to analysis may havecontributed to the loss of species from our samples.
Any and all of these effects are possible explanations forthe lack of detectable species in the filter samples from theSynUrb54 experiments. All of these concerns point towardthe need for new particle methods (for both chemical analysisand toxicology) that will not interrupt the equilibria betweenPM and the species partitioned to it.
4.3 Potential differences to traditional PM toxicityassessments
This research would not have been possible without the invitro exposure systems that we have available to us. Tradi-tionally, the toxicity of PM is estimated by collecting parti-cles and then resuspending them in a liquid medium that canbe instilled onto in vitro cells or into the lungs of test ani-mals (Steenhof et al., 2011; Tsukue et al., 2010; Weldy et al.,2011; Farina et al., 2011). Additionally, in toxicology stud-ies, filter samples are routinely left exposed to laboratory airfor extended periods of time and/or autoclaved. These samplehandling practices are likely to result in the loss of volatilespecies from the particle phase and, by extension, most likelyeffects such as those we observed here. The EAVES devicehas proven to be a sensitive biosensor for particle-borne airtoxics in this study, as well as previously (Lichtveld et al.,2012; Ebersviller et al., 2012a; de Bruijne et al., 2009). Ifthe device (or one similar to it) could be adapted to act as achemical analysis technique, it is possible that our perceptionof the interplay between gases and particles would undergo aparadigm shift similar to the conception of partitioning the-ory.
4.4 Summary
We have demonstrated that test atmospheres with urban-likecomplexity can be created in our chamber in situ. We alsosuccessfully performed in vitro exposures to measure the bi-ological effects induced by each of the complex test atmo-spheres we generated. Due to the complexity of the dynamicinteractions in our systems, we are unable to unambiguouslyassign observed biological effects to specific species presentin the test atmospheres. This causal assignment is not nec-essary, however, to determine that PM “effect modification”
Atmos. Chem. Phys., 12, 12293–12312, 2012 www.atmos-chem-phys.net/12/12293/2012/

S. Ebersviller et al.: Part 2: Complex urban VOCs and model PM 12311
occurred in our experiments. This not only establishes thatthe hypothesis for this study is true, it demonstrates that thefindings of the Part 1 study can be extended to mixturesof gases with complexity approaching the ambient environ-ment.
5 Conclusions
These results together have important ramifications acrossthe air pollution field. Our studies have shown that gas phaseair toxics can, and are likely to, increase the toxicity of air-borne particulate matter by directly modifying the chemicalcomposition of the PM. These findings can help explain theinability of laboratory-based toxicologists to replicate effectsseen in near-roadway epidemiology studies, which has con-founded the risk assessment field and policy makers alike.The time scale for these inter-phase dynamics is on the or-der of seconds. What this means in the real world is thatvehicle emissions (and other PM) may not be exceptionallytoxic as they enter the atmosphere but, when mixed into anaged or ageing air mass, can change dramatically in compo-sition and biological effect by the time they drift off-road andreach the general population. Therefore, due to their ability toact as pre-concentrators and delivery mechanisms for semi-volatiles and SOA compounds (and their associated toxicity),even relatively “non-toxic” PM (such as salts and minerals)should not be completely discounted from regulation.
What is clear from this work is that the evolution of tox-icity with photochemical ageing and the subsequent shift ofthat toxicity to the PM present in the mixture is an impor-tant component to understanding the response of individualsexposed in the ambient environment. Further, this work re-inforces the importance of the atmosphere itself as a signif-icant source of toxicity in air pollution. This is true for bothgas/particle interactions and the evolution of toxic specieswith photochemical atmospheric ageing. These findings aredemonstrated for test atmospheres with the full complexityof the ambient environment in the final study in this series(Ebersviller et al., 2012b).
Acknowledgements.This research was supported in part by agrant from the National Institute of Environmental Health Sciences(P30ES010126) and in part by support from the Gillings Schoolof Global Public Health’s Gillings Innovation Laboratory Programfor Research and Innovation Solutions. Publication costs wereprovided by the Department of Environmental Sciences andEngineering in the Gillings School of Global Public Health at theUniversity of North Carolina at Chapel Hill.
Edited by: H. Saathoff
References
ATCC: American Type Culture Collection. Cell Biology, Designa-tion: A549, available online at:http://www.atcc.org, 2011.
Atkinson, R.: Atmospheric chemistry of VOCs and NOx, Atmos.Environ., 34, 2063–2101, 2000.
Cao, G. and Jang, M.: Secondary organic aerosol formation fromtoluene photooxidation under various NOx conditions and par-ticle acidity, Atmos. Chem. Phys. Discuss., 8, 14467–14495,doi:10.5194/acpd-8-14467-2008, 2008.
de Bruijne, K., Ebersviller, S., Sexton, K. G., Lake, S., Leith, D.,Goodman, R., Jetter, J., Walters, G., Doyle-Eisele, M., Wood-side, R., Jeffries, H. J., and Jaspers, I.: Design and Testing ofElectrostatic Aerosol In Vitro Exposure System (EAVES): AnAlternative Exposure System for Particles, Inhal. Toxicol., 21,91–101, 2009.
Donahue, N., Robinson, A., Stanier, C., and Pandis, S.: CoupledPartitioning, Dilution, and Chemical Aging of Semivolatile Or-ganics, Environ. Sci. Technol., 40, 2635–2643, 2006.
Doyle, M., Sexton, K. G., Jeffries, H. E., Bridge, K., and Jaspers,I.: Effects of 1,3-Butadiene, Isoprene, and Their PhotochemicalDegradation Products on Human Lung Cells, Environ. HealthPerspect., 112, 1488–1495, 2004.
Doyle, M., Sexton, K., Jeffries, H., and Jaspers, I.: Atmosphericphotochemical transformations enhance 1,3-butadiene-inducedinflammatory responses in human epithelial cells: The role ofozone and other photochemical degradation products, Chem.Biol. Interact., 166, 163–169, 2007.
Dreher, K.: Particulate matter physicochemistry and toxicology: insearch of causality-a critical perspective, Inhal. Toxicol., 12, 45–57, 2000.
Ebersviller, S., Lichtveld, K., Sexton, K. G., Zavala, J., Lin, Y.-H., Jaspers, I., and Jeffries, H. E.: Gaseous VOCs rapidly mod-ify particulate matter and its biological effects – Part 1: SimpleVOCs and model PM, Atmos. Chem. Phys., 12, 12277–12292,doi:10.5194/acp-12-12277-2012, 2012a.
Ebersviller, S., Lichtveld, K., Sexton, K., Zavala, J., Lin, Y.-H.,Jaspers, I., and Jeffries, H.: Gaseous VOCs rapidly modify partic-ulate matter and its biological effects – Part 3: Petroleum dieseland biodiesel oxidations, Atmos. Chem. Phys. Discuss., in prepa-ration, 2012b.
Farina, F., Sancini, G., Mantecca, P., Gallinotti, D., Camatini, M.,and Palestini, P.: The acute toxic effects of particulate matter inmouse lung are related to size and season of collection, Toxicol.Lett., 202, 209–217, 2011.
Hauptmann, M., Lubin, J., Stewart, P., Hayes, R. B., and Blair, A.:Mortality from solid cancers among workers in formaldehyde in-dustries, Am. J. Epidemiol., 159, 1117–1130, 2004.
Hu, D. and Kamens, R.: Evaluation of the UNC toluene-SOA mech-anism with respect to other chamber studies and key model pa-rameters, Atmos. Environ., 41, 6465–6477, 2007.
Jaspers, I., Flescher, E., and Chen, L.: Ozone-induced IL-8 ex-pression and transcription factor binding in respiratory epithelialcells, Am. J. Physiol. Lung Cell Mol. Physiol., 272, L504–L511,1997.
Jeffries, H.: Composition, Chemistry, and Climate of the Atmo-sphere, chap. Photochemical air pollution, 308–348, Van Nos-trand Reinhold, 1995.
Jeffries, H., Sexton, K., Kamens, R., and Holleman, M.: OutdoorSmog Chamber Experiments: Reactivity of Methanol Exhaust,
www.atmos-chem-phys.net/12/12293/2012/ Atmos. Chem. Phys., 12, 12293–12312, 2012

12312 S. Ebersviller et al.: Part 2: Complex urban VOCs and model PM
Environmental Protection Agency, Office of Mobile Sources,Ann Arbor, MI, USA, 1985.
Johnson, G., Nancarrow, P. C., Quintanar, A., and Azzi, M.: SmogChamber Data for Testing Chemical Mechanisms at Low VOCto NOx Ratio Conditions, Final Report to EPA CooperativeAgreement, Tech. Rep. CR-821420, US Environmental Protec-tion Agency, Office of Research and Development, 1997.
Kamens, R. and Jaoui, M.: Modeling Aerosol Formation from a-pinene + NOx in the Presence of Natural Sunlight Using GasPhase Kinetics and Gas-particle Partitioning Theory, Environ.Sci. Technol., 35, 1394–1405, 2001.
Kamens, R., Jeffries, H., Gery, M., Wiener, R., Sexton, K., andHowe, G.: The Impact of a-pinene on Urban Smog Formation:An Outdoor Chamber Study, Atmos. Environ., 15, 969–981,1981.
Lee, S., Jang, M., and Kamens, R.: SOA formation from the pho-tooxidation of a-pinene in the presence of freshly emitted dieselsoot exhaust, Atmos. Environ., 38, 2597–2605, 2004.
Lichtveld, K., Ebersviller, S., Sexton, K. G., Vizuete, W., Jaspers,I., and Jeffries, H. J.: In Vitro Exposures in Diesel Exhaust At-mospheres: Resuspension of PM from Filters versus Direct De-position of PM from Air, Environ. Sci. Technol., 46, 9062–9070,2012.
Lieber, M., Smith, B., Szakal, A., Nelson-Rees, W., and Todaro, G.:A continuous tumor-cell line from a human lung carcinoma withproperties of Type II alveolar epithelial cells, Int. J. Cancer, 17,62–70, 1976.
Liu, X., Jeffries, H., and Sexton, K.: Hydroxyl radical and ozoneinitiated photochemical reaction of 1,3-butadiene, Atmos. Envi-ron., 33, 3005–3022, 1999a.
Liu, X., Jeffries, H., and Sexton, K.: Atmospheric photochmicaldegradation of 1,4-unsaturated dicarbonyls, Environ. Sci. Tech-nol., 33, 4212–4220, 1999b.
Liu, X., Lovell, M., and Lynn, B.: Development of a Method forQuantification of Acrolein-Deoxyguanosine Adducts in DNAUsing Isotope Dilution-Capillary LC/MS/MS and Its Applicationto Human Brain Tissue, Analyt. Chem., 77, 5982–5989, 2005.
NAS: National Research Council Research Priorities for AirborneParticulate Matter, vol. IV Continuing Research Progress, Na-tional Academies Press, Washington, DC, USA, 98–102, 2004.
Pankow, J., Liang, C., Odum, J., and Seinfeld, J.: Gas/Particle Parti-tioning of Semivolatile Organic Compounds to Model Inorganic,Organic, and Ambient Smog Aerosols, Environ. Sci. Technol.,31, 3086–3092, 1997.
Schlesinger, R., Kaunzli, N., Hidy, G., Gotschi, T., and Jerrett, M.:The health relevence of ambient particulate matter characteris-tics: coherence of toxicological and epidemiological inferences,Inhal. Toxicol., 18, 95–125, 2006.
Seaman, V., Charles, J., and Cahill, T.: A Sensitive Method for theQuantification of Acrolein and Other Volatile Carbonyls in Am-bient Air, Analyt. Chem., 78, 2405–2412, 2006.
Seila, R. L., Lonneman, W. A., and Meeks, S. A.: Determination ofC2 to C12 ambient air hydrocarbons in 39 U.S. cities from 1984through 1986, Tech. Rep. EPA/600/3-89/056, US EnvironmentalProtection Agency, Office of Research and Development, Atmo-spheric Research and Exposure Assessment Laboratory, 1989.
Sexton, K. G., Jeffries, H. J., Jang, M., Kamens, R. M., Doyle, M.,Voicu, I., and Jaspers, I.: Photochemical products in urban mix-tures enhance inflammatory responses in lung cells, Inhal. Toxi-col., 16, 107–114, 2004.
Sexton, K. G., Lin, Y.-H., Lichtveld, K., Ebersviller, S., Vizuete, W.,and Jaspers, I.: Dynamic gaseous air pollutant generation sys-tems for toxicity studies using cultured cells, Inhal. Toxicol., inpreparation, 2012.
Sihabut, T., Ray, J., Northcross, A., and McDow, S.: Sampling ar-tifact estimates for alkanes, hopanes, and aliphatic carboxylicacids, Atmos. Environ., 39, 6945–6956, 2005.
Simonaitis, R., Meagher, J. F., and Bailey, E. M.: Evaluation of thecondensed carbon bond (CB-IV) mechanism against smog cham-ber data at low VOC and NOx concentrations, Atmos. Environ.,31, 27–43, 1997.
Steenhof, M., Gosens, I., Strak, M., Godri, K. J., Hoek, G., Cassee,F. R., Mudway, I. S., Kelly, F. J., Harrison, R. M., Lebret, E.,Brunekreef, B., Janssen, N. A., and Pieters, R. H.: In vitro toxi-city of particulate matter (PM) collected at different sites in theNetherlands is associated with PM composition, size fraction andoxidative potential – the RAPTES project, Part Fibre Toxicol., 8,1–15, 2011.
Takigawa, T., Wang, B.-L., Sakano, N., Wang, D.-H., Ogino, K.,and Kishi, R.: A longitudinal study of environmental risk factorsfor subjective symptoms associated with sick building syndromein new dwellings, Sci. Total Environ., 407, 5223–5228, 2009.
Tsukue, N., Okumura, H., Ito, T., Sugiyama, G., and Nakajima, T.:Toxicological evaluation of diesel emissions on A549 cells, Tox-icol. In Vitro, 24, 363–369, 2010.
Volckens, J. and Leith, D.: Effects of Sampling Bias on Gas-ParticlePartitioning of Semivolatile Compounds, Atmos. Environ., 37,3385–3393, 2003.
Weldy, C. S., Wilkerson, H. W., Larson, T. V., Stewart, J. A., andKavanagh, T. J.: Diesel particulate exposed macrophages alterendothelial cell expression of eNOS, iNOS, MCP1, and glu-tathione synthesis genes, Toxicol. In Vitro, 25, 2064–2073, 2011.
WHO: Air Quality Guidelines for Europe, European Series, WHORegional Publications, Copenhagen, Denmark, 2nd edn., 2000.
Yu, J., Jeffries, H. E., and Le Lacheur, R.: Identifying AirborneCarbonyl Compounds in Isoprene Atmospheric PhotooxidationProducts by Their PFBHA Oximes Using Gas Chromatogra-phy/Ion Trap Mass Spectrometry, Environ. Sci. Technol., 29,1923–1932, 1995.
Yu, J., Jeffries, H., and Sexton, K. G.: Atmospheric photo oxidationof alkylbenzenes – I. Carbonyl product analyses, Atmos. Envi-ron., 31, 2261–2280, 1997.
Zhang, J. and Smith, K.: Indoor air pollution: a global health con-cern, Br. Med. Bull., 68, 209–225, 2003.
Atmos. Chem. Phys., 12, 12293–12312, 2012 www.atmos-chem-phys.net/12/12293/2012/