gdpe0787icr- thailand power market outlook …... 2004–april 2015 ... 8.1.1 egat, company overview...
TRANSCRIPT

REFERENCE CODE GDPE0787ICR | PUBLICATION DATE JUNE 2015
THAILAND POWER MARKET OUTLOOK TO 2025, UPDATE 2015 – MARKET TRENDS, REGULATIONS,
AND COMPETITIVE LANDSCAPE

Thailand Power Market Outlook to 2025, Update 2015 – Market Trends, Regulations, and Competitive Landscape 2 © GlobalData. This report is a licensed product and is not to be copied, reproduced, shared or resold in any form.
THAILAND POWER MARKET OUTLOOK TO 2025, UPDATE 2015 – MARKET TRENDS, REGULATIONS, AND COMPETITIVE LANDSCAPE
Executive Summary
Thailand’s Power Sector Outlook
Although Thailand is not one of the Four Asian
Tigers, its economic performance during the 2000–
2014 period was nonetheless impressive. Gross
Domestic Product (GDP) – at constant prices –
increased at an average growth rate of XX%
between 2000 and 2007. However, integration with
the global economy has meant rough patches,
such as in 2009 when the GDP declined at a
negative XX%, and in 2011 and 2014 when growth
was very low at XX% and XX% respectively.
Overall, the GDP increased at a Compound Annual
Growth Rate (CAGR) of XX% between 2000 and
2014. Growth has meant an increase in power
consumption, led by the industrial and business
sectors. The increased use of electrical equipment
in the residential sector has also driven power
demand, causing it to mirror GDP trends, as shown
in the following figure.
Power Market, Thailand, Gross Domestic Product ($bn) and Annual Power Consumption (TWh), 2000–2014
2000
2001
2002
2003
2004
2005
2006
2007
2008
2009
2010
2011
2012
2013
2014
Ann
ual p
ower
con
sum
ptio
n (T
Wh)
GD
P ($
bn)
GDP (constant prices) Annual power consumption Source: GlobalData; IMF, 2015 TWh: Terawatt hour
Annual power consumption stood at XX TWh in
2000, which increased to XX TWh in 2014 at a
CAGR of XX%. Annual power generation also
increased, from XX TWh to XX TWh at a CAGR of
XX%. Most of the additional power generated
came from gas and coal.
Thailand Power Market Outlook to 2025, Update 2015 – Market Trends, Regulations, and Competitive Landscape 4 © GlobalData. This report is a licensed product and is not to be copied, reproduced, shared or resold in any form.
Table of Contents
THAILAND POWER MARKET OUTLOOK TO 2025, UPDATE 2015 – MARKET TRENDS, REGULATIONS, AND COMPETITIVE LANDSCAPE
1 Table of Contents
1 Table of Contents ....................................................................................................................... 4
1.1 List of Tables ...................................................................................................................... 7
1.2 List of Figures ..................................................................................................................... 8
2 Introduction ................................................................................................................................. 9
2.1 GlobalData Report Guidance ............................................................................................ 10
3 Thailand, Power Market, Snapshot ........................................................................................... 11
3.1 Thailand, Power Market, Macro-economic Factors ........................................................... 11
3.2 Thailand, Power Market, Supply Security .......................................................................... 13
3.3 Thailand, Power Market, Opportunities ............................................................................. 14
3.4 Thailand, Power Market, Challenges ................................................................................. 14
4 Thailand, Power Market, Market Analysis ................................................................................. 16
4.1 Thailand, Power Market, Supply Structure ........................................................................ 16
4.2 Thailand, Power Market, Key Market Players .................................................................... 16
4.3 Thailand, Power Market, Financial Deals .......................................................................... 17
4.3.1 Deal Volume and Value Analysis, 2004–April 2015 ....................................................... 17
4.3.2 Deals by Type, 2014 ..................................................................................................... 19
4.4 Thailand, Power Market, Demand Structure ...................................................................... 19
4.4.1 Power Consumption by Sector, 2014 ............................................................................ 22
5 Thailand, Power Market, Regulatory Scenario .......................................................................... 23
5.1 Thailand, Power Market, Key Electricity Policies ............................................................... 23
5.1.1 Power Development Plan, 2012–2030 .......................................................................... 23
5.1.2 New Power Development Plan (2015–2036) ................................................................. 24
5.1.3 Sustainable Alternative Energy Development Strategy .................................................. 24
5.2 Energy Efficiency .............................................................................................................. 25
5.3 Small Power Producer and Very Small Power Producer Programs ................................... 25
6 Thailand, Power Market, Capacity and Generation Overview ................................................... 27
Thailand Power Market Outlook to 2025, Update 2015 – Market Trends, Regulations, and Competitive Landscape 5 © GlobalData. This report is a licensed product and is not to be copied, reproduced, shared or resold in any form.
Table of Contents
THAILAND POWER MARKET OUTLOOK TO 2025, UPDATE 2015 – MARKET TRENDS, REGULATIONS, AND COMPETITIVE LANDSCAPE
6.1 Thailand, Power Market, Cumulative Installed Capacity by Fuel Type, 2014 ..................... 27
6.2 Thailand, Power Market, Cumulative Installed Capacity and Annual Power Generation, 2000–2025 ........................................................................................................................ 28
6.2.1 Cumulative Installed Thermal Power Capacity and Annual Thermal Power Generation, 2000–2025 ................................................................................................................... 31
6.2.2 Cumulative Installed Hydropower Capacity and Annual Hydropower Generation, 2000–2025 ............................................................................................................................. 35
6.2.3 Cumulative Installed Renewable Power Capacity and Annual Renewable Power Generation, 2000–2025 ................................................................................................ 39
7 Thailand, Power Market, Transmission and Distribution Overview ............................................ 43
7.1 Thailand, Power Market, Transmission Overview .............................................................. 43
7.2 Thailand, Power Market, Distribution Overview ................................................................. 44
7.3 Thailand, Power Market, Grid Interconnection................................................................... 46
7.3.1 Power Imports and Exports, 2000–2014........................................................................ 46
7.4 Thailand, Power Market, Smart Grid Development ........................................................... 48
8 Thailand, Power Market, Competitive Landscape: Snapshot of Leading Power Generating Companies ............................................................................................................................... 49
8.1 Key Companies in the Thailand Power Market, EGAT ...................................................... 49
8.1.1 EGAT, Company Overview ........................................................................................... 49
8.1.2 EGAT, Business Description ......................................................................................... 49
8.1.3 EGAT, SWOT Analysis ................................................................................................. 51
8.2 Key Companies in the Thailand Power Market, Ratchaburi Electricity Generating Holding Public Company Limited (RATCH) .................................................................................... 55
8.2.1 RATCH, Company Overview ......................................................................................... 55
8.2.2 RATCH, Business Description ....................................................................................... 55
8.2.3 RATCH, SWOT Analysis ............................................................................................... 56
8.3 Key Companies in the Thailand Power Market, EGCO ..................................................... 60
8.3.1 EGCO, Company Overview ........................................................................................... 60
8.3.2 EGCO, Business Description ........................................................................................ 60
Thailand Power Market Outlook to 2025, Update 2015 – Market Trends, Regulations, and Competitive Landscape 6 © GlobalData. This report is a licensed product and is not to be copied, reproduced, shared or resold in any form.
Table of Contents
THAILAND POWER MARKET OUTLOOK TO 2025, UPDATE 2015 – MARKET TRENDS, REGULATIONS, AND COMPETITIVE LANDSCAPE
8.3.3 EGCO, SWOT Analysis ................................................................................................. 61
8.4 Key Companies in the Thailand Power Market, Glow Energy Public Company Ltd ........... 65
8.4.1 Glow Energy Public Company Ltd., Company Overview ............................................... 65
8.4.2 Glow Energy Public Company Ltd., Business Description ............................................. 65
8.4.3 Glow Energy Public Company Ltd., SWOT Analysis ..................................................... 67
9 Appendix................................................................................................................................... 72
9.1 Market Definitions ............................................................................................................. 72
9.1.1 Power ............................................................................................................................ 72
9.1.2 Installed Capacity .......................................................................................................... 72
9.1.3 Electricity Generation .................................................................................................... 72
9.1.4 Electricity Consumption ................................................................................................. 72
9.1.5 Coal-Fired Power Plant ................................................................................................. 72
9.1.6 Hydropower Plant .......................................................................................................... 72
9.1.7 Nuclear Power............................................................................................................... 72
9.1.8 Renewable Energy Resources ...................................................................................... 73
9.2 Abbreviations .................................................................................................................... 73
9.3 Bibliography ...................................................................................................................... 74
9.4 GlobalData’s Methodology ................................................................................................ 76
9.4.1 Coverage ...................................................................................................................... 76
9.4.2 Secondary Research and Analysis ................................................................................ 76
9.4.3 Primary Research and Analysis..................................................................................... 77
9.5 Disclaimer ......................................................................................................................... 78

Thailand Power Market Outlook to 2025, Update 2015 – Market Trends, Regulations, and Competitive Landscape 7 © GlobalData. This report is a licensed product and is not to be copied, reproduced, shared or resold in any form.
Table of Contents
THAILAND POWER MARKET OUTLOOK TO 2025, UPDATE 2015 – MARKET TRENDS, REGULATIONS, AND COMPETITIVE LANDSCAPE
1.1 List of Tables
Table 1: Power Market, Thailand, Gross Domestic Product ($bn), Population (million), and Annual Power
Consumption (TWh), 2000–2020 ................................................................................................. 13
Table 2: Power Market, Thailand, Market Share of Power Generation Companies (%), 2014..................... 17
Table 3: Power Market, Thailand, Deal Value ($bn) and Number of Deals, 2004–April 2015 ...................... 18
Table 4: Power Market, Thailand, Deals by Type (%), 2014 ...................................................................... 19
Table 5: Power Market, Thailand, Annual Power Consumption (TWh), 2000–2025 .................................... 21
Table 6: Power Market, Thailand, Power Consumption by Sector (%), 2014 .............................................. 22
Table 7: Power Market, Thailand, Expected Capacity Addition (MW), 2012–2019 ..................................... 23
Table 8: Power Market, Thailand, Expected Capacity Addition (MW), 2020–2030 ..................................... 23
Table 9: Power Market, Thailand, Energy Savings by Economic Sector, 2030 ........................................... 25
Table 10: Power Market, Thailand, Adder Feed-in Premiums, 2013 ............................................................ 26
Table 11: Power Market, Thailand, Cumulative Installed Capacity Share by Fuel Type (%), 2014 ................ 27
Table 12: Power Market, Thailand, Cumulative Installed Capacity (GW) and Annual Power Generation
(TWh), 2000–2025 ...................................................................................................................... 30
Table 13: Power Market, Thailand, Leading Thermal Power Plants, 2015.................................................... 32
Table 14: Power Market, Thailand, Cumulative Installed Thermal Power Capacity (GW) and Annual Thermal
Power Generation (TWh), 2000–2025 ......................................................................................... 35
Table 15: Power Market, Thailand, Leading Hydropower Plants, 2015 ........................................................ 36
Table 16: Power Market, Thailand, Cumulative Installed Hydropower Capacity (GW) and Annual Hydropower
Generation (TWh), 2000–2025 .................................................................................................... 38
Table 17: Power Market, Thailand, Leading Renewable Power Plants, 2015 ............................................... 40
Table 18: Power Market, Thailand, Cumulative Installed Renewable Power Capacity (GW) and Annual
Renewable Power Generation (TWh), 2000–2025 ....................................................................... 42
Table 19: Power Market, Thailand, Transmission Line Length (Ckm), 2000–2020 ....................................... 44
Table 20: Power Market, Thailand, Distribution Line Length (Ckm), 2000–2020 .......................................... 45

Thailand Power Market Outlook to 2025, Update 2015 – Market Trends, Regulations, and Competitive Landscape 8 © GlobalData. This report is a licensed product and is not to be copied, reproduced, shared or resold in any form.
Table of Contents
THAILAND POWER MARKET OUTLOOK TO 2025, UPDATE 2015 – MARKET TRENDS, REGULATIONS, AND COMPETITIVE LANDSCAPE
Table 21: Power Market, Thailand, Annual Power Imports and Exports (TWh), 2000–2014 ......................... 47
Table 22: Power Market, Thailand, EGAT, SWOT Analysis ......................................................................... 51
Table 23: Power Market, Thailand, RATCH, SWOT Analysis....................................................................... 57
Table 24: Power Market, Thailand, EGCO, SWOT Analysis ........................................................................ 62
Table 25: Power Market, Thailand, Glow Energy Public Company Limited, SWOT Analysis ........................ 67
Table 26: Abbreviations .............................................................................................................................. 73
1.2 List of Figures
Figure 1: Power Market, Thailand, Gross Domestic Product ($bn), Population (million), and Annual Power
Consumption (TWh), 2000–2020 ................................................................................................. 12
Figure 2: Power Market, Thailand, Market Share of Power Generation Companies (%), 2014..................... 17
Figure 3: Power Market, Thailand, Deal Value ($bn) and Number of Deals, 2004–April 2015 ...................... 18
Figure 4: Power Market, Thailand, Deals by Type (%), 2014 ...................................................................... 19
Figure 5: Power Market, Thailand, Annual Power Consumption (TWh), 2000–2025 .................................... 20
Figure 6: Power Market, Thailand, Power Consumption by Sector (%), 2014 .............................................. 22
Figure 7: Power Market, Thailand, Cumulative Installed Capacity by Fuel Type (%), 2014 .......................... 27
Figure 8: Power Market, Thailand, Cumulative Installed Capacity (GW) and Annual Power Generation
(TWh), 2000–2025 ...................................................................................................................... 29
Figure 9: Power Market, Thailand, Cumulative Installed Thermal Power Capacity (GW) and Annual Thermal
Power Generation (TWh), 2000–2025 ......................................................................................... 34
Figure 10: Power Market, Thailand, Cumulative Installed Hydropower Capacity (GW) and Annual Hydropower
Generation (TWh), 2000–2025 .................................................................................................... 37
Figure 11: Power Market, Thailand, Cumulative Installed Renewable Power Capacity (GW) and Annual
Renewable Power Generation (TWh), 2000–2025 ....................................................................... 41
Figure 12: Power Market, Thailand, Annual Power Imports and Exports (TWh), 2000–2014 ......................... 47

Thailand Power Market Outlook to 2025, Update 2015 – Market Trends, Regulations, and Competitive Landscape 9 © GlobalData. This report is a licensed product and is not to be copied, reproduced, shared or resold in any form.
THAILAND POWER MARKET OUTLOOK TO 2025, UPDATE 2015 – MARKET TRENDS, REGULATIONS, AND COMPETITIVE LANDSCAPE
Introduction
2 Introduction
Thailand is a developing country with a liberalized economy and a developed infrastructure. It has
a constitutional monarchy form of government, wherein the head of state is a monarch who acts
within the guidelines of the country’s constitution. Thailand is a member of international
organizations such as the Asia-Pacific Economic Cooperation (APEC), the Association of South
East Asian Nations (ASEAN), and the United Nations Conference on Trade and Development
(UNCTAD).
Thailand’s liberalized economy attracts a large amount of Foreign Direct Investment (FDI), ranking
the 11st best destination in the world for FDI in 2011 (BOI, 2011). This is due to its well-developed
infrastructure and strong government support via incentives from the Board of Investment of
Thailand (BOI). The BOI acts under the Ministry of Industry to encourage investment from both
domestic and foreign sources.
The economy is mainly export-driven. Its rising dependence on international trade makes it highly
vulnerable to volatility in the world market, and it was affected negatively by the global economic
recession in 2008. However, it recovered considerably by 2012 with an estimated Gross Domestic
Product (GDP) of $XX billion at current prices, equating to annual growth of XX%, followed by XX%
in 2013. In 2014, the GDP growth rate fell to a negative XX% due to political tension, which slowed
consumption, investment, and government spending. The services sector accounted for the largest
share of GDP with XX% in 2014, followed by the industrial sector with XX% and the agricultural
sector with XX% (CIA, 2015).
The power regulatory structure is multi-layered, although the Electricity Generating Authority of
Thailand (EGAT) is the most important entity in the power market. The Department of Alternative
Energy and Efficiency (DAEE) is responsible for implementing national policy on energy efficiency,
renewable energy, and water sources.
Renewable sources are expected to show the highest growth in the power mix in the future. As
agriculture is a primary occupation, the government intends to use agricultural waste for electricity
generation. However, power is predominantly generated by thermal sources at present, mainly
from gas-fired power plants; in 2014, thermal power accounted for XX% of installed capacity. The
country has been using its domestic gas resources for power generation, but depleting gas
Thailand Power Market Outlook to 2025, Update 2015 – Market Trends, Regulations, and Competitive Landscape 10 © GlobalData. This report is a licensed product and is not to be copied, reproduced, shared or resold in any form.
THAILAND POWER MARKET OUTLOOK TO 2025, UPDATE 2015 – MARKET TRENDS, REGULATIONS, AND COMPETITIVE LANDSCAPE
Introduction
reserves mean that the government is looking to expand its energy mix by introducing nuclear
power, for which feasibility studies are in progress.
2.1 GlobalData Report Guidance
The executive summary highlights the key growth trends in Thailand’s power market.
Chapter three provides a snapshot of the key parameters that affect the power sector, as well
as key points about the power market.
Chapter four provides an analysis of the power market.
Chapter five details the regulatory control of the power market and the inward foreign
investment scenario.
Chapter six provides information on the cumulative installed capacity and annual generation
trends, by individual generation source.
Chapter seven describes the power Transmission and Distribution (T&D) infrastructure and
provides information on interconnectors with neighboring countries. It also covers electricity
imports and exports and upcoming grid-related projects.
Note: All 2014 market numbers provided in the report are estimates, except where actual data were
available.

Thailand Power Market Outlook to 2025, Update 2015 – Market Trends, Regulations, and Competitive Landscape 22 © GlobalData. This report is a licensed product and is not to be copied, reproduced, shared or resold in any form.
THAILAND POWER MARKET OUTLOOK TO 2025, UPDATE 2015 – MARKET TRENDS, REGULATIONS, AND COMPETITIVE LANDSCAPE
Thailand, Power Market, Market Analysis
4.4.1 Power Consumption by Sector, 2014
The industrial sector accounted for the highest share of consumption in 2014 with an estimated
XX%; followed by trade, commerce, and other services with XX%; the residential sector with XX%;
and the agriculture sector with XX%. The remaining XX% came from other smaller sectors.
Figure 6: Power Market, Thailand, Power Consumption by Sector (%), 2014
Industrial
Trade, commerce, and other services
Residential
Agriculture and fisheriesOther
Source: GlobalData
Table 6: Power Market, Thailand, Power Consumption by Sector (%), 2014
Sector Share
Industrial
Trade, commerce, and other services
Residential
Agriculture and fisheries
Other
Source: GlobalData
Thailand Power Market Outlook to 2025, Update 2015 – Market Trends, Regulations, and Competitive Landscape 28 © GlobalData. This report is a licensed product and is not to be copied, reproduced, shared or resold in any form.
THAILAND POWER MARKET OUTLOOK TO 2025, UPDATE 2015 – MARKET TRENDS, REGULATIONS, AND COMPETITIVE LANDSCAPE
Thailand, Power Market, Capacity and Generation Overview
6.2 Thailand, Power Market, Cumulative Installed Capacity and Annual Power Generation, 2000–2025
Thailand had a total installed capacity of XX GW in 2014, having grown at a CAGR of XX% from
XX GW in 2000. Thermal power accounted for the largest share with XX%, or XX GW; followed by
hydropower with XX% or XX GW; and renewable power with XX% or XX GW.
In 2000, thermal power accounted for XX%, or XX GW, of the total installed capacity, followed by
hydropower with XX% or XX GW, and renewable energy sources with XX% or XX GW.
Total installed capacity is expected to grow at a CAGR of XX% from XX GW in 2015 to XX GW in
2025. Thermal power will grow at a lower CAGR of XX% to represent XX% of the total capacity in
2025. Hydropower is expected to grow at a CAGR of XX%, accounting for a XX% share of the
2025 total capacity. Renewable power is expected to grow from XX GW in 2015 to XX GW in 2025,
registering the highest rate of increase in capacity with a CAGR of XX%. This is due to the
government’s encouragement of renewable capacity installation, driven by tax incentives and
benefits. Thailand has also started harnessing solar energy and municipal waste to generate
power, which will further augment installed renewable capacity. Nuclear power has been ruled out
for now and the government is planning to address energy security issues by installing new coal-
based thermal power plants and renewable energy sources.
Power generation grew at a CAGR of XX% from XX TWh in 2000 to XX TWh in 2014. In 2014,
thermal power accounted for XX% of total annual generation, while hydropower and renewable
sources accounted for XX% and XX% respectively. Total power generation is expected to grow at
a CAGR of XX%, from XX TWh in 2015 to XX TWh in 2025. During the same period, renewable
power generation is expected to grow at a rate of XX%, followed by hydropower generation at
XX%, and thermal power generation at XX%.
Thailand Power Market Outlook to 2025, Update 2015 – Market Trends, Regulations, and Competitive Landscape 29 © GlobalData. This report is a licensed product and is not to be copied, reproduced, shared or resold in any form.
THAILAND POWER MARKET OUTLOOK TO 2025, UPDATE 2015 – MARKET TRENDS, REGULATIONS, AND COMPETITIVE LANDSCAPE
Thailand, Power Market, Capacity and Generation Overview
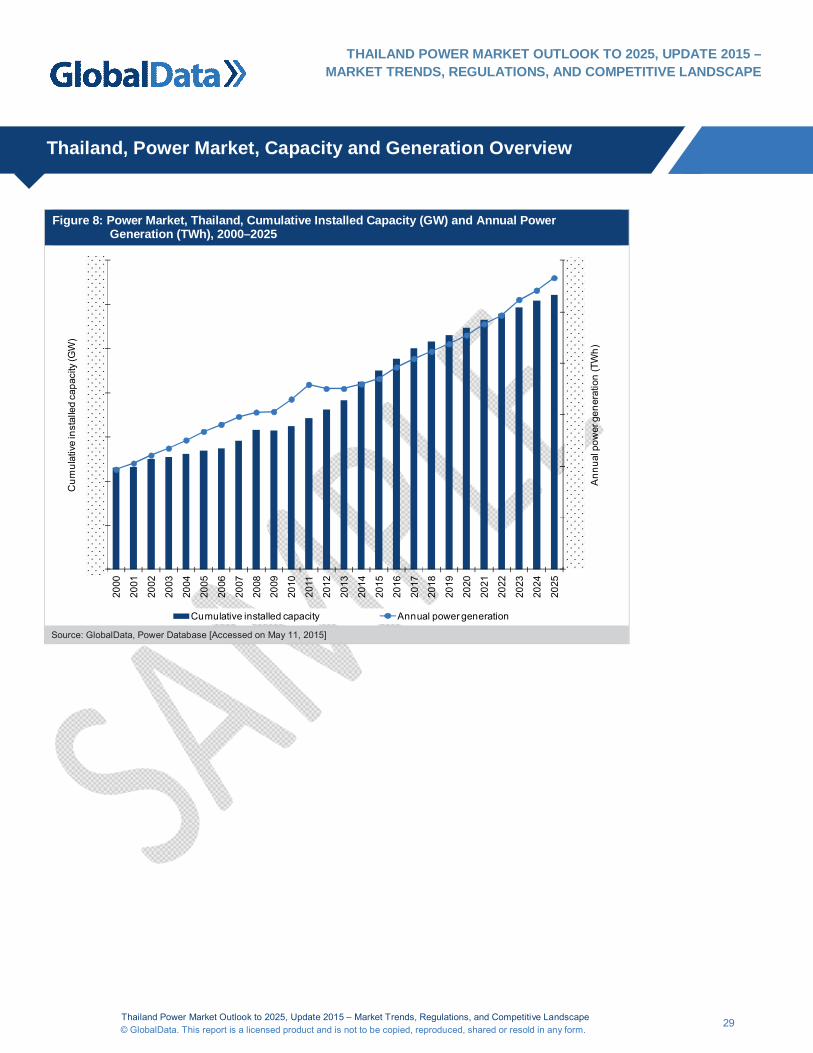
Figure 8: Power Market, Thailand, Cumulative Installed Capacity (GW) and Annual Power Generation (TWh), 2000–2025
2000
2001
2002
2003
2004
2005
2006
2007
2008
2009
2010
2011
2012
2013
2014
2015
2016
2017
2018
2019
2020
2021
2022
2023
2024
2025
Ann
ual p
ower
gen
erat
ion
(TW
h)
Cum
ulat
ive
inst
alle
d ca
paci
ty (G
W)
Cumulative installed capacity Annual power generation Source: GlobalData, Power Database [Accessed on May 11, 2015]
Thailand Power Market Outlook to 2025, Update 2015 – Market Trends, Regulations, and Competitive Landscape 30 © GlobalData. This report is a licensed product and is not to be copied, reproduced, shared or resold in any form.
THAILAND POWER MARKET OUTLOOK TO 2025, UPDATE 2015 – MARKET TRENDS, REGULATIONS, AND COMPETITIVE LANDSCAPE
Thailand, Power Market, Capacity and Generation Overview
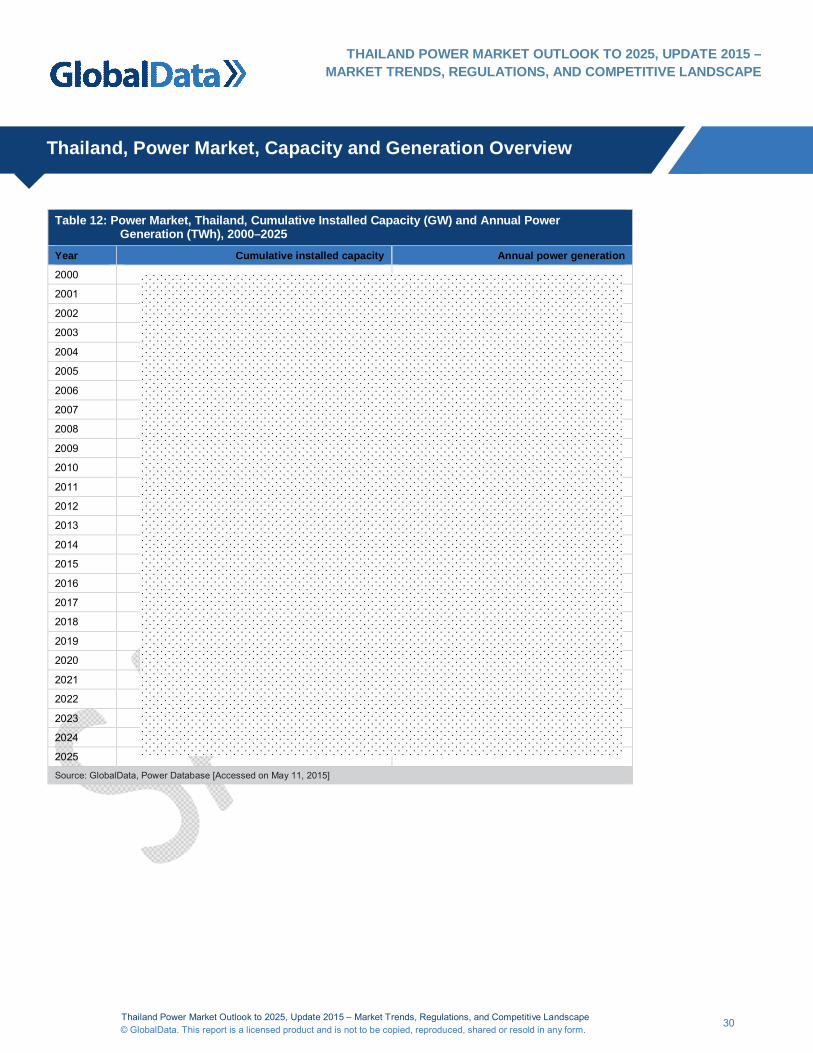
Table 12: Power Market, Thailand, Cumulative Installed Capacity (GW) and Annual Power Generation (TWh), 2000–2025
Year Cumulative installed capacity Annual power generation
2000
2001
2002
2003
2004
2005
2006
2007
2008
2009
2010
2011
2012
2013
2014
2015
2016
2017
2018
2019
2020
2021
2022
2023
2024
2025
Source: GlobalData, Power Database [Accessed on May 11, 2015]
Thailand Power Market Outlook to 2025, Update 2015 – Market Trends, Regulations, and Competitive Landscape 72 © GlobalData. This report is a licensed product and is not to be copied, reproduced, shared or resold in any form.
Appendix
THAILAND POWER MARKET OUTLOOK TO 2025, UPDATE 2015 – MARKET TRENDS, REGULATIONS, AND COMPETITIVE LANDSCAPE
9 Appendix
9.1 Market Definitions
9.1.1 Power
Power refers to the rate of production, transfer or energy use, usually related to electricity. It is
measured in Watts (W) and often expressed in kilowatts (kW) or Megawatts (MW). It is also known
as real power or active power.
9.1.2 Installed Capacity
Installed capacity refers to the generator’s nameplate capacity as stated by the manufacturer, or
the maximum rated output of a generator under given conditions. It is given in Megawatts (MW) on
a nameplate affixed to the generator.
9.1.3 Electricity Generation
Electricity generation refers to the process of generating electricity from other forms of energy. It
also refers to the amount of electricity produced, expressed in Gigawatt hours (GWh).
9.1.4 Electricity Consumption
Electricity consumption is the sum of electricity generated, plus imports, minus exports and
transmission and distribution losses. It is measured in Gigawatt hours (GWh).
9.1.5 Coal-Fired Power Plant
A coal-fired power plant produced electricity from the combustion of coal.
9.1.6 Hydropower Plant
A hydropower plant is a plant in which the turbine generators are driven by falling or flowing water.
9.1.7 Nuclear Power
Nuclear power is the energy released from the fission of nuclear fuel in a reactor.

Thailand Power Market Outlook to 2025, Update 2015 – Market Trends, Regulations, and Competitive Landscape 73 © GlobalData. This report is a licensed product and is not to be copied, reproduced, shared or resold in any form.
Appendix
THAILAND POWER MARKET OUTLOOK TO 2025, UPDATE 2015 – MARKET TRENDS, REGULATIONS, AND COMPETITIVE LANDSCAPE
9.1.8 Renewable Energy Resources
Renewable energy resources are those that provide energy that is naturally replenished but limited
in the amount of energy available per unit of time. Biomass, geothermal, solar, small hydropower
and wind are examples of renewable resources.
9.2 Abbreviations
Table 26: Abbreviations AMR Automatic Meter Reading
APEC Asia-Pacific Economic Cooperation
ASEAN Association of South East Asian Nations
BOI Board of Investment of Thailand
CAGR Compound Annual Growth Rate
CCGT Combined-Cycle Gas Turbine
Cogen Cogeneration
Ckm Circuit kilometer
DAEE Department of Alternative Energy and Efficiency
EGAT Electricity Generating Authority of Thailand
EGCO Electricity Generating Public Company Limited
FDI Foreign Direct Investment
FiT Feed-in Tariff
GDP Gross Domestic Product
GHG Greenhouse Gas
GW Gigawatt
GWh Gigawatt hour
HVDC High-Voltage Direct-Current
IPP Independent Power Producer
ktoe kilometric ton of oil equivalent
kV kilovolt
kW kilowatt
MEA Metropolitan Electricity Authority
mmcfd million cubic feet per day
MoU Memorandum of Understanding
MVA Megavolt Ampere
MW Megawatt
PDP Power Development Plan
PEA Provincial Electricity Authority
PPA Power Purchase Agreement
Thailand Power Market Outlook to 2025, Update 2015 – Market Trends, Regulations, and Competitive Landscape 74 © GlobalData. This report is a licensed product and is not to be copied, reproduced, shared or resold in any form.
Appendix
THAILAND POWER MARKET OUTLOOK TO 2025, UPDATE 2015 – MARKET TRENDS, REGULATIONS, AND COMPETITIVE LANDSCAPE
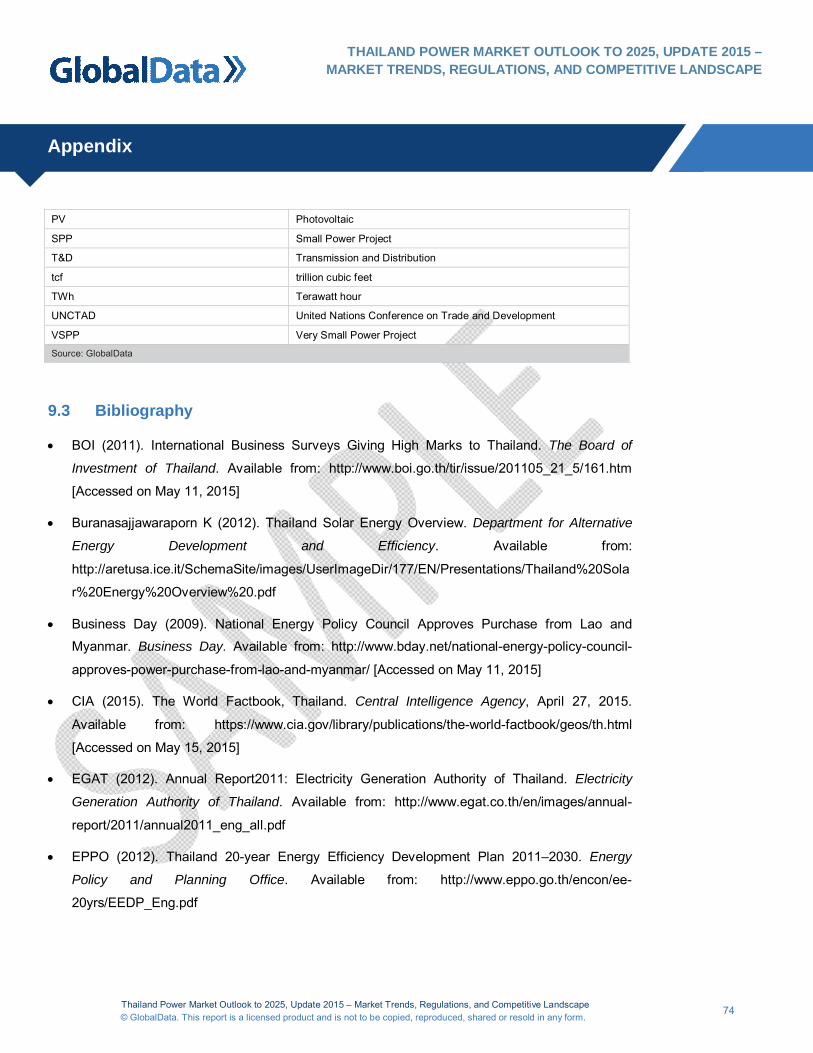
PV Photovoltaic
SPP Small Power Project
T&D Transmission and Distribution
tcf trillion cubic feet
TWh Terawatt hour
UNCTAD United Nations Conference on Trade and Development
VSPP Very Small Power Project
Source: GlobalData
9.3 Bibliography
BOI (2011). International Business Surveys Giving High Marks to Thailand. The Board of
Investment of Thailand. Available from: http://www.boi.go.th/tir/issue/201105_21_5/161.htm
[Accessed on May 11, 2015]
Buranasajjawaraporn K (2012). Thailand Solar Energy Overview. Department for Alternative
Energy Development and Efficiency. Available from:
http://aretusa.ice.it/SchemaSite/images/UserImageDir/177/EN/Presentations/Thailand%20Sola
r%20Energy%20Overview%20.pdf
Business Day (2009). National Energy Policy Council Approves Purchase from Lao and
Myanmar. Business Day. Available from: http://www.bday.net/national-energy-policy-council-
approves-power-purchase-from-lao-and-myanmar/ [Accessed on May 11, 2015]
CIA (2015). The World Factbook, Thailand. Central Intelligence Agency, April 27, 2015.
Available from: https://www.cia.gov/library/publications/the-world-factbook/geos/th.html
[Accessed on May 15, 2015]
EGAT (2012). Annual Report2011: Electricity Generation Authority of Thailand. Electricity
Generation Authority of Thailand. Available from: http://www.egat.co.th/en/images/annual-
report/2011/annual2011_eng_all.pdf
EPPO (2012). Thailand 20-year Energy Efficiency Development Plan 2011–2030. Energy
Policy and Planning Office. Available from: http://www.eppo.go.th/encon/ee-
20yrs/EEDP_Eng.pdf

Thailand Power Market Outlook to 2025, Update 2015 – Market Trends, Regulations, and Competitive Landscape 75 © GlobalData. This report is a licensed product and is not to be copied, reproduced, shared or resold in any form.
Appendix
THAILAND POWER MARKET OUTLOOK TO 2025, UPDATE 2015 – MARKET TRENDS, REGULATIONS, AND COMPETITIVE LANDSCAPE
EPPO (2012c). Summary of Thailand Power Development Plan: 2012–2030. Energy Policy
and Planning Office. Available from: http://www.eppo.go.th/power/PDP2010-r3/PDP2010-
Rev3-Cab19Jun2012-E.pdf
Hutapea M (2011). “Thailand’s Natural Gas Reserves Set to Deplete in 18 years”. The
Nation/Asia News Network, June 6, 2011. Available from:
http://www.eiwatch.org/2011/06/thailands-natural-gas-reserves-set-to-deplete-in-18-years/
[Accessed on May 11, 2015]
IMF (2015). International Monetary Fund, World Economic Outlook Database, April 2015
[database]. Available from:
http://www.imf.org/external/pubs/ft/weo/2015/01/weodata/weoselco.aspx?g=2001&sg=All+coun
tries [Accessed on May 10, 2015]
NTPC (2012). The Lao–Thai Relationship on Electricity Supply. Nam Theun 2 Power
Company. Available from:
http://www.namtheun2.com/index.php?option=com_content&view=article&id=55&Itemid=72
[Accessed on May 11, 2015]
Nunt-Jaruwong S (2012). Thailand Renewable Energy Policy: The Potential for Electricity from
Dendro Power. National Research Institute. Available from:
http://www.nri.org/projects/biomass/conference_papers/thailand_renewable_energy_policy_su
mmary.pdf
PEA (2012). PEA Moves Further Towards a “Smart Grid” with Their Newly Announced Smart
Grid Roadmap Project. PEA Smart Grid. Available from: http://161.200.85.41/pea-smartgrid/
[Accessed on May 11, 2015]
Praiwan Y (2015). “Power plan aims to cut reliance on gas”, Bangkok Post, April 9, 2015.
Available from: http://www.bangkokpost.com/business/news/522911/power-plan-aims-to-cut-
reliance-on-gas [Accessed on: May 12, 2015]
Smart Thai (2011). Thailand–EU Co-operation Facility Phase II (TEC II). Smart/Intelligent Grid
Development and Deployment in Thailand. Available from:
http://eeas.europa.eu/delegations/thailand/documents/eu_thailand/project_fiche_242677_en.p
df

Thailand Power Market Outlook to 2025, Update 2015 – Market Trends, Regulations, and Competitive Landscape 76 © GlobalData. This report is a licensed product and is not to be copied, reproduced, shared or resold in any form.
Appendix
THAILAND POWER MARKET OUTLOOK TO 2025, UPDATE 2015 – MARKET TRENDS, REGULATIONS, AND COMPETITIVE LANDSCAPE
Thongrung W (2012). Without More Coal Plants, Power Bills to Double in 2017”. The Nation,
May 28, 2015. Available from: http://www.nationmultimedia.com/business/Without-more-coal-
plants-power-bills-to-double-in--30193509.html [Accessed on May 11, 2015]
Thongrun W (2015). April launch for Power Development Plan”, The Nation, January 14, 2015.
Available from: http://www.nationmultimedia.com/business/April-launch-for-Power-
Development-Plan-30251851.html [Accessed on: May 11, 2015]
Tordesillas C (2012). Myanmar to Cut Gas Exports to Thailand to Address Power Shortages.
Asian Power. Available from: http://asianpower.com/regulation/news/myanmar-cut-gas-
exports-hailand-address-power-shortage [Accessed on May 12, 2015]
9.4 GlobalData’s Methodology
GlobalData’s dedicated research and analysis teams consist of experienced professionals with
advanced statistical expertise and marketing, market research and consulting backgrounds in the
energy industry.
GlobalData adheres to the codes of practice of the Market Research Society (www.mrs.org.uk) and
Strategic and Competitive Intelligence Professionals (www.scip.org).
All of GlobalData’s databases are continuously updated and revised. The following methodology
has been followed for the collection and analysis of data presented in this report.
9.4.1 Coverage
This report covers Thailand’s power market, examining the market structure and providing
historical generation, capacity and consumption forecasts until 2025. It also looks at the market’s
regulatory structure, import and export trends, competitive landscape and leading active and
upcoming power projects.
9.4.2 Secondary Research and Analysis
The capacity, generation and consumption data is collected and validated using a number of
secondary resources including but not limited to:
Government agencies, ministry websites, industry associations, the World Bank, IMF, and
statistical databases

Thailand Power Market Outlook to 2025, Update 2015 – Market Trends, Regulations, and Competitive Landscape 77 © GlobalData. This report is a licensed product and is not to be copied, reproduced, shared or resold in any form.
Appendix
THAILAND POWER MARKET OUTLOOK TO 2025, UPDATE 2015 – MARKET TRENDS, REGULATIONS, AND COMPETITIVE LANDSCAPE
Company websites, annual reports, financial reports, analyst reports and investor
presentations
Industry trade journals, market reports and other literature
GlobalData’s proprietary databases such as the Capacity and Generation Database, Power
Plant Database and Transmission and Distribution Database
Further to this, the following secondary information is collected and analyzed to project Thailand’s
power market scenario to 2025, analyzing factors such as:
Macro-economic scenario
Government regulations, policies and targets
Government and private sector investment
Contract and deal announcements
Utility expansion plans
The sector’s historical track record
Other qualitative insights built through secondary research and analysis of company websites,
annual reports, investor presentations, industry and trade journals, and data from industry
associations
9.4.3 Primary Research and Analysis
Secondary research is further complemented through primary interviews with industry participants
to verify the market numbers obtained through secondary research and obtain first-hand
information on industry trends.
The participants are drawn from a diverse set of backgrounds, including power producers,
equipment manufacturers, industry associations, government bodies, utilities, distributors, and
academia. The participants include but are not limited to C-level executives, industry consultants,
academic experts, business development and sales managers, purchasing managers, plant
managers, government officials and industry spokespersons.

Thailand Power Market Outlook to 2025, Update 2015 – Market Trends, Regulations, and Competitive Landscape 78 © GlobalData. This report is a licensed product and is not to be copied, reproduced, shared or resold in any form.
Appendix
THAILAND POWER MARKET OUTLOOK TO 2025, UPDATE 2015 – MARKET TRENDS, REGULATIONS, AND COMPETITIVE LANDSCAPE
9.5 Disclaimer
All Rights Reserved.
No part of this publication may be reproduced, stored in a retrieval system or transmitted in any
form by any means, electronic, mechanical, photocopying, recording or otherwise, without the prior
permission of the publisher, GlobalData.
This report is a licensed product and should not to be reproduced without prior permission.