generating ecological hypotheses from biomass spectra
TRANSCRIPT

Vol. 13: 151-166, 1983 MARINE ECOLOGY - PROGRESS SERIES Mar. Ecol. Prog. Ser.
Published August 30
Generating ecological hypotheses from biomass spectra using causal analysis: a benthic example*
Peter Schwinghamer
Marine Ecology Laboratory, Bedford Institute of Oceanography, P. 0. Box 1006, Dartmouth, Nova Scotia B2Y 4.42. Canada
ABSTRACT: Benthic communities in the Bay of Fundy are characterized by the distribution of biomass among logarithmic size classes of organisms ranging from 0.25 p m to 64 mm equivalent spherical diameter. This distribution, a biornass spectrum, exhibits features that are conservative over a wide range of environmental conditions and over a seasonal cycle, having 3 distinct size groups of heterotrophic organisms: grain surface dwellers (bacteria), interstitial fauna (rneiofauna), and macro- scopic surface dwellers (rnacrofauna). Causal analysis was used to construct plausible, hypothetical models of interactions among macrofauna, meiofauna, micro-algae, bacteria, and environmental variables. In the models, macrofaunal biomass was largely a function of exogenous predation and sediment disturbance, meiofauna were most abundant in fluid, fine-grained sedirnents where algal biornass was high, and there was evidence of size-dependent competition for food between macrofauna and rneiofauna. Benthic micro-algae at an intertidal station appeared to be controlled by rnacrofaunal cropping and nutrient conditions in the sediment. Bacteria showed a very strong positive relationship with macrofauna and sediment carbon over a seasonal cycle and, spatially, with grain surface area and carbon content of sedirnents.
INTRODUCTION
Benthic communities, like all biological com- munities, are hierarchical systems composed of many structural and organizational levels. Rosen (1977) demonstrated that some properties of a hierarchically organized system, often referred to as emergent pro- perties (e. g. Salt, 1979), are not predictable from obser- vations of components of the hierarchy below that level of organization. Therefore, our understanding of the behaviour of benthic or any other biological com- munities requires adequate observation of community- level phenomena and development of rigorous theory regarding these phenomena (Kerr. 1976; Silvert, 1981).
Schwinghamer (1981b) provided evidence that the biomass or 'Sheldon' spectrum, the pattern of biomass distribution over the entire range of diffenrently sized organisms, is a conservative feature of marine soft- bottom communities regardless of taxonomic composi- tion. Such a pattern, if indeed it is general, would constitute an emergent community property. The dis- covery and analysis of biomass spectra characteristic of communities in open water have led to considerable
Based on part of a thesis submitted in partical fulfillment of the requirements for the degree of Doctor of Philosophy, Dalhousie University
O Inter-Research/Printed in F. R. Germany
new insight into dynamics within these communities (Sheldon et al., 1972, 1977; Kerr, 1974, 1979; Platt and Denman, 1977; Ware, 1977; Sprules and Holtby, 1979; Sprules and Knoechel, in press). While benthic and pelagic biomass spectra differ fundamentally in both shape and hypothetical causative dynamics (Schwing- hamer, 1981b), similar analysis of some problems in benthic ecology is likely to prove similarly fruitful.
In the analysis of structural data such as biomass spectra, hypotheses must be formulated to describe the dynamics underlying the observational data. Although not widely used in ecology, the class of quasi-statisti- cal methods known in the social sciences as causal analysis provides an approach to generating hypoth- eses from non-experimental data that is ideally suited to ecological applications. Some aspects of the philoso- phy and methodology of causal analysis and theory construction are given by Blalock (1961, 1969). The technical literature on the methods used is large but some readable introductions are Heise (1975), and papers in Goldberger and Duncan (1973) and Blalock (1971). Li (1975) gives a detailed account of path ana- lysis, a method I will use in this work and one of the principal tools of causal analysis.
Technically, causal analysis is the solution of a set of equations for a number of unknowns where the
Mar. Ecol. Prog. Ser. 13: 151-166, 1983
unknowns are hypothesized to be causally linked to a set of explanatory variables. In the present context the unknowns are the biomasses of size groups of benthic heterotrophic organisms and micro-algae. The equa- tions relate these variables to one another, and to other environmental variables whose values are determined externally to the model hypotheses. Many of the pit- falls and problems as well as the advantages of the numerous methods of parameter estimation in causal analysis are dealt with in the extensive econometric literature on structural equations (see Kennedy, 1979; Johnston, 1972; Heise, 1975 for introductions to this literature). I do not propose to give a detailed back- ground to the methods I have used but I hope the examples given will sufficiently indicate the very great potential of causal analysis in ecology.
The study sites included herein are all located in the Bay of Fundy. They are subject to strong tidal currents, not unusual among coastal communities, and in other respects they represent a cross section of benthic habitats in many ways typical of temperate inshore areas. Depths are from upper intertidal to 141 m below chart datum, waters are moderately to highly turbid, sediments range from coarse sands and gravels to almost pure silt-clay. The benthic communities, too, are widely representative, comprising a diverse fauna of at least 245 species of macrofauna (Peer et al., 1980). Both suspension feeding and deposit feeding com- munities are represented. The macrofauna has been well mapped (Peer at al., 1980; D. Wildish and D. Peer, unpubl.) but little is known of meiofaunal (Hopper, 1969) or bacterial (Cammen and Walker, ms) distribu- tions in the Bay of Fundy benthos.
The work presented here extends the observations on biomass spectra beyond the intertidal sites on which the initial studies were conducted (Schwing- hamer, 1981b). By means of causal analysis some hypothetical explanations of the size structure of benthic communities in the Bay of Fundy are formu- lated.
METHODS
Collection of samples
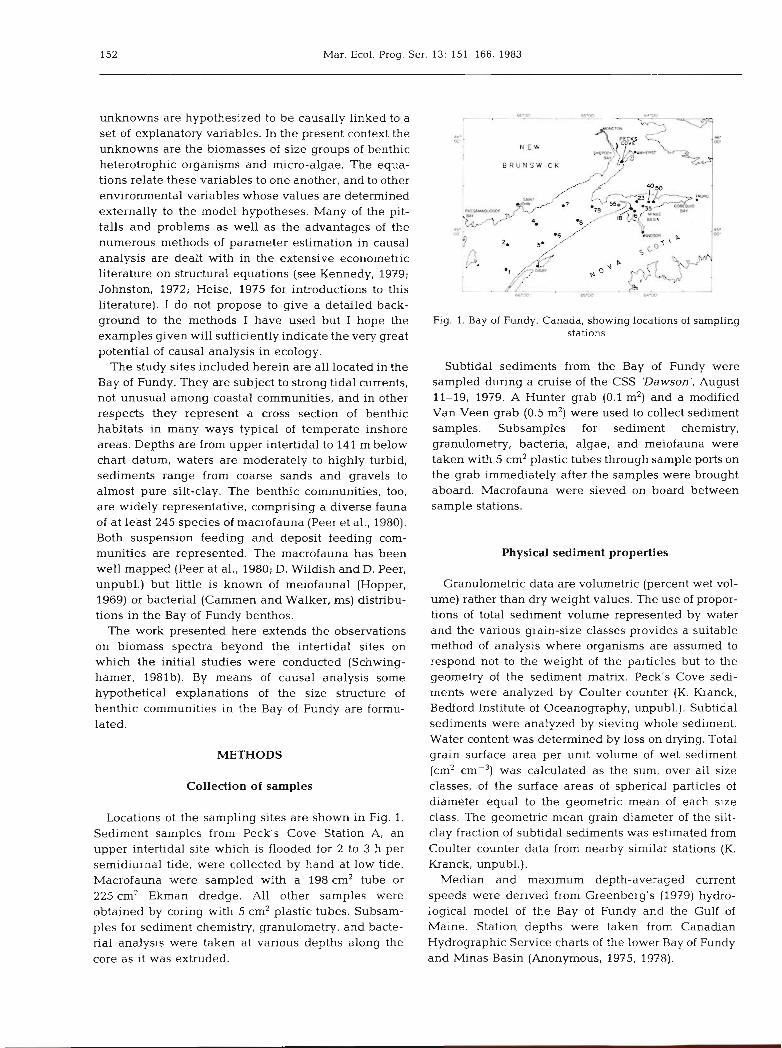
Locations ot the sampling sites are shown in Fig. 1. Sediment samples from Peck's Cove Station A, an upper intertidal site which is flooded for 2 to 3 h per semidiurnal tide, were collected by hand at low tide. Macrofauna were sampled with a 198 cm2 tube or 225 cm2 Ekman dredge. All other samples were obtained by coring with 5 cm2 plastic tubes. Subsam- ples for sediment chemistry, granulometry, and bacte- rial analysis were taken at various depths along the core as it was extruded.
... W
B R U N S W I C K
Fig. 1. Bay of Fundy, Canada, showing locations of sampling stations
Subtidal sediments from the Bay of Fundy were sampled during a cruise of the CSS 'Dawson', August 11-19, 1979. A Hunter grab (0.1 m*) and a modified Van Veen grab (0.5 m2) were used to collect sediment samples. Subsamples for sediment chemistry, granulometry, bacteria, algae, and meiofauna were taken with 5 cm2 plastic tubes through sample ports on the grab immediately after the samples were brought aboard. Macrofauna were sieved on board between sample stations.
Physical sediment properties
Granulometric data are volumetric (percent wet vol- ume) rather than dry weight values. The use of propor- tions of total sediment volume represented by water and the various grain-size classes provides a suitable method of analysis where organisms are assumed to respond not to the weight of the particles but to the geometry of the sediment matrix. Peck's Cove sedi- ments were analyzed by Coulter counter (K. Kranck, Bedford Institute of Oceanography, unpubl.). Subtidal sediments were analyzed by sieving whole sediment. Water content was determined by loss on drying. Total grain surface area per unit volume of wet sediment (cm2 cm-3) was calculated as the sum, over all size classes, of the surface areas of spherical particles of diameter equal to the geometric mean of each size class. The geometric mean grain diameter of the silt- clay fraction of subtidal sediments was estimated from Coulter counter data from nearby similar stations (K. Kranck, unpubl.).
Median and maximum depth-averaged current speeds were derived from Greenberg's (1979) hydro- logical model of the Bay of Fundy and the Gulf of Maine. Station depths were taken from Canadian Hydrographic Service charts of the lower Bay of Fundy and Minas Basin (Anonymous, 1975, 1978).

Schwinghamer: Ec ,ologlcal hypotheses 153
Sediment chemistry
Total organic carbon and total nitrogen in the sedi- ment were measured as percent dry weight using a CHN analyzer according to methods outlined by Gor- don et al. (1980). Carbonates were removed by acidifi- cation prior to analysis.
Storms at Peck's Cove Station A
Weather records from Moncton, N. B., the Depart- ment of Agriculture station at Nappan, N. S., and quarter-daily weather maps of the Eastern Seaboard kept by the Atmospheric Environment Service, Envi- ronment Canada, Bedford, N. S., were examined to identify occurrences of winds of 65 km h-' or more associated with intense low pressure areas or frontal systems centered over the upper Bay of Fundy.
Benthic flora and fauna
The occurrence of shorebirds known to feed upon intertidal macrofauna was noted on each sampling day at Peck's Cove. The 'shorebird' variable used in ana- lyses to follow was given two values: 0 indicated ab- sence, 1 presence.
Body sizes of organisms referred to as bacteria, meiofauna, and macrofauna are those established by Schwinghamer (1981b) and are expressed in terms of the diameter of a sphere of volume equivalent to that of the organism. The term 'bacteria' refers here to pro- karyotes in the 0.25 to 4 p size classes which are not identifiable as Cyanophyceae. Meiofauna refers to protozoans and metazoans in the 8 to 500 pm size classes and macrofauna to metazoans in the size clas- ses larger than 500 pm. Benthic microalgal volumes are also expressed as equivalent spherical diameter.
Bacterial biomass in the surface 10 cm of sediment was measured using the acridine-orange method of Hobbie et al. (1977). Peck's Cove data were supplied by L. M. Cammen and J. Walker (unpubl.). I have excluded large colonial and filamentous forms that they counted. These forms were determined separately as outlined below. Bacterial size distributions were estimated from micrometer measurements of all cells in selected fields along a transect from the centre to the edge of the filtered area.
Microalgae (3 to 11 pm minimum dimension) were separated from bulk sediments by centrifuging four l rnl aliquots of fixed core sample (5 cm2 X 10 cm depth, see below) in Percoll-sorbitol (Schwinghamer, 1981a) and filtering the supernatant onto a 3 pm Nucle- pore filter. The filtered materials was rinsed into a
25 m1 settling chamber and allowed to settle. All indi- vidual cells, colonies, and filaments of minimum dimension between 3 and 11 pm were counted and measured in equidistant fields along a diameteric transect of the settling chamber at 650x on a Zeiss-Jena inverted plankton microscope. About 200 organisms were counted and sized in each sample, yielding 90 % confidence intervals of 12 to 15 % of the count (Cassell, 1965). This method was developed only after the initial results of the bacterial counts had been scrutinized and were felt to be unsatisfactory for the larger sizes. Thus only 3 samples were available from the Peck's Cove collection (August 1, November 13, March 20) and 10 samples from the Bay of Fundy collection. Most of the material counted by this method was algae so esti- mates of biomasses of other organisms in the 8 and 16 pm size classes were little affected by the inclusion of these counts.
A 5 cm2 round plastic corer was used to collect meio- fauna1 and algal samples. At Peck's Cove, 4 replicates were collected at each sampling. The standard devia- tion of replicates was consistently less than 10 % of the mean count, so pooled samples representing 20 cm2 to a depth of 10 cm were used to estimate biomass and size distributions. Meiofauna and algae retained on a 10 pm Nitex screen were enumerated and measured according to the method described by Schwinghamer (1981a, b). At the 15 subtidal stations, duplicate 5 cm2 area X 10 cm depth cores were taken from the grab samples before they were emptied onto a screen. Of 80 samples collected during the August 1979 cruise of the CSS 'Dawson', 15 were undisturbed at the surface and suitable for quantitative comparison. Testate Foraminifera were under-represented in the cen- trifuged meiofaunal samples so the sediment slugs remaining after centrifugation were examined.
Five replicate macrofaunal samples of 198 cm2 area and 15 cm depth were collected from Peck's Cove on May 5 and June 1, 1979. Later samples consisted of 4 replicates, each 225 cm2 area and 15 cm depth. The sediment surface was frozen in January so no sample was collected. In February only one 34 cm2 was col- lected. Organisms were collected on a 420 p sieve, picked and sorted, then fixed in 10 % formalin in seawater.
Subtidal macrofaunal samples were collected using a 0.1 m2 Hunter grab (Stations G6 and G7) or a 0.5 m2 modified van Veen grab. In total, 1 m2 of sediment was collected at Stations G1 to G5 and G8, 0.6 m2 at Station G6, 0.5 m2 at Stations G16 to G78, and 0.2 m2 at Station G7. After subsampling the grab through sample ports, the contents were sieved onto a 740 pm mesh screen, washed into 4 1 buckets, and fixed with 10 % buffered formalin in seawater. Macrofauna was picked and sorted by J. Hines, Marine Ecology Laboratory.

154 Mar. Ecol. Prog. Ser
Size and biomasses of macrofauna from all stations were determined by volume displacement in micro- pipettes readable to 0.001 ml. Replicate error of vol- ume measurement of 3 mm diameter glass beads was less than 5 % (2 S. d.) using this method. Low biomass values in the 1 mm size class were confirmed by check- ing the retention of animals of this size on a 740 pm mesh sieve. All organisms were extracted from 20 to 40 cm2 sediment samples taken at each of 6 of the subtidal sites (Gl , G4, G5, G6, G35, G55). After siev- ing, both fractions of each sample were enumerated and measured. In the 6 samples, only two 1 mm size- class animals were not retained on the sieve, both were polychaetes at the lower size limit of the size class. Rather than allowing many 1 mm class animals to pass through, the 740 pm sieve retained significant numbers of 500 pm class animals.
Statistics and causal analysis
Kendall's coefficient of concordance (W) and Spear- man's rank correlation coefficient (r,,,, pairwise aver- age) were used to determine the overall correspond- ence of size class rankings among the stations or sam- ple dates. They were calculated using the methods described by Siege1 (1956) for large tables in which there are tied values.
SPSS subprograms 'PEARSON CORR', 'PARTIAL CORR', 'REGRESSION', and 'GSSLS' (Nie et al., 1975) were used for statistical calculations and construction of regression models. Johnston (1972) was consulted for statistical details regarding the application of regression models, especially reduced or 'structural' equation models as they are applied to econometric analysis.
Path analysis techniques used to construct and assess the validity of hypothetical causal models are presented in detail in Wright (1960), Li (1975), and Heise (1975). Duncan (1966) gives an excellent account of the application of path analysis to causal modelling of sociological problems more closely a h n to ecologi- cal problems than are the well known genetic applica- tions of path analysis. Costner and Schoenberg (1973) discuss methods of choosing the best set of structural equations from a number of alternative causal models.
As a method of interpretation in causal analysis, path analysis is useful in making explicit the set of causal assumptions and hypotheses incorporated into a regression or structural equation model (Duncan, 1966). We are, of course, interested in cause-effect relationships more than mere correlations, whatever the philosophical problems with the former may be. Path analysis provides a method of assessing the valid- ity of a causal interpretation by comparison of correla-
tions among variables calculated from the resulting path diagram with those observed in the data set. In this way it is possible, by iteration, to select hypotheti- cal models that are biologically acceptable and statisti- cally most consistent with the data.
Path coefficients, the numerical values associated with hypothesized cause-effect relationships (paths), were estimated by either ordinary least-squares regression or, where independence of residuals was unlikely, by generalized, 3-stage, least-squares regres- sion for the whole model (Johnston, 1972). In all cases the path coefficients are standardized regression coef- ficients. Correlations among variables indicated by a given path diagram are calculated according to the general formula:
'ij = 2 PiqrIq
where i and j = 2 variables; q = index running over all variables from which paths lead directly to variable y. These correlations (r,,), which were dependent upon the structure of the hypothesized causal model, were compared with Pearson correlation coefficients (r,,,) generated by the data to assess the 'fit' of the model to the observed data relationships. The models examined are all linear and additive, but lack of correlation of residuals was not assumed.
The judgment as to whether or not a given set of regressors accounts for a satisfactory proportion of var- iance in a dependent variable is quite separate from the path-analyhc procedure. It is based upon choosing a parsimonious, biologically sensible and statistically significant regression model in which all of the regres- sors contribute positively to the overall significance of the equation. The models presented here have been selected by the following criteria:
(1) Regressors a priori judged likely to have some ecologically sensible, causal relationship with a dependent variable were tested.
(2) Insignificant regressors (by 't' test of regression coefficient) and all but one of any group of multicol- linear regressors were deleted.
(3) By partial correlation and regression analysis, relationships were examined for possible intervening variables and included in the final model only if proxi- mate and significant.
(4) Where a choice ex~sted, the most significant regression model (by coefficient of determination) was selected.
Such a procedure represents, in principle, a difficult optimization process. In practice, the restrictions of biological plausibility and individual significance of regressors reduced the number of possible path dia- grams (regression models) for each dependent variable to a manageable set. Collinearity among the regressor variables imposed further restrictions on model choice.
Schwinghamer: Ecological hypotheses 155
Table 1. Environmental variables and summed biomasses of the 4 groups of benthic organisms at Peck's Cove, Station A from May 1979 to March 1980
Date Days since % sediment dry wt. Biomass (cm3 m-') last storm Carbon Nitrogen Bacteria Algae Meiofauna Macrofauna
(.25-4 pm) (4-125 pm) (8-500 pm) (> l mm)
M a y 5 1979 23 0.81 0.12 63.4 3.4 3.2 33.1 Jun 1 26 0.67 0.11 54.1 3.4 6.8 39.3 Jul 3 6 1.23 0.19 58.0 36.5 19.6 5.1 Aug 1 27 0.67 0.06 54.7 45.8 10.8 8.6 Sep 13 6 1.53 0.30 60.5 125.7 24.5 4.0 Oct 12 4 0.72 0.14 48.4 43.1 15.0 18.9 Nov 13 36 0.30 0.05 43.8 23.1 12.5 20.6 Dec 12 3 0.47 0.07 48.2 16.0 13.4 5.7 Feb 8 1980 14 0.38 0.06 33.3 1 .? 0.9 < 0.1 Mar 20 2 0.64 0.11 51.7 1.3 11.0 12.6
Systems of simultaneous linear equations were con- structed for each data set and represented by path diagrams. Biomass models for 16 August stations in the Bay of Fundy were amenable to estimation by ordinary least squares regression. Regression coefficients dif- fered little from those obtained with three-stage, least- squares regression and no direct or indirect feedback loops were of much significance in the equation sys- tems tested.
The Peck's Cove model was more difficult to deal with, however, because of some features of the data base. Paradoxically, the most serious problem was the high degree of correlation among carbon, nitrogen, bacteria, algae, and meiofauna. The problem of multi- collinearity remains to some extent in the model. Serial autocorrelation and lack of independence among residuals were less serious problems. The latter indi- cated reciprocal interactions (feedback) among endogenous variables. These problems were dealt with by the use of a 3-stage, least-squares regression procedure to reduce the model to a set of structural (independent) equations, as described in Johnston (1972).
DATA SUMMARY
Peck's Cove
Sediment properties
Sediment at Station A was characterized by high water content (78 to 84 % by volume) and fine grain size (20 to 30 pn mode) with little variation over the sampling period. Variations in sediment carbon and nitrogen appeared to be seasonal (Table 1) but were unrelated to variations in suspended particulate car- bon as measured during this study (D. C. Gordon, unpubl.). There was, however, a correspondence (by multiple linear regression) of sediment carbon with the
level of high tide on the sampling day and length of time since a storm (R2 = 0.350, p = 0.002). A neap tide, with Station A covered by only 1 to 1.5 m of water, following a recent storm tended to produce an increase in sediment carbon and nitrogen. Assuming 1 cm3 wet volume is equivalent to 0.1 g C, living biomass contri- buted a maximum of approximately 2.8 % to the total mass of carbon in the surface 10 c m of sediment during a bloom of benthic microalgae in September 1979. Microscopic examination indicated that detritus was the most abundant organic material in the sediment and was mostly fragments of Spartina alterniflora, probably originating from the fringe marsh a few metres inshore from Station A.
Bacteria
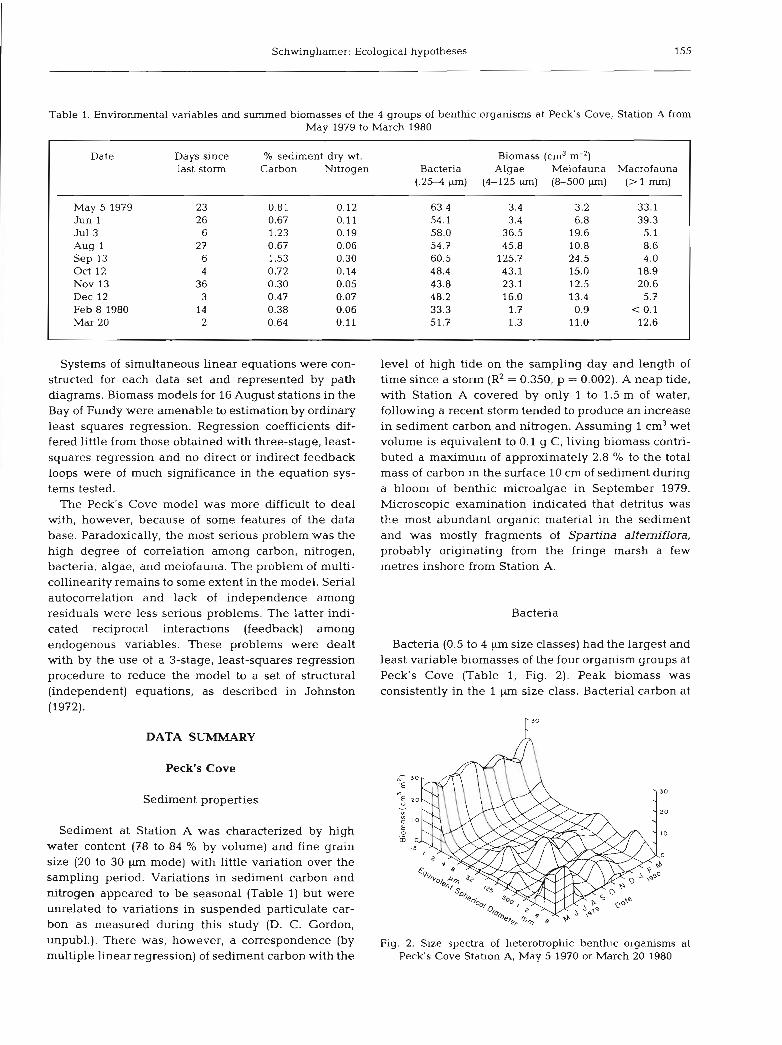
Bacteria (0.5 to 4 pm size classes) had the largest and least variable biomasses of the four organism groups at Peck's Cove (Table 1, Fig. 2). Peak biomass was consistently in the 1 size class. Bacterial carbon at
Fig. 2. Size spectra of heterotrophic benthic organisms at Peck's Cove Station A, May 5 1970 or March 20 1980
Mar. Ecol. Prog. Ser. 13: 151-166, 1983
Peck's Cove was approximately 1.3 % of total organic found in marine sediments. The ice-free season mean carbon in the sediment, assuming 1 cm3 biomass = 0.1 was 13 cm3 m-2, considerably in excess of the normal g C. This is in agreement with Cammen (1980) and range of 1 to 2 g m-' dry weight (4 to 8 cm3 m-') given sources quoted therein who observe that bacteria usu- by Coull and Bell (1979). ally account for less than 3 % of the total organic carbon in sediments.
Macrofauna
Algae
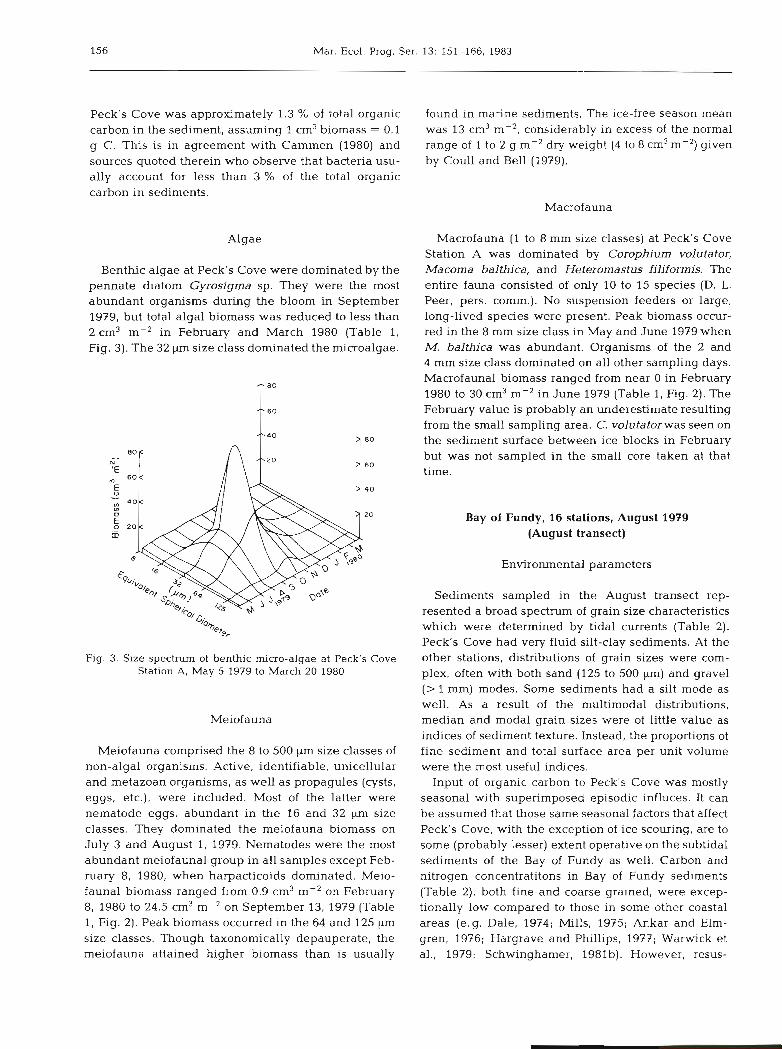
Benthic algae at Peck's Cove were dominated by the pennate diatom Gyrosigma sp. They were the most abundant organisms during the bloom in September 1979, but total algal biomass was reduced to less than 2 cm3 m-' in February and March 1980 (Table 1, Fig. 3). The 32 kun size class dominated the microalgae.
Fig. 3. Size spectrum of benthic micro-algae at Peck's Cove Station A, May 5 1979 to March 20 1980
Meiofauna
Meiofauna comprised the 8 to 500 p size classes of non-algal organisms. Active, identifiable, unicellular and metazoan organisms, as well as propagules (cysts, eggs, etc.), were included. Most of the latter were nematode eggs, abundant in the 16 and 32 pm size classes. They dominated the meiofauna biomass on July 3 and August 1, 1979. Nematodes were the most abundant meiofaunal group in all samples except Feb- ruary 8, 1980, when harpacticoids dominated. Meio- fauna1 biomass ranged from 0.9 cm3 m-' on February 8, 1980 to 24.5 cm3 m-' on September 13, 1979 (Table 1, Fig. 2). Peak biomass occurred in the 64 and 125 pm size classes. Though taxonomically depauperate, the meiofauna attained higher biomass than is usually
Macrofauna (1 to 8 mm size classes) at Peck's Cove Station A was dominated by Corophium volutator, Macorna balthica, and Heterornastus filiformis. The entire fauna consisted of only 10 to 15 species (D. L. Peer, pers. comm.). No suspension feeders or large, long-lived species were present. Peak biomass occur- red in the 8 mm size class in May and June 1979 when M, balthica was abundant. Organisms of the 2 and 4 mm size class dominated on all other sampling days. Macrofaunal biomass ranged from near 0 in February 1980 to 30 cm3 m-' in June 1979 (Table 1, Fig. 2). The February value is probably an underestimate resulting from the small sampling area. C. volutatorwas seen on the sediment surface between ice blocks in February but was not sampled in the small core taken at that time.
Bay of Fundy, 16 stations, August 1979 (August transect)
Environmental parameters
Sediments sampled in the August transect rep- resented a broad spectrum of grain size characteristics which were determined by tidal currents (Table 2). Peck's Cove had very fluid silt-clay sediments. At the other stations, distributions of grain sizes were com- plex, often with both sand (125 to 500 v) and gravel (> l mm) modes. Some sediments had a silt mode as well. As a result of the multimodal distributions, median and modal grain sizes were of little value as indices of sediment texture. Instead, the proportions of fine sediment and total surface area per unit volume were the most useful indices.
Input of organic carbon to Peck's Cove was mostly seasonal with superimposed episodic influces. It can be assumed that those same seasonal factors that affect Peck's Cove, with the exception of ice scouring, are to some (probably lesser) extent operative on the subtidal sediments of the Bay of Fundy as well. Carbon and nitrogen concentratitons in Bay of Fundy sediments (Table 2), both fine and coarse grained, were excep- tionally low compared to those in some other coastal areas (e .g . Dale, 1974; Mills, 1975; Ankar and Elm- gren, 1976; Hargrave and Phillips, 1977; Warwick et al., 1979; Schwinghamer, 1981b). However, resus-

Schwinghamer: Ecological hypotheses
Table 2. Environmental variables at 16 stations in the Bay of Fundy, August 1979
Station Depth % dry wet cm S-' cm2 cm-3 % Wet vol. (m] Current speed Wet
Carbon Nitrogen Median 95 % Water Sediment grain size-classes Maximum Surface content < 63 pn 63-500 pm >500 pn
area
Peck'sCove 0 0.67 0.06 0 50 530 80 19.2 0.5 0.3 G1 141 0.30 0.05 4 6 84 289 4 1 4.4 20.0 34.7 G2 119 0.28 0.04 40 7 3 839 4 6 14.1 27.9 12.0 G4 64 0.18 0.03 66 120 593 33 9.3 37.0 21.3 G5 7 3 0.23 0.04 64 116 724 52 12.1 26.5 9.3 G6 66 0.34 0.05 65 118 231 56 2.9 26.5 14.7 G7 49 0.09 0.03 65 117 556 25 9.3 29.0 36.7 G8 69 0.03 0.00 7 2 130 256 4 1 3.0 54.8 1.1 G16 10 0.14 0.03 72 109 176 36 1.3 38.7 24.0 G18 13 0.05 0.01 60 104 150 37 0.9 50.5 11.5 G23 22 0.03 0.02 138 214 70 39 0.1 48.9 12.0 G35 20 0.21 0.04 106 168 650 57 10.5 44.1 26.4 G40 16 0.04 0.01 96 156 105 3 1 0.6 50.4 18.3 G50 18 0.02 0.00 125 202 4 1 26 0.1 29.2 44.5 G55 18 0.87 0.16 21 60 356 6 1 4.7 33.0 1.3 G78 40 0.12 0.02 96 157 206 24 3.3 17.3 55.5
pended sediments and littoral detritus are rapidly cycled within the Bay by strong tidal currents so that the flux of organic detritus is high.
Bacteria
Organisms in the 0.25 to 4 pm size classes consisted mostly of bacteria, though blue-green algae were sometimes dominant in the 4 pm size class. Total bacterial biomasses among the August transect sta- tions ranged from 54.7 cm3 m-2 at Peck's Cove down to
3.1 cm3 m-2 at G23 (Table 3). The stations with high current speed, low silt clay, carbon and water content had very low bacterial counts, the lowest being among the stations in the central Minas Basin (G23, G40, G50).
Bacterial carbon accounted for 1 to 2 % of total organic carbon in the sediments at the 15 subtidal stations, similar to values found in the intertidal sedi- ments at Peck's Cove. The size distribution of bacteria among the August transect stations was less constant than among the Peck's Cove samples but the biomass peak was still usually in the 1 p m size class (Fig. 4) .
Table 3. Summed biomasses of the 4 groups of benthic organisms at 16 stations in the Bay of Fundy, August 1979
Station Biomass (cm3 m-*)
Bacteria Algae Meiofauna Macrofauna .25-4 4-250 pn 8-500 pm 1-64 mm
Peck's Cove 54.7 45.8 10.8 8.5 G 1 24.2 2.6 14.5 158. G2 18.6 1.8 3.6 50.1 G4 22.8 3.6 10.5 2666. G5 48.4 10.6 18.0 4778. G6 42.3 0.3 4.8 1103. G7 6.2 1.9 9.4 23.0 G8 4.1 0.4 6.5 136. G16 5.5 0.6 18.2 45.4 G18 8.4 0.6 12.4 141. G23 3.1 0.1 1.0 0.1 G35 11.7 0.7 14.4 2642. G40 3.8 0.2 1.1 0.0 G50 4.2 0.9 0.4 0.3 G55 33.8 4.3 24.4 130. G78 5.9 1.3 13.1 38.3

Schwinghamer: Ecological hypotheses 159
Table 4. Analysis of conelations among ranked biomasses of equivalent size classes on 10 sampling days, May 5 1979 to March 20 1980 at Peck's Cove Station A and at 16 stations in fhe Bay of Fundy, August 1980. Details of calculations of parameter
estimates are given in the text
k N N- l smu S W x2 P Javg
Samples Size Degrees of classes freedom
Peck's Cove 10 12 11 14.300 8.312 0.59 64 < 0.001 0.54 Bay of Fundy 16 19 18 145,920 73,651 0.51 148 < 0.001 0.48
exhibit identical size distributions, regardless of the absolute values of the size-class biomasses, then the observed sum of squares, S, would equal S,,. As Table 4 illustrates, size distribution is judged by this method to be a conservative structural feature of benthic com- munities in the Bay of Fundy. The r,,, statistics for both the time series and cross-sectional data show a high degree of correlation in the ranking of all size classes over all pairs of stations or dates. The significance in both cases is extremely high. In short, the biomass peaks and troughs are similarly positioned on the size spectrum in all the samples. This provides justification for defining the variables 'bacteria' (.25 to 4 pm), 'meiofauna' (8 to 500 p), and 'macrofauna' (> l mm) similarly at all stations for the purpose of the causal analysis to follow.
Causal analysis
In this section I examine the structure of relation- ships within benthic communities in the Bay of Fundy by the use of causal analysis techniques. Causal analy- sis of factors affecting biomasses of the 4 groups of benthic organisms led to the structural models illus- trated in Figs. 5 and 6. Fitting such models to sets of data is a compromise, but if the variables and relation-
Exogenous Voriobles - Endogenous Voriobles
Shorebirds Bacterial Biomass
Algol B~omass
Doys slnce storm
Fig. 5. Causal model of Peck's Cove Station A benthic biomass by functional group. Simple correlations indicated by curved double headed arrows. Path coefficients are stan- dardized linear regression coefficients calculated according
to methods described in the text
ships are correctly chosen and measured then, as each part of the model is more closely fit to 'reality', the fit of all other parts should also be improved insofar as the parts are interactive. This was indeed the pattern observed during the iterative process of choosing the most plausible structural hypothesis. The regression models presented (Fig. 5 and 6, Tables 5 and 6) are the end results of an iterative process wherein many com- binations of variables and relationships have been examined. The structural models presented cannot be interpreted as dynamic energy flow models. Arrows in Fig. 5 and 6 represent standardized regression coeffi- cients (path coefficients) and correlation coefficients. Biomass variance is explained, not energy flow.
Following are some comments on the models illus- trated and the process of model formulation by causal analysis.
Exogenous Var~obles - Endogenous Vor~a bles
Carbon .49
Groin Surface Area
Median Current Speed Mocrofaunal B~ornass
Depth 'h Meiofounol
Fine Sand Fraction (63 - 125 ),m)
Surface Areo Median
Woter Content
Fig. 6. Causal model of Bay of Fundy benthic biomass by functional group. Correlations (r) among exogenous variables not shown but listed below. Path coefficients are standardized linear regression coefficients calculated according 10 methods
described in the text

Mar. Ecol. Prog. Ser. 13: 151-166, 1983
Table 5. Correlation coefficients of variables Included in the generalized llnear model of Peck's Cove Station A illustrated in Flg. 4. Observed values (r,,,) are those inherent in the data set; calculated values (rcdc) derived from the path dlagram according to methods outlined in the text. Coefficients of determination (R2) based on ordinary least squares estimation as described in the text
Variable Dependent variable (Biomass)
Bacteria Algae Meiofauna Macrofauna robs rca~c robs rca~c robs rca~c 'ohs rca~c
Days since storm -.05 .l6 -.28 -.49 -.43 -.30 .52 .43 Shorebirds .36 .03 .78 .46 .44 .29 -.34 -.36 (present or absent) Carbon .72 .98 .76 .70 .?O .72 -.l8 .03 Nitrogen .59 .96 .78 .79 .? 1 .71 -.l6 -.l6 Bacteria .380 .42 .40 .4 1 .33 .34 Algae .81 .74 -.38 -.45 Meiofauna -.38 -.l0 R2 .74 .68 .66 .71
Table 6. Correlation coefficients of variables included the linear model of the Bay of Fundy illustrated in Fig. 5. Observed values (r,,,) are those inherent in the data set; calculated values (rCdc) derived from the path diagram according to methods outlined in
the text. Coefficients of determination (R2) based on ordinary least squares estimation as described in the text
Variable Dependent variable (biomass)
Bacteria Algae Meiofauna Macrofauna robs rca~c 'ohs rca~c robs rca~c robs rcalc
Carbon .74 .77 .56 .64 .S5 .58 .01 .l4 Grain surface area .47 .45 .30 .38 .28 .29 .55 .54 Median current speed -.69 -.43 -.59 -.59 -.49 -.4? .04 .05 Water content .80 .?O .69 .69 .32 .40 .22 .l4 Depth .l6 -.01 -.23 -.23 -.05 -.01 .l6 . l1 Fine sand .43 .45 -.08 .30 .?6 .84 .37 .l5 Bacteria .68 .? 1 .36 .49 .44 .44 Algae .l4 .44 .03 .l3 Meiofauna .31 .l8 R2 .69 .59 .68 .62
Peck's Cove Station A
Bacteria (0.5 to 4 pm)
The initial working hypothesis was that bacterial biomass would be a function of habitable grain surface area and the quality and rate of input of food. I assumed at the start that positive and negative effects of biotic interactions with macrofauna and meiofauna would largely balance, but I did not distinguish between spatial and temporal variance. This is an important distinction as will be seen later.
Sediment grain properties, including grain surface area, were constant over the sampling period at Peck's Cove. However, concentrations of sediment carbon and nitrogen which can be used as measures of food abundance and (to some extent) quality, and biomas- ses of meiofauna and macrofauna varied significantly over the sampling period. Therefore, suitable observ- ables were available with which to examine the valid-
ity of the proposal that biotic interactions should be of neutral effect, and that food characteristics should then be the single most significant cause of variance in bacterial biomass. As previously noted, bacterial car- bon amounted to ca. 1 % of total sediment carbon, so significant feedback from bacteria to carbon was judged to be unlikely.
Nitrogen and carbon were very highly correlated, indicating a relatively uniform quality of detrital mate- rial entering the system over the sampling period. Further, variables such as carbon plus (weighted) ni- trogen or C:N ratio were not as well correlated with bacterial biomass as was carbon alone. Therefore, car- bon concentration was used as the sole indicator of food availability. The precedents for using carbon in this way are numerous (for review, see Parsons et al., 1977) and the high correlation between carbon and bacterial biomass (I = 0.74, p = 0.009) was expected.
Examination of the effects of biotic interactions upon bacteria was more difficult because lack of feedback

Schwinghamer: Ecological hypotheses 161
could not be assumed. Generalized, 3-stage, least- squares regression was used to examine numerous models that included reciprocal interaction among the endogenous variables (Johnston, 1972). The model illustrated in Fig. 5 includes a reciprocal interaction between bacteria and macrofauna. The implication of the model is that biotic interactions between bacteria and macrofauna strongly affect bacterial biomass, less so macrofaunal biomass. The model leads to the con- clusion that, over the sampling period, there was a significant, positive, direct effect exerted by mac- rofauna upon bacterial biomass. Correlations of bac- teria with algae and meiofauna were apparently medi- ated by the effects of macrofauna and environmental variables.
Algae (4 to 125 pm)
Unlike the subtidal stations in the Bay of Fundy, Peck's Cove Station A was the site of considerable primary production by benthic diatoms (Hargrave et al., 1983). As an initial working hypothesis, it was assumed that algal biomass would be most strongly related to the seasonal influence of incident radiation (e. g. Pamatrnat, 1968) and negatively related to meio- fauna1 and macrofaunal biomass through grazing. Analysis of partial correlations revealed that, though the simple correlation of algae with average daily incident radiation over the previous two-week period was high enough to be of interest (r = 0.442, p = 0.01), the positive correlation was mediated by both algae and light being highly correlated with temperature. Further, partial correlations of algae with both light and temperature were insignificant if the effects of sediment nitrogen were removed, but the positive par- tial correlation with nitrogen was robust. Algal biomass probably did not contribute significantly to sediment nitrogen as algae accounted for a maximum of less than 3 % of the organic matter in the surface 10 cm of sediment during the September 1979 bloom. Nitrogen could have been indicative of nutrient condi- tions in the sediment, and is included as a proximate regressor of algal biomass.
Generalized, 3-stage, least-squares regression revealed that the hypothesis that macrofaunal grazing exerted a negative effect on algal biomass was consi- stent with the data, but no negative effect of meiofauna upon algal biomass could be detected in any of the models attempted. Inclusion of a direct, positive, recip- rocal effect of algae upon macrofauna produced less satisfactory results than the model in Fig. 5 . Collinear- ity of algae and meiofauna precluded the possibility of detecting any significant effect of meiofauna upon algal biomass, assuming the direction of the causal path in Fig. 4 is correct.
The proposed model implies that a large part of the seasonality of the benthic algae was a result of proxi- mate causal mechanisms within the benthic commun- ity. Events within the system were seasonal, however, and seasonal effects are implicit in the model. The strong correlations among shorebirds, carbon, and ni- trogen can only be attributed to an underlying sea- sonal component of these variables. While the role of nitrogen in controlling or limiting phytoplankton pro- duction is well established, that is not the case for benthic algae. The necessity to further investigate the role of nutrient limitation of benthic algae is certainly indicated by this result.
Meiofauna (8 to 500 pm)
Sediment properties were constant over the samp- ling period at Peck's Cove, so the initial working hypothesis was that meiofaunal biomass might be related to food resources (bacteria and algae), and to macrofaunal biomass via predation and competition. Sediment carbon was assumed to be important only insofar as it was the bacterial food resource.
Meiofaunal biomass was most strongly correlated with that of algae (r = 0.808, p = 0.002). The partial correlation with the effects of bacteria and macrofauna removed was not significantly reduced. Of the many regression models attempted, the most successful depicted meiofaunal biomass as a function of algal and bacterial biomass. The model illustrated in Fig. 5 accounts well for most of the observed correlations of meiofauna with other variables except macrofauna (Table 5). The magnitude of that negative correlation was underestimated, suggesting a direct negative effect of macrofauna upon meiofauna. Models incor- porating this path were not satisfactory (the path coef- ficient was not significantly different from 0 ) so it was not included. This path could be examined to better advantage with a larger data set where collinearity problems could be adequately dealt with. Experiments to determine the effects of macrofaunal predation on meiofauna may be difficult to design (Hulberg and Oliver, 1980) so at present it must suffice to note that the negative correlation of meiofauna with macrofauna was of greater magnitude than explained by the model in Fig. 5.
Peck's Cove causal analysis indicates the possibility that there exists size-dependent competition within sediment communities similar to, but on a broader size scale,' than that observed in freshwater plankton com- munities (Brooks and Dodson, 1965; review by Hall et al., 1976). One interpretation of the causal model is that meiofaunal biomass is limited by competition with macrofauna for algae while the reverse is not true. If

Mar. Ecol. Prog. Ser. 13: 151-166, 1983
that is so, then a size-efficiency hypothesis may be is of considerable heuristic value, especially in that formulated (modified from Hall et al., 1976) to account fruitful directions of future observation and ex- for interactions between deposit-feeding macrofauna perimentation are revealed. and meiofauna. The hypothesis may be stated as fol- lows:
(1) Macrofaunal and meiofaunal deposit-feeders Bay of Fundy, August transect both derive most of their nutrition from a similar source, in this case benthic algae. Bacteria (0.25 to 4 pm)
(2) When epifaunal predation and exogenous physi- cal disturbance do not limit biomass of macrofaunal Data from August transect stations were consistent deposit-feeders, meiofauna will be reduced in abun- with the hypothesis that bacterial biomass is a function dance, mainly via reduction in food supply due to of grain surface area and sediment carbon content macrofaunal aopping. (Schwinghamer, 1981b). In the causal model illus-
(3) When biomass of macrofaunal deposit-feeders is trated in Fig. 6 algal biomass was included as a regres- reduced by predation and exogenous disturbance, sor in addition to carbon and grain surface area meiofauna can thrive, possibly dominating the in- because partial correlation analysis indicated a robust fauna. correlation of algae and bacteria. Algae could be a
source of high quality nutrition for bacteria that would Macrofauna (1 to 8 mm) not necessarily be detectable by carbon or nitrogen
measurements (Cammen and Walker, ms). The calcu- There were indications from field observations that lated correlations agreed very well with observed cor-
the variance in macrofaunal biomass at Peck's Cove relations (Table 6) indicating that the proposed model would best be explained by exogenous disturbance, includes most significant paths relating to bacteria. that is, by epifaunal predation and physical sediment The pattern of correlations among some variables disturbance. Unfortunately, fish predation data were indicates a common source or sources of variation, not suitable for any puantitative application because of possibly associated with a mobile, fluid layer at the the short sampling period and lack of correspondence benthic surface (Swift et al., 1973). I shall refer to the in sampling frequency between the fish data and mac- suite of covarying variables including silt-clay content, rofaunal data. Further, only presence of absence could sediment carbon and water content, 0.25 to 1 pm bac- be used as values for a variable related to shorebird teria, 8 to 64 pm algae and meiofauna, 2 mm macro- predation. Major storms which caused physical sedi- fauna and median current speed as the 'turbidity fac- ment disturbance were identified using weather tor'. Flocculent material was present, sometimes in records available for the area. such quantities that bacterial and meiofaunal counts
The effects of interactions within the benthic com- were difficult. munity on macrofaunal biomass were examined but path analysis of the many causal models constructed Algae (4 to 250 pm) indicated that most of the variance of macrofaunal biomass was, indeed, directly and indirectly attribut- Because it represented a living component of the able to the observed exogenous disturbances. Most of benthic community, algal biomass was considered to the observed correlations with macrofauna are satis- be an endogenous variable in the causal analysis of the factorily accounted for by the model in Fig. 5, except August transect stations, although it was representa- for meiofauna and possibly carbon (Table 5). The coef- tive of allochthonous settled material. The most satis- ficient of determination also indicates that the van- factory regression model explained only 59 % of the ables included account for most of the observed var- variance of algal biomass. The regressors, sediment iance in macrofaunal biomass though, certainly, others water content, median current speed, and station might do so as well. The model indicates that a sea- depth, are associated with the 'turbidity factor' and are sonal component of variation must be included in order related to the concentrations of flocculent material for consistent results to be obtained. This seasonal settled from the water column. component is implicit in the correlations between shorebirds and carbon and nitrogen.
The advantage of causal analysis as used here Meiofauna (8 to 500 pm)
perhaps lies as much in the inconsistencies it exposes and in the questions it raises as in its value as a method The only robust partial correlations which meio- of formulation of hypothetical relationships from the fauna1 abundance were those of algal biomass and data set. The structural hypothesis illustrated in Fig. 5 very fine sand (percent sediment 64 to 125 p). Other

Schwinghamer: Ecol ogical hypotheses 163
correlations were apparently mediated by the 'prefer- ence' of meiofauna for sediments with a high propor- tion of very fine sand. The effects of hypothesized predation-competition interactions between meio- fauna and macrofauna were not detectable by causal analysis of this data set. A model of meiofaunal biomass determined by very fine sand and algal biomass (Fig. 6) satisfied the conditions for choice of a model stated earlier and shows that the most important factor deterrning meiofaunal abundance is sediment grain characteristics. It must be stressed, however, that both algae and very fine sand were associated with the 'turbidity factor'. Thus there is the possibility that a more complex group of interactions, of which algae and very fine sand are indices, may influence meio- fauna1 biomass.
Macrofauna ( 1 to 64 mm)
Macrofauna biomass was initially hypothesized to be a function of food supply and disturbance factors including epifaunal predation and physical 'catas- trophes'. In the August data set, several variables (car- bon, nitrogen, bacteria, algae) could be used as indi- cators of food supply. Rather than looking at physical disturbance, I measured environmental rigor using median and maximum current speed, which would also be related to the rate of food input. No indices of epifaunal predation were available so the causal model (Fig. 6) assumes that either predation is related to the factors measured or its effects are minor. These assumptions must be tested in the future as the inclu- sion of a predation variable could have some effect on the structure of the model.
The models included grain surface area, median current speed and bacteria as regressors of mac- rofauna. Biomass of macrofaunal deposit-feeders was very strongly related to grain surface area (r = 0.855), suspension-feeders less so (r = 0.537). In neither case was the partial correlation significantly weakened by controlling for possible intervening or prior variables. Both macrofaunal groups had an apparent 'preference' for fine-textured sediment independent of the effects of other variables. Inclusion of a causal path from mac- rofauna to grain-surface area made the rest of the model difficult to reconcile but evidence is strong that such an interaction (bioturbation) is to be expected, at least over time at a given site.
An apparent nonlinear relationship of macrofauna with median current speed, where maximum biomass was attained at stations of moderate current speed (=65 cm S-'), was produced by the positive relation- ship of macrofauna with current speed, grain-surface area, and bacterial biomass, and the negative relation-
ship of the latter 2 variables with current speed. Mac- rofaunal biomass increased with current speed only until sediment texture and bacteria (possibly the tur- bidity factor) were adversely affected sufficient to negate the positive, direct effects of current speed upon macrofauna. Experimental work and observa- tions of Wildish and Peer (1983) have corroborated this interpretation.
SUMMARY AND CONCLUSIONS
The distribution of biomass among different size classes of heterotrophic organisms is a conservative structural feature of benthic communities in the Bay of Fundy. Each sample represents a realization of the characteristic benthic biomass spectrum under given environmental conditions. There are 3 virtually non- overlapping size groups of heterotrophic benthic organisms. They have been described on the basis of pre-dominant lifestyle (Schwinghamer, 1981b) as mi- croscopic grain surface dwellers, interstitial proto- zoans plus micro-metazoans, and burrowing or seden- tary macroscopic surface dwellers. These are conven- tionally referred to as bacteria, meiofuna, and mac- rofauna, respectively. Microalgae occur in the bacte- rial and meiofaunal size range but must be regarded as a separate functional group.
Biomass spectra typical of benthic communities dif- fer from the pelagic biomass spectra observed by Shel- don et al. (1972), Harding et al. (1980), and Sprules and Knoechel (in press). Differences between biomass peaks and troughs can be 6 orders of magnitude in benthic communities, whereas in open-water com- munities these differences are adequately represented on an arithmetic scale. Furthermore, biomass is not distributed evenly over the size range of organisms in the benthos as it is in pelagic communities. Rather the highest biomass values tend to be in the largest size classes of macrofauna. At no station did bacterial or meiofauna reach, even within an order of magnitude, the biomass attained by sedentary macrofauna at Sta- tions G4, G5, G6, and G35. Smith (1976) observed that, where substrate and climate permit, biomass should concentrate in large long-lived species of sedentary habit that receive input energy and nutrients more or less passively. This appears to be consistent with the pattern of the biomass spectra in the Bay of Fundy benthos (see also Schwinghamer. 1981b).
The integral biomasses of each group of organisms defined by the biomass spectrum may be treated as single variables in causal analysis. This results in a great reduction in complexity of community models. Causal analysis indicated that each group responded to a unique set of variables:

Mar. Ecol. Prog. Ser 13: 151-166, 1983
(1) In spatial distribution, bacterial biomass exhi- bited the well established dependence upon sediment carbon and grain-surface area. In Peck's Cove over an annual cycle, macrofauna were seen to have a very strong positive influence upon bacteria, consistent with observations by Lopez et al. (1977) and Hargrave (1970).
(2) Algal biomass was thought to be largely allochthonous at the subtidal stations and was associ- ated with a nepheloid layer at the benthic surface in which detrital material was apparently concentrated. Over an annual cycle at Peck's Cove, however, algal biomass resulted from autochthonous production. Algal biomass was apparently less strongly related to temperature and incident solar radiation than to sedi- ment nitrogen at Peck's Cove.
(3) Meiofaunal biomass was largely a function of food abundance and physical properties of the sedi- ment. Meiofauna appeared to prefer sediments with higher fine sand content, but a complex of variables associated with a fluid benthic boundary layer may have been involved. Algal variance more strongly affected meiofaunal biomass than did bacterial var- iance, both temporally and spatially. On the other hand, no negative effect on meiofaunal grazing on either algae or bacteria was inferred from the data. Macrofauna exerted a negative influence upon meiofauna temporally at Peck's Cove, largely via depletion of algal biomass. This may be indicative of a size-dependent, competitive relationship between meiofauna and macrofauna. A size-efficiency hypothesis, similar to that proposed to account for planktonic size distributions in freshwater, is consis- tent with the temporal sequence of events observed at Peck's Cove.
(4) Macrofaunal biomass was, temporally, largely a function of exogenous predation and physical sedi- ment disturbance; there is no evidence that food sup- ply is the sole or strongest limiting factor. There is a major difference in the dynamics of food supply to the benthos between the Bay of Fundy and the more 'typi- cal' North Sea shelf and coastal areas, for example, where copepod faecal pellets presumably supply much of the organic input to the benthos (Steele, 1974). Thus, although tidal currents in the Bay of Fundy create a physically rigorous environment for benthic organ- isms, they also create feeding conditions suitable for the sustenance of large benthic populations. Spatially, macrofaunal biomass reached maximum levels at sta- tions with moderately high current speeds. Higher current speeds, although facilitating suspension feed- ing, adversely affected sediment quality (grain-surface area, % proportion of fine material, organic content), an effect felt most strongly by deposit-feeders, but also by suspension-feeders. Larval settlement of both
groups would be adversely affected by strong currents and unsuitable sediment properties such as coarse grain size and low carbon content (Newell, 1970; Gray, 1974). The great variability of macrofaunal biomass, both temporally and spatially, compared with that of bacteria or meiofauna, is a consequence of the longer generation time and larger size of the macrofauna. Effects of environmental differences among stations are magnified by macrofaunal production to a greater extent than by bacterial or meiofaunal production. This is simply because the presence of, for example, one individual of a large bivalve species in an area can represent a biomass in excess of the combined bacte- rial and meiofaunal biomass in that area. An exoge- nous disturbance can remove that individual more effectively than it can the diffuse biomass of smaller organisms, and with more lasting consequences because of the longer turnover times of large mac- rofauna compared to meiofauna and bacteria.
Adequate observation of phenomena at the com- munity level is greatly facilitated by using a body-size typology rather than a taxonomic one. The biomass spectra of benthic communities reveal an underlying unity of processes with the marine soft-bottom habitat and also allow comparison among benthic com- munities by parameters similarly defined in all benthic ecosystems. Use of the biomass spectrum as a commun- ity-level variable can help to define some problems in community ecology, possibly leading to a coherent theory of benthic community structure. It may be that many previous observations and speculations of benthic ecologists can be unified by use of a body-size
typolog~. Both the Peck's Cove and the August transect models
adequately account for most of the observed correla- tions within the data sets, indicating that few signifi- cant causal mechanisms have been excluded. In both models the amount of variance explained could have been increased by the addition of more variables or less proximate but more highly correlated variables. Such a strategy would have destroyed the heuristic value of the analytical approach adopted here in favour of a strictly statistical approach that would shed little light on the possible or plausible cause-effect relationship within the data set. The validity of models such as those presented here is dependent upon the intelligent specification of variables. The search for such variables continues to be a central activity of ecologists.
Acknowledgements. I am grateful to Dr. S. R. Kerr, Marine Ecology Laboratory, Bedford Institute of Oceanography for support, advice, and encouragement throughout this study and for useful comments on the manuscript.
Other members of the MEL staff provided generous logistic support, data, and stimulating discussion. I would like to

Schwinghamer: Ec :ological hypotheses
thank Dr. B. T. Hargrave, Mr. P. Keizer, Mr. D. Peer, Mr. N. Prouse, Dr. K. Kranck, Dr. L. M. Cammen and Dr. L. M. Dickie for the many kindnesses they extended to me during thls study. In particular, I thank Dr. D. C. Gordon, who inspired and co-ordinated the multi-disciplinary ecological studies of which this work is a part.
Dr. I. A. McLaren, Dr. R. W. Doyle, and Dr. E. L. Mills, Dalhousie University Biology Department, provided shmulat- ing ideas and comments throughout this work.
Of the many other individuals who have helped out, I thank, in particular: Mr. P. Hicklin, Dr. J . J . Kerekes, Mr. F. Amirault, and Mr. J . D. Robinson. Special thanks are due to Mr. B. E. Hopper for nematode identifications.
Financial support was in part through grants from the Natural Sciences and Engineering Research Council and Department of Fisheries and Oceans subventions to Dr. I. A. McLaren, and in part through a Dalhousie University gradu- ate fellowship.
Finally, I should like to thank my wife Sandra for many helpful comments and insights which have contributed to this work.
LITERATURE CITED
Ankar, S., Elmgren, R. (1976). The benthic macro and meiofauna of the Asko Landsort Area (Northern Baltic Proper). Contr. Asko Lab., No. 11. University of Stock- holm, Sweden
Anonymous (1975). Atlantic coast, approaches to Bay of Fundy. Canadian Hydrographic Service, Ottawa D?-4011
Anonymous (1978). Atlantic coast, Bay of Fundy (Inner Por- tion). Canadian Hydrographic Service, Ottawa D?-4010
Blalock, H. M., Jr. (1961). Causal inferences in non-experi- mental research. University of North Carolina Press, Chapel Hill, N.C.
Blalock, H. M,, Jr. (1969). Theory construction: from verbal to mathematical formulations. Prentice-Hall, Englewood Cliffs, N.J.
Blalock, H. M., Jr. (ed.) (1971). Causal models in the social sciences. Aldine-Atherton, Chicago
Brooks, J. , Dodson, I. (1965). Predation, body size, and com- position of plankton. Science, N. Y. 150: 28-35
Cammen, L. M. (1980). The significance of microbial carbon in the nutrition of the deposit feeding Polychaete Nereis succinea. Mar. Biol. 61: 9-20
Cammen, L. M., Walker, J. A. Microbial ecology of the Bay of Fundy. 11. Bacterial abundance in the sediment and over-- lylng water at a Cumberland Basin mudflat. Submitted to Can. J. Fish. Aquat. Sci.
Cassell, E. A. (1965). Rapid graphical method for estimating the precision of direct microscopic counting data. Appl. Microbiol. 13: 293-296
Costner, H. L., Schoenberg, R. (1973). Diagnostic indicator ills in mult~ple indicator models. In: Goldberger, A. S., Dun- can, 0. D. (ed.) Structural equation models in the social sciences. Seminar Press, New York, p. 167-199
Coull, B. C., Bell, S. S. (1979). Perspectives of marine meio- fauna1 ecology. In: Livingstone, R. J. (ed.) Ecological pro- cesses in coastal and marine systems. Plenum Press, New York, p. 189-216
Coull, B. C., Ellison, R. L., Fleeger, J . W., Higgins, R. P., Hope, W. D., Hummon, W. D., Rieger, R. M,, Sterrer, W. E., Thiel, H., Tietjen, J. H. (1977). Quantitative estimates of the meiofauna from the deep-sea off North Carolina, USA. Mar. Biol. 29: 233-240
Dale, N. G. (1974). Bacteria in intertidal sediments: factors
related to their distribution. Lirnnol. Oceanogr. 19: 509-518
Duncan, 0. D. (1966). Path analysis: sociological examples. Am. J. Sociol. 72: 1-16
Goldberger, A. S., Duncan, 0. D. (ed.) (1973). Structural equatlon models in the soclal sciences. Seminar Press, New York
Gordon, D. C., Jr., Keizer, P. D., Dale, J., Cranford, P. J . (1980). Peck's Cove mudflat ecosystem study: observations In 1978. Can. Tech. Rep. Fish. Aquat. Sci. 928: 1-17
Gray, J . (1974). Animal-sediment relationships. Oceanogr. mar. Biol. A. Rev. 12: 223-261
Greenberg, D. A. (1979). A numerical model investigation of tidal phenomena in the Bay of Fundy and Gulf of Maine. Mar. Geodesy 2: 161-187
Hall, D. J . , Threlkeld, S. T., Bums, C. W., Crowley, P. H. (1976). The size efficiency hypothesis and the size struc- ture of zooplankton communities. Ann. Rev. Ecol. Syst. 7: 177-208
Harding, G., Vass, P,, Pearre, S. (1980). Seasonal abundance, biomass, lipid content, size composition, and mean biomass of plankton. Marine Ecology Laboratory, Physical Oceanography, dissolved nutrients, phytoplankton pro- duction, plankton biomass, and sedimentation in St. Georges Bay, N. S., 1977. Can. Tech. Rep. Fish. aquat. Sci. 9342: 23-34
Hargrave, B. T. (1970). The effect of a deposit-feeding amphipod on the metabolism of benthic microflora. Lim- nol. Oceanogr. 15: 21-30
Hargrave, B. T., Phillips, G . A. (1977). Oxygen uptake of microbial communities on solid surface. In: Cairns, J. (ed.) Aquatic microbial communities. Garland Publ., New York, p. 545-587
Hargrave, B. T., Prouse, N. J . , Phillips, G. A., Neame, P. A. (1983). Primary production and respiration in pelagic and benthic communities at two intertidal sites In the upper Bay of Fundy. Can. J. Fish. Aquat. Sci. 40 (Suppl. 1): 229-243
Heise, D. R. (1975). Causal analysis. Wiley-Interscience, New York
Hobbie, J. E., Daley, R. J., Jasper, S. (1977). Use of nuclepore filters for counting bacteria by fluorescence microscopy. Appl. environ. Microbiol. 33: 1225-1228
Hopper, B. E. (1969). Marine nematodes of Canada. 11. Marine nematodes from the Minas Basin - Scots Bay area of the Bay of Fundy, Nova Scotia. Can. J. Zool. 47: 671-690
Hulberg, L. W., Oliver, J . S. (1980). Caging manipulations in marine soft-bottom cornrnunitles: importance of animal interactions or sedimentary habitat modifications. Can. J . Fish. Aquat. Sci. 37: 1130-1139
Johnston. J . (1972). Econometric methods, 2nd ed. McGraw Hill, New York
Kennedy, P. (1979). A guide to econometrics. MIT Press, Cambridge, Mass.
Kerr, S. R. (1974). Theory of size distribution in ecological communities. J . Fish. Res. Bd Can. 31: 1859-1862
Kerr, S. R. (1976). Ecological analysis and the Fry paradigm. J. Fish. Res. Bd Can. 33: 32G332
Ken, S. R. (1979). Prey availability, metaphoetesis, and the size structure of lake trout stocks. Investigacion pesq. 43: 187-198
Li, C. C. (1975). Path analysis - a primer. The Boxwood Press, Pacific Grove, California
Lopez, G. R., Levinton, J . S., Slobodkin, L. B. (1977). The effect of grazing by the detritivore Orchestia grillus on Spartina litter and its associated microbial community. Oecologia (Berl.) 30: 111-127

~vlar. Ecol. Prog. Ser
Mills, E. L. (1975). Benthic orgamsms and the structure of marine ecosystems. J. Fish. Res. Bd Can. 32: 1657-1663
Newell, R. C. (1970). Biology of intertidal animals. Logos Press, London
Nie, N. H., Hull, C. H., Jenkins, J. G., Steinbrenner, K., Bent, D. H. (1975). Statistical package for the social sciences, 2nd ed. McGraw Hill, New York
Pamatmat, M. M. (1968). Ecology and metabolism of a benthic community on an intertidal sand flat. Int. Revue ges. Hydrobiol. 53: 211-298
Parsons, T. R., Takahashi, M., Hargrave, B. (1977). Biological oceanographic processes, 2nd. ed. Pergammon Press, Ox- ford
Peer, D., Wildish, D. J., Wilson, A. J., Hines, J., Dadswell, M. (1980). Sublittoral macro-infauna of the lower Bay of Fundy. Can. Tech. Rep. Fish. Aquat. Sci. 981: 1-74
Platt, T., Denman, K. (1977). Organization in the pelagic ecosystem. Helgolhder wiss. Meeresunters. 30: 575-581
Rosen, R. (1977). Observation and biological systems. Bull. math. Biol. 39: 663-678
Salt, G . W. (1979). A comment on the use of the term emergent properties. Am. Nat. 113: 145-148
Schwinghamer, P. (1981a). Extraction of living meiofauna from marine sediments by centrifugation in a silica sol- sorbitol mixture. Can. J . Fish. aquat. Sci. 38: 476-478
Schwinghamer, P. (1981b). Characteristic size distributions of integral benthic communities. Can. J . Fish. aquat. Sci. 38: 1255-1263
Sheldon, R. W., Prakash, A., Sutcliffe, W. H., Jr. (1972). The size distribution of particles in the Ocean. Limnol. Oceanogr. 17: 327-340
Sheldon, R. W., Sutcliffe, W. H., Jr., Paranjape, M. A. (1977). Structure of pelagic food chain and relationship between plankton and fish production. J. Fish Res. Bd Can. 34: 2344-2353
Siegel, S. (1956). Nonparametric statistics for the behavioral sciences. McGraw Hill, New York
Silvert. W. (1981). Top-down modelling of multi-species fisheries. In: Mercer, M. C. (ed.) Multi-species approaches to fisheries management advice. Can. Spec. Publ. Fish. Aquat. Sci. 58
Smith, F. E. (1976). Ecosystems and evolution. Bull. ecol. Soc. Am., Spring 1976: 2-6
Sprules, W. G., Holtby, L. B. (1979). Body size and feeding ecology as alternatives to taxonomy for the study of lirnne- tic zooplankton community structure. J. Fish. Res. Bd Can. 36: 1354-1363
Sprules, W. G., Knoechel, R. (in press). Lake ecosystem dynamics based on functional representations of trophic components. In: Myers, D., Strickler, R. (ed.) Tropho- dynamics in aquatic ecosystems. AAAS Symposium. Washington, D. C.
Steele, J . H. (1974). The structure of marine ecosystems. Harvard University Press, Cambridge, Mass.
Swift, D. J. P., Pelletier, B. R., Lyall, A. K., Miller, J. A. (1973). Quaternary sedimentation in the Bay of Fundy. Earth Science Symposium on Offshore Eastern Canada. Geol. SW. Can. Pap. 71-23: 113-151
Tietjen, J. H. (1971). Ecology and distribution of deep-sea meiobenthos off North Carolina. Deep Sea Res. 18: 94 1-957
Thiel, H. (1975). The size structure of the deep-sea benthos. Int. Revue ges. Hydrobiol. 60: 575-606
Ware, D. M. (1977). Spawning time and egg size of Atlantic mackerel. Scomber scombms, in realtion to the plankton. J. Fish. Res. Bd Can. 34: 2308-2315
Warwick, R. M,, Joint, I. R., Radford, P. J . (1979). Secondary production of the benthos in an estuarine environment. In: Jeffries, R. L., Davy, A. J. (ed.) Ecological processes in coastal environments. Blackwell Scientific Publications, London, p. 4 2 W 5 0
Wigley, R. L., McIntyre, A. D. (1964). Some quantitative com- parisons of offshore meiobenthos and macrobenthos south of Martha's Vineyard. Limnol. Oceanogr. 9: 485-493
Wildish, D., Peer, D. (1983). Tidal current speed and produc- tion of benthic macrofauna in the Bay of Fundy. Can. J. Fish. aquat. Sci. 40 (Suppl. 1): 209-321
Williams, R. (1972). The abundance and biomass of the inter- stitial fauna of a graded series of shell-gravels in relation to the available space. J . Anim. Ecol. 41: 623-646
Wright, S. (1960). Path coefficients and path regressions: alternative or complementary concepts? Biometrics 16: 189-202
This paper was presented by Dr. R. J. Conover; it was accepted for printing on May 16. 1983