genetics - mr. hill's science websitemrscienceut.net/genetics.pdf · the dna they inherit from...
TRANSCRIPT

Genetics

Are Fingerprint Patterns Inherited? (from http://www.sciencebuddies.com)
Objective
In this science project, you'll collect, categorize, and compare the fingerprints of siblings versus unrelated pairs of individuals to determine if fingerprint patterns are inherited. Introduction
During weeks 10 through 24 of gestation, ridges are formed on the epidermis, which is the outermost layer of skin, on your fingertips. The pattern that these ridges make is known as your fingerprint. Fingerprints are static and do not change with age, so an individual will have the same fingerprint from infancy to adulthood. The pattern changes size, but not shape, as the person grows. (To get a better idea of how that works, you can model the change in size by inking your fingerprint onto a balloon and then blowing up the balloon.) Since each person has unique fingerprints that do not change over time, they can be used for identification. For example, police use fingerprints to determine whether a particular individual has been at a crime scene. Although the exact number, shape, and spacing of the ridges changes from person to person, fingerprints can be sorted into three general categories based on their pattern type: loop, arch, and whorl.
The three fingerprint patterns are illustrated here (FBI website).
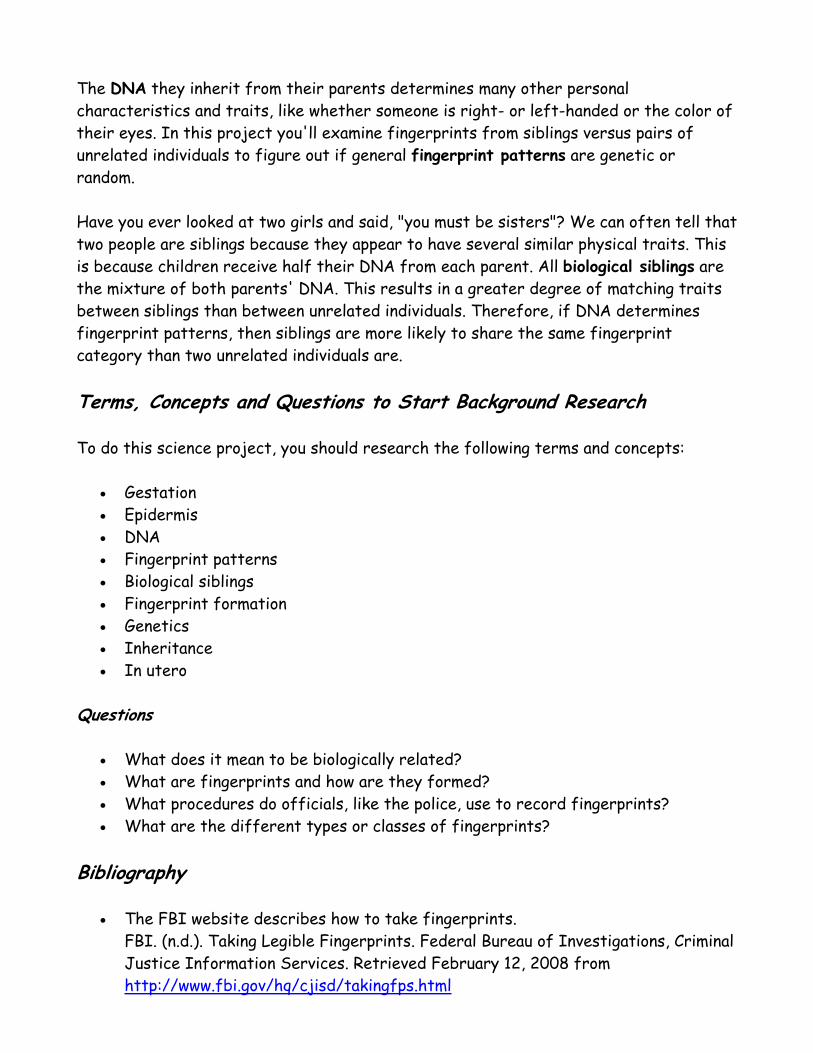
The DNA they inherit from their parents determines many other personal characteristics and traits, like whether someone is right- or left-handed or the color of their eyes. In this project you'll examine fingerprints from siblings versus pairs of unrelated individuals to figure out if general fingerprint patterns are genetic or random. Have you ever looked at two girls and said, "you must be sisters"? We can often tell that two people are siblings because they appear to have several similar physical traits. This is because children receive half their DNA from each parent. All biological siblings are the mixture of both parents' DNA. This results in a greater degree of matching traits between siblings than between unrelated individuals. Therefore, if DNA determines fingerprint patterns, then siblings are more likely to share the same fingerprint category than two unrelated individuals are. Terms, Concepts and Questions to Start Background Research To do this science project, you should research the following terms and concepts:
• Gestation • Epidermis • DNA • Fingerprint patterns • Biological siblings • Fingerprint formation • Genetics • Inheritance • In utero
Questions
• What does it mean to be biologically related? • What are fingerprints and how are they formed? • What procedures do officials, like the police, use to record fingerprints? • What are the different types or classes of fingerprints?
Bibliography
• The FBI website describes how to take fingerprints. FBI. (n.d.). Taking Legible Fingerprints. Federal Bureau of Investigations, Criminal Justice Information Services. Retrieved February 12, 2008 from http://www.fbi.gov/hq/cjisd/takingfps.html

• This Australian police website describes fingerprints, how they're formed, and their uses in forensics. Lennard, C. and Patterson, T. (2003). Dactyloscopy: The Science of Fingerprinting. New South Wales Police Service. Retrieved February 12, 2008 from http://www.policensw.com/info/fingerprints/indexfinger.html
• This Wikipedia entry gives an overview of fingerprints and their history. Wikipedia contributors. (2006). Fingerprints. Wikipedia, The Free Encyclopedia. Retrieved February 12, 2008 from http://en.wikipedia.org/w/index.php?title=Fingerprint&oldid=190845125
Materials and Equipment Before starting this science project, you should gather together these items:
• Black ink pad • White paper • Paper towel • Moist towelettes for cleaning hands (cotton balls dipped in rubbing alcohol will
also work) • Magnifying glass
Experimental Procedure
1. To start this science project, practice taking reliable clear fingerprints. Ask a friend or family member to let you learn by using his or her fingers.
a. Use a moist towelette to clean the person's right index finger. b. Thoroughly dry the finger with a paper towel. c. Roll the right index finger on a black ink pad. d. Then roll the inked finger onto white paper using light but constant
pressure. e. Use another towlette to clean the person's inked finger. f. Perfect your technique until fingerprints come out clear each time.
2. Make up a consent form for your project. Because fingerprints can be used to identify people, you'll need their consent to take and use their fingerprints.
3. Take fingerprints of pairs of siblings and of pairs of unrelated people. a. Make sure they sign a consent form BEFORE you take the fingerprint. b. Use the cleaning and inking system you developed to take the fingerprint of
each person's right index finger. c. Label each fingerprint with a unique code, which will tell you which pair the
fingerprint belongs to and whether that is a sibling pair or an unrelated pair. An example of an appropriate code would be to give each pair a

number and each individual a letter. Siblings would be labeled as subjects A and B while unrelated individuals would be labeled as subjects D and Z. Thus, fingerprints from a sibling pair might carry the codes 10A and 10B while fingerprints from a unrelated pair might be labeled 11D and 11Z.
d. Collect fingerprints from at least 15 sibling pairs and 15 unrelated pairs. For unrelated pairs, you can actually use sibling 1A with sibling 2B since these individuals are not related to each other. The more pairs you look at in your science project, the stronger your conclusions will be! For a more in-depth look at how the number of participants affects the reliability of your conclusions, see: "Sample Size: How Many Survey Participants Do I Need" at http://www.sciencebuddies.org/science-fair-projects/project_ideas/Soc_participants.shtml.
4. Examine each fingerprint using your magnifying glass and characterize it as a whorl, arch, or loop pattern. Fill out a data sheet like the one below.
Related Pairs (unique ID) Fingerprint Category (arch/whorl/loop)
Category match? (yes/no)
10A 10B
Unrelated Pairs (unique ID) Fingerprint Category (arch/whorl/loop)
Category match? (yes/no)
11D 11Z
5. Compare the percentage of related pairs whose fingerprint patterns match to the
percentage of unrelated pairs whose fingerprint patterns match. a. Are they the same? Which is higher? b. What does this tell us about whether fingerprints are genetic? c. Identical twins share 100% of their DNA. Does your data include any
identical twins? Do they have the same fingerprint pattern? Variations
• How do your results change if you compare all 10 fingers, rather than just 1? Do all 10 fingers from the same person have the same fingerprint?
• Toes also have ridge patterns. Do "toe prints" follow the same rules as fingerprints?

• Are some patterns more common than others? • If you make more quantitative measurements of the fingerprint patterns, can
they be used to predict sibling pairs? With what degree of accuracy? • If fingerprints are unique, why do misidentifications occur in forensics? How easy
or hard is it to match a fingerprint with an individual? • Read about statistics and use a mathematical test (like Fisher's exact test) to
determine if your findings are statistically relevant. To do this, you'll need to make sure you understand p values and you'll need to think about whether your sample size is large enough. Online calculators, like the one from GraphPad Software - http://www.graphpad.com/quickcalcs/contingency1.cfm, are good resources for this analysis.

How Much DNA Can You Pack into a Cell? (from http://www.sciencebuddies.com)
Objective In this science project you will determine whether there is a correlation between an animal's genome size and cell nucleus size. Introduction Every living organism, whether it's a rose, a bacterium, a fly, or an elephant, has a set of blueprints telling its cells how to form the organism, how to make all the proteins it needs, and how to function. These blueprints are stored as deoxyribonucleic acid (DNA) in the organism's cells. There are four different DNA units, or nucleotide bases: adenine (A), thymine (T), guanine (G), and cytosine (C). A nearly infinite number of combinations can be made from repeating these four bases in sequences of different lengths, leading to very precise instructions on how to build organisms as different as a human and a jellyfish. It takes a lot of nucleotide bases to set out all the instructions an organism needs. The total set of instructions for a human is over 3 billion nucleotides and would stretch almost 6 feet in length if you lined up all the bases! Yet all this DNA has to fit into a cell—almost every single cell in an organism contains the same set of DNA. To make it all fit, the DNA is tightly wound into structures called chromosomes and packaged into a membrane-bound compartment in the cell, called the nucleus. Many organisms are diploid, meaning they have two copies of every chromosome—one from their mother and one from their father. A single copy of all the chromosomes is referred to as the genome. For example, humans have 23 pairs of chromosomes (for a total of 46 individual chromosomes) and the human genome consists of a single copy of each of those 23 chromosomes. Genome size is measured in terms of weight. The more DNA there is, the greater the weight, and the larger the genome. Genome size is often reported in a tiny unit of measurement called picograms (pg)—that's a trillionth of 1 gram. Picogram measurements of genome size are also referred to as an organism's C-value, and are used to compare the size of genomes across different species. There is a large variation in genome size among different animals. However, genome size is not correlated with the complexity of the animal or even with the number of genes it

has. Much of the variation in genome size is from sequences of DNA that do not code for proteins. Scientists are still trying to figure out why genome size varies so much. To give you an idea of the range in genome size, the smallest animal genome, belonging to the plant-parasitic nematode Pratylenchus coffeae, is 0.02 pg, while the largest animal genome, from the marble lungfish Protopterus aethiopicus, is just over 132 pg. That's more than a 6,000-fold difference in DNA content! That means the lungfish has to fit a lot more DNA into its nuclei than the nematode does. Does this lead to a change in the size of the nucleus? Is there a correlation between genome size and nucleus size? In this science project you'll use two databases to determine the answer. You'll record both the C-value, from the Animal Genome Size Database, and the nucleus size from the Cell Size Database, of different amphibians, birds, and fish, then graph the data to see if there is a relationship between genome size and nucleus size. You won't be able to include mammals in this comparison because the Cell Size Database uses erythrocyte (red blood cell) measurements, and mammals are an exception because their erythrocytes don't have nuclei. But the rest of the animal kingdom does, so let's get graphing!
Figure 1. The light brown cells shown here are avian erythrocytes. Notice the dark oval in the middle of each erythrocyte—this is the nucleus where the genome is stored. (G. Kaufman, 2000.)
Terms, Concepts and Questions to Start Background Research
• Deoxyribonucleic acid (DNA) • Nucleotide base (also called nucleotide) • Adenine (A) • Thymine (T) • Guanine (G) • Cytosine (C)

• Chromosome • Nucleus • Diploid • Genome • Picogram (pg) • C-value • Correlation • Erythrocyte
Questions
• What is a genome? • How is genome size measured? • Where is DNA stored in animal cells? • How do you determine if two variables are correlated?
Bibliography You will use these two databases to gather the data for this science project.
• Gregory, T.R. (2003, October 16). Cell Size Database. Retrieved May 10, 2008 from http://www.genomesize.com/cellsize/
• Gregory, T.R. (2008). Animal Genome Size Database. Retrieved May 10, 2008 from http://www.genomesize.com
These websites offer definitions and information about DNA and genomes. • GlaxoSmithKline. (2006). Kids Genetics. Retrieved May 10, 2008 from
http://www.genetics.gsk.com/kids/index_kids.htm • National Human Genome Research Institute. (2007, December 27). A Brief Guide
to Genomics. Retrieved May 10, 2008 from http://www.genome.gov/18016863 • National Center for Biotechnology Information. (2004, March 31). What Is a
Genome? Retrieved May 10, 2008 from http://www.ncbi.nlm.nih.gov/About/primer/genetics_genome.html
These websites offer help with creating graphs and more information about correlation. • National Center for Education Statistics. (n.d.). Create a Graph. Retrieved May
10, 2008 from http://nces.ed.gov/nceskids/CreateAGraph/default.aspx • Olsen, A. (2006, April 20). Which Team Batting Statistic Predicts Run Production
Best? Retrieved June 12, 2008 from http://www.sciencebuddies.org/science-fair-projects/project_ideas/Sports_p003.shtml
• Hunt, N., Tyrrell, S., and Nicholson, J. (2002, March 25). DISCUSS: Regression and Correlation. Retrieved May 10, 2008 from http://www.coventry.ac.uk/ec/~nhunt/regress/index.html

Materials and Equipment
• Computer with Internet access • Lab notebook • Graph paper • Spreadsheet or statistics program, like Microsoft® Excel® (optional)
Experimental Procedure
1. To start this science project, gather information about the nucleus size of a variety of animals using the Cell Size Database http://www.genomesize.com/. You will be using the nucleus area (NA) for the nucleus size data. These are tiny areas, millionths of a square meter (μm2), calculated from cell measurements made using microscopes.
a. Start by opening the "Amphibians" data set. Copy the category ("Amphibian"), scientific name, and nucleus area information for a minimum of 20 different amphibians into a data table in your lab notebook. You will be able to record the common name and C-value in the next step. Your data table should look similar to the one below.
If you prefer, you can input the data directly into a spreadsheet program like Microsoft Excel and print a copy for your lab notebook when you are done.
b. Important: Make sure to scroll through the full data set and choose amphibians that represent the whole range of measured nucleus areas. You can see they range from 18.10 μm2 to 412.71 μm2. If you choose from too small of a range you might be skewing your data and either creating a trend where there isn't one, or failing to see a trend that would be there if you looked at the entire range.
2. Once you have nucleus area data for at least 20 amphibians, find their C-values in the Animal Genome Size Database http://www.genomesize.com/.
a. From the database homepage, select "Search Data" from the options on the left- hand side of the screen.
b. Type the scientific name of the first amphibian on your data table into the "Species:" search box. Leave all other fields as is. Record the animal's common name and C-value in your data table.
Occasionally, more than one C-value will be listed. This is because different groups of scientists have reported different experimental findings in genome size for the same organism. For this science project, take the average of all the C-values reported and use that average as the animal's C-value.

The Animal Genome Size Database also lists the common name for all the animals; you can add this to your data chart too, so you have a better idea of what these amphibians are.
3. Not all animals listed in the Cell Size Database will be listed in the Animal Genome Size Database. You may not find data for all 20 amphibians on your list. Repeat steps 1 and 2 until you have both nucleus area and C-value data for a minimum of 15 amphibians. This may require a bit of patience!
Scientific Name
Common Name
Category (Amphibian, Bird, etc.)
Nucleus Area (NA) (μm2)
C-value (pg)
4. Repeat steps 1-3 for 20 birds and 20 fish (or 15, if you cannot obtain data for
20). a. In the end, you should have a data table with at least 15 amphibians, 15
birds, and 15 fish, all with nucleus area and C-value measurements. b. If you have fewer than 45 animals total, you might have too few data points
to determine if there is any correlation between nucleus size and genome size.
5. Analyze the data you've gathered by creating a scatterplot. This can be done by hand on graph paper, or on the computer using either a spreadsheet program like Microsoft Excel or a website like Create a Graph http://nces.ed.gov/nceskids/createagraph/. Note: In both Microsoft Excel and Create a Graph, scatterplot is a sub-option found under XY-graphs.
a. For each animal, place the C-value data on the x-axis and the nucleus area on the y-axis.
b. Draw a best-fit line on your graph. This is a line that best sums up your data.
If you are drawing this line by hand, try to make it go through the middle of the cloud of data points such that most data points fall evenly on one side or the other. Don't worry if there are some extreme outliers that don't fit the best-fit line.
If you are using Microsoft Excel, you can have the program add a best-fit line. Use the "Help" features in the program to find out how to do this. Note: Microsoft Excel refers to the best-fit line as a "trend line."
c. Using the best-fit line, determine what your data tells you about the relationship between nucleus size and genome size. Is there any

correlation? If so, is it a negative correlation (i.e., the two measurements move in opposite directions) or a positive correlation (i.e., the two measurements move in the same direction). If there is a correlation, would you describe it as strong or weak?
d. Optional: The correlation between two variables can be described by statistics. Advanced students should calculate the Pearson correlation coefficient, r, for their data. If you need help with this calculation the Which Team Batting Statistic Predicts Run Production Best? science project has a step-by-step introduction to correlation and linear regression. Note: Excel will calculate r2 and the slope of the trend line; you can back-calculate r from r2.
Variations
• In the science project above you looked for a correlation between nucleus size and genome size. If you use cell area rather than nucleus area, do you get the same result? What does this tell you about the relationship between cell size and nucleus size? Can you use data from the Cell Size Database http://www.genomesize.com/cellsize/ to directly test your hypothesis about the relationship between nucleus size and cell size?
• Mammal erythrocytes do not have nuclei, but is there still a relationship between the size of the erythrocytes and the genome size? Mean corpuscular volume (MCV), is a measurement of the volume of a cell. Use the MCV data for mammals, amphibians, and fish from the Cell Size Database http://www.genomesize.com/cellsize/ to determine if cell size and genome size follow the same trend in mammals as they do in other vertebrates.
Learning Your A, G, C’s (and T, Too) (from http://sciencebuddies.com/science-fair-
projects/project_ideas/Genom_p005.shtml?fave=no&isb=c2lkOjEsaWE6R2Vub20scDoxLHJpZDozMTI5Mzg1&from=TSW)
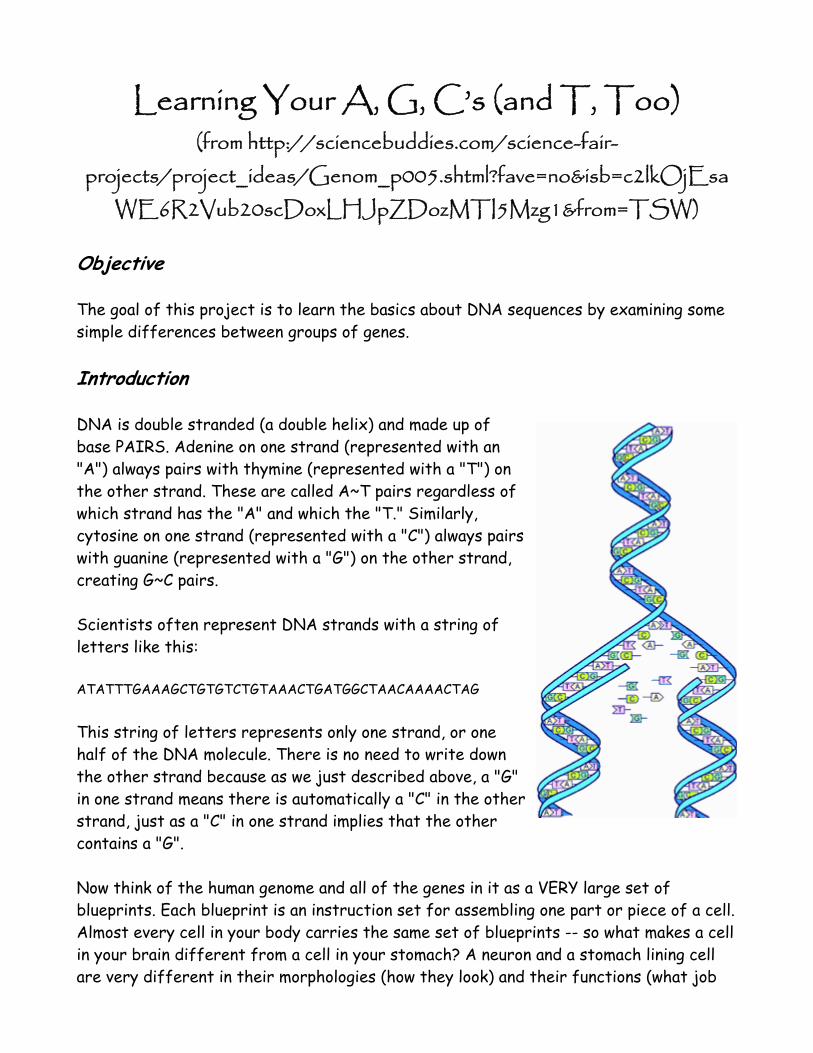
Objective The goal of this project is to learn the basics about DNA sequences by examining some simple differences between groups of genes. Introduction DNA is double stranded (a double helix) and made up of base PAIRS. Adenine on one strand (represented with an "A") always pairs with thymine (represented with a "T") on the other strand. These are called A~T pairs regardless of which strand has the "A" and which the "T." Similarly, cytosine on one strand (represented with a "C") always pairs with guanine (represented with a "G") on the other strand, creating G~C pairs. Scientists often represent DNA strands with a string of letters like this: ATATTTGAAAGCTGTGTCTGTAAACTGATGGCTAACAAAACTAG This string of letters represents only one strand, or one half of the DNA molecule. There is no need to write down the other strand because as we just described above, a "G" in one strand means there is automatically a "C" in the other strand, just as a "C" in one strand implies that the other contains a "G". Now think of the human genome and all of the genes in it as a VERY large set of blueprints. Each blueprint is an instruction set for assembling one part or piece of a cell. Almost every cell in your body carries the same set of blueprints -- so what makes a cell in your brain different from a cell in your stomach? A neuron and a stomach lining cell are very different in their morphologies (how they look) and their functions (what job

they do). The different shapes and functions are a result of the fact that those two cells use different portions of the complete blueprint set to construct themselves. The neuron uses the blueprints for parts involved in brain signaling, while the stomach cell does not. The stomach cell makes parts for secreting stomach enzymes to help in food digestion, while the brain cell does not. These kinds of blueprints (or genes) are often called "tissue specific" because they are used in some body parts and not in others. However, there are also some blueprints that are used in every cell in the body because the parts they represent are needed in every cell (like pieces used during cell division or making energy). These kinds of blueprints (or genes) are often called "housekeeping" because they represent a basic need of every cell and they "keep up" the basic functions of the cell. How does the cell know which blueprints to use? Each gene (or blueprint) is has its own control panel that acts as a group of switches affecting when (during an organism's development), where (in the body) and how much a particular blueprint is used. Scientists are still working hard at being able to identify all of the pieces of a gene's control panel. One important part of the control panel that we know a lot about is the "promoter." The number and pattern of As, Ts, Gs and Cs in a promoter is important in determining whether the switch will act like a "housekeeping" switch or a "tissue specific" switch. As of today, scientists are just beginning to understand why this is true. Terms, Concepts and Questions to Start Background Research
• DNA, gene • Nucleotide bases (adenine, thymine, guanine, cytosine)
Bibliography Background knowledge/info:
• Genetic Science Learning Center: http://gslc.genetics.utah.edu/units/basics/ • Understanding Genetics: http://www.thetech.org/genetics/ See the "Zooming
into DNA" link. • NHGRI Education: http://www.genome.gov/Education/ See the book "From
Blueprint to You." • The online encyclopedia Wikipedia has a slightly more advanced discussion of
DNA. http://en.wikipedia.org/wiki/Deoxyribonucleic_acid Experimental Procedure

In this experiment, you will compare housekeeping promoters to other genes by calculating the percentage of G~C content. This will make sense in a minute! How to calculate the G~C pair content of a DNA sequence:
1. Count the total number of G's and C's. Try it for this sample:
ATATTTGAAAGCTGTGTCTGTAAACTGATGGCTAACAAAACTAG You should get a total count of 15 (9 G's and 6 C's).
2. Now count the total number of letters (bases). You should get 44. 3. %G~C pair content = (Count of G's and C's / Total count of all bases)*100
So, for our sample, the %G~C pair content = (15/44)*100 or 34% Now, let's perform the experiment: Step 1: Formulate your hypothesis. Which do you think might be true?
a. Housekeeping promoters will have lower G~C content than other genes, b. Housekeeping promoters will have higher G~C content than other genes, or c. Housekeeping promoters will have similar G~C content to other genes.
Step 2: Calculate the %G~C content for each sequence listed below on this page. We have provided partial DNA sequences for three housekeeping promoters, three tissue specific promoters, and for comparison, a number of additional genes of the sort that the promoters would regulate and control. Time saver! Do the first couple sequences "by hand," but then you can use the Genomics % G~C Content Calculator. http://sciencebuddies.com/mentoring/project_ideas/Genom_GC_Calculator.shtml. To use the calculator:
1. Copy and paste the DNA sequence you want to analyze into the box. 2. Press "Calculate" to count the bases and determine the %G~C content. 3. Record your results. 4. Press "Clear Form" to clear all the fields, preparing the calculator for its next
count. Step 3: Record your results in a table with the % G~C content in one column and the name of the sequence in the second column. Fill the table out as you do your calculations. It should look like this:

%G~C Content Sequence Name Type of Gene
48% Bone Morphogenetic Protein 5 (BMP5) Tissue specific promoter
... ... ...
Step 4: Sort the rows of the table, so that the highest %G~C content is at the top, the next highest percentage appears second, the third highest percentage appears third, and so forth. When you are done, the very lowest %G~C content should be at the bottom. If you need or want to do a graph for your science fair project (it's almost always a good idea to do so), you can also do a bar chart showing the %G~C content for each gene. Step 5: Draw your conclusion. What can you say about housekeeping promoters? How does their %G~C content compare to tissue specific promoters? How does the %G~C content of the housekeeping promoters compare to other genes of the sort that the promoters would regulate and control (bone morphogenetic protein 7, leptin, opsin, and cystic fibrosis genes)? DNA Sequences for Your Experiment Here are the sequences to use for your experiment. Note that these are partial sequences for the molecules; the full sequence is generally much longer. Housekeeping Promoters:
1. Heat Shock Protein 90 (HSP90): When proteins get over-heated, their folding and conformation gets messed up which often affects their function. Heat Shock Proteins repair the unfolded proteins back to their working state.
GCGCGCTGGGCGGGCCCGTGGCTATATAAGGCAGGCGCGGGGGTGGCGCG
2. Glucose-6-phosphate Dehydrogenase (G6PD): This molecule is a member of a team
that helps protect each cell from agents that damage important proteins.
CAGGCGCCCGCCCCCGCCCCCGCCGATTAAATGGGCCGGCGGGGCTCAGC

3. Beta-actin (ACTB): Actin proteins help the cell make an internal "skeleton" that maintains the cell's proper shape.
CGAGCGGCCGCGGCGGCGCCCTATAAAACCCAGCGGCGCGACGCGCCACC
Tissue Specific Promoters:
1. Bone Morphogenetic Protein 5 (BMP5): Bone morphogenetic proteins help induce the growth of new bone.
TCCCAGCAGGGTTGTGCTTACACTACTCTTTAGATCTCTCTTGAAGAGGG
2. Hemoglobin Beta (HBB): Part of hemoglobin which carries iron molecules in blood
cells.
CAGGAGCCAGGGCTGGGCATAAAAGTCAGGGCAGAGCCATCTATTGCTTA
3. GABA Receptor A1 (GABRA1): An important receptor of chemical signals that travel only in the brain.
TTTGCCCTGGGACGTATTACTACTGTCTTGGTAAAGAGAAATCTTTTGTT
Bone Morphogenetic Protein 7 Genes: Here is a partial DNA sequence from humans, pig, rabbit, and sheep for the Bone Morphogenetic Protein 7 gene (BMP7). You will notice that the sequences are not exactly the same. Bone Morphogenetic Proteins represent signals found in the body that help induce bone growth.
1. Human BMP7
AGAACCGCTCCAAGACGCCCAAGAACCAGGAAGCCCTGCGGATGGCCAACGTGGCAGAG AACAGCAGCAGCGACCAGAGGCAGGCCTGTAAGAAGCACGAGCTGTATGTCAGCTTCCG AGACCTGGGCTGGCAGGACTGGATCATCGCGCCTGAAGGCTACGCCGCCTACTACTGTG AGGGGGAGTGTGCCTTCCC
2. Pig BMP7 AGAACCGCTCCAAGACGCCCAAGAACCAGGAAGCCCTGCGGGTGGCCAACGTCGCAGAG AACAGCAGCAGTGACCAGCGGCAGGCCTGTAAGAAGCATGAGCTCTACGTCAGCTTCCG GGACCTGGGCTGGCAAGACTGGATCATCGCGCCCGAAGGCTATGCCGCCTACTACTGCG AGGGGGAGTGCGCCTTCCC

3. Rabbit BMP7
AGAACCGCTCCAAGGCACCCAAGAACCAAGAGGCGCTGCGAGTGGCCAACGTGGCAGAA AACAGCAGCAGTGACCAGCGGCAGGCGTGCAAGAAACACGAACTGTACGTCAGCTTCCG CGACCTGGGCTGGCAGGATTGGATCATTGCCCCGGAAGGCTACGCCGCCTACTACTGCG AGGGAGAGTGCGCCTTCCC
4. Sheep BMP7
AGAATCGCTCCAAGGCGCCCAAGAACCAAGAAGCCCTGCGGGTGGCCAACGTCGCAGAA AACAGCAGCAGTGACCAGAGGCAGGCATGTAAGAAGCACGAGCTATACGTCAGCTTCCG GGACCTGGGCTGGCAGGATTGGATCATCGCACCCGAAGGCTATGCCGCCTACTACTGCG AGGGGGAGTGCGCCTTCCC Leptin Genes: Here is a partial DNA sequence from humans, cow, dog, and horse for Leptin (LEP), a signal found in the body that tells your brain how much fat you have stored away. Leptin may help regulate how hungry you feel. You will notice that the sequences are not exactly the same.
1. Human Leptin TGTGGCTTTGGCCCTATCTTTTCTATGTCCAAGCTGTGCCCATCCAAAAAGTCCAAGAT GACACCAAAACCCTCATCAAGACAATTGTCACCAGGATCAATGACATTTCACACACGCA GTCAGTCTCCTCCAAACAGAAAGTCACCGGTTTGGACTTCATTCCTGGGCTCCACCCCA TCCTGACCTTATCCAAGATGGACCAGACACTGGCAGTCTACCAACAGATCCTCACCAGT ATGCCTTCCAGAAACGTGATCCAAATATCCAACGACCTGGAGAACCTCCGGGATCTTCT TCACGTGCTGGCCTTCTCTAAGAGCTGCCACTTGCCCTGGGCCAGTGGCCTGGAGACCT TGGACAGCCTGGGGGGTGTCCTGGAAGCTTCAGGCTACTCCACAGAGGTGGTGGCCCTG AGCAGGCTGCAGG
2. Cow Leptin TGTGGCTTTGGCCCTATCTGTCTTACGTGGAGGCTGTGCCCATCCGCAAGGTCCAGGAT GACACCAAAACCCTCATTAAGACAATTGTCACCAGGATCAATGACATCTCACACACGCA GTCCGTCTCCTCCAAACAGAGGGTCACTGGTTTGGACTTCATCCCTGGGCTCCACCCTC TCCTGAGTTTGTCCAAGATGGACCAGACATTGGCGATCTACCAACAGATCCTCACCAGT CTGCCTTCCAGAAATGTGGTCCAAATATCCAATGACCTGGAGAACCTCCGGGACCTTCT

CCACCTGCTGGCCGCCTCCAAGAGCTGCCCCTTGCCGCAGGTCAGGGCCCTGGAGAGCT TGGAGAGCTTGGGCGTTGTCCTGGAAGCTTCCCTCTACTCCACCGAGGTGGTGGCCCTG AGCCGGCTGCAGG
3. Dog Leptin TGTGGCTCTGGCCCTATCTGTCCTGTGTTGAAGCTGTGCCAATCCGAAAAGTCCAGGAC GACACCAAACCCCTCATCAAGACGATTGTCGCCAGGATCAATGACATTTCACACACTCA GTCTGTCTCCTCCCAACAGAGGGTCGCTGGTCTGGACTTCATTCCTGGGCTCCAACCAG TCCTGAGTTTGTCCAGGATGGGCCAGACGTTGGCCATATACCAACAGATCCTCAACAGT CTGCATTCCAGAAATGTGGTCCAAATATCTAATGACCTGGAGAACCTCCGGGACCTTCT CCACCTGCTGGCCTCCTCCAAGAGCTGCCCCTTGCCCCGGGCCAGGGGCCTGGAGACCT TTGAGAGCGTGGGCGGCGTCCTGGAAGCCTCACTCTACTCCACAGAAGTGGTGGCTCTG AACAGACTGCAGG
4. Horse Leptin TGTGGCTTTGGCCCTATCTGTTCTTCATTGAAGCTGTGCCCATCCGAAAAGTCCAGGAT GACACCAAAACCCTCATCAAGACGATTGTCACCAGGATCAATGACATTTCACACACGCA GTCAGTCTCCTCCAAACAGAGGGTCACTGGTTTGGACTTCATTCCTGGGCTTCACCCTG TCCTGAGTTTGTCCAAGATGGACCAGACATTGGCAATCTACCAACAGATCCTTACAAGT CTGCCTTCCAGAAATGTGATCCAGATATCTAATGACCTGGAGAACCTCCGGGACCTTCT CCACCTGCTGGCCTCCTCCAAGAGTTGCCCCTTGCCCCAGGCCAGGGGTCTGGAGACCT TGGCGAGCCTGGGCGGTGTCCTGGAAGCTTCACTCTACTCCACAGAGGTGGTAGCCCTG AGCAGGCTGCAGG Other genes:
1. Here is a partial DNA sequence for the human Cystic Fibrosis gene (CFTR). In the body this gene's product is involved in making sure mucous doesn't build up in the lungs and that the pancreas secretes the right enzymes to help you digest your food. If this gene is damaged, a patient gets Cystic Fibrosis.
ATATTTGAAAGCTGTGTCTGTAAACTGATGGCTAACAAAACTAGGATTTTGGTCACTTC TAAAATGGAACATTTAAAGAAAGCTGACAAAATATTAATTTTGAATGAAGGTAGCAGCT ATTTTTATGGGACATTTTCAGAACTCCAAAATCTACAGCCAGACTTTAGCTCAAAACTC ATGGGATGTGATTCTTTCGACCAATTTAGTGCAGAAAGAAGAAATTCAATCCTAACTGA GACCTTACACCGTTTCTCATTAGAAGGAGATGCTCCTGTCTCCTGGACAGAAACCAATC TTTTAAACAGACTGGAGAGTTTGGGGAAAAAAGGAAGAATTCTATTCTCAATCCAATCA ACTCTATACGAAAATTTTCCATTGTGCAAAAGACTCCCTTACAAATGAATGGCATCGAA GAGGATTCTGATGAGCCTTTAGAGAGAAGGCTGTCCTTAGTACCAGATTCTGAGCAGGG

AGAGGCGATACTGCCTCGCATCAGCGTGATCAGCACTGGCCCCACGCTTCAGGCACGAA GGAGGCAGTCTGTCCTGAACCTGATGACACACTCAGTTAACCAAGGTCAGAACATTCAC CGAAAGACAACAGCATCCACACGAAAAGTGTCACTGGCCCCTCAGGCAAACTTGACTGA ACTGGATATATATTCAAGAAGGTTATCTCAAGAAACTGGCTTGGAAATAAGTGAAGAAA TTAACGAAGAAGACTTAAAGG
2. Here is a partial DNA sequence for human Opsin1 (OPS1MW) Opsins are involved in providing color vision in the eye. Changes in the function of an opsin protein can lead to color-blindness.
CCCTTCGAAGGCCCGAATTACCACATCGCTCCCAGATGGGTGTACCACCTCACCAGTGT CTGGATGATCTTTGTGGTCATTGCATCCGTTTTCACAAATGGGCTTGTGCTGGCGGCCA CCATGAAGTTCAAGAAGCTGCGCCACCCGCTGAACTGGATCCTGGTGAACCTGGCGGTC GCTGACCTGGCAGAGACCGTCATCGCCAGCACTATCAGCGTTGTGAACCAGGTCTATGG CTACTTCGTGCTGGGCCACCCTATGTGTGTCCTGGAGGGCTACACCGTCTCCCTGTGTG GGATCACAGGTCTCTGGTCTCTGGCCATCATTTCCTGGGAGAGATGGATGGTGGTCTGC AAGCCCTTTGGCAATGTGAGATTTGATGCCAAGCTGGCCATCGTGGGCATTGCCTTCTC CTGGATCTGGGCTGCTGTGTGGACAGCCCCGCCCATCTTTGGTTGGAGCAGGTACTGGC CCCACGGCCTGAAGACTTCATGCGGCCCAGACGTGTTCAGCGGCAGCTCGTACCCCGGG GTGCAGTCTTACATGATTGTCCTCATGGTCACCTGCTGCATCACCCCACTCAGCATCAT CGTGCTCTGCTACCTCCAAGTGTGGCTGGCCATCCGAGCGGTGGCAAAGCAGCAGAAAG AGTCTGAATCCACCCAGAAGGCAGAGAAGGAAGTGACGCGCATGGTGGTGGTGATGGTC CTGGCATTCTGCTTCTGCTGGGGACCATACGCCTTCTTCGCATGCTTTGCTGCTGCCAA CCCTGGCTA

May the Best Plant Win! Experiment with Genetically Modified Seeds
(from http://sciencebuddies.com/science-fair-projects/project_ideas/Genom_p020.shtml?fave=no&isb=cmlkOjMyOTM1OTEsc2lkOjA
scDoxLGlhOkdlbm9t&from=TSW) Objective The objective of this science fair project is to determine the effect of the use of Roundup® on the growth of genetically modified plants that are competing with weeds for food and light. Introduction This science fair project deals with the growth of normal (wild-type) and genetically modified (GM) soybeans. The GM plants have been engineered to so that they are resistant to glyphosate, the active ingredient in Roundup and other commercial herbicides. Glyphosate kills plants by inhibiting an enzyme that performs a function that is critical for the survival of the plant. The GM plants are able to grow in the presence of glyphosate because they carry a modified version of this enzyme. The modified enzyme is able to carry out the same biochemical steps as the wild-type enzyme, but the modified enzyme has a slightly different 3-dimensional structure that causes it not to bind glyphosate. So when the GM plant is sprayed with Roundup, it is able to keep growing normally. The GM plants carry a genetically modified gene. The modified gene produces a modified enzyme. This enzyme, called EPSPS (5-enolpyruvylshikimate-3-phosphate synthase), (pronounced EE-nahl-py-ROO-vuhl-SHIH-kih-mate) catalyzes a key step in the synthesis of the amino acids phenylalanine, tyrosine, and tryptophan in plants. Plants need to make these amino acids "from scratch" in order to live; whereas people do not make these amino acids, because we get them from eating the plants. In fact, people do not even have the ability to make these amino acids because we lack the enzymes that are needed for their synthesis. This explains why glyphosate is toxic to plants, but not to people. Glyphosate is transported from the leaves to the roots of treated plants. This is critical for its effectiveness. Because it is transported to the roots, it is able to actually kill the plant, rather than just damage the weed's leaves. Glyphosate is toxic to nearly all

plants, not just weeds. If you are using it in your garden, you need to shield the plants you want to grow from the spray. Farmers use glyphosate to kill plants that compete with their GM crops for water, nutrients, and light. In this science fair project, you will plant wild-type and GM plants together, so that they are competing for resources. The "weeds" will be represented by the WT plants (soybean or corn) that match the GM plants, as well as other "weed" seeds you will purchase. The procedure calls for planting parsley and radish seeds, since these germinate quickly (about 7–10 days). Feel free to use other seeds as "weeds" if you prefer. The plants will be sprayed with Roundup at various times. You will determine if "killing off the competition" helps the growth of GM plants. Since this science fair project involves growing plants from seeds, keep in mind that it may take over a month to finish. Also keep in mind that because there is no way to predict exactly how the plants will grow and compete with each other, you may need to be flexible with the experimental procedure. Terms, Concepts and Questions to Start Background Research
• Wild-type • Genetically modified (GM) crop • Glyphosate • Roundup • Herbicide • Enzyme • 5-enolpyruvylshikimate-3-phosphate synthase (EPSPS) • Amino acid • Phenylalanine • Tyrosine • Tryptophan • Toxic • Transport
Questions
• Based on your research, where did scientists first discover the glyphosate-resistant EPSPS gene?
• What percentage of soybean and corn grown in the United States is genetically modified? How about the world?
• What are some potential environmental risks of using GM crops? Bibliography

These websites provide more information about some of the key topics related to this science fair project:
• Shaner, D. (2006, December 12). An Overview of Glyphosate Mode of Action: Why Is It Such a Great Herbicide? Retrieved February 12, 2009, from http://www.ars.usda.gov/research/publications/Publications.htm?seq_no_115=204435
• Peel, M.D. (2001, October). A Basic Primer on Biotechnology. Retrieved February 12, 2009, from http://www.ag.ndsu.edu/pubs/plantsci/crops/a1219w.htm
• Wikipedia Contributors. (2009, February 5). Enzyme inhibitors. Wikipedia: The Free Encyclopedia. Retrieved February 12, 2009, from http://en.wikipedia.org/w/index.php?title=Enzyme_inhibitor&oldid=268779215
These websites include information about Roundup: • HowStuffWorks.com. (n.d.). How the herbicide Roundup works. Retrieved April
23, 2009, from http://www.howstuffworks.com/question357.htm • Boerboom, C. (2002). Herbicide Timing in Roundup Ready Corn. Retrieved April 23,
2009, from http://128.104.239.6/uw_weeds/extension/articles/herbtiming.htm • Moran, L. (2007). The Molecular Basis of Roundup Resistance. Retrieved April 23,
2009, from http://sandwalk.blogspot.com/2007/03/molecular-basis-of-roundup-resistance.html
Learn more about soybeans from these websites: • Wikipedia Contributors. (2009). Soybean. Wikipedia: The Free Encyclopedia.
Retrieved May 6, 2009, from http://en.wikipedia.org/w/index.php?title=Soybean&oldid=288266919
• D.A. McWilliams, D.R. Berglund, and G.J. Endres. Soybean growth and management. Retrieved April 24, 2009, from http://www.ag.ndsu.edu/pubs/plantsci/rowcrops/a1174/a1174w.htm
Materials and Equipment
• Plastic cups (2) • Permanent marker • Planting pots, 4-inch diameter, with holes to let water drain (15) • Genetically modified soy seeds; kit available from Science Kit and Boreal
Laboratories at www.sciencekit.com, part # WW01753M12 • Potting soil, sterile (1 bag) • Pencil with an eraser • Ruler • Plastic wrap (1 roll) • Radish seeds; available at hardware stores, grocery stores, and plant nurseries • Basil seeds; available at hardware stores, grocery stores, and plant nurseries

• Camera • Lab notebook • Graph paper
Disclaimer: Science Buddies occasionally provides information (such as part numbers, supplier names, and supplier weblinks) to assist our users in locating specialty items for individual projects. The information is provided solely as a convenience to our users. We do our best to make sure that part numbers and descriptions are accurate when first listed. However, since part numbers do change as items are obsoleted or improved, please send us an email if you run across any parts that are no longer available. We also do our best to make sure that any listed supplier provides prompt, courteous service. Science Buddies receives no consideration, financial or otherwise, from suppliers for these listings. (The sole exception is any Amazon.com or Barnes&Noble.com link.) If you have any comments (positive or negative) related to purchases you've made for science fair projects from recommendations on our site, please let us know. Write to us at [email protected]. Experimental Procedure Note: Keep in mind that you will need to perform three trials of this science fair project. To save time, the trials can be run concurrently. Planting Your Seeds
1. Label the two plastic cups with the different seed types: WT soybean or GM soybean.
a. WT = wild-type (unmodified) Note: The WT plants are functioning as "weeds" in this procedure, since they compete for resources and are sensitive to Roundup.
b. GM = genetically modified 2. Add five GM soybean seeds to the GM cup. 3. Add 15 WT soybean seeds to the WT cup. 4. Add water to both cups and let the seeds soak for 30 minutes. 5. Fill five planting pots with potting soil. 6. Label five sticks (supplied with the kit) with the numbers 1–5. Also add the date
to each stick. 7. Place a stick in each of the five plant pots. 8. Use the eraser end of the pencil to poke four holes in each pot, about 5 cm deep.
Place one hole in the middle, and the other three surrounding the middle hole. Use the same pattern of holes in each pot.
9. Plant one GM and three WT seeds in each pot, as follows: a. Plant the GM seed in the middle.

b. Plant the three WT seeds in each pot, surrounding the GM seed. 10. Cover the seeds with soil. 11. Place three radish seeds and three basil seeds on the surface of the soil in each
of the previous five pots. a. Note: To increase the competition, add some more "weeds." You may wish
to use different competitor plants or more competitor seeds per pot. Just be sure to document your procedure and your observations in your lab notebook.
12. Push the radish and basil seeds about 1 cm into the soil. 13. Gently cover the seeds with soil. 14. Water the plants thoroughly and let them drain completely. 15. Cover the pots with plastic wrap to keep them moist while the seeds germinate. 16. Water the pots if the soil starts to dry out. Keep the soil moist, but not soggy. 17. Remove the plastic wrap when plants start to emerge from the soil. 18. Continue to keep the plants well-watered. 19. Continue growing the plants outdoors if the temperature is above 13°C (55°F) at
night. They can also be grown indoors on a sunny windowsill, in a growth chamber, or in a greenhouse.
Treating Your Plants with Herbicide
1. Treat the plants with Roundup, as detailed below. a. Planting pot #1: No Roundup.
The GM plant will compete with the "weeds" for the duration of the experiment.
b. Planting pot #2: Treat with Roundup when the soybean plants are about 2.5 cm tall.
The GM plant will compete with the weeds early on, but then will have the pot to itself.
c. Planting pot #3: Treat with Roundup when the soybean plants are about 5 cm tall.
d. Planting pot #4: Treat with Roundup when the soybean plants are about 10 cm tall.
e. Planting pot #5: Treat with Roundup when the soybean plants are about 15 cm tall.
2. Follow the directions on the Roundup container. 3. Make sure you treat all of the plants with the herbicide. Wear disposable gloves
when handling the weed killer and work in a well-ventilated area, such as outdoors, away from any other plants, and at a calm, non-windy time of day.

a. Note: You may need to alter the treatment timing for your experiment, depending on how your plants are growing. Feel free to adjust the procedure, as necessary.
4. Keep detailed notes of what you do and observe, in your lab notebook. Record the height of the GM plant each day.
5. Record the effects of the Roundup on the GM and WT plants. Use a scale from 1–5, with 1 being "very healthy" and 5 being "dead."
a. You don't need to record the health of every plant that is growing. You could just note the overall appearance of health for the GM and WT plants in each pot. For example, "Pot # 1: GM plant healthy (score = 1), WT plants healthy (score = 1)," etc.
b. Record the dates of your observations. 6. Take photographs of the plants for your records.
a. Add notes to the photographs, including the sample #, the time and date, and your observations about what is significant about the picture.
7. Provide water and sunlight to the plants for the entire duration of the experiment.
8. Use your judgment about when to stop the experiment. Stop the experiment when you determine that you have seen clear results, or when you determine that extending the experiment will not yield new valuable data.
9. Repeat the entire procedure two more times, with new materials, for a total of three trials. The trials can be run concurrently. The reason for doing three trials is to ensure that your results are consistent and repeatable.
Analyzing Your Data
1. Graph the data. a. Put time on the x-axis and the height of the GM plant on the y-axis. b. Use different-colored lines for each treatment (1–5).
2. Based on your results, what can you conclude about the benefits vs. drawbacks of Roundup-resistant plants?
Variations
• Even if the Roundup does not kill the GM plants, does it affect their growth or appearance? Devise an experiment to compare the growth of GM plants with and without treatment. Use WT plants as controls to show that the Roundup is working as an herbicide.
• Repeat the main experimental procedure, using other types of plants as "weeds." You could also vary the number of competing plants.

• Does using GM seeds allow you to successfully grow plants in soil with established weeds? You can test this by planting and watering the "weeds" before planting the GM seeds. For example, plant the weeds 7 days prior to planting the GM seed, and then treat with Roundup at 1 week, 2 weeks, 3 weeks, and 4 weeks.
• Since the plants are competing for limited resources, you might expect the size of the pot to affect the outcome. Devise a way to test this.
• Repeat the procedure above with the GM and WT corn seeds that are in the GM plant kit.
• Repeat the procedure with real weeds. Plant the GM seeds outdoors in an area with lots of weeds. Treat them with Roundup, as described above. Record the height of the GM plants and the effects of the Roundup on the health of the plants.
• In a real farming situation, weeds would be a continuous threat to the GM crops. Model this by adding new "weed" seeds after treatment with Roundup.
• Soybean plants are grown for their beans, and minimizing environmental stress will optimize seed yield. Devise a procedure that uses seed yield as an endpoint, rather than plant height.

What Makes a DNA Fingerprint Unique? (from http://www.sciencebuddies.com)
Objective In this experiment you will test if unique DNA sequences can create individual fingerprints that are also unique. Introduction All living things come with a set of instructions stored in their DNA, short for deoxyribonucleic acid. Whether you are a human, rat, tomato, or bacteria, each cell will have DNA inside of it. DNA is the blueprint for everything that happens inside the cell of an organism, and each cell has an entire copy of the same set of instructions. The entire set of instructions is called the genome and the information is stored in a code of nucleotides (A, T, C, and G) called bases. Here is an example of a DNA sequence that is 12 base pairs long:
Every individual has its own DNA code, but how can a code with only four letters be unique? It is hard to imagine how a code with so few parts can hold so much information. The key is that the longer the code is, the more unique sequences there can be. Below is a table showing how many unique sequences are possible for a piece of DNA of a certain length in base pairs (bp):
DNA Length (bp) How Many Unique DNA Sequences are Possible?
1 bp 4 = 4
2 bp 4 x 4 = 16
3 bp 4 x 4 x 4 = 64
4 bp 4 x 4 x 4 x 4 = 256
5 bp 4 x 4 x 4 x 4 x 4 = 1,024

6 bp 4 x 4 x 4 x 4 x 4 x 4 = 4,096
7 bp 4 x 4 x 4 x 4 x 4 x 4 x 4 = 16,384
8 bp 4 x 4 x 4 x 4 x 4 x 4 x 4 x 4 = 65,536
9 bp 4 x 4 x 4 x 4 x 4 x 4 x 4 x 4 x 4 = 262,144
10 bp 4 x 4 x 4 x 4 x 4 x 4 x 4 x 4 x 4 x 4 = 1,048,576
For example, a two base pair long DNA sequence can be one of sixteen different sequences: AA, AT, AC, AG, TA, TT, TC, TG, CA, CT, CC, CG, GA, GT, GC, or GG. Longer sequences have even more possibilities. The 12 base pair sequence shown above is only one of 16,777,216 different DNA sequences that are possible for a piece of DNA that size! Considering that the entire human genome is 3 billion DNA bases long, the number of possible combinations is practically infinite. But the truth is, most of the DNA from person to person is the same. Because we are of the same species, our DNA is about 99.9% identical to each other. Even the DNA of a chimpanzee is 99% identical to our DNA. With all of the similarities in the DNA sequences of humans, why does DNA fingerprinting still work? In this experiment you will investigate whether or not unique DNA sequences will generate unique DNA footprints. You will use an online random sequence generator to "make" pieces of DNA. Then you will use another online program to make a DNA fingerprint of each piece of randomly generated DNA. Will fingerprints with different DNA sequences look different or the same? Terms, Concepts and Questions to Start Background Research To do this type of experiment you should know what the following terms mean. Have an adult help you search the Internet, or take you to your local library to find out more!
• DNA sequence • Genome • Nucleotides (A, T, C, G) • Base pairs • Restriction enzyme • DNA gel • DNA fingerprinting
Questions

• What does a DNA sequence look like? • What does a DNA fingerprint look like? • What makes DNA fingerprints look unique? Is it the DNA sequence?
Bibliography
• Here are three great tutorials to learn about DNA fingerprinting and its applications:
o This tutorial from the National Academy of Sciences explains how DNA Evidence can determine guilt or innocence in a criminal investigation: NAS, 2007. "Putting DNA to Work - DNA and Criminal Justice - How DNA Determines Guilt or Innocence," Marian Koshland Science Museum, National Academy of Sciences (NAS), Washington, D.C. [accessed March 6, 2007] http://www.koshland-science-museum.org/exhibitdna/crim01.jsp
o This tutorial will explain how DNA fingerprinting was invented and show you several ways it is used through stories, online activities, and personal interviews: DNAi, 2003. "DNA Interactive: Applications," DNA Interactive (DNAi), Dolan DNA Learning Center, Cold Spring Harbor Laboratory, NY. [accessed March 6, 2007] http://www.dnai.org/d/index.html
o Read this tutorial to find out how the changes in a DNA fingerprint (called a Single Nucleotide Polymorphism, or SNP) can be used to help design better drugs: BLC, 2007. "Biotechnology Learning Center," The Children's Museum of Indianapolis. [accessed March 6, 2007] http://www.childrensmuseum.org/biotech/index.htm
• Here are two sites with online applications that you will use for this experiment: o You will use this site to make short, randomizes sequences of DNA:
Maduro, M., date unknown. "Random DNA Sequence Generator," Department of Biology, University of California, Riverside. [accessed March 6, 2007] http://www.faculty.ucr.edu/~mmaduro/random.htm
o You will use this site to "cut" your DNA and run it through a gel to make a fingerprint: NEB, 2007. "REBsites," New England Biolabs (NEB). [accessed March 6, 2007] http://tools.neb.com/REBsites/index.php3
• Here are two sites with some background information on restriction enzymes that are used to "cut" DNA to make a fingerprint:
o Kimball, J., 2003. "Restriction Enzymes," Andover, MA: Kimball's Biology Pages. [accessed March 6, 2007]

http://users.rcn.com/jkimball.ma.ultranet/BiologyPages/R/RestrictionEnzymes.html
o Wikipedia contributors, 2007. "Restriction enzyme," Wikipedia, The Free Encyclopedia. [accessed March 6, 2007] http://en.wikipedia.org/w/index.php?title=Restriction_enzyme&oldid=123442704
Materials and Equipment
• A computer with Internet connection • Java-based web browser • Lab notebook and pencil • Printer • Scissors • Glue
Experimental Procedure
1. The first step is to m 2. Make a piece of DNA using the Random DNA Sequence Generator. 3. Enter "1000" in the box for the Size of DNA in bp, and leave the setting for the
GC content at 0.50 (which will give you half G+C and half A+T). 4. Click the generate button and you will get a random piece of DNA shown in the
text box:
5. Print this page, cut it out and paste it into your lab notebook for your records. Make a name for this piece of DNA and write the name in your notebook ("Suspect #1" for example).
6. Double click in the text box to select your DNA sequence, then copy it to the clipboard by selecting "Edit" and then "Copy" from your file menu.
7. The next step is to "Cut" your piece of DNA and run it through a gel matrix to make a fingerprint by using the REBsites tool from New England Biolabs (NEB).
8. Click inside the text box and paste your DNA sequence from the clipboard by selecting "Edit" and "Paste" from the file menu. Leave all of the other settings to the default settings.
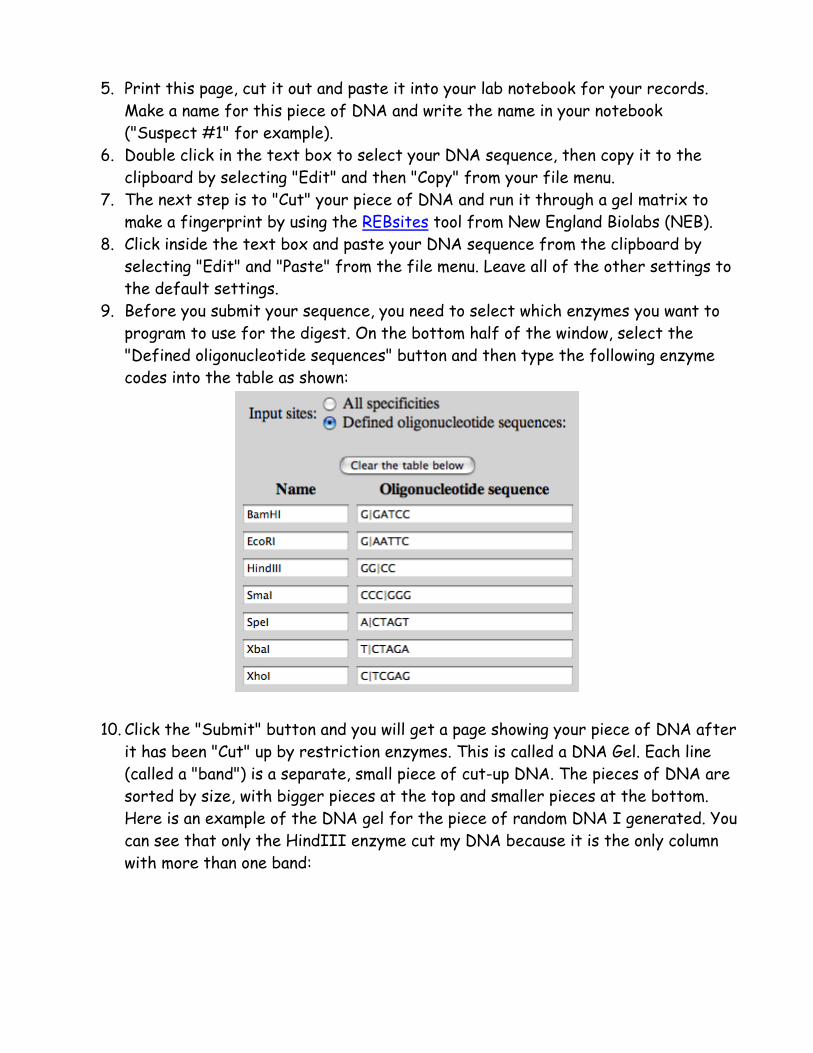
9. Before you submit your sequence, you need to select which enzymes you want to program to use for the digest. On the bottom half of the window, select the "Defined oligonucleotide sequences" button and then type the following enzyme codes into the table as shown:
10. Click the "Submit" button and you will get a page showing your piece of DNA after
it has been "Cut" up by restriction enzymes. This is called a DNA Gel. Each line (called a "band") is a separate, small piece of cut-up DNA. The pieces of DNA are sorted by size, with bigger pieces at the top and smaller pieces at the bottom. Here is an example of the DNA gel for the piece of random DNA I generated. You can see that only the HindIII enzyme cut my DNA because it is the only column with more than one band:

11. Print this page, cut it out, and paste it into your lab notebook for your records. Be
sure you label the fingerprint with the name of your DNA (Suspect #1) and that you know the top from the bottom!
12. Now you are ready to make a new "Suspect" DNA sequence. 13. Repeat steps 1–9 with a new DNA sequence. Just go back to the Random DNA
Sequence Generator and start over. This time name your DNA sequence something new (like "Suspect #2" for example).
14. Repeat this experiment at least five different times. Each time you will make one new piece of "Suspect" DNA and make a new DNA fingerprint.
15. Compare all of your sequences and fingerprints. Look at the pattern of bands. Do they match or are they different? Do unique sequences of DNA result in similar or different DNA fingerprints?
Variations
• In this experiment, you are making a new, randomly generated sequence of DNA each time. In reality, our DNA changes very little from person to person. Can small changes in DNA sequences also result in unique DNA fingerprints? To test

this, start with one piece of randomly generated DNA and make a fingerprint. Then, instead of making a new DNA sequence from scratch, only change a few nucleotides (letters) of the first sequence. For example, change the middle 10 letters to something new, but leave the rest of the sequence the same. What happens if you make these small changes in different places of the sequence?
• If you are an advanced student and have access to laboratory equipment, try the Science Buddies experiment Who Done It? DNA Fingerprinting and Forensics.