geocoding sentinel-1 grd products using arcgis · geocoding is not terrain correction it is...
TRANSCRIPT

6 February 2019 v.1.3 | 1
UAF is an AA/EO employer and educational institution and prohibits illegal discrimination against any individual: www.alaska.edu/nondiscrimination
Geocoding Sentinel-1 GRD Products using ArcGIS
Document Contents:
A) Background .......................................................................................................................................... 1
Why Geocode? ........................................................................................................................... 2
Geocoding is NOT Terrain Correction ........................................................................................ 2
B) Materials List ........................................................................................................................................ 3
C) Geocoding Steps .................................................................................................................................. 4
1. Download Sentinel-1 data .................................................................................................... 4
2. Extract the .tif file with the data of interest ............................................................................ 4
Unzipping with Windows 10 ............................................................................................. 5
3. Project your product.............................................................................................................. 6
4. (OPTIONAL) Set No Data Value .......................................................................................... 9
APPENDIX: Working in the ArcGIS Environment ....................................................................................... 12
The Catalog Window................................................................................................................. 12
Folder Connections ................................................................................................................... 13
Adding Data to ArcMap ............................................................................................................. 13
The Search Window .................................................................................................................. 14
ArcToolbox ................................................................................................................................ 14
Geoprocessing Results ............................................................................................................. 15
Visualizing SAR Data ................................................................................................................ 16
A) Background
Sentinel-1 Ground-Range Detected (GRD) products are available for download from
ASF’s Vertex data portal. These Level-1 GRD products are georeferenced to
geographic coordinates using the Earth ellipsoid WGS84, but are still in SAR geometry.

6 February 2019 v.1.3 | 2
UAF is an AA/EO employer and educational institution and prohibits illegal discrimination against any individual: www.alaska.edu/nondiscrimination
By following this data recipe, users will learn how to geocode Sentinel-1 GRD products
in ArcGIS using the Project Raster tool. This recipe was tested against ArcGIS 10.6.1
and 10.4, but it should work for earlier 10.X versions as well.
Why Geocode?
Once extracted from their zip file, GRD products downloaded from Vertex can be
viewed directly in ArcGIS without any additional steps. The georeferenced TIFF
files include the information necessary to allow most GIS software platforms to project
the data layers on the fly to match the other layers in your GIS, so you can easily
visualize the data without additional effort. If you are visualizing the images outside of a
GIS platform, however, the images may appear reversed or rotated. To display the
images as you would expect to see them, the image must be transformed from its SAR
geometry into a map projection. When working with SAR data, this process is called
“Geocoding”.
Geocoding the imagery will ensure not only that the image displays at the correct
location on the Earth’s surface in any given application, but that the image will also
display as expected when it is viewed outside of a spatially-enabled framework (i.e.
north is up, features are not stretched or reversed in unexpected ways).
Even when working within a GIS, if you want to go beyond simply visualizing the data
and perform analysis or geoprocessing functions using the GRD granule, it should be
geocoded to a map projection first. In ArcGIS, this can be accomplished by using the
Project Raster tool. If you would prefer to use GDAL or QGIS to geocode, refer to ASF’s
Data Recipes for geocoding products within each of these platforms.
Note that using different geocoding techniques/options may result in slight differences in
the output products. While one output is not necessarily “better” than another, it is a
good idea to be consistent when generating geocoded products for use in the same
project, especially if you are looking at imagery from one location through time. The best
approach to use will vary depending on the goals and preferences of the user.
Geocoding is NOT Terrain Correction
It is important to understand that this geocoding process does not involve terrain
correction. To match the imagery to actual features on the earth and correct for
distortions caused by the side-looking geometry of SAR data, you must perform
Radiometric Terrain Correction (RTC) instead. This will be particularly important in
areas of high topographic variation. Refer to ASF’s Data Recipes on Radiometric
Terrain Correction, or contact ASF to learn about other resources for RTC processing.

6 February 2019 v.1.3 | 3
UAF is an AA/EO employer and educational institution and prohibits illegal discrimination against any individual: www.alaska.edu/nondiscrimination
B) Materials List
ArcGIS Desktop (any licensing level)
Earthdata login credentials
o If you do not already have an Earthdata account, visit the Earthdata
website to register for this free service.
Download Sentinel-1 GRD data using Vertex.
o When downloading from Vertex, you must either already be logged in to
Earthdata, or you will be prompted to enter your Earthdata Login
username and password before the download will begin.
o You may use this Sample Granule.
If you choose to download a granule other than the sample granule, you will need
to determine an appropriate projected coordinate reference system to use for that
location (i.e. UTM zone).
To determine the UTM zone for an unfamiliar granule:
1. Add the GRD to ArcGIS (See Steps 1 and 2 in Section C for downloading and extracting the granule, refer to Section C for tips on Adding Data to ArcMap).
2. In the File menu, select Add Data – Add Data from ArcGIS Online.
3. In the search bar, enter “UTM Zones” and click Enter to display the results.
4. Find the “World UTM Grid” layer package, served by esri_dm, and click Add.
5. No transformation should be necessary, as both should be in WGS84.
6. With the Identify tool, click on the UTM grid cell containing your granule to display the World UTM Grid properties for that area.
Note the ZONE and ROW_ attributes.
7. The UTM zone number will be the ZONE value, and you must determine if the zone is in the northern or southern hemisphere.
Northern Hemisphere: Rows N-Z
Southern Hemisphere: Rows A-M
8. Visit www.spatialreference.org and enter your UTM zone in the search field (i.e. “UTM 13N” for zone 13 - northern hemisphere).
Click the link for the EPSG code for the WGS 84 entry (i.e. WGS 84 / UTM zone 13N) and verify that its location logically matches your granule.
Copy the EPSG number for use in Step 3.3.d in Section C of this data recipe.

6 February 2019 v.1.3 | 4
UAF is an AA/EO employer and educational institution and prohibits illegal discrimination against any individual: www.alaska.edu/nondiscrimination
C) Geocoding Steps
If you are new to the ArcGIS environment, refer to the APPENDIX: Working in the
ArcGIS Environment, which will introduce you to some key aspects of ArcMap that will
be helpful to understand when working through this Data Recipe.
1. Download Sentinel-1 data
Using Vertex, download a Sentinel-1 GRD granule. Note that you will need to log in
with your Earthdata credentials before the download will begin. The download will be
served as a .zip file.
2. Extract the .tif file with the data of interest
Within the downloaded zip file is a base directory with the name of the granule
followed by a “.SAFE” extension. This SAFE structure contains a number of
directories and files, and the data images are saved as georeferenced .tiff files in the
folder named “measurement” (Figure 1).
Figure 1: Contents of the GRD SAFE file, within the
downloaded .zip file
The image we are interested in for this tutorial is the co-polarized GRD:
s1a-iw-grd-vv-20170819t001029-20170819t001054-017985-01e2e8-001.tiff
Note: If you are using a different granule than the sample provided, the co-pol image
may be labeled hh instead of vv.
Use your preferred method to extract the desired file from the zipped folder, or refer to
the suggestions on the next page.

6 February 2019 v.1.3 | 5
UAF is an AA/EO employer and educational institution and prohibits illegal discrimination against any individual: www.alaska.edu/nondiscrimination
Unzipping with Windows 10
If you unzip the entire folder with the standard Windows 10 zip utility, there is a good
chance that you will exceed the number of characters allowed in a Windows directory
path. You can either save the zipped contents to a different folder, or you can just
extract the single file as follows:
1. Double-click the .zip file in your Downloads folder, double-click the .SAFE file,
double-click the measurement folder, and highlight the desired .tiff file.
2. Under the Compressed Folder Tools menu (which appears when you browse into
a zip file), click the Extract button, and select the “Extract To…” option (Figure 2).
Figure 2: The compressed Folder Tools menu within the measurement folder in the downloaded .zip file
3. Select one of the recent folders (which will start the extraction immediately), or
use the “Choose Location” option at the bottom of the dialog box to navigate to
the desired extraction location and click the “Copy” button to extract the file.
4. The single .tiff file will be extracted from the zipped folder structure.
You may also wish to download the 7-Zip File Manager for a more flexible zip utility than
the standard Windows zip utility, especially if you have a Windows operating system
earlier than Windows 10.

6 February 2019 v.1.3 | 6
UAF is an AA/EO employer and educational institution and prohibits illegal discrimination against any individual: www.alaska.edu/nondiscrimination
3. Project your product
1. Open a new ArcMap project.
2. Open the Project Raster tool.
You can find this tool in the ArcGIS System
Toolboxes, under Data Management Tools
– Projections and Transformations – Raster
(Figure 3). Double-click to open the tool.
You can also type “project raster” into the
ArcMap Search window (Figure 4 - use
Ctrl+F to open the ArcGIS Search window if
it isn’t already open). Click on the Project
Raster (Data Management) name in the
results to open the tool.
3. Enter the parameters into the Project Raster tool dialog (Figure 5).
a. Select your input raster from the dropdown list of project layers (if you added
it to your ArcMap project), or click the folder icon next to the field to browse to
the image to be projected.
b. The input coordinate system will be recognized as GCS_WGS_1984.
c. Enter the output file path/name, or click the folder icon next to the field to
navigate to the destination directory and type in the name.
Unless you are saving the output to a geodatabase, you must add the .tif
extension to the end of the filename.
Figure 3: Location of the Project Raster tool in the ArcGIS System Toolboxes located in the Catalog Window (Refer to Section C for more information)
Figure 4: Finding the Project Raster tool using
the ArcMap Search Window

6 February 2019 v.1.3 | 7
UAF is an AA/EO employer and educational institution and prohibits illegal discrimination against any individual: www.alaska.edu/nondiscrimination
Figure 5: The Project Raster Tool dialog box
d. Enter the Output Coordinate System.
i. Click the projection icon next to
the field to open the Spatial
Reference Properties window
(Figure 6).
The sample granule provided is located in
Louisiana, which is UTM Zone 15N (EPSG
32615).
If you know the EPSG number of the
desired projection, you can type that
number into the search field and press
Enter to locate the projection (Figure 6).
ii. Click OK to apply the highlighted
projection. Figure 6: Using EPSG number to find projection
a
b
c
d
e
f
g
h

6 February 2019 v.1.3 | 8
UAF is an AA/EO employer and educational institution and prohibits illegal discrimination against any individual: www.alaska.edu/nondiscrimination
OTHER OPTIONS FOR FINDING OR SELECTING PROJECTIONS:
If you know the name of the coordinate system you want to use, but it’s not
coming up when you search, you can also navigate through the Projected
Coordinate System folder manually to find the desired projection.
If you have chosen a custom granule
to cover a specific area of interest and
you have other imagery that has
already been projected to an
appropriate coordinate system for that
area, you can reference the projection
information of this other imagery. Add
the reference image to your project,
open the Project Raster tool, then
open the Spatial Reference Properties
window as in step d above. Expand
the Layers folder to select the
projection of your reference image
(Figure 7). Note that if you have
multiple layers in your ArcMap project,
all the projections present will be
displayed. Expand an entry to
determine which layer(s) use that
projection. Highlight the correct
projection and click OK to apply it.
You can examine the Spatial
Reference of any raster in
ArcCatalog to find the projection
information:
o Right-click on the layer in
ArcCatalog (or in the ArcCatalog
window in ArcMap), select
Properties, and scroll down to the
Spatial Reference section. The
XY Coordinate System lists the
projection of the layer (Figure 8).
o Click the Edit… button to open the Spatial Reference Properties. The
current coordinate system of the raster is displayed, including the EPSG
number.
Figure 8: Coordinate System in Raster Dataset
Properties
Figure 7: Setting the output projection using a layer with the desired projection

6 February 2019 v.1.3 | 9
UAF is an AA/EO employer and educational institution and prohibits illegal discrimination against any individual: www.alaska.edu/nondiscrimination
e. Enter the Geographic Transformation (optional).
If a transformation is required to project the source coordinates into the output
coordinate system, ArcGIS will list the transformations available for the
selected input and output coordinate systems as a dropdown menu.
If the datum is the same for the input and output coordinates, there is likely no
geographic transformation required. For our sample granule, we are
generating a product in WGS_1984_UTM_Zone_15N, and because the input
is also in WGS 84 coordinates, no transformation is required.
f. Set the Resampling Technique to BILINEAR.
g. If desired, you may set the Output Cell Size in the X and Y direction.
The output cell size will be in the units of the projection. For example, UTM
projections are in meters, so entering 10 for X and Y when projecting to UTM
would result in a product with 10 x 10 m pixels.
h. Click OK to run the tool.
4. (OPTIONAL) Set No Data Value
ArcMap does not include an option
to set the padding pixels added
during the projection process to
No Data; by default they are given
values of 0.
If you add a projected image to an
ArcMap project, these 0-value
padding pixels will display as black
by default (Figure 9).
In addition, the ESA granules
served by Vertex may also have 0-
value pixels added along the
edges to mask out garbage
values.
To set any 0-value pixels to a
NoData value, which can then be
easily set to display transparently,
use the following steps: Figure 9: Projected Image with 0-value padding

6 February 2019 v.1.3 | 10
UAF is an AA/EO employer and educational institution and prohibits illegal discrimination against any individual: www.alaska.edu/nondiscrimination
1. Navigate to the output .tif file in the Catalog window, right-click on the filename,
and select Properties.
2. Scroll down to Raster Information,
and click the Edit button next to
the NoData value (Figure 10).
3. Highlight the NoData Value, enter
0, and click OK to close the
NoData Editor. Click OK to close
the Raster Data Properties
window.
4. Add the new raster layer to your
ArcMap project by dragging it from
the Catalog window into the
Layers window. Uncheck the box
in front of the old layer to make
this new layer the only one visible.
5. Right-click the layer in
the ArcMap TOC and
select Properties.
6. In the Symbology tab, set
the Display NoData to
“No Color” (Figure 11).
7. Click OK to close the
Layer Properties. The
image will now display
with the 0-values
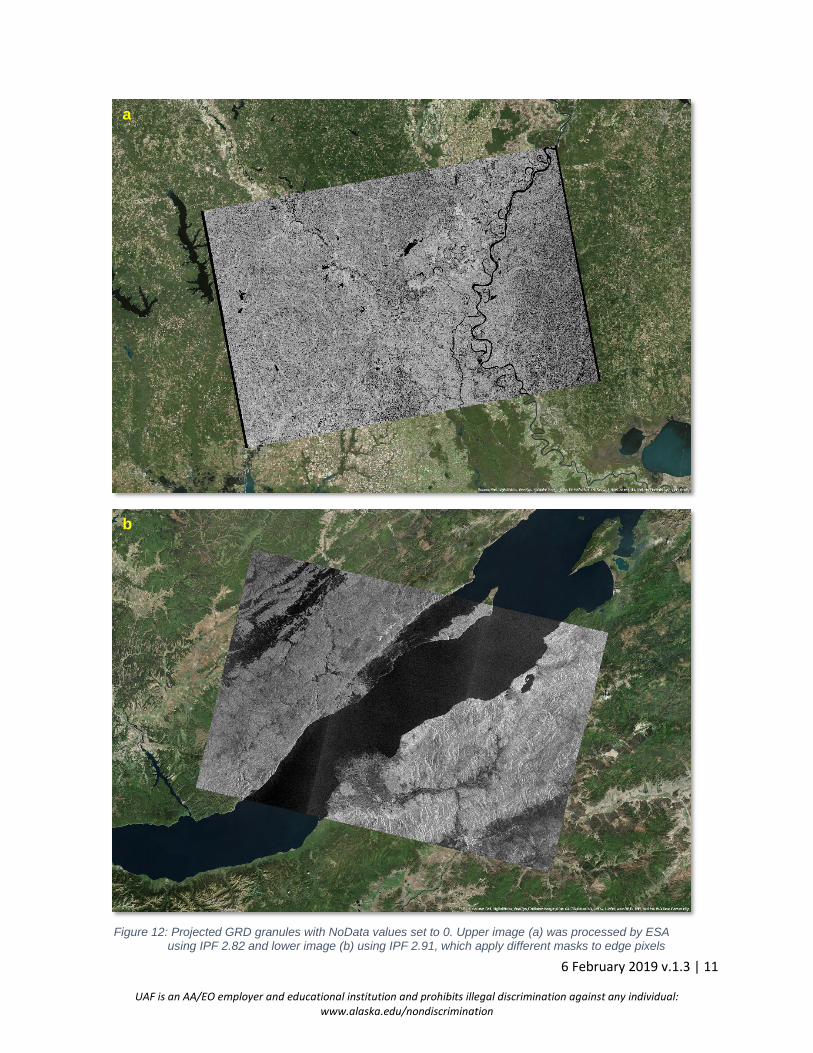
transparent (Figure 12).
Note that while most of the black edge pixels are gone, there may be some remaining
(Figure 12a). ESA has applied different masking approaches to the Sentinel-1 data over
time, and not until IPF Version 2.90 (March 2018) were 0-values used to mask all of the
garbage pixels along the edges of the GRD images. Applying the NoData designation to
0-value pixels in newer images results a very clean image without any edge artifacts
(Figure 12b). You can determine the IPF version used to process your granule by
opening the manifest.safe file (included in the download folder for your GRD product –
see Figure 1) with a text editor (i.e. Notepad) or other xml-compatible software, and
searching for IPF. Refer to ESA documentation for more details on masking.
Figure 10: Editing the NoData value in the Raster Dataset Properties
Figure 11: Setting NoData pixels to display transparently
6 February 2019 v.1.3 | 11
UAF is an AA/EO employer and educational institution and prohibits illegal discrimination against any individual: www.alaska.edu/nondiscrimination
Figure 12: Projected GRD granules with NoData values set to 0. Upper image (a) was processed by ESA
using IPF 2.82 and lower image (b) using IPF 2.91, which apply different masks to edge pixels
a
b
6 February 2019 v.1.3 | 12
UAF is an AA/EO employer and educational institution and prohibits illegal discrimination against any individual: www.alaska.edu/nondiscrimination
APPENDIX: Working in the ArcGIS Environment
If you are new to the ArcGIS environment, this section will introduce you to some key
aspects of working in ArcMap.
The Catalog Window
Most ArcGIS users work in the ArcMap application. ArcCatalog is an additional ArcGIS
application designed for managing datasets, and while some processing tools can be
run directly in the ArcCatalog application, ArcMap is better suited to geoprocessing and
visualizing spatial data. Over the years, the ArcGIS platform has integrated more and
more of the ArcCatalog functions into the Catalog window within the ArcMap application
to the point that the Catalog window is nearly equivalent to ArcCatalog. It is extremely
helpful to have the Catalog window open or available when working in ArcMap.
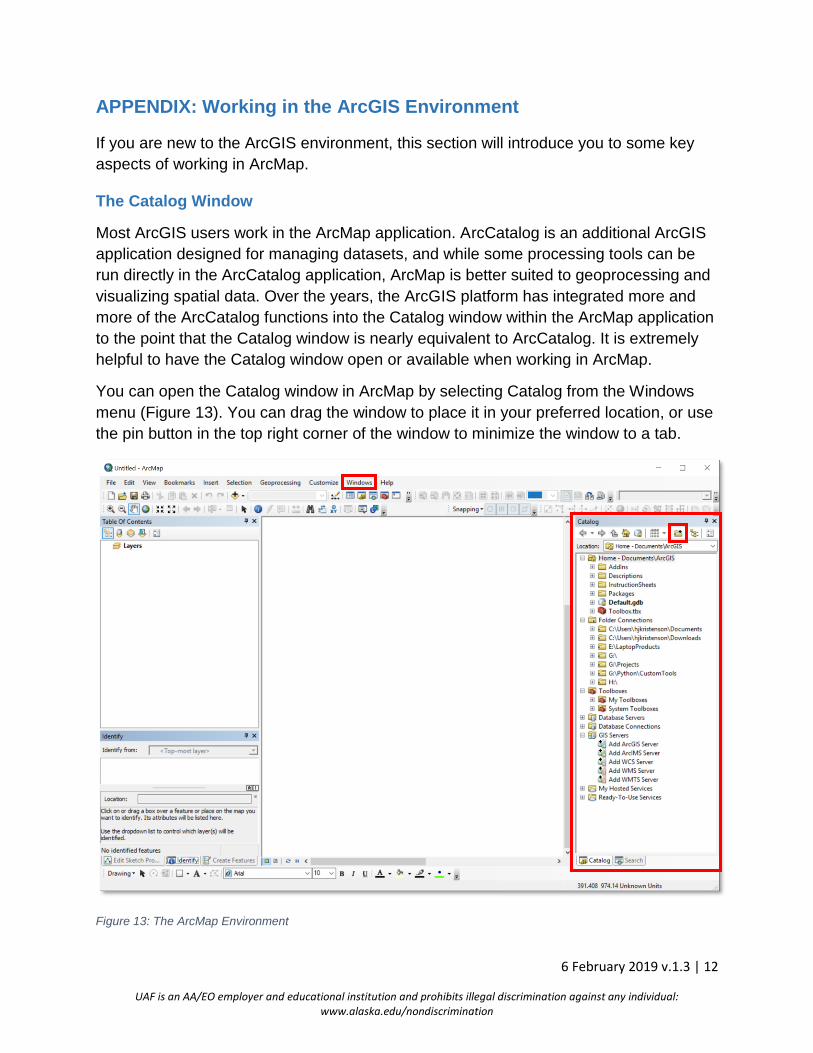
You can open the Catalog window in ArcMap by selecting Catalog from the Windows
menu (Figure 13). You can drag the window to place it in your preferred location, or use
the pin button in the top right corner of the window to minimize the window to a tab.
Figure 13: The ArcMap Environment

6 February 2019 v.1.3 | 13
UAF is an AA/EO employer and educational institution and prohibits illegal discrimination against any individual: www.alaska.edu/nondiscrimination
The Standard Toolbar also includes a Catalog icon that you can use to open
the window (right below the Windows menu in Figure 13).
Folder Connections
You will want to create a folder connection to the directory on your computer that
contains your geospatial project data and/or products. You can create a connection to a
very specific folder if you will be using it frequently, or you can set a connection to a
fairly high level of your directory structure, allowing you to access many less frequently-
used folders within that directory from one connection.
To connect to a folder:
1. Click the Connect to Folder icon at the top of the Catalog window (Figure 13).
2. Browse to the folder you would like to add and click OK.
3. You will see the path to your newly-connected folder listed in the Folder Connections section of your Catalog window.
If you find you are no longer needing a folder and want to clean up your list of folders,
you can simply disconnect it by right-clicking the connection in the Catalog window and
selecting Disconnect Folder. This will not delete the actual folder, but just the
connection (basically a shortcut) listed in ArcCatalog. You can always reconnect later if
you find yourself needing to access it again in the future.
Adding Data to ArcMap
ArcGIS allows users to drag and drop files into an ArcMap project. While you can do
this directly from Windows File Explorer, the safer an often more convenient option is to
drag the file from the Catalog window (or double-click it). ArcCatalog (and by extension,
the Catalog window) curates data files with ArcGIS applications in mind. You will note
that not every file in your directory structure may be displayed in the Catalog, because it
will display files in terms of what is useful to ArcGIS.
If you browse to a shapefile in File Explorer, you will see on the order of 7 files with the
same basename but different extensions. If you browse to that same location in the
Catalog window, the shapefile will appear as a single file, which you can drag into your
project and be sure that all of the information necessary to correctly render the shapefile
is recognized and accessible by ArcGIS.
Similarly, appropriately-named and formatted auxiliary files containing metadata (.xml)
or pyramids (.ovr) for rasters won’t appear in the ArcCatalog structure, but will be
recognized by ArcGIS as being associated with the appropriate geospatial file, and the
contents will be accessed appropriately. In the case of the xml, it can be viewed and

6 February 2019 v.1.3 | 14
UAF is an AA/EO employer and educational institution and prohibits illegal discrimination against any individual: www.alaska.edu/nondiscrimination
edited through the ArcGIS Item Description interface, which ensures that edits are
applied in the correct format. If you edit the xml metadata file directly outside of the
ArcGIS environment, it may be rendered unreadable by ArcGIS applications.
If you are using or accessing file geodatabase structures in ArcGIS, you will find that no
meaningful structure is present when you open the .gdb file in File Explorer; it is a series
of hundreds of inscrutably-named files. When you navigate to that same gdb in
ArcCatalog, it is neatly organized, with all of the component feature classes and
associated files clearly defined and ready for use.
If you are dealing with multi-band rasters, you can either add the entire raster as a multi-
band image, or you can expand the raster dataset in the Catalog and import specific
bands of interest as individual single-band images. This capability is not available when
looking at the raster in File Explorer, where it appears as a single TIFF file.
By adding data from the Catalog window instead of directly from File Explorer, you can
be confident that you are adding the appropriate data. You can also add data using the
Add Data button in the Standard Toolbar, which browses through your directory
structure using the same treatment for files as would be seen in the Catalog window.
The Search Window
Another useful ArcMap Window to become familiar with is the Search window.
It can also be opened from the Windows menu, or by clicking the Search icon
in the Standard Toolbar.
The Search window is very useful for finding tools, because you can type in some key
words and it will return a list of potential tools. You can click the title to open the tool
dialog directly, or click on the links below to either read more about the tool or locate the
tool in the Catalog. You can choose to dock the Search window in the same area as the
Catalog window, allowing for easy toggling between the two using tabs (Figure 13).
ArcToolbox
The tools available for use in ArcGIS are all stored in “System Toolboxes”, found in the
Toolboxes section of the Catalog window. The toolbox is divided into additional layers of
toolboxes and toolsets by topic. If you know exactly where a desired tool is stored, you
can navigate through the toolbox “folder” structure to locate your tool, and double-click it
to launch the tool dialog. Because there are hundreds of tools, however, and many
levels of organization (some more intuitive than others) in the System Toolbox, it is
often easier to find the tool by using the Search window described above.

6 February 2019 v.1.3 | 15
UAF is an AA/EO employer and educational institution and prohibits illegal discrimination against any individual: www.alaska.edu/nondiscrimination
You can also open an ArcToolbox window in ArcMap, which has the same
contents as the System Toolboxes directory in the Catalog window. Click the
ArcToolbox icon in the Standard Toolbar to open it directly.
If there are tools you find yourself using over and over, you can create your own toolbox
by right-clicking in the desired target directory in the Catalog window, and selecting
New – Toolbox. You can copy and paste tools from other toolboxes to create your own
collection for easy reference, rather than having to search each time.
Geoprocessing Results
The Results option in the Geoprocessing menu (Figure 14) is a useful reference. When
you run a tool, the results window will display the tools that you have run since opening
that instance of ArcMap. You can expand each entry to look at the parameters you
entered, and any messages generated during processing. This can be especially helpful
if a process fails and you want to investigate it more fully.
When processing is complete, a small popup appears in the bottom right corner of your
screen, letting you know if the process was successful or if it failed. Clicking on the link
in that popup will also open the Results window.
If you want to run a process again with slightly different parameters, open the Results
pane, expand the Current Session section, and double-click the process you would like
to repeat. The tool dialog will open, pre-populated with the parameters you used when
you ran it. Make the desired changes, and click OK to run the tool again with your new
parameters.
Figure 14: Opening the Results window

6 February 2019 v.1.3 | 16
UAF is an AA/EO employer and educational institution and prohibits illegal discrimination against any individual: www.alaska.edu/nondiscrimination
Visualizing SAR Data
You may wish to change the way an image is displayed, especially if it is too dark or
washed out to see features clearly. Because the Sentinel-1 GRD products are displayed
with amplitude values, they will usually display well in GIS environments; this is more of
an issue when viewing datasets with power values. In any case, you can use the
ArcMap stretch settings to display the image with a different level of contrast without
changing the data or having to generate a new image.
1. Right-click on the image layer in the Table of Contents, select Properties.
2. In the Symbology tab, under the Stretched option, experiment with the different
Type options. The default is Percent Clip, but you may prefer Standard Deviation,
Sigmoid, Histogram Equalize, or Minimum-Maximum.
Many of these options have different parameters; experiment with different
values to see which settings bring out the features of interest in your
image. For example, the default setting for Standard Deviation is 2.5, but
you may find that a different value is more appropriate for the range of
values in your image.
Click Apply to see how your changes affect the image. When you decide
on a setting you like, click OK.
3. When using the Identify tool on a stretched image, the main Identify window will
still display the original power value. The expanded feature properties will display
both the Stretched value and the original pixel value.