geology of lagoa das furnas, a crater lake on são miguel, …899432/fulltext01.pdf · geology of...
TRANSCRIPT
Geology of Lagoa das Furnas, a crater lake on São Miguel,
Azores archipelago
Licentiate thesis
by
Tommy Andersson
Department of Geological Sciences
Stockholm University
2015
“Hot springs are prominent at Furnas and, along with its magnificent scenery…” (Moore, 1991)

Abstract
In this thesis, the results from a geophysical mapping and coring campaign of Lagoa das Furnas
are presented. Specific focus is placed on the origin of a subaqueous volcanic cone mapped in the
southern part of the lake. Lagoa das Furnas is a crater lake within the Furnas volcanic centre
which is located on the island of São Miguel in the Azores archipelago. The Furnas volcanic
centre has a long history of earthquakes and volcanic activity. The area is relatively well-studied,
except for the lake floor. Therefore, a high resolution geophysical and geological mapping survey
was conducted at Lagoa das Furnas. Sidescan sonar was used to map the surface of the lake floor
and single beam sonar was used to acquire sub-bottom profiles. In addition to the geophysical
mapping, sediment surface sampling and core drilling were carried out followed by geochemical
analyses of the retrieved material. The mapped data permitted a characterisation of the floor of
Lagoa das Furnas and revealed several volcanic features including fumarolic activity and a
volcanic cone in the southern part of the lake. In order to unravel the origin of this cone several
methods were applied, including analyses of tephra and minerals collected from the cone itself
and from nearby deposits of two known eruptions, Furnas I and Furnas 1630. Sedimentological,
petrological, geochemical and geochronological studies of pyroclastic deposits from the cone
suggest a subaqueous eruption linked to the Furnas 1630 eruption. The chemistry of glass and
crystal fragments sampled from the cone suggests that it is composed of more evolved magma
than that of the main Furnas 1630, implying that the lake cone is likely a product of the last
eruptional phase. According to historical records, two of three lakes were lost due the 1630
eruption. The results of this study show that the remaining lake is most likely Lagoa das Furnas
and consequently did exist before the 1630 eruption.
Table of Contents
1 Introduction ............................................................................................................................. 1
1.1 Background ........................................................................................................................ 1
1.2 Geological setting .............................................................................................................. 3
1.2.1 Atlantic setting ........................................................................................................... 3
1.2.2 São Miguel setting ...................................................................................................... 3
1.2.3 Furnas setting ............................................................................................................. 5
1.3 Hazards in Furnas .............................................................................................................. 5
1.3.1 Earthquakes ................................................................................................................ 5
1.3.2 Landslides ................................................................................................................... 6
1.3.3 Flooding ..................................................................................................................... 7
1.4 Two historical eruptions in Furnas volcano ...................................................................... 7
1.5 Earlier geophysical studies in crater lakes ......................................................................... 9
2 Methods .................................................................................................................................. 10
2.1 Geophysical mapping ...................................................................................................... 10
2.1.1 Acoustic mapping methods ...................................................................................... 10
2.1.2 MD 500 single beam echo sounder .......................................................................... 12
2.1.3 Klein 3000 sidescan sonar ........................................................................................ 13
2.1.4 Hemisphere 100 GPS ............................................................................................... 13
2.1.5 Software ................................................................................................................... 13
2.1.6 Geodetic datum and projections ............................................................................... 14
2.2 Sediment coring and drilling ........................................................................................... 15
2.2.1 Portable core sampler ............................................................................................... 15
2.3 Rock sampling and geochemical/petrological analysis ................................................... 16
3 Results .................................................................................................................................... 17
3.1 Backscatter and acoustic returns analysis ........................................................................ 17
3.1.1 Single beam sonar .................................................................................................... 18

3.1.2 Sidescan sonar .......................................................................................................... 18
3.2 Debris from mass movements ......................................................................................... 19
3.3 Summary of manuscript ................................................................................................... 20
4 Discussion and conclusions ................................................................................................... 21
Acknowledgements ....................................................................................................................... 24
References ..................................................................................................................................... 25
Manuscript


1
1 Introduction
1.1 Background
São Miguel is the most populated island in
the Azores archipelago with ca. 150,000
inhabitants. Three active volcanoes on São
Miguel have erupted within the past 500
years and the majority of the inhabitants live
close to them. One of these, the Furnas
volcano, is regarded as particularly
dangerous with five explosive eruptions
within 1,100 years (Moore, 1991b) Even a
small eruption in the Furnas area could cause
fatalities (Guest et al., 1999).
The Furnas area has been subjected to
several geological studies. Booth et al. (1978)
made a tephrochronology study and
produced isopach and isopleth maps of
tephra distributions during the past 3,000
years. Moore (1991b) made an overall
geological study of Furnas. However, there
are no systematic geological and geophysical
studies of the crater lakes in São Miguel.
Bottoms of crater lakes world-wide are
generally less studied than their surrounding
landscapes simply because the water body
prevents direct mapping. Though, there is
strong incentive to investigate and monitor
crater lakes from a hazard mitigation
perspective. Lakes situated in calderas are
located above one or more magma chambers.
Hot magma and storage of large volumes of
water makes an explosive and dangerous
combination. It can not only generate
phreatomagmatic eruptions and lahars with
devastating consequences, as during the
large volcanic event that took place 1630 in
Furnas (Cole et al., 1995), but also flooding
when large amounts of water drain during an
eruption. This may cause serious damage
downslope from the crater lake, as when
Aniakchak crater lake in Alaska rapidly
drained because of caldera failure
(Waythomas et al., 1996).
Geochemical investigations and monitoring
of crater lakes are not too uncommon
because they are considered a potential
geohazards; e.g. seismic and fumarolic
activity have been monitored at Poás
Volcano in Costa Rica (Rowe Jr et al., 1992),
gas discharges have been analysed at Mt.
Ruapehu, New Zealand (Christenson, 2000)
and temperatures and pH have been
monitored in a newly formed crater lake at
El Chichón in Chiapas (Casadevall et al.,
1984). Some geochemical investigations of
Lagoa das Furna’s water have been carried
out, as well. From these, Cruz et al. (2006)
showed a high content of CO2 in the water.
Ferreira et al. (2005) monitored the
fumarolic activity on the northern shore of
Lagoa das Furnas and showed that CO2
represented 94 to 99.6 mol % of the steam
discharges.
Seismic and volcanic activities in crater
lakes are widespread and common
phenomena. The bottom of a crater may thus
contain clues about a number of volcanic
and tectonic processes affecting the area.
These include caldera formation, collapse of
the caldera-floor, dome- or cone-formation,
2
active faultings, fumarolic activity and active
gas seepages. Lake bottom and/or sub-
bottom structures may thus provide valuable
information about the volcanic centre as a
whole. Furnas valley has changed
appearance during history. Historical
documents reveal that more than one lake
body existed in the Furnas area before the
1630 volcanic event, and studies of the lake
bottom may reveal additional information
about how the present Lagoa das Furnas got
its form.
Sediment cores of deposits in a crater lake
may provide an archive of past historical
volcanic activity (Barker et al., 2000) and
geophysical mapping using sonars may
reveal geomorphological structures on the
lake floor and within sub-bottom sediment
stratigraphy (Ulusoy et al., 2008, Morgan et
al., 2003). The aim of this licentiate project
is to apply coring and geophysical mapping
to characterize the bottom and sub-bottom of
Lagoa das Furnas and to investigate the
occurrence of tectonic events and volcanic
activity that occurred since the Azores
islands were first inhabited. In November
2012 a geophysical mapping survey was
conducted and sediment cores were retrieved
from the lake floor in June 2013 and May
2014. In this thesis the results from
geophysical, sedimentological, petrological,
geochemical and geochronological studies
from the crater lake of Lagoa das Furnas are
presented.
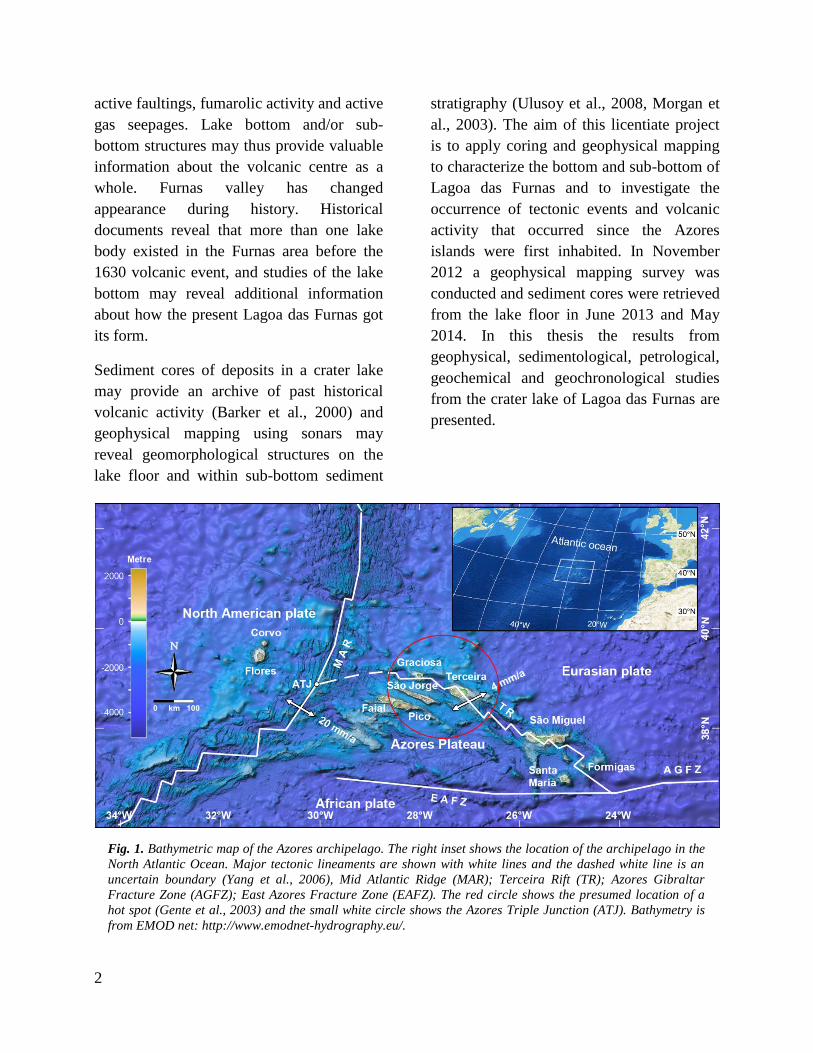
Fig. 1. Bathymetric map of the Azores archipelago. The right inset shows the location of the archipelago in the
North Atlantic Ocean. Major tectonic lineaments are shown with white lines and the dashed white line is an
uncertain boundary (Yang et al., 2006), Mid Atlantic Ridge (MAR); Terceira Rift (TR); Azores Gibraltar
Fracture Zone (AGFZ); East Azores Fracture Zone (EAFZ). The red circle shows the presumed location of a
hot spot (Gente et al., 2003) and the small white circle shows the Azores Triple Junction (ATJ). Bathymetry is
from EMOD net: http://www.emodnet-hydrography.eu/.

3
1.2 Geological setting
1.2.1 Atlantic setting
Lagoa das Furnas is located on São Miguel,
the largest island in the Azores archipelago
(Fig. 1). The Azores archipelago comprises
nine islands. The western group, Corvo and
the smallest island Flores, is located on the
North American plate, west of the Mid
Atlantic Ridge (MAR) which has a
spreading of ca. 20 mm/a (Vogt and Jung,
2004). Graciosa, Pico, Terceira, Faial and
São Jorge belong to the central group. São
Miguel and the oldest island Santa Maria
form the eastern group together with the
Formigas islets. Volcanism and earthquakes
on the Azorean archipelago are directly
related to their tectonic setting in the North
Atlantic. The islands are situated on the
Azores Plateau, which rises about 1,500 m
above the surrounding seafloor. This plateau
is formed at the Azores Triple Junction
where the North American, Eurasian and
African lithospheric plates meet with
presumed hot spot interaction (Gente et al.,
2003). At the plateau, the lithospheric plate
boundary includes several additional
complex tectonic features. One of the more
significant is Terceira Rift, a hyper-slow
spreading zone with plate separation of ca. 4
mm/a (Vogt and Jung, 2004). It starts from
the Azores triple junction (ATJ) and extends
along or alongside the islands Graciosa,
Terceira and São Miguel. It is widely
accepted, according to Vogt and Jung (2004),
that the ATJ has made a jump from the
intersection of East Azores Fracture Zone
(EAFZ) and the MAR to its present location
(Fig. 1).
1.2.2 São Miguel setting
The Terceira rift axis crosses the western
part of São Miguel where it trends NW-SW
(Fig. 2), whereas in the central and eastern
parts of the island, the rift trends W-E,
Fig. 2. São Miguel island consists of six volcanic centres. Boundaries from Geological map of São Miguel
(Moore, 1991a). Lines representing faults, inferred faults and volcanic alignments, modified from (Carmo et
al., 2014).The inset shows the tectonic lineaments in São Miguel. A is the Terceira rift axis and B is the
alignment of Agua da de Pau, Furnas and Nordeste volcanic centres, modified from (Beier et al., 2006). The
topography is from the global land elevation model (DEM) generated from the Shuttle Radar Topography
Mission (SRTM) (Farr et al., 2007).
4
parallel to EAFZ (Beier et al., 2006, Moore,
1991a). This is expressed as a series of
trachytic volcanic centres linked by rift
zones. The island comprises a total of six
volcanic zones. Sete Cidades is the
westernmost of these zones. It is an active
trachytic stratovolcano which has had at
least 17 explosive eruptions during the past
5,000 years (Guest et al., 1999) (Fig. 2).
Further east, Região dos Picos which is
sometimes referred to as the “waist region”
is an 18 km long rift field with numerous
mainly alkali-basaltic cinder cones. These
link to the next volcanic centre, Agua de Pau
which is also called Fogo. This has been the
site of at least five eruptions, mostly within
the caldera, during the past 5,000 years
(Booth et al., 1978). A major eruption
occurred ca. 5,000 years ago and is a key
marker horizon in the area, called “Fogo A”
(Walker and Croasdale, 1971). East of Fogo
is Achada das Furnas, a fissure zone,
dominated by alkali-basalt cinder cones and
links with the active Furnas volcanic centre.
The easternmost volcanic centre, Nordeste,
is no longer active. Nordeste is between 4 to
0.95 million years old and is the oldest
volcano centre in São Miguel (Abdel-
Monem et al., 1975).
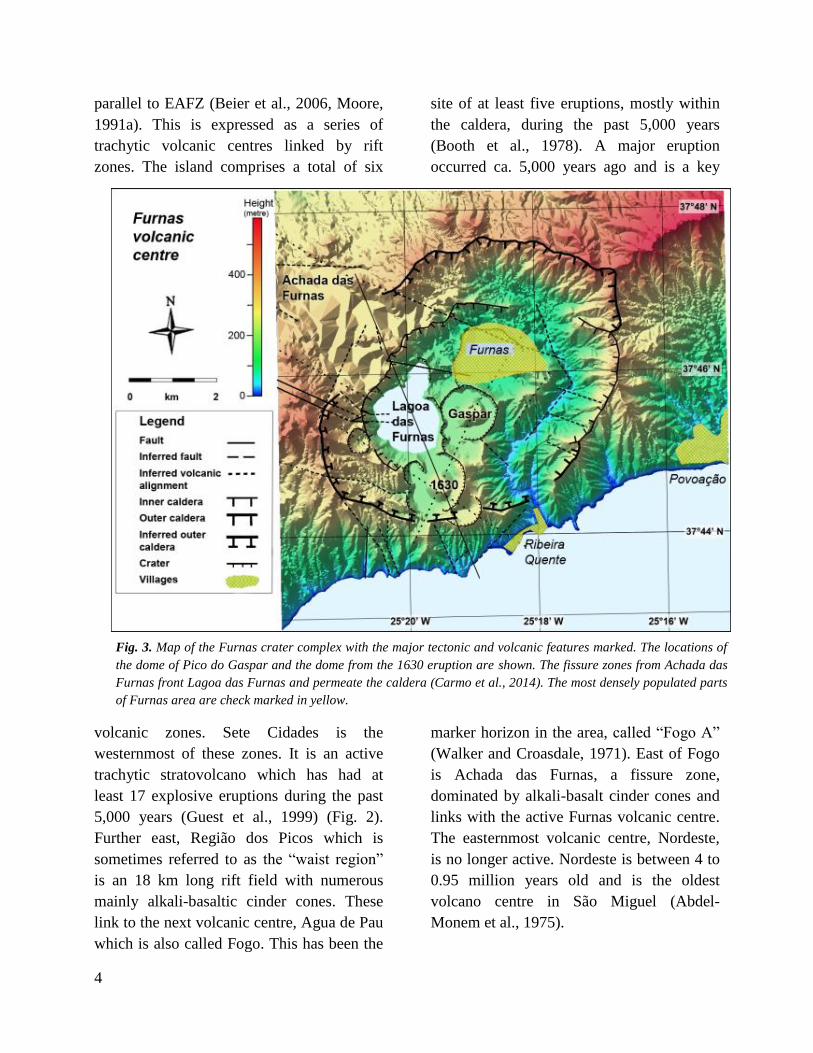
Fig. 3. Map of the Furnas crater complex with the major tectonic and volcanic features marked. The locations of
the dome of Pico do Gaspar and the dome from the 1630 eruption are shown. The fissure zones from Achada das
Furnas front Lagoa das Furnas and permeate the caldera (Carmo et al., 2014). The most densely populated parts
of Furnas area are check marked in yellow.

5
1.2.3 Furnas setting
The Furnas trachytic volcano centre is
located approximately 800 m above sea level
and is about 100,000 years old, making it the
youngest of the active volcanos on the island
(Moore, 1991b). The centre is transected by
several WNW-ESE trending faults which
extend from the Achada das Furnas rift zone
(Guest et al., 1999) (Fig. 3). It consists of
two craters with edifices that are not well
developed; the outer caldera is about 30,000
and the inner caldera is about 10-12,000
years old (Guest et al., 1999). The formation
of the inner caldera was probably followed
by an eruption related collapse that could
have formed the crater lake Lagoa das
Furnas (Guest et al., 1999). During the past
5,000 years at least 10 intra caldera eruptions
have occurred of trachytic character and
formed pumice rings and domes on the
caldera floor (Booth et al., 1978). Mafic
eruptions have only occurred on the flanks
of the caldera. Furthermore, three areas of
fumarolic activity are found in the caldera.
One is found on the northern shore of Lagoa
das Furnas and probably related to the
nearby fault. The other two areas are found
in Furnas village and 1 km southeast of
Ribeira Quente (Moore, 1991b).
1.3 Hazards in Furnas
At times, volcanism has plagued the islands
situated along Terceira Rift zone (Malheiro,
2006, Lourenço et al., 1998, Searle, 1980).
For example, the Furnas volcano has had
eight trachytic eruptions, between 2,900
years BP and 320 years B.P. This gives a
mean dormant time of ca. 370 years which
means the next eruption may be overdue.
Moreover, the mean dormant time for the
last five eruptions, between 1,100 years BP
and 320 years BP, is approximately 175
years which means that an eruption is now
long overdue (Moore, 1991b). Mathematical
calculation by Jones et al. (1999), based on
Poisson distribution of the eruptions for the
last 5,000 years, show that the risk of an
eruption before 2099 is 53 % with a 95 %
confidence interval.
Besides volcanism, the Furnas area is
particularly vulnerable to geohazards related
to landslides and degassing (Guest et al.,
1999). The steep walls of the caldera enclose
both the lake and the villages of Furnas and
Ribeira Quente which limits evacuation
routes for people in the case of volcanic
eruptions, flooding or mass wasting (Fig. 5).
The Furnas area has therefore been closely
monitored with respect to geohazards over
recent decades (Baxter et al., 1999, Gaspar et
al., 2004, Ferreira et al., 2005).
1.3.1 Earthquakes
The Azores archipelago is an area of high
seismic activity (Senos et al., 1998). One
major earthquake occurred in 1757 and
killed more than 20 percent of the population
on São Jorge Island. The largest event during
the 20th
century occurred at Terceria Island
1980; the magnitude was 7.2 and caused
many fatalities. An earthquake in 1998 had a
magnitude 5.8 and caused severe damage in
Faial and Pico (Senos et al., 1998).

6
São Miguel has high seismic activity (Guest
et al., 1999). The area between Fogo and
Furnas is the most seismically active on São
Miguel (Gomes et al., 2006) (Fig. 4). Several
catastrophic earthquakes have occurred in
the Furnas area during the last five centuries.
One of the most devastating occurred in
1522 and destroyed the former capital Vila
Franca do Campo, ca. 10 km west of Furnas.
Furthermore, more than 46,000 earthquakes
were registered in the Congro-Fogo
seismogenic region, ca. 7 km west of Furnas,
between May and December 2005, the
strongest had a magnitude of 4.3. Even
though the earthquakes were of smaller size
they trigged more than 250 landslides
(Marques et al., 2007).
1.3.2 Landslides
The Azores are located in a mild maritime
climate zone. The average temperature is
17.8°C and the annual average rainfall in the
Furnas area is 2220 mm (Cruz et al., 1999).
The soil in São Miguel is unconsolidated and
contains tephra and pyroclastic rocks (Moore,
1991b). During long periods of rainfall, the
soil can become saturated and landslides can
occur either spontaneously or to be trigged
by earthquakes (Valadão et al., 1999).
Several major landslides have occurred in
São Miguel. For example the devastation of
the former capital Vila Franca do Campo
(1.3.3) was caused by an earthquake
triggered landslide. This landslide killed the
entire population of nearly 5,000 people. São
Miguel was also plagued with heavy rain
storms in October 1997, which most likely
contributed to the landslides that killed 29
people in Ribeira Quente, situated in the
south flank of Furnas (Figs. 3 and 5). Houses
and bridges were destroyed and the area was
isolated for more than 12 hours (Valadão et
al., 1999).
The risk of landslides has been mapped for
São Miguel Island showing that the highest
risks occur along the southern shore of
Furnas facing the ocean, although practically
all slopes in the Furnas area are identified as
high-risk areas (Valadão et al., 1999). Strong
seismic activity is expected prior to a
Fig. 4. The epicentre distribution of earthquakes in São Miguel between 1986 and 2006. Vila Franca do
Campo is marked with a white circle. The image is modified from Gomes (2006).

7
volcanic eruption at Furnas, which could
cause landslides possibly isolating the
communities in the Furnas area (Guest et al.,
1999).
1.3.3 Flooding
The water recharge area of the Furnas
caldera measures ca. 33.2 km2 and feeds the
streams of Ribeira dos Tambores, Ribeira
Amarela from Lagoa das Furnas and Ribeira
Quente (Cruz et al., 1999). The outflow from
Lagoa das Furnas basin passes Furnas
village and ends at Ribeira Quente at the
south shore. The water content in Lagoa das
Furnas is ca. 13,000,000 m3. A small barrier,
ca. 7.4 m above the Lagoa das Furnas water
surface, separates the lake from the valley
that leads to Furnas Village. This barrier
could breach due to an earthquake or a
landslide without seismic activity if the soil
is saturated and cause serious flooding in
Furnas village and Ribeira Quente (Guest et
al., 1999).
1.4 Two historical eruptions in
Furnas volcano
When the first settlers discovered the
archipelago of the Azores in the early 15th
century, Santa Maria was the first island to
be inhabited by the Portuguese during the
autumn of 1431 (Guest et al., 1999). São
Miguel was sighted from Santa Maria and an
expedition was sent to the island in order to
release animals for grazing. Sometime
between 1439 and 1443 they returned to São
Miguel and were met by ”tongues of fires”
and earth tremors (Dias, 1936). A priest
entered the valley and saw vapour rising and
three lakes, later named Lagoa Grande,
Lagoa Berrenta and Lagoa Obscura. Most
likely, the described eruption corresponds to
the latest eruption from Gaspar Dome (Guest
et al., 1999).
The most recent eruption in Furnas is from
1630 and caused about 195 casualties. It was
an explosive eruption of subplinian character
with a dome building ending phase,
described in detail by Cole (1995). At the
time of the 1630 eruption, people were living
in the Furnas valley and at the northern and
southern coast of Furnas. The villages
nearest to the caldera were Povoação,
Ribeira Grande, Ponta da Garça and Vila
Franca located at the southern shore (Fig. 6).
Several first-hand observations from the
Fig. 5. Slope map of the terrain of the Furnas area and
the evacuation roads. The cross-hatched areas are
populated and the stripes shows an area that is
particularly at risk for landslides in Furnas and São
Miguel (Valadão et al., 1999).

8
eruptions have been recorded. Manoel da
Purificação describes “clouds of fire from
two of the lakes” and violent tremors on
Monday the 2nd
of September 1630 between
8 pm and approximately 10 pm. He
described a short time of calmness after the
tremors and around 11pm an explosion blew
away an “elevation” between two lakes (Fig.
6). That was the start of the latest eruption in
Furnas where ashes from the eruption
“turned the day to night” for the next three
days (Da Purificação, 1880).
The narrative of Pedro da Ponte confirms the
witnessing of tremors and a subsequent
eruption on the night between the 2nd
and 3rd
of September, which was ongoing until
Friday the 5th
(Da Ponte, 1880). Moreover,
Pedro da Ponte writes that 75 people died
when they harvested “baga de louro” in the
fields. Another witness, João Gonçalves
Homem, describes three explosive active
days with ash fall and a new eruption phase
with tremors that “felt like the whole island
was in swale” (Gonçalves, 1880). These
tremors were ongoing for about two months.
The consequences for the villages in the
valley and south of Furnas were devastating,
in Povoação only one functional house
remained and in Ponta da Garça one house
and one chapel was left. João Gonçalves
Homem also states that 115 died from a
pyroclastic surge in Ponta da Garça
(Gonçalves, 1880). Furthermore, he
describes that “the eruption consumed and
dried two lakes” and that “Lagoa Grande
continued to have clear water”. He also
describes in detail “boiling water with smoke
and fires” and “material spreads from three
gaps“ on the south flank near the shore.
It seems likely that the reported Lagoa
Grande in fact is the present Lagoa das
Furnas and Lagoa Barrenta and Lagoa
Obscura were the lakes in the valley that was
lost due to the eruption. This is further
described in more detail in the manuscript.
Moreover, basaltic eruptions are restricted to
the flanks of the volcano and basaltic dykes
are exposed along the coast and form
Fig. 6. On the left a map of the surroundings of Furnas volcano modified from Wallenstein et al. (2007). On the
right a painting of the eruption in Lagoa das Furnas by Manuel Carreiro with direction from Victor-Hugo
Forjaz.

9
offshore basaltic reefs (Guest et al., 1999).
The gaps, described by João Gonçalves
Homem, were most likely dykes with lava
flows on the flank of Furnas volcano.
1.5 Earlier geophysical studies in
crater lakes
Sub-bottom sonars are needed for
penetrating the sediment stratigraphy and
sidescan sonar (SSS) for making a mosaic of
the sub-bottom. But, crater lakes are often
located in remote areas and can be difficult
to access. Nevertheless, several geophysical
studies have been made and listed by
Newhall et al. (1987). They list only 14
crater lakes where seismic reflection studies
have been undertaken between 1971 and
1986. For example a geophysical and
geological survey was made by Poppe et. al.,
(1985) in Laguna de Ayarza in Guatemala.
This caldera lake is similar to Lagoa das
Furnas in that it is a twin lake, but differs in
that it is double the size. Powerful airgun
sonar penetrated the sediment stratigraphy at
least 170 m revealing a chaotic caldera
collapse. Even though the geophysical study
was made by airgun sonar the signal was
attenuated by gas in some areas in the lake.
An airgun sonar together with a sidescan
sonar were used for making an image of the
lake floor and for collecting sub-bottom
profiles in Crater Lake, Oregon (Nelson et
al., 1986).
Moreover, more modern multibeam sonars
have the capability to acquire both high
resolution mosaics of lake floors and high
resolution sub-bottom profiles. The survey
on Crater Lake (Oregon) 2002 was likely
one of the first surveys with multibeam
technique in a crater lake (Bacon et al.,
2002). They revealed landforms in striking
detail and also new features were discovered.
Lake Albano was investigated by multibeam
bathymetric survey in 2005 which provided
e.g. detailed 3-D maps and information of
earlier unknown morphological features
(Anzidei et al., 2006).
10
2 Methods
2.1 Geophysical mapping
In November 2012 a geophysical survey was
conducted of Lagoa das Furnas using a
sidescan sonar and single beam echo sounder.
The survey was complemented by sediment
coring, drilling and visual bottom inspection
by divers. A small vessel (~ 1.5 m x 4 m)
was used to accomplish both the geophysical
mapping and the sediment coring (Fig. 7).
This description of applied methods
complements that of the manuscript by
adding addition technical details and the
fundamentals of the used mapping and
coring techniques.
2.1.1 Acoustic mapping methods
A single beam echo sounder was used for
bathymetric data and to acquire sub-bottom
profiles. Echo sounders are capable of
penetrating the sub-bottom sediment
stratigraphy. The penetration is a result of
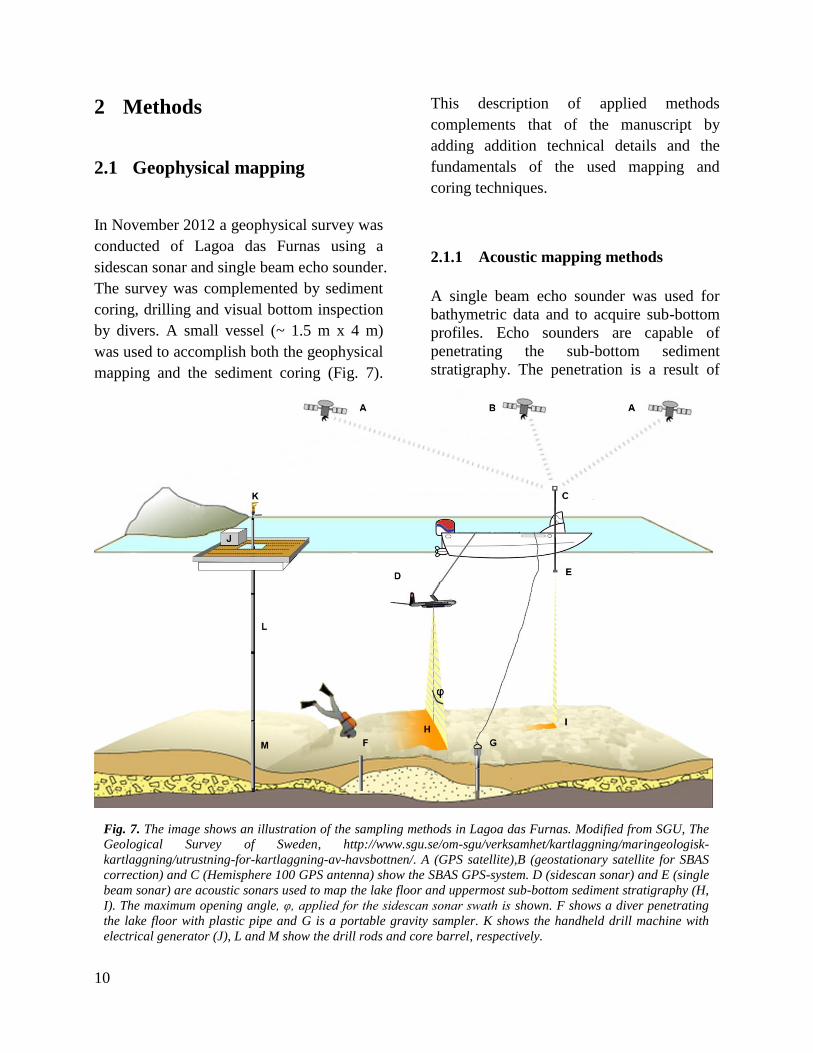
Fig. 7. The image shows an illustration of the sampling methods in Lagoa das Furnas. Modified from SGU, The
Geological Survey of Sweden, http://www.sgu.se/om-sgu/verksamhet/kartlaggning/maringeologisk-
kartlaggning/utrustning-for-kartlaggning-av-havsbottnen/. A (GPS satellite),B (geostationary satellite for SBAS
correction) and C (Hemisphere 100 GPS antenna) show the SBAS GPS-system. D (sidescan sonar) and E (single
beam sonar) are acoustic sonars used to map the lake floor and uppermost sub-bottom sediment stratigraphy (H,
I). The maximum opening angle, φ, applied for the sidescan sonar swath is shown. F shows a diver penetrating
the lake floor with plastic pipe and G is a portable gravity sampler. K shows the handheld drill machine with
electrical generator (J), L and M show the drill rods and core barrel, respectively.
11
the used frequency of the sound lobe and
acoustic characteristics of the geologic
material. The reflected signal is proportional
to the amplitude from the transducer and the
magnitude of the acoustic impedance
contrast. Acoustic impedance contrasts
within the sediment stratigraphy will give
rise to reflections of the transmitted sound
lobe, which continues to propagate through
the sub-bottom stratigraphy until it has lost
all its energy. The sound lobe will lose
energy before reaching the sub-bottom
material, when traveling through the water
column mainly through acoustic absorption.
The pressure amplitude will be absorbed
depending on the two-way distance and the
frequency of the sound lobe approximately
by:
(The following theory is mainly based on
synopsis on signal theory provided by
Mosher and Simpkin (1999). While the
presented equations are from standard
acoustic theory, they are here presented in
the forms given by Mosher and Simpkin.)
𝑃𝑟 = 𝑃0𝑒
𝑟
−𝛼𝑘𝑓𝑟 (1)
where Pr is the pressure amplitude received
from the source amplitude, P0 at a distance r.
𝛼𝑘 is the absorption coefficient and fr is the
frequency of the sound lobe. From this
equation it is clearly seen that longer
distances from the acoustic source as well as
higher applied frequencies will yield lower
pressure, resulting in weaker echoes from
targets. Large acoustic characteristic
impedance contrasts between subsequent
geological layers imply stronger echoes.
Seismic reflection is the reflection of a
sound lobe between two media with different
impedance and the size of seismic reflection
is determined by:
𝜇0 =𝐼2−𝐼1
𝐼2+𝐼1=
𝑉2𝜌2−𝑉1𝜌1
𝑉2𝜌2+𝑉1𝜌1 (2)
where 𝜇0 is the reflection coefficient, I is the
acoustic impedance, V is the compressional
sound speed and 𝜌 the bulk density. The first
strong echoed signal is usually representing
the sea/lake bottom since there is commonly
a large acoustic characteristic impedance
contrast between the water and bottom
material. Moreover, geologic characteristics
of the lake floor will influence the size of the
seismic reflection. A rough lake floor will
scatter the sound lobes and reduce the
echoed signals more than a flat lake floor.
Slope angles of the bathymetry will also
reduce the strength. A high incidence angle
(Fig. 7) of the beam will decrease the size of
the returned signal and is normally
compensated for in the post processing of
the acoustic data. The reflection coefficient
𝜇0 is therefore reduced by:
𝜇 = 𝜇0exp−(4𝜋ℎ𝑠𝑖𝑛φ
𝜆)2 = 𝜇0𝑒
−𝑅2 (3)
where 𝜇 is the reduced reflection coefficient,
h is the depth, φ is the incidence angle and 𝜆
is the wave length of the sound lobe. R is
called the Rayleigh coefficient and describes
the size of scattering. Wave length 𝜆 is based
on the frequency (f) and the velocity (V) of
the sound lobe according to:
𝑉 = 𝑓 × 𝜆 (4)
The vertical resolution, R, of the received
signals is often estimated to about 𝜆/4 and is
called Rayleigh Criterion.
𝑅 =𝑉
4𝑓 (5)
This means that the physics of sonars with
near singular high frequency of the sound
lobe is capable of providing a higher
resolution (Equation 5) portrayal of the sub-
bottom stratigraphy but the signal will on the
other hand attenuate (Equation 1) and scatter
more (Equation 3). Consequently, low

12
frequency lobes will penetrate more, though,
with a lower resolution. To overcome this
dilemma another type of sonar can be used.
Chirp sonar produces a signal which sweeps
from a lower to a higher frequency in a pulse.
The difference between the higher and the
lower frequency is called the bandwidth. The
frequency range is anywhere between 400
Hz and 20 kHz. The resolution, R, of a chirp
is decided by (Schock et al., 1989):
𝑅 =𝑉
2𝐵 (6)
where V is the sound velocity and B is the
bandwidth. This type of sonar yields a higher
resolution and a deeper penetration
compared to sonars with constant frequency.
The sidescan sonar emits fan shaped beams
downwards and to the sides and is towed
behind the boat and is sometimes called a
“towfish” (Fig. 7). The frequency used in
sidescan sonar is high, generally between 50
kHz to 1,000 kHz which results in high
attenuation in the water column and limited
penetration in the sub-bottom. Earlier
models printed out the mosaic directly on
scrolling papers but since the late 1980s the
computer has been able to process sidescan
data and e.g. correct towfish instability
(Oppenheim and Cobra, 1988). The returned
echoes to the transducer in sidescan sonars
are sometimes called backscatter and will be
in this paper. Sidescan sonar is used to get a
high resolution picture of the lake/sea floor
and to identify objects on the lake/sea floor
e.g. Lee and Kim (2004). It is also used for
classification of the top sediment on the lake
floor, called acoustic seabed classification,
e.g. Collier and Brown (2005).
2.1.2 MD 500 single beam echo sounder
We used a portable 28 KHz Meridata MD
500 hydrographic echo sounder for
bathymetric data and to acquire sub-bottom
profiles (Fig. 7). The 28 kHz transducer of
this high frequency sub-bottom profiler was
mounted on an aluminium pole attached to
the starboard side of the boat. The pole was
mounted vertically in order to point the
transducer with an angle of 0° towards the
lake bottom. In order to achieve accurate
depths, a sound velocity probe was used to
measure sound velocity profiles of the lake
water at stations spread out over the survey
area. From these stations, a harmonic mean
Fig. 8. Boat and the sidescan sonar (A) with the computers receiving the sub-bottom and sidescan sonar
backscatter data (B).

13
of 1471 m/s was calculated. This value was
taken to be generally representative of the
surveyed part of the lake and applied when
converting echo sound travel times to depth.
2.1.3 Klein 3000 sidescan sonar
A Klein 3000 dual high frequency (100/500
kHz) sidescan sonar was used to map the
surface of the lake floor (Fig. 7). The
sidescan towfish was towed behind the boat
to minimise noise disturbance from the
outboard motor. The high frequency of the
sonar generates and receives high resolution
data for detection of small targets. The
sidescan sonar has a fan shaped beam that
covers a large area of the lake floor.
Maximum incidence angle is 40° and the
towfish can also be tilted between 5° to 25°.
The disadvantage of high frequency sonars is
high attenuation in the water column but
Lagoa das Furnas Lake is shallow with a
maximum depth of ca. 11 m and the
attenuation is relatively low.
2.1.4 Hemisphere 100 GPS
Navigation was provided by mounting a
Hemisphere 100 GPS smart antenna on the
upper end of the pole where the MD 500
transducer was mounted (Fig. 7). This gives
a minimum offset between the GPS positions
and the echo sounder transducer, which
helps to minimise navigational errors. The
satellite-based augmentation system (SBAS)
was used to enhance the navigational
accuracy. SBAS uses geostationary satellites
(Fig. 7) and yields a horizontal accuracy of
approximately 2 m. The positions provided
by the Hemisphere 100 were also used for
the sidescan mapping.
2.1.5 Software
The software of the MD 500 MDCS server,
the core of the system, enables other
programs to communicate with each other
e.g. compass, motion sensor (compensation
for heave and tide), sound velocity profiler
and the MD 500 Echo Sounder. With two
computers it was possible to use both the
single beam sonar and the sidescan sonar at
the same time (Fig. 8). To get absolute
positions MD receives real-time GPS
positions.
The SSS mosaic and sub-bottom profiles
were post-processed with Chesapeake’s
SonarWiz 5 (Fig. 9). The SSS mosaic was
adjusted with several methods for image
enhancement. One important method was the
“Automatic Gain Control” (AGC), used for
compensating data loss for high beam
Fig. 9. A is a processed sidescan mosaic in
SonarWiz and B a non-processed mosaic.
14
incident angle that will reduce the acoustic
return. Figure 9 shows a non-processed
sidescan mosaic lane before and after
adjustments of the returned acoustic signal.
The black stripe in between the port and
starboard swaps is the nadir, and represents
the water column. The AGC was also used
for sub-bottom profiles for compensation of
energy loss when the signal penetrates the
water column and the sediment. An example
of single beam mosaic is shown in figure 14
and figure 17.
The depth data from the single beam sonar
was exported for further gridding. Digital
Terrain models (DTM) were generated by
Surfer 10.7.972 and gridded with the Kriging
interpolation algorithm with 10 m spatial
resolution. That algorithm works well for
interpolation in areas of sparse data (Oliver
and Webster, 1990). 2-D maps were made
by Surfer and the 3-d processing was carried
out with Global Mapper 15.0.6 and
Fledermaus suite 7.3. Garmin GPSMAP
60CSx Handheld GPS Navigator was used to
mark samples and Lagoa das Furnas
shoreline. EasyGPS 4.79 was used for
import of the coordinates and Earthpoint for
conversion coordinates.
2.1.6 Geodetic datum and projections
Given that the earth is flattened at the poles
and composed of varied topography the
following steps were taken for the mapping
of Lagoa das Furnas and the Furnas area.
The World Geodetic System 1984 (WGS 84)
reference surface was employed, a standard
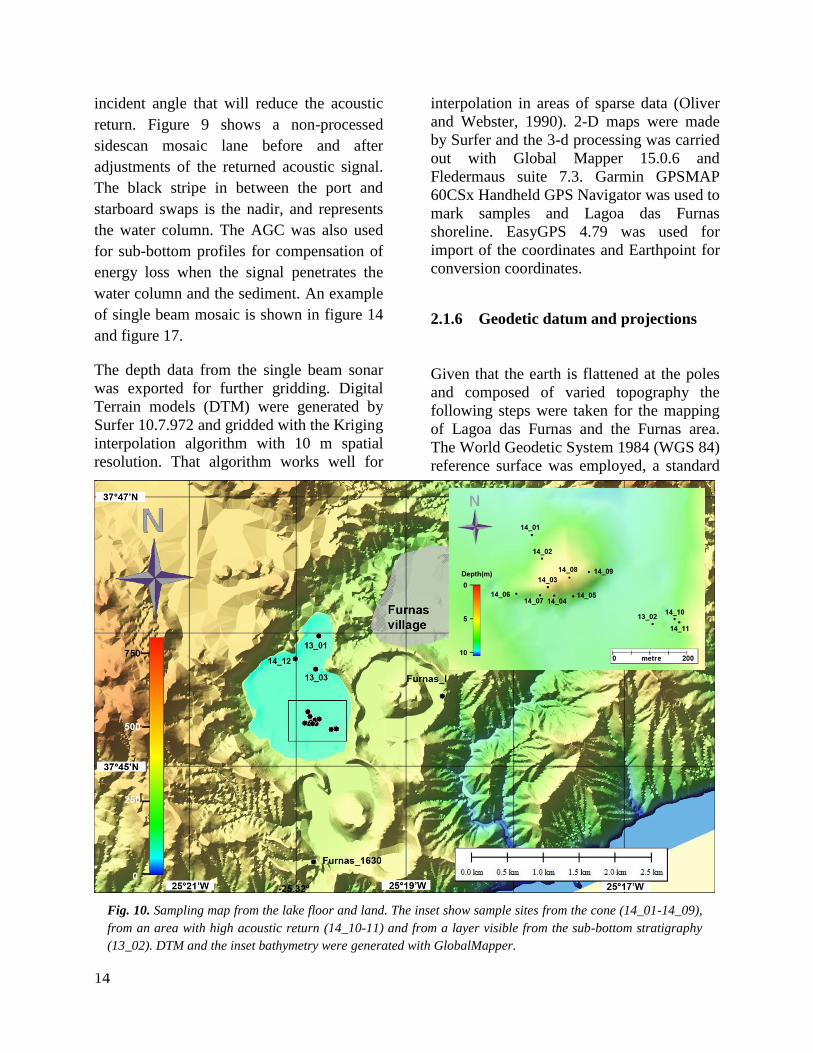
Fig. 10. Sampling map from the lake floor and land. The inset show sample sites from the cone (14_01-14_09),
from an area with high acoustic return (14_10-11) and from a layer visible from the sub-bottom stratigraphy
(13_02). DTM and the inset bathymetry were generated with GlobalMapper.

15
system used in cartography. All topological
maps, bathymetric maps and sidescan sonar
mosaics were overlain in Universal
Transverse Mercator (UTM) projection.
UTM projection covers the reference surface
in 60 conformal zones; the Azores is located
in Zone 26N.
2.2 Sediment coring and drilling
Sediment cores were retrieved from the lake
floor of Lagoa das Furnas in June 2013 and
May 2014. Selection of the sample stations
in the lake was based on the earlier
geophysical survey.
In total 12 sediment cores were collected in
50 mm plastic pipes by divers pressing and
hammering the pipes into the lake bottom
(Fig. 7). Dredge samples were collected
from two sites in the lake. One was collected
at position 14_03 at a depth of ca. 1.3 m and
the other, 13_03 on the ridge between the
northern and the southern part of the lake
(Fig. 10). Also, three samples (14_10, -
14_12) were collected by a specially
designed portable gravity sampler, see 2.2.1.
In addition, lake floor samples were obtained
by drilling in May 2014. This was carried
out with an Atlas Copco 1500 mm
conventional single tube core barrel (Fig. 7).
The diameter of the corer was 46 mm and
the recovered cores were 32 mm in diameter.
The corer was connected to a drilling
machine by drill rods produced by Atlas
Copco that were designed for drilling in
water depths up to 4.5 m. To increase this
depth limit, additional 6 m drill rods were
constructed from 27 mm steel pipes. The
drilling machine was handheld and powered
by an electrical generator driven by gasoline.
Drilling was undertaken from a 3 x 4 m
anchored platform. Finally, samples were
taken on land from eruptive sites of the two
most recent Furnas eruptions: Furnas I and
Furnas 1630 (Fig. 10).
2.2.1 Portable core sampler
In order to collect sediment samples without
divers, a portable core sampler for loose lake
sediment was needed. This corer was
designed to be portable and to cause
minimum disturbance of loose lake
sediments. The total weight of the sampler is
12 kg with material of steel and PVC (Fig.
11).
Fig. 11. Portable core sampler for loose
sediment.

16
To maintain stability, two wings were
welded on the top of the corer (B). The
check valve (C) lets the water flow through
the sampler on the way down to the lake
floor. This will minimise the bow wave in
front of the sampler which can disrupt the
sediment when the sampler hits the lake
floor. This is a common design feature for
samplers of loose sediment (Blomqvist,
1991). The check valve is mounted with a
screwed cap on the top. Further down the
corer has an inner diameter of 40 mm and
outer diameter of 70 mm (D) that ends with
a thread (E). An outer steel thread cylinder
(F) holds the 50 mm plastic pipe (G) with a
length of 630 mm. The corer edge is sharp
for best penetration in the sediment (H).
For operation, the corer needs to be
complemented with plastic tape around the
attachment (E) to ensure it will hold under
pressure. A rope attached to the holder (A)
and the corer is lowered into the water and
released. After penetration the sampler is
retrieved to the surface. During withdrawal,
the check valve will close and the under-
pressure will hold the sediment in the plastic
tube.
2.3 Rock sampling and
geochemical/petrological
analysis
Three sediment cores were analysed with a
non-destructive multi-sensor core logger
(MSCL) and nine cores were scanned with
ITRAX X-ray fluorescence (XRF) at the
Department of Geological Sciences,
Stockholm University (SU). After the non-
destructive analyses the cores were
described lithologically. Detailed core
descriptions are presented in the manuscript.
Furthermore, sub-samples of tephra were
sorted out from the lake cores and from the
land-based Furnas I and Furnas 1630
eruptive sites. The tephra was pulverised to a
size between 40 µm to 150 µm in a mortar
and mounted on stubs (Fig. 12). These
samples were analysed for 13 major
elements using a scanning microscope
Philips XL-30 with an energy-dispersive
spectrometry (EDS) at SU. In addition,
twenty 0.03 mm thin sections were prepared
at SU and Vancouver Petrographic, Canada.
Seven of these thin sections were analysed
using a JXA-8530F electron microprobe
Fig. 12. Scanning electron micrograph of tephra from the cone in Lagoa das Furnas with characteristic tephra
morphology with bubble wall (Lowe, 2011) in (A) and photomicrograph minerals from petrographic microscope
in B. (1) shows trachytic matrix, and (2) the most common phenocryst, feldspar. C is a backscatter electron
image of feldspar from the electron microscope in Uppsala University.
17
analyser with wavelength-dispersive
spectrometers (WDS) at the Department of
Earth Sciences, Uppsala University (Fig. 12).
This is a common method for tephra
analyses (Lowe, 2011). Volcanic glass and
minerals from the thin sections were also
studied using a petrographic microscope and
modal estimates were carried out at SU (Fig.
12). Radiocarbon dates were obtained from
three samples at the Department of
Geological Sciences at Lund University.
3 Results
3.1 Backscatter and acoustic
returns analysis
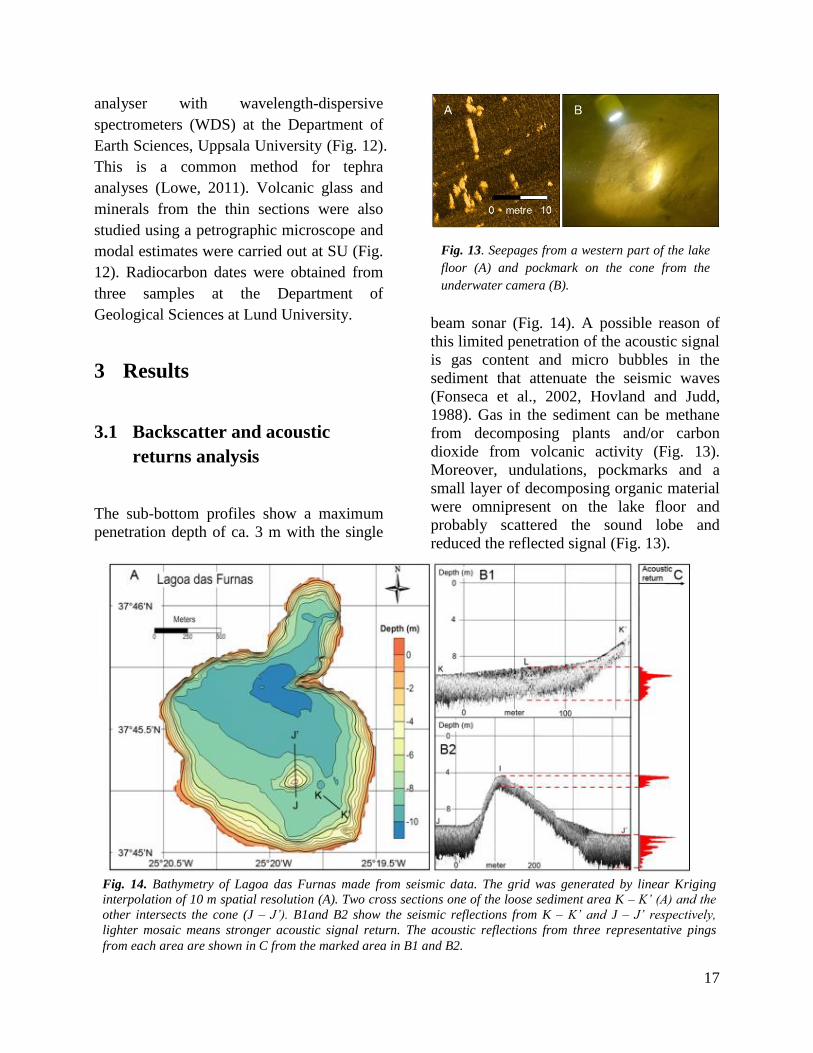
The sub-bottom profiles show a maximum
penetration depth of ca. 3 m with the single
beam sonar (Fig. 14). A possible reason of
this limited penetration of the acoustic signal
is gas content and micro bubbles in the
sediment that attenuate the seismic waves
(Fonseca et al., 2002, Hovland and Judd,
1988). Gas in the sediment can be methane
from decomposing plants and/or carbon
dioxide from volcanic activity (Fig. 13).
Moreover, undulations, pockmarks and a
small layer of decomposing organic material
were omnipresent on the lake floor and
probably scattered the sound lobe and
reduced the reflected signal (Fig. 13).
Fig. 14. Bathymetry of Lagoa das Furnas made from seismic data. The grid was generated by linear Kriging
interpolation of 10 m spatial resolution (A). Two cross sections one of the loose sediment area K – K’ (A) and the
other intersects the cone (J – J’). B1and B2 show the seismic reflections from K – K’ and J – J’ respectively,
lighter mosaic means stronger acoustic signal return. The acoustic reflections from three representative pings
from each area are shown in C from the marked area in B1 and B2.
Fig. 13. Seepages from a western part of the lake
floor (A) and pockmark on the cone from the
underwater camera (B).
18
3.1.1 Single beam sonar
Figure 14 shows the bathymetry map made
by Surfer with depth data from the single
beam sonar. As mentioned in section 3.1, the
penetration depth was limited. Figure 14 also
shows the three recognizable categories of
acoustic returns from the single beam sonar.
The choice of the specific return signals in
figure 14 was based on the typical features
of the ping signals for each category. At J’
on B2 in figure 13 shows the dominant
acoustic return characteristic from the lake.
The first acoustic return shows a relatively
slow increased signal strength that probably
comes from the small layer of decomposing
organic material, as described above. The
signal peaks when it encounters gyttja clay,
with an organic content of ca. 6 %, and
thereafter gradually decreases and terminates
at ca. 3 m. (The sediment depth is based on
the water velocity, 1471 m/s, which will
result in an underestimated value.) On the
cone, the signal encounters harder lake floor
such lapilli, coarse ash and compacted ash
(Fig. 14). The penetration of the cone was ca.
1 m. The attenuation pattern is similar as
with clay gyttja but shorter.
At the eastern part of the lake (the transect
K-K’ in figure 14), we were able to establish
a relative distinct stratigraphy. The
uppermost layer held a higher content of
organic material, ca. 9 %, and the water
content was also higher. The signal
penetrates this softer material ca. 1 m and
subsequently encounters another layer with
different impedance and reaches the
maximal acoustic return. From there the
signal decreases gradually (B1 in figure 14).
3.1.2 Sidescan sonar
A covering sidescan sonar mosaic from
Lagoa das Furnas is shown in figure 6 in the
manuscript.
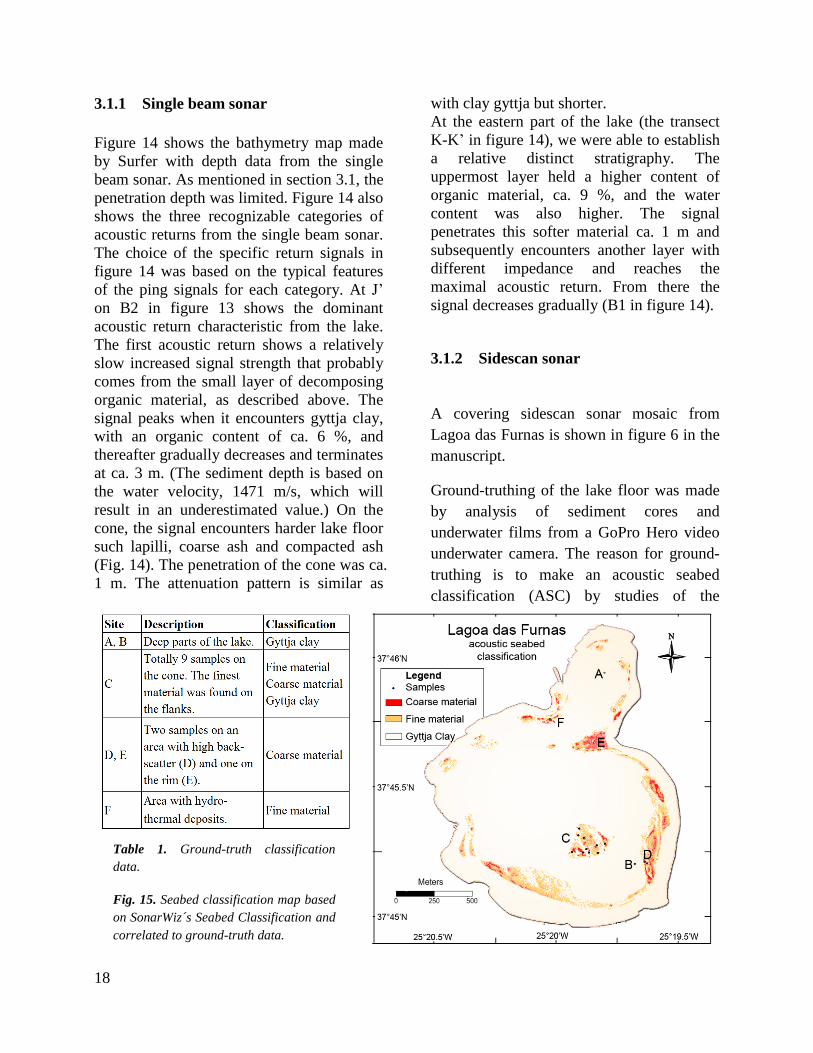
Ground-truthing of the lake floor was made
by analysis of sediment cores and
underwater films from a GoPro Hero video
underwater camera. The reason for ground-
truthing is to make an acoustic seabed
classification (ASC) by studies of the
Table 1. Ground-truth classification
data.
Fig. 15. Seabed classification map based
on SonarWiz´s Seabed Classification and
correlated to ground-truth data.
19
correlation between the features of the
sediment and the characteristic of the
backscatter (Anderson et al., 2008). In short,
a strong signal is assumed to indicate hard
lake floor and a weak signal is assumed to
indicate soft lake floor which absorbs the
signal more (Bellec et al., 2008). The Seabed
Classification manager in the computer
program SonarWiz was used to classify
different textures in the sidescan sonar
mosaic. The program uses a square window
and several statistical calculations for every
pixel in the image. The square could be, for
example, the eight nearest neighbours of a
pixel. One useful statistical process
calculated the standard deviation of the
pixels in the window which resulted in a
“smoother” image. Before the classification
process, the program was “trained” on
representative mosaic lane(s) to identify a
number of different textures. Each pixel in
figure 15 was calculated from 24 neighbours
and the result was divided into six different
classes with unique colours. This seabed
classification was then correlated with the
samples from the lake and reduced to three
classes in Photoshop (Table 1 and Fig. 15).
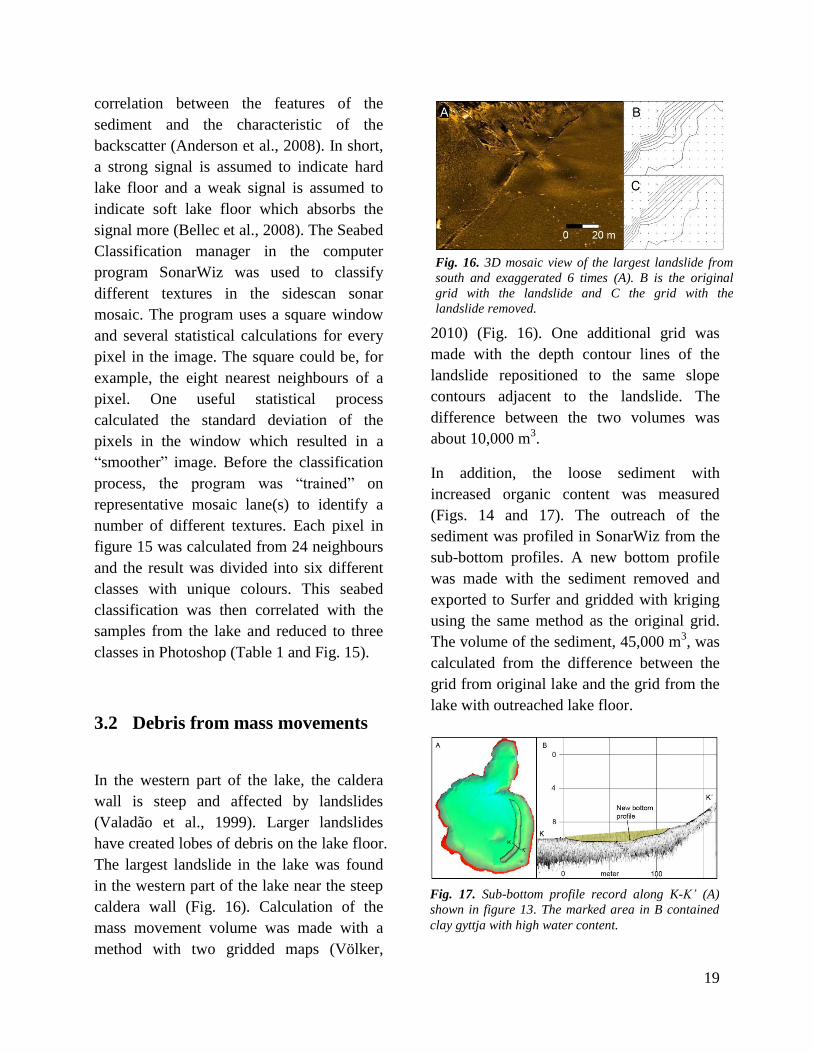
3.2 Debris from mass movements
In the western part of the lake, the caldera
wall is steep and affected by landslides
(Valadão et al., 1999). Larger landslides
have created lobes of debris on the lake floor.
The largest landslide in the lake was found
in the western part of the lake near the steep
caldera wall (Fig. 16). Calculation of the
mass movement volume was made with a
method with two gridded maps (Völker,
2010) (Fig. 16). One additional grid was
made with the depth contour lines of the
landslide repositioned to the same slope
contours adjacent to the landslide. The
difference between the two volumes was
about 10,000 m3.
In addition, the loose sediment with
increased organic content was measured
(Figs. 14 and 17). The outreach of the
sediment was profiled in SonarWiz from the
sub-bottom profiles. A new bottom profile
was made with the sediment removed and
exported to Surfer and gridded with kriging
using the same method as the original grid.
The volume of the sediment, 45,000 m3, was
calculated from the difference between the
grid from original lake and the grid from the
lake with outreached lake floor.
Fig. 17. Sub-bottom profile record along K-K’ (A)
shown in figure 13. The marked area in B contained
clay gyttja with high water content.
Fig. 16. 3D mosaic view of the largest landslide from
south and exaggerated 6 times (A). B is the original
grid with the landslide and C the grid with the
landslide removed.

20
3.3 Summary of manuscript
This manuscript presents results from
geophysical mapping of Lagoa das Furnas
and sedimentological, petrological,
geochemical and geochronological studies of
sediments samples from the lake floor.
Based on bottom characterization of Lagoa
das Furnas, a newly discovered volcanic
cone on the lake floor is described and
proposed to be linked to one of the volcanic
eruptions that took place in 1630. The origin
of the cone is supported by a correlation
between tephra deposited on the cone and
tephra from the Furnas 1630 and Furnas I
eruptions.
Based on a compiled bathymetric map and a
sidescan mosaic assembled from data
acquired in this study, the overall
morphology of the lake floor is described
and geological features such as hydrothermal
deposits, seepages and pockmarks are
located. Furthermore, debris lobes from
mass movements were found in the western
part of the lake just below the steep caldera
rim (Fig. 18).
The most prominent mapped feature in the
lake floor is clearly expressed by a different
backscatter signal. This bathymetric height,
located in the southern part of the lake, takes
the form of a circular oblique cone (Fig. 19).
The cone rises 5 m above the lake floor and
has a basal diameter of 300 m. Its volume
is approximately 100,000 m3 and the slope
angle of it sides is between 2° and 5°.The
surface texture of the cone is coarse with
small pockmark-looking depressions and
small winding fissures.
To investigate the nature of this cone, nine
sediment cores were acquired along two
transects across the cone (Fig. 19). In order
to unravel the origin of the cone, samples
were taken from the two most recent
eruptions, Furnas I and Furnas 1630. The
lithostratigraphy, geochemistry and
mineralogy of these cores were studied in
this work.
The sediment cores retrieved from the cone
are comprised of pyroclastic debris with
alternating layers of ash, pumice and lapilli
indicating explosive subaqueous eruptions.
The spatial distribution of pyroclastic debris
in the area of the cone is consistent with the
hypothesis that the debris were produced
from eruptions of the cone itself rather than
being draped over the cone by an eruption
Fig. 18. Sidescan sonar mosaic of the lake shows: hydrothermal deposit (A), an area with high gas seepages
activity (B) and mass movement material (C). Small funnel shaped pockmarks were frequently on the lake floor,
here documented with a GoPro underwater camera on the cone (D).

21
located elsewhere. Result of drilling on the
cone indicates blocks or bedrock below 1.3
m of pyroclastic debris.
14C-dating reveals that the cone most likely
was formed during the Furnas 1630 eruption.
Geochemical, petrological and statistical
studies of the pyroclastic material confirm
that it belongs to the same magma series as
the 1630 eruption. The chemical components
of all analysed tephra show strong
intermutual similarities. Applying
Borchardt’s coefficient table gives a
maximum difference of 4 % for major
elements and Ward's minimum variance
method distinguishes two major groups with
maximum dissimilarity, one with tephra
from Furnas 1630 and Furnas I and the other
containing all samples from the cone. The
silica content of pyroclastic debris from the
cone suggests a more evolved magma than
Furnas 1630, with an increased content of
phenocrysts, dominated by feldspar. This
suggests that during a late phase of Furnas
1630 eruption phase Lagoa das Furnas
erupted and a dome or a block-and-ash-cone
in the southern part of the lake was formed.
4 Discussion and conclusions
The high-resolution sidescan mosaic
assembled in this study shows that the lake
floor of Lagoa das Furnas is scattered with
gas seepages and that there are two areas
with hydrothermal deposits. Moreover,
pictures from an underwater camera and
reports from divers revealed pockmarks on
the mapped cone in the southern part of the
lake as well as in all other parts of the lake.
The single beam sonar was used to
characterise the uppermost metres of
accumulated sediments and for acquiring
depth data of the lake. In total, 35 km of
survey lines were acquired in the lake, which
was adequate to generate a general view of
the lake bathymetry and characterise the
uppermost bottom sediments. By draping the
mosaic onto the bathymetry, the volcanic
cone mapped in the southern part of the lake
Fig. 19. The southern part of the lake is dominated by a volcanic cone (A); the illumination is from north and
the picture is 20 times vertically exaggerated. Two transects (No-So;We-Ea) are marked on the cone with nine
samples marked 01-09 (B). Higher backscatter intensity was found on the base of the cone.
22
is clearly visible. In the manuscript, the
eruption producing the cone is suggested to
come from a late stage of the Furnas 1630
eruption. These results as well as the
methods producing them are here further
discussed.
The sub-bottom penetration achieved using
the 28 kHz MD 500 in the relatively shallow
Lagoa das Furnas did not exceed ~3 m (see
chapter 3.1). Previous mapping with this
particular sonar has generally provided much
better results. For example, during surveys in
Lake Vättern, southern Sweden, the
penetration was approaching 15 m in 100 m
water depth and apparently similar bottom
sediments with respect to grain size as in
Lagoa das Furnas (Personal communication,
Martin Jakobsson, SU). Other studies of
crater lakes using more powerful sonars with
lower frequencies have shown good results
with respect to sub-bottom penetration (e.g.
Poppe et al., 1985). However, it is also noted
in previous studies that crater lakes may
have large amounts of gas in the sediment
(Poppe et al., 1985, Newhall et al., 1987),
which causes a known problem for sub-
bottom profilers (Mosher and Simpkin 1999).
Gas will scatter the acoustic signal and
absorb the energy. The abundant small
pockmarks and mapped areas of
hydrothermal vents in Lagoa das Furnas
suggest the presence of gas. This may
explain the poor performance of the 28 kHz
MD 500.
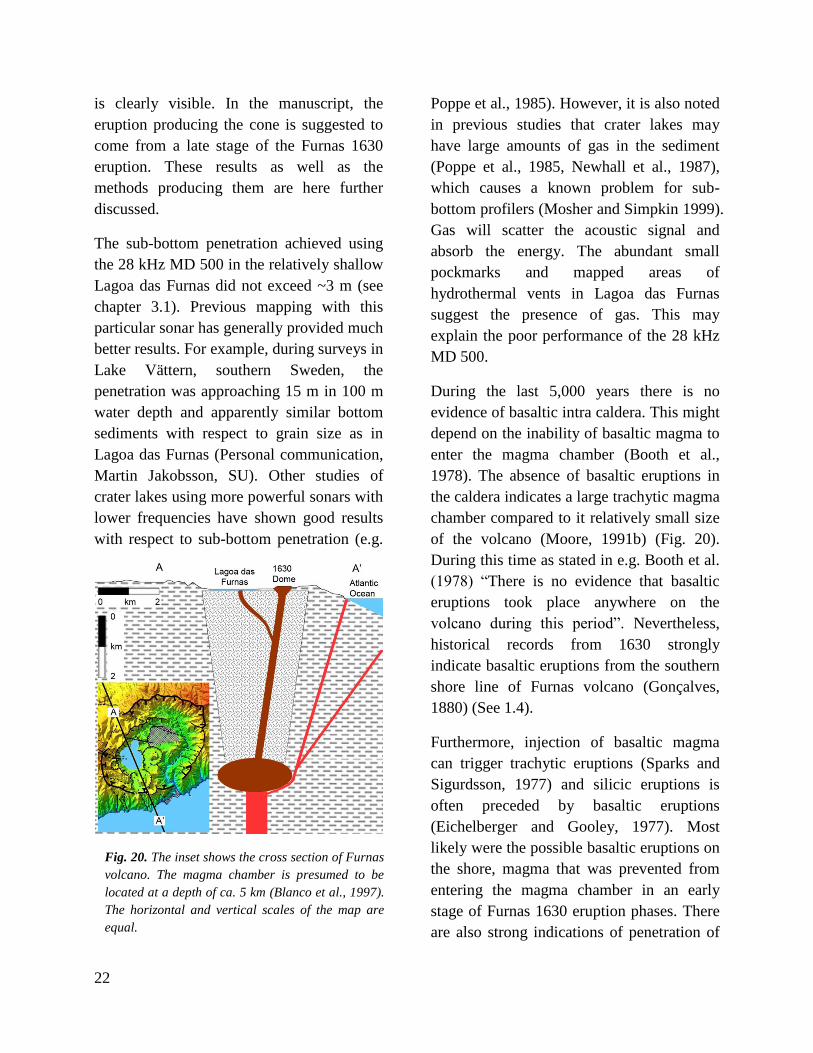
During the last 5,000 years there is no
evidence of basaltic intra caldera. This might
depend on the inability of basaltic magma to
enter the magma chamber (Booth et al.,
1978). The absence of basaltic eruptions in
the caldera indicates a large trachytic magma
chamber compared to it relatively small size
of the volcano (Moore, 1991b) (Fig. 20).
During this time as stated in e.g. Booth et al.
(1978) “There is no evidence that basaltic
eruptions took place anywhere on the
volcano during this period”. Nevertheless,
historical records from 1630 strongly
indicate basaltic eruptions from the southern
shore line of Furnas volcano (Gonçalves,
1880) (See 1.4).
Furthermore, injection of basaltic magma
can trigger trachytic eruptions (Sparks and
Sigurdsson, 1977) and silicic eruptions is
often preceded by basaltic eruptions
(Eichelberger and Gooley, 1977). Most
likely were the possible basaltic eruptions on
the shore, magma that was prevented from
entering the magma chamber in an early
stage of Furnas 1630 eruption phases. There
are also strong indications of penetration of
Fig. 20. The inset shows the cross section of Furnas
volcano. The magma chamber is presumed to be
located at a depth of ca. 5 km (Blanco et al., 1997).
The horizontal and vertical scales of the map are
equal.

23
basaltic magma during fractional
crystallisation in the Furnas 1630 magma
chamber (Rowland-Smith, 2007).
An interesting and important dimension of
this research is the historical records. An
early hypothesis was to connect the eruption
from the cone to one of the lakes with
“clouds of fires”, described by Manoel da
Purificação, see 1.4. However, our research
points to an eruption in the third lake, Lagoa
Grande, which most likely is the existing
Lagoa das Furnas.
The geochronology established in this work
suggests that this cone was produced
sometime during the 1630 event. This
chronology was far from simple to establish,
in particular due to the large risk of
contamination of the lake-floor sediment as
well as plants growing near the lake by “old”
carbon from the hydrothermal venting. Older
carbon originating from the hydrothermal
venting will influence any 14
C-dating on
organic material in the sediments. This also
showed in 14
C-dating of sediment samples
from the northern shoreline (see manuscript
chapter 4), which clearly yielded ages that
was too old (Björck et al., 2006).
On the eastern part of the lake it is only a 7.4
m high barrier that prevents the water from
Lagoa das Furnas from flooding the Furnas
valley with its two villages downstream.
This is an area with high risk concerning
landslides and flooding (see section 1.3.2
and 1.3.2). To make a simulation of a barrier
breach and following flood wave is an
interesting and necessary research project.
The western part of Lagoa das Furnas also
faces a steep 200 m caldera wall of
unconsolidated material. The conditions here
are similar to those at Lake Tahoe, which is
located in a tectonically active area framed
by steep walls from where several landslides
and debris flows have moved material into
the lake. Detailed bathymetric mapping by
Gardner et al.(2000) enabled volume
calculation of mass moved debris into Lake
Tahoe. The major landslide, named
McKinney Bay Landslide, occurred between
21 and 12 ka (Moore et al., 2014). Moore et
al. calculated the volume of this landslide to
~12 km3 and made a simulation of the
landslide and subsequent tsunami flood. The
course of events of landslide and flood wave
has also been animated by Ward (2001). A
simulation of a landslide and subsequent
flood wave in Lagoa das Furnas would
determine whether if the wave would be able
to wash away the barrier.

Acknowledgements
First I want to thank my supervisors Otto Hermelin and Martin Jakobsson. Both for the idea of
the exciting research object and for all help in sample collections and writings. Also many thanks
are directed to Alasdair Skelton for the geochemistry help and for making the text more readable.
From the Department of Physical Geography, Stockholm University, I want to thank Stefan
Wastegård for sharing wise tephra knowledge. From the Department of Geological Sciences,
Stockholm University, I also want to thank; Hildred Crill for the writing help, Dan Zetterberg for
his thin section work, Malin Kylander for Itrax analyses and Matt O´Regan for the MSCL
analyse help, Marianne Ahlbom for ESEM analyse, Ines Jakobsson for interpretation of ancient
Portuguese, Olivia Andersson for assisting with finding organic material, Josefin Linde for the
point counting and Rickard Gyllencreutz for help with GIS problem.
I also want to thank Dr. Pacheco and Professor Gaspar at Centro de Vulcanologia e Avaliação de
Riscos Geológicos, Universidade dos Açores, for the supply of the boat on Lagoa das Furnas and
Jarek Majka at the Department of Earth Sciences, Uppsala University for assistance with micro
probe analyses. Furthermore, the diver Johan Skantz, from the Department of Geological
Sciences, Stockholm University, helped with sampling together with Johan Johansson from the
University of Gothenburg. I also want to thank the local divers from the Azores, João Pedro
Soares, Rui Patricio de Melo, Renato Verdadeiro and diver assistants. For help with drilling
equipment and drilling advice I thank Anders Olsson and Ingemar Larsson. For the help with
manufacturing of the portable sampler I send gratitudes to Bruksgymnasiet in Gimo.
I also want to thank Östhammars kommun and my principal Irmeli Bellander for their efforts that
gave me the oppurtunity to join the Research school focusing on natural hazards. Finally I will
thank my family for supporting me during this time.

References
ABDEL-MONEM, A., FERNANDEZ, L. & BOONE, G. 1975. K-Ar ages from the eastern Azores group (Santa Maria, São Miguel and the Formigas islands). Lithos, 8, 247-254.
ANDERSON, J. T., VAN HOLLIDAY, D., KLOSER, R., REID, D. G. & SIMARD, Y. 2008. Acoustic seabed classification: current practice and future directions. ICES Journal of Marine Science: Journal du Conseil, 65, 1004-1011.
ANZIDEI, M., ESPOSITO, A. & DE GIOSA, F. 2006. The dark side of the Albano crater lake. BACON, C. R., GARDNER, J. V., MAYER, L. A., BUKTENICA, M. W., DARTNELL, P., RAMSEY, D. W. &
ROBINSON, J. E. 2002. Morphology, volcanism, and mass wasting in Crater Lake, Oregon. Geological Society of America Bulletin, 114, 675-692.
BARKER, P., TELFORD, R., MERDACI, O., WILLIAMSON, D., TAIEB, M., VINCENS, A. & GIBERT, E. 2000. The sensitivity of a Tanzanian crater lake to catastrophic tephra input and four millennia of climate change. The Holocene, 10, 303-310.
BAXTER, P. J., BAUBRON, J.-C. & COUTINHO, R. 1999. Health hazards and disaster potential of ground gas emissions at Furnas volcano, Sao Miguel, Azores. Journal of Volcanology and Geothermal Research, 92, 95-106.
BEIER, C., HAASE, K. M. & HANSTEEN, T. H. 2006. Magma evolution of the Sete Cidades volcano, São Miguel, Azores. Journal of Petrology, 47, 1375-1411.
BELLEC, V., WILSON, M., BØE, R., RISE, L., THORSNES, T., BUHL-MORTENSEN, L. & BUHL-MORTENSEN, P. 2008. Bottom currents interpreted from iceberg ploughmarks revealed by multibeam data at Tromsøflaket, Barents Sea. Marine Geology, 249, 257-270.
BJÖRCK, S., RITTENOUR, T., ROSÉN, P., FRANÇA, Z., MÖLLER, P., SNOWBALL, I., WASTEGÅRD, S., BENNIKE, O. & KROMER, B. 2006. A Holocene lacustrine record in the central North Atlantic: proxies for volcanic activity, short-term NAO mode variability, and long-term precipitation changes. Quaternary Science Reviews, 25, 9-32.
BLANCO, I., GARCIA, A. & TORTA, J. M. 1997. Magnetic study of the Furnas caldera (Azores). Annals of Geophysics, 40.
BLOMQVIST, S. 1991. Quantitative sampling of soft-bottom sediments: problems and solutions. Mar. Ecol. Prog. Ser., 72, 295-304.
BOOTH, B., CROASDALE, R. & WALKER, G. P. L. 1978. Quantitative Study of 5000 Years of Volcanism on Sao-Miguel, Azores. Philosophical Transactions of the Royal Society a-Mathematical Physical and Engineering Sciences, 288, 271-319.
CARMO, R., MADEIRA, J., HIPÓLITO, A. & FERREIRA, T. 2014. Paleoseismological evidence for historical surface faulting in São Miguel island (Azores). Annals of Geophysics, 56.
CASADEVALL, T. J., DE LA CRUZ-REYNA, S., ROSE JR, W. I., BAGLEY, S., FINNEGAN, D. L. & ZOLLER, W. H. 1984. Crater lake and post-eruption hydrothermal activity, El Chichón Volcano, Mexico. Journal of Volcanology and Geothermal Research, 23, 169-191.
CHRISTENSON, B. 2000. Geochemistry of fluids associated with the 1995–1996 eruption of Mt. Ruapehu, New Zealand: signatures and processes in the magmatic-hydrothermal system. Journal of Volcanology and Geothermal Research, 97, 1-30.
COLE, P. D., QUEIROZ, G., WALLENSTEIN, N., GASPAR, J. L., DUNCAN, A. M. & GUEST, J. E. 1995. An historic subplinian phreatomagmatic eruption: The 1630 AD eruption of Furnas volcano, Sao Miguel, Azores. Journal of Volcanology and Geothermal Research, 69, 117-135.
COLLIER, J. & BROWN, C. 2005. Correlation of sidescan backscatter with grain size distribution of surficial seabed sediments. Marine Geology, 214, 431-449.

CRUZ, J., ANTUNES, P., AMARAL, C., FRANÇA, Z. & NUNES, J. 2006. Volcanic lakes of the Azores archipelago (Portugal): Geological setting and geochemical characterization. Journal of volcanology and geothermal research, 156, 135-157.
CRUZ, J. V. L., COUTINHO, R. M., CARVALHO, M. R., OSKARSSON, N. & GISLASON, S. R. 1999. Chemistry of waters from Furnas volcano, São Miguel, Azores: fluxes of volcanic carbon dioxide and leached material. Journal of Volcanology and Geothermal Research, 92, 151-167.
DA PONTE, P. 1880. Castro EVPC (1880) -Anno de 1630. Erupção no Valle das Furnas. Arch. Açores, 2: 527-547.
DA PURIFICAÇÃO, M. 1880. Castro EVPC (1880) -Anno de 1630. Erupção no Valle das Furnas. Arch. Açores, 2: 527-547.
DIAS, U. D. M. 1936. História do Vale das Furnas. Vila-franca do Campo, Emp. Tip. Ltd. de Vila-franca do Campo.
EICHELBERGER, J. C. & GOOLEY, R. 1977. Evolution of silicic magma chambers and their relationship to basaltic volcanism. The Earth's Crust, 57-77.
FARR, T. G., ROSEN, P. A., CARO, E., CRIPPEN, R., DUREN, R., HENSLEY, S., KOBRICK, M., PALLER, M., RODRIGUEZ, E. & ROTH, L. 2007. The shuttle radar topography mission. Reviews of geophysics, 45.
FERREIRA, T., GASPAR, J. L., VIVEIROS, F., MARCOS, M., FARIA, C. & SOUSA, F. 2005. Monitoring of fumarole discharge and CO2 soil degassing in the Azores: contribution to volcanic surveillance and public health risk assessment. Annals of Geophysics, 48, 787-796.
FONSECA, L., MAYER, L., ORANGE, D. & DRISCOLL, N. 2002. The high-frequency backscattering angular response of gassy sediments: model/data comparison from the Eel River Margin, California. The Journal of the Acoustical Society of America, 111, 2621-2631.
GARDNER, J. V., MAYER, L. A. & CLARKE, J. E. H. 2000. Morphology and processes in Lake Tahoe (California-Nevada). Geological Society of America Bulletin, 112, 736-746.
GASPAR, J. L., GOULART, C., QUEIROZ, G., SILVEIRA, D. & GOMES, A. 2004. Dynamic structure and data sets of a GIS database for geological risk analysis in the Azores volcanic islands. Natural Hazards and Earth System Sciences, 4, 233-242.
GENTE, P., DYMENT, J., MAIA, M. & GOSLIN, J. 2003. Interaction between the Mid‐Atlantic Ridge and
the Azores hot spot during the last 85 Myr: Emplacement and rifting of the hot spot‐derived plateaus. Geochemistry, Geophysics, Geosystems, 4.
GOMES, A., GASPAR, J. L. & QUEIROZ, G. 2006. Seismic vulnerability of dwellings at Sete Cidades Volcano (S. Miguel Island, Azores). Natural Hazards and Earth System Sciences, 6, 41-48.
GONÇALVES, H. J. 1880. Castro EVPC (1880) -Anno de 1630. Erupção no Valle das Furnas. Arch. Açores, 2: 527-547.
GUEST, J. E., GASPAR, J. L., COLE, P. D., QUEIROZ, G., DUNCAN, A. M., WALLENSTEIN, N., FERREIRA, T. & PACHECO, J. M. 1999. Volcanic geology of Furnas Volcano, Sao Miguel, Azores. Journal of Volcanology and Geothermal Research, 92, 1-29.
HOVLAND, M. & JUDD, A. 1988. Seabed pockmarks and seepages: impact on geology, biology, and the marine environment, Springer.
JONES, G., CHESTER, D. & SHOOSHTARIAN, F. 1999. Statistical analysis of the frequency of eruptions at Furnas Volcano, São Miguel, Azores. Journal of volcanology and geothermal research, 92, 31-38.
LEE, S. H. & KIM, K.-H. 2004. Side-Scan Sonar Characteristics and Manganese Nodule Abundance in the Clarion—Clipperton Fracture Zones, NE Equatorial Pacific. Marine Georesources and Geotechnology, 22, 103-114.
LOURENÇO, N., MIRANDA, J., LUIS, J., RIBEIRO, A., VICTOR, L. M., MADEIRA, J. & NEEDHAM, H. 1998. Morpho-tectonic analysis of the Azores Volcanic Plateau from a new bathymetric compilation of the area. Marine Geophysical Researches, 20, 141-156.

LOWE, D. J. 2011. Tephrochronology and its application: a review. Quaternary Geochronology, 6, 107-153. MALHEIRO, A. 2006. Geological hazards in the Azores archipelago: Volcanic terrain instability and human
vulnerability. Journal of Volcanology and Geothermal Research, 156, 158-171. MARQUES, R., QUEIROZ, G., COUTINHO, R. & ZÊZERE, J. 2007. Actividade geomorfológica desencadeada
pela crise sísmica de 2005 no Vulcão do Fogo (S. Miguel, Açores): avaliação da susceptibilidade com recurso a regressão logística. Publicações da Associação Portuguesa de Geomorfólogos, 5, 47-61.
MOORE, J. G., SCHWEICKERT, R. A. & KITTS, C. A. 2014. Tsunami-generated sediment wave channels at Lake Tahoe, California-Nevada, USA. Geosphere, 10, 757-768.
MOORE, R. B. 1991a. Geologic map of São Miguel, Azores, US Geological Survey. MOORE, R. B. 1991b. Geology of Three Late Quaternary Stratovolcanos of São Miguel, Azores U.S.
GEOLOGICAL SURVEY BULLETIN 1900. MORGAN, L., SHANKS, W., LOVALVO, D., JOHNSON, S., STEPHENSON, W., PIERCE, K., HARLAN, S., FINN, C.,
LEE, G. & WEBRING, M. 2003. Exploration and discovery in Yellowstone Lake: results from high-resolution sonar imaging, seismic reflection profiling, and submersible studies. Journal of Volcanology and Geothermal Research, 122, 221-242.
MOSHER, D. C. & SIMPKIN, P. G. 1999. Environmental Marine Geoscience 1. Status and Trends of Marine High-Resolution Seismic Reflection Profiling: Data Acquistion. Geoscience Canada, 26.
NELSON, C. H., MEYER, A. W., THOR, D. & LARSEN, M. 1986. Crater Lake, Oregon: A restricted basin with base-of-slope aprons of nonchannelized turbidites. Geology, 14, 238-241.
NEWHALL, C., PAULL, C., BRADBURY, J., HIGUERA-GUNDY, A., POPPE, L., SELF, S., BONAR SHARPLESS, N. & ZIAGOS, J. 1987. Recent geologic history of Lake Atitlan, a caldera lake in western Guatemala. Journal of volcanology and geothermal research, 33, 81-107.
OLIVER, M. A. & WEBSTER, R. 1990. Kriging: a method of interpolation for geographical information systems. International Journal of Geographical Information System, 4, 313-332.
OPPENHEIM, A. V. & COBRA, D. T. 1988. 25.4 Digital Processing of Side Scan Sonographs. RLE Progress Report No. 130, 208.
POPPE, L., PAULL, C., NEWHALL, C., BRADBURY, J. & ZIAGOS, J. 1985. A geophysical and geological study of Laguna de Ayarza, a Guatemalan caldera lake. Journal of volcanology and geothermal research, 25, 125-144.
ROWE JR, G. L., OHSAWA, S., TAKANO, B., BRANTLEY, S. L., FERNANDEZ, J. F. & BARQUERO, J. 1992. Using crater lake chemistry to predict volcanic activity at Poás volcano, Costa Rica. Bulletin of volcanology, 54, 494-503.
ROWLAND-SMITH, A. 2007. The 1630 AD eruption of Furnas volcano, São Miguel, Azores (Portugal): chemical variations and magmatic processes.
SCHOCK, S. G., LEBLANC, L. R. & MAYER, L. A. 1989. Chirp subbottom profiler for quantitative sediment analysis. Geophysics, 54, 445-450.
SEARLE, R. 1980. Tectonic pattern of the Azores spreading centre and triple junction. Earth and Planetary Science Letters, 51, 415-434.
SENOS, M. L., TEVES-COSTA, P. & NUNES, J. C. 1998. SEISMICITY STUDIES OF THE AZORES ISLANDS-AN APPLICATION TO THE JULY 9, 1998 EARTHQUAKE.
SPARKS, S. R. & SIGURDSSON, H. 1977. Magma mixing: a mechanism for triggering acid explosive eruptions. Nature, 267, 315-318.
ULUSOY, İ., LABAZUY, P., AYDAR, E., ERSOY, O. & ÇUBUKÇU, E. 2008. Structure of the Nemrut caldera (Eastern Anatolia, Turkey) and associated hydrothermal fluid circulation. Journal of Volcanology and Geothermal Research, 174, 269-283.
VALADÃO, P., GASPAR, J., QUEIROZ, G. & FERREIRA, T. 1999. Landslides density map of S. Miguel Island, Azores archipelago. Natural Hazards and Earth System Science, 2, 51-56.

WALKER, G. & CROASDALE, R. 1971. Two plinian-type eruptions in the Azores. Journal of the Geological Society, 127, 17-55.
WALLENSTEIN, N., DUNCAN, A., CHESTER, D. & MARQUES, R. 2007. Fogo volcano (Sao Miguel, Azores): a hazardous edifice. Géomorphologie: relief, processus, environnement, 259-270.
WARD, S. N. 2001. Landslide tsunami. Journal of Geophysical Research: Solid Earth (1978–2012), 106, 11201-11215.
WAYTHOMAS, C. F., WALDER, J. S., MCGIMSEY, R. G. & NEAL, C. A. 1996. A catastrophic flood caused by drainage of a caldera lake at Aniakchak Volcano, Alaska, and implications for volcanic hazards assessment. Geological Society of America Bulletin, 108, 861-871.
VOGT, P. & JUNG, W. 2004. The Terceira Rift as hyper-slow, hotspot-dominated oblique spreading axis: a comparison with other slow-spreading plate boundaries. Earth and Planetary Science Letters, 218, 77-90.
VÖLKER, D. J. 2010. A simple and efficient GIS tool for volume calculations of submarine landslides. Geo-Marine Letters, 30, 541-547.
YANG, T., SHEN, Y., VANDERLEE, S., SOLOMON, S. & HUNG, S. 2006. Upper mantle structure beneath the Azores hotspot from finite-frequency seismic tomography. Earth and Planetary Science Letters, 250, 11-26.

Manuscript