geometric design - libvolume3.xyzlibvolume3.xyz/.../highwaygeometricdesign2presentation1.pdf ·...
TRANSCRIPT

CE
E 3
20
Win
ter
20
06
Geometric Design
CEE 320
Steve Muench
CE
E 3
20
Win
ter
20
06
Outline
1. Concepts
2. Vertical Alignment a. Fundamentals
b. Crest Vertical Curves
c. Sag Vertical Curves
d. Examples
3. Horizontal Alignment a. Fundamentals
b. Superelevation
4. Other Non-Testable Stuff

CE
E 3
20
Win
ter
20
06
Concepts
• Alignment is a 3D problem broken
down into two 2D problems
– Horizontal Alignment (plan view)
– Vertical Alignment (profile view)
• Stationing
– Along horizontal alignment
– 12+00 = 1,200 ft.
Piilani Highway on Maui

CE
E 3
20
Win
ter
20
06
Stationing
Horizontal Alignment
Vertical Alignment

From Perteet Engineering

CE
E 3
20
Win
ter
20
06
Vertical Alignment

CE
E 3
20
Win
ter
20
06
Vertical Alignment
• Objective:
– Determine elevation to ensure
• Proper drainage
• Acceptable level of safety
• Primary challenge
– Transition between two grades
– Vertical curves
G1 G2
G1 G2
Crest Vertical Curve
Sag Vertical Curve

CE
E 3
20
Win
ter
20
06
Vertical Curve Fundamentals
• Parabolic function
– Constant rate of change of slope
– Implies equal curve tangents
• y is the roadway elevation x stations
(or feet) from the beginning of the curve
cbxaxy ++= 2

CE
E 3
20
Win
ter
20
06
Vertical Curve Fundamentals
G1
G2
PVI
PVT
PVC
L
L/2
δ
cbxaxy ++= 2
x
Choose Either: • G1, G2 in decimal form, L in feet
• G1, G2 in percent, L in stations

CE
E 3
20
Win
ter
20
06
Relationships
Choose Either: • G1, G2 in decimal form, L in feet
• G1, G2 in percent, L in stations
G1
G2
PVI
PVT
PVC
L
L/2
δ
x
1 and 0 :PVC At the Gbdx
dYx ===
cYx == and 0 :PVC At the
L
GGa
L
GGa
dx
Yd
22 :Anywhere 1212
2
2 −=⇒
−==

CE
E 3
20
Win
ter
20
06
Example
A 400 ft. equal tangent crest vertical curve has a PVC station of
100+00 at 59 ft. elevation. The initial grade is 2.0 percent and the final
grade is -4.5 percent. Determine the elevation and stationing of PVI,
PVT, and the high point of the curve.
PVI
PVT
PVC: STA 100+00
EL 59 ft.

PVI
PVT
PVC: STA 100+00
EL 59 ft.

CE
E 3
20
Win
ter
20
06
Other Properties
G1
G2
PVI
PVT PVC
x
Ym
Yf
Y
2
200x
L
AY =
800
ALYm=
200
ALYf=
21 GGA −=
•G1, G2 in percent
•L in feet

CE
E 3
20
Win
ter
20
06
Other Properties
• K-Value (defines vertical curvature)
– The number of horizontal feet needed for a 1%
change in slope
A
LK =
1./ GKxptlowhigh =⇒

CE
E 3
20
Win
ter
20
06
Crest Vertical Curves
G1 G2
PVI
PVT PVC
h2 h1
L
SSD
( )( )221
2
22100 hh
SSDAL
+= ( ) ( )
A
hhSSDL
2
212002
+−=
For SSD < L For SSD > L
Line of Sight

CE
E 3
20
Win
ter
20
06
Crest Vertical Curves
• Assumptions for design
– h1 = driver’s eye height = 3.5 ft.
– h2 = tail light height = 2.0 ft.
• Simplified Equations
( )2158
2SSDA
L = ( )A
SSDL2158
2 −=
For SSD < L For SSD > L

CE
E 3
20
Win
ter
20
06
Crest Vertical Curves
• Assuming L > SSD@
2158
2SSD
K =
CE
E 3
20
Win
ter
20
06
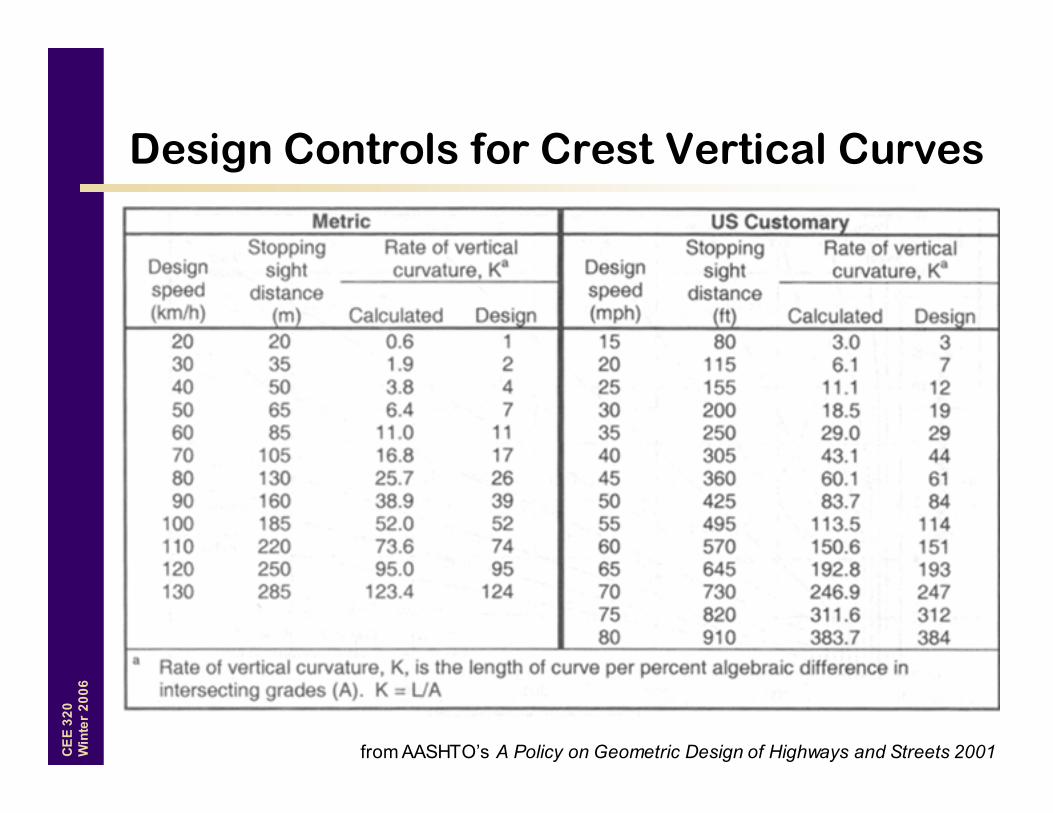
Design Controls for Crest Vertical Curves
from AASHTO’s A Policy on Geometric Design of Highways and Streets 2001

CE
E 3
20
Win
ter
20
06
Design Controls for Crest Vertical Curves
fro
m A
AS
HT
O’s
A Policy on Geometric Design of Highways and Streets 2001

CE
E 3
20
Win
ter
20
06
Sag Vertical Curves
G1 G2
PVI
PVT PVC
h2=0 h1
L
Light Beam Distance (SSD)
( )( )βtan200 1
2
Sh
SSDAL
+= ( ) ( )( )
A
SSDhSSDL
βtan2002 1 +−=
For SSD < L For SSD > L
headlight beam (diverging from LOS by β degrees)
CE
E 3
20
Win
ter
20
06
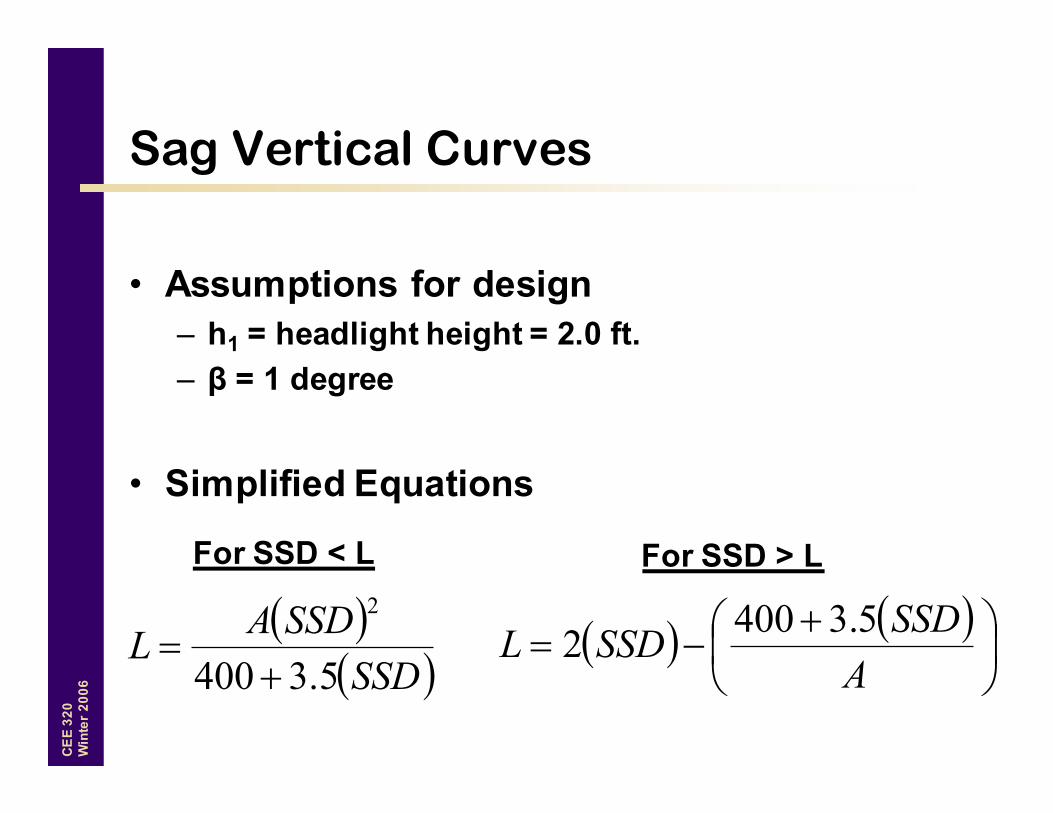
Sag Vertical Curves
• Assumptions for design
– h1 = headlight height = 2.0 ft.
– β = 1 degree
• Simplified Equations
( )( )SSD
SSDAL
5.3400
2
+= ( ) ( )
+−=
A
SSDSSDL
5.34002
For SSD < L For SSD > L

CE
E 3
20
Win
ter
20
06
Sag Vertical Curves
• Assuming L > SSD@
SSD
SSDK
5.3400
2
+=
CE
E 3
20
Win
ter
20
06
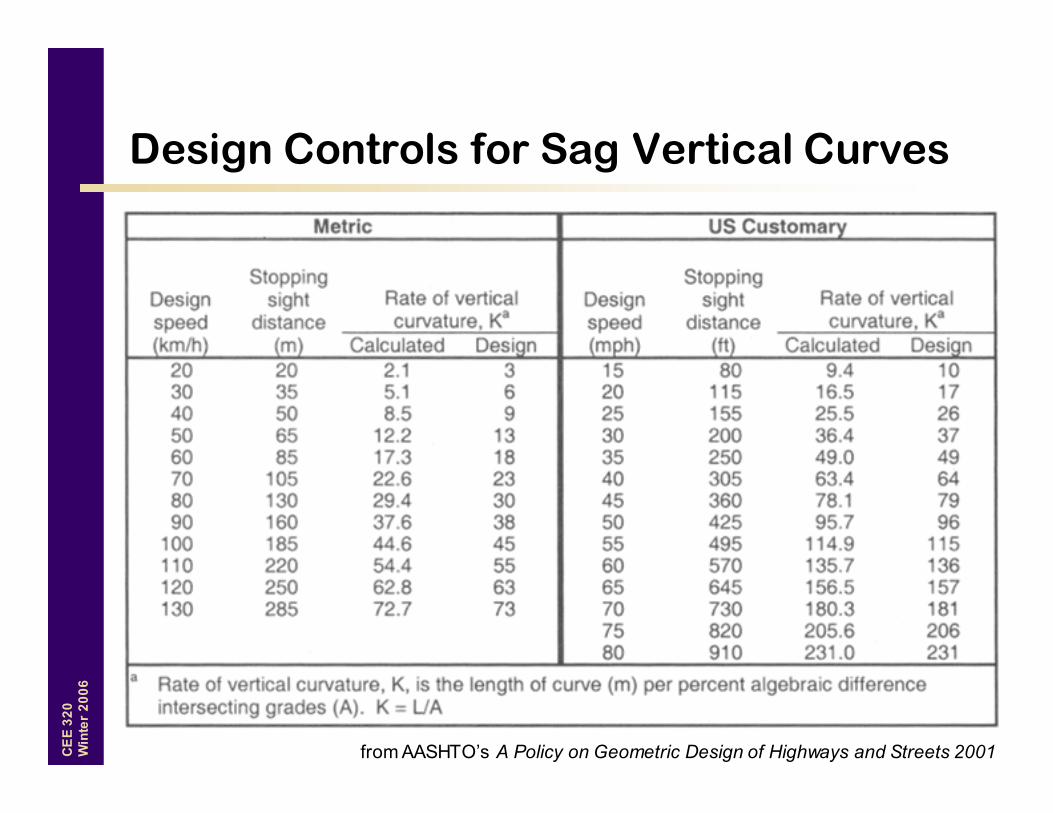
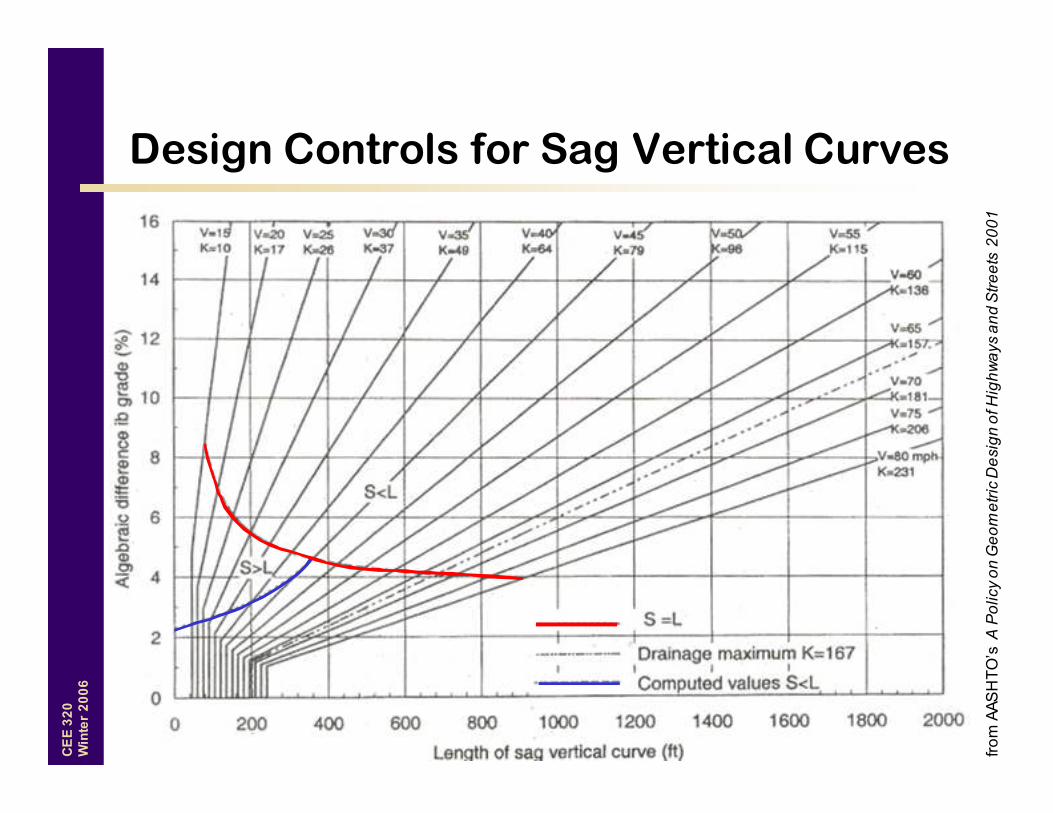
Design Controls for Sag Vertical Curves
from AASHTO’s A Policy on Geometric Design of Highways and Streets 2001
CE
E 3
20
Win
ter
20
06
Design Controls for Sag Vertical Curves
fro
m A
AS
HT
O’s
A Policy on Geometric Design of Highways and Streets 2001

CE
E 3
20
Win
ter
20
06
Example 1
A car is traveling at 30 mph in the country at night on a wet road
through a 150 ft. long sag vertical curve. The entering grade is -2.4
percent and the exiting grade is 4.0 percent. A tree has fallen across
the road at approximately the PVT. Assuming the driver cannot see
the tree until it is lit by her headlights, is it reasonable to expect the
driver to be able to stop before hitting the tree?

CE
E 3
20
Win
ter
20
06
Example 2
Similar to Example 1 but for a crest curve.
A car is traveling at 30 mph in the country at night on a wet road
through a 150 ft. long crest vertical curve. The entering grade is 3.0
percent and the exiting grade is -3.4 percent. A tree has fallen across
the road at approximately the PVT. Is it reasonable to expect the driver
to be able to stop before hitting the tree?

CE
E 3
20
Win
ter
20
06
Example 3
A roadway is being designed using a 45 mph design speed. One
section of the roadway must go up and over a small hill with an
entering grade of 3.2 percent and an exiting grade of -2.0 percent.
How long must the vertical curve be?

CE
E 3
20
Win
ter
20
06
Horizontal
Alignment

CE
E 3
20
Win
ter
20
06
Horizontal Alignment
• Objective: – Geometry of directional transition to ensure:
• Safety
• Comfort
• Primary challenge
– Transition between two directions
– Horizontal curves
• Fundamentals – Circular curves
– Superelevation
∆

CE
E 3
20
Win
ter
20
06
Horizontal Curve Fundamentals
R
T
PC PT
PI
M
E
R
∆
∆/2 ∆/2
∆/2
RRD
ππ 000,18
180100
=
=
2tan
∆= RT
DRL
∆=∆=
100
180
π
L

CE
E 3
20
Win
ter
20
06
Horizontal Curve Fundamentals
−
∆= 1
2cos
1RE
∆−=
2cos1RM
R
T
PC PT
PI
M
E
R
∆
∆/2 ∆/2
∆/2 L

CE
E 3
20
Win
ter
20
06
Example 4
A horizontal curve is designed with a 1500 ft. radius. The tangent
length is 400 ft. and the PT station is 20+00. What are the PI and PT
stations?
CE
E 3
20
Win
ter
20
06
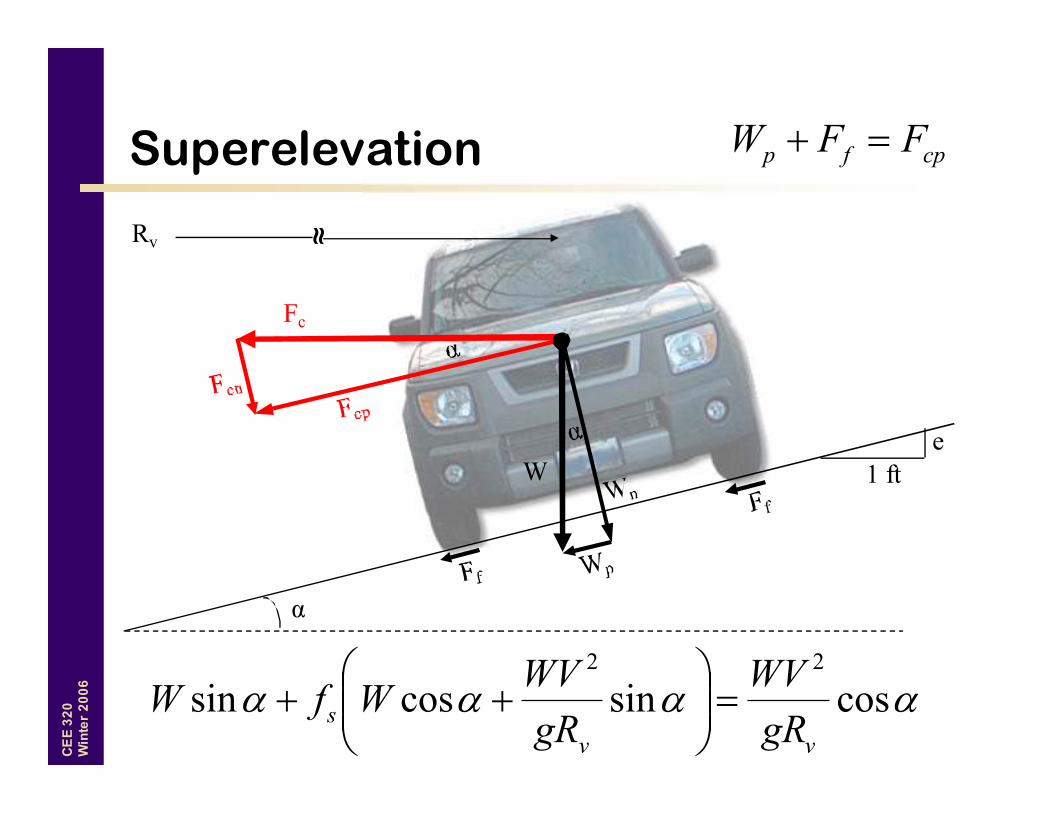
Superelevation cpfp FFW =+
αααα cossincossin22
vv
sgR
WV
gR
WVWfW =
++
α
Fc
W 1 ft
e
≈
Rv

CE
E 3
20
Win
ter
20
06
Superelevation
αααα cossincossin22
vv
sgR
WV
gR
WVWfW =
++
( )αα tan1tan2
s
v
s fgR
Vf −=+
( )efgR
Vfe s
v
s −=+ 12
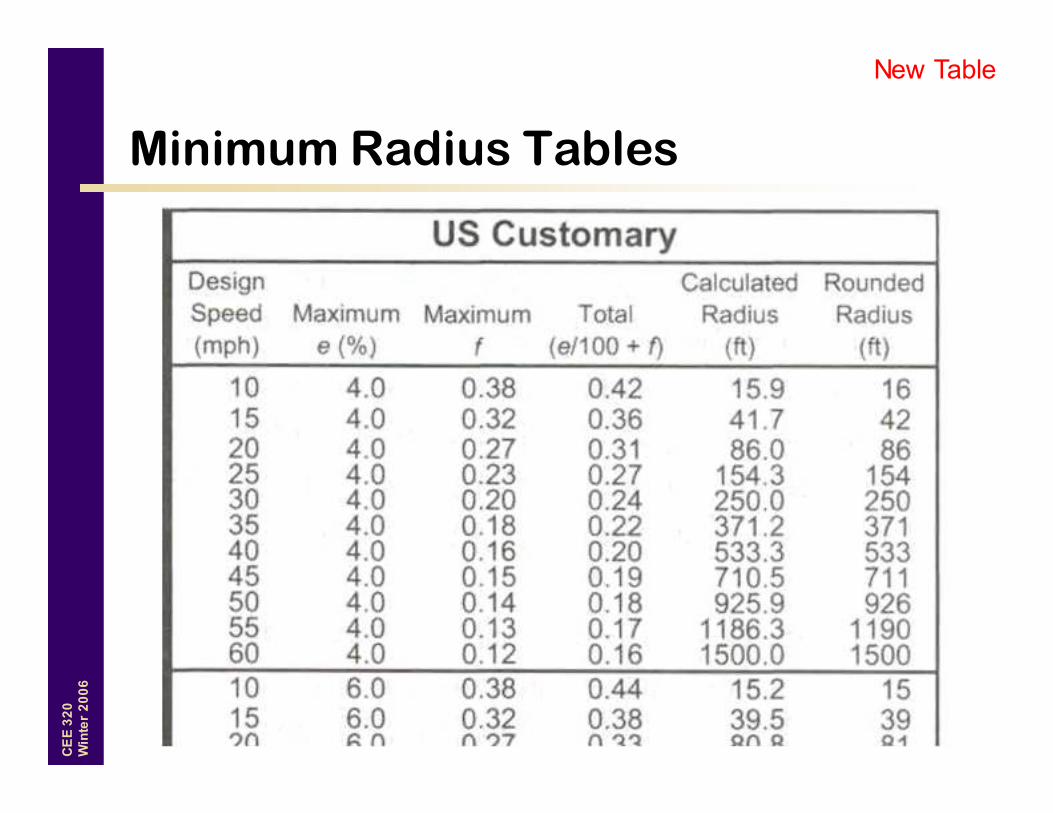
( )efg
VR
s
v +=
2

CE
E 3
20
Win
ter
20
06
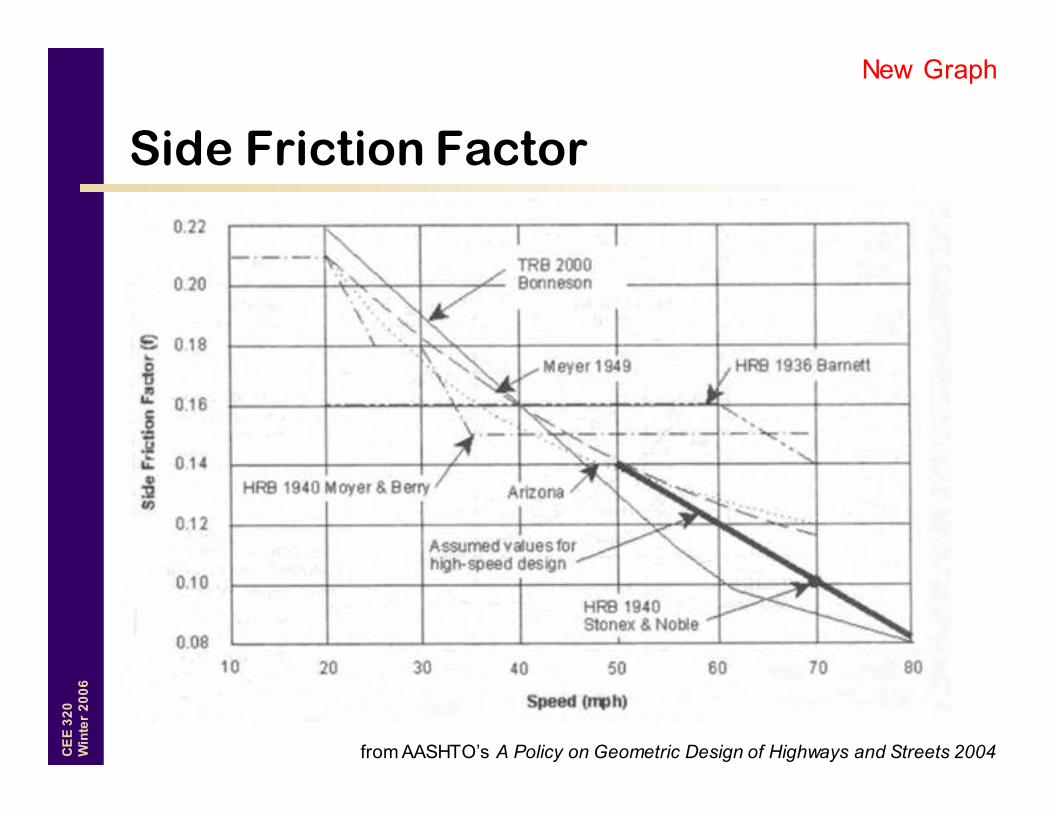
Selection of e and fs
• Practical limits on superelevation (e)
– Climate
– Constructability
– Adjacent land use
• Side friction factor (fs) variations
– Vehicle speed
– Pavement texture
– Tire condition
CE
E 3
20
Win
ter
20
06
Side Friction Factor
from AASHTO’s A Policy on Geometric Design of Highways and Streets 2004
New Graph
CE
E 3
20
Win
ter
20
06
Minimum Radius Tables
New Table

CE
E 3
20
Win
ter
20
06
WSDOT Design Side Friction Factors
fro
m t
he
20
05
WS
DO
T Design Manual, M
22
-01
New Table
For Open Highways and Ramps

CE
E 3
20
Win
ter
20
06
WSDOT Design Side Friction Factors
fro
m t
he
20
05
WS
DO
T Design Manual, M
22
-01
For Low-Speed Urban Managed Access Highways
New Graph
CE
E 3
20
Win
ter
20
06
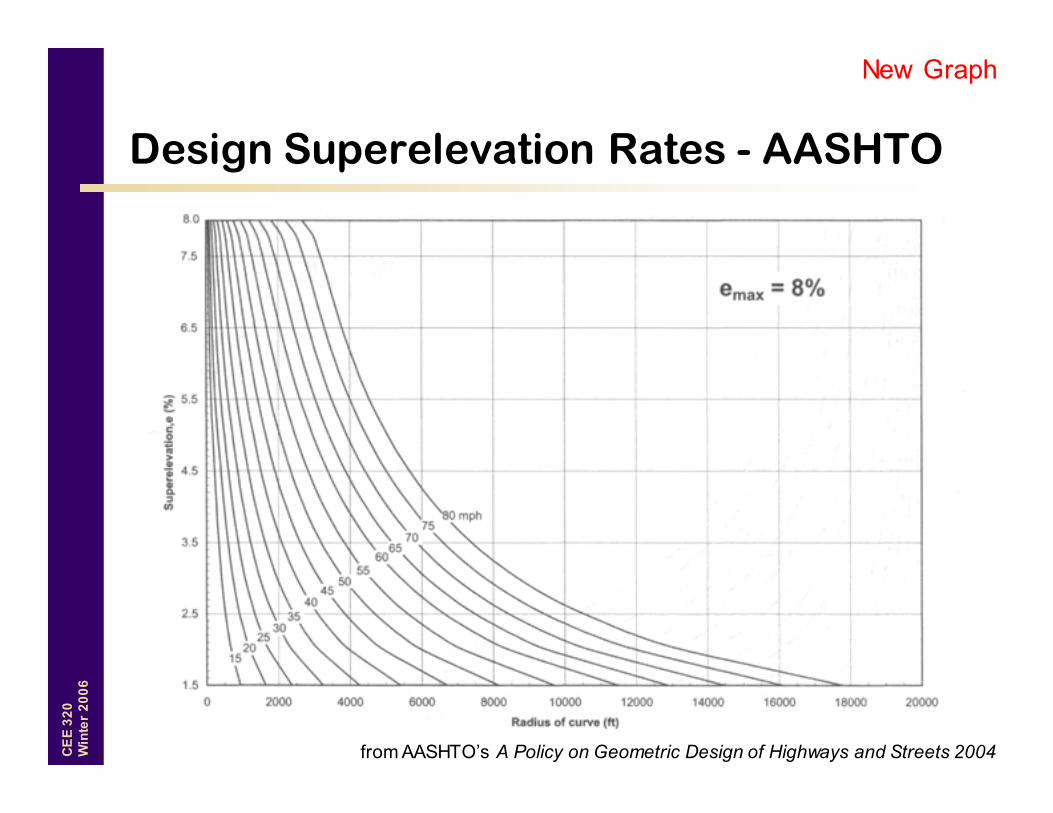
Design Superelevation Rates - AASHTO
from AASHTO’s A Policy on Geometric Design of Highways and Streets 2004
New Graph
CE
E 3
20
Win
ter
20
06
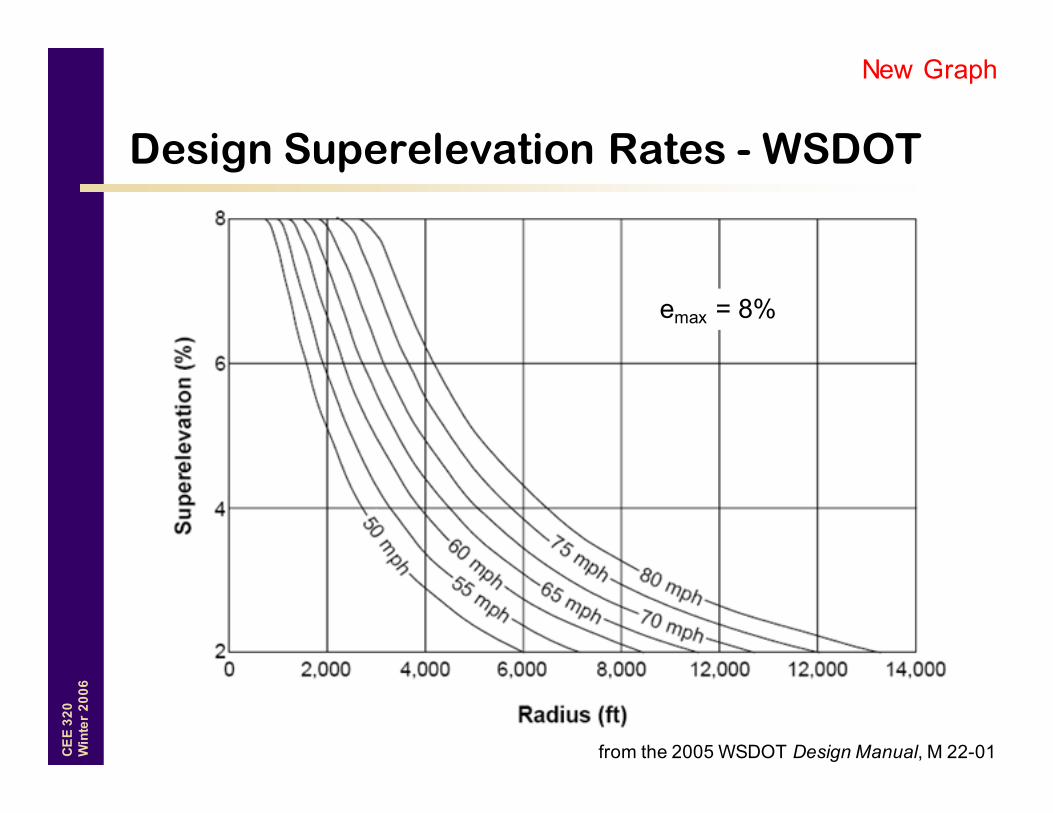
Design Superelevation Rates - WSDOT
from the 2005 WSDOT Design Manual, M 22-01
emax = 8%
New Graph
CE
E 3
20
Win
ter
20
06
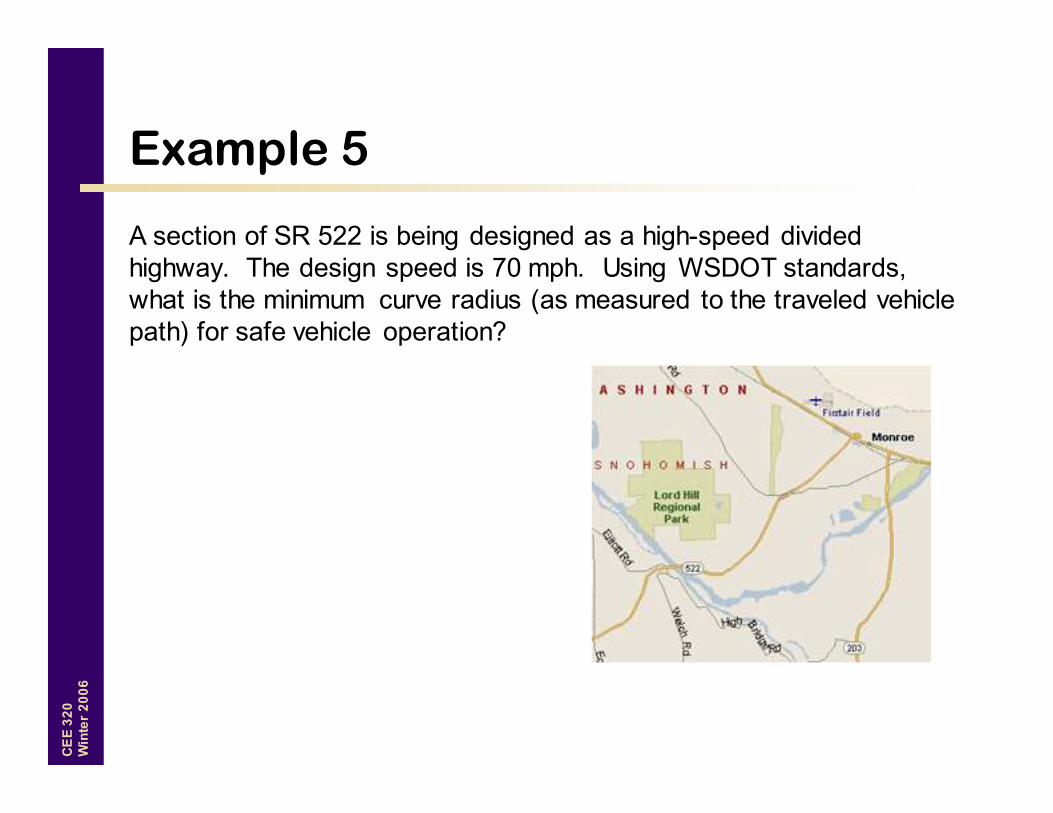
Example 5
A section of SR 522 is being designed as a high-speed divided
highway. The design speed is 70 mph. Using WSDOT standards,
what is the minimum curve radius (as measured to the traveled vehicle
path) for safe vehicle operation?

CE
E 3
20
Win
ter
20
06
Stopping Sight Distance
Rv
∆s
Obstruction
Ms ( )v
sR
SSD
π180
=∆
DRSSD s
sv
∆=∆=
100
180
π SSD
−=
v
vsR
SSDRM
π90
cos1
−= −
v
svv
R
MRRSSD
1cos
90
π

CE
E 3
20
Win
ter
20
06
Supplemental Stuff
• Cross section
• Superelevation Transition
– Runoff
– Tangent runout
• Spiral curves
• Extra width for curves
FYI – NOT TESTABLE

CE
E 3
20
Win
ter
20
06
Cross Section
FYI – NOT TESTABLE

CE
E 3
20
Win
ter
20
06
Superelevation Transition
from the 2001 Caltrans Highway Design Manual
FYI – NOT TESTABLE

CE
E 3
20
Win
ter
20
06
Superelevation Transition
from AASHTO’s A Policy on Geometric Design of Highways and Streets 2001
FYI – NOT TESTABLE

CE
E 3
20
Win
ter
20
06
Superelevation Runoff/Runout
fro
m A
AS
HT
O’s
A Policy on Geometric Design of Highways and Streets 2001
FYI – NOT TESTABLE

CE
E 3
20
Win
ter
20
06
Superelevation Runoff - WSDOT
from the 2005 WSDOT Design Manual, M 22-01
FYI – NOT TESTABLE
New Graph

CE
E 3
20
Win
ter
20
06
Spiral Curves
No Spiral
Spiral
from AASHTO’s A Policy on Geometric Design of Highways and Streets 2001
FYI – NOT TESTABLE

CE
E 3
20
Win
ter
20
06
No Spiral
FYI – NOT TESTABLE

CE
E 3
20
Win
ter
20
06
Spiral Curves
• WSDOT no longer uses spiral curves
• Involve complex geometry
• Require more surveying
• Are somewhat empirical
• If used, superelevation transition should
occur entirely within spiral
FYI – NOT TESTABLE

CE
E 3
20
Win
ter
20
06
Desirable Spiral Lengths
from AASHTO’s A Policy on Geometric Design of Highways and Streets 2001
FYI – NOT TESTABLE
CE
E 3
20
Win
ter
20
06
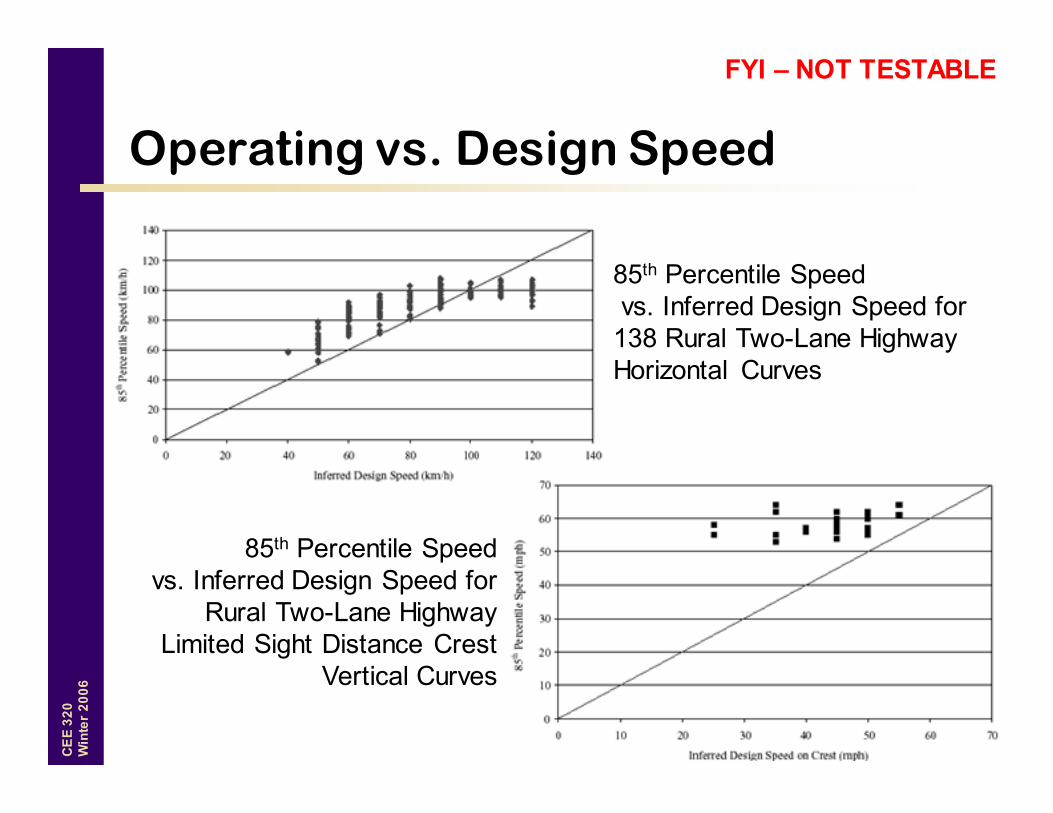
Operating vs. Design Speed
85th Percentile Speed
vs. Inferred Design Speed for
138 Rural Two-Lane Highway
Horizontal Curves
85th Percentile Speed
vs. Inferred Design Speed for
Rural Two-Lane Highway
Limited Sight Distance Crest
Vertical Curves
FYI – NOT TESTABLE
CE
E 3
20
Win
ter
20
06
Primary References
• Mannering, F.L.; Kilareski, W.P. and Washburn, S.S. (2005).
Principles of Highway Engineering and Traffic Analysis, Third
Edition. Chapter 3
• American Association of State Highway and Transportation
Officials (AASHTO). (2001). A Policy on Geometric Design of
Highways and Streets, Fourth Edition. Washington, D.C.